Embed Size (px)
Citation preview
Preliminary Evaluation of Proposed LLPRS Rigid
Pavement Structures and Design Inputs
Report Prepared for
CALIFORNIA DEPARTMENT OF TRANSPORTATION
By
J. Harvey, J. Roesler, J. Farver, and L. Liang
May 2000Pavement Research Center
Institute of Transportation StudiesUniversity of California at Berkeley
Paper No. FHWA/CA/OR-2000/02


iii
TABLE OF CONTENTS
Table of Contents ...........................................................................................................................iii
List of Figures ................................................................................................................................ ix
List of Tables.................................................................................................................................xii
Executive Summary ....................................................................................................................xvii
1.0 Background of LLPRS............................................................................................................ 1
1.1 Objectives .......................................................................................................................... 1
1.1.1 LLPRS Objectives....................................................................................................... 1
1.1.2 Contract Team Research Objectives ........................................................................... 2
1.2 Overview of Preliminary Reports ...................................................................................... 4
1.3 Overview of this Report..................................................................................................... 4
2.0 Assessment of Design Criteria ................................................................................................ 7
2.1 Rigid Pavement Distress Mechanisms............................................................................... 7
2.1.1 Faulting........................................................................................................................ 8
2.1.2 Pumping ...................................................................................................................... 8
2.1.3 Corner Cracking ........................................................................................................ 11
2.1.4 Transverse (Fatigue) Cracking .................................................................................. 11
2.1.5 Longitudinal Cracking............................................................................................... 17
2.1.6 Spalling...................................................................................................................... 17
2.2 Caltrans Rigid Pavement Design Evolution since 1959 .................................................. 21
2.2.1 Design Features Continuously Used Since 1959 ...................................................... 21
2.2.2 1952 to 1964.............................................................................................................. 22
2.2.3 1964 to 1967.............................................................................................................. 22
2.2.4 1967 to 1983.............................................................................................................. 23
iv
2.2.5 1983 to Current.......................................................................................................... 23
2.3 Previous Reviews of Caltrans Designs ............................................................................ 28
2.3.1 McLeod and Monismith ............................................................................................ 28
2.3.2 Wells and Nokes........................................................................................................ 31
2.4 Caltrans Rigid Pavements Current Conditions ................................................................ 33
2.5 LLPRS Strategies Proposed by Caltrans.......................................................................... 33
2.6 Summary of Recommendations from TRB Workshop on Pavement Renewal for Urban
Freeways ................................................................................................................................... 34
2.6.1 710 Design Constraints ............................................................................................. 36
2.6.2 TRB Team Recommendations .................................................................................. 37
2.7 Characteristics of candidate projects ............................................................................... 42
2.8 Condition Survey of Candidate LLPRS Pavements ........................................................ 50
2.8.1 Interstate 5 ................................................................................................................. 52
2.8.2 Interstate 10 ............................................................................................................... 57
2.8.3 Interstate 215 ............................................................................................................. 62
2.8.4 Interstate 405 ............................................................................................................. 64
2.8.5 Interstate 710 ............................................................................................................. 65
2.8.6 State Route 60 ........................................................................................................... 67
2.8.7 Summary of Southern California Survey.................................................................. 69
2.8.8 Northern California Routes ....................................................................................... 71
2.9 Findings: Summary of Important Design Considerations ............................................... 72
2.9.1 The mechanisms for pavement distresses are mostly understood............................. 72
v
2.9.2 Transverse joint faulting is the most prevalent distress on LLPRS candidate projects.
................................................................................................................................... 73
2.9.3 Faulting reduction measures have not been effective. .............................................. 73
2.9.4 Use of joint sealants may reduce joint spalling and longitudinal cracking. .............. 73
2.9.5 Cracking is present on Caltrans rigid pavements. ..................................................... 74
2.9.6 Future efforts to reduce joint faulting will also probably reduce occurrence of corner
cracking. ................................................................................................................................ 74
2.9.7 Long joint spacings in proposed LLPRS-Rigid strategies will increase the likelihood
of transverse (fatigue) cracking............................................................................................. 74
2.9.8 Flexural strength plays a key role in cracking........................................................... 74
2.9.9 Proposed strategies for pavement reconstruction will require substantial work on
many bridges to maintain legal height clearances................................................................. 75
2.9.10 Climatic regions play a significant role in rigid pavement distress mechanisms, but
are not currently considered in Caltrans design procedures.................................................. 75
3.0 Evaluation of Proposed Strategies Using Existing Design Methods .................................... 77
3.1 Description and Applicability of Methods Used ............................................................. 77
3.1.1 PCA Method.............................................................................................................. 77
3.1.2 ACPA/AASHTO Method ......................................................................................... 78
3.1.3 Illinois DOT Method................................................................................................. 79
3.2 Variables Considered ....................................................................................................... 82
3.2.1 Design Life................................................................................................................ 82
3.2.2 Truck Traffic and Axle Load Spectra ....................................................................... 82
3.2.3 Subgrade/Base Support ............................................................................................. 88
vi
3.2.4 Concrete Flexural Strength........................................................................................ 91
3.2.5 Design Features ......................................................................................................... 91
3.2.6 Safety Factors/Reliability.......................................................................................... 93
3.2.7 Climate and Drainage................................................................................................ 94
3.2.8 Failure Modes............................................................................................................ 95
3.3 Evaluation of Design Lives Using the PCA Method ....................................................... 96
3.4 Evaluation of Design Lives Using the ACPA/AASHTO Method................................. 101
3.5 Evaluation of Design Lives Using ILLICON ................................................................ 108
3.5.1 Base Type................................................................................................................ 109
3.5.2 Concrete Coefficient of Thermal Expansion........................................................... 110
3.5.3 Dowel Size .............................................................................................................. 111
3.5.4 Increased Axle Loads .............................................................................................. 111
3.5.5 Overall Results from ILLICON factorial ................................................................ 115
3.6 Comparison Across Design Methods............................................................................. 123
3.7 Effect of Dowel Size on Bearing Stress and Faulting.................................................... 126
3.7.1 Determination of Bearing Stress Values ................................................................. 126
3.7.2 Variables Considered .............................................................................................. 131
3.7.3 Results ..................................................................................................................... 133
3.8 Findings: Required Pavement Designs to Provide 30-year Life.................................... 146
3.8.1 The Various Design Methods Currently in Use Produce Different Results ........... 146
3.8.2 ACPA/AASHTO Design Method Slab Thickness Are Generally Greater than Those
of Other Methods ................................................................................................................ 146
3.8.3 Axle Loads will Probably Increase Over Next 30 Years ........................................ 147
vii
3.8.4 Caltrans Flexural Strength Requirements Are Low Compared to Other State DOTs ..
................................................................................................................................. 147
3.8.5 Dowels are Necessary to Improve Faulting Performance....................................... 147
3.8.6 Large Diameter Dowels Increase Dowel Effectiveness .......................................... 147
3.8.7 Use of Widened Truck Lanes or Tied Concrete Shoulders Improves Fatigue
Cracking Performance......................................................................................................... 147
3.8.8 Use of Non-Erodable Bases Improves Distresses Associated with Loss of Subgrade
Support ................................................................................................................................ 148
3.8.9 Concrete Strength and Slab Thickness Are Related in Terms of Cracking Resistance
................................................................................................................................. 148
3.8.10 Coefficient of Thermal Expansion Affects Tensile Stresses in Concrete ............... 148
3.8.11 Axle Load Spectra Affect Required Slab Thickness............................................... 149
3.8.12 Design Methods Mostly Agree on Relative Benefits and Drawbacks of Design
Variables.............................................................................................................................. 149
4.0 Recommendations ............................................................................................................... 151
4.1 Faulting .......................................................................................................................... 151
4.2 Axle Loads ..................................................................................................................... 151
4.3 Climate and Slab Length................................................................................................ 151
4.4 Stiff Bases ...................................................................................................................... 152
4.5 Flexural Strength and Coefficient of Thermal Expansion ............................................. 152
4.6 Dowels, Tied Concrete Shoulders, and Widened Truck Lanes ..................................... 153
4.7 Slab Thickness ............................................................................................................... 153
5.0 References ........................................................................................................................... 155
viii
Appendix A: Condition Survey Notes ....................................................................................... 159
Appendix B: PCA Sensitivity Analysis ..................................................................................... 173
Appendix C: ACPA/AASHTO Sensitivity Analysis ................................................................. 179
Appendix D: Illinois Department of Transportation, ILLICON Results ................................... 191

ix
LIST OF FIGURES
Figure 1. Schematic representation of faulting distress mechanism in rigid pavements. .............. 9
Figure 2. Schematic representation of pumping distress mechanism in rigid pavements............ 10
Figure 3. Typical corner cracks in rigid pavements. .................................................................... 12
Figure 4. Schematic of typical transverse fatigue cracks in rigid pavements. ............................. 13
Figure 5. Typical distribution of fatigue damage as function of the distance from the edge at
which the axle load passes. (6).............................................................................................. 16
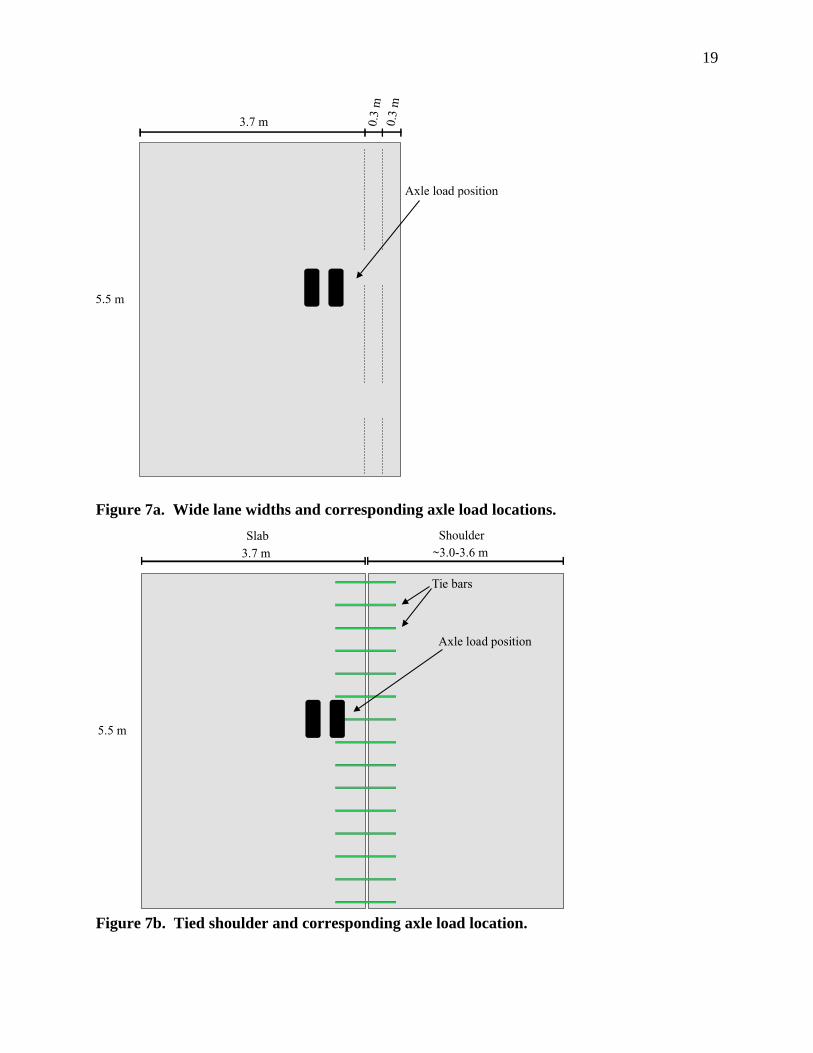
Figure 6. Standard lane width and corresponding axle load location. .......................................... 18
Figure 7a. Wide lane widths and corresponding axle load locations. .......................................... 19
Figure 7b. Tied shoulder and corresponding axle load location. ................................................. 19
Figure 8. Schematic of typical longitudinal cracks in rigid pavements. ...................................... 20
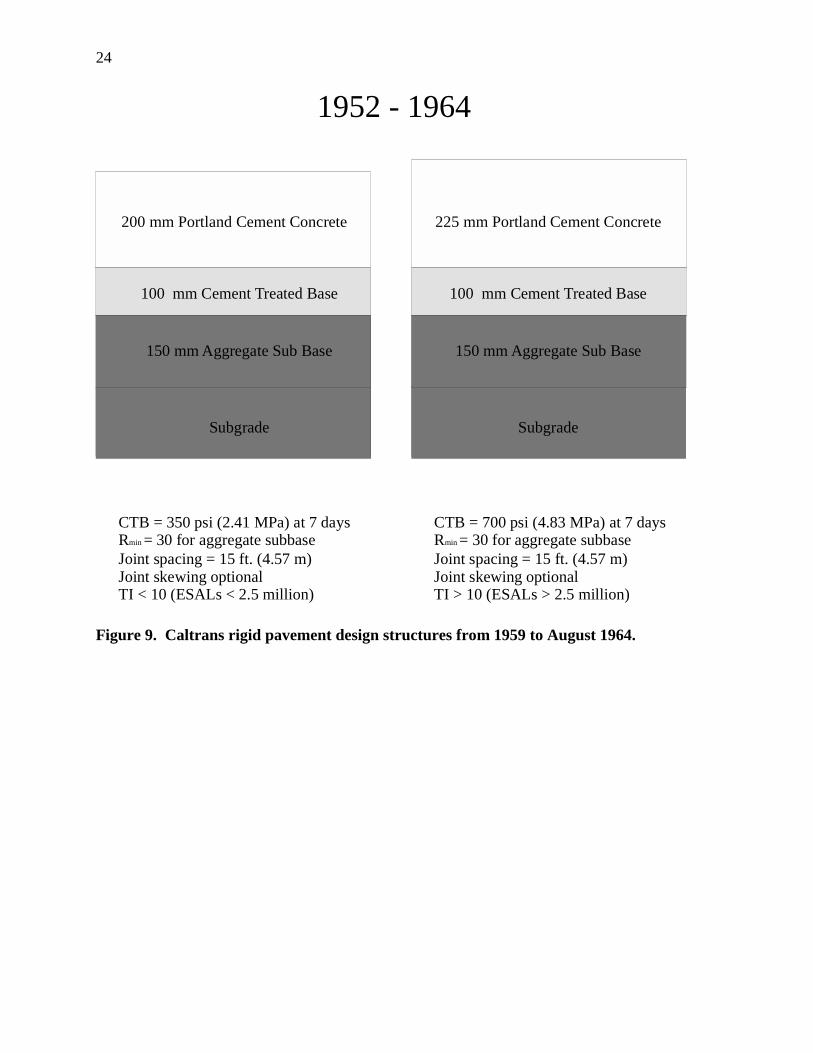
Figure 9. Caltrans rigid pavement design structures from 1959 to August 1964......................... 24
Figure 10. Caltrans rigid pavement design structures from 1964 to 1967. .................................. 25
Figure 11. Caltrans rigid pavement design structures from 1967 to 1983. .................................. 26
Figure 12. Caltrans rigid pavement design structures since 1983................................................ 27
Figure 13. Proposed LLPRS structure.......................................................................................... 35
Figure 14. Rigid pavement structure proposed by Green team.................................................... 38
Figure 15. Rigid pavement structure proposed by Yellow team for areas without sufficient
support for an unbonded PCC overlay. ................................................................................. 39
Figure 16. Rigid pavement structure proposed by Yellow team for areas with sufficient subgrade
support................................................................................................................................... 41
Figure 17. Flexible pavement structure proposed by Blue team.................................................. 41
Figure 18. Flexible pavement structure proposed by Brown team. ............................................. 42
x
Figure 19. Locations of projects meeting criteria for LLPRS implementation, based on 1995
data. ....................................................................................................................................... 44
Figure 20. Locations of projects meeting criteria for LLPRS implementation, based on 1995
data. ....................................................................................................................................... 45
Figure 21. Locations of projects meeting criteria for LLPRS implementation, based on 1995
data. ....................................................................................................................................... 46
Figure 22. Five climate regions affecting pavement performance in California. ........................ 47
Figure 23. LLPRS candidate projects surveyed for distress mechanisms in May, 1998. ............ 53
Figure 24. Pavement distresses at postmile 23.7 southbound, Interstate 5, Los Angeles County:
transverse fatigue cracking and perpendicular joints. ........................................................... 55
Figure 25. Pavement distresses at postmile 34.9 southbound, Interstate 5, Los Angeles County:
transverse fatigue cracking and perpendicular joints. ........................................................... 56
Figure 26. Pavement distress at postmile 12.9 westbound, Interstate 10, between Los Angeles
and District 7/District 8 boundary: large joint openings, faulting, no cracking.................... 58
Figure 27. Pavement distress at postmile 30.0 eastbound, Interstate 10, between Los Angeles
and District 7/District 8 boundary: large joint openings, no cracking. ................................. 59
Figure 28. Pavement distresses at postmile 30.0 eastbound, Interstate 10, between Los Angeles
and District 7/District 8 boundary: longitudinal cracking..................................................... 60
Figure 29. Pavement distresses at postmile 30.0 eastbound, Interstate 10, between Los Angeles
and District 7/District 8 boundary: corner cracking.............................................................. 60
Figure 30. Pavement distress at postmile 9.6 eastbound, Interstate 10, San Bernardino county:
transverse fatigue cracking in long slab, none in short slab.................................................. 62
xi
Figure 31. Pavement distress at postmile 9.6 eastbound, Interstate 10, San Bernardino county:
large joint opening................................................................................................................. 63
Figure 32. Pavement distress at postmile 7.7 southbound, Interstate 215, District 8: sealed corner
and transverse fatigue cracking. ............................................................................................ 63
Figure 33. Pavement distress at postmile 2.7 northbound, Interstate 405, District 12: longitudinal
cracking. ................................................................................................................................ 66
Figure 34. Pavement distress at postmile 8.3 southbound, Interstate 710: transverse fatigue
cracking and badly spalled, badly faulted joint..................................................................... 68
Figure 35. Pavement distress at postmile 8.3 southbound, Interstate 710: spalled joint, transverse
fatigue cracking. .................................................................................................................... 68
Figure 36. Pavement distress condition at postmile 17.3 westbound Interstate 60, District 7:
corner cracking, transverse cracking, moderate faulting....................................................... 70
Figure 37. Comparison of PCA “very heavy,” I-5 San Joaquin County, and I-215 San Diego
County axle load spectra. ...................................................................................................... 87
Figure 38. Comparison of heaviest loads from PCA “very heavy,” I-5 San Joaquin County, and
I-215 San Diego County axle load spectra............................................................................ 89
Figure 39. Dowel/Concrete Bearing Stress Versus Dowel Size and Concrete Slab Thickness. 129
Figure 40. Dowel/Concrete Bearing Stress Versus Dowel Size and Subgrade Stiffness. ......... 130
Figure 41. Effects of dowels and dowel bearing stress on faulting............................................ 143
Figure 42. Effects of base type and wide truck lane on faulting. ............................................... 144
Figure 43. Effects of drainage, dowels, and environment on faulting. ...................................... 145

xii
LIST OF TABLES
Table 1 Minimum Concrete Flexural Strengths Required by State Highway Agencies............ 15
Table 2 Effects of CTB Specifications on Faulting Performance (from FHWA Report [9]). ... 29
Table 3 Summary of Preliminary Design Variables for LLPRS Candidate Projects................. 49
Table 4 Summary of Typical Values for Important Climate Variables for Six California
Regions.................................................................................................................................. 50
Table 5 Condition Survey Summary for Interstate 5 in District 7. ............................................ 54
Table 6 Condition survey summary for Interstate 5 in District 12............................................. 55
Table 7 Condition Survey Summary for Interstate 5 in District 11. .......................................... 57
Table 8 Condition Survey Summary for Interstate 10 in District 7. .......................................... 57
Table 9 Condition Survey Summary for Interstate 10 in District 8. .......................................... 61
Table 10 Condition Survey Summary for Interstate 215 in District 8. ........................................ 64
Table 11 Condition Survey Summary for Interstate 405 in District 7. ........................................ 65
Table 12 Condition Survey Summary for Interstate 405 in District 12. ...................................... 65
Table 13 Condition Survey Summary for Interstate 710. ............................................................ 66
Table 14 Condition Survey Summary for Interstate 60 in District 7. .......................................... 69
Table 15 Condition Survey Summary for State Route 60 in District 8........................................ 70
Table 16 Summary of Distresses for all Southern California Sections Surveyed........................ 71
Table 17 Variables Considered in ILLICON, ACPA/AASHTO, and PCA Design Methods. .... 83
Table 18 Caltrans Facilities with Highest Daily Truck Traffic Volumes in Design Lane
(Assuming Even Distribution of Trucks Between All Truck Lanes).................................... 84
Table 19 Headways and Clearances Between Trucks for Design Truck Traffics at 50 kph........ 84
Table 20 Daytime Headways and Clearances Between Trucks for Design Truck Traffics at 50
kph, Assuming 75 Percent of Trucks Pass in Daylight Half of Day..................................... 85
xiii
Table 21 PCA “Very Heavy,” I-5 San Joaquin and I-215 San Diego Axle Load Spectra........... 86
Table 22 Summary of Assumed Values for Variables Included in Illinois DOT Method and Not
Considered in PCA and ACPA/AASHTO Methods. ............................................................ 88
Table 23 Composite base/subgrade k-values for PCA and ACPA/AASHTO methods for various
subgrade and base structures. ................................................................................................ 90
Table 24 Joint Load Transfer, “J factors,” Selected for Use with ACPA/AASHTO Method. .... 92
Table 25 Locations Used for Integrated Climate Model Analysis. .............................................. 94
Table 26 Concrete Slab Thicknesses from PCA Method, in. (cm). ............................................. 97
Table 27 Average Concrete Slab Thicknesses and Failure Modes for Each Variable Factor
Level. PCA Method............................................................................................................... 99
Table 28 Average Concrete Slab Thicknesses and Failure Modes for Each Variable Factor
Level, Assuming Use of Dowels and Tied Concrete Shoulders or Widened Truck Lanes.101
Table 29 Concrete Slab Thicknesses from ACPA/AASHTO Method, in. (cm)........................ 103
Table 30 Average Concrete Slab Thicknesses for Each Variable Factor Level, ACPA/AASHTO
Method. ............................................................................................................................... 107
Table 31 Average Concrete Slab Thicknesses and Failure Modes for Each Variable Factor
Level, Assuming Use of Dowels and Tied Concrete Shoulders or Widened Truck Lanes,
ACPA/AASHTO Method. .................................................................................................. 108
Table 32 Effect of Base Type on Required Slab Thickness for South Coast Climate, AC
Shoulders, No Dowels, 5.79 m Slabs, San Joaquin Axle Load Spectrum. ......................... 109
Table 33 Effect of Concrete Coefficient of Thermal Expansion (alpha) on Required Slab
Thickness for South Coast Climate, AC Shoulders, 5.79 m Slabs, San Joaquin Axle Load
Spectrum.............................................................................................................................. 110

xiv
Table 34 Effect of Dowel Size on Required Slab Thickness Based on Fatigue Cracking
Criterion, for South Coast Climate, AC Shoulders, 5.79-m Slabs, San Joaquin Axle Load
Spectrum.............................................................................................................................. 112
Table 35 Current San Joaquin Axle Load Spectrum, and With 20 Percent Increase in Loads. . 113
Table 36 Effect on Required Slab Thickness of Increasing All Axle Loads by 20 Percent for 19
and 15 ft. (5.79 and 4.57 m) Slab Lengths, South Coast Climate, No Dowels, ILLICON
method, [in. (cm)]. .............................................................................................................. 114
Table 37 Concrete Slab Thicknesses [in. (cm)] from Illinois DOT Method for 15 ft. (4.57 m)
Slabs in Los Angeles Climate. ............................................................................................ 116
Table 38 Concrete Slab Thicknesses [in. (cm)] from Illinois DOT Method for 19 ft. (5.79 m)
Slabs in Los Angeles Climate. ............................................................................................ 117
Table 39 Concrete Slab Thicknesses [in. (cm)] from Illinois DOT Method for 15 ft. (4.57 m)
Slabs in Fresno Climate....................................................................................................... 118
Table 40 Concrete Slab Thicknesses [in. (cm)] from Illinois DOT Method for 19-ft. (5.79-m)
Slabs in Fresno Climate....................................................................................................... 119
Table 41 Concrete Slab Thicknesses [in. (cm)] from Illinois DOT Method for 15 ft. (4.57 m)
Slabs in Daggett Climate..................................................................................................... 120
Table 42 Concrete Slab Thicknesses [in. (cm)] from Illinois DOT Method for 19 ft. (5.79 m)
Slabs in Daggett Climate..................................................................................................... 121
Table 43 Average Concrete Slab Thicknesses, Each Variable Factor Level, Illinois DOT
Method. ............................................................................................................................... 122
Table 44 Comparison of Slab Thickness Versus Inclusion of Dowels and Tied Concrete
Shoulders or Wide Truck Lanes Across All Three Design Methods for LLPRS Base
xv
Structure, South Coast Environment, San Joaquin Axle Load Spectrum, 17,500 Trucks Per
Day in Design Lane, 650 psi (4.48 MPa) Concrete Flexural Strength................................ 124
Table 45 Comparison of Slab Thickness Versus Concrete Flexural Strength Across All Three
Design Methods for LLPRS Base Structure, South Coast Environment, San Joaquin Axle
Load Spectrum, 17,500 Trucks Per Day in Design Lane, Dowels and Tied Concrete
Shoulders............................................................................................................................. 125
Table 46 Comparison of Slab Thickness Versus Daily Trucks in the Design Lane Across All
Three Design Methods for LLPRS Base Structure, 650 psi (4.48 MPa) Concrete Flexural
Strength, South Coast Environment, San Joaquin Axle Load Spectrum, Dowels and Tied
Concrete Shoulders. ............................................................................................................ 125
Table 47 Experiment Design for Analysis of Bearing Stress at Dowel/Concrete Interface. ..... 127
Table 48 Results of Bearing Stress Analysis Experiment.......................................................... 128
Table 49 Experiment Design for Evaluation of Faulting Performance versus Dowel Size. ...... 132
Table 50 Experiment Design for Evaluation of Faulting Performance for Undoweled Pavements.
..................................................................................................................................... 133
Table 51 Calculated Faulting Histories for Doweled and Undoweled Pavements, San Diego
Axle Load Spectrum, 15-ft. (4.57-m) Joint Spacing, 8-in. (20.3-cm) Slab Thickness. ...... 135
Table 52 Calculated Faulting Histories for Doweled and Undoweled Pavements, San Joaquin
Axle Load Spectrum, 15-ft. (4.57-m) Joint Spacing, 8-in. (20.3-cm) Slab Thickness. ...... 137
Table 53 Calculated Faulting Histories for Doweled and Undoweled Pavements, San Diego
Axle Load Spectrum, 15-ft. (4.57-m) Joint Spacing, 12-in. (30.5-cm) Slab Thickness. .... 139
Table 54 Calculated Faulting Histories for Doweled and Undoweled Pavements, San Joaquin
Axle Load Spectrum, 15-ft. (4.57-m) Joint Spacing, 12-in. (30.5-cm) Slab Thickness. .... 141

xvi

xvii
EXECUTIVE SUMMARY
Chapter 1 of this report includes a summary of the Caltrans objectives for long life
concrete pavement rehabilitation strategies, the objectives of the UCB Contract Team work, and
an overview of the four reports containing preliminary findings and recommendations from the
UCB Contract Team.
The objectives of the Caltrans Long Life Pavement Rehabilitation Strategies (LLPRS) for
rigid pavements (LLPRS-Rigid) are to provide 30 or more years of service life, to require
minimal maintenance, and to have a construction production capability of about 6 lane-
kilometers in a weekend. The current proposed strategy for LLPRS-Rigid is to use high early
strength concretes (4- to 8-hour opening times), retain current base structures below the existing
concrete slabs, remove and replace current 200- to 225-mm thick slabs with new slabs of the
same thickness, and potentially include design features such as dowels, tied concrete shoulders,
and widened truck lanes.
The objectives of the UCB Contract Team are to evaluate potential LLPRS-Rigid
strategies with respect to structural adequacy of the designs, materials selection, and construction
issues. To meet these objectives, the UCB Contract Team is performing mechanistic analyses of
the proposed structures, investigation of design parameters, laboratory testing of paving
materials, and verification of failure mechanisms and expected performance through Heavy
Vehicle Simulator testing in the field.
This report is one of four presenting preliminary findings regarding the expected
performance of LLPRS strategies developed to date by Caltrans. The other reports address
potential long term concrete durability problems for concrete paving materials; investigations of
the effects of loading configurations, concrete strength versus traffic opening times, and

xviii
construction production; and the performance under HVS loading of an instrumented test
pavement constructed using accelerated Portland cement concrete.
Chapter 2 presents an assessment of design criteria. Rigid pavement distress mechanisms
are reviewed from a mechanistic perspective, including a summary of the effects of design,
materials, environment, and construction variables on pavement performance. A historical
review of distresses typical of Caltrans rigid pavements is made, to identify distress mechanisms
that must be considered to obtain pavements with 30 years of service life. Design and
construction practices over the past 50 years are reviewed, to obtain a better understanding of
past performance, and because current LLPRS-Rigid strategies call for retention of all of the
existing structure except for the concrete slab, and existing lanes with their particular joint
spacings and slab thicknesses.
The important characteristics of the projects prioritized for inclusion in the LLPRS
program are summarized, particularly with regard to environmental variables. The results of a
recent condition survey performed to identify distress mechanisms present in the existing
structures of LLPRS candidate projects is presented.
The findings of Chapter 2 are as follows:
• The mechanisms for pavement distresses are mostly understood. The distresses found
on Caltrans rigid pavements, faulting and transverse, corner, and longitudinal
cracking, are caused by mechanisms that for the most part have been investigated by
other researchers and observed on rigid pavements in other states as well as in
California. The mechanism that causes longitudinal cracking is the only one of those
discussed in this report that is not well understood. The mechanisms for corner

xix
cracking and transverse joint faulting are understood, however, reliable quantitative
models have not yet been developed.
• The most prevalent distress found on the candidate LLPRS projects is transverse joint
faulting. Faulting occurs throughout the state. Some routes have faulting over nearly
their entire length. Faulting is often severe enough to cause a high level of discomfort
to road users.
• Past designs for faulting reduction measures have not been effective. Caltrans rigid
pavement designs have changed since construction of the interstate highway system
began in California in the mid-1950s. Many of those changes have been introduced
to reduce faulting, which has been recognized as one of the most important distresses
on California rigid pavements since the early 1960s. The distress mechanism for
faulting requires poor levels of load transfer across joints, and the presence of
movable materials in the material underlying the joints. The decision to not use
dowels for better load transfer across transverse joints is based on construction
problems observed in 1949 by Hveem. The use of dowels does not appear to have
been the subject of Caltrans research since then. The use of cement treated bases as a
non-erodable material beneath the concrete slabs does not appear to have mitigated
the occurrence of severe faulting. The use of skewed joints also does not appear to
have had much effect on faulting performance.
• Use of joint sealant reduce joint spalling, and may reduce longitudinal cracking. The
construction of joint sealant reservoirs and use of long lasting compressible joint
sealants can help keep incompressible materials out of the joints, which reduces the
potential for joint spalling and possibly longitudinal cracking. Further investigation

xx
of the mechanism for longitudinal cracking is needed to better determine the effects
of incompressible materials in the joints.
• Cracking is present on Caltrans rigid pavements. Although cracking is not the most
prevalent distress on Caltrans rigid pavements, transverse cracking and longitudinal
cracking are present, and corner cracking is present to a lesser extent.
• The measures necessary to reduce joint faulting will probably result in a lower
occurrence of corner cracking because both distresses are primarily caused by loss of
support under the slab. Such measures may also reduce occurrence of longitudinal
cracking. The measures identified to reduce faulting are improved joint load transfer,
use of non-erodable materials below the concrete slabs, and elimination of free water
beneath the slabs.
• Long joint spacings in proposed LLPRS projects will be critical for transverse
(fatigue) cracking. In the current LLPRS-Rigid strategies under review for Caltrans
by the University of California Berkeley Contract Team, the joint spacings of the
truck lanes to be reconstructed must be the same as those of the inner lanes. Joint
spacings on existing inner lanes range between 3.6 and 5.8 m. The longer joint
spacings may cause transverse fatigue cracking or environmentally induced cracking
to occur faster. (37)
• Flexural strength plays an essential role in cracking, particularly transverse fatigue
cracking. Flexural strengths required by Caltrans are less than those of many other
states.
• The strategies proposed for rigid pavement reconstruction by the team involved in the
TRB evaluation of Interstate 710 call for 300- to 350-mm thick concrete slabs to be

xxi
placed on cement stabilized bases. These thick slabs will require substantial work on
many bridges to maintain legal height clearances.
• Climatic regions play a significant role in rigid pavement distress mechanisms, but
are not currently considered in Caltrans design procedures. The LLPRS candidate
projects are located in several climatic regions. Temperature and rainfall play
significant roles in rigid pavement distress mechanisms.
Chapter 3 presents an evaluation of the proposed LLPRS strategies using three current
rigid pavement design methods: the Portland Cement Association (PCA) method; the American
Concrete Paving Association (ACPA) version of the AASHTO method; and, the method
developed for the Illinois Department of Transportation by the University of Illinois. The
objective of this experiment was to evaluate the effects of various design features and design
variables on slab thicknesses required to obtain service lives of 30 years or more.
A summary of preliminary investigations of expected design input variables is presented
first. The design input variables include traffic and axle loads expected over the next 30 years,
different levels of base and subgrade support, concrete strength, design features such as dowels
and tied shoulders, design reliability, climate, drainage, and pavement failure modes.
The findings of Chapter 3 were:
• The various design methods currently in use produce different results. The
ACPA/AASHTO and PCA methods consider both transverse fatigue cracking and
distresses associated with loss of support to the slab. The Illinois DOT method
considers transverse fatigue cracking only. The PCA and Illinois DOT methods use a
mechanistic approach for transverse fatigue cracking analysis, while the
ACPA/AASHTO method uses an empirical approach. The current ACPA/AASHTO
xxii
method is extrapolated very far beyond the traffic levels encountered at the AASHO
Road Test.
• In general, the required slab thicknesses for the ACPA/AASHTO method are much
thicker than those of the Illinois DOT method. The required thicknesses from the
Illinois DOT method are typically thicker than those from the PCA method, although
at times they are in agreement.
• It is likely that axle loads will increase over the next 30 years due to the need to
increase freight throughput without increasing lane capacity.
• Current concrete flexural strengths required by Caltrans are less than those required
by many other State DOTs.
• The inclusion of dowels to increase load transfer at the transverse joints is necessary
to obtain improved resistance to faulting, based on the results from the PCA and
ACPA/AASHTO methods.
• The benefit of including dowels to reduce faulting is substantially increased when
large diameter dowels are used. The largest possible size dowel should be used (i.e.,
37-mm diameter) provided the concrete slab is thick enough to prevent cracking of
the concrete cover around the dowels.
• Use of widened truck lanes or tied concrete shoulders to provide good load transfer
across longitudinal joints is necessary to obtain good fatigue cracking performance.
These features will improve performance with respect to distresses associated with
loss of support to the slab as well.
• Use of non-erodable bases will improve performance for distresses associated with
loss of subgrade support, such as faulting and corner cracking. The use of very stiff
xxiii
bases that cannot accommodate temperature curling may be detrimental to transverse
fatigue cracking performance.
• A minimum concrete strength of 650 psi (4.48 MPa) at 90 days is needed to limit the
thickness of the concrete slabs. Concrete strength of less than 650 psi (4.48 MPa)
will require thicker slabs to prevent cracking.
• The coefficient of thermal expansion of the concrete plays an important role in
determining tensile stresses in the slab due to temperature curling. The determination
of the coefficient of thermal expansion is necessary in order to determine the effect of
new fast setting cements on slab cure stresses.
• Axle load spectra play a role in determining required slab thickness because the
heaviest loads in the spectrum generally determine pavement performance with
respect to both transverse fatigue cracking (single axle loads) and faulting (tandem
axle loads).
• Although the three design methods generally did not require the same slab
thicknesses for similar design inputs, they are nearly always in agreement as to the
benefits and drawbacks of structural design features such as dowels and tied concrete
shoulders, concrete flexural strength, thicker concrete slabs, and axle load spectra.
The results from the PCA and Illinois DOT methods indicate that it may be possible
to obtain 30-year design lives using 8- or 9-inch (203- or 229-mm) concrete slabs.
Those methods indicate that for 30-year design lives, the pavements must include all
of the following features:
· concrete flexural strengths of 650 psi (4.48 MPa) or higher,
xxiv
· concrete coefficient of thermal expansion less than 3×10⁻⁶ to 5×10⁻⁶ in./in./°F
(5.4×10⁻⁶ to 9×10⁻⁶ mm/mm/°C),
· dowels with as large a diameter as possible while providing sufficient concrete
cover,
· tied concrete shoulders with high load transfer, or widened (4.3-m) truck lanes,
· non-erodable bases that are not too stiff when the concrete slab is curling due to
temperature gradients.
Even with all of these features included in the pavements, 30-year design lives with 8- or
9-inch (203- or 229-mm) slabs may not be obtainable under conditions in which:
• slab lengths are greater than 15 ft. (4.57 m),
• day to night temperature changes introduce large tensile stresses, such as in the Desert
and Valley climatic regions, and
• in particular, greater than 15-ft. (4.57 m) slab lengths are used in the Desert and
Valley climatic regions.
As presented in Chapter 4, the recommendations to Caltrans based on the findings of this
report are:
• Faulting. Faulting is the most prevalent distress that occurs in Caltrans rigid
pavements. Transverse cracking due to axle loading and temperature curling, corner
cracking, and longitudinal cracking are also present in the network. Each distress
must be addressed specifically in the pavement designs.
• Axle Loads. Axle loads and the number of trucks on the design lanes will
undoubtedly increase over the next 30 years. Designs that may have worked in the
xxv
past may not work in the future, and designs that did not provide adequate
performance in the past will deteriorate even more quickly under the increased
loading. This traffic and loading growth must be accounted for in the pavement
designs. The efficiency of evaluating truck traffic in terms of ESALs, as opposed to
evaluating distress mechanisms in terms of axle load spectra, merits further
investigation.
• Climate and Slab Length. The performance of the LLPRS proposed pavement
structures will depend in large part on the specific climate and the slab lengths of the
adjoining lanes. Rigid pavements in the Desert and Valley climates, with their large
day to night temperature changes, will deteriorate with respect to cracking faster than
the milder coastal climates. Transverse joint spacings greater than 15 ft. (4.57 m) will
also experience more rapid cracking than joint spacing less than 15 ft. (4.57 m), all
other variables being equal. Pavement structural designs must be considered on a
project by project basis, rather than applying a uniform structure across a variety of
climates and joint spacings, as well as base, subgrade, and drainage conditions.
• Stiff Bases. The use of very stiff bases may lead to earlier cracking because of
temperature curling. This is particularly the case in the Valley and Desert climates
with long slab lengths large concrete coefficients of thermal expansion. At the same
time, bases should be as non-erodable as possible in order to minimize loss of support
to the slab, which contributes to faulting and corner cracking. The effectiveness of
keeping the existing CTB bears further investigation, especially to evaluate its
strength and condition. New asphalt concrete bases with relatively high asphalt
contents may provide the desired properties of being non-erodable, yet with low
xxvi
stiffness under loading times of several hours. Alternative bases should be
considered with respect to structural performance and constructability.
• Flexural Strength and Coefficient of Thermal Expansion. The most important
concrete properties from a pavement structural performance perspective are flexural
strength and coefficient of thermal expansion. Long term durability is also important,
and is addressed in a separate report. (38) Large flexural strengths (650 to 800 psi
[4.44 to 5.52 MPa]), and small coefficients of thermal expansion (3×10⁻⁶ to 5×10⁻⁶
in./in./°F) are needed to minimize slab thicknesses. Development of materials
meeting these requirements is essential if the desired design life of 30 or more years
is to be obtained.
• Dowels, Tied Concrete Shoulders, and Widened Truck Lanes. It is apparent from
the design methods that the use of dowels is necessary to address faulting. The use of
tied concrete shoulders or widened truck lanes is needed to address fatigue cracking
and loss of support to the slab, which contributes to faulting and corner cracking.
These features should be implemented in the LLPRS-Rigid strategies based on these
preliminary investigations performed using existing design methods.
• Slab Thickness. Although not exactly in agreement, the PCA and Illinois DOT
methods indicate that 8- and 9-inch (203- and 229-mm) concrete slabs may provide
adequate design lives, provided that all of the other factors included in these
recommendations are addressed. At this time, it can be assumed that 8- to 9-in. (203-
229-mm) thicknesses will be adequate for some projects. At the same time, methods
for constructing somewhat thicker slab thicknesses, probably ranging from 10 to 12
inches (254 to 305 mm), should be considered for projects with combinations of the
xxvii
heaviest truck traffic, Valley and Desert climates, and slab lengths greater than 15 ft.
(4.57 m).
These recommendations are based on preliminary investigations conducted using existing
design methods. Except for the study of the effects of bearing stress and dowel sizes on faulting
performance, the design methods used in this report are primarily calibrated for conditions in the
Midwestern states. Despite the Midwestern calibration, the results of this study provide good
indications of the structure and materials requirements necessary to produce LLPRS pavements
that will provide 30 or more years of good performance. Continued investigation of each of the
variables included in this study is necessary for verification and calibration under expected
conditions in California over the next 30 years.

xxviii
1
1.0 BACKGROUND OF LLPRS
The California Department of Transportation (Caltrans) Long-Life Pavement
Rehabilitation Strategies (LLPRS) Task Force was commissioned on April, 1997. The product
that Caltrans has identified for the LLPRS Task Force to develop is Draft Long Life Pavement
Rehabilitation guidelines and specifications for implementation on projects in the 1998/99 fiscal
year. The focus of the LLPRS Task Force has been rigid pavement strategies. A separate task
force has more recently been established for flexible pavement strategies, called the Asphalt
Concrete Long-Life (AC Long-Life) Task Force.
The University of California at Berkeley (UCB) and its subcontractors, Dynatest, Inc., the
Roads and Transport Technology Division of the Council for Scientific and Industrial Research
(CSIR), and Symplectic Engineering Corporation, Inc., are investigating the viability of various
proposed LLPRS optional strategies for Caltrans.
1.1 Objectives
1.1.1 LLPRS Objectives
In recent years, Caltrans engineers and policy makers have felt that existing methods of
rigid pavement maintenance and rehabilitation may not be optimum from a benefit/cost or
lifecycle cost standpoint. Caltrans is also becoming more concerned about increasingly severe
traffic management problems. The agency costs of applying lane closures in urban areas is very
large compared to the actual costs of materials and placement, and increased need for
maintenance forces to be in the roadway is increasing costs and safety risks. In addition, the
costs to Caltrans’ clients, the pavement users, are increasing due to the increasing frequency of
2
lane closures, which cause delays, and the additional vehicle operating costs from deteriorating
ride quality.
A need to develop lane replacement strategies that will not require long-term closures
associated with the use of Portland Cement Concrete (PCC) and that will provide longer lives
than the current assumed design life of 20 years was identified. Caltrans has developed
strategies for rehabilitation of concrete pavements intended to meet the following objectives (1):
1. Provide 30+ years of service life,
2. Require minimal maintenance, although zero maintenance is not a stated objective,
3. Have sufficient production to rehabilitate or reconstruct about 6 lane-kilometers
within a construction window of 67 hours (10 a.m. Friday to 5 a.m. Monday).
1.1.2 Contract Team Research Objectives
The objective of the contract work is to develop as much information as possible to
estimate whether the Long Life Pavement Rehabilitation Strategies for Rigid Pavements
(LLPRS-Rigid) will meet the stated LLPRS-Rigid objectives. The Contract Team research
objectives have been determined by the Caltrans LLPRS task force.
The research test plan (2) is designed to provide Caltrans with information regarding the
following aspects of the LLPRS-Rigid design options being considered by Caltrans. It is hoped
that this information will enable Caltrans to increase the performance and reliability of the
pavements being placed in the field. The objectives of the test plan research are the following:
• To evaluate the adequacy of structural design options (tied concrete shoulders,
doweled joints, and widened truck lanes) being considered by Caltrans at this time,
primarily with respect to joint distress, fatigue cracking and corner cracking,
3
• To assess the durability of concrete slabs made with cements meeting the
requirements for early ability to place traffic upon them and develop methods to
screen new materials for durability, and
• To measure the effects of construction and mix design variables on the durability and
structural performance of the pavements.
To achieve these objectives three types of investigation are being performed:
• Computer modeling and design analysis, including use of existing mechanistic-
empirical design methods, and estimation of critical stresses and strains within the
pavement structure under environmental and traffic loading for comparison with
failure criteria;
• Laboratory testing of the strength, fatigue properties, and durability of concrete
materials that will be considered for use in the LLPRS pavements; and
• Verification of failure mechanisms and design criteria and validation of stress and
strain calculations under traffic and environmental loading by means of accelerated
pavement testing using the Heavy Vehicle Simulator (HVS) on test sections
constructed in the field.
The first milestone in the research project is the preparation of a set of reports and
presentations identifying key issues that will affect the potential for success of the proposed
rehabilitation strategies. The presentations of preliminary results were made to the Caltrans
Long Life Rehabilitation Strategies (LLPRS) Task Force on 18 June, 1998 in Woodland,
California. This report and three other reports (9, 37, 38) are part of the first milestone.

4
1.2 Overview of Preliminary Reports
Four reports have been prepared for the June, 1998 milestone. They are as follows
• This report, which presents an assessment of the critical design criteria and an
evaluation of the proposed strategies using three rigid pavement design
methodologies.
• A report that includes preliminary results of investigations of load equivalence factors
for design, potential new axle configurations and load limits, the development of
longitudinal cracking, and the relationships between strength gain in concrete, traffic
opening times, and construction productivity. (9)
• A report that presents an assessment of the causes of long-term chemical durability
problems in cements and concretes that have high early strength properties desired for
LLPRS projects. (38)
• A report that describes the construction of an instrumented test pavement using
calcium chloride accelerated PCC, and the results and analysis of HVS testing of this
test section pavement. (37)
Together, these reports identify the most important issues that need to be addressed in the
evaluation of the LLPRS-Rigid proposed strategies, and provide preliminary results and
recommendations regarding these issues.
1.3 Overview of this Report
Chapter 2.0 of this report contains an assessment of the important criteria for design of
rigid pavements in California based on past experience. The assessment includes a review of the
evolution of Caltrans designs and failure modes for those designs, and a review of the existing
5
pavement structures, climate, and future traffic conditions in which the LLPRS strategies will be
expected to perform.
Chapter 3.0 presents the results of using three structural design methods commonly used
in practice to estimate the performance of the proposed LLPRS-Rigid strategies.
Chapter 4.0 includes a summary of the results included in this report, conclusions drawn
from the results, and preliminary recommendations based on the conclusions.

6
7
2.0 ASSESSMENT OF DESIGN CRITERIA
Caltrans has been building, operating, and maintaining rigid pavements for more than 60
years. Traditionally, Caltrans has referred to rigid pavements as PCCP or Portland Cement
Concrete Pavement. The potential for using materials other than Portland Cement Concrete for
similar pavement structures requires that they be referred to as rigid pavements for this report.
Caltrans operates a state highway network of more than 24,000 centerline kilometers,
with over 78,000 lane-kilometers of pavement. Rigid pavements make up 32 percent, or about
25,000 lane-kilometers, of the Caltrans pavement network. Most of the Caltrans rigid pavements
are on heavy truck routes and/or are in urban areas where heavy traffic volumes exist. Rigid
pavements were used extensively for construction of the California State Interstate Highway
system (3).
Approximately 75 percent of California state highway pavements were constructed in the
15 years between 1959 and 1974, and were designed for 20 year lives based on traffic volumes
and loads estimated at that time. (3) It has been estimated that approximately 90 percent of the
rigid pavements were constructed in those 15 years (4), which means that those pavements will
have been in service for 25 to 40 years by 1999.
2.1 Rigid Pavement Distress Mechanisms
In order to develop effective pavement designs, it is essential to understand the
mechanisms that cause pavement distresses. The mechanisms responsible for the most common
rigid pavement distresses occurring in California are briefly summarized herein as a point of
reference for the discussion of design methods and the proposed LLPRS rehabilitation design
strategies that follow.
8
2.1.1 Faulting
Transverse joint faulting is the difference in elevation between abutting slab faces. The
difference in elevation is the result of the build-up of material under the approach slab, and often
the loss of material under the leave slab, as shown in Figure 1.
Faulting is primarily the result of a combination of heavy axle loads, pumpable materials
in the layers beneath the concrete slab, and presence of moisture beneath the pavement. Heavy
axle loads passing over the transverse joint or crack causes the rapid upward deflection of the
approach slab and downward deflection of the leave slab, which in turn causes material to
accumulate under the approach slab. The rapid deflections result in the movement of material
from under the leave slab to under the approach slab, and may also bring materials from the
subgrade or other layers to the underside of the approach slab.
Faulting is primarily reduced or prevented through good load transfer between concrete
slabs, which minimizes the differential deflection caused by axle loads passing over the joint.
The use of non-erodable materials that do not migrate and the elimination of free water in the
layers under the slab also aid in the reduction of faulting.
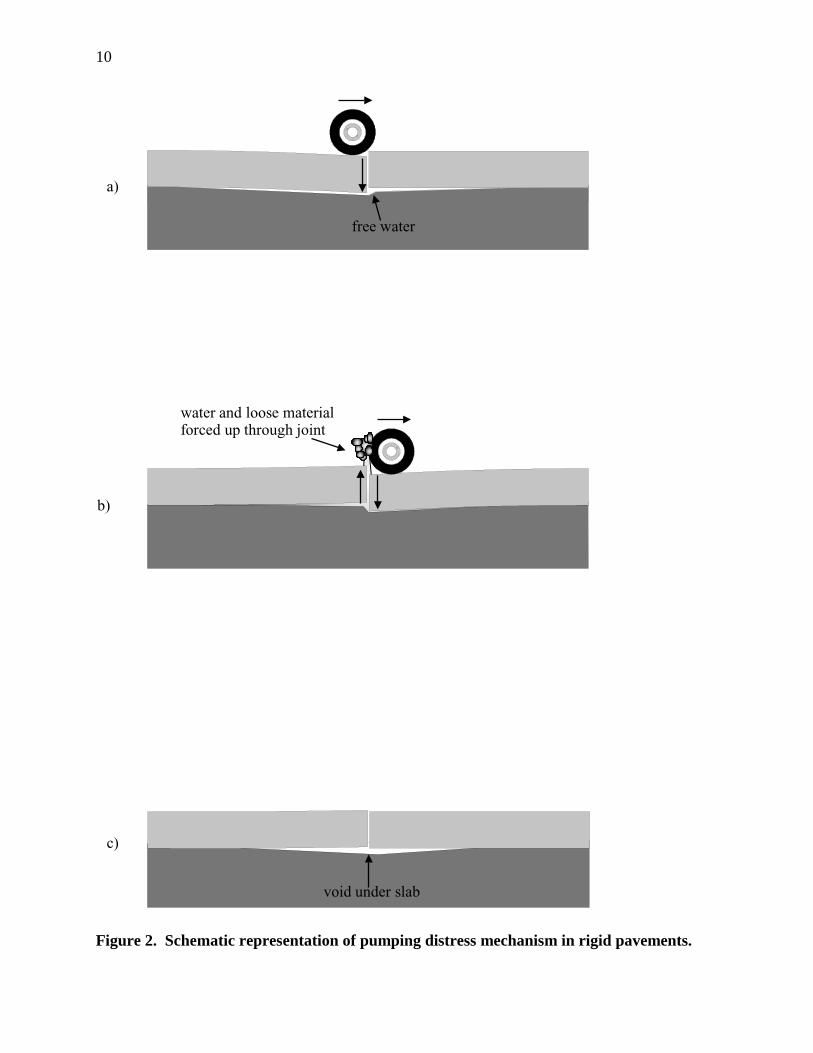
2.1.2 Pumping
Pumping is the ejection of loose materials and water from under the pavement through
cracks and joints under large deflections, as illustrated in Figure 2. Pumping becomes a serious
problem when the volume of displaced materials results in loss of support to the slab at the
corners, which causes larger deflections and stresses at the corners and may result in corner
cracks. Pumping can also cause incompressible material to accumulate in the joints between
concrete slabs, which can lead to cracking and spalling at the joints, referred to as “blow-ups,”
and may be a cause of longitudinal cracking.

9
migration of base material
accumulated base material
uneven (faulted) joint
a)
b)
c)
Figure 1. Schematic representation of faulting distress mechanism in rigid pavements.
10
void under slab
a)
b)
c)
free water
water and loose material
forced up through joint
Figure 2. Schematic representation of pumping distress mechanism in rigid pavements.

11
Pumping is primarily reduced or prevented by the elimination of free water in the layers
under the concrete slab. Pumping is also reduced by employing the same tactics as those used to
reduce faulting (i.e., ensuring good load transfer between joints and using non-erodable
materials).
2.1.3 Corner Cracking
A corner crack is a crack that intersects a transverse joint and the pavement edge at a
distance of about 2 m or less on each side from the corner of the slab, as illustrated in Figure 3.
Corner cracks are caused by loss of support under the slab corner and loading from one or
a combination of heavy axles, thermal curling, moisture warping, and high deflections. Loss of
slab support can be the result of voids under the slab corners caused by pumping or faulting, or
poor load transfer across longitudinal and transverse joints and/or shoulders.
Corner cracks are reduced or prevented primarily by measures that prevent loss of
support under the slab corners, including good load transfer from dowels and/or tied concrete
shoulders, widened truck lanes, use of non-erodable material below the slabs, good drainage, and
reduction of corner deflection.
2.1.4 Transverse (Fatigue) Cracking
Transverse cracks generally cross the slab in a direction perpendicular to the slab edge
and the direction of traffic, and are located near the transverse centerline of the slab, as illustrated
in Figure 4.
Transverse cracks occurring soon after construction are typically caused by stress levels
greater than the flexural strength of the concrete. These conditions are the result of some
combination of restraint forces from shrinkage or temperature changes, thermal curling, moisture
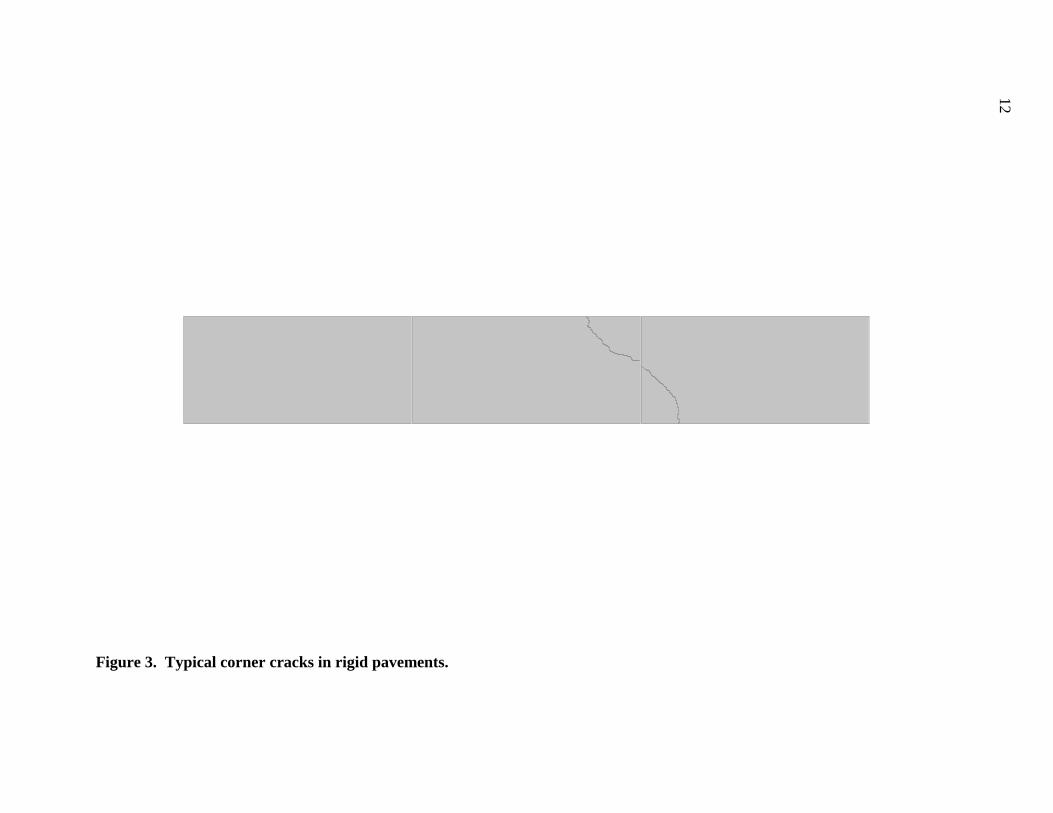
Figure 3. Typical corner cracks in rigid pavements.
12
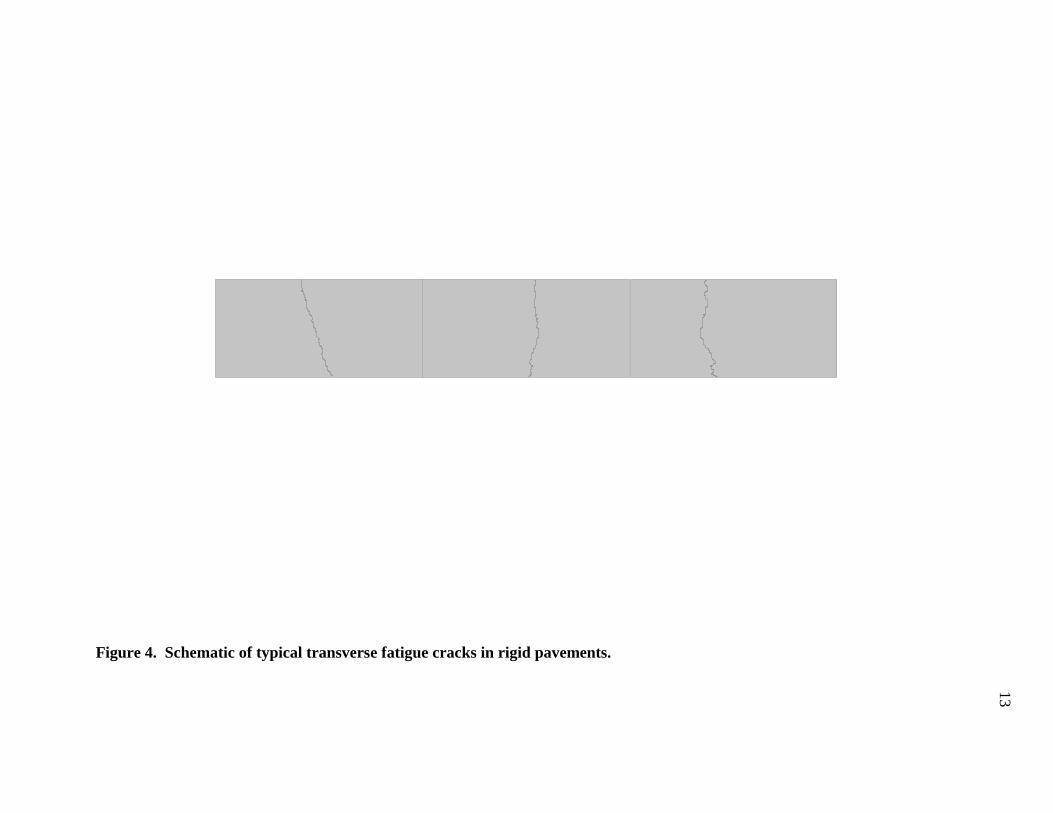
Figur
e 4. Schematic of typical transverse fatigue cracks in rigid pavements.13

14
warping, and/or traffic loads placed on the concrete before it has sufficient strength. Transverse
cracking caused by these mechanisms can largely be prevented through timely sawing of
contraction joints, proper design of slab lengths, construction practices with consideration for the
control of moisture warping and thermal curl during curing, and control of traffic to provide
sufficient strength development in the concrete before loading.
Transverse cracks that occur in the years following construction are primarily the result
of fatigue of the concrete slab caused by repeated heavy axle loads and temperature curling at
tensile stress levels less than the flexural strength of the concrete. If the concrete has particularly
low flexural strength, temperature stresses alone or a few load repetitions may be sufficient to
cause transverse cracking. The fatigue damage caused by a truck load or curling stress is a
function of the stress ratio:
MRσ
where σ is the tensile bending stress in the slab caused by the truck load and/or stress caused by
curling due to a thermal gradient in the slab, and MR is the flexural strength of the concrete.
A larger ratio of stress to strength results in cracking after fewer repetitions of the stress.
The strength to stress ratio indicates the two factors controlling fatigue cracking: tensile bending
stress in the slab and flexural strength of the concrete. The stress in the slab is determined by the
truck axle load, the thermal gradient in the slab, slab thickness, slab length, subgrade support,
and the edge support provided to the slab by load transfer devices (e.g., dowels, tied shoulders,
and/or widened lanes) near the axle load. The flexural strength of the concrete is controlled by
the concrete materials, mix design, construction variability, and curing time and conditions.
Many state highway agencies (SHAs) specify the flexural strength of concrete used for
pavements, primarily to control fatigue cracking. Table 1 shows the summary of a recent survey
15
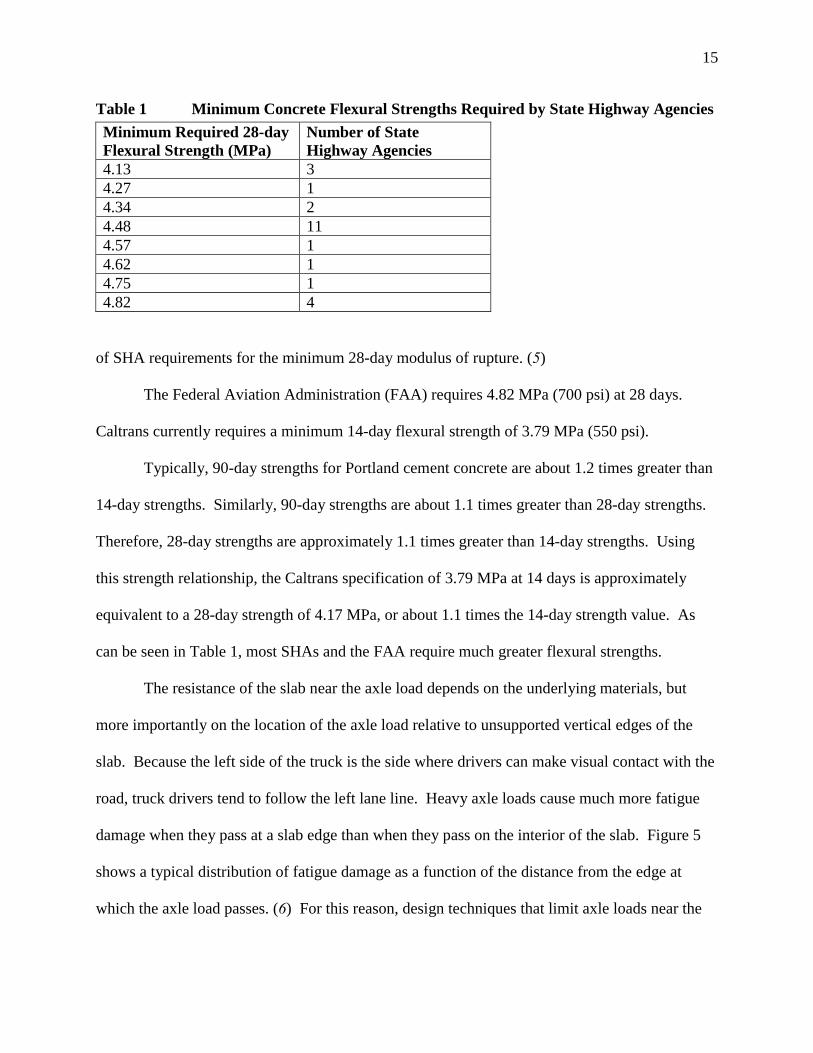
Table 1 Minimum Concrete Flexural Strengths Required by State Highway AgenciesMinimum Required 28-dayFlexural Strength (MPa)
Number of StateHighway Agencies
4.13 34.27 14.34 24.48 114.57 14.62 14.75 14.82 4
of SHA requirements for the minimum 28-day modulus of rupture. (5)
The Federal Aviation Administration (FAA) requires 4.82 MPa (700 psi) at 28 days.
Caltrans currently requires a minimum 14-day flexural strength of 3.79 MPa (550 psi).
Typically, 90-day strengths for Portland cement concrete are about 1.2 times greater than
14-day strengths. Similarly, 90-day strengths are about 1.1 times greater than 28-day strengths.
Therefore, 28-day strengths are approximately 1.1 times greater than 14-day strengths. Using
this strength relationship, the Caltrans specification of 3.79 MPa at 14 days is approximately
equivalent to a 28-day strength of 4.17 MPa, or about 1.1 times the 14-day strength value. As
can be seen in Table 1, most SHAs and the FAA require much greater flexural strengths.
The resistance of the slab near the axle load depends on the underlying materials, but
more importantly on the location of the axle load relative to unsupported vertical edges of the
slab. Because the left side of the truck is the side where drivers can make visual contact with the
road, truck drivers tend to follow the left lane line. Heavy axle loads cause much more fatigue
damage when they pass at a slab edge than when they pass on the interior of the slab. Figure 5
shows a typical distribution of fatigue damage as a function of the distance from the edge at
which the axle load passes. (6) For this reason, design techniques that limit axle loads near the

0.00
0.10
0.20
0.30
0.40
0.50
0.60
0.70
0.80
0.90
1.00
0 1 2 3 4 5 6
Location, inches from pavement edge
Rel
ativ
e Fa
tigue
Dam
age
1 inch = 25.4 mm
Figure 5. Typical distribution of fatigue damage as function of the distance from the edge at
7 8
which the axle load passes. (6)
16

17
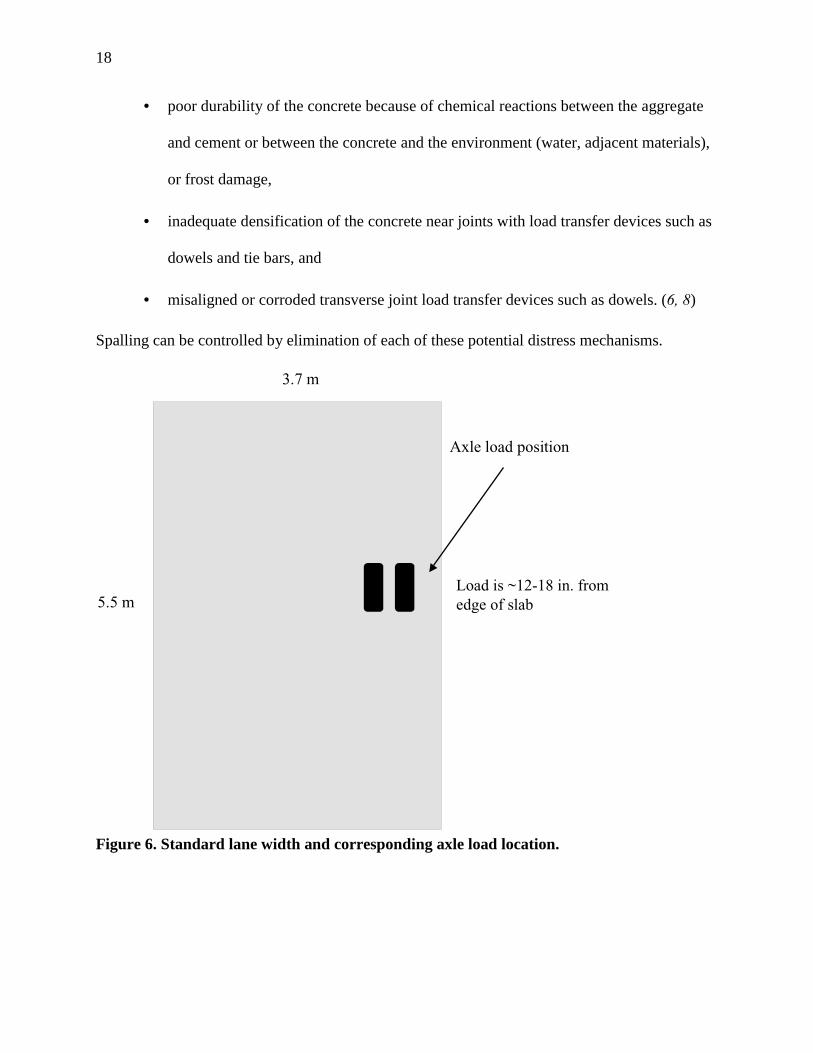
edge of the slab such as widened truck lanes, or provide improved load transfer across slab edges
such as tied concrete shoulders and tied longitudinal joints, reduce fatigue damage, as illustrated
in Figures 6 and 7. (7)
2.1.5 Longitudinal Cracking
Longitudinal cracks generally run parallel to the edge of the slab in the direction of
traffic, as illustrated in Figure 8. Longitudinal cracks can be caused by poor or late sawing of
longitudinal joints, warping or curling of the slab, or loss of support to the slab caused by
movement of underlying materials. (8)
Longitudinal cracking may also be caused by non-uniform accumulation of
incompressible fines in transverse joints, which can cause high tensile stresses when the slabs
expand with increasing temperature. The potential for this mechanism is presented in more
detail in the companion to this report. (9)
Longitudinal cracking can be controlled by timely and proper sawing of longitudinal
joints, good slab support, and potentially by elimination of incompressible fines from transverse
joints.
2.1.6 Spalling
Spalling typically occurs at transverse joints, and is the fracture or chipping of the slab
edges within one meter of the joint. Spalling can occur at transverse and corner cracks as well,
however control of those distress mechanisms negates the need to control spalling at cracks.
Spalling can be caused by:
• the presence of incompressible materials in the joints, which causes large stresses
when the slab expands with increasing temperature,
18
• poor durability of the concrete because of chemical reactions between the aggregate
and cement or between the concrete and the environment (water, adjacent materials),
or frost damage,
• inadequate densification of the concrete near joints with load transfer devices such as
dowels and tie bars, and
• misaligned or corroded transverse joint load transfer devices such as dowels. (6, 8)
Spalling can be controlled by elimination of each of these potential distress mechanisms.
5.5 m
3.7 m
Axle load position
Load is ~12-18 in. from
edge of slab
Figure 6. Standard lane width and corresponding axle load location.
19
3.7 m 0.3
m
0.3
m
Figure 7a. Wide lane widths and corresponding axle load locations.
5.5 m
3.7 m
Tie bars
Axle load position
Slab Shoulder
~3.0-3.6 m
Figure 7b. Tied shoulder and corresponding axle load location.

Figure 8. Schematic of typical longitudinal cracks in rigid pavements.
20

21
2.2 Caltrans Rigid Pavement Design Evolution since 1959
The Caltrans rigid pavement design method is essentially an empirical method based on
experience gained from long-term performance observations of in-service pavements and
engineering judgement. Changes to the design procedure have occurred when problems have
been observed in the performance of mainline pavements or a limited number of test sections.
The Caltrans rigid pavement design guide does not fall into a mechanistic-empirical framework
accounting for traffic, materials, and environment.
2.2.1 Design Features Continuously Used Since 1959
Although Caltrans rigid pavement designs have changed several times since 1959, some
design features have been used continuously since at least 1959. Some non-standard design
features, such as continuous reinforcement, have been used in test sections. However, their use
has been confined to one or two locations.
Caltrans exclusively uses plain jointed concrete, meaning that the slabs do not contain
steel rebar or wire mesh. In reinforced concrete, the rebar or wire mesh is intended to hold
cracks in the slab together and maintain load transfer across the cracks through aggregate
interlock.
All standard Caltrans rigid pavements are jointed, meaning that they have no load transfer
devices at the joints. The joint load transfer devices typically used by many other state highway
agencies (SHAs) are steel dowels.
Caltrans rigid pavements usually have asphalt concrete shoulders. Alternatives to asphalt
concrete shoulders are tied concrete shoulders that provide load transfer across longitudinal
joints between the edge of the loaded slab and the adjoining slab or concrete shoulder.
22
Caltrans saws concrete joints, but does not form transverse joint sealant reservoirs in the
cuts. Joint sealing is typically not performed, although at times joints are sealed using poured
crack sealant type material. For a time, preformed joint seals were tried, but they gave poor
performance because joints did not crack, the forms often became bent or tilted during
construction, and transverse joints in adjacent lanes often did not line up.
2.2.2 1952 to 1964
Slab thicknesses, slab lengths, joint types and joint details have changed over time.
Between 1952 and August, 1964 slab thicknesses were 200 or 225 mm, depending upon the
design truck traffic. Slab lengths were uniform at 4.6 m, with perpendicular or skewed joints
optional. An Aggregate Subbase (ASB) was placed over the subgrade, and a Cement Treated
Base (CTB) placed on ASB before placement of the concrete slab. The CTB layer was 100 mm
thick and had a compressive strength requirement of 2067 kPa (300 psi) at 7 days when the PCC
slab was 200 mm thick; and 100 mm thick with a strength requirement of 4830 kPa (700 psi)
when the PCC slab was 225 mm thick. The CTB was usually road mixed, which resulted in a
layer with a relatively high variability in strength. The 1952-1964 Caltrans rigid structures are
shown in Figure 9.
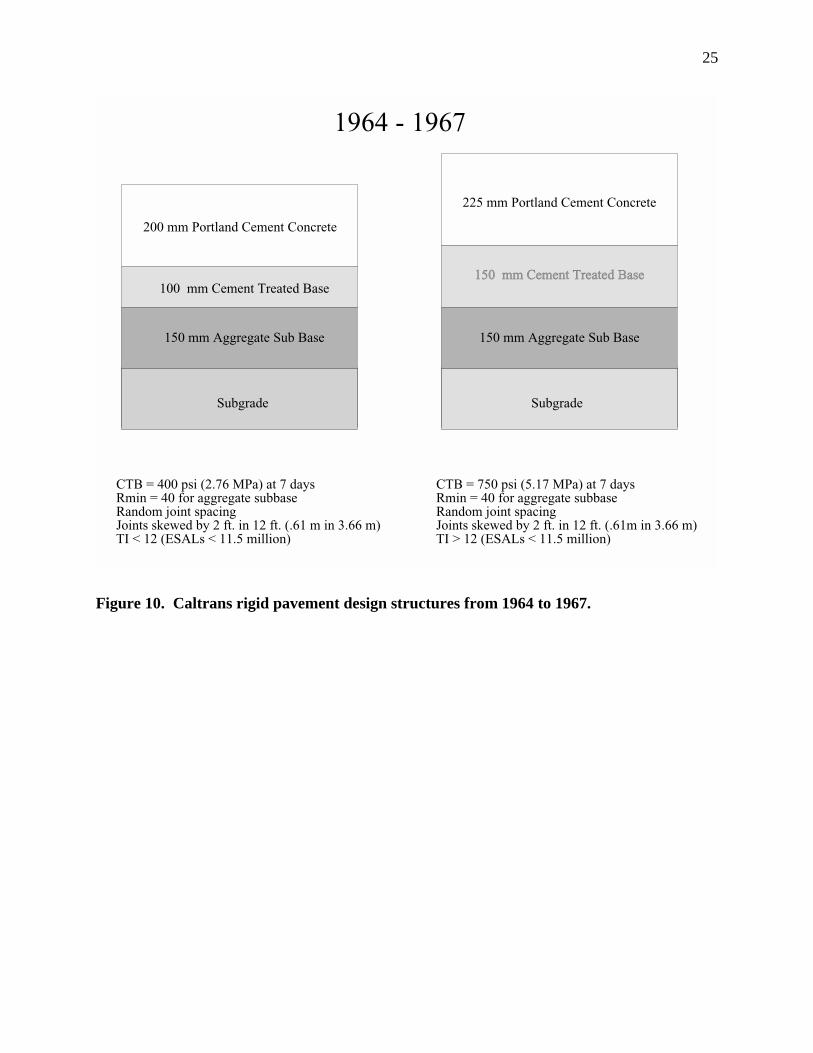
2.2.3 1964 to 1967
From 1964 until 1967, slab thicknesses remained 200 and 225 mm, although the
allowable truck traffic for slabs was made less conservative, as shown in Figure 10. Slab lengths
followed an alternating pattern of 3.7, 4.0, 5.5, 5.8 m, and all joints were required to be skewed
at an angle of 9.5 degrees. Requirements for the CTB layer changed to a thickness of 100 mm
and a compressive strength of 2756 kPa (400 psi) under 200-mm thick PCC slabs; and, a 150-
23
mm thickness and a compressive strength of 5168 kPa (750 psi) under 225-mm thick PCC slabs.
The R-value requirements were also increased for the ASB. The CTB was still road mixed.
2.2.4 1967 to 1983
During the period from 1967 to 1983, a modified version of the Portland Cement
Association (PCA) method was used to design rigid pavements. The resulting designs typically
consisted of 200- or 225-mm thick slabs with 150 mm of CTB and a varying thickness of ASB
depending on the truck traffic. Asphalt concrete bases (ACB) and aggregate bases (AB) were
also permitted in the early years of this period, and asphalt concrete and lean concrete bases
(LCB) were permitted in the latter years. After 1967, CTB was required to be plant mixed,
which produced a more uniform layer than did the previously used road mix. The minimum R-
value for the aggregate subbase was 40. Slab lengths were required to follow a pattern of 3.7,
4.0, 5.5, 5.8 m. Skewed joints were also required. The pavement structure from this period is
shown in Figure 11.
2.2.5 1983 to Current
Since 1983, constructed slab thicknesses have been between 150 and 260 mm, depending
upon the design truck traffic, as shown in Figure 12. Slab lengths are 3.6, 4.6, 4.0, and 4.3 m,
with joints skewed counterclockwise at an angle of 9.5 degrees. Of the four types of base and
subbase system shown in Figure 12, the use of Asphalt Treated Permeable Base (ATPB) with
Aggregate Base (AB) and Aggregate Subbase (ASB), or Cement Treated Permeable Base
(CTPB) with AB and ASB, are required to be given first consideration because they are
considered to provide better drainage. They are to be used with an edge drain collector and
outlet system. The Lean Concrete Base (LCB) with ASB, or Asphalt Concrete Base (ACB) with
24
200 mm Portland Cement Concrete
100 mm Cement Treated Base
150 mm Aggregate Sub Base
Subgrade
1952 - 1964
225 mm Portland Cement Concrete
100 mm Cement Treated Base
150 mm Aggregate Sub Base
Subgrade
CTB = 350 psi (2.41 MPa) at 7 daysR = 30 for aggregate subbaseJoint spacing = 15 ft. (4.57 m)Joint skewing optionalTI < 10 (ESALs < 2.5 million)
min
CTB = 700 psi (4.83 MPa) at 7 daysR = 30 for aggregate subbaseJoint spacing = 15 ft. (4.57 m)Joint skewing optionalTI > 10 (ESALs > 2.5 million)
min
Figure 9. Caltrans rigid pavement design structures from 1959 to August 1964.
25
200 mm Portland Cement Concrete
100 mm Cement Treated Base
150 mm Aggregate Sub Base
Subgrade
1964 - 1967
225 mm Portland Cement Concrete
150 mm Cement Treated Base
150 mm Aggregate Sub Base
Subgrade
CTB = 400 psi (2.76 MPa) at 7 daysRmin = 40 for aggregate subbaseRandom joint spacingJoints skewed by 2 ft. in 12 ft. (.61 m in 3.66 m)TI < 12 (ESALs < 11.5 million)
CTB = 750 psi (5.17 MPa) at 7 daysRmin = 40 for aggregate subbaseRandom joint spacingJoints skewed by 2 ft. in 12 ft. (.61m in 3.66 m)TI > 12 (ESALs < 11.5 million)
Figure 10. Caltrans rigid pavement design structures from 1964 to 1967.

26
1967 - 1983
Portland Cement Concrete 200-225 mm
Cement Treated Base 100 - 150 mm
Aggregate Sub Basevarying thickness depending on traffic
Subgrade
CTB = 400 psi (2.76 MPa)Rmin = 40 for Aggregate Sub BaseJoints spaced at 3.6, 4.6,4.0, 4.3 m patternJoints skewed
Figure 11. Caltrans rigid pavement design structures from 1967 to 1983.
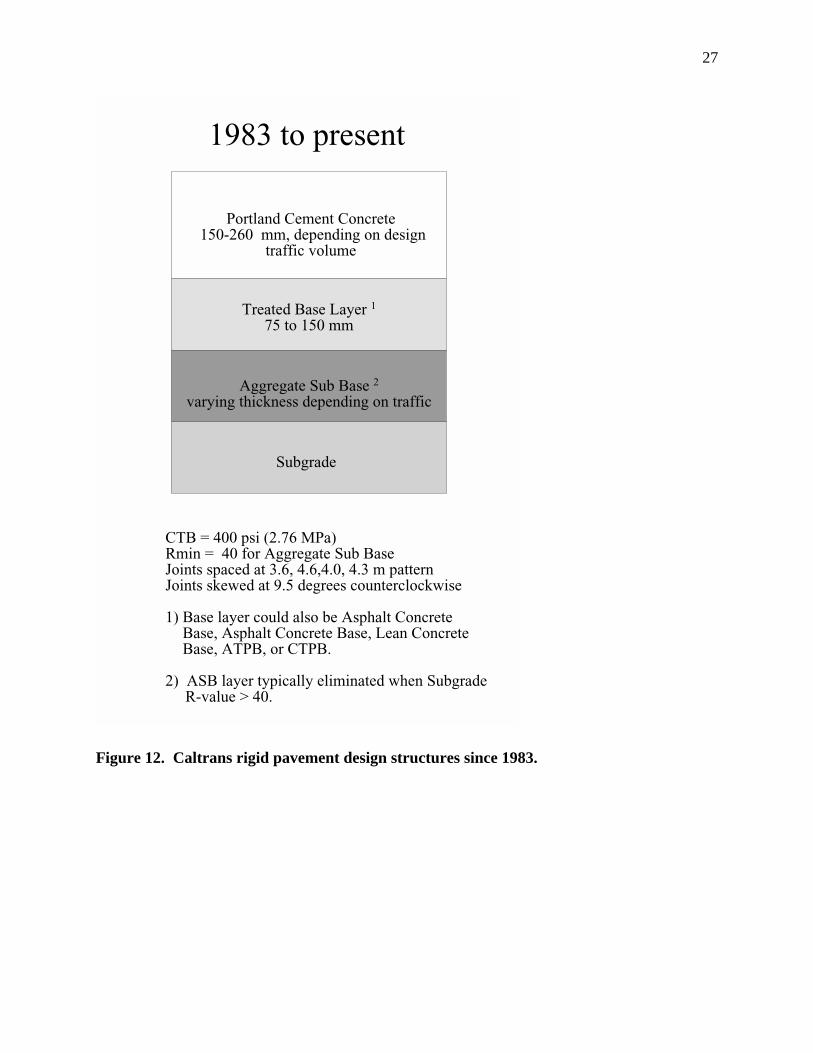
27
1983 to present
Portland Cement Concrete 150-260 mm, depending on design
traffic volume
Treated Base Layer 1
75 to 150 mm
Aggregate Sub Base 2
varying thickness depending on traffic
Subgrade
CTB = 400 psi (2.76 MPa)Rmin = 40 for Aggregate Sub BaseJoints spaced at 3.6, 4.6,4.0, 4.3 m patternJoints skewed at 9.5 degrees counterclockwise
1) Base layer could also be Asphalt ConcreteBase, Asphalt Concrete Base, Lean ConcreteBase, ATPB, or CTPB.
2) ASB layer typically eliminated when Subgrade R-value > 40.
Figure 12. Caltrans rigid pavement design structures since 1983.

28
ASB underlying layer systems also require the use of an edge drain collector and outlet system.
The ASB layer is typically eliminated when the subgrade R-value is greater than 40.
Many rigid pavements were retrofitted with edge drain systems in the late 1980s and
early 1990s. The retrofitting did not include installation of a treated permeable base under the
concrete slab. The program of edge drain retrofits has not been continued because of observed
problems with clogging of the drainage systems with fine soils, and problems maintaining the
edge drain systems due to technical and maintenance staffing reasons. These observed problems
have at times resulted in “bathtub” conditions in which water remains trapped under the concrete
slabs. Problems of stripping of the Asphalt Treated Permeable Base (ATPB) layer as it is
currently designed have also been observed. (10, 11)
2.3 Previous Reviews of Caltrans Designs
The performance of Caltrans rigid pavement design has been comprehensively reviewed
several times over the past fifty years, and changes to the standard designs have often been based
on the recommendations of those reviews. Two primary sources were reviewed to evaluate the
evolution of Caltrans rigid pavement designs and the performance observations upon which
changes to the standard designs were based:
• A 1979 report by McLeod and Monismith (12) that primarily provided a detailed
review of the effects on performance of the 1964 changes to the standard designs, and
• A 1991 report by Wells and Nokes (10) that evaluated the evolution of Caltrans
standard designs since 1949, and also compared Caltrans design practice to that of
other states in the early 1990s.

29
2.3.1 McLeod and Monismith
The report by McLeod and Monismith evaluated the effects of the 1967 changes to the
standard designs on rigid pavement performance about 15 years after those changes were first
implemented. The 1967 changes primarily consisted of slab lengths following a pattern of 3.7,
4.0, 5.5, 5.8 m instead of a uniform joint spacing of 4.6 m, skewed joints, a thicker, plant-mixed
CTB layer with greater compressive strength, and increased R-values requirements for the ASB.
The authors found that the change to plant-mixed, higher compressive strength CTB
improved the performance of rigid pavements with respect to faulting. Their data indicated an
increase in the number of equivalent single axle loads (ESALs) to a given severity of faulting, as
shown in Table 2.
Table 2 Effects of CTB Specifications on Faulting Performance (from FHWA Report[9]).
Millions of ESALsFaulting Severity CTB before 1967 CTB after 1967Moderate Faulting Begins 1.0 1.0Severe Faulting Begins 1.5 2.0Severe Faulting is Typical 2.5 4.0
It is interesting to note that although the CTB specification change improved faulting
performance, severe faulting typically still occurred after only 4.0 million ESALs. Many of the
pavements that are candidates for LLPRS based on their distress condition and traffic levels are
subjected to more than 4.0 million ESALs within two years, and will be expected to carry 100
million to potentially more than 200 million ESALs over their intended 30-year design life.
McLeod and Monismith found that on highway US 101, the change to plant mix cement
treated base in the mid-1960s resulted in better cracking performance. It was found that the
extent of transverse fatigue cracking versus longitudinal cracking changed as well. Cracked
30
pavement with road mix bases from before 1967 had 97 percent transverse fatigue cracking and
3 percent longitudinal cracking. Cracked pavement with plant mix bases from after 1967 had 40
percent transverse fatigue cracking and 60 percent longitudinal cracking. Finite element
analyses indicated that the greater strength of the plant mix material after 1967 provided greater
support to the concrete and reduced critical tensile stresses caused by loads, compared to the road
mix material used prior to 1967. The road mix material was estimated to have an elastic
modulus between 980 and 4,100 MPa, compared to 5,450 to 7,965 MPa for the plant mix
material, based on compressive and diametral strength laboratory tests.
For their transverse fatigue cracking analysis, McLeod and Monismith calculated load
stresses and thermal stresses independently and then calculated fatigue lives for the combined
stress state using modified Goodman diagrams. They found that the fatigue equation proposed
by Vesic (13) matched the observed performance of the rigid pavements analyzed, with the
analysis including a detailed evaluation of the axle load spectra, thermal stresses, and material
variabilities. The Vesic fatigue relation derived from the AASHO Road Test is the following:
Nf = 225,000 (MR/σ)4
where Nf is the number of repetitions to transverse fatigue cracking,
MR is the flexural strength of the concrete (in this case estimated from diametral and
compressive strengths), and
σ is the maximum tensile bending stress calculated for the axle load applied.
The longitudinal cracking occurred primarily in the inner wheelpath of the outer lane.
Explanation of some other factors that may have contributed to the difference in cracking mode,
such as concrete strength and joint sealing practices, were not provided.

31
McLeod’s and Monismith’s recommendations were primarily directed towards the
development of maintenance strategies for rigid pavements. Several are of interest to evaluation
of rigid pavement design:
• Faulting is the prime cause for ride deterioration in rigid pavements, and faulting was
found to be a function of truck loading.
• Severe faulting could be expected after about 2.5 million ESALs on pavements with
road mix bases, and after about 4.0 million ESALs on pavements with plant mix
bases.
• The fatigue equation proposed by Vesic predicted fatigue life well for the pavements
analyzed.
• The time between a cracking extent of 15 to 20 percent of slabs cracked and the
presence of widespread third stage cracking (breakup of the slabs with many
intersecting cracks) was typically three to four years.
• Pavement researchers had difficulty in evaluating pavement performance because of
unreported maintenance activities.
2.3.2 Wells and Nokes
The report by Wells and Nokes was intended to review the field performance results of
prior rigid pavement design research, primarily to support interim design recommendations. It
was also intended to cite areas for future rigid pavement research with regard to both new
construction and rehabilitation.
The report first reviewed research that lead to earlier decisions regarding rigid pavement
design features. In particular, they cited a 1949 report by Hveem (14) describing the results of
32
test slabs with 6.0-, 9.0-, 12.0-, and 18.0-m lengths and 25-mm diameter dowels. Hveem
concluded that long slab lengths led to transverse fatigue cracking. He also concluded that
dowels helped reduce faulting, however, dowel performance was poor because most dowels
became corroded, bent, broken, or frozen in the joint. Dowel hole widening from 25 to 32 mm
was common due to repeated degradation. Primarily based on that experience, Caltrans has not
used dowels as a standard design feature.
The use of skewed joints as a design feature was intended to deal with faulting based on
reports by the Portland Cement Association (PCA) in 1955 (15), and Caltrans in 1961 (16).
These reports were based on test section results in California, and indicated that skewed joints
significantly reduced faulting compared to perpendicular joints.
The use of non-uniform joint spacings was primarily based on a 1961 report by General
Motors (17), which indicated that bump attenuation was greatest for a 3.7-, 4.0-, 5.5-, 5.8-m
spacing.
The recommendations of Wells and Nokes were based on results from some California
test sections and review of practices by other states, although results from California sections in
different locations were at times conflicting. In summary, Wells and Nokes recommended:
• Continued use of skewed joints
• Continued use of the 3.6-, 4.6-, 4.0- and 4.3-m joint spacing
• Tie bars across longitudinal joints
• Sealing of joints and development of joints with sealant reservoirs
• Continued use of treated permeable based on primed aggregate base
• Use of tied and sealed concrete shoulders
• Investigation of the use of continuously reinforced concrete pavement (CRCP).
33
2.4 Caltrans Rigid Pavements Current Conditions
In 1995, about 22,500 lane-kilometers of the Caltrans highway network—nearly thirty
percent—required corrective maintenance or rehabilitation. Nearly 7,000 lane kilometers
required immediate attention to avoid further damage or loss of the facility. Rigid pavements
(Portland cement concrete pavements [PCCP]) make up 48 percent of the rehabilitation project
needs. Rigid pavements had 41 percent of the lane-kilometers requiring immediate attention. It
has also been estimated that approximately 80 percent of the rigid pavements needing
rehabilitation are in urban areas in Southern California. The remaining pavements are in urban
areas in the San Francisco Bay Area and rural areas.
The most common rehabilitation strategy used for failed PCCP is an asphalt concrete
overlay preceded by cracking and seating of the existing PCC slabs. Faulted pavements are
typically smoothed with a diamond grinding process.
In 1993-94, Caltrans contracted out about $73,500,000 on AC overlays of rigid
pavements, $37,900,000 on other rehabilitation methods including grinding, and $2,900,000 on
slab replacement. Maintenance and rehabilitation work performed by Caltrans forces are not
included in these costs. (3)
2.5 LLPRS Strategies Proposed by Caltrans
The initial strategy developed by the Caltrans LLPRS Task Force includes the following
key features:
• Removal of existing concrete slabs in the truck lanes, which are typically 200 to 225
mm thick, by means of sawing and lifting

34
• Retention of the existing 100 to 150 mm of CTB, unless analyses or testing show that
it will not provide sufficient support, or that there are other problems associated with
its retention
• Replacement of the removed slabs with slabs of same thickness, using Fast Setting
Hydraulic Cement Concrete (FSHCC) with strength gain specified to provide 400 psi
beam strength within 4 to 8 hours after placement
• Use of perpendicular joints, and same joint spacings as adjacent lanes
• Consideration of dowels, tied shoulders, and/or widened truck lanes
The underlying assumptions of this strategy were:
• the use of FSHCC will provide performance at least equal to that of PCC
• the use of FSHCC will permit Caltrans to replace approximately 6 to 8 lane-
kilometers in a weekend
• the use of dowels, tied shoulders, and/or widened truck lanes would extend the life of
the reconstructed pavements from the current 20-year design life assumption to at
least 30 years.
The proposed structure is illustrated in Figure 13.
2.6 Summary of Recommendations from TRB Workshop on Pavement Renewal forUrban Freeways
In February, 1998, Caltrans and the Transportation Research Board (TRB) convened a
workshop to evaluate pavement renewal design concepts for the Interstate 710 corridor in Los
Angeles and Long Beach. Four teams from across the country were formed with experts in
construction, traffic, and pavements.

35
Figure 13. Proposed LLPRS structure.

36
Two teams developed rigid pavement strategies and two teams developed flexible
pavement strategies. The teams were provided with preliminary information and visited the
corridor. They were then asked for recommendations regarding the pavement structure, traffic
control, and other improvements to the corridor infrastructure.
The common objectives of the teams were to provide a safe and efficient facility while
minimizing the community impact, maintenance costs, and construction time.
The recommendations of the four teams are briefly summarized here, with emphasis on
the rigid pavement solutions and the pavement structures proposed, as opposed to the flexible
pavement solutions and the construction and traffic control details. This summary is based on
the draft summary of the team presentations. (18)
2.6.1 710 Design Constraints
The same constraints were provided to all teams. Each team was asked to develop a
pavement structural solution and a traffic control plan. For the traffic control plan, only one lane
in each direction could be closed, and no additional lanes could be added. A total of 32 bridges
cross the 42 kilometer length of the project, and solutions had to account for required clearance
between the pavement and bridge structures.
Caltrans District 7 provided cost estimates for the strategies proposed by each team.
Implementation of the Caltrans LLPRS proposed strategy, summarized previously herein, was
estimated to cost about $80 million. This cost may not have included the additional cost of
placing dowels in the new slabs, or adding tied shoulders or widened truck lanes.
Each team noted that their recommendations had to be made without a quantitative
assessment of the subgrade support conditions, and that their recommendations could be
drastically changed depending on the measured subgrade support.
37
No lifecycle cost estimates were made, and all cost estimates made by District 7 only
included construction costs. The teams did not select their structures based on lifecycle cost
estimates for a 30-year design life. Instead, the proposed structural designs reflected opinions
and experience regarding what would provide a relatively long pavement service life.
2.6.2 TRB Team Recommendations
The existing pavement structures were not subjected to a thorough review of as-built
drawings, and were not subjected to coring and testing to determine layer thicknesses, slab
lengths, or materials properties. Most of the I-710 project to be reconstructed was originally
built in the late 1950s and completed in the mid-1960s, and probably has an existing structure
similar to the one shown in Figure 10, with a slab thickness of about 225 mm.
The Green and Yellow Teams were assigned to develop rigid pavement strategies. Both
of these teams indicated that they would expect 40 years of service life from their proposals.
The Green team recommended removal of the entire existing pavement structure down to
the subgrade. Any existing PCC and AC material would be recycled into a Lean Concrete Base
(LCB) layer, 350 mm thick. Traffic would be expected to travel on the LCB for short periods of
time during construction. A 300-mm thick PCC slab would be placed on the LCB. The PCC
would have a low water/cement ratio and include pozzolanic materials for high strength. The
PCC slabs would be doweled at the joints. The Green team’s proposed structure is shown in
Figure 14. This proposal would require rebuilding all bridges in the project to maintain required
height clearances.
The Yellow team recommended selection of one of two strategies, the final selection
depending on a more extensive investigation of the existing pavement structure and subsurface
conditions. The first option, shown in Figure 15, involves recycling of the existing PCC and
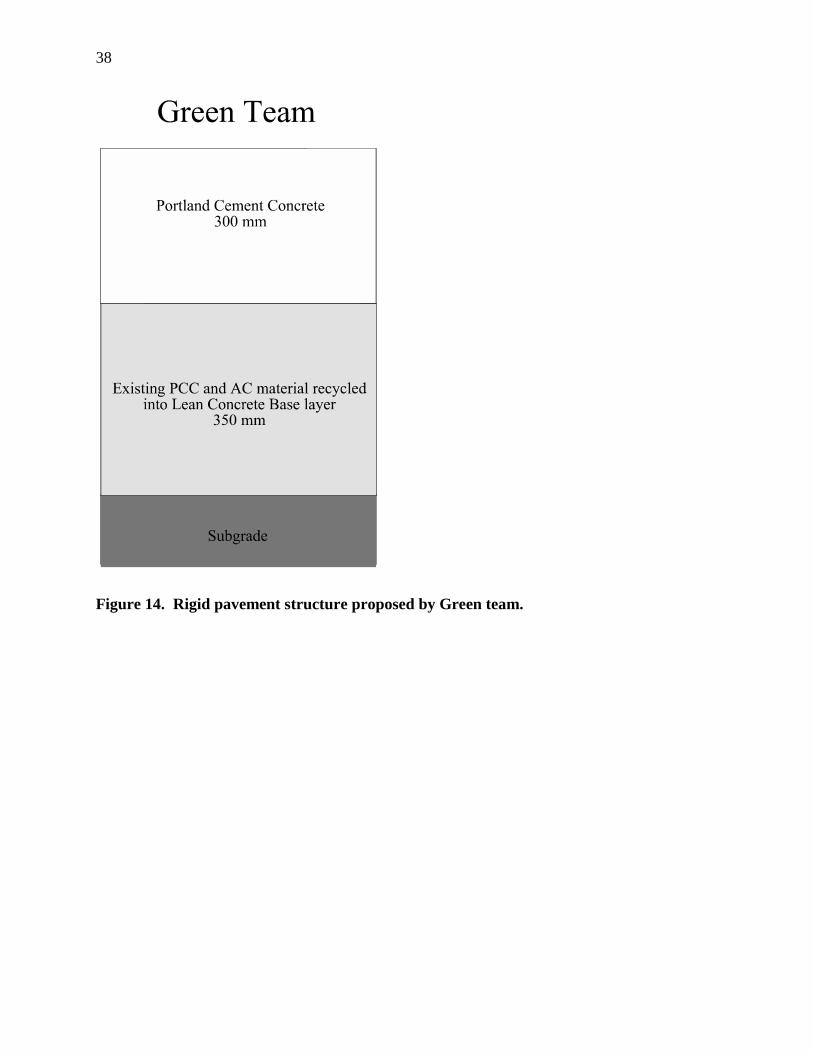
38
Figure 14. Rigid pavement structure proposed by Green team.
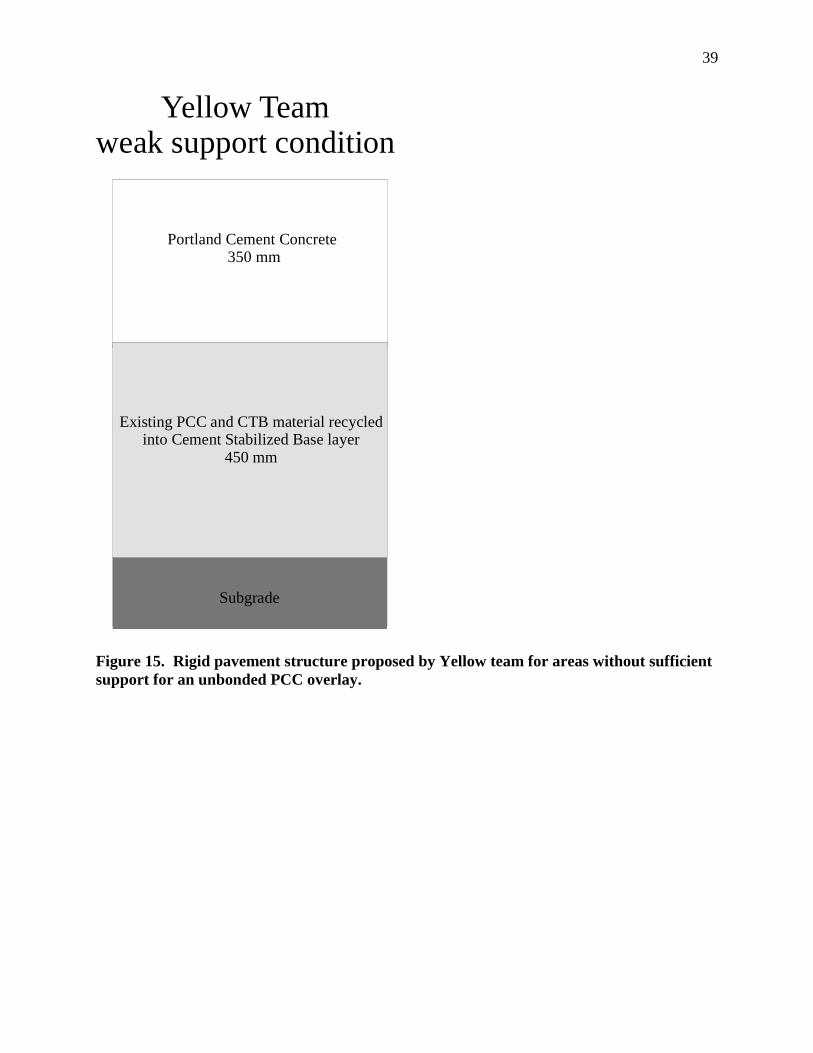
39
Yellow Teamweak support condition
Portland Cement Concrete 350 mm
Existing PCC and CTB material recycledinto Cement Stabilized Base layer
450 mm
Subgrade
Figure 15. Rigid pavement structure proposed by Yellow team for areas without sufficientsupport for an unbonded PCC overlay.

40
CTB layers into a new 450-mm thick cement stabilized base layer under the heavy truck lanes.
A new PCC slab, 350 mm thick would be placed on the base in the truck lanes.
The second option was recommended for areas where the existing subgrade provides
sufficient support. This strategy, shown in Figure 16, consists of placement of a 300-mm thick
unbonded PCC overlay on the existing structure. The bond breaking layer would consist of 50
mm of AC. Dowels were not mentioned by the Yellow team. Excavation would be required
under some bridges with this strategy.
The Blue and Brown teams were assigned to develop flexible pavement solutions. Both
of these teams indicated that their strategies would provide about 40 years of design life, but
would require a surface treatment after about 25 years.
The Blue team recommended that the existing PCC slabs be repaired and replaced where
required, and would provide a base for a stone matrix asphalt (SMA) overlay. The SMA overlay
would consist of 150 mm with a maximum aggregate size of 19 mm, followed by 50 mm of
SMA with a maximum aggregate size of 9.5 mm. An open graded friction course could be
placed on the surface for safety, if necessary. The Blue team’s proposed structure is shown in
Figure 17.
The Brown team recommended that existing PCC and CTB be rubblized, and then rolled
to stabilize it so that it can serve as a base layer. A 200-mm thick polymer modified AC layer
would then be placed on the base. The rubblization is intended to delay or eliminate reflection
cracking. The Brown team’s proposed structure is shown in Figure 18.
All of the teams utilized some type of recycling, and recommended complete
reconstruction of the facility rather than just the truck lanes. They also recommended that the
project be reconstructed at one time, as opposed to stage construction over the 40-year design
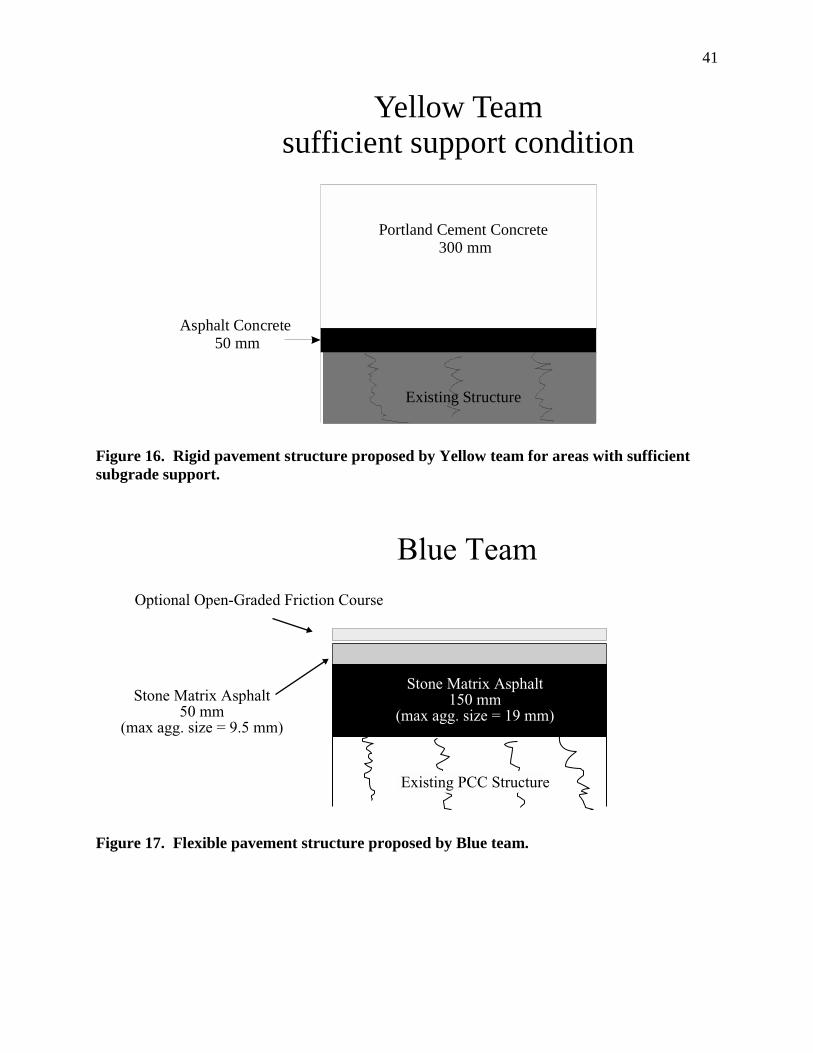
41
Yellow Teamsufficient support condition
Portland Cement Concrete 300 mm
Existing Structure
Asphalt Concrete 50 mm
Figure 16. Rigid pavement structure proposed by Yellow team for areas with sufficientsubgrade support.
Blue Team
Stone Matrix Asphalt150 mm
(max agg. size = 19 mm)
Stone Matrix Asphalt50 mm
(max agg. size = 9.5 mm)
Optional Open-Graded Friction Course
Existing PCC Structure
Figure 17. Flexible pavement structure proposed by Blue team.
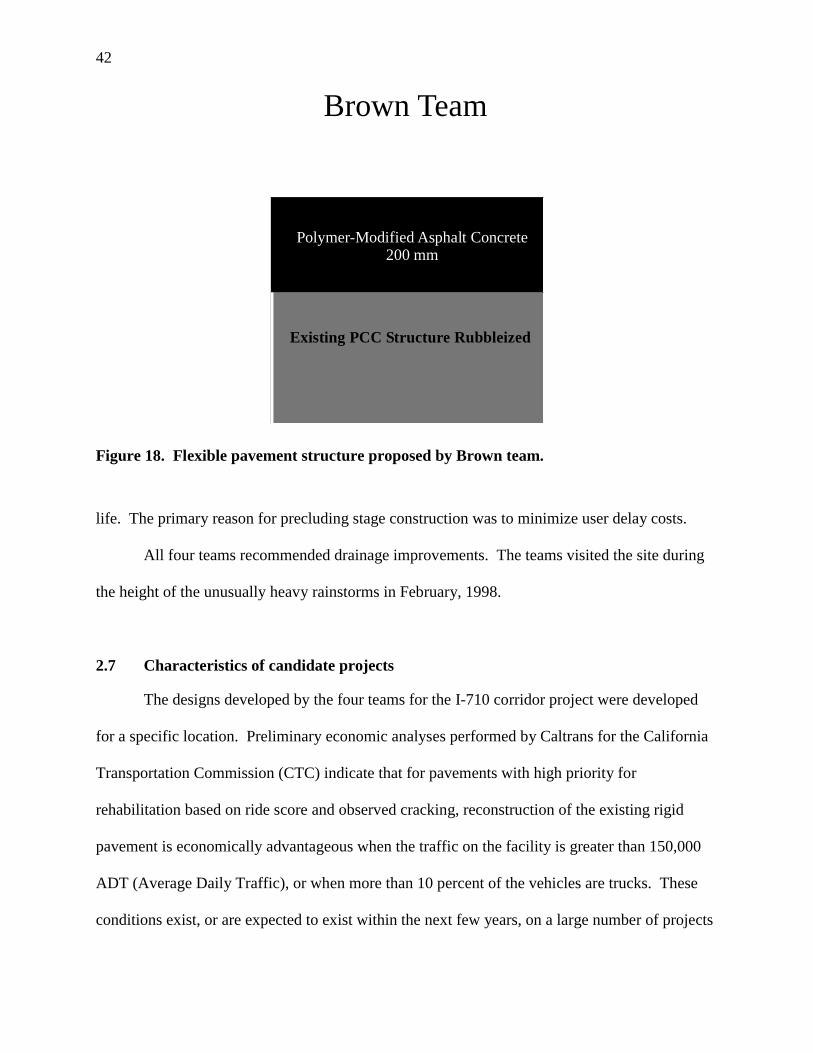
42
Brown Team
Existing PCC Structure Rubbleized
Polymer-Modified Asphalt Concrete200 mm
Figure 18. Flexible pavement structure proposed by Brown team.
life. The primary reason for precluding stage construction was to minimize user delay costs.
All four teams recommended drainage improvements. The teams visited the site during
the height of the unusually heavy rainstorms in February, 1998.
2.7 Characteristics of candidate projects
The designs developed by the four teams for the I-710 corridor project were developed
for a specific location. Preliminary economic analyses performed by Caltrans for the California
Transportation Commission (CTC) indicate that for pavements with high priority for
rehabilitation based on ride score and observed cracking, reconstruction of the existing rigid
pavement is economically advantageous when the traffic on the facility is greater than 150,000
ADT (Average Daily Traffic), or when more than 10 percent of the vehicles are trucks. These
conditions exist, or are expected to exist within the next few years, on a large number of projects

43
within the California. Projects identified as candidates for LLPRS implementation by the
Pavement Management Information Branch of the Caltrans Maintenance Program based on 1995
data (19), are shown in Figures 19-22
In addition to traffic volumes, other variables critical to the design of rigid pavements
differ across the potential candidate projects. These variables include the pavement structure,
climate, expected truck loading, and the presence of alternate routes. These variables were
quantified for the projects identified as candidates for LLPRS, as shown in Table 3.
It can be seen in Figures 19-21 that the LLPRS candidate projects are located in Districts
3, 4, 7, 8, 11, and 12—the “urban” districts. There are 199 candidate projects, totaling 2,290
lane-kilometers.
The location of the projects is important because it determines the climate in which the
pavement will have to perform, as well as the presence of alternate routes for traffic during
construction. California can be divided, somewhat arbitrarily, into six climate regions with
respect to the effect of climate on rigid pavement performance: North Coast, San Francisco Bay
Area, Central Valley, Mountain, Desert, South Coast, as shown in Figure 22. The primary
environmental variables affecting rigid pavement performance are temperatures and rainfall.
Average values for important temperature and rainfall variables are summarized for each of the
six regions in Table 4.
Greater rainfall and larger diurnal temperature changes are typically detrimental to rigid
pavement performance. Greater rainfall results in greater chance of loss of support, which
causes pumping, faulting, corner cracking, and potentially contributes to longitudinal cracking.
Larger diurnal temperature changes result in more slab curling, which contributes to cracking.
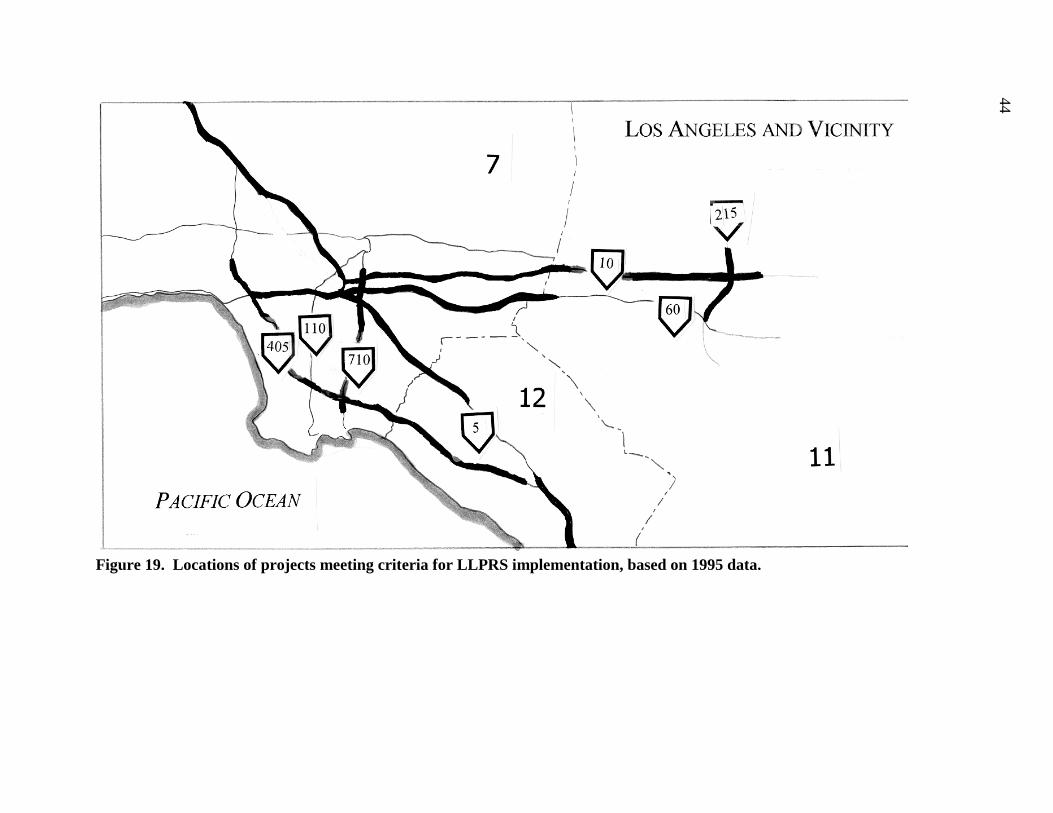
Figure 19. Locations of projects meeting criteria for LLPRS implementation, based on 1995
data.44

45
Figure 20. Locations of projects meeting criteria for LLPRS implementation, based on1995 data.
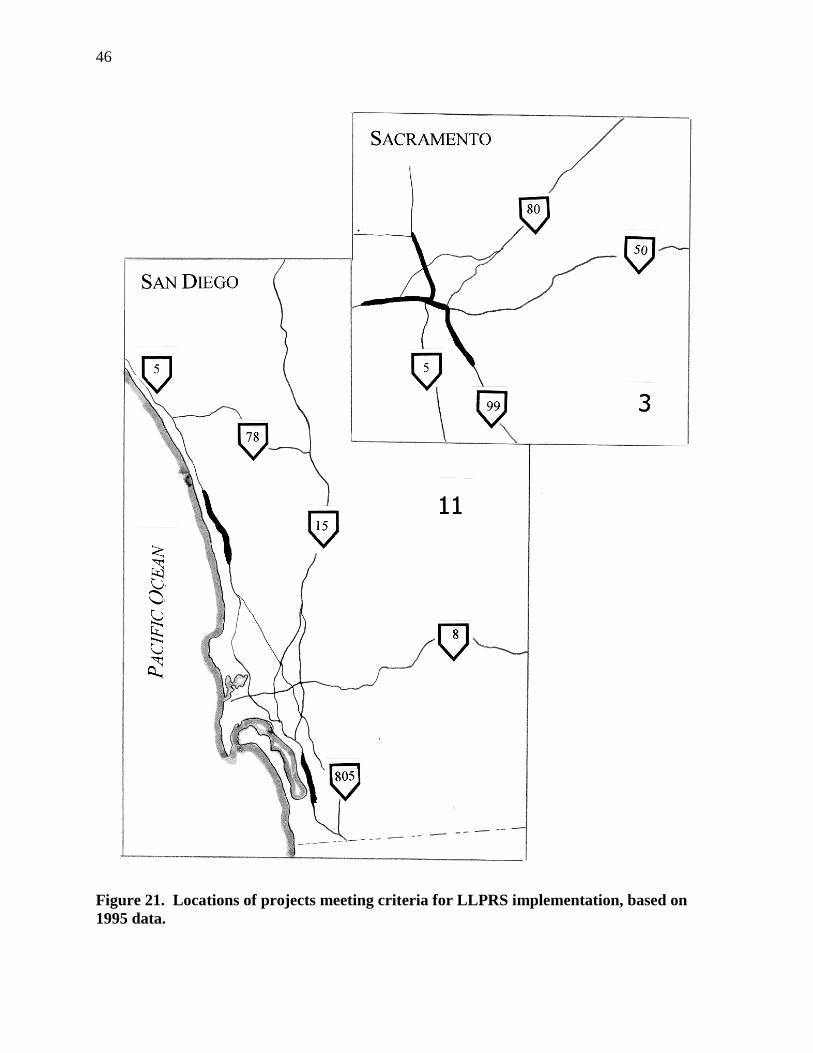
46
Figure 21. Locations of projects meeting criteria for LLPRS implementation, based on1995 data.

47
Figure 22. Five climate regions affecting pavement performance in California.
48
From Table 3, it can be seen that the LLPRS candidate projects were mostly constructed
in the 1950s and 1960s, although some portions were constructed as recently as the 1980s in
locations where new interchanges or realignments were constructed. This indicates that the
LLPRS candidate projects include a variety of CTB strengths, slab lengths, and slab thickness.
The LLPRS candidate projects are also spread across four of the six climate regions
identified in Table 4. These include the temperate San Francisco Bay Area and South Coast
regions, and the more extreme Desert and Valley regions. The wide range of slab lengths and
thicknesses required to match existing adjacent lanes, and the range of climate regions indicates
that each candidate project must be individually designed. A uniform design across all projects
will most likely result in a wide range of performance. In addition, there are differences in axle
loads, truck traffic volumes, subgrade stiffnesses, and available construction windows due to the
presence of alternate routes. Each of these factors will play a role in the selection of structural
design and selection of concrete materials with sufficient strength gain for the construction time
window.
Only limited axle load distributions were obtained in time for this report. The load
distributions obtained are for Interstate 5 in San Joaquin county and Interstate 15 in San Diego
county. Better evaluations of the design traffic for each project can be made when weigh-in-
motion (WIM) data (where they exist) can be obtained from Caltrans for locations on each of the
candidate projects. Axle load and configuration data is essential for the design of rigid
pavements.
The presence of alternate routes to which traffic can be diverted during reconstruction
will play a role in determining the time available for reconstruction during each construction
window. If adequate alternate routes are available, the use of materials with normal strength

Table
Route809980
580880380805
1060
40571060
21510
2155555
405
3 Summary of Preliminary Design Variables for LLPRS Candidate Projects.
Postmile Average Daily TrafficDaily Trucks in Design Lane (2
Truck Lanes each Direction)District County First Last Max Min Max Min
ClimateRegion
ProbableConstruction
AlternateRoutes
3 Sacramento 10 17 195,000 130,000 3,213 1,584 Valley 1960s -3 Sacramento 19 24.2 155,000 130,000 3,990 3,160 Valley 1960s-1970s 54 Alameda 3.9 6.6 233,000 227,000 4,033 3,873 Bay Area 1950s -4 Alameda 11 45.7 164,000 131,000 4,189 2,875 Bay Area 1960s -4 Alameda 6.7 11.4 156,000 138,000 2,742 2,406 Bay Area 1960s-1970s 6804 San Mateo 6.3 6.3 133,000 133,000 3,830 3,830 Bay Area 1970s 924 Solano 9.7 25 125,000 125,000 3,232 3,232 Bay Area 1960s -7 Los Angeles 0.4 47.8 237,000 133,000 7,303 3,754 South Coast 1950s-1960s 91/105,22/6057 Los Angeles 6.1 47.6 309,000 186,000 5,400 2,007 South Coast 1960s 60,210/1347 Los Angeles 1 29.4 287,000 170,000 9,975 2,705 South Coast 1960s 10,917 Los Angeles 0.3 44.7 308,000 156,000 3,565 1,494 South Coast mid-1960s -7 Los Angeles 6.8 25.6 198,000 126,000 9,560 2,665 South Coast late 1950s, 1980s 110,6058 Riverside 0 1 147,000 147,000 4,161 4,161 Desert 1960s 10,918 Riverside 38.6 43.3 150,000 143,000 5,341 2,665 Desert 1960s 158 San Bernardino 0 30.4 238,000 130,000 5,595 3,510 Desert 1960s 608 San Bernardino 6.9 8 130,000 130,000 2,010 2,010 Desert 1960s 15
11 San Diego 11.7 14.4 166,000 166,000 1,568 1,568 South Coast 1960s 52/15/7811 San Diego 32.9 43.6 199,000 154,000 4,050 4,050 South Coast 1960s 52/15/7812 Orange 7.8 18.7 242,000 148,000 3,984 2,736 South Coast 1960s 405,55/9112 Orange 36.8 42.6 176,000 166,000 4,344 2,976 South Coast 1960s 405,55/9112 Orange 2.5 23.7 327,000 235,000 4,742 4,111 South Coast late 1960s 22/5
49
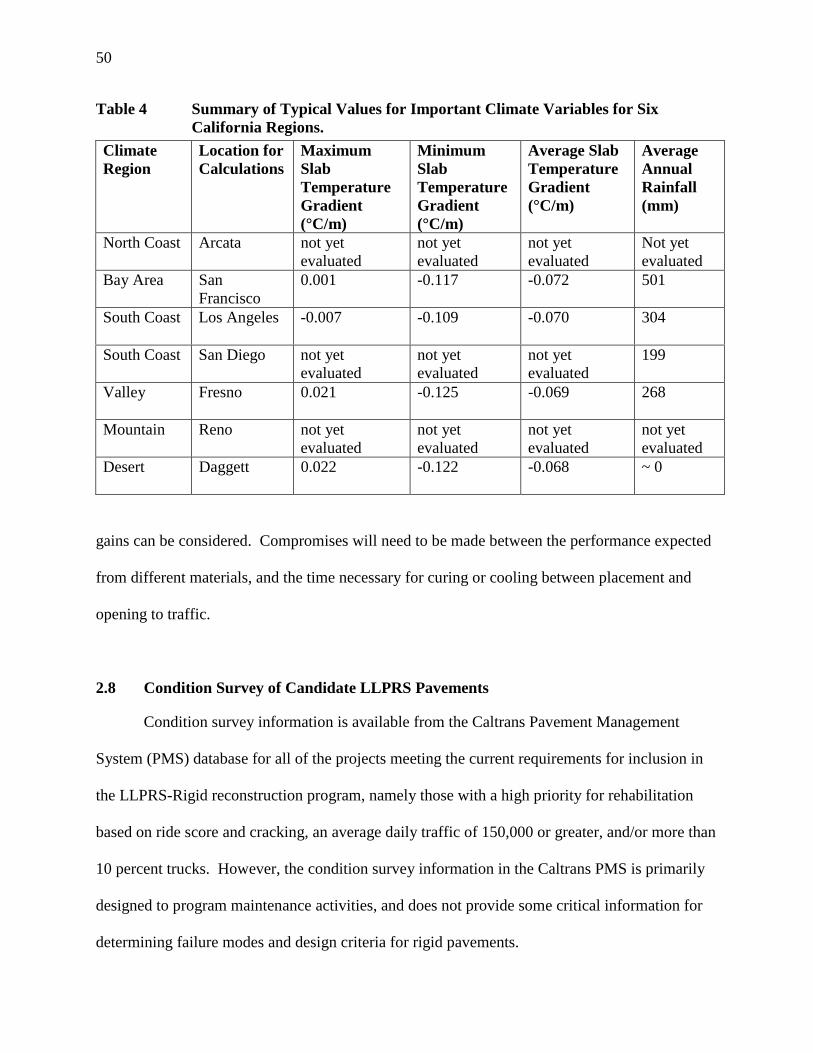
50
Table 4 Summary of Typical Values for Important Climate Variables for SixCalifornia Regions.
ClimateRegion
Location forCalculations
MaximumSlabTemperatureGradient(°C/m)
MinimumSlabTemperatureGradient(°C/m)
Average SlabTemperatureGradient(°C/m)
AverageAnnualRainfall(mm)
North Coast Arcata not yetevaluated
not yetevaluated
not yetevaluated
Not yetevaluated
Bay Area SanFrancisco
0.001 -0.117 -0.072 501
South Coast Los Angeles -0.007 -0.109 -0.070 304
South Coast San Diego not yetevaluated
not yetevaluated
not yetevaluated
199
Valley Fresno 0.021 -0.125 -0.069 268
Mountain Reno not yetevaluated
not yetevaluated
not yetevaluated
not yetevaluated
Desert Daggett 0.022 -0.122 -0.068 ~ 0
gains can be considered. Compromises will need to be made between the performance expected
from different materials, and the time necessary for curing or cooling between placement and
opening to traffic.
2.8 Condition Survey of Candidate LLPRS Pavements
Condition survey information is available from the Caltrans Pavement Management
System (PMS) database for all of the projects meeting the current requirements for inclusion in
the LLPRS-Rigid reconstruction program, namely those with a high priority for rehabilitation
based on ride score and cracking, an average daily traffic of 150,000 or greater, and/or more than
10 percent trucks. However, the condition survey information in the Caltrans PMS is primarily
designed to program maintenance activities, and does not provide some critical information for
determining failure modes and design criteria for rigid pavements.
51
The Caltrans PMS includes information regarding cracking classified into first, second,
and third stage cracking. The classifications indicate stage at which cracks are interconnected
and the slab has broken up. This provides information for maintenance and rehabilitation
programming based on whether the slabs are “repairable” or must be replaced. For design
purposes and development of mechanistic models for cracking prediction, the information
regarding the type of cracking is needed. The type of cracking, transverse (fatigue) cracking,
corner cracking or longitudinal cracking, can then be related to the distress mechanism for each
type, as described previously in Section 2.1. Other important information needed to evaluate the
design for cracking for a given project is the following:
• transverse joint spacings,
• presence of tied concrete shoulders,
• skewed or perpendicular transverse joints.
• strength of base and subgrade
• pavement thickness and stiffness
The presence of faulting is monitored in the Caltrans PMS by the ride score and
observations in the condition survey as to whether or not faulting is present. This information
provides a good indication of the development of faulting. The inclusion of fault height
measurements in locations where faulting is present will aid the development of better
mechanistic models for faulting prediction.
In May, 1998, a three day survey was made of most of the candidate projects for
implementation of LLPRS in Southern California. The survey was undertaken to augment the
information included in the Caltrans PMS, and to provide an update to the information in the list
52
of candidate projects, which is based on 1995 and 1996 data. (19) The survey was also intended
to provide an indication of the distribution of different joint spacings and types of joints.
The survey included 540 kilometers, counting different directions separately, as shown in
Figure 23. Less rigorously documented observations of pavement distress mechanisms for
LLPRS candidate projects in Northern California are also included in the survey. Miles are the
measurement unit for this survey instead of kilometers because the results are based on the post-
miles shown on paddles and emergency call boxes along each route. The notes from the
condition survey in Southern California are included in Appendix A of this report.
All surveys were performed in the truck lanes at approximately 80 kph. At a few
locations on each route, a walking survey was made in which distresses were more closely
observed, transverse joint spacings were measured, photographs were taken, and the joint type
(skewed or perpendicular) was noted. For the survey, faulting was classified based on the
discomfort level for the driver (one driver for all sections) in a 1993 Plymouth Acclaim.
Slight faulting indicated that the presence of faulting was barely noticeable. Moderate
faulting indicated some discomfort to the driver. Terrible faulting indicated a high level of
discomfort for the driver. Cracking was classified by type: transverse, corner, or longitudinal.
The presence of faulting and cracking was noted at approximately 0.3 kilometer intervals.
The extent of the distresses was not measured or estimated within each interval. If the presence
of a distress remained the same for long intervals, a note was only made when the type of
distress changed.
2.8.1 Interstate 5
In District 7 (Los Angeles County), Interstate 5 was surveyed from postmiles 42.7 to 3.7
in the southbound direction, and postmiles 0 to 4.4 and 34.2 to 37.2 in the northbound direction.

Figur
e 23. LLPRS candidate projects surveyed for distress mechanisms in May, 1998.53

54
The primary distresses in the truck lanes were faulting and transverse fatigue cracking, as shown
in Table 5. Most of the sections surveyed have faulting, and much of the faulting is severe.
Table 5 Condition Survey Summary for Interstate 5 in District 7.Degree of Faulting
Slight Moderate TerribleTotal
Miles Surveyed 15 13 8 41Percentage 37% 31% 19% 87%
Type of CrackingTransverse Corner Longitudinal
Total
Miles Surveyed 16 3 3 41Percentage 39% 8% 8%
Interstate 5 was primarily constructed in the late 1950s and in the 1960s. The oldest
sections, in East Los Angeles, were constructed in 1959, with a pavement structure consisting of
225 mm of PCC placed on 100 mm of road mix CTB, 75 mm of AB, and 200 mm of ASB.
Cores taken in the CTB in 1997 indicated poor cementing in some areas, with the CTB breakable
by hand. Construction proceeded in the 1960s, both north and south. The use of plastic
preformed joint spacers was used towards the south end of District 7 in place of sawing the
joints. In many cases the plastic spacers tilted from a vertical orientation, and became bowed in
the horizontal direction under the force of the concrete in front of the paver. This resulted in
joints that are poorly formed and difficult to maintain. In the 1970s, 1980s and 1990s various
sections were rehabilitated by cracking and seating the concrete slabs and overlaying with
asphalt concrete. No second AC overlays have been placed on those sections. (20)
Observations at postmile 23.7 southbound included 4.6-m transverse joint spacing with
perpendicular joints. Large vertical deflections were observed at slab corners under heavy

55
trucks. Transverse and corner cracking, and moderate faulting were observed in this area, as
shown in Figures 24 and 25.
Perpendicular joints with approximately 4.6-m transverse joint spacing were also
observed at postmile 10.9 southbound in an area with transverse cracking and slight faulting.
In District 12 (Orange County), Interstate 5 was surveyed from postmiles 44.6 to 17.6 in
the southbound direction, and postmiles 0 to 43.4 in the northbound direction. The primary
distresses in the truck lanes were faulting and longitudinal cracking, as shown in Table 6.
Table 6 Condition survey summary for Interstate 5 in District 12.Degree of Faulting
Slight Moderate TerribleTotal
Miles Surveyed 8 11 8 46Percentage 17% 24% 18% 59%
Type of CrackingTransverse Corner Longitudinal
Total
Miles Surveyed 2 2 9 46Percentage 5% 4% 19%
Figure 24. Pavement distresses at postmile 23.7 southbound, Interstate 5, Los AngelesCounty: transverse fatigue cracking and perpendicular joints.
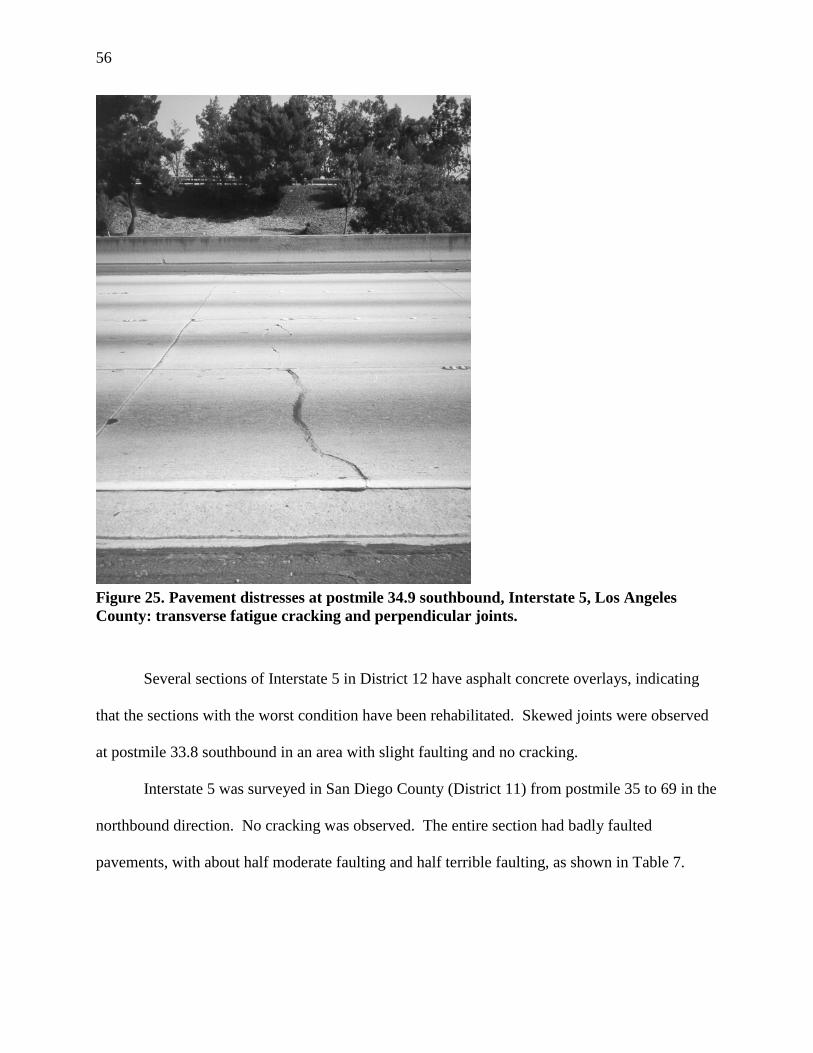
56
Figure 25. Pavement distresses at postmile 34.9 southbound, Interstate 5, Los AngelesCounty: transverse fatigue cracking and perpendicular joints.
Several sections of Interstate 5 in District 12 have asphalt concrete overlays, indicating
that the sections with the worst condition have been rehabilitated. Skewed joints were observed
at postmile 33.8 southbound in an area with slight faulting and no cracking.
Interstate 5 was surveyed in San Diego County (District 11) from postmile 35 to 69 in the
northbound direction. No cracking was observed. The entire section had badly faulted
pavements, with about half moderate faulting and half terrible faulting, as shown in Table 7.

57
Table 7 Condition Survey Summary for Interstate 5 in District 11.Degree of Faulting
Slight Moderate TerribleTotal
Miles Surveyed 0 17 17 34Percentage 0% 49% 51% 100%
Type of CrackingTransverse Corner Longitudinal
Total
Miles Surveyed 0 0 0 34Percentage 0% 0% 0%
2.8.2 Interstate 10
In District 7, Interstate 10 was surveyed between postmiles 4.6 and 48.4 in the eastbound
direction and postmiles 18.3 and 6.7 in the westbound direction. Faulting was present in nearly
all of the pavements surveyed. Transverse, corner, and longitudinal cracking were present in
nearly equal amounts, and were fairly common, as shown in Table 8.
Table 8 Condition Survey Summary for Interstate 10 in District 7.Degree of Faulting
Slight Moderate TerribleTotal
Miles Surveyed 9 29 13 45Percentage 20% 42% 28% 89%
Type of CrackingTransverse Corner Longitudinal
Total
Miles Surveyed 6 7 8 45Percentage 14% 16% 19%
Interstate 10 through Santa Monica was constructed in 1964 and 1965. I-10 was
constructed east of Los Angeles to the border with District 8 in the early 1960s. The concrete
slabs were 225 mm thick. In 1997, inspection of the CTB after sawing and liftoff of the PCC
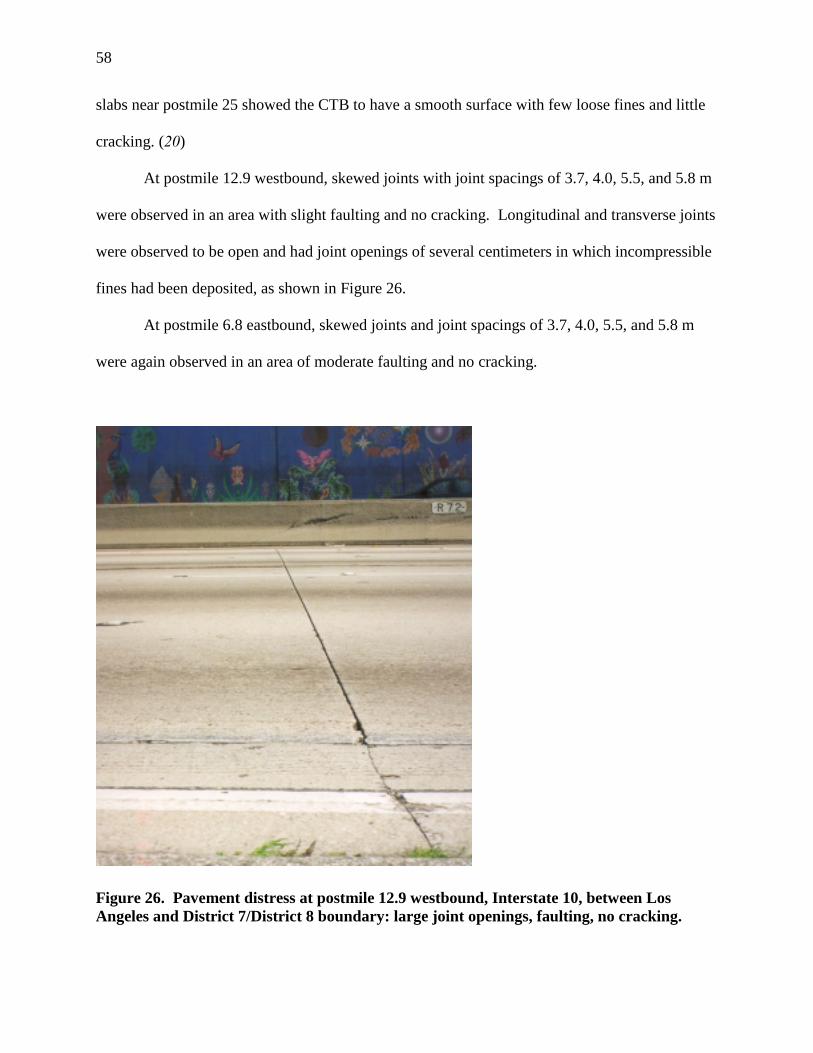
58
slabs near postmile 25 showed the CTB to have a smooth surface with few loose fines and little
cracking. (20)
At postmile 12.9 westbound, skewed joints with joint spacings of 3.7, 4.0, 5.5, and 5.8 m
were observed in an area with slight faulting and no cracking. Longitudinal and transverse joints
were observed to be open and had joint openings of several centimeters in which incompressible
fines had been deposited, as shown in Figure 26.
At postmile 6.8 eastbound, skewed joints and joint spacings of 3.7, 4.0, 5.5, and 5.8 m
were again observed in an area of moderate faulting and no cracking.
Figure 26. Pavement distress at postmile 12.9 westbound, Interstate 10, between LosAngeles and District 7/District 8 boundary: large joint openings, faulting, no cracking.
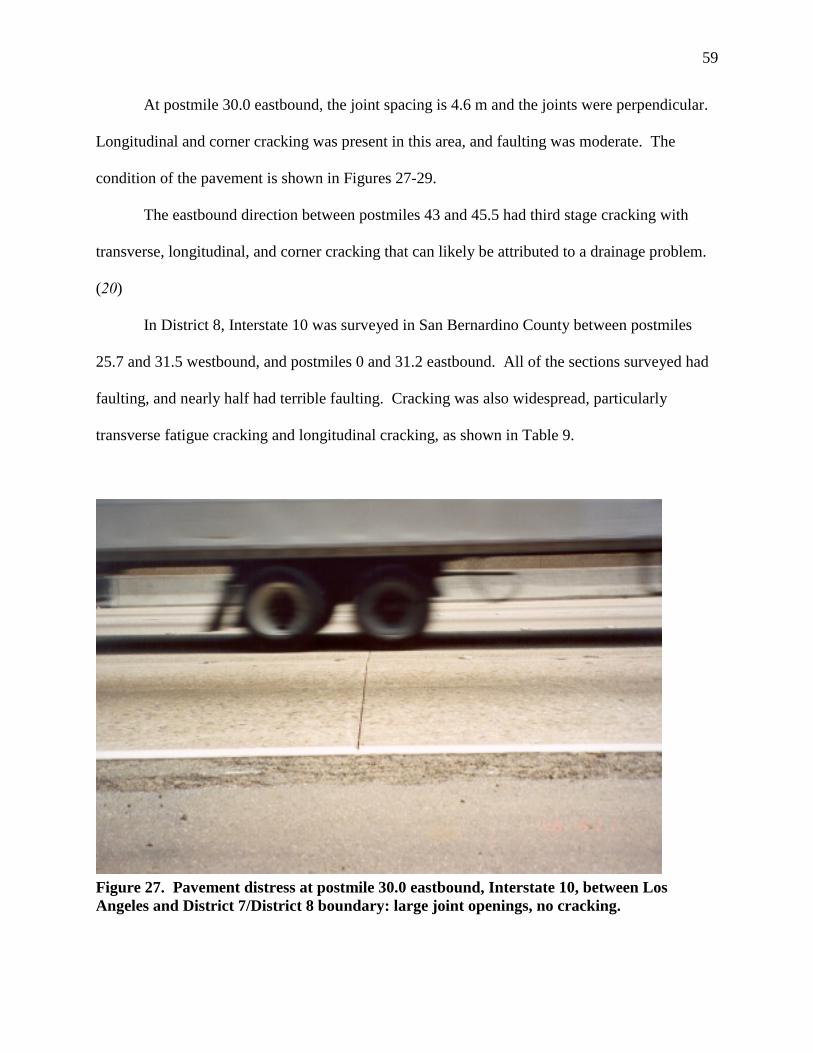
59
At postmile 30.0 eastbound, the joint spacing is 4.6 m and the joints were perpendicular.
Longitudinal and corner cracking was present in this area, and faulting was moderate. The
condition of the pavement is shown in Figures 27-29.
The eastbound direction between postmiles 43 and 45.5 had third stage cracking with
transverse, longitudinal, and corner cracking that can likely be attributed to a drainage problem.
(20)
In District 8, Interstate 10 was surveyed in San Bernardino County between postmiles
25.7 and 31.5 westbound, and postmiles 0 and 31.2 eastbound. All of the sections surveyed had
faulting, and nearly half had terrible faulting. Cracking was also widespread, particularly
transverse fatigue cracking and longitudinal cracking, as shown in Table 9.
Figure 27. Pavement distress at postmile 30.0 eastbound, Interstate 10, between LosAngeles and District 7/District 8 boundary: large joint openings, no cracking.
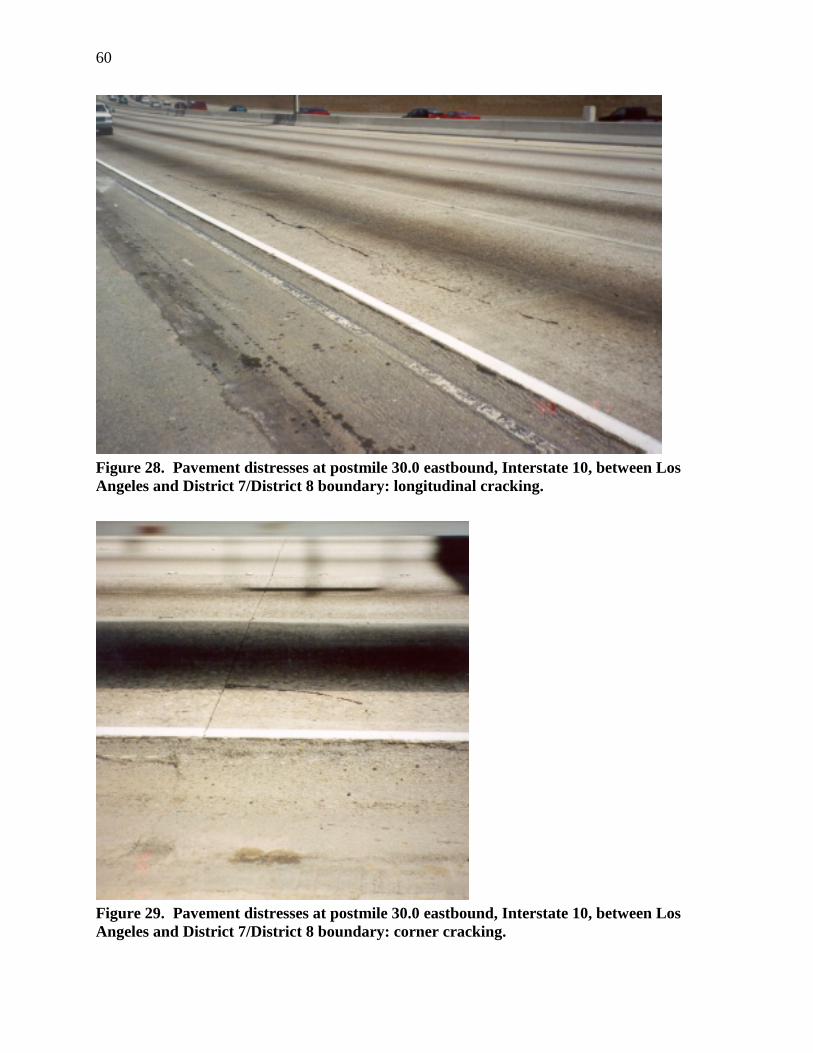
60
Figure 28. Pavement distresses at postmile 30.0 eastbound, Interstate 10, between LosAngeles and District 7/District 8 boundary: longitudinal cracking.
Figure 29. Pavement distresses at postmile 30.0 eastbound, Interstate 10, between LosAngeles and District 7/District 8 boundary: corner cracking.

61
Table 9 Condition Survey Summary for Interstate 10 in District 8.Degree of Faulting
Slight Moderate TerribleTotal
Miles Surveyed 6 15 17 37Percentage 16% 39% 45% 100%
Type of CrackingTransverse Corner Longitudinal
Total
Miles Surveyed 11 4 10 37Percentage 29% 11% 26%
Faulting was particularly severe in the eastbound direction from postmile 0. A Caltrans
engineer has observed that when slabs were removed near postmile 5, the upper 50 mm of the
100 mm thick CTB was not cemented, and consisted of loose, relatively fine grained material.
Cores from these sections indicated that the cemented material looked like sandstone, and
produced fines from the friction of running a hand over the core. (20) This observation of easily
transportable material beneath the slab indicates that this material probably contributed to the
severe faulting, due to the mechanism described in Section 2.1.1 of this report. Some other
nearby sections did not have the loose material under the slab, and were very hard and well
cemented.
At postmile 9.6 in the eastbound direction, joint spacings were approximately 3.7, 4.0,
5.5, 5.8 m, and the joints were skewed. The pavement at this location was exhibiting terrible
faulting and transverse cracking. The transverse cracking only occurred in the slabs that were
between 5.5 and 5.8 m long, and did not occur in the slabs 3.7 to 4.0 m long. This observation
matches the expected distress mechanism for transverse fatigue cracking, described in Section
2.1.4. The condition of the pavement can be seen in Figures 30 and 31.

62
At postmile 17.5 in the eastbound direction, joint spacing was about 4.6 m, and the joints
were perpendicular. At this location, there was moderate faulting and transverse fatigue cracking
in every slab.
2.8.3 Interstate 215
Interstate 215 was surveyed in District 8 in San Bernardino County between postmiles 4
and 8.6 northbound, and postmiles 4.3 and 9.3 southbound. In Riverside County, the sections
between postmiles 38.5 and 42.6 were surveyed northbound, and between postmiles 43.5 and
38.5 southbound. Faulting was present in nearly all of the sections surveyed with 25 percent of
the sections having severe faulting. Transverse fatigue cracking was also widespread. Corner
and longitudinal cracking were also present, as shown in Table 10.
Figure 30. Pavement distress at postmile 9.6 eastbound, Interstate 10, San Bernardinocounty: transverse fatigue cracking in long slab, none in short slab.
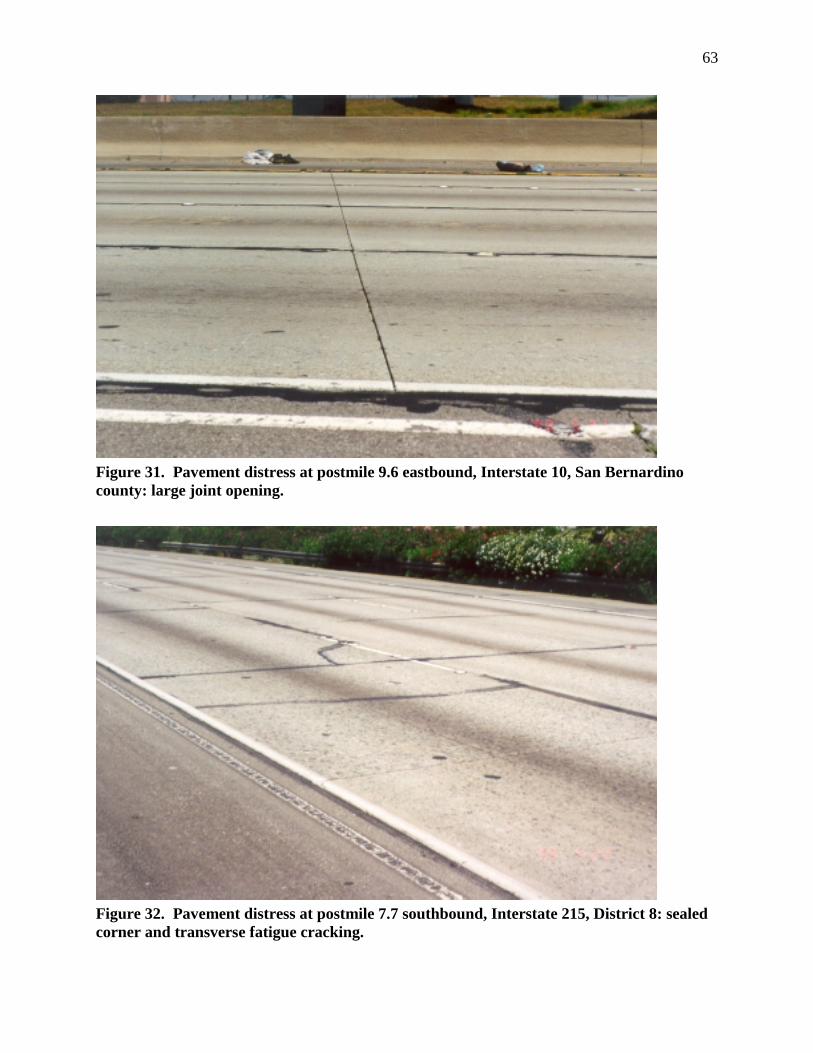
63
Figure 31. Pavement distress at postmile 9.6 eastbound, Interstate 10, San Bernardinocounty: large joint opening.
Figure 32. Pavement distress at postmile 7.7 southbound, Interstate 215, District 8: sealedcorner and transverse fatigue cracking.
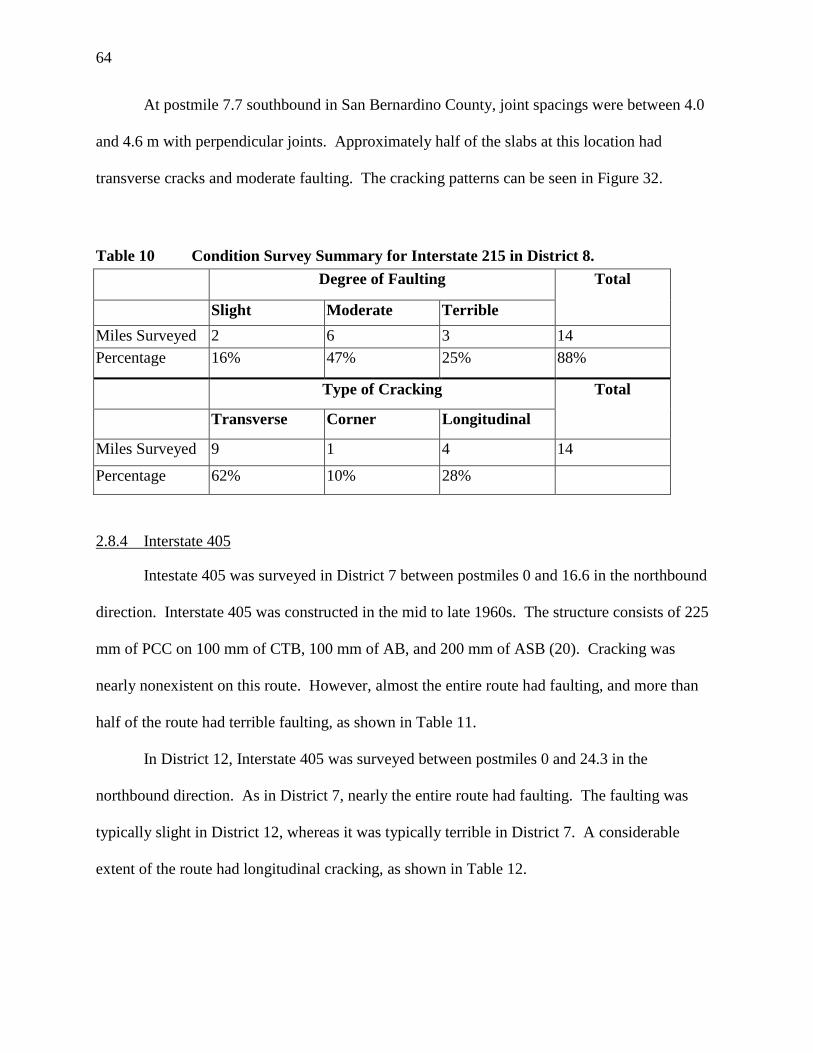
64
At postmile 7.7 southbound in San Bernardino County, joint spacings were between 4.0
and 4.6 m with perpendicular joints. Approximately half of the slabs at this location had
transverse cracks and moderate faulting. The cracking patterns can be seen in Figure 32.
Table 10 Condition Survey Summary for Interstate 215 in District 8.Degree of Faulting
Slight Moderate Terrible
Total
Miles Surveyed 2 6 3 14Percentage 16% 47% 25% 88%
Type of Cracking
Transverse Corner Longitudinal
Total
Miles Surveyed 9 1 4 14
Percentage 62% 10% 28%
2.8.4 Interstate 405
Intestate 405 was surveyed in District 7 between postmiles 0 and 16.6 in the northbound
direction. Interstate 405 was constructed in the mid to late 1960s. The structure consists of 225
mm of PCC on 100 mm of CTB, 100 mm of AB, and 200 mm of ASB (20). Cracking was
nearly nonexistent on this route. However, almost the entire route had faulting, and more than
half of the route had terrible faulting, as shown in Table 11.
In District 12, Interstate 405 was surveyed between postmiles 0 and 24.3 in the
northbound direction. As in District 7, nearly the entire route had faulting. The faulting was
typically slight in District 12, whereas it was typically terrible in District 7. A considerable
extent of the route had longitudinal cracking, as shown in Table 12.
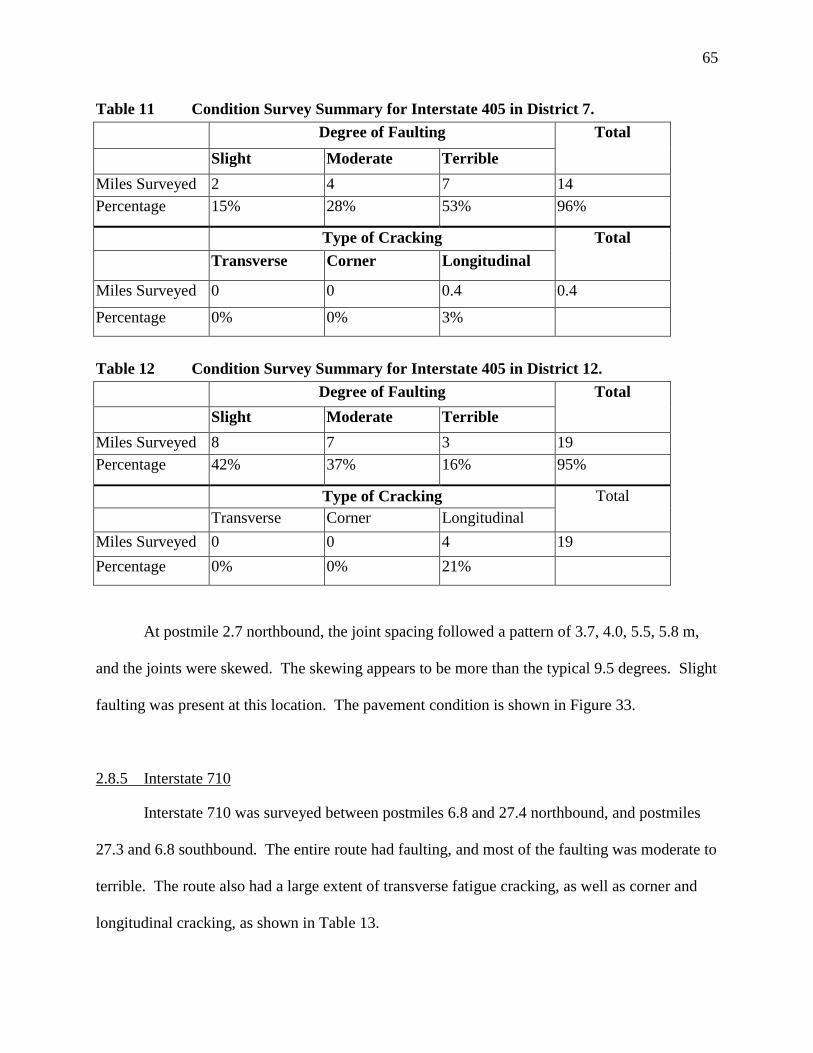
65
Table 11 Condition Survey Summary for Interstate 405 in District 7.Degree of Faulting
Slight Moderate TerribleTotal
Miles Surveyed 2 4 7 14Percentage 15% 28% 53% 96%
Type of CrackingTransverse Corner Longitudinal
Total
Miles Surveyed 0 0 0.4 0.4
Percentage 0% 0% 3%
Table 12 Condition Survey Summary for Interstate 405 in District 12.Degree of Faulting
Slight Moderate TerribleTotal
Miles Surveyed 8 7 3 19Percentage 42% 37% 16% 95%
Type of CrackingTransverse Corner Longitudinal
Total
Miles Surveyed 0 0 4 19Percentage 0% 0% 21%
At postmile 2.7 northbound, the joint spacing followed a pattern of 3.7, 4.0, 5.5, 5.8 m,
and the joints were skewed. The skewing appears to be more than the typical 9.5 degrees. Slight
faulting was present at this location. The pavement condition is shown in Figure 33.
2.8.5 Interstate 710
Interstate 710 was surveyed between postmiles 6.8 and 27.4 northbound, and postmiles
27.3 and 6.8 southbound. The entire route had faulting, and most of the faulting was moderate to
terrible. The route also had a large extent of transverse fatigue cracking, as well as corner and
longitudinal cracking, as shown in Table 13.
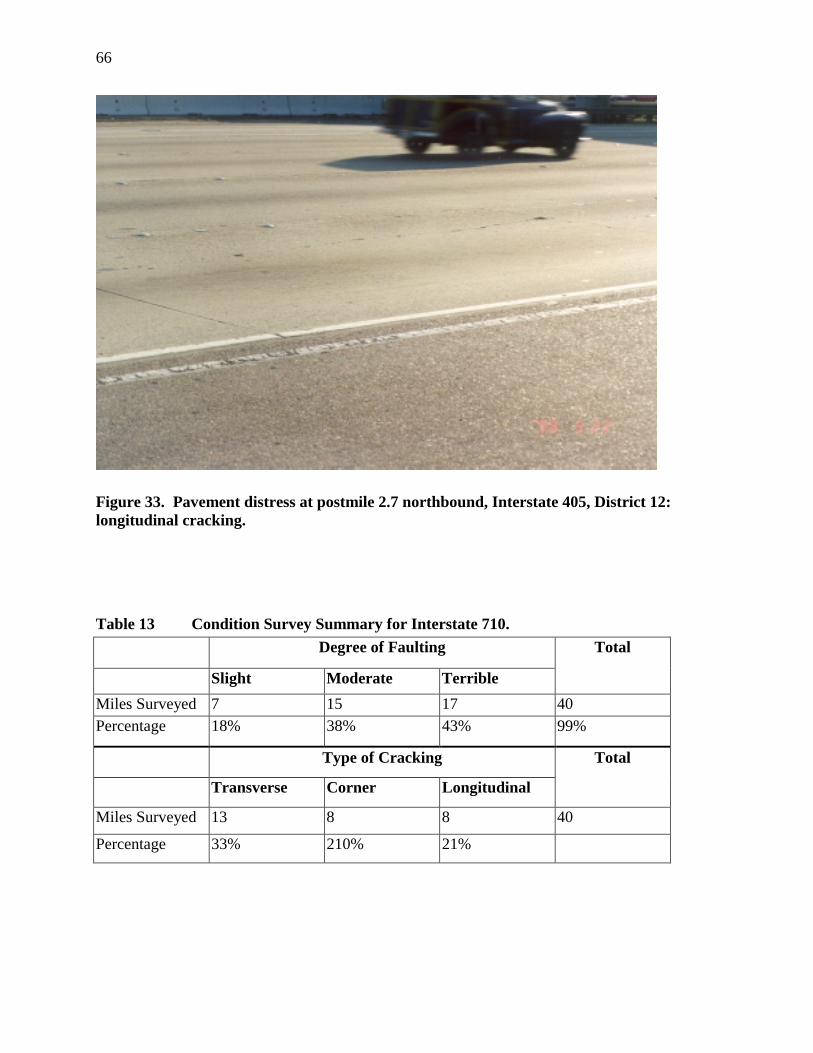
66
Figure 33. Pavement distress at postmile 2.7 northbound, Interstate 405, District 12:longitudinal cracking.
Table 13 Condition Survey Summary for Interstate 710.Degree of Faulting
Slight Moderate Terrible
Total
Miles Surveyed 7 15 17 40Percentage 18% 38% 43% 99%
Type of Cracking
Transverse Corner Longitudinal
Total
Miles Surveyed 13 8 8 40
Percentage 33% 210% 21%

67
Interstate 710 was built in the late 1950s, although sections on either side of the
interchange with Interstate 105 were rebuilt more recently. The pavement structure consists of
200 or 225 mm of PCC on 100 mm of CTB, 100 mm of AB, and 200 mm of ASB. Failed slabs
on I-710 have been replaced at various times. Many of the slab replacements consisted of
calcium chloride accelerated PCC with 0.3 m or more of CTB, AB, and ASB below. Re-
compaction of the remaining ASB after excavation may have been cursory, and at times may not
have been done at all due to pressures to quickly open to traffic. (20) Performance of the slab
replacements has often been poor.
At postmile 8.3 southbound, joint spacing varied between approximately 3.7 to 4.6 m,
and joints were perpendicular. Terrible faulting and spalled transverse cracks are present at this
location. A transverse joint fault of about 10 mm was visible. Some joints appear to be
preformed rather than sawed. The pavement condition is shown in Figures 34 and 35.
At postmile 14.8 northbound, the joints were skewed in a short section, which had slight
faulting and was probably more recently constructed. At postmile 16.5 northbound, joints were
perpendicular in an area with terrible faulting and extensive transverse, corner, and longitudinal
cracking.
Interstate 710 exhibited more crack and joint spalling than any other pavement surveyed.
In some locations, cracked portions of slabs have subsided, effectively creating a punchout. This
condition was not observed on any other highways surveyed.
2.8.6 State Route 60
In District 7, State Route 60 was surveyed between postmiles 0 and 29.4 westbound.
Nearly the entire route had faulting, and more than 80 percent was moderate or terrible faulting.
The route also had a large extent of longitudinal cracking, and some corner and transverse

68
Figure 34. Pavement distress at postmile 8.3 southbound, Interstate 710: transverse fatiguecracking and badly spalled, badly faulted joint.
Figure 35. Pavement distress at postmile 8.3 southbound, Interstate 710: spalled joint,transverse fatigue cracking.
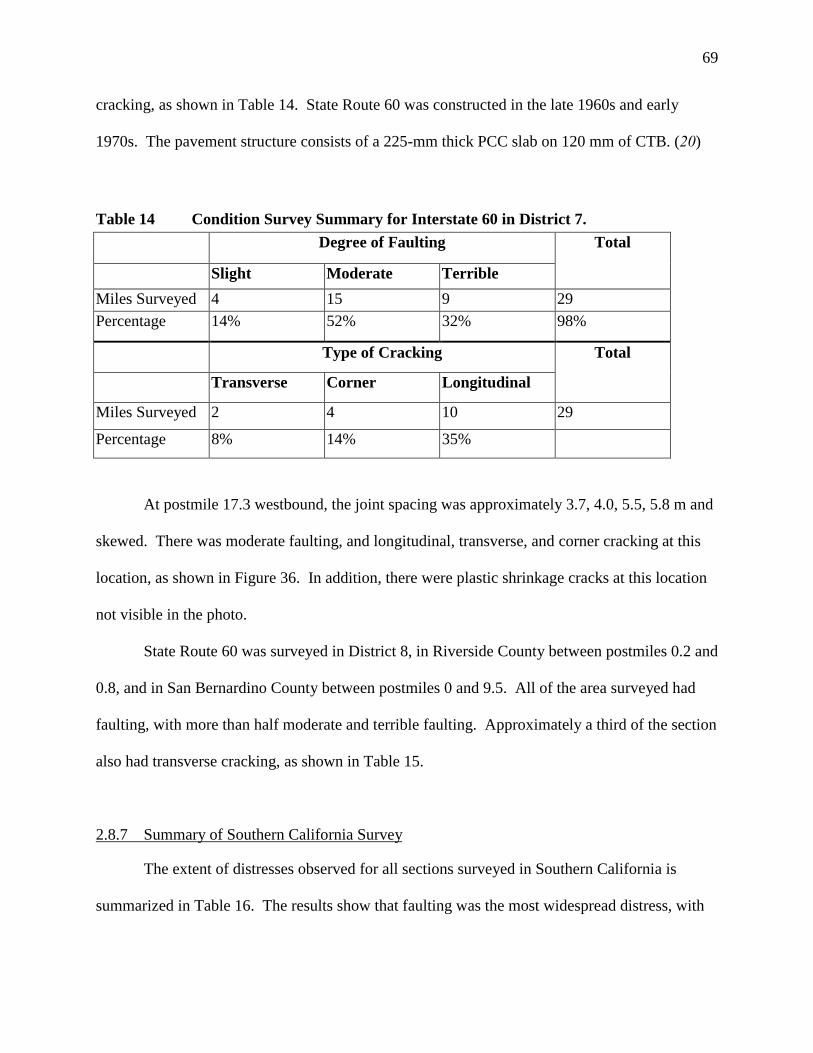
69
cracking, as shown in Table 14. State Route 60 was constructed in the late 1960s and early
1970s. The pavement structure consists of a 225-mm thick PCC slab on 120 mm of CTB. (20)
Table 14 Condition Survey Summary for Interstate 60 in District 7.Degree of Faulting
Slight Moderate Terrible
Total
Miles Surveyed 4 15 9 29Percentage 14% 52% 32% 98%
Type of Cracking
Transverse Corner Longitudinal
Total
Miles Surveyed 2 4 10 29
Percentage 8% 14% 35%
At postmile 17.3 westbound, the joint spacing was approximately 3.7, 4.0, 5.5, 5.8 m and
skewed. There was moderate faulting, and longitudinal, transverse, and corner cracking at this
location, as shown in Figure 36. In addition, there were plastic shrinkage cracks at this location
not visible in the photo.
State Route 60 was surveyed in District 8, in Riverside County between postmiles 0.2 and
0.8, and in San Bernardino County between postmiles 0 and 9.5. All of the area surveyed had
faulting, with more than half moderate and terrible faulting. Approximately a third of the section
also had transverse cracking, as shown in Table 15.
2.8.7 Summary of Southern California Survey
The extent of distresses observed for all sections surveyed in Southern California is
summarized in Table 16. The results show that faulting was the most widespread distress, with
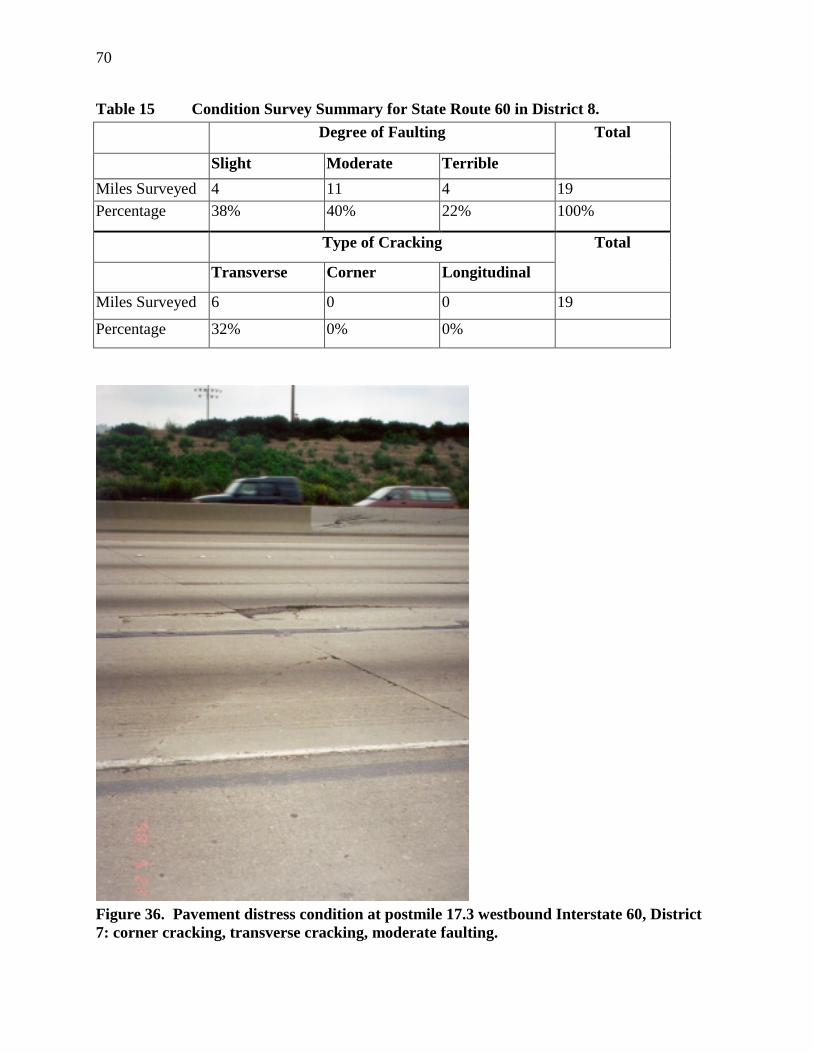
70
Table 15 Condition Survey Summary for State Route 60 in District 8.Degree of Faulting
Slight Moderate Terrible
Total
Miles Surveyed 4 11 4 19Percentage 38% 40% 22% 100%
Type of Cracking
Transverse Corner Longitudinal
Total
Miles Surveyed 6 0 0 19
Percentage 32% 0% 0%
Figure 36. Pavement distress condition at postmile 17.3 westbound Interstate 60, District7: corner cracking, transverse cracking, moderate faulting.

71
Table 16 Summary of Distresses for all Southern California Sections Surveyed.Degree of Faulting
Slight Moderate TerribleTotal
Miles Surveyed 65 132 108 336Percentage 19% 39% 32% 91%
Type of CrackingTransverse Corner Longitudinal
Total
Miles Surveyed 65 30 56 336
Percentage 19% 9% 17%
more than 90 percent of the sections surveyed having noticeable faulting. Almost a third of the
sections had faulting severe enough to cause a high level of discomfort for the driver.
Corner cracking was the least common distress. Transverse fatigue cracking and
longitudinal cracking occurred in less than 20 percent of the sections surveyed.
These results indicate that faulting is the major form of distress for existing Caltrans rigid
pavements. Faulting significantly affects ride scores and is highly correlated with user opinion
of rigid pavement quality. (21) A reduction in the extent and severity of faulting will likely
result in a much greater level of satisfaction for the public regarding Caltrans rigid pavements.
In addition, a reduction in faulting may result in an increase in pavement fatigue life due to a
reduction in vehicle dynamic loading.
2.8.8 Northern California Routes
In District 3 (Sacramento County), Interstate 80 was surveyed in the eastbound and
westbound directions between postmiles 10 and 17. Slight to moderate faulting was present in
most of the sections. The only cracking observed was longitudinal cracking, which was present
in most of the sections.
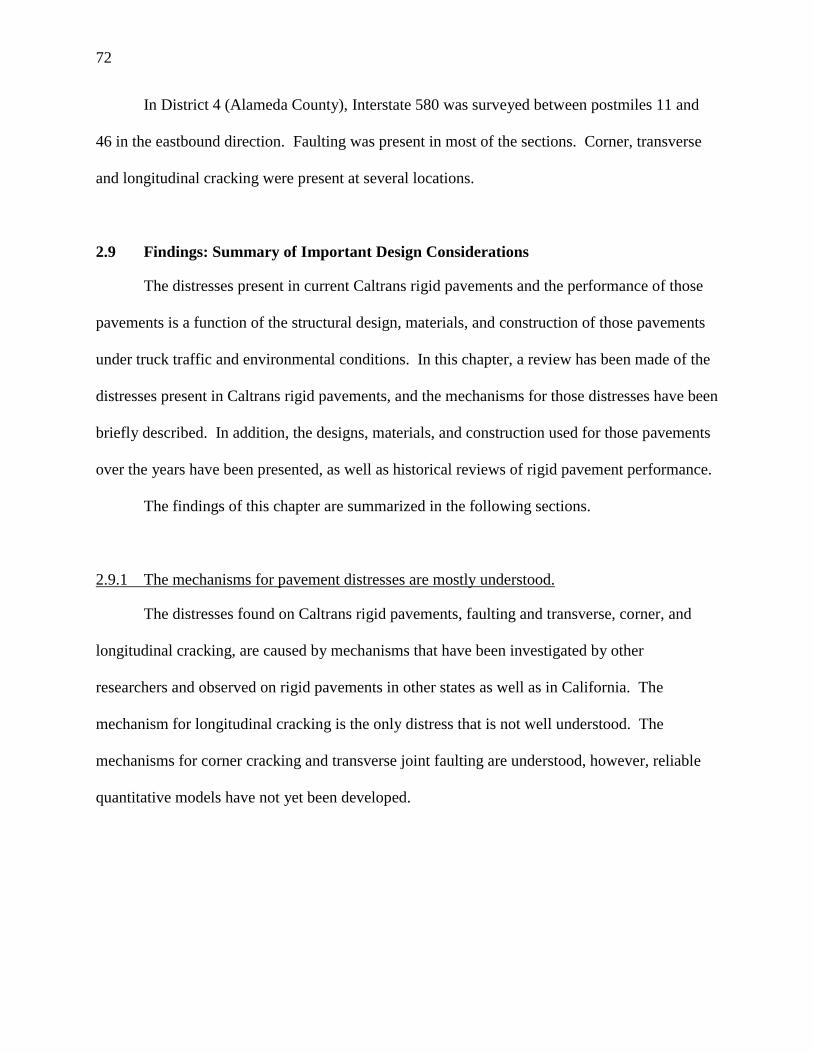
72
In District 4 (Alameda County), Interstate 580 was surveyed between postmiles 11 and
46 in the eastbound direction. Faulting was present in most of the sections. Corner, transverse
and longitudinal cracking were present at several locations.
2.9 Findings: Summary of Important Design Considerations
The distresses present in current Caltrans rigid pavements and the performance of those
pavements is a function of the structural design, materials, and construction of those pavements
under truck traffic and environmental conditions. In this chapter, a review has been made of the
distresses present in Caltrans rigid pavements, and the mechanisms for those distresses have been
briefly described. In addition, the designs, materials, and construction used for those pavements
over the years have been presented, as well as historical reviews of rigid pavement performance.
The findings of this chapter are summarized in the following sections.
2.9.1 The mechanisms for pavement distresses are mostly understood.
The distresses found on Caltrans rigid pavements, faulting and transverse, corner, and
longitudinal cracking, are caused by mechanisms that have been investigated by other
researchers and observed on rigid pavements in other states as well as in California. The
mechanism for longitudinal cracking is the only distress that is not well understood. The
mechanisms for corner cracking and transverse joint faulting are understood, however, reliable
quantitative models have not yet been developed.
73
2.9.2 Transverse joint faulting is the most prevalent distress on LLPRS candidate projects.
The most prevalent distress found on the candidate LLPRS projects was transverse joint
faulting. Faulting occurs throughout the state. Some routes have faulting nearly their entire
length. Faulting is often severe enough to cause a high level of discomfort to road users.
2.9.3 Faulting reduction measures have not been effective.
Caltrans rigid pavement designs have changed since construction of the interstate
highway system began in California in the mid-1950s. Many of those changes have been
introduced to reduce faulting, which has been recognized as one of the most important distresses
on California rigid pavements since the early 1960s. The distress mechanism for faulting
requires poor levels of load transfer across joints, and the presence of movable materials in the
material underlying the joints. The decision to not use dowels for better load transfer across
transverse joints is based on construction problems observed in 1949 by Hveem. (14) The use of
dowels does not appear to have been the subject of Caltrans research since then. The use of
cement treated bases as a non-erodable material beneath the concrete slabs does not appear to
have mitigated the occurrence of severe faulting after about 2,000,000 equivalent single axle
loads, which was observed in 1979 by McLeod and Monismith. (12) In District 8, it has been
observed that the CTB can produce significant quantities of fines beneath the slabs. The use of
skewed joints does not appear to have reduced faulting.
2.9.4 Use of joint sealants may reduce joint spalling and longitudinal cracking.
The construction of joint sealant reservoirs and use of long lasting compressible joint
sealants can help keep incompressible materials out of the joints, which reduces the potential for
joint spalling, and may also reduce the potential for longitudinal cracking. Further investigation
74
of the mechanism for longitudinal cracking is needed to better determine the effects of
incompressible materials in the joints.
2.9.5 Cracking is present on Caltrans rigid pavements.
Although cracking is not the most prevalent distress on Caltrans rigid pavements,
transverse cracking and longitudinal cracking are present, and corner cracking is present to a
lesser extent.
2.9.6 Future efforts to reduce joint faulting will also probably reduce occurrence of cornercracking.
The measures necessary to reduce joint faulting will probably result in a lower
occurrence of corner cracking because both distresses are primarily caused by loss of support
under the slab. The measures identified to reduce faulting are joint load transfer, non-movable
materials below the concrete slabs, and elimination of free water beneath the slabs.
2.9.7 Long joint spacings in proposed LLPRS-Rigid strategies will increase the likelihood oftransverse (fatigue) cracking.
In the current LLPRS-Rigid strategies under review for Caltrans by the University of
California Berkeley Contract Team, the joint spacings of the truck lanes to be reconstructed must
be the same as those of the inner lanes. Joint spacings on existing inner lanes range between 3.6
and 5.8 m. The longer joint spacings may cause transverse fatigue cracking.
2.9.8 Flexural strength plays a key role in cracking.
Flexural strength plays a key role in cracking, particularly transverse fatigue cracking.
Flexural strengths required by Caltrans are less than those of many other states that specify
75
flexural strength. The effect of flexural strength on the slab thicknesses required to prevent
transverse fatigue cracking is investigated in the next chapter of this report.
2.9.9 Proposed strategies for pavement reconstruction will require substantial work on manybridges to maintain legal height clearances.
The strategies proposed for rigid pavement reconstruction by the team involved in the
TRB evaluation of Interstate 710 call for 300- to 350-mm thick concrete slabs to be placed on
cement stabilized bases. These thick slabs will require substantial work on many bridges to
maintain legal height clearances. A preliminary evaluation of concrete slab thicknesses is
included in the next chapter of this report.
2.9.10 Climatic regions play a significant role in rigid pavement distress mechanisms, but arenot currently considered in Caltrans design procedures.
The LLPRS candidate projects are located in several climatic regions. Temperatures and
rainfall play a significant role in rigid pavement distress mechanisms. Climatic regions are not
currently considered in Caltrans design procedures.

76

77
3.0 EVALUATION OF PROPOSED STRATEGIES USING EXISTING DESIGNMETHODS
3.1 Description and Applicability of Methods Used
In a recent NCHRP survey, it was found that 21 states use the AASHTO 1986 guide for
design of jointed plain concrete pavements, 12 states use the 1972 AASHTO guide, two states
use the PCA method, and two states use a combination of the 1986 AASHTO guide and the PCA
method. (22) The Illinois Department of Transportation (IDOT) method is used only by that
state. Caltrans is the only state following the California method.
3.1.1 PCA Method
The latest version of the Portland Cement Association (PCA), thickness design guide for
concrete highway and street pavements (23, 24), has more mechanistic features than the
empirically based AASHTO guide. For fatigue cracking analysis, the PCA uses load spectra
analysis (traffic characterization) to calculate the bending stress in the concrete due to various
axle loads and configurations. Load spectra analyses also allow for calculation of pavement
stresses due to axle loads and configurations not originally considered in the AASHO Road Test.
The PCA guide also has many limitations, including:
• no accounting for temperature stresses in the slab,
• no ability to analyze widened lanes or different joint spacings,
• the use of top of the base k-value (combined base/subgrade k-value),
• no direct inclusion of reliability in the overall design, and
• no ability to change the load transfer across longitudinal joints between the lane and
shoulder.
78
The PCA recommends maximum slab length of 15 feet (4.57 m) or less. The computer
program developed by the PCA (PCAPAV) for their design method, was used to conduct the
experiment. (25)
3.1.2 ACPA/AASHTO Method
Many existing design procedures are empirically based. The AASHTO Pavement Design
Guide (26) is based on the field testing of flexible and rigid pavement structures in Ottawa,
Illinois in the late 1950s and early 1960s. (27) The AASHTO guide is based on the performance
of these test sections under truck traffic and environmental conditions.
One major output of the AASHO Road Test was the load equivalency factor (LEF)
concept. LEFs were used to quantify the damage different axle loads and configurations caused
to the different pavement structures relative to an 80-kN single axle load (dual wheels). The
concept of equivalent single axle loads (ESAL) was developed to quantify the damage caused by
a given axle load in terms of equal damage caused by a certain number of passes of an 80-kN
standard axle. ESALs are calculated by multiplying and summing each individual axle load and
configuration by its corresponding LEF for a particular pavement structure.
One shortcoming of rigid pavement LEFs is that they were based on the performance of
the concrete pavements at AASHO Road Test, which mostly failed due to pumping and erosion.
This type of failure is not the predominant failure mode in many rigid pavement structures.
Many rigid pavements fail because of faulting and fatigue cracking. Some further limitations of
the AASHTO Design guide are that the effects of wide truck lanes or tied concrete shoulders
cannot be analyzed. Joint spacing and curling stresses in the rigid pavement are also not directly
considered in the existing design guide.

79
The 1986 AASHTO Guide was revised in 1993 with respect to concrete overlay design.
The American Concrete Pavement Association (ACPA) has taken the 1993 version of the
AASHTO method, which contained some updates to the rigid pavement design procedure, and
adopted it with some modifications of their own. The following modifications regarding
concrete pavement design (not overlays) were made by the ACPA to the AASHTO method:
• More specific guidelines were made by ACPA than were given by the AASHTO
guide regarding load transfer coefficients, referred to as “J factors” in the design
method.
• The ACPA recommended that “loss of support” factors not be used. These factors
are included in the AASHTO guide because pumping was the primary cause of
failure at the AASHTO Road Test. These factors are not applicable to most other
pavement structures built today. Faulting, rather than pumping is a major distress in
California.
• Axle load spectrum data can be input, and the design method converts the axle loads
to ESALs using LEFs from the AASHTO design method.
The computer program PAS was used to produce results for this experiment, following
the 1993 AASHTO design method, as modified by the ACPA. (28)
3.1.3 Illinois DOT Method
The need has been growing for mechanistic-empirical design procedures in order to
account for situations where existing empirical studies could not be extrapolated to find a
reasonable solution. Mechanistic-based design guides address the theoretical stresses, strains,
and deflections in the pavement structure due to the environment, pavement materials, and

80
traffic. These stresses, strains, and deflections are then related to the field performance of in-
service rigid pavements through transfer functions. A common transfer function for concrete
pavements is to relate fatigue damage to cracking.
In a mechanistic-empirical design procedure, new, old, and current pavement features
may be analyzed to determine their effect on the pavement performance. Examples of pavement
design features are slab thickness, shoulder type, joint spacing, load transfer devices, and base
type. These features allow the pavement engineer to make changes to the design to
accommodate the specific location and constraints of the proposed pavement structure.
Mechanistic-empirical design procedures also can be used to evaluate pavement
structural performance in specific environments. For example, the behavior of a pavement in a
high desert environment, such as Palmdale, should not be expected to be the same as a pavement
in a coastal environment, such as Los Angeles. With an empirical design guide such as
AASHTO, only variables that were included in the original field testing can be reliably
considered in the procedure. Extrapolation of designs not included in the field testing could
result in unrealistic designs, especially for current traffic volumes. For example, only a few
million ESALs were applied to the pavements at the AASHO Road Test. Extrapolation of those
empirical results to 100 to 200 million ESALs for some LLPRS pavements may result in
unrealistic designs.
A pavement program, using the results of finite element analyses, was developed as a
pavement analysis supplement for the Illinois Department of Transportation (IDOT)
mechanistic-based rigid pavement design procedure. (29) The ILLICON program (30) calculates
the total edge stresses, load plus curl stresses, for a given set of pavement features. ILLICON
uses algorithms derived from a factorial of finite element analyses, using the program ILLI-

81
SLAB, for various pavement parameters. ILLICON allows the user to answer a variety of “what
if?” questions regarding changes in the material properties, environmental conditions, and
pavement features.
Mechanistic models are calibrated with field performance data for each distress type to
account for factors not included in the mechanistic model. In the fatigue design of concrete
pavements, laboratory and field tests are used to derive relationship between concrete stress ratio
and the number of cycles to failure. Currently, laboratory fatigue tests by themselves cannot be
accurately used to predict field performance of concrete slabs.
ILLICON permits the use of ESALs or the more mechanistic approach of calculating
stresses in the pavement from each axle configuration and weight (load spectra analysis). The
climatic region is included in the design procedure in terms of the temperature differential
through the slab. Heat transfer models (31) are able to predict the temperature gradient in the
slab given the climatic conditions (e.g., rainfall, solar radiation, wind speed, air temperature, etc.)
for any locations. These models enable designers to predict maximum temperature differentials
in regions where concrete pavements are going to be built without the necessity of field
measurements. The models only require air temperature, rainfall, cloud cover, and wind speed
data, which are easily accessible from local weather stations.
The flexural strength or concrete modulus of rupture must be known to complete a
mechanistic-based design. The flexural strength of a beam is tested in the laboratory to give an
idea what the strength of the slab is in the field. Currently, the flexural strength of the beam is
assumed to be equal to the in-situ strength of the slab. The flexural strength of the beam is used
in the fatigue analysis to calculate the concrete slab stress ratio (slab bending stress divided by
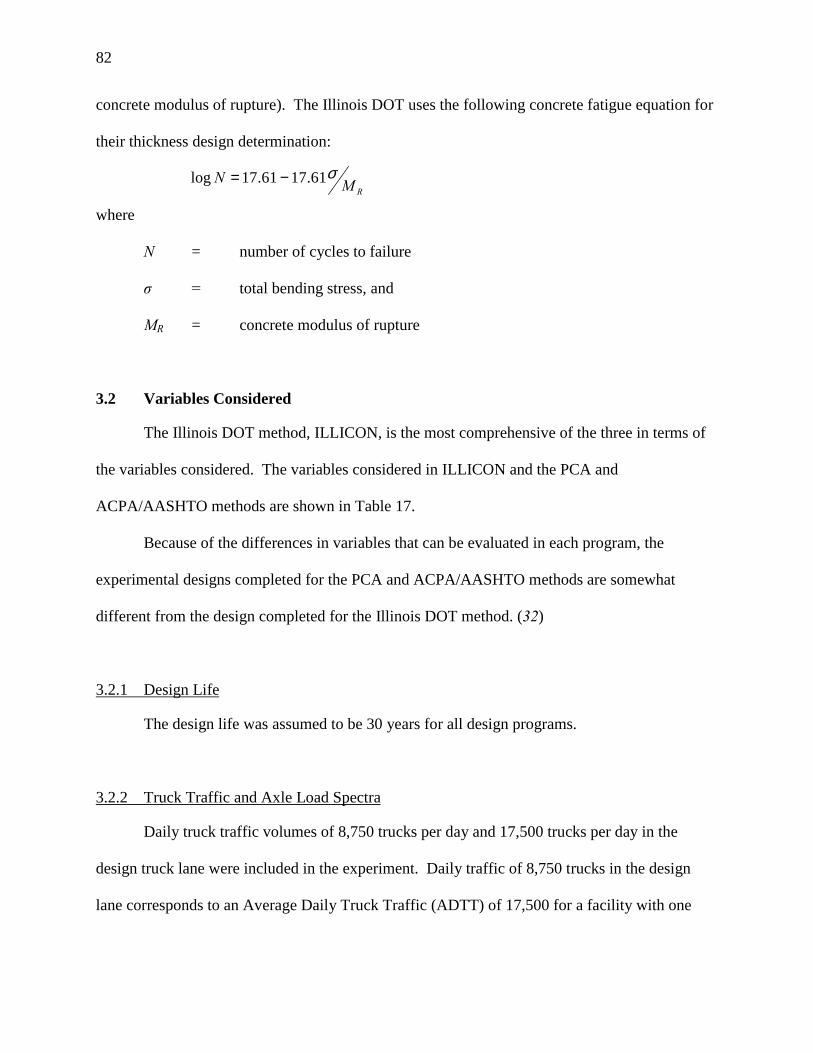
82
concrete modulus of rupture). The Illinois DOT uses the following concrete fatigue equation for
their thickness design determination:
where
N = number of cycles to failure
σ = total bending stress, and
MR = concrete modulus of rupture
3.2 Variables Considered
The Illinois DOT method, ILLICON, is the most comprehensive of the three in terms of
the variables considered. The variables considered in ILLICON and the PCA and
ACPA/AASHTO methods are shown in Table 17.
Because of the differences in variables that can be evaluated in each program, the
experimental designs completed for the PCA and ACPA/AASHTO methods are somewhat
different from the design completed for the Illinois DOT method. (32)
3.2.1 Design Life
The design life was assumed to be 30 years for all design programs.
3.2.2 Truck Traffic and Axle Load Spectra
Daily truck traffic volumes of 8,750 trucks per day and 17,500 trucks per day in the
design truck lane were included in the experiment. Daily traffic of 8,750 trucks in the design
lane corresponds to an Average Daily Truck Traffic (ADTT) of 17,500 for a facility with one
RMN σ61.1761.17log −=
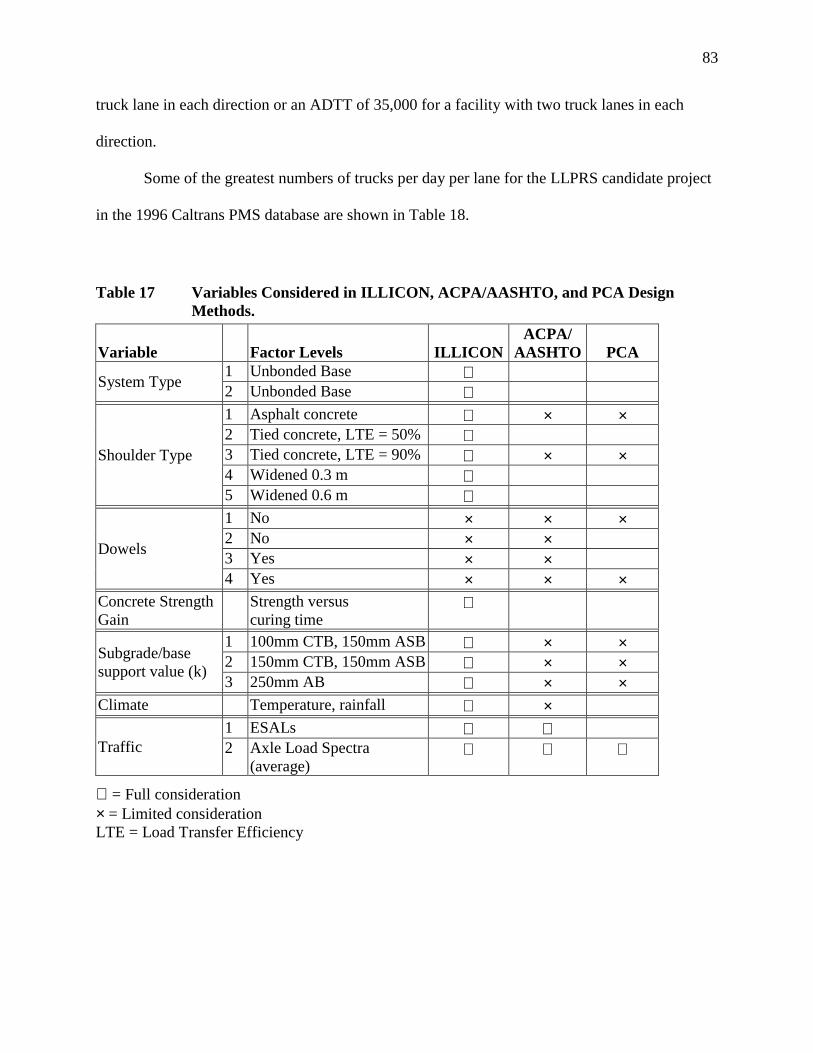
83
truck lane in each direction or an ADTT of 35,000 for a facility with two truck lanes in each
direction.
Some of the greatest numbers of trucks per day per lane for the LLPRS candidate project
in the 1996 Caltrans PMS database are shown in Table 18.
Table 17 Variables Considered in ILLICON, ACPA/AASHTO, and PCA DesignMethods.
Variable Factor Levels ILLICONACPA/
AASHTO PCA1 Unbonded Base ⊗System Type 2 Unbonded Base ⊗1 Asphalt concrete ⊗ × ×2 Tied concrete, LTE = 50% ⊗3 Tied concrete, LTE = 90% ⊗ × ×4 Widened 0.3 m ⊗
Shoulder Type
5 Widened 0.6 m ⊗1 No × × ×2 No × ×3 Yes × ×
Dowels
4 Yes × × ×Concrete StrengthGain
Strength versuscuring time
⊗
1 100mm CTB, 150mm ASB ⊗ × ×2 150mm CTB, 150mm ASB ⊗ × ×Subgrade/base
support value (k)3 250mm AB ⊗ × ×
Climate Temperature, rainfall ⊗ ×1 ESALs ⊗ ⊗
Traffic 2 Axle Load Spectra(average)
⊗ ⊗ ⊗
⊗ = Full consideration× = Limited considerationLTE = Load Transfer Efficiency

84
Table 18 Caltrans Facilities with Highest Daily Truck Traffic Volumes in Design Lane(Assuming Even Distribution of Trucks Between All Truck Lanes).
Location Post-miles
1996ADTT
Truck Lanesin EachDirection
Number ofTrucks PerDay in DesignLane
Percent ofTrucks with 5or More Axles
I-60, LosAngeles County
23 to25
39,900 2 9,975 55.0
I-710, LosAngeles County
6.8 to15
38,239 2 9.560 69.4
I-5, Los AngelesCounty
16 to24
28,320 2 7,080 40.0
The lower value for daily trucks in the design lane of 8,750 is similar to the maximum
values currently existing in the Caltrans network. The upper value of 17,500 was selected to
provide information for much greater levels of truck traffic, which may represent average traffic
over the 30-year design life for LLPRS pavements. It can be seen that these facilities have large
percentages of trucks with five or more axles, indicating semi-tractor trailer combinations that
typically carry heavy loads.
It is valuable to consider the throughput associated with the levels of truck traffic
included in the experiment. Assuming idealized conditions of a uniform distribution of trucks
across 24 hours per day and 365 days per year, no cars in the truck lanes, a uniform truck length
of 30 m (5 axle trucks, single trailer, semi-tractor), and a constant speed of 50 kph, these truck
traffic levels result in the headways and clear space between trucks shown in Table 19.
Table 19 Headways and Clearances Between Trucks for Design Truck Traffics at 50kph.
Trucks per day in designlane
Headway Between Trucks Clear Space BetweenTrucks
8,750 9.87 seconds 106 m17,500 4.94 seconds 38 m
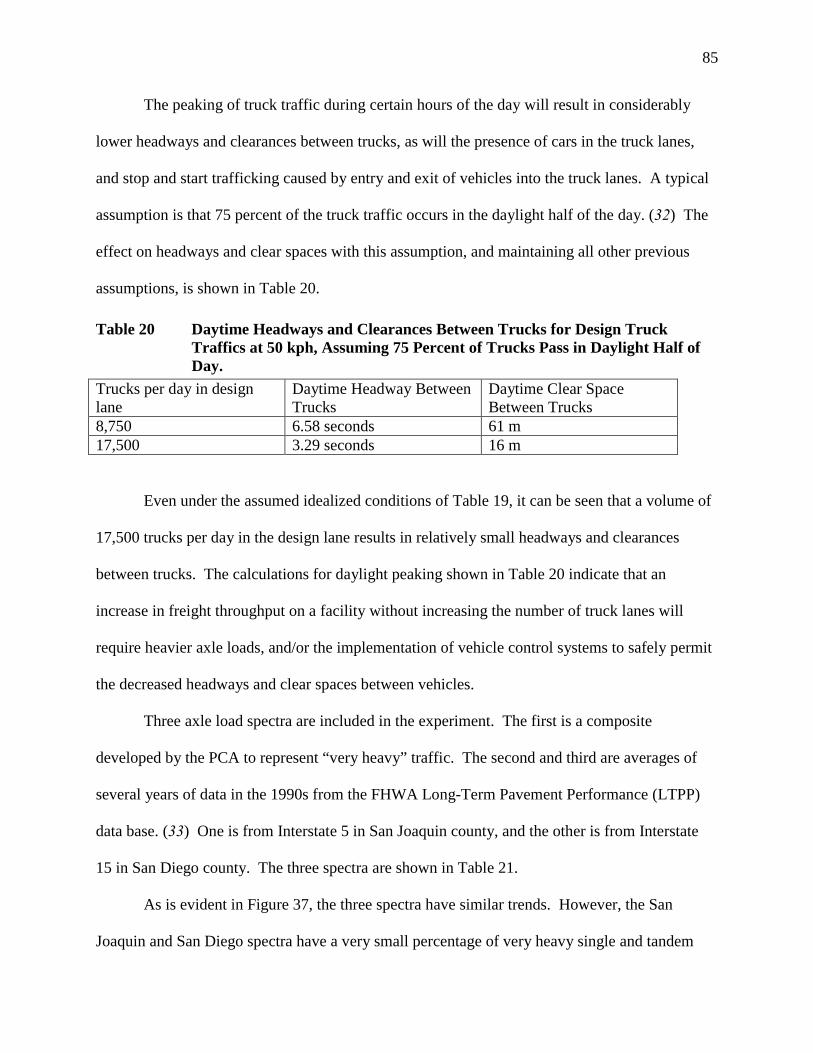
85
The peaking of truck traffic during certain hours of the day will result in considerably
lower headways and clearances between trucks, as will the presence of cars in the truck lanes,
and stop and start trafficking caused by entry and exit of vehicles into the truck lanes. A typical
assumption is that 75 percent of the truck traffic occurs in the daylight half of the day. (32) The
effect on headways and clear spaces with this assumption, and maintaining all other previous
assumptions, is shown in Table 20.
Table 20 Daytime Headways and Clearances Between Trucks for Design TruckTraffics at 50 kph, Assuming 75 Percent of Trucks Pass in Daylight Half ofDay.
Trucks per day in designlane
Daytime Headway BetweenTrucks
Daytime Clear SpaceBetween Trucks
8,750 6.58 seconds 61 m17,500 3.29 seconds 16 m
Even under the assumed idealized conditions of Table 19, it can be seen that a volume of
17,500 trucks per day in the design lane results in relatively small headways and clearances
between trucks. The calculations for daylight peaking shown in Table 20 indicate that an
increase in freight throughput on a facility without increasing the number of truck lanes will
require heavier axle loads, and/or the implementation of vehicle control systems to safely permit
the decreased headways and clear spaces between vehicles.
Three axle load spectra are included in the experiment. The first is a composite
developed by the PCA to represent “very heavy” traffic. The second and third are averages of
several years of data in the 1990s from the FHWA Long-Term Pavement Performance (LTPP)
data base. (33) One is from Interstate 5 in San Joaquin county, and the other is from Interstate
15 in San Diego county. The three spectra are shown in Table 21.
As is evident in Figure 37, the three spectra have similar trends. However, the San
Joaquin and San Diego spectra have a very small percentage of very heavy single and tandem

Table 21 PCA “Very Heavy,” I-5 San Joaquin and I-215 San Diego Axle Load Spectra.Single Axles per 1000 Trucks Tandem A
Axle Loads kips(kN)
I-15 San Diego I-5 San Joaquin PCA very heavy Axle Loads kips(kN)
I-15 San Diego
42 (187) 0 0.0002 0 80 (356) 040 (177) 0.0074 0.0072 0 76 (338) 0.001738 (169) 0.0080 0.0075 0 72 (320) 0.005736 (160) 0.0084 0.0036 0 68 (302) 0.012134 (151) 0.0160 0.0109 0.1900 64 (285) 0.009532 (142) 0.0299 0.0215 0.5400 60 (267) 0.054830 (133) 0.0440 0.0383 0.6300 56 (249) 0.071228 (125) 0.061 0.097 1.780 52 (231) 0.17026 (116) 0.254 0.449 3.520 48 (214) 0.39024 (107) 0.668 4.028 4.160 44 (196) 1.60422 (98) 2.9 31.6 9.7 40 (178) 7.220 (89) 19.7 117.6 41.8 36 (160) 69.418 (80) 58.1 207.5 68.3 32 (142) 148.516 (71) 75.0 169.2 57.1 28 (125) 103.614 (62) 75.1 152.5 NA 24 (107) 118.512 (53) 293.9 418.9 NA 20 (89) 123.510 (44) 451.5 436.8 NA 16 (71) 176.18 (36) 294.3 227.3 NA 12 (53) 185.76 (27) 253.9 228.2 NA 8 (36) 34.84 (18) 190.5 133.0 NA 4 (18) 26.12 (9) 126.4 66.9 NA
xles per 1000 TrucksI-5 San Joaquin PCA very heavy
0.0018 00.0033 00.0068 00.0081 00.0226 00.0467 0.57000.1052 1.07000.225 1.7900.056 3.0302.843 3.52040.1 20.3
213.1 78.2196.8 109.580.6 95.875.9 71.285.3 NA
133.7 NA171.5 NA60.0 NA18.8 NA
86

Axl
es p
er 1
000
Truc
ks
Figur
0
50
100
150
200
250
15 25 35 45 55 65 75 85
Axle Load (kips)
I-15 San Diego Singles
I-5 San Joaquin Singles
PCA Very Heavy Singles
I-15 San Diego Tandems
I-5 San Joaquin Tandems
PCA Very Heavy Tandems
e 37. Comparison of PCA “very heavy,” I-5 San Joaquin County, and I-215 San Diego County axle load spectra. 87

88
axle loads that are not included in the PCA spectrum, as shown in Figure 38. Despite accounting
for only a few percent of the total axle loads, these very overloaded axles are responsible for a
significant portion of the damage to concrete pavements, particularly fatigue cracking because of
the very high stress to modulus of rupture ratios. Single axle load distributions were truncated at
151 kN (34 kips) and tandem axle loads at 267 kN (60 kips) because of limitations on the
number of axle load categories that can be included in the ACPA/AASHTO and PCA software
analyses.
Additional traffic variables are considered in the Illinois DOT method, as shown in Table
22.
Table 22 Summary of Assumed Values for Variables Included in Illinois DOT Methodand Not Considered in PCA and ACPA/AASHTO Methods.
Variable Assumed ValuesSlab to Base Bonding UnbondedConcrete Elastic Modulus 4,000,000 psiBase Elastic Modulus 500,000 psiConcrete Poisson Ratio 0.15Dowel Diameter 37 mm (1.5 inches)Modulus of Rupture Test Method 3rd Point LoadingTruck Traffic Daily Distribution 75 percent of Trucks in Daylight HoursAverage Distance Slab Edge to Edge ofWheel
456 mm (18 in.)
Standard Deviation of Lateral WheelLocation
300 mm (12 in.)
Fatigue Model BeamsMethod to Include About 90 percentReliability
Multiply axle load repetitions by 2.5
3.2.3 Subgrade/Base Support
The support provided to the concrete slabs by the subgrade, subbase, and base is used in
terms of the modulus of subgrade reaction, or k, in all three methods. The modulus of subgrade
reaction is essentially a linear spring constant in which the distance that the spring compresses is

Axl
es p
er 1
000
Truc
ks
Figurload
0.0
0.1
0.2
0.3
0.4
0.5
0.6
0.7
0.8
15 25 35 45 55 65 75 85
Axle Load (kips)
I-15 San Diego Singles
I-5 San Joaquin Singles
PCA Very Heavy Singles
I-15 San Diego Tandems
I-5 San Joaquin Tandems
PCA Very Heavy Tandems
e 38. Comparison of heaviest loads from PCA “very heavy,” I-5 San Joaquin County, and I-215 San Diego County axlespectra. 89
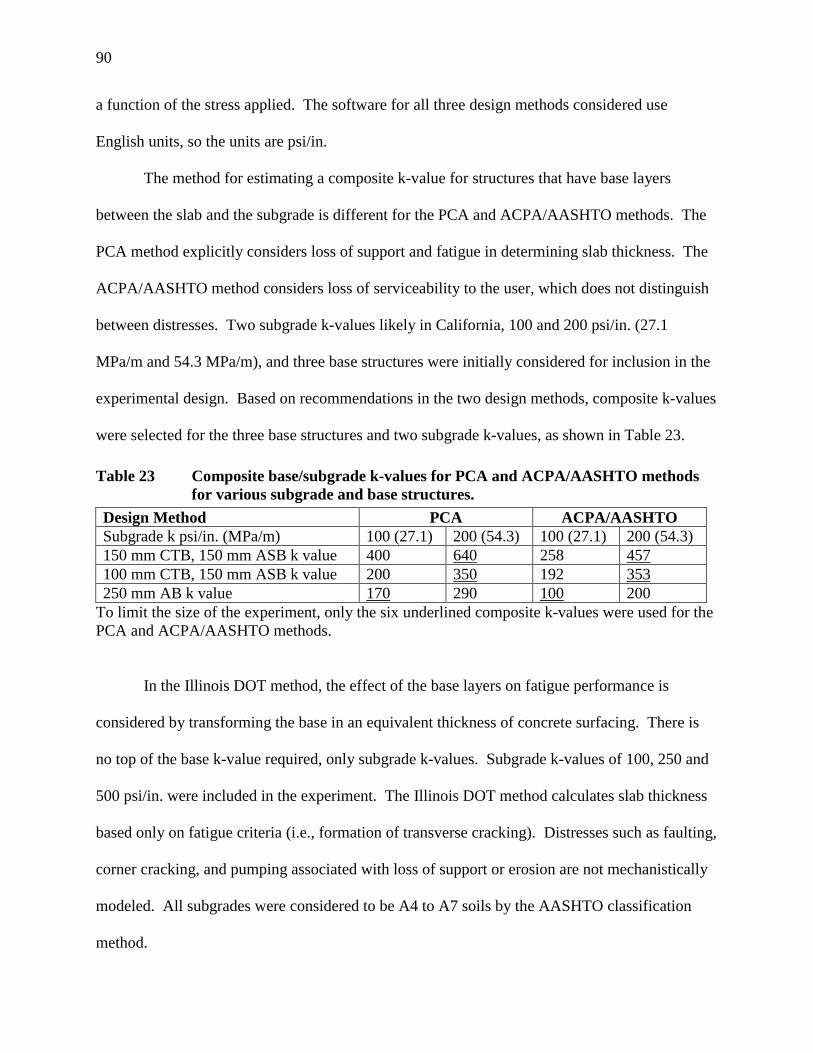
90
a function of the stress applied. The software for all three design methods considered use
English units, so the units are psi/in.
The method for estimating a composite k-value for structures that have base layers
between the slab and the subgrade is different for the PCA and ACPA/AASHTO methods. The
PCA method explicitly considers loss of support and fatigue in determining slab thickness. The
ACPA/AASHTO method considers loss of serviceability to the user, which does not distinguish
between distresses. Two subgrade k-values likely in California, 100 and 200 psi/in. (27.1
MPa/m and 54.3 MPa/m), and three base structures were initially considered for inclusion in the
experimental design. Based on recommendations in the two design methods, composite k-values
were selected for the three base structures and two subgrade k-values, as shown in Table 23.
Table 23 Composite base/subgrade k-values for PCA and ACPA/AASHTO methodsfor various subgrade and base structures.
Design Method PCA ACPA/AASHTOSubgrade k psi/in. (MPa/m) 100 (27.1) 200 (54.3) 100 (27.1) 200 (54.3)150 mm CTB, 150 mm ASB k value 400 640 258 457100 mm CTB, 150 mm ASB k value 200 350 192 353250 mm AB k value 170 290 100 200
To limit the size of the experiment, only the six underlined composite k-values were used for thePCA and ACPA/AASHTO methods.
In the Illinois DOT method, the effect of the base layers on fatigue performance is
considered by transforming the base in an equivalent thickness of concrete surfacing. There is
no top of the base k-value required, only subgrade k-values. Subgrade k-values of 100, 250 and
500 psi/in. were included in the experiment. The Illinois DOT method calculates slab thickness
based only on fatigue criteria (i.e., formation of transverse cracking). Distresses such as faulting,
corner cracking, and pumping associated with loss of support or erosion are not mechanistically
modeled. All subgrades were considered to be A4 to A7 soils by the AASHTO classification
method.

91
3.2.4 Concrete Flexural Strength
Concrete 28-day moduli of rupture (MR) of 3.45, 4.48, and 5.52 MPa (500, 650 and 800
psi, respectively) were included in the experiment. These MR values are based on third-point
loading for all three design methods. Caltrans currently specifies a concrete MR of 3.79 MPa
(550 psi) at 14 days for Portland cement concrete using a center-point loading configuration.
The special provisions for many LLPRS projects require a concrete MR of 2.8 MPa at 8 hours,
and 4.1 MPa at 7 days. Caltrans uses center-point loading (CT 523) instead of third-point
loading (ASTM C78), which typically produces MR values approximately 5 percent greater than
those from third-point loading and with a greater variance. Many other states also use center-
point loading.
The elastic modulus of the concrete is required for the ACPA/AASHTO and Illinois DOT
methods. For the ACPA/AASHTO method, the elastic modulus was estimated based on the MR,
with elastic modulus values of 3.375×10⁶, 4.388×10⁶, and 5.400×10⁶ psi corresponding to MR
values of 500, 650, and 800 psi (3.45, 4.48, and 5.51 MPa) respectively. For the Illinois DOT,
an elastic modulus of 4.0×10⁶ psi was used.
3.2.5 Design Features
The design features included in the long life rigid pavement rehabilitation strategies
(LLPRS-Rigid) to extend the life of rigid pavements are dowels in the transverse joints, tied
concrete shoulders, and widened truck lanes. Doweled transverse joints and tied concrete
shoulders were evaluated using the three design methods. Characterization of the pavement
structure for these features is different in the three methods. The PCA method does not consider
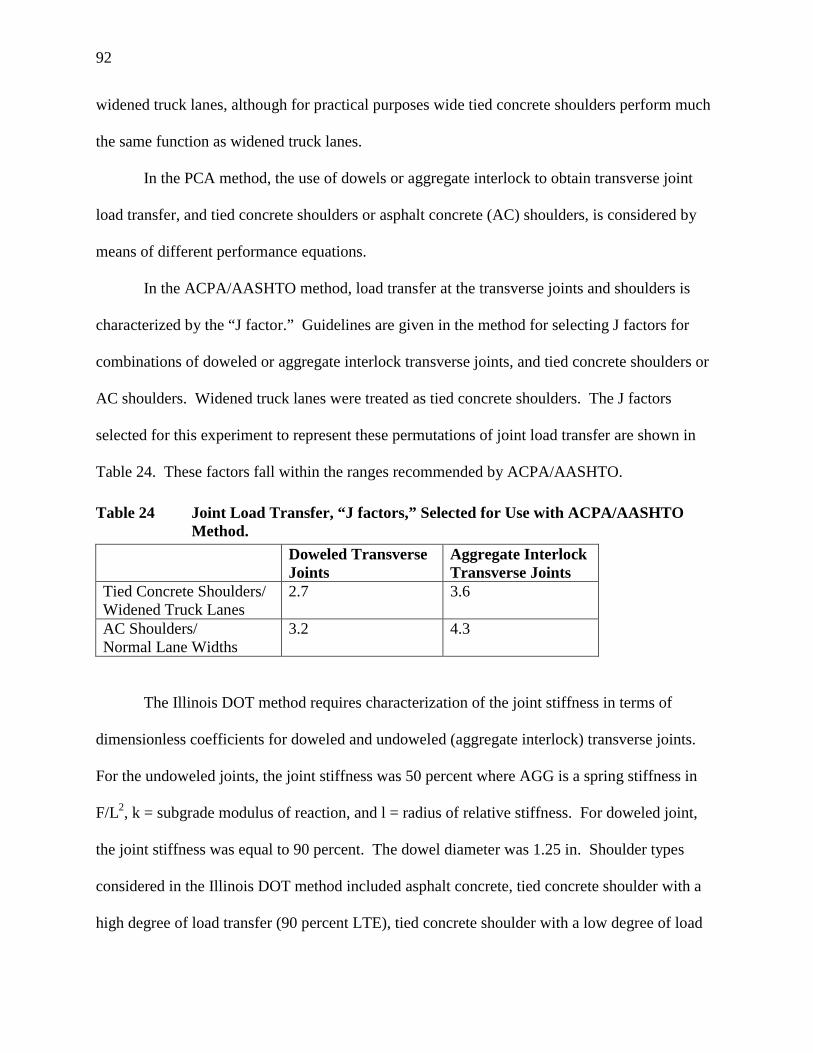
92
widened truck lanes, although for practical purposes wide tied concrete shoulders perform much
the same function as widened truck lanes.
In the PCA method, the use of dowels or aggregate interlock to obtain transverse joint
load transfer, and tied concrete shoulders or asphalt concrete (AC) shoulders, is considered by
means of different performance equations.
In the ACPA/AASHTO method, load transfer at the transverse joints and shoulders is
characterized by the “J factor.” Guidelines are given in the method for selecting J factors for
combinations of doweled or aggregate interlock transverse joints, and tied concrete shoulders or
AC shoulders. Widened truck lanes were treated as tied concrete shoulders. The J factors
selected for this experiment to represent these permutations of joint load transfer are shown in
Table 24. These factors fall within the ranges recommended by ACPA/AASHTO.
Table 24 Joint Load Transfer, “J factors,” Selected for Use with ACPA/AASHTOMethod.
Doweled TransverseJoints
Aggregate InterlockTransverse Joints
Tied Concrete Shoulders/Widened Truck Lanes
2.7 3.6
AC Shoulders/Normal Lane Widths
3.2 4.3
The Illinois DOT method requires characterization of the joint stiffness in terms of
dimensionless coefficients for doweled and undoweled (aggregate interlock) transverse joints.
For the undoweled joints, the joint stiffness was 50 percent where AGG is a spring stiffness in
F/L2, k = subgrade modulus of reaction, and l = radius of relative stiffness. For doweled joint,
the joint stiffness was equal to 90 percent. The dowel diameter was 1.25 in. Shoulder types
considered in the Illinois DOT method included asphalt concrete, tied concrete shoulder with a
high degree of load transfer (90 percent LTE), tied concrete shoulder with a low degree of load

93
transfer (50 percent LTE), and truck lanes widened 0.3 and 0.6 m beyond the standard 3.7-m
width.
Unlike the ACPA/AASHTO and PCA methods, the Illinois method considers slab length,
which is a key consideration for transverse fatigue cracking. Slab lengths considered in the
ILLICON experiment were 4.57 and 5.79 m (15 and 19 ft.).
3.2.6 Safety Factors/Reliability
The three design methods considered use very different procedures to include reliability
into the structural design. An attempt was made in the experiment to include design reliability
appropriate for heavy-duty interstate pavements, and to include similar reliability across the three
methods.
The PCA method includes reliability by applying a Load Safety Factor (LSF) to each
load in the axle load spectrum. An LSF for interstate pavements of 1.2 was used in the
experiment.
The ACPA/AASHTO method explicitly considers reliability in the design equation. An
overall reliability of 95 percent was used for the experiment. The standard deviation of the
concrete strength was assumed to be 10 percent of the average strength. The initial serviceability
in terms of the Present Serviceability Index (PSI) was assumed to be 4.5, and the terminal PSI
was assumed to be 2.5.
The Illinois DOT method considers design reliability. The ILLICON program is used as
a design check and does not include reliability factors. Designs are for average performance in
terms of percent of slabs cracked. To introduce a design reliability of approximately 90 to 95
percent into the calculations, traffic repetitions were multiplied by a factor of 2.5. The Illinois
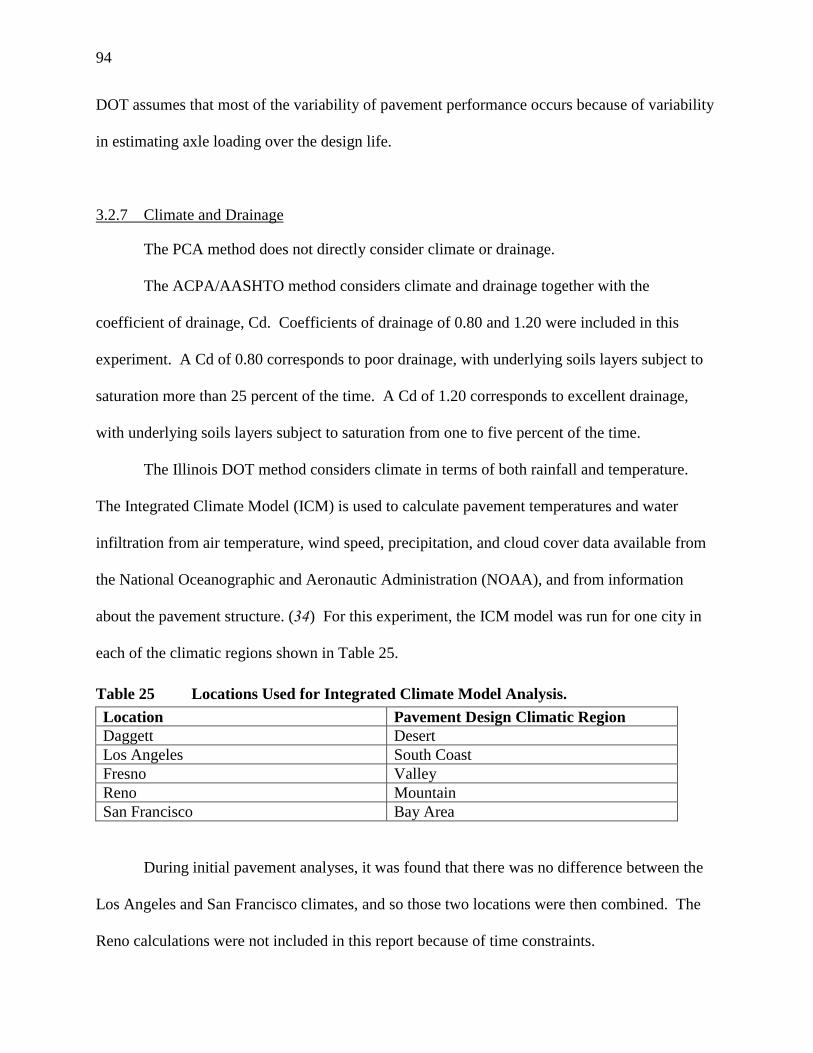
94
DOT assumes that most of the variability of pavement performance occurs because of variability
in estimating axle loading over the design life.
3.2.7 Climate and Drainage
The PCA method does not directly consider climate or drainage.
The ACPA/AASHTO method considers climate and drainage together with the
coefficient of drainage, Cd. Coefficients of drainage of 0.80 and 1.20 were included in this
experiment. A Cd of 0.80 corresponds to poor drainage, with underlying soils layers subject to
saturation more than 25 percent of the time. A Cd of 1.20 corresponds to excellent drainage,
with underlying soils layers subject to saturation from one to five percent of the time.
The Illinois DOT method considers climate in terms of both rainfall and temperature.
The Integrated Climate Model (ICM) is used to calculate pavement temperatures and water
infiltration from air temperature, wind speed, precipitation, and cloud cover data available from
the National Oceanographic and Aeronautic Administration (NOAA), and from information
about the pavement structure. (34) For this experiment, the ICM model was run for one city in
each of the climatic regions shown in Table 25.
Table 25 Locations Used for Integrated Climate Model Analysis.Location Pavement Design Climatic RegionDaggett DesertLos Angeles South CoastFresno ValleyReno MountainSan Francisco Bay Area
During initial pavement analyses, it was found that there was no difference between the
Los Angeles and San Francisco climates, and so those two locations were then combined. The
Reno calculations were not included in this report because of time constraints.
95
3.2.8 Failure Modes
It is important to understand that different failure criteria are used in each of the three
design methods.
The PCA method considers failure to occur by either transverse fatigue cracking or
“erosion.” Erosion includes all distresses caused by loss of support to the concrete slab,
including faulting, corner cracking, and potentially longitudinal cracking. Each thickness design
is evaluated for both fatigue cracking and erosion, and the failure mode that requires the thickest
slab is considered critical. In the tables of experiment results included in Appendices B-D, the
mode of failure found to be critical is identified for each case.
Failure is not identified by distress in the ACPA/AASHTO method. Instead, pavement
life is evaluated in terms of “serviceability,” a composite measure of pavement condition
dependent primarily on user perception, and therefore primarily on ride quality. The design
equations are mostly based on the results of the AASHO Road Test of 1958 to 1960, and are
restricted in many ways to the subgrade conditions and climate in central Illinois during those
years. In particular, rigid pavement distress development caused by loss of support to the
concrete slabs is highly related to the “pumpable” and “erodable” subgrade materials at the
AASHO Road Test. For this reason, some adjustments were made to the J factors used in the
ACPA version of the AASHTO design method. These adjustments were used in this experiment
and are described in detail in notes that accompany the ACPA design method. (35)
The failure mode considered in the Illinois DOT method is transverse fatigue cracking.
This method considers slab thickness to be the primary variable that determines a pavement’s
potential for fatigue cracking. The IDOT method uses past experience to justify other design
features such as base type. This approach is justifiable considering that faulting and other

96
distresses caused by loss of support to the concrete slabs are not significantly affected by slab
thickness if slab thickness is appropriately designed for resistance to fatigue cracking.
3.3 Evaluation of Design Lives Using the PCA Method
Concrete slab thicknesses determined by the PCA method for the experiment variables
are shown in Table 26. The results are summarized in terms of the mode of failure, fatigue or
erosion, and shown on a case by case basis in Appendix B. The program output is in inches and
so the results are reported in inches.
For the proposed rigid pavement strategies, which include retention of 100 mm of CTB
and 150 mm of ASB, assuming a subgrade k-value of 200 psi/in., the required slab thicknesses
are between 7.5 and 14 inches (191 and 356 mm). Slab thickness is dependent primarily upon
the inclusion of dowels and/or tied shoulder and concrete flexural strength, and to a lesser extent
upon axle load spectra and truck traffic.
Average, minimum and maximum slab thicknesses for each variable and factor level are
shown in Table 27. Also shown is the proportion of cases for which fatigue or erosion is
identified as critical by the design method. Overall, 16 percent of the cases were identified as
failing by fatigue, and 84 percent by erosion. The maximum permitted slab thickness in the PCA
method is 14 inches (356 mm). When a thicker slab is required, the software calls for a slab “>
14 inches.” For the purposes of preparing Table 27, slab thicknesses greater than 14 inches (356
mm) were calculated as 14.5 inches (368 mm). The maximum of 14 inches (356 mm) is an
indication of the maximum extent to which the PCA wishes to extrapolate its method, which was
exceeded for many of the cases in this experiment, especially when dowels and tied concrete
shoulders were not employed.
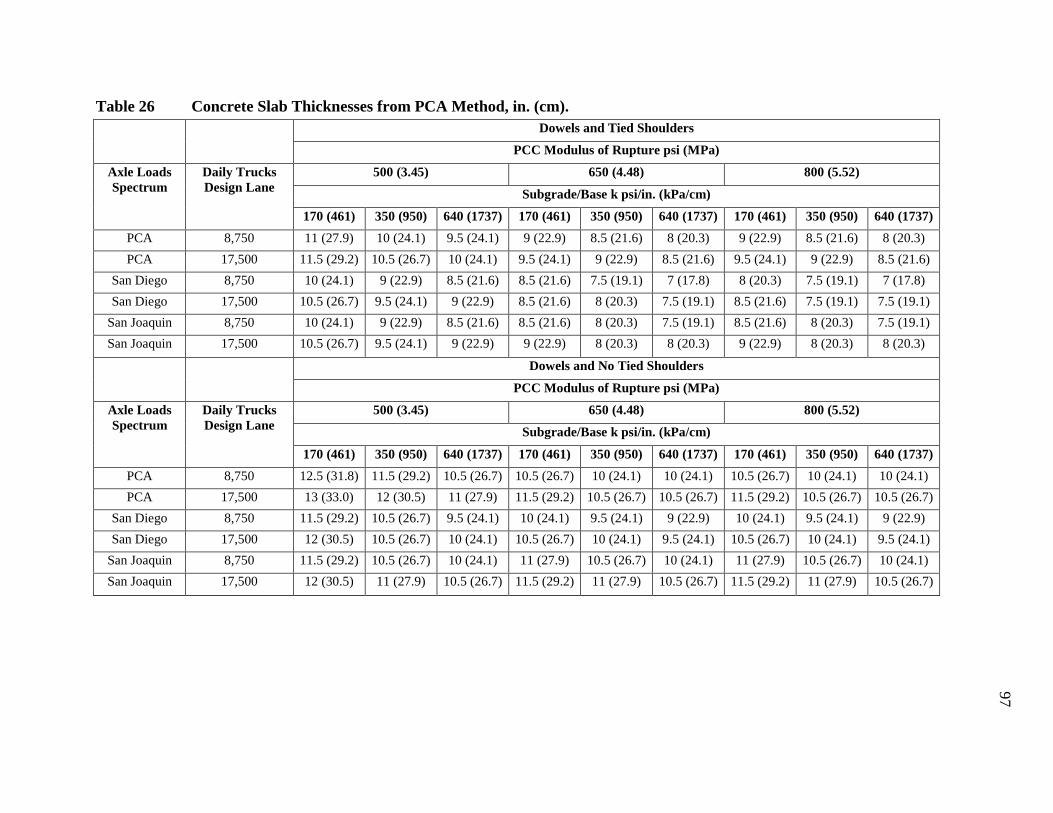
Table
AxleSpe
PP
SanSan
San San
AxleSpe
PP
SanSan
San San
26 Concrete Slab Thicknesses from PCA Method, in. (cm).Dowels and Tied Shoulders
PCC Modulus of Rupture psi (MPa)500 (3.45) 650 (4.48) 800 (5.52)
Subgrade/Base k psi/in. (kPa/cm)
Loadsctrum
Daily TrucksDesign Lane
170 (461) 350 (950) 640 (1737) 170 (461) 350 (950) 640 (1737) 170 (461) 350 (950) 640 (1737)CA 8,750 11 (27.9) 10 (24.1) 9.5 (24.1) 9 (22.9) 8.5 (21.6) 8 (20.3) 9 (22.9) 8.5 (21.6) 8 (20.3)CA 17,500 11.5 (29.2) 10.5 (26.7) 10 (24.1) 9.5 (24.1) 9 (22.9) 8.5 (21.6) 9.5 (24.1) 9 (22.9) 8.5 (21.6) Diego 8,750 10 (24.1) 9 (22.9) 8.5 (21.6) 8.5 (21.6) 7.5 (19.1) 7 (17.8) 8 (20.3) 7.5 (19.1) 7 (17.8) Diego 17,500 10.5 (26.7) 9.5 (24.1) 9 (22.9) 8.5 (21.6) 8 (20.3) 7.5 (19.1) 8.5 (21.6) 7.5 (19.1) 7.5 (19.1)Joaquin 8,750 10 (24.1) 9 (22.9) 8.5 (21.6) 8.5 (21.6) 8 (20.3) 7.5 (19.1) 8.5 (21.6) 8 (20.3) 7.5 (19.1)Joaquin 17,500 10.5 (26.7) 9.5 (24.1) 9 (22.9) 9 (22.9) 8 (20.3) 8 (20.3) 9 (22.9) 8 (20.3) 8 (20.3)
Dowels and No Tied Shoulders
PCC Modulus of Rupture psi (MPa)500 (3.45) 650 (4.48) 800 (5.52)
Subgrade/Base k psi/in. (kPa/cm) Loadsctrum
Daily TrucksDesign Lane
170 (461) 350 (950) 640 (1737) 170 (461) 350 (950) 640 (1737) 170 (461) 350 (950) 640 (1737)CA 8,750 12.5 (31.8) 11.5 (29.2) 10.5 (26.7) 10.5 (26.7) 10 (24.1) 10 (24.1) 10.5 (26.7) 10 (24.1) 10 (24.1)CA 17,500 13 (33.0) 12 (30.5) 11 (27.9) 11.5 (29.2) 10.5 (26.7) 10.5 (26.7) 11.5 (29.2) 10.5 (26.7) 10.5 (26.7) Diego 8,750 11.5 (29.2) 10.5 (26.7) 9.5 (24.1) 10 (24.1) 9.5 (24.1) 9 (22.9) 10 (24.1) 9.5 (24.1) 9 (22.9) Diego 17,500 12 (30.5) 10.5 (26.7) 10 (24.1) 10.5 (26.7) 10 (24.1) 9.5 (24.1) 10.5 (26.7) 10 (24.1) 9.5 (24.1)Joaquin 8,750 11.5 (29.2) 10.5 (26.7) 10 (24.1) 11 (27.9) 10.5 (26.7) 10 (24.1) 11 (27.9) 10.5 (26.7) 10 (24.1)Joaquin 17,500 12 (30.5) 11 (27.9) 10.5 (26.7) 11.5 (29.2) 11 (27.9) 10.5 (26.7) 11.5 (29.2) 11 (27.9) 10.5 (26.7)
97
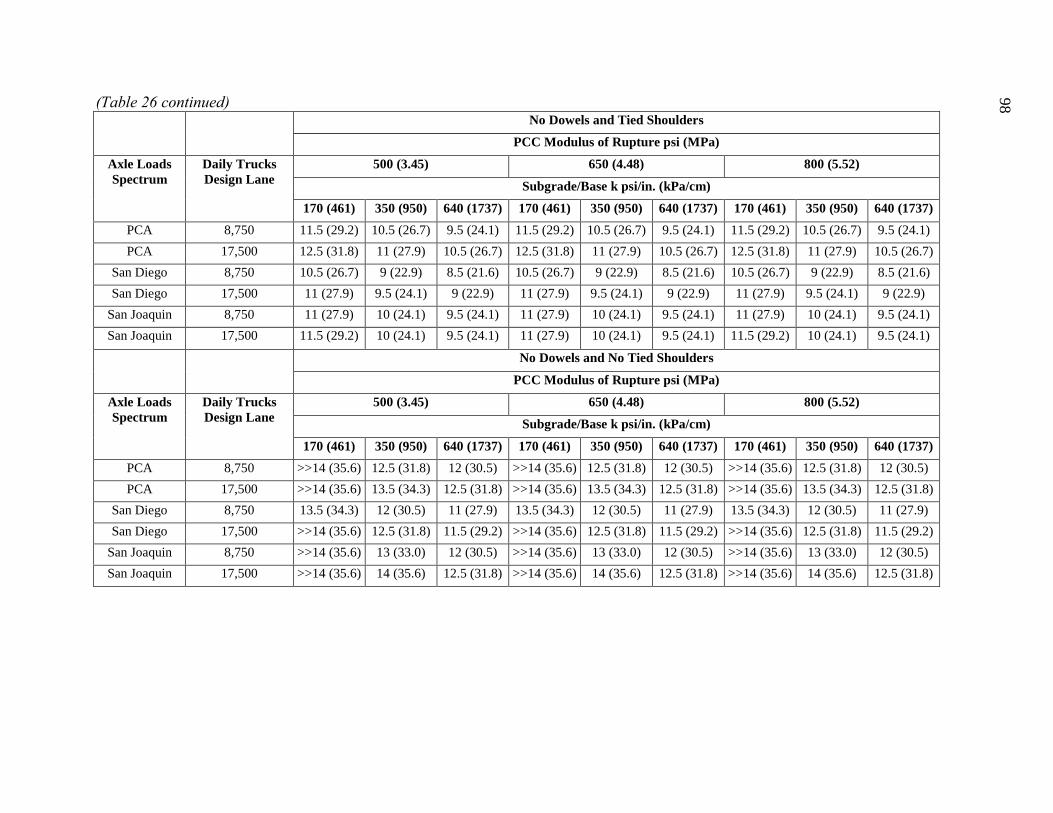
(Table 26 continued)No Dowels and Tied Shoulders
PCC Modulus of Rupture psi (MPa)500 (3.45) 650 (4.48)
Subgrade/Base k psi/in. (kPa/cm)
Axle LoadsSpectrum
Daily TrucksDesign Lane
170 (461) 350 (950) 640 (1737) 170 (461) 350 (950) 640 (1737)PCA 8,750 11.5 (29.2) 10.5 (26.7) 9.5 (24.1) 11.5 (29.2) 10.5 (26.7) 9.5 (24.1)PCA 17,500 12.5 (31.8) 11 (27.9) 10.5 (26.7) 12.5 (31.8) 11 (27.9) 10.5 (26.7)
San Diego 8,750 10.5 (26.7) 9 (22.9) 8.5 (21.6) 10.5 (26.7) 9 (22.9) 8.5 (21.6)San Diego 17,500 11 (27.9) 9.5 (24.1) 9 (22.9) 11 (27.9) 9.5 (24.1) 9 (22.9)
San Joaquin 8,750 11 (27.9) 10 (24.1) 9.5 (24.1) 11 (27.9) 10 (24.1) 9.5 (24.1)San Joaquin 17,500 11.5 (29.2) 10 (24.1) 9.5 (24.1) 11 (27.9) 10 (24.1) 9.5 (24.1)
No Dowels and No Tied Shoulders
PCC Modulus of Rupture psi (MPa)500 (3.45) 650 (4.48)
Subgrade/Base k psi/in. (kPa/cm)Axle LoadsSpectrum
Daily TrucksDesign Lane
170 (461) 350 (950) 640 (1737) 170 (461) 350 (950) 640 (1737)PCA 8,750 >>14 (35.6) 12.5 (31.8) 12 (30.5) >>14 (35.6) 12.5 (31.8) 12 (30.5)PCA 17,500 >>14 (35.6) 13.5 (34.3) 12.5 (31.8) >>14 (35.6) 13.5 (34.3) 12.5 (31.8)
San Diego 8,750 13.5 (34.3) 12 (30.5) 11 (27.9) 13.5 (34.3) 12 (30.5) 11 (27.9)San Diego 17,500 >>14 (35.6) 12.5 (31.8) 11.5 (29.2) >>14 (35.6) 12.5 (31.8) 11.5 (29.2)
San Joaquin 8,750 >>14 (35.6) 13 (33.0) 12 (30.5) >>14 (35.6) 13 (33.0) 12 (30.5)San Joaquin 17,500 >>14 (35.6) 14 (35.6) 12.5 (31.8) >>14 (35.6) 14 (35.6) 12.5 (31.8)
800 (5.52)
170 (461) 350 (950) 640 (1737)11.5 (29.2) 10.5 (26.7) 9.5 (24.1)12.5 (31.8) 11 (27.9) 10.5 (26.7)10.5 (26.7) 9 (22.9) 8.5 (21.6)11 (27.9) 9.5 (24.1) 9 (22.9)11 (27.9) 10 (24.1) 9.5 (24.1)
11.5 (29.2) 10 (24.1) 9.5 (24.1)
800 (5.52)
170 (461) 350 (950) 640 (1737)>>14 (35.6) 12.5 (31.8) 12 (30.5)>>14 (35.6) 13.5 (34.3) 12.5 (31.8)13.5 (34.3) 12 (30.5) 11 (27.9)>>14 (35.6) 12.5 (31.8) 11.5 (29.2)>>14 (35.6) 13 (33.0) 12 (30.5)>>14 (35.6) 14 (35.6) 12.5 (31.8)
98
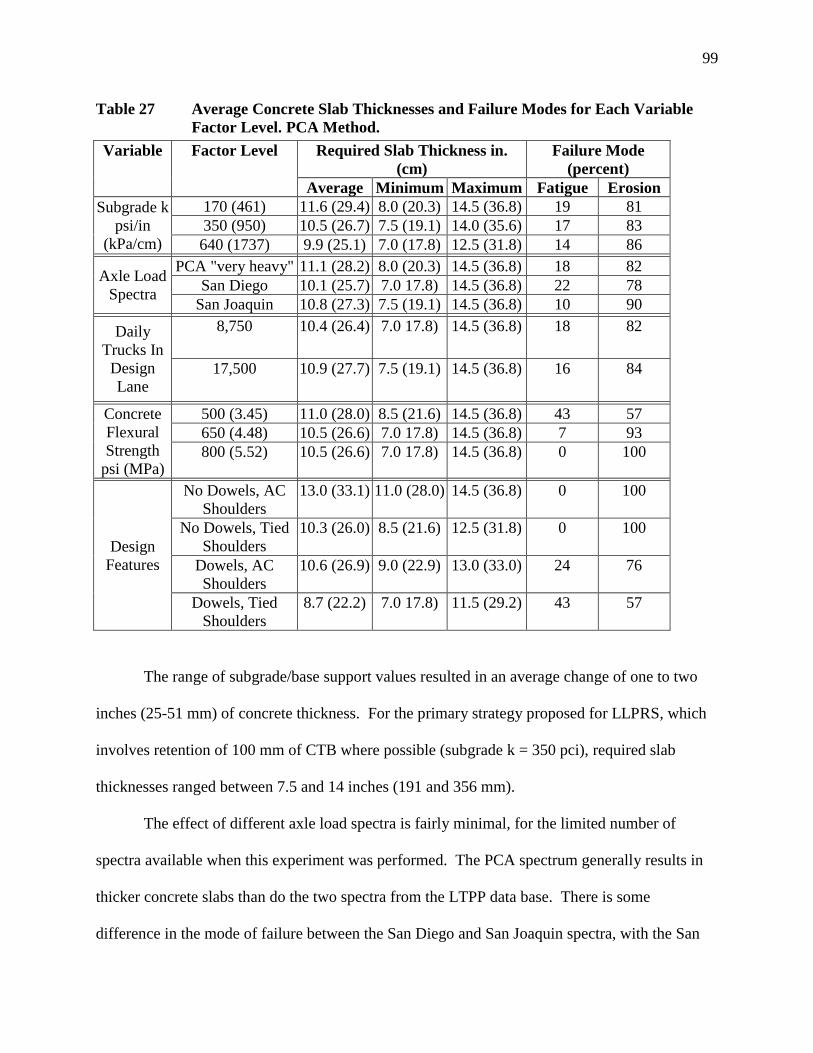
99
Table 27 Average Concrete Slab Thicknesses and Failure Modes for Each VariableFactor Level. PCA Method.
Required Slab Thickness in.(cm)
Failure Mode(percent)
Variable Factor Level
Average Minimum Maximum Fatigue Erosion170 (461) 11.6 (29.4) 8.0 (20.3) 14.5 (36.8) 19 81350 (950) 10.5 (26.7) 7.5 (19.1) 14.0 (35.6) 17 83
Subgrade kpsi/in
(kPa/cm) 640 (1737) 9.9 (25.1) 7.0 (17.8) 12.5 (31.8) 14 86PCA "very heavy" 11.1 (28.2) 8.0 (20.3) 14.5 (36.8) 18 82
San Diego 10.1 (25.7) 7.0 17.8) 14.5 (36.8) 22 78Axle LoadSpectra San Joaquin 10.8 (27.3) 7.5 (19.1) 14.5 (36.8) 10 90
8,750 10.4 (26.4) 7.0 17.8) 14.5 (36.8) 18 82DailyTrucks In
DesignLane
17,500 10.9 (27.7) 7.5 (19.1) 14.5 (36.8) 16 84
500 (3.45) 11.0 (28.0) 8.5 (21.6) 14.5 (36.8) 43 57650 (4.48) 10.5 (26.6) 7.0 17.8) 14.5 (36.8) 7 93
ConcreteFlexuralStrength
psi (MPa)800 (5.52) 10.5 (26.6) 7.0 17.8) 14.5 (36.8) 0 100
No Dowels, ACShoulders
13.0 (33.1) 11.0 (28.0) 14.5 (36.8) 0 100
No Dowels, TiedShoulders
10.3 (26.0) 8.5 (21.6) 12.5 (31.8) 0 100
Dowels, ACShoulders
10.6 (26.9) 9.0 (22.9) 13.0 (33.0) 24 76Design
Features
Dowels, TiedShoulders
8.7 (22.2) 7.0 17.8) 11.5 (29.2) 43 57
The range of subgrade/base support values resulted in an average change of one to two
inches (25-51 mm) of concrete thickness. For the primary strategy proposed for LLPRS, which
involves retention of 100 mm of CTB where possible (subgrade k = 350 pci), required slab
thicknesses ranged between 7.5 and 14 inches (191 and 356 mm).
The effect of different axle load spectra is fairly minimal, for the limited number of
spectra available when this experiment was performed. The PCA spectrum generally results in
thicker concrete slabs than do the two spectra from the LTPP data base. There is some
difference in the mode of failure between the San Diego and San Joaquin spectra, with the San
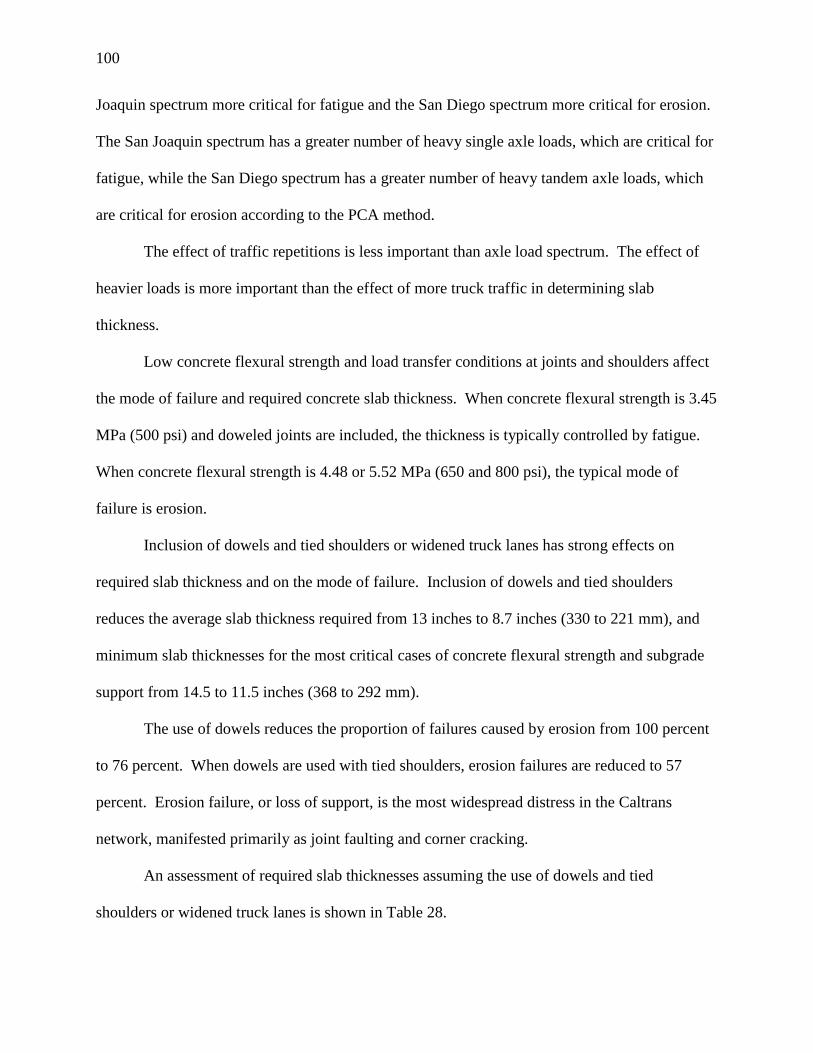
100
Joaquin spectrum more critical for fatigue and the San Diego spectrum more critical for erosion.
The San Joaquin spectrum has a greater number of heavy single axle loads, which are critical for
fatigue, while the San Diego spectrum has a greater number of heavy tandem axle loads, which
are critical for erosion according to the PCA method.
The effect of traffic repetitions is less important than axle load spectrum. The effect of
heavier loads is more important than the effect of more truck traffic in determining slab
thickness.
Low concrete flexural strength and load transfer conditions at joints and shoulders affect
the mode of failure and required concrete slab thickness. When concrete flexural strength is 3.45
MPa (500 psi) and doweled joints are included, the thickness is typically controlled by fatigue.
When concrete flexural strength is 4.48 or 5.52 MPa (650 and 800 psi), the typical mode of
failure is erosion.
Inclusion of dowels and tied shoulders or widened truck lanes has strong effects on
required slab thickness and on the mode of failure. Inclusion of dowels and tied shoulders
reduces the average slab thickness required from 13 inches to 8.7 inches (330 to 221 mm), and
minimum slab thicknesses for the most critical cases of concrete flexural strength and subgrade
support from 14.5 to 11.5 inches (368 to 292 mm).
The use of dowels reduces the proportion of failures caused by erosion from 100 percent
to 76 percent. When dowels are used with tied shoulders, erosion failures are reduced to 57
percent. Erosion failure, or loss of support, is the most widespread distress in the Caltrans
network, manifested primarily as joint faulting and corner cracking.
An assessment of required slab thicknesses assuming the use of dowels and tied
shoulders or widened truck lanes is shown in Table 28.
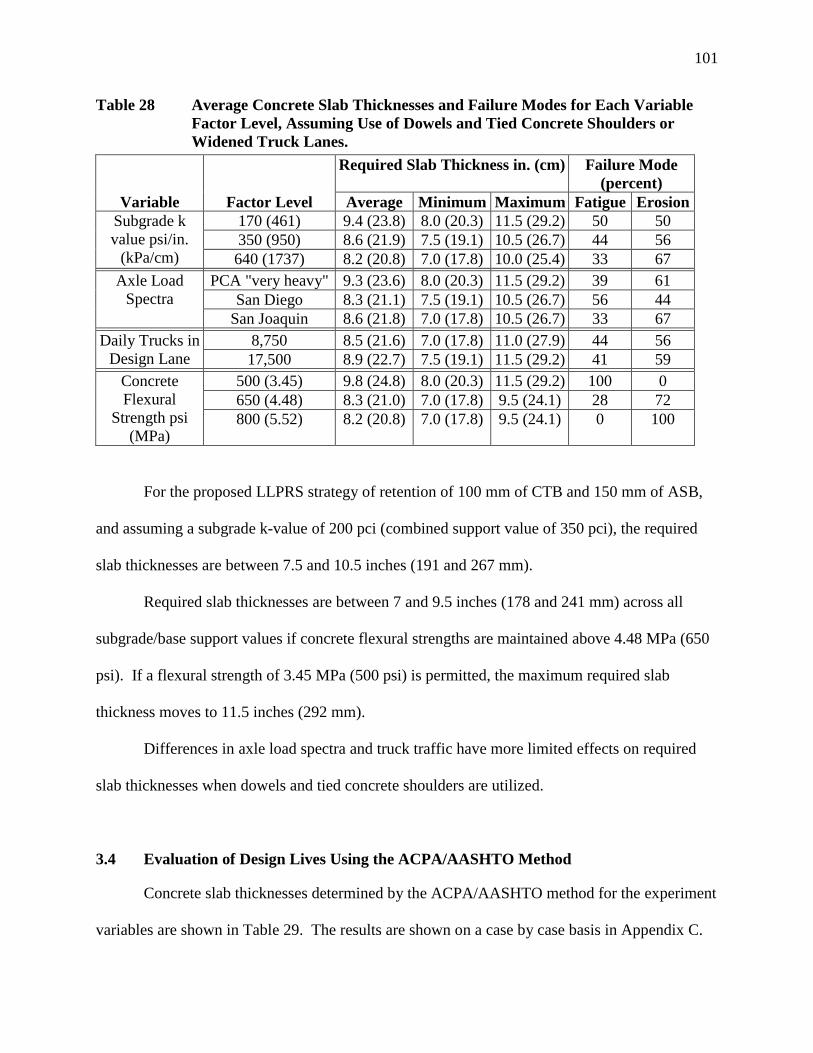
101
Table 28 Average Concrete Slab Thicknesses and Failure Modes for Each VariableFactor Level, Assuming Use of Dowels and Tied Concrete Shoulders orWidened Truck Lanes.
Required Slab Thickness in. (cm) Failure Mode(percent)
Variable Factor Level Average Minimum Maximum Fatigue Erosion170 (461) 9.4 (23.8) 8.0 (20.3) 11.5 (29.2) 50 50350 (950) 8.6 (21.9) 7.5 (19.1) 10.5 (26.7) 44 56
Subgrade kvalue psi/in.
(kPa/cm) 640 (1737) 8.2 (20.8) 7.0 (17.8) 10.0 (25.4) 33 67PCA "very heavy" 9.3 (23.6) 8.0 (20.3) 11.5 (29.2) 39 61
San Diego 8.3 (21.1) 7.5 (19.1) 10.5 (26.7) 56 44Axle Load
SpectraSan Joaquin 8.6 (21.8) 7.0 (17.8) 10.5 (26.7) 33 67
8,750 8.5 (21.6) 7.0 (17.8) 11.0 (27.9) 44 56Daily Trucks inDesign Lane 17,500 8.9 (22.7) 7.5 (19.1) 11.5 (29.2) 41 59
500 (3.45) 9.8 (24.8) 8.0 (20.3) 11.5 (29.2) 100 0650 (4.48) 8.3 (21.0) 7.0 (17.8) 9.5 (24.1) 28 72
ConcreteFlexural
Strength psi(MPa)
800 (5.52) 8.2 (20.8) 7.0 (17.8) 9.5 (24.1) 0 100
For the proposed LLPRS strategy of retention of 100 mm of CTB and 150 mm of ASB,
and assuming a subgrade k-value of 200 pci (combined support value of 350 pci), the required
slab thicknesses are between 7.5 and 10.5 inches (191 and 267 mm).
Required slab thicknesses are between 7 and 9.5 inches (178 and 241 mm) across all
subgrade/base support values if concrete flexural strengths are maintained above 4.48 MPa (650
psi). If a flexural strength of 3.45 MPa (500 psi) is permitted, the maximum required slab
thickness moves to 11.5 inches (292 mm).
Differences in axle load spectra and truck traffic have more limited effects on required
slab thicknesses when dowels and tied concrete shoulders are utilized.
3.4 Evaluation of Design Lives Using the ACPA/AASHTO Method
Concrete slab thicknesses determined by the ACPA/AASHTO method for the experiment
variables are shown in Table 29. The results are shown on a case by case basis in Appendix C.

102
The slab thicknesses are given in inches because these are the units used by the software. The
maximum slab thickness permitted in the ACPA/AASHTO method is 20 inches, as opposed to
14.5 inches in the PCA method. The 20-inch maximum thickness is an indication of the
maximum extent to which the design method is intended to be extrapolated. Many cases resulted
in the design method calling for this maximum thickness.
Table 29 shows that with 100 mm of CTB and 150 mm of ASB, slab thicknesses range
between 13.2 and 20 inches (335 and 508 mm), assuming a subgrade k-value of 200 pci
(combined k value of 353 pci). This would be the concrete thicknesses required using this
procedure if Caltrans decided not to disturb the existing CTB and ASB. Slab thickness is
dependent primarily upon the drainage coefficient, inclusion of dowels and tied concrete
shoulders, truck traffic level, and concrete flexural strength. It is dependent to a lesser extent
upon axle load spectra and subgrade/base support.
Table 30 includes average, minimum, and maximum slab thicknesses for each variable
and factor level.
Drainage condition has a significant effect on the required slab thicknesses. Between
drainage coefficients of 0.8 and 1.2, the average slab thickness decreases from 17.9 to 15 inches
(455 to 381 mm). Drainage condition is not considered in the calculation of slab thickness in the
PCA method.
The addition of dowels and tied shoulders reduces required slab thickness by about 3
inches (76 mm) on average, compared to aggregate interlock joints and asphalt concrete
shoulders. The inclusion of dowels alone on average reduces slab thickness by about 2 inches
(51 mm). The inclusion of tied shoulders alone on average reduces slab thickness by about 1
inch (25 mm).
103
Table 29 Concrete Slab Thicknesses from ACPA/AASHTO Method, in. (cm).Dowels and Tied Shoulders J = 2.7Coefficient of
Drainage = 0.8 PCC Modulus of Rupture psi (MPa)Reliability = 95% 500 (3.45) 650 (4.48) 800 (5.52)
Concrete Modulus of Elasticity Epcc (psi)
3,375,000 4,388,000 5,400,000Subgrade/Base k (psi/in.)
Axle LoadsLocation
Trucksin
DesignLane
per Day100 353 457 100 353 457 100 353 457
PCA 8,750 17.2(43.7)
16.5(41.9)
16.4(41.7)
15.2(38.6)
14.6(37.1)
14.5(36.8)
13.8(35.1)
13.2(33.5)
13.1(33.3)
PCA 17,500 19.0(48.3)
18.4(46.7)
18.2(4.2)
16.8(42.7)
16.2(41.1)
16.0(40.6)
15.2(38.6)
14.7(37.3)
14.5(36.8)
San Diego 8,750 17.2(43.7)
16.5(41.9)
16.4(41.7)
15.2(38.6)
14.6(37.1)
14.4(36.6)
13.7(34.8)
13.2(33.5)
13.0(33.0)
San Diego 17,500 19.0(48.3)
18.4(46.7)
18.2(46.2)
16.8(42.7)
16.2(41.1)
16.0(40.6)
15.2(38.6)
14.7(37.3)
14.5(36.8)
San Joaquin 8,750 19.2(48.8)
18.5(47.0)
18.5(47.0)
16.9(42.9)
16.3(41.4)
16.2(41.1)
15.3(38.9)
14.8(37.6)
14.6(37.1)
San Joaquin 17,500 20.0(50.8)
20.0(50.8)
20.0(50.8)
18.7(47.5)
18.1(46.0)
18.0(45.7)
17.0(43.2)
16.4(41.7)
16.3(41.4)
Dowels and No Tied Shoulders J = 3.2Coefficient ofDrainage = 0.8 PCC Modulus of Rupture (psi)
Reliability = 95% 500 (3.45) 650 (4.48) 800 (5.52)Concrete Modulus of Elasticity Epcc (psi)
3,375,000 4,388,000 5,400,000Subgrade/Base k (psi/in.)
Axle LoadsLocation
Trucksin
DesignLane
per Day100 353 457 100 353 457 100 353 457
PCA 8,750 18.7(47.5)
18.1(46.0)
17.9(45.5)
16.5(41.9)
16.0(40.6)
15.8(40.1)
15.0(38.1)
14.4(36.6)
14.3(36.3)
PCA 17,500 20.0(50.8)
20.0(50.8)
19.9(50.5)
18.3(46.5)
17.7(45.0)
17.5(44.5)
16.6(42.2)
16.0(40.6)
15.9(40.1)
San Diego 8,750 18.7(47.5)
18.1(46.0)
17.9(45.5)
16.5(41.9)
15.9(40.1)
15.8(40.1)
15.0(38.1)
14.4(36.6)
14.3(36.3)
San Diego 17,500 20.0(50.8)
20.0(50.8)
19.9(50.5)
18.3(46.5)
17.7(45.0)
17.5(44.5)
16.5(41.9)
16.0(40.6)
15.9(40.1)
San Joaquin 8,750 20.0(50.8)
20.0(50.8)
20.0(50.8)
18.4(46.7)
17.8(45.2)
17.7(45.0)
16.7(42.4)
16.1(40.9)
16.0(40.6)
San Joaquin 17,500 20.0(50.8)
20.0(50.8)
20.0(50.8)
20.0(50.8)
19.8(50.3)
19.6(49.8)
18.4(46.7)
17.9(45.5)
17.7(45.0)
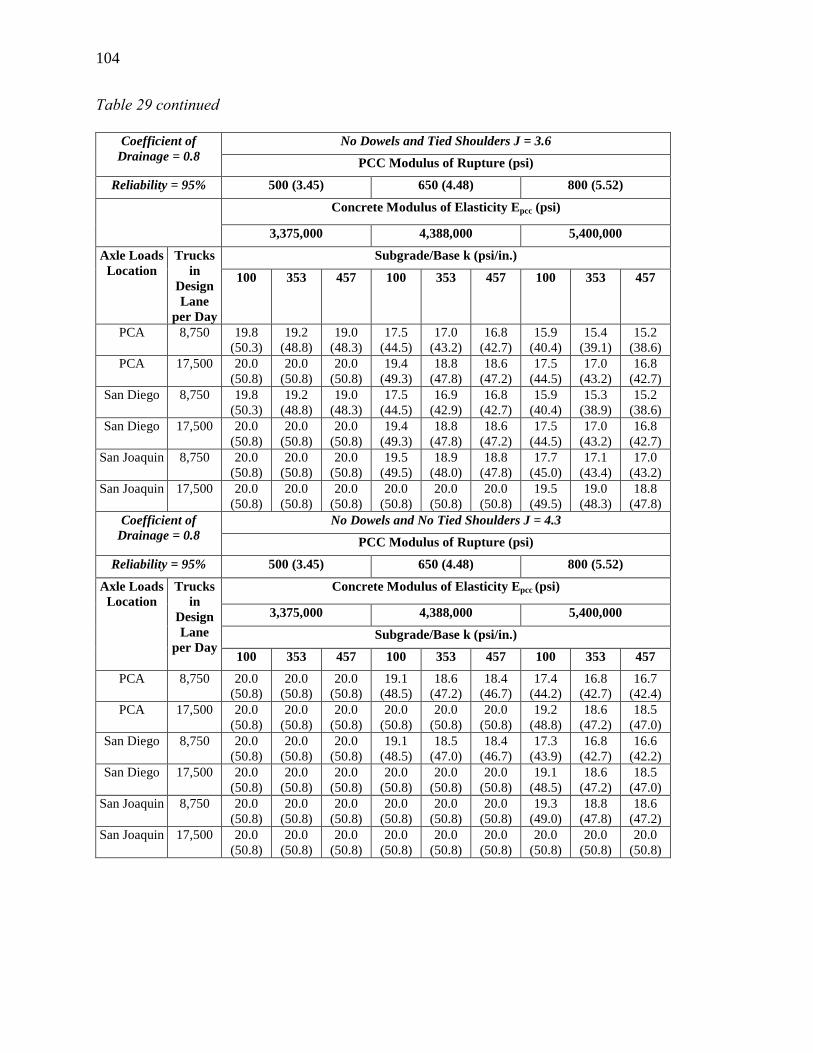
104
Table 29 continued
No Dowels and Tied Shoulders J = 3.6Coefficient ofDrainage = 0.8 PCC Modulus of Rupture (psi)
Reliability = 95% 500 (3.45) 650 (4.48) 800 (5.52)
Concrete Modulus of Elasticity Epcc (psi)
3,375,000 4,388,000 5,400,000Subgrade/Base k (psi/in.)Axle Loads
LocationTrucks
inDesignLane
per Day
100 353 457 100 353 457 100 353 457
PCA 8,750 19.8(50.3)
19.2(48.8)
19.0(48.3)
17.5(44.5)
17.0(43.2)
16.8(42.7)
15.9(40.4)
15.4(39.1)
15.2(38.6)
PCA 17,500 20.0(50.8)
20.0(50.8)
20.0(50.8)
19.4(49.3)
18.8(47.8)
18.6(47.2)
17.5(44.5)
17.0(43.2)
16.8(42.7)
San Diego 8,750 19.8(50.3)
19.2(48.8)
19.0(48.3)
17.5(44.5)
16.9(42.9)
16.8(42.7)
15.9(40.4)
15.3(38.9)
15.2(38.6)
San Diego 17,500 20.0(50.8)
20.0(50.8)
20.0(50.8)
19.4(49.3)
18.8(47.8)
18.6(47.2)
17.5(44.5)
17.0(43.2)
16.8(42.7)
San Joaquin 8,750 20.0(50.8)
20.0(50.8)
20.0(50.8)
19.5(49.5)
18.9(48.0)
18.8(47.8)
17.7(45.0)
17.1(43.4)
17.0(43.2)
San Joaquin 17,500 20.0(50.8)
20.0(50.8)
20.0(50.8)
20.0(50.8)
20.0(50.8)
20.0(50.8)
19.5(49.5)
19.0(48.3)
18.8(47.8)
No Dowels and No Tied Shoulders J = 4.3Coefficient ofDrainage = 0.8 PCC Modulus of Rupture (psi)
Reliability = 95% 500 (3.45) 650 (4.48) 800 (5.52)
Concrete Modulus of Elasticity Epcc (psi)
3,375,000 4,388,000 5,400,000Subgrade/Base k (psi/in.)
Axle LoadsLocation
Trucksin
DesignLane
per Day100 353 457 100 353 457 100 353 457
PCA 8,750 20.0(50.8)
20.0(50.8)
20.0(50.8)
19.1(48.5)
18.6(47.2)
18.4(46.7)
17.4(44.2)
16.8(42.7)
16.7(42.4)
PCA 17,500 20.0(50.8)
20.0(50.8)
20.0(50.8)
20.0(50.8)
20.0(50.8)
20.0(50.8)
19.2(48.8)
18.6(47.2)
18.5(47.0)
San Diego 8,750 20.0(50.8)
20.0(50.8)
20.0(50.8)
19.1(48.5)
18.5(47.0)
18.4(46.7)
17.3(43.9)
16.8(42.7)
16.6(42.2)
San Diego 17,500 20.0(50.8)
20.0(50.8)
20.0(50.8)
20.0(50.8)
20.0(50.8)
20.0(50.8)
19.1(48.5)
18.6(47.2)
18.5(47.0)
San Joaquin 8,750 20.0(50.8)
20.0(50.8)
20.0(50.8)
20.0(50.8)
20.0(50.8)
20.0(50.8)
19.3(49.0)
18.8(47.8)
18.6(47.2)
San Joaquin 17,500 20.0(50.8)
20.0(50.8)
20.0(50.8)
20.0(50.8)
20.0(50.8)
20.0(50.8)
20.0(50.8)
20.0(50.8)
20.0(50.8)
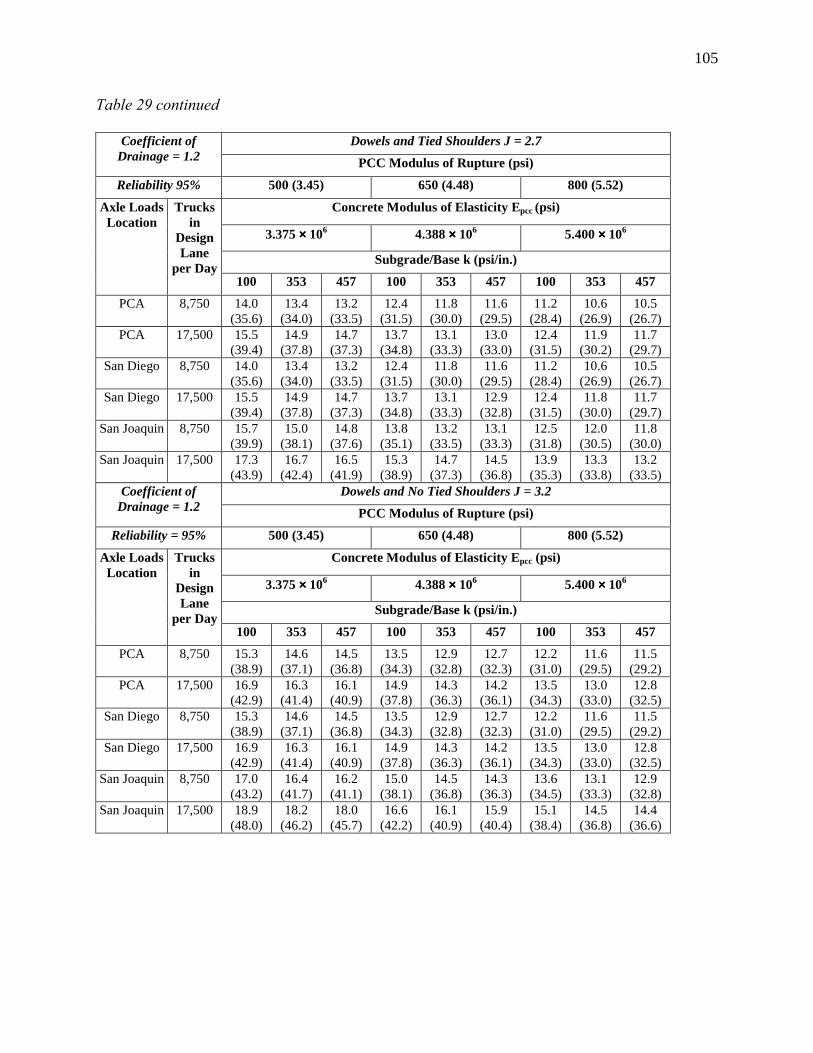
105
Table 29 continued
Dowels and Tied Shoulders J = 2.7Coefficient ofDrainage = 1.2 PCC Modulus of Rupture (psi)Reliability 95% 500 (3.45) 650 (4.48) 800 (5.52)
Concrete Modulus of Elasticity Epcc (psi)
3.375 ×××× 106 4.388 ×××× 106 5.400 ×××× 106
Subgrade/Base k (psi/in.)
Axle LoadsLocation
Trucksin
DesignLane
per Day100 353 457 100 353 457 100 353 457
PCA 8,750 14.0(35.6)
13.4(34.0)
13.2(33.5)
12.4(31.5)
11.8(30.0)
11.6(29.5)
11.2(28.4)
10.6(26.9)
10.5(26.7)
PCA 17,500 15.5(39.4)
14.9(37.8)
14.7(37.3)
13.7(34.8)
13.1(33.3)
13.0(33.0)
12.4(31.5)
11.9(30.2)
11.7(29.7)
San Diego 8,750 14.0(35.6)
13.4(34.0)
13.2(33.5)
12.4(31.5)
11.8(30.0)
11.6(29.5)
11.2(28.4)
10.6(26.9)
10.5(26.7)
San Diego 17,500 15.5(39.4)
14.9(37.8)
14.7(37.3)
13.7(34.8)
13.1(33.3)
12.9(32.8)
12.4(31.5)
11.8(30.0)
11.7(29.7)
San Joaquin 8,750 15.7(39.9)
15.0(38.1)
14.8(37.6)
13.8(35.1)
13.2(33.5)
13.1(33.3)
12.5(31.8)
12.0(30.5)
11.8(30.0)
San Joaquin 17,500 17.3(43.9)
16.7(42.4)
16.5(41.9)
15.3(38.9)
14.7(37.3)
14.5(36.8)
13.9(35.3)
13.3(33.8)
13.2(33.5)
Dowels and No Tied Shoulders J = 3.2Coefficient ofDrainage = 1.2 PCC Modulus of Rupture (psi)
Reliability = 95% 500 (3.45) 650 (4.48) 800 (5.52)
Concrete Modulus of Elasticity Epcc (psi)
3.375 ×××× 106 4.388 ×××× 106 5.400 ×××× 106
Subgrade/Base k (psi/in.)
Axle LoadsLocation
Trucksin
DesignLane
per Day100 353 457 100 353 457 100 353 457
PCA 8,750 15.3(38.9)
14.6(37.1)
14.5(36.8)
13.5(34.3)
12.9(32.8)
12.7(32.3)
12.2(31.0)
11.6(29.5)
11.5(29.2)
PCA 17,500 16.9(42.9)
16.3(41.4)
16.1(40.9)
14.9(37.8)
14.3(36.3)
14.2(36.1)
13.5(34.3)
13.0(33.0)
12.8(32.5)
San Diego 8,750 15.3(38.9)
14.6(37.1)
14.5(36.8)
13.5(34.3)
12.9(32.8)
12.7(32.3)
12.2(31.0)
11.6(29.5)
11.5(29.2)
San Diego 17,500 16.9(42.9)
16.3(41.4)
16.1(40.9)
14.9(37.8)
14.3(36.3)
14.2(36.1)
13.5(34.3)
13.0(33.0)
12.8(32.5)
San Joaquin 8,750 17.0(43.2)
16.4(41.7)
16.2(41.1)
15.0(38.1)
14.5(36.8)
14.3(36.3)
13.6(34.5)
13.1(33.3)
12.9(32.8)
San Joaquin 17,500 18.9(48.0)
18.2(46.2)
18.0(45.7)
16.6(42.2)
16.1(40.9)
15.9(40.4)
15.1(38.4)
14.5(36.8)
14.4(36.6)
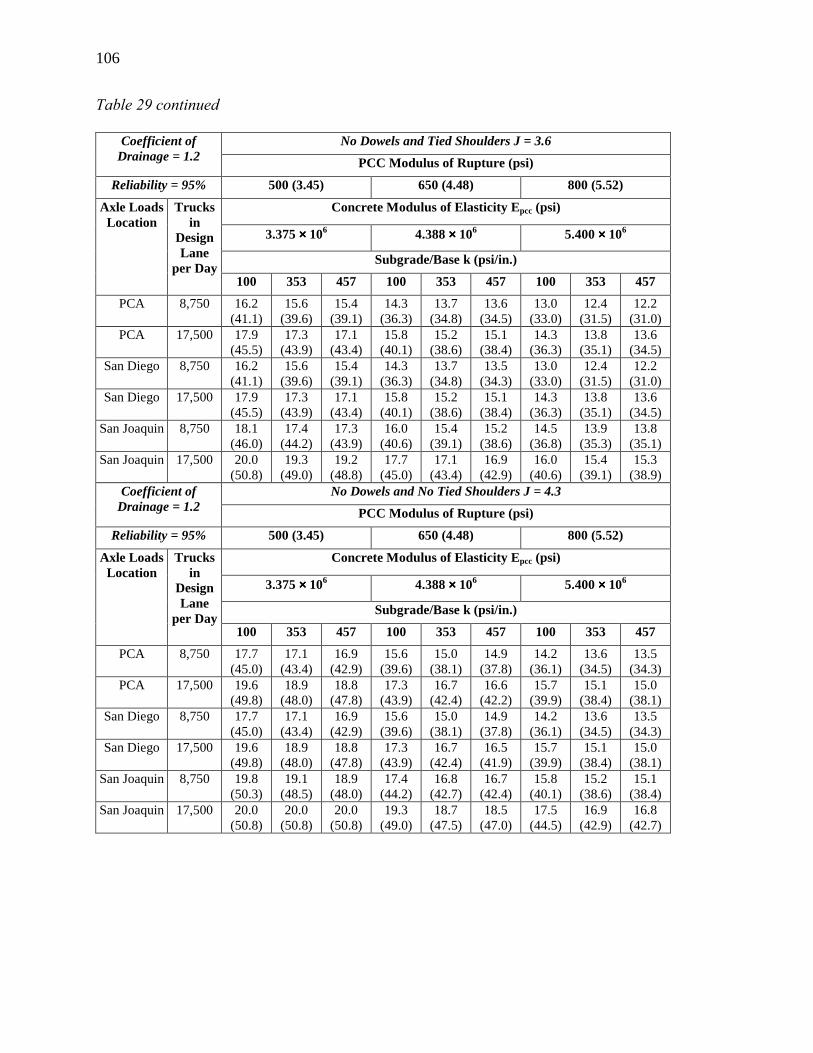
106
Table 29 continued
No Dowels and Tied Shoulders J = 3.6Coefficient ofDrainage = 1.2 PCC Modulus of Rupture (psi)
Reliability = 95% 500 (3.45) 650 (4.48) 800 (5.52)
Concrete Modulus of Elasticity Epcc (psi)
3.375 ×××× 106 4.388 ×××× 106 5.400 ×××× 106
Subgrade/Base k (psi/in.)
Axle LoadsLocation
Trucksin
DesignLane
per Day100 353 457 100 353 457 100 353 457
PCA 8,750 16.2(41.1)
15.6(39.6)
15.4(39.1)
14.3(36.3)
13.7(34.8)
13.6(34.5)
13.0(33.0)
12.4(31.5)
12.2(31.0)
PCA 17,500 17.9(45.5)
17.3(43.9)
17.1(43.4)
15.8(40.1)
15.2(38.6)
15.1(38.4)
14.3(36.3)
13.8(35.1)
13.6(34.5)
San Diego 8,750 16.2(41.1)
15.6(39.6)
15.4(39.1)
14.3(36.3)
13.7(34.8)
13.5(34.3)
13.0(33.0)
12.4(31.5)
12.2(31.0)
San Diego 17,500 17.9(45.5)
17.3(43.9)
17.1(43.4)
15.8(40.1)
15.2(38.6)
15.1(38.4)
14.3(36.3)
13.8(35.1)
13.6(34.5)
San Joaquin 8,750 18.1(46.0)
17.4(44.2)
17.3(43.9)
16.0(40.6)
15.4(39.1)
15.2(38.6)
14.5(36.8)
13.9(35.3)
13.8(35.1)
San Joaquin 17,500 20.0(50.8)
19.3(49.0)
19.2(48.8)
17.7(45.0)
17.1(43.4)
16.9(42.9)
16.0(40.6)
15.4(39.1)
15.3(38.9)
No Dowels and No Tied Shoulders J = 4.3Coefficient ofDrainage = 1.2 PCC Modulus of Rupture (psi)
Reliability = 95% 500 (3.45) 650 (4.48) 800 (5.52)
Concrete Modulus of Elasticity Epcc (psi)
3.375 ×××× 106 4.388 ×××× 106 5.400 ×××× 106
Subgrade/Base k (psi/in.)
Axle LoadsLocation
Trucksin
DesignLane
per Day100 353 457 100 353 457 100 353 457
PCA 8,750 17.7(45.0)
17.1(43.4)
16.9(42.9)
15.6(39.6)
15.0(38.1)
14.9(37.8)
14.2(36.1)
13.6(34.5)
13.5(34.3)
PCA 17,500 19.6(49.8)
18.9(48.0)
18.8(47.8)
17.3(43.9)
16.7(42.4)
16.6(42.2)
15.7(39.9)
15.1(38.4)
15.0(38.1)
San Diego 8,750 17.7(45.0)
17.1(43.4)
16.9(42.9)
15.6(39.6)
15.0(38.1)
14.9(37.8)
14.2(36.1)
13.6(34.5)
13.5(34.3)
San Diego 17,500 19.6(49.8)
18.9(48.0)
18.8(47.8)
17.3(43.9)
16.7(42.4)
16.5(41.9)
15.7(39.9)
15.1(38.4)
15.0(38.1)
San Joaquin 8,750 19.8(50.3)
19.1(48.5)
18.9(48.0)
17.4(44.2)
16.8(42.7)
16.7(42.4)
15.8(40.1)
15.2(38.6)
15.1(38.4)
San Joaquin 17,500 20.0(50.8)
20.0(50.8)
20.0(50.8)
19.3(49.0)
18.7(47.5)
18.5(47.0)
17.5(44.5)
16.9(42.9)
16.8(42.7)
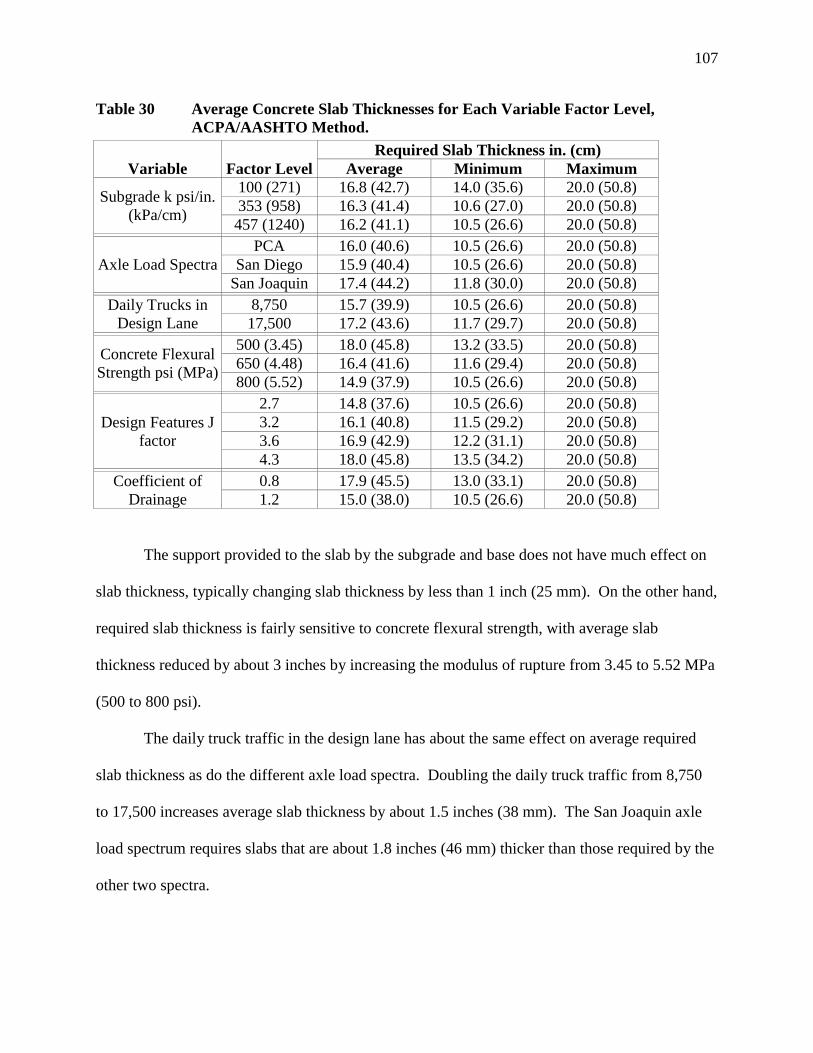
107
Table 30 Average Concrete Slab Thicknesses for Each Variable Factor Level,ACPA/AASHTO Method.
Required Slab Thickness in. (cm)Variable Factor Level Average Minimum Maximum
100 (271) 16.8 (42.7) 14.0 (35.6) 20.0 (50.8)353 (958) 16.3 (41.4) 10.6 (27.0) 20.0 (50.8)Subgrade k psi/in.
(kPa/cm) 457 (1240) 16.2 (41.1) 10.5 (26.6) 20.0 (50.8)PCA 16.0 (40.6) 10.5 (26.6) 20.0 (50.8)
San Diego 15.9 (40.4) 10.5 (26.6) 20.0 (50.8)Axle Load SpectraSan Joaquin 17.4 (44.2) 11.8 (30.0) 20.0 (50.8)
8,750 15.7 (39.9) 10.5 (26.6) 20.0 (50.8)Daily Trucks inDesign Lane 17,500 17.2 (43.6) 11.7 (29.7) 20.0 (50.8)
500 (3.45) 18.0 (45.8) 13.2 (33.5) 20.0 (50.8)650 (4.48) 16.4 (41.6) 11.6 (29.4) 20.0 (50.8)Concrete Flexural
Strength psi (MPa) 800 (5.52) 14.9 (37.9) 10.5 (26.6) 20.0 (50.8)2.7 14.8 (37.6) 10.5 (26.6) 20.0 (50.8)3.2 16.1 (40.8) 11.5 (29.2) 20.0 (50.8)3.6 16.9 (42.9) 12.2 (31.1) 20.0 (50.8)
Design Features Jfactor
4.3 18.0 (45.8) 13.5 (34.2) 20.0 (50.8)0.8 17.9 (45.5) 13.0 (33.1) 20.0 (50.8)Coefficient of
Drainage 1.2 15.0 (38.0) 10.5 (26.6) 20.0 (50.8)
The support provided to the slab by the subgrade and base does not have much effect on
slab thickness, typically changing slab thickness by less than 1 inch (25 mm). On the other hand,
required slab thickness is fairly sensitive to concrete flexural strength, with average slab
thickness reduced by about 3 inches by increasing the modulus of rupture from 3.45 to 5.52 MPa
(500 to 800 psi).
The daily truck traffic in the design lane has about the same effect on average required
slab thickness as do the different axle load spectra. Doubling the daily truck traffic from 8,750
to 17,500 increases average slab thickness by about 1.5 inches (38 mm). The San Joaquin axle
load spectrum requires slabs that are about 1.8 inches (46 mm) thicker than those required by the
other two spectra.
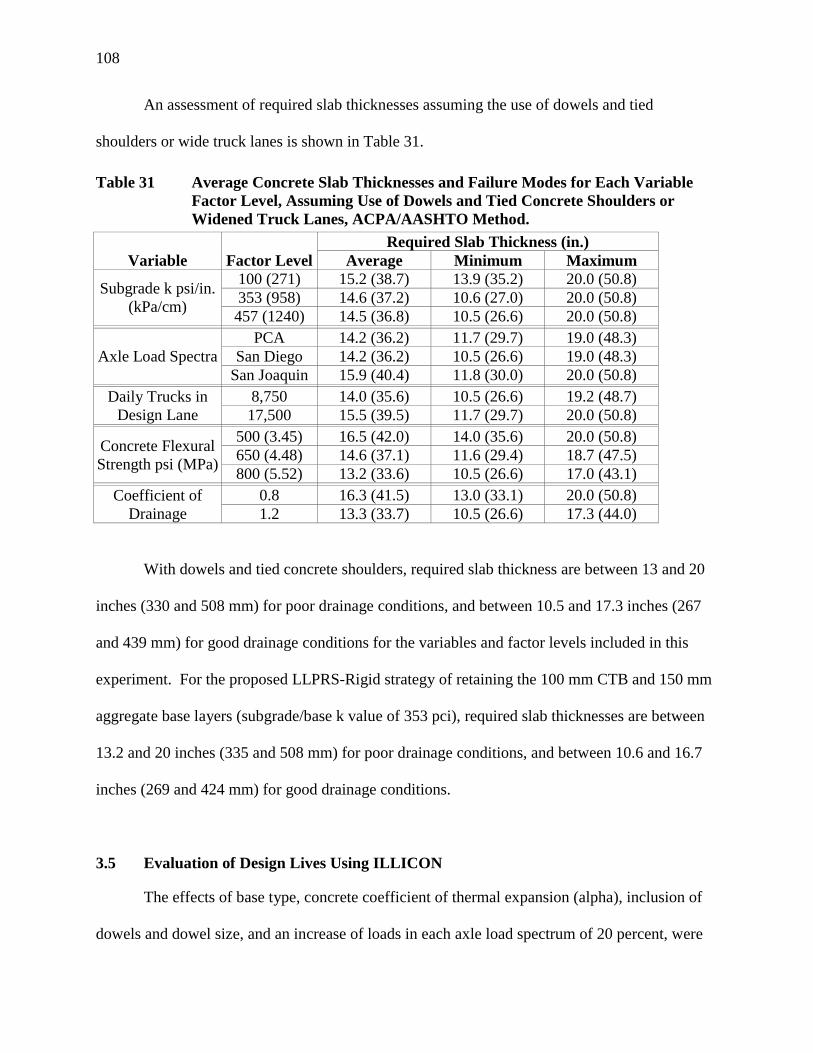
108
An assessment of required slab thicknesses assuming the use of dowels and tied
shoulders or wide truck lanes is shown in Table 31.
Table 31 Average Concrete Slab Thicknesses and Failure Modes for Each VariableFactor Level, Assuming Use of Dowels and Tied Concrete Shoulders orWidened Truck Lanes, ACPA/AASHTO Method.
Required Slab Thickness (in.)Variable Factor Level Average Minimum Maximum
100 (271) 15.2 (38.7) 13.9 (35.2) 20.0 (50.8)353 (958) 14.6 (37.2) 10.6 (27.0) 20.0 (50.8)Subgrade k psi/in.
(kPa/cm) 457 (1240) 14.5 (36.8) 10.5 (26.6) 20.0 (50.8)PCA 14.2 (36.2) 11.7 (29.7) 19.0 (48.3)
San Diego 14.2 (36.2) 10.5 (26.6) 19.0 (48.3)Axle Load SpectraSan Joaquin 15.9 (40.4) 11.8 (30.0) 20.0 (50.8)
8,750 14.0 (35.6) 10.5 (26.6) 19.2 (48.7)Daily Trucks inDesign Lane 17,500 15.5 (39.5) 11.7 (29.7) 20.0 (50.8)
500 (3.45) 16.5 (42.0) 14.0 (35.6) 20.0 (50.8)650 (4.48) 14.6 (37.1) 11.6 (29.4) 18.7 (47.5)Concrete Flexural
Strength psi (MPa) 800 (5.52) 13.2 (33.6) 10.5 (26.6) 17.0 (43.1)0.8 16.3 (41.5) 13.0 (33.1) 20.0 (50.8)Coefficient of
Drainage 1.2 13.3 (33.7) 10.5 (26.6) 17.3 (44.0)
With dowels and tied concrete shoulders, required slab thickness are between 13 and 20
inches (330 and 508 mm) for poor drainage conditions, and between 10.5 and 17.3 inches (267
and 439 mm) for good drainage conditions for the variables and factor levels included in this
experiment. For the proposed LLPRS-Rigid strategy of retaining the 100 mm CTB and 150 mm
aggregate base layers (subgrade/base k value of 353 pci), required slab thicknesses are between
13.2 and 20 inches (335 and 508 mm) for poor drainage conditions, and between 10.6 and 16.7
inches (269 and 424 mm) for good drainage conditions.
3.5 Evaluation of Design Lives Using ILLICON
The effects of base type, concrete coefficient of thermal expansion (alpha), inclusion of
dowels and dowel size, and an increase of loads in each axle load spectrum of 20 percent, were
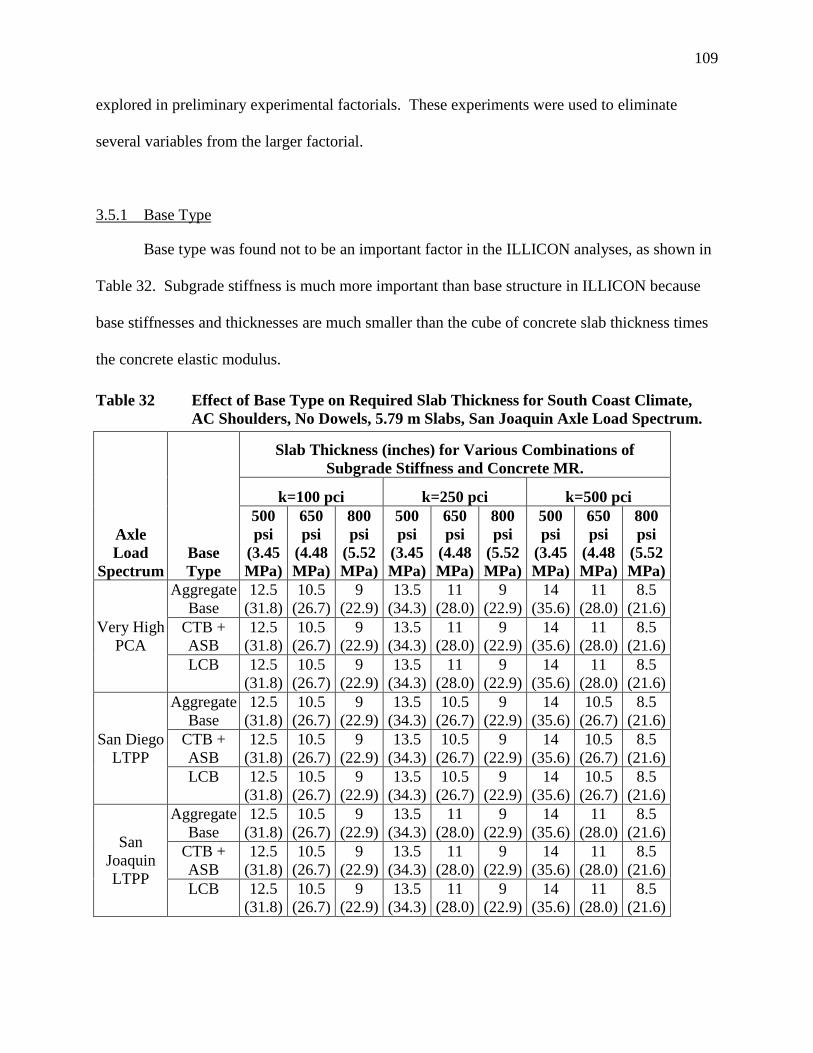
109
explored in preliminary experimental factorials. These experiments were used to eliminate
several variables from the larger factorial.
3.5.1 Base Type
Base type was found not to be an important factor in the ILLICON analyses, as shown in
Table 32. Subgrade stiffness is much more important than base structure in ILLICON because
base stiffnesses and thicknesses are much smaller than the cube of concrete slab thickness times
the concrete elastic modulus.
Table 32 Effect of Base Type on Required Slab Thickness for South Coast Climate,AC Shoulders, No Dowels, 5.79 m Slabs, San Joaquin Axle Load Spectrum.
Slab Thickness (inches) for Various Combinations ofSubgrade Stiffness and Concrete MR.
k=100 pci k=250 pci k=500 pci
AxleLoad
SpectrumBaseType
500psi
(3.45MPa)
650psi
(4.48MPa)
800psi
(5.52MPa)
500psi
(3.45MPa)
650psi
(4.48MPa)
800psi
(5.52MPa)
500psi
(3.45MPa)
650psi
(4.48MPa)
800psi
(5.52MPa)
AggregateBase
12.5(31.8)
10.5(26.7)
9(22.9)
13.5(34.3)
11(28.0)
9(22.9)
14(35.6)
11(28.0)
8.5(21.6)
CTB +ASB
12.5(31.8)
10.5(26.7)
9(22.9)
13.5(34.3)
11(28.0)
9(22.9)
14(35.6)
11(28.0)
8.5(21.6)
Very HighPCA
LCB 12.5(31.8)
10.5(26.7)
9(22.9)
13.5(34.3)
11(28.0)
9(22.9)
14(35.6)
11(28.0)
8.5(21.6)
AggregateBase
12.5(31.8)
10.5(26.7)
9(22.9)
13.5(34.3)
10.5(26.7)
9(22.9)
14(35.6)
10.5(26.7)
8.5(21.6)
CTB +ASB
12.5(31.8)
10.5(26.7)
9(22.9)
13.5(34.3)
10.5(26.7)
9(22.9)
14(35.6)
10.5(26.7)
8.5(21.6)
San DiegoLTPP
LCB 12.5(31.8)
10.5(26.7)
9(22.9)
13.5(34.3)
10.5(26.7)
9(22.9)
14(35.6)
10.5(26.7)
8.5(21.6)
AggregateBase
12.5(31.8)
10.5(26.7)
9(22.9)
13.5(34.3)
11(28.0)
9(22.9)
14(35.6)
11(28.0)
8.5(21.6)
CTB +ASB
12.5(31.8)
10.5(26.7)
9(22.9)
13.5(34.3)
11(28.0)
9(22.9)
14(35.6)
11(28.0)
8.5(21.6)
SanJoaquinLTPP LCB 12.5
(31.8)10.5
(26.7)9
(22.9)13.5
(34.3)11
(28.0)9
(22.9)14
(35.6)11
(28.0)8.5
(21.6)
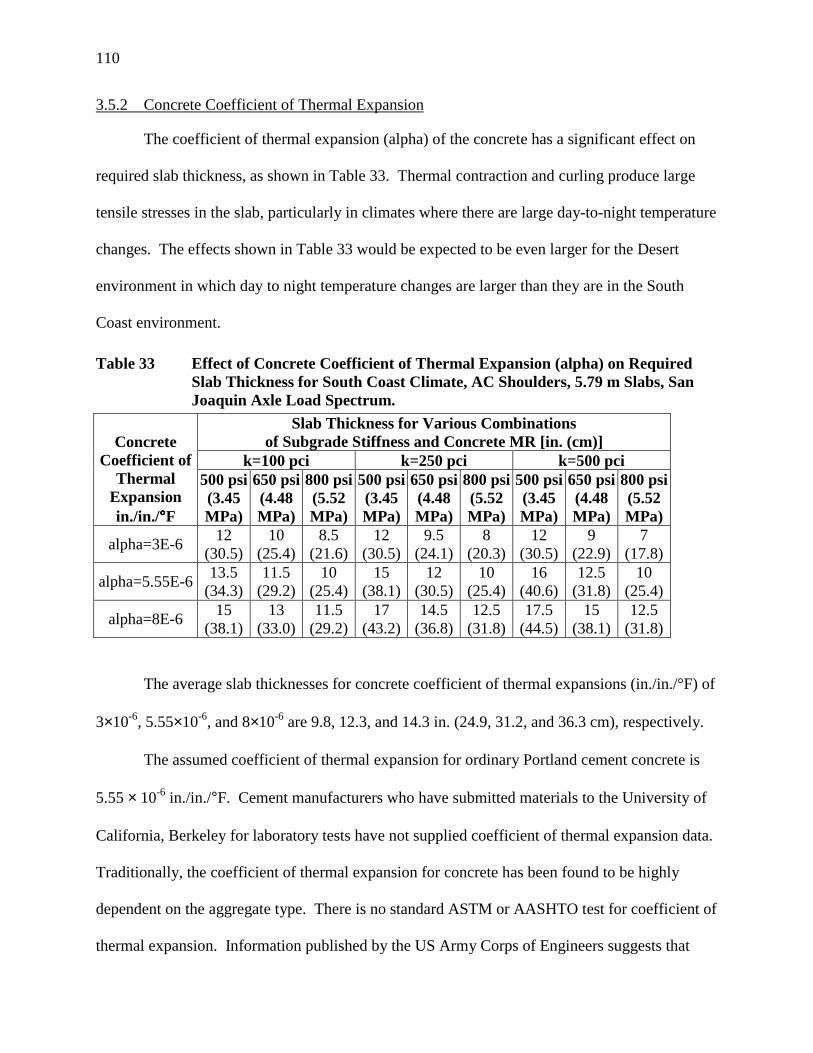
110
3.5.2 Concrete Coefficient of Thermal Expansion
The coefficient of thermal expansion (alpha) of the concrete has a significant effect on
required slab thickness, as shown in Table 33. Thermal contraction and curling produce large
tensile stresses in the slab, particularly in climates where there are large day-to-night temperature
changes. The effects shown in Table 33 would be expected to be even larger for the Desert
environment in which day to night temperature changes are larger than they are in the South
Coast environment.
Table 33 Effect of Concrete Coefficient of Thermal Expansion (alpha) on RequiredSlab Thickness for South Coast Climate, AC Shoulders, 5.79 m Slabs, SanJoaquin Axle Load Spectrum.
Slab Thickness for Various Combinationsof Subgrade Stiffness and Concrete MR [in. (cm)]
k=100 pci k=250 pci k=500 pciConcrete
Coefficient ofThermal
Expansionin./in./°°°°F
500 psi(3.45MPa)
650 psi(4.48MPa)
800 psi(5.52MPa)
500 psi(3.45MPa)
650 psi(4.48MPa)
800 psi(5.52MPa)
500 psi(3.45MPa)
650 psi(4.48MPa)
800 psi(5.52MPa)
alpha=3E-6 12(30.5)
10(25.4)
8.5(21.6)
12(30.5)
9.5(24.1)
8(20.3)
12(30.5)
9(22.9)
7(17.8)
alpha=5.55E-6 13.5(34.3)
11.5(29.2)
10(25.4)
15(38.1)
12(30.5)
10(25.4)
16(40.6)
12.5(31.8)
10(25.4)
alpha=8E-6 15(38.1)
13(33.0)
11.5(29.2)
17(43.2)
14.5(36.8)
12.5(31.8)
17.5(44.5)
15(38.1)
12.5(31.8)
The average slab thicknesses for concrete coefficient of thermal expansions (in./in./°F) of
3×10⁻⁶, 5.55×10⁻⁶, and 8×10⁻⁶ are 9.8, 12.3, and 14.3 in. (24.9, 31.2, and 36.3 cm), respectively.
The assumed coefficient of thermal expansion for ordinary Portland cement concrete is
5.55 × 10⁻⁶ in./in./°F. Cement manufacturers who have submitted materials to the University of
California, Berkeley for laboratory tests have not supplied coefficient of thermal expansion data.
Traditionally, the coefficient of thermal expansion for concrete has been found to be highly
dependent on the aggregate type. There is no standard ASTM or AASHTO test for coefficient of
thermal expansion. Information published by the US Army Corps of Engineers suggests that

111
some calcium sulfoaluminate cements may have larger coefficients than Portland cement,
however the corresponding data for concrete mixes was not included. (36)
The negative effects of a large coefficient of thermal expansion are made worse by stiffer
subgrades, which do not deform much when the slab curls. The result is that the slab is
unsupported by the curling, resulting in larger tensile stresses. Use of base materials that will
deform with the concrete slab when it curls, but that are not erodable under the effects of joint
movement and the presence of water, appears to be the best option.
3.5.3 Dowel Size
Dowel size and its effect on bearing stress at the concrete/dowel interface have
significant effects on the development of faulting, as is presented in Section 3.7 of this report.
However, the effects of dowels, and dowel size, on transverse fatigue cracking are relatively
minor according to the sensitivity study performed using ILLICON, as shown in Table 34. The
transverse joints, where dowels provide load transfer, are not the critical load locations for
fatigue cracking and are far enough away from the slab edge not to affect the maximum bending
stress.
3.5.4 Increased Axle Loads
The effect of an increase of all axle loads in the San Joaquin spectrum was evaluated for
4.57- and 5.79-m (15- and 19-ft.) slab lengths. The San Joaquin spectrum included the full set of
axle loads shown in Table 21, not the truncated spectrum. All axle loads were increased 20
percent. The number of repetitions was not increased, as shown in Table 35.
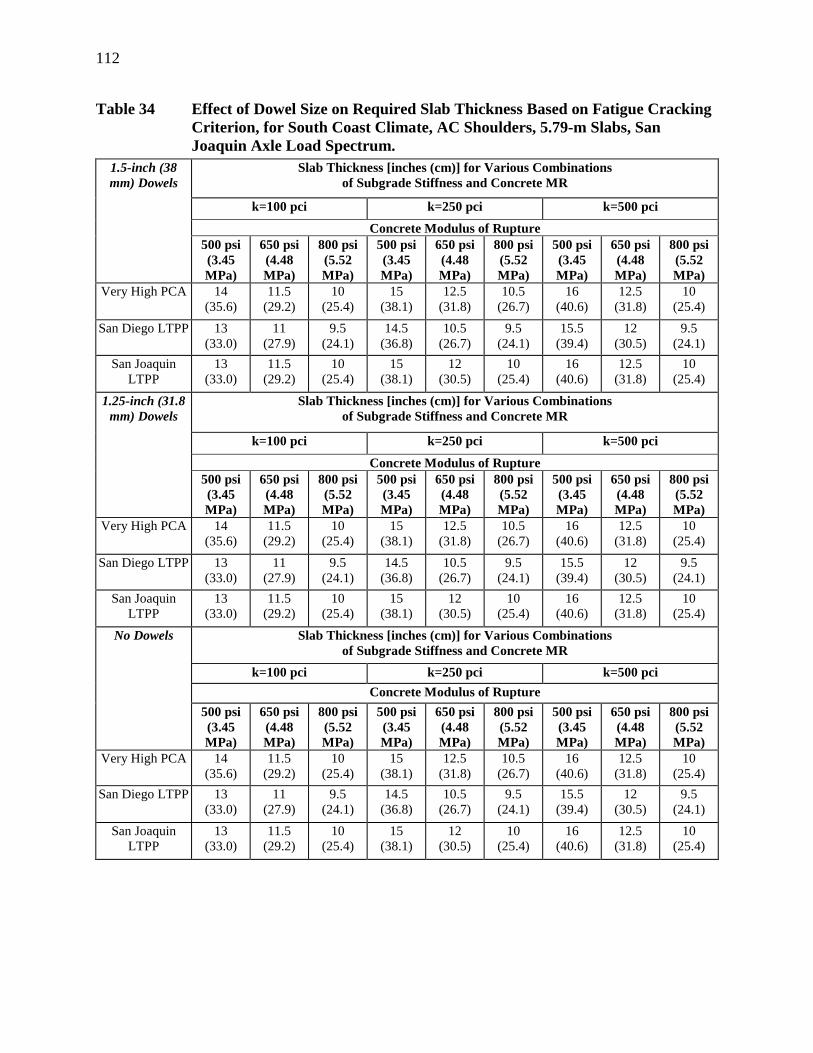
112
Table 34 Effect of Dowel Size on Required Slab Thickness Based on Fatigue CrackingCriterion, for South Coast Climate, AC Shoulders, 5.79-m Slabs, SanJoaquin Axle Load Spectrum.
Slab Thickness [inches (cm)] for Various Combinationsof Subgrade Stiffness and Concrete MR
k=100 pci k=250 pci k=500 pciConcrete Modulus of Rupture
1.5-inch (38mm) Dowels
500 psi(3.45MPa)
650 psi(4.48MPa)
800 psi(5.52MPa)
500 psi(3.45MPa)
650 psi(4.48MPa)
800 psi(5.52MPa)
500 psi(3.45MPa)
650 psi(4.48MPa)
800 psi(5.52MPa)
Very High PCA 14(35.6)
11.5(29.2)
10(25.4)
15(38.1)
12.5(31.8)
10.5(26.7)
16(40.6)
12.5(31.8)
10(25.4)
San Diego LTPP 13(33.0)
11(27.9)
9.5(24.1)
14.5(36.8)
10.5(26.7)
9.5(24.1)
15.5(39.4)
12(30.5)
9.5(24.1)
San JoaquinLTPP
13(33.0)
11.5(29.2)
10(25.4)
15(38.1)
12(30.5)
10(25.4)
16(40.6)
12.5(31.8)
10(25.4)
Slab Thickness [inches (cm)] for Various Combinationsof Subgrade Stiffness and Concrete MR
k=100 pci k=250 pci k=500 pciConcrete Modulus of Rupture
1.25-inch (31.8mm) Dowels
500 psi(3.45MPa)
650 psi(4.48MPa)
800 psi(5.52MPa)
500 psi(3.45MPa)
650 psi(4.48MPa)
800 psi(5.52MPa)
500 psi(3.45MPa)
650 psi(4.48MPa)
800 psi(5.52MPa)
Very High PCA 14(35.6)
11.5(29.2)
10(25.4)
15(38.1)
12.5(31.8)
10.5(26.7)
16(40.6)
12.5(31.8)
10(25.4)
San Diego LTPP 13(33.0)
11(27.9)
9.5(24.1)
14.5(36.8)
10.5(26.7)
9.5(24.1)
15.5(39.4)
12(30.5)
9.5(24.1)
San JoaquinLTPP
13(33.0)
11.5(29.2)
10(25.4)
15(38.1)
12(30.5)
10(25.4)
16(40.6)
12.5(31.8)
10(25.4)
Slab Thickness [inches (cm)] for Various Combinationsof Subgrade Stiffness and Concrete MR
k=100 pci k=250 pci k=500 pciConcrete Modulus of Rupture
No Dowels
500 psi(3.45MPa)
650 psi(4.48MPa)
800 psi(5.52MPa)
500 psi(3.45MPa)
650 psi(4.48MPa)
800 psi(5.52MPa)
500 psi(3.45MPa)
650 psi(4.48MPa)
800 psi(5.52MPa)
Very High PCA 14(35.6)
11.5(29.2)
10(25.4)
15(38.1)
12.5(31.8)
10.5(26.7)
16(40.6)
12.5(31.8)
10(25.4)
San Diego LTPP 13(33.0)
11(27.9)
9.5(24.1)
14.5(36.8)
10.5(26.7)
9.5(24.1)
15.5(39.4)
12(30.5)
9.5(24.1)
San JoaquinLTPP
13(33.0)
11.5(29.2)
10(25.4)
15(38.1)
12(30.5)
10(25.4)
16(40.6)
12.5(31.8)
10(25.4)
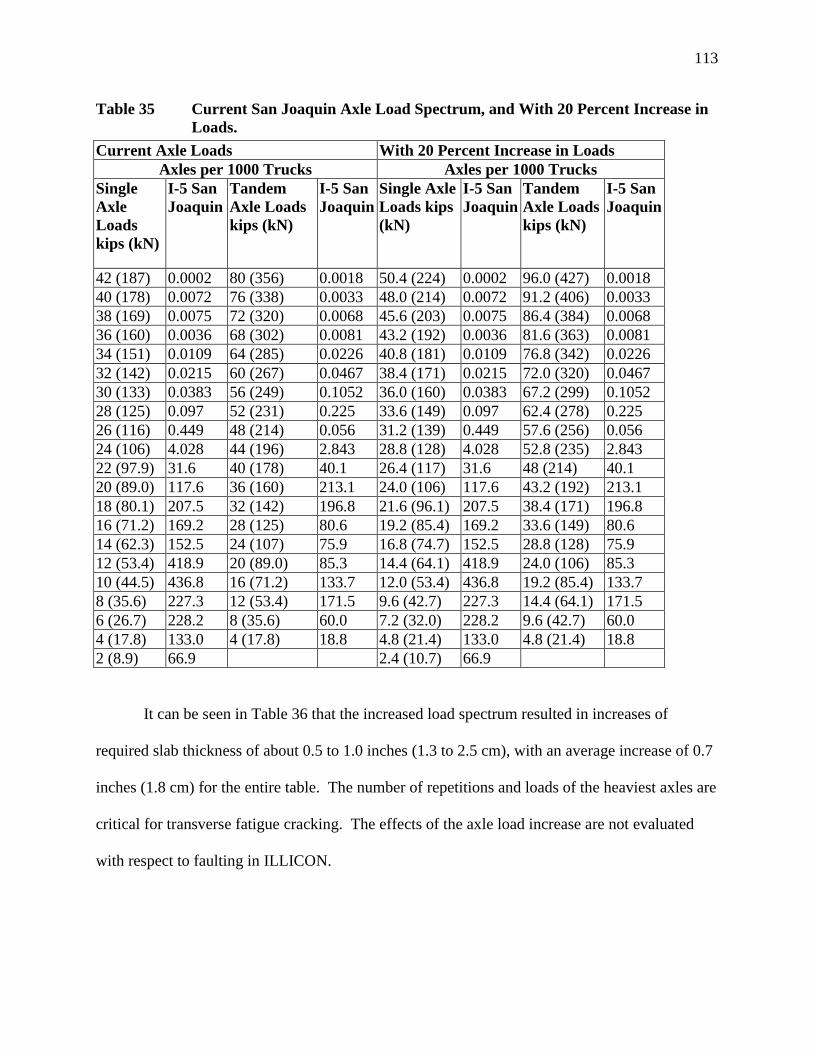
113
Table 35 Current San Joaquin Axle Load Spectrum, and With 20 Percent Increase inLoads.
Current Axle Loads With 20 Percent Increase in LoadsAxles per 1000 Trucks Axles per 1000 Trucks
SingleAxleLoadskips (kN)
I-5 SanJoaquin
TandemAxle Loadskips (kN)
I-5 SanJoaquin
Single AxleLoads kips(kN)
I-5 SanJoaquin
TandemAxle Loadskips (kN)
I-5 SanJoaquin
42 (187) 0.0002 80 (356) 0.0018 50.4 (224) 0.0002 96.0 (427) 0.001840 (178) 0.0072 76 (338) 0.0033 48.0 (214) 0.0072 91.2 (406) 0.003338 (169) 0.0075 72 (320) 0.0068 45.6 (203) 0.0075 86.4 (384) 0.006836 (160) 0.0036 68 (302) 0.0081 43.2 (192) 0.0036 81.6 (363) 0.008134 (151) 0.0109 64 (285) 0.0226 40.8 (181) 0.0109 76.8 (342) 0.022632 (142) 0.0215 60 (267) 0.0467 38.4 (171) 0.0215 72.0 (320) 0.046730 (133) 0.0383 56 (249) 0.1052 36.0 (160) 0.0383 67.2 (299) 0.105228 (125) 0.097 52 (231) 0.225 33.6 (149) 0.097 62.4 (278) 0.22526 (116) 0.449 48 (214) 0.056 31.2 (139) 0.449 57.6 (256) 0.05624 (106) 4.028 44 (196) 2.843 28.8 (128) 4.028 52.8 (235) 2.84322 (97.9) 31.6 40 (178) 40.1 26.4 (117) 31.6 48 (214) 40.120 (89.0) 117.6 36 (160) 213.1 24.0 (106) 117.6 43.2 (192) 213.118 (80.1) 207.5 32 (142) 196.8 21.6 (96.1) 207.5 38.4 (171) 196.816 (71.2) 169.2 28 (125) 80.6 19.2 (85.4) 169.2 33.6 (149) 80.614 (62.3) 152.5 24 (107) 75.9 16.8 (74.7) 152.5 28.8 (128) 75.912 (53.4) 418.9 20 (89.0) 85.3 14.4 (64.1) 418.9 24.0 (106) 85.310 (44.5) 436.8 16 (71.2) 133.7 12.0 (53.4) 436.8 19.2 (85.4) 133.78 (35.6) 227.3 12 (53.4) 171.5 9.6 (42.7) 227.3 14.4 (64.1) 171.56 (26.7) 228.2 8 (35.6) 60.0 7.2 (32.0) 228.2 9.6 (42.7) 60.04 (17.8) 133.0 4 (17.8) 18.8 4.8 (21.4) 133.0 4.8 (21.4) 18.82 (8.9) 66.9 2.4 (10.7) 66.9
It can be seen in Table 36 that the increased load spectrum resulted in increases of
required slab thickness of about 0.5 to 1.0 inches (1.3 to 2.5 cm), with an average increase of 0.7
inches (1.8 cm) for the entire table. The number of repetitions and loads of the heaviest axles are
critical for transverse fatigue cracking. The effects of the axle load increase are not evaluated
with respect to faulting in ILLICON.
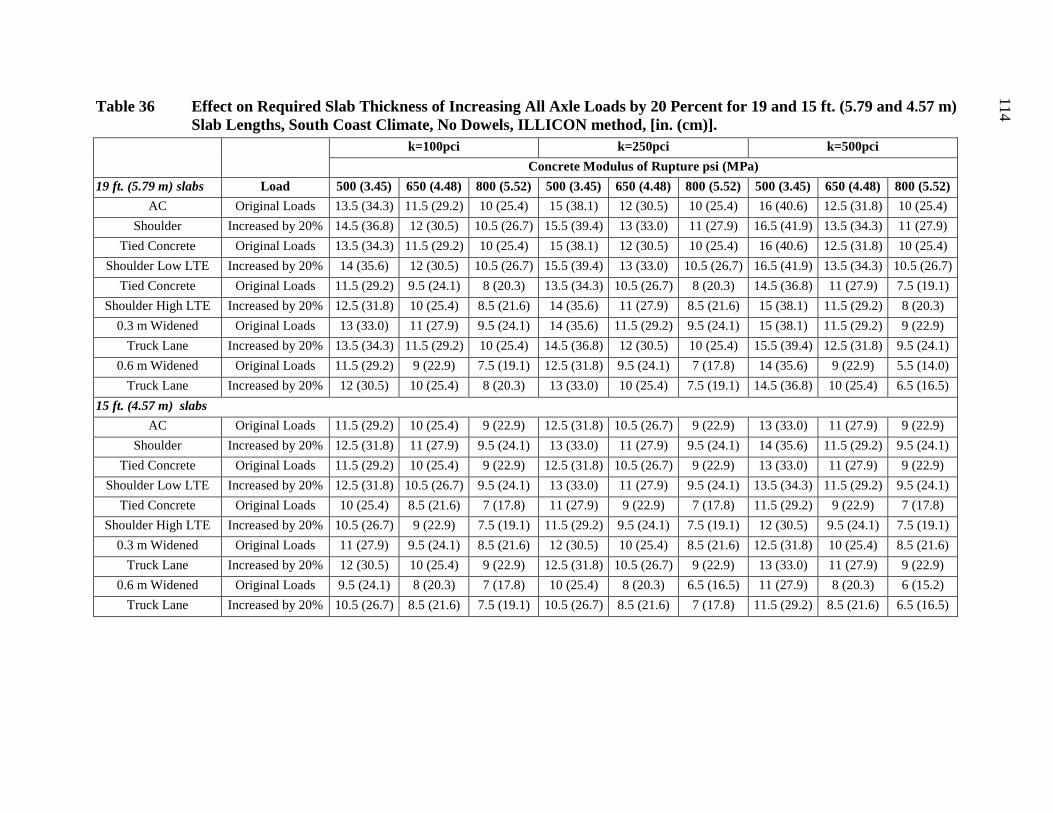
Table 36 Effect on Required Slab Thickness of Increasing All Axle Loads by 20 Percent Slab Lengths, South Coast Climate, No Dowels, ILLICON method, [in. (cm)].
k=100pci k=250pciConcrete Modulus of Rupture psi (
19 ft. (5.79 m) slabs Load 500 (3.45) 650 (4.48) 800 (5.52) 500 (3.45) 650 (4.48) 800 (5.5AC Original Loads 13.5 (34.3) 11.5 (29.2) 10 (25.4) 15 (38.1) 12 (30.5) 10 (25.
Shoulder Increased by 20% 14.5 (36.8) 12 (30.5) 10.5 (26.7) 15.5 (39.4) 13 (33.0) 11 (27.Tied Concrete Original Loads 13.5 (34.3) 11.5 (29.2) 10 (25.4) 15 (38.1) 12 (30.5) 10 (25.
Shoulder Low LTE Increased by 20% 14 (35.6) 12 (30.5) 10.5 (26.7) 15.5 (39.4) 13 (33.0) 10.5 (26Tied Concrete Original Loads 11.5 (29.2) 9.5 (24.1) 8 (20.3) 13.5 (34.3) 10.5 (26.7) 8 (20.3
Shoulder High LTE Increased by 20% 12.5 (31.8) 10 (25.4) 8.5 (21.6) 14 (35.6) 11 (27.9) 8.5 (21.0.3 m Widened Original Loads 13 (33.0) 11 (27.9) 9.5 (24.1) 14 (35.6) 11.5 (29.2) 9.5 (24.
Truck Lane Increased by 20% 13.5 (34.3) 11.5 (29.2) 10 (25.4) 14.5 (36.8) 12 (30.5) 10 (25.0.6 m Widened Original Loads 11.5 (29.2) 9 (22.9) 7.5 (19.1) 12.5 (31.8) 9.5 (24.1) 7 (17.8
Truck Lane Increased by 20% 12 (30.5) 10 (25.4) 8 (20.3) 13 (33.0) 10 (25.4) 7.5 (19.15 ft. (4.57 m) slabs
AC Original Loads 11.5 (29.2) 10 (25.4) 9 (22.9) 12.5 (31.8) 10.5 (26.7) 9 (22.9Shoulder Increased by 20% 12.5 (31.8) 11 (27.9) 9.5 (24.1) 13 (33.0) 11 (27.9) 9.5 (24.
Tied Concrete Original Loads 11.5 (29.2) 10 (25.4) 9 (22.9) 12.5 (31.8) 10.5 (26.7) 9 (22.9Shoulder Low LTE Increased by 20% 12.5 (31.8) 10.5 (26.7) 9.5 (24.1) 13 (33.0) 11 (27.9) 9.5 (24.
Tied Concrete Original Loads 10 (25.4) 8.5 (21.6) 7 (17.8) 11 (27.9) 9 (22.9) 7 (17.8Shoulder High LTE Increased by 20% 10.5 (26.7) 9 (22.9) 7.5 (19.1) 11.5 (29.2) 9.5 (24.1) 7.5 (19.
0.3 m Widened Original Loads 11 (27.9) 9.5 (24.1) 8.5 (21.6) 12 (30.5) 10 (25.4) 8.5 (21.Truck Lane Increased by 20% 12 (30.5) 10 (25.4) 9 (22.9) 12.5 (31.8) 10.5 (26.7) 9 (22.9
0.6 m Widened Original Loads 9.5 (24.1) 8 (20.3) 7 (17.8) 10 (25.4) 8 (20.3) 6.5 (16.Truck Lane Increased by 20% 10.5 (26.7) 8.5 (21.6) 7.5 (19.1) 10.5 (26.7) 8.5 (21.6) 7 (17.8
for 19 and 15 ft. (5.79 and 4.57 m)
k=500pciMPa)2) 500 (3.45) 650 (4.48) 800 (5.52)4) 16 (40.6) 12.5 (31.8) 10 (25.4)9) 16.5 (41.9) 13.5 (34.3) 11 (27.9)4) 16 (40.6) 12.5 (31.8) 10 (25.4).7) 16.5 (41.9) 13.5 (34.3) 10.5 (26.7)) 14.5 (36.8) 11 (27.9) 7.5 (19.1)6) 15 (38.1) 11.5 (29.2) 8 (20.3)1) 15 (38.1) 11.5 (29.2) 9 (22.9)4) 15.5 (39.4) 12.5 (31.8) 9.5 (24.1)) 14 (35.6) 9 (22.9) 5.5 (14.0)1) 14.5 (36.8) 10 (25.4) 6.5 (16.5)
) 13 (33.0) 11 (27.9) 9 (22.9)1) 14 (35.6) 11.5 (29.2) 9.5 (24.1)) 13 (33.0) 11 (27.9) 9 (22.9)1) 13.5 (34.3) 11.5 (29.2) 9.5 (24.1)) 11.5 (29.2) 9 (22.9) 7 (17.8)1) 12 (30.5) 9.5 (24.1) 7.5 (19.1)6) 12.5 (31.8) 10 (25.4) 8.5 (21.6)) 13 (33.0) 11 (27.9) 9 (22.9)5) 11 (27.9) 8 (20.3) 6 (15.2)) 11.5 (29.2) 8.5 (21.6) 6.5 (16.5)
114
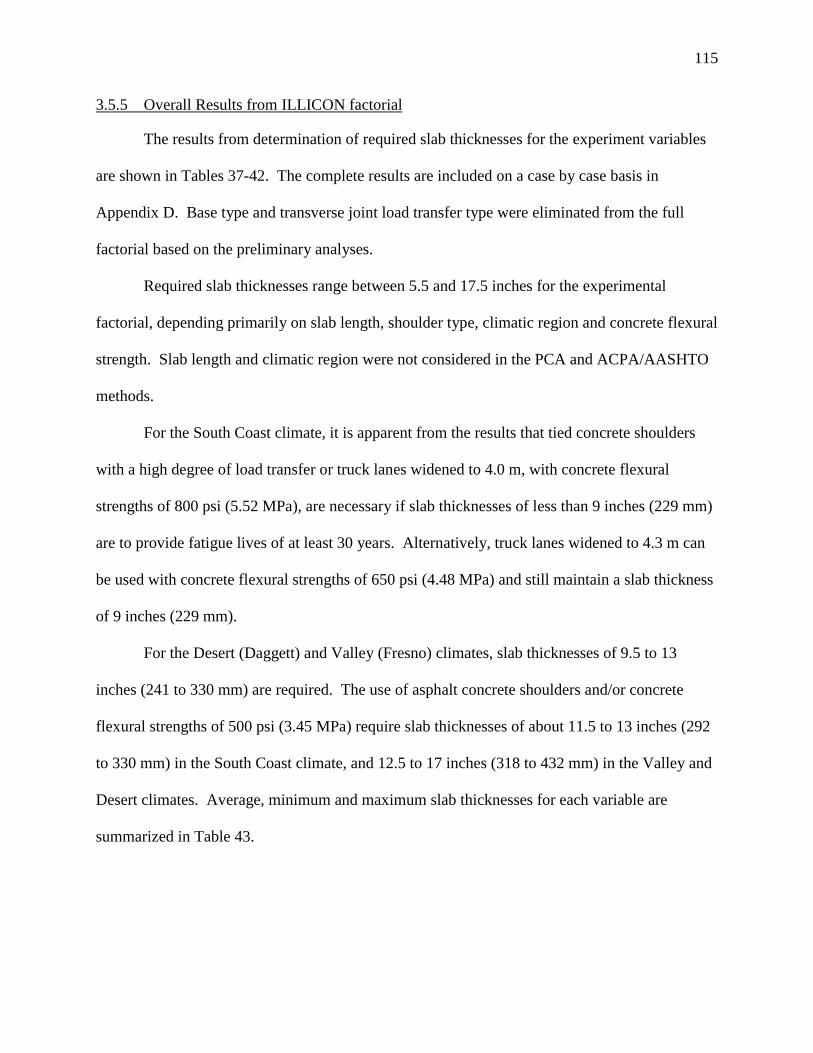
115
3.5.5 Overall Results from ILLICON factorial
The results from determination of required slab thicknesses for the experiment variables
are shown in Tables 37-42. The complete results are included on a case by case basis in
Appendix D. Base type and transverse joint load transfer type were eliminated from the full
factorial based on the preliminary analyses.
Required slab thicknesses range between 5.5 and 17.5 inches for the experimental
factorial, depending primarily on slab length, shoulder type, climatic region and concrete flexural
strength. Slab length and climatic region were not considered in the PCA and ACPA/AASHTO
methods.
For the South Coast climate, it is apparent from the results that tied concrete shoulders
with a high degree of load transfer or truck lanes widened to 4.0 m, with concrete flexural
strengths of 800 psi (5.52 MPa), are necessary if slab thicknesses of less than 9 inches (229 mm)
are to provide fatigue lives of at least 30 years. Alternatively, truck lanes widened to 4.3 m can
be used with concrete flexural strengths of 650 psi (4.48 MPa) and still maintain a slab thickness
of 9 inches (229 mm).
For the Desert (Daggett) and Valley (Fresno) climates, slab thicknesses of 9.5 to 13
inches (241 to 330 mm) are required. The use of asphalt concrete shoulders and/or concrete
flexural strengths of 500 psi (3.45 MPa) require slab thicknesses of about 11.5 to 13 inches (292
to 330 mm) in the South Coast climate, and 12.5 to 17 inches (318 to 432 mm) in the Valley and
Desert climates. Average, minimum and maximum slab thicknesses for each variable are
summarized in Table 43.
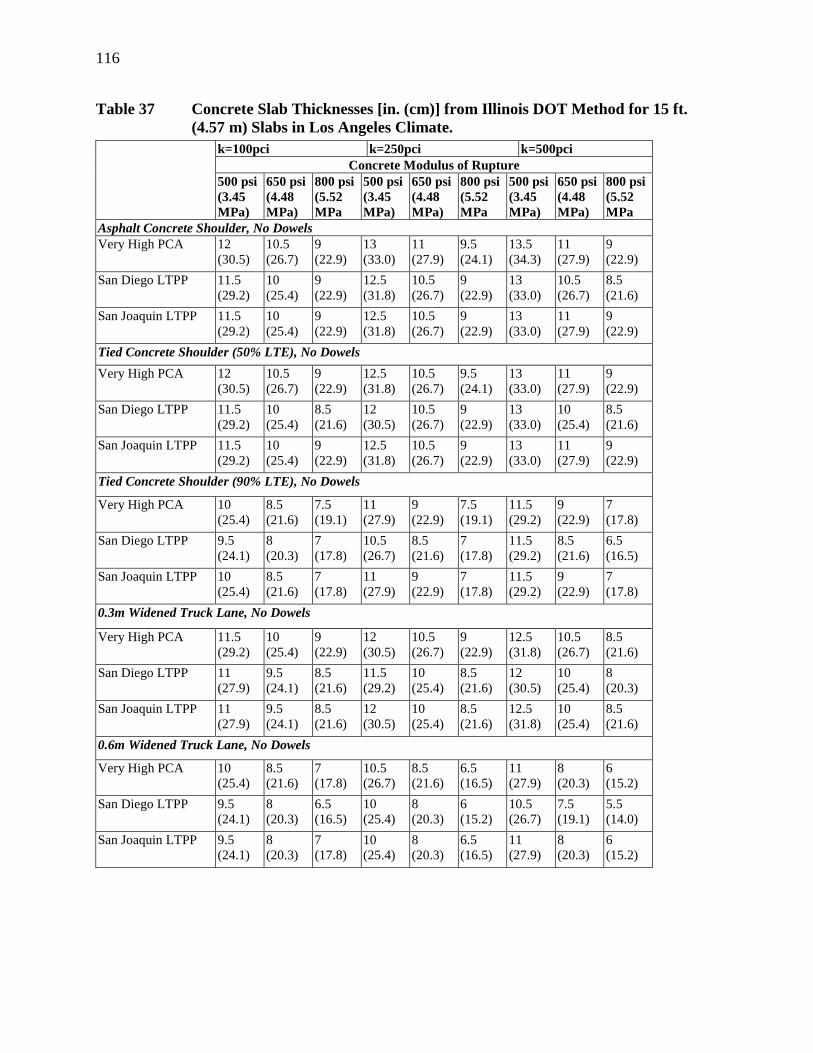
116
Table 37 Concrete Slab Thicknesses [in. (cm)] from Illinois DOT Method for 15 ft.(4.57 m) Slabs in Los Angeles Climate.
k=100pci k=250pci k=500pciConcrete Modulus of Rupture
500 psi(3.45MPa)
650 psi(4.48MPa)
800 psi(5.52MPa
500 psi(3.45MPa)
650 psi(4.48MPa)
800 psi(5.52MPa
500 psi(3.45MPa)
650 psi(4.48MPa)
800 psi(5.52MPa
Asphalt Concrete Shoulder, No DowelsVery High PCA 12
(30.5)10.5(26.7)
9(22.9)
13(33.0)
11(27.9)
9.5(24.1)
13.5(34.3)
11(27.9)
9(22.9)
San Diego LTPP 11.5(29.2)
10(25.4)
9(22.9)
12.5(31.8)
10.5(26.7)
9(22.9)
13(33.0)
10.5(26.7)
8.5(21.6)
San Joaquin LTPP 11.5(29.2)
10(25.4)
9(22.9)
12.5(31.8)
10.5(26.7)
9(22.9)
13(33.0)
11(27.9)
9(22.9)
Tied Concrete Shoulder (50% LTE), No DowelsVery High PCA 12
(30.5)10.5(26.7)
9(22.9)
12.5(31.8)
10.5(26.7)
9.5(24.1)
13(33.0)
11(27.9)
9(22.9)
San Diego LTPP 11.5(29.2)
10(25.4)
8.5(21.6)
12(30.5)
10.5(26.7)
9(22.9)
13(33.0)
10(25.4)
8.5(21.6)
San Joaquin LTPP 11.5(29.2)
10(25.4)
9(22.9)
12.5(31.8)
10.5(26.7)
9(22.9)
13(33.0)
11(27.9)
9(22.9)
Tied Concrete Shoulder (90% LTE), No Dowels
Very High PCA 10(25.4)
8.5(21.6)
7.5(19.1)
11(27.9)
9(22.9)
7.5(19.1)
11.5(29.2)
9(22.9)
7(17.8)
San Diego LTPP 9.5(24.1)
8(20.3)
7(17.8)
10.5(26.7)
8.5(21.6)
7(17.8)
11.5(29.2)
8.5(21.6)
6.5(16.5)
San Joaquin LTPP 10(25.4)
8.5(21.6)
7(17.8)
11(27.9)
9(22.9)
7(17.8)
11.5(29.2)
9(22.9)
7(17.8)
0.3m Widened Truck Lane, No Dowels
Very High PCA 11.5(29.2)
10(25.4)
9(22.9)
12(30.5)
10.5(26.7)
9(22.9)
12.5(31.8)
10.5(26.7)
8.5(21.6)
San Diego LTPP 11(27.9)
9.5(24.1)
8.5(21.6)
11.5(29.2)
10(25.4)
8.5(21.6)
12(30.5)
10(25.4)
8(20.3)
San Joaquin LTPP 11(27.9)
9.5(24.1)
8.5(21.6)
12(30.5)
10(25.4)
8.5(21.6)
12.5(31.8)
10(25.4)
8.5(21.6)
0.6m Widened Truck Lane, No Dowels
Very High PCA 10(25.4)
8.5(21.6)
7(17.8)
10.5(26.7)
8.5(21.6)
6.5(16.5)
11(27.9)
8(20.3)
6(15.2)
San Diego LTPP 9.5(24.1)
8(20.3)
6.5(16.5)
10(25.4)
8(20.3)
6(15.2)
10.5(26.7)
7.5(19.1)
5.5(14.0)
San Joaquin LTPP 9.5(24.1)
8(20.3)
7(17.8)
10(25.4)
8(20.3)
6.5(16.5)
11(27.9)
8(20.3)
6(15.2)
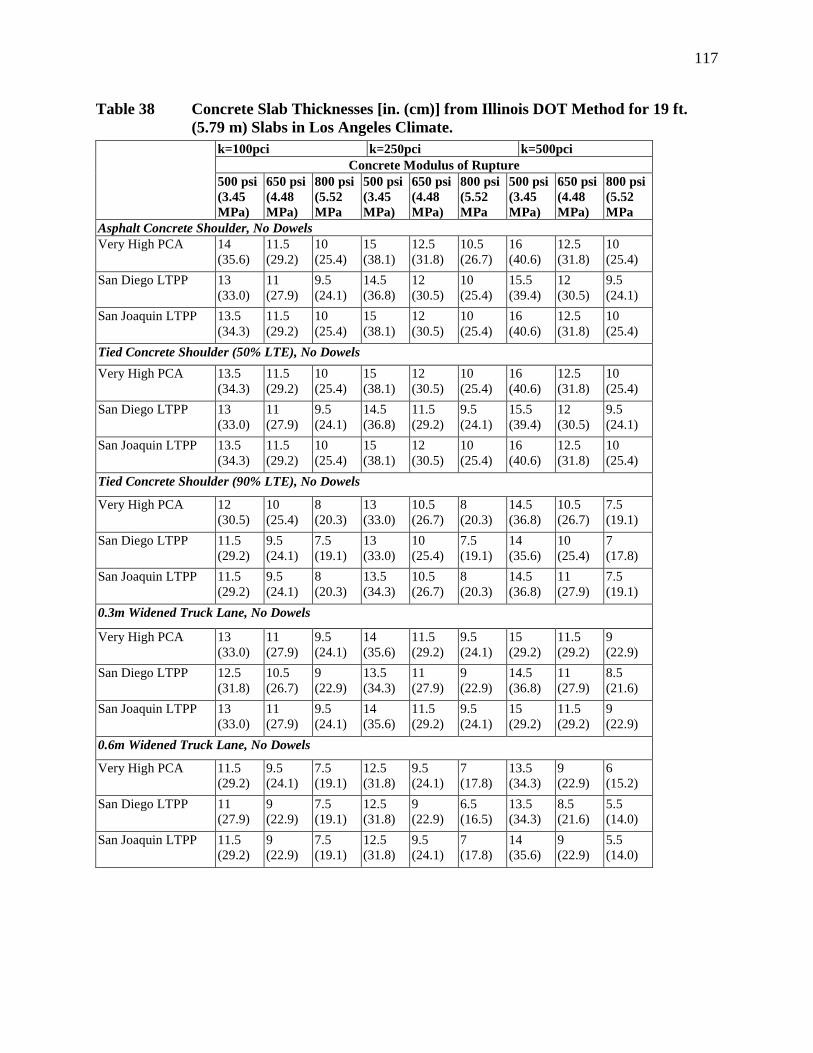
117
Table 38 Concrete Slab Thicknesses [in. (cm)] from Illinois DOT Method for 19 ft.(5.79 m) Slabs in Los Angeles Climate.
k=100pci k=250pci k=500pciConcrete Modulus of Rupture
500 psi(3.45MPa)
650 psi(4.48MPa)
800 psi(5.52MPa
500 psi(3.45MPa)
650 psi(4.48MPa)
800 psi(5.52MPa
500 psi(3.45MPa)
650 psi(4.48MPa)
800 psi(5.52MPa
Asphalt Concrete Shoulder, No DowelsVery High PCA 14
(35.6)11.5(29.2)
10(25.4)
15(38.1)
12.5(31.8)
10.5(26.7)
16(40.6)
12.5(31.8)
10(25.4)
San Diego LTPP 13(33.0)
11(27.9)
9.5(24.1)
14.5(36.8)
12(30.5)
10(25.4)
15.5(39.4)
12(30.5)
9.5(24.1)
San Joaquin LTPP 13.5(34.3)
11.5(29.2)
10(25.4)
15(38.1)
12(30.5)
10(25.4)
16(40.6)
12.5(31.8)
10(25.4)
Tied Concrete Shoulder (50% LTE), No DowelsVery High PCA 13.5
(34.3)11.5(29.2)
10(25.4)
15(38.1)
12(30.5)
10(25.4)
16(40.6)
12.5(31.8)
10(25.4)
San Diego LTPP 13(33.0)
11(27.9)
9.5(24.1)
14.5(36.8)
11.5(29.2)
9.5(24.1)
15.5(39.4)
12(30.5)
9.5(24.1)
San Joaquin LTPP 13.5(34.3)
11.5(29.2)
10(25.4)
15(38.1)
12(30.5)
10(25.4)
16(40.6)
12.5(31.8)
10(25.4)
Tied Concrete Shoulder (90% LTE), No Dowels
Very High PCA 12(30.5)
10(25.4)
8(20.3)
13(33.0)
10.5(26.7)
8(20.3)
14.5(36.8)
10.5(26.7)
7.5(19.1)
San Diego LTPP 11.5(29.2)
9.5(24.1)
7.5(19.1)
13(33.0)
10(25.4)
7.5(19.1)
14(35.6)
10(25.4)
7(17.8)
San Joaquin LTPP 11.5(29.2)
9.5(24.1)
8(20.3)
13.5(34.3)
10.5(26.7)
8(20.3)
14.5(36.8)
11(27.9)
7.5(19.1)
0.3m Widened Truck Lane, No Dowels
Very High PCA 13(33.0)
11(27.9)
9.5(24.1)
14(35.6)
11.5(29.2)
9.5(24.1)
15(29.2)
11.5(29.2)
9(22.9)
San Diego LTPP 12.5(31.8)
10.5(26.7)
9(22.9)
13.5(34.3)
11(27.9)
9(22.9)
14.5(36.8)
11(27.9)
8.5(21.6)
San Joaquin LTPP 13(33.0)
11(27.9)
9.5(24.1)
14(35.6)
11.5(29.2)
9.5(24.1)
15(29.2)
11.5(29.2)
9(22.9)
0.6m Widened Truck Lane, No Dowels
Very High PCA 11.5(29.2)
9.5(24.1)
7.5(19.1)
12.5(31.8)
9.5(24.1)
7(17.8)
13.5(34.3)
9(22.9)
6(15.2)
San Diego LTPP 11(27.9)
9(22.9)
7.5(19.1)
12.5(31.8)
9(22.9)
6.5(16.5)
13.5(34.3)
8.5(21.6)
5.5(14.0)
San Joaquin LTPP 11.5(29.2)
9(22.9)
7.5(19.1)
12.5(31.8)
9.5(24.1)
7(17.8)
14(35.6)
9(22.9)
5.5(14.0)

118
Table 39 Concrete Slab Thicknesses [in. (cm)] from Illinois DOT Method for 15 ft.(4.57 m) Slabs in Fresno Climate.
k=100pci k=250pci k=500pciConcrete Modulus of Rupture
500 psi(3.45MPa)
650 psi(4.48MPa)
800 psi(5.52MPa
500 psi(3.45MPa)
650 psi(4.48MPa)
800 psi(5.52MPa
500 psi(3.45MPa)
650 psi(4.48MPa)
800 psi(5.52MPa
Asphalt Concrete Shoulder, No DowelsVery High PCA 13
(33.0)11(27.9)
10(25.4)
13.5(34.3)
12(30.5)
10.5(26.7)
14(35.6)
12(30.5)
10(25.4)
San Diego LTPP 12.5(31.8)
10.5(26.7)
9.5(24.1)
13.5(34.3)
11.5(29.2)
10(25.4)
13.5(34.3)
11.5(29.2)
10(25.4)
San Joaquin LTPP 12.5(31.8)
11(27.9)
9.5(24.1)
13.5(34.3)
11.5(29.2)
10.5(26.7)
14(35.6)
12(30.5)
10(25.4)
Tied Concrete Shoulder (50% LTE), No DowelsVery High PCA 12.5
(31.8)11(27.9)
10(25.4)
13.5(34.3)
12(30.5)
10.5(26.7)
14(35.6)
11.5(29.2)
10(25.4)
San Diego LTPP 12.5(31.8)
10.5(26.7)
9.5(24.1)
13(33.0)
11.5(29.2)
10(25.4)
13.5(34.3)
11.5(29.2)
10(25.4)
San Joaquin LTPP 12.5(31.8)
11(27.9)
9.5(24.1)
13.5(34.3)
11.5(29.2)
10(25.4)
14(35.6)
12(30.5)
10(25.4)
Tied Concrete Shoulder (90% LTE), No Dowels
Very High PCA 11(27.9)
9.5(24.1)
8.5(21.6)
12.5(31.8)
10.5(26.7)
9.5(24.1)
12.5(31.8)
10.5(26.7)
9(22.9)
San Diego LTPP 11(27.9)
9.5(24.1)
8(20.3)
12(30.5)
10(25.4)
8.5(21.6)
12.5(31.8)
10.5(26.7)
8.5(21.6)
San Joaquin LTPP 11(27.9)
9.5(24.1)
8.5(21.6)
12.5(31.8)
10.5(26.7)
9(22.9)
12.5(31.8)
10.5(26.7)
9(22.9)
0.3m Widened Truck Lane, No Dowels
Very High PCA 12.5(31.8)
10.5(26.7)
9.5(24.1)
13(33.0)
11.5(29.2)
10(25.4)
13.5(34.3)
11.5(29.2)
9.5(24.1)
San Diego LTPP 12(30.5)
10.5(26.7)
9(22.9)
13(33.0)
11(27.9)
9.5(24.1)
13(33.0)
11(27.9)
9.5(24.1)
San Joaquin LTPP 12(30.5)
10.5(26.7)
9(22.9)
13(33.0)
11(27.9)
9.5(24.1)
13.5(34.3)
11.5(29.2)
9.5(24.1)
0.6m Widened Truck Lane, No Dowels
Very High PCA 11(27.9)
9.5(24.1)
8(20.3)
12(30.5)
10(25.4)
8.5(21.6)
12(30.5)
10(25.4)
8(20.3)
San Diego LTPP 10.5(26.7)
9(22.9)
8(20.3)
11.5(29.2)
9.5(24.1)
8(20.3)
12(30.5)
10(25.4)
8(20.3)
San Joaquin LTPP 11(27.9)
9(22.9)
8(20.3)
12(30.5)
10(25.4)
8.5(21.6)
12(30.5)
10(25.4)
8.5(21.6)
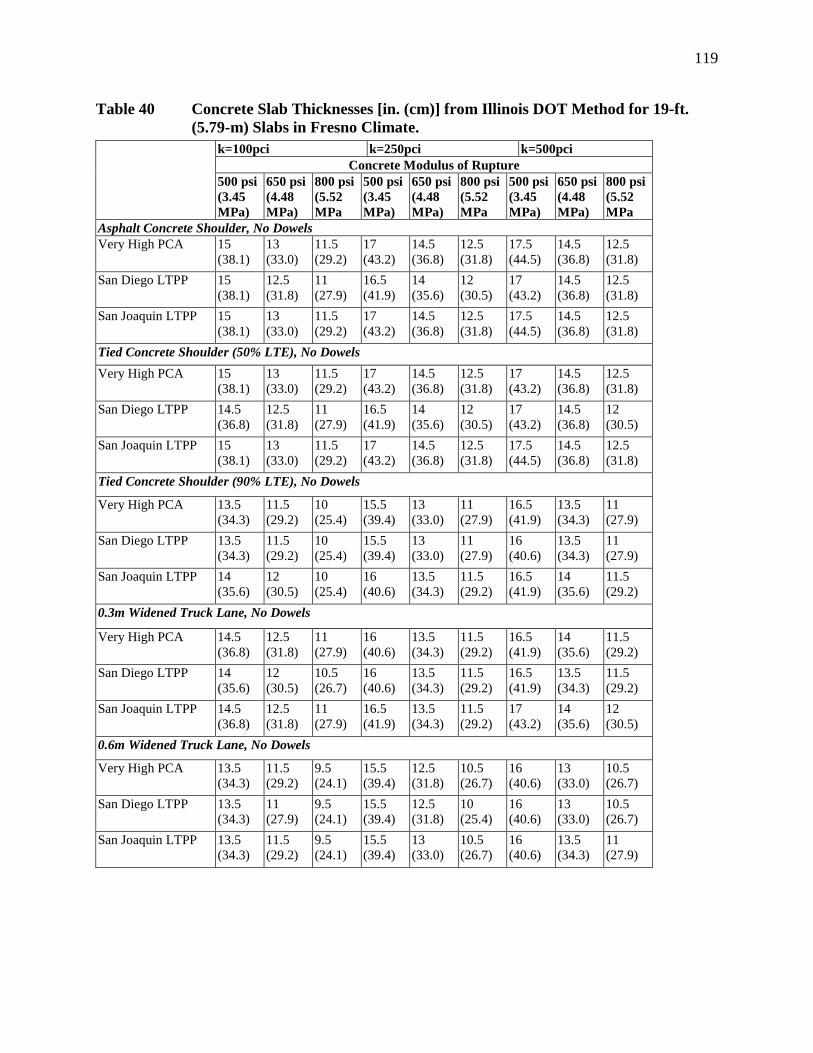
119
Table 40 Concrete Slab Thicknesses [in. (cm)] from Illinois DOT Method for 19-ft.(5.79-m) Slabs in Fresno Climate.
k=100pci k=250pci k=500pciConcrete Modulus of Rupture
500 psi(3.45MPa)
650 psi(4.48MPa)
800 psi(5.52MPa
500 psi(3.45MPa)
650 psi(4.48MPa)
800 psi(5.52MPa
500 psi(3.45MPa)
650 psi(4.48MPa)
800 psi(5.52MPa
Asphalt Concrete Shoulder, No DowelsVery High PCA 15
(38.1)13(33.0)
11.5(29.2)
17(43.2)
14.5(36.8)
12.5(31.8)
17.5(44.5)
14.5(36.8)
12.5(31.8)
San Diego LTPP 15(38.1)
12.5(31.8)
11(27.9)
16.5(41.9)
14(35.6)
12(30.5)
17(43.2)
14.5(36.8)
12.5(31.8)
San Joaquin LTPP 15(38.1)
13(33.0)
11.5(29.2)
17(43.2)
14.5(36.8)
12.5(31.8)
17.5(44.5)
14.5(36.8)
12.5(31.8)
Tied Concrete Shoulder (50% LTE), No DowelsVery High PCA 15
(38.1)13(33.0)
11.5(29.2)
17(43.2)
14.5(36.8)
12.5(31.8)
17(43.2)
14.5(36.8)
12.5(31.8)
San Diego LTPP 14.5(36.8)
12.5(31.8)
11(27.9)
16.5(41.9)
14(35.6)
12(30.5)
17(43.2)
14.5(36.8)
12(30.5)
San Joaquin LTPP 15(38.1)
13(33.0)
11.5(29.2)
17(43.2)
14.5(36.8)
12.5(31.8)
17.5(44.5)
14.5(36.8)
12.5(31.8)
Tied Concrete Shoulder (90% LTE), No Dowels
Very High PCA 13.5(34.3)
11.5(29.2)
10(25.4)
15.5(39.4)
13(33.0)
11(27.9)
16.5(41.9)
13.5(34.3)
11(27.9)
San Diego LTPP 13.5(34.3)
11.5(29.2)
10(25.4)
15.5(39.4)
13(33.0)
11(27.9)
16(40.6)
13.5(34.3)
11(27.9)
San Joaquin LTPP 14(35.6)
12(30.5)
10(25.4)
16(40.6)
13.5(34.3)
11.5(29.2)
16.5(41.9)
14(35.6)
11.5(29.2)
0.3m Widened Truck Lane, No Dowels
Very High PCA 14.5(36.8)
12.5(31.8)
11(27.9)
16(40.6)
13.5(34.3)
11.5(29.2)
16.5(41.9)
14(35.6)
11.5(29.2)
San Diego LTPP 14(35.6)
12(30.5)
10.5(26.7)
16(40.6)
13.5(34.3)
11.5(29.2)
16.5(41.9)
13.5(34.3)
11.5(29.2)
San Joaquin LTPP 14.5(36.8)
12.5(31.8)
11(27.9)
16.5(41.9)
13.5(34.3)
11.5(29.2)
17(43.2)
14(35.6)
12(30.5)
0.6m Widened Truck Lane, No Dowels
Very High PCA 13.5(34.3)
11.5(29.2)
9.5(24.1)
15.5(39.4)
12.5(31.8)
10.5(26.7)
16(40.6)
13(33.0)
10.5(26.7)
San Diego LTPP 13.5(34.3)
11(27.9)
9.5(24.1)
15.5(39.4)
12.5(31.8)
10(25.4)
16(40.6)
13(33.0)
10.5(26.7)
San Joaquin LTPP 13.5(34.3)
11.5(29.2)
9.5(24.1)
15.5(39.4)
13(33.0)
10.5(26.7)
16(40.6)
13.5(34.3)
11(27.9)
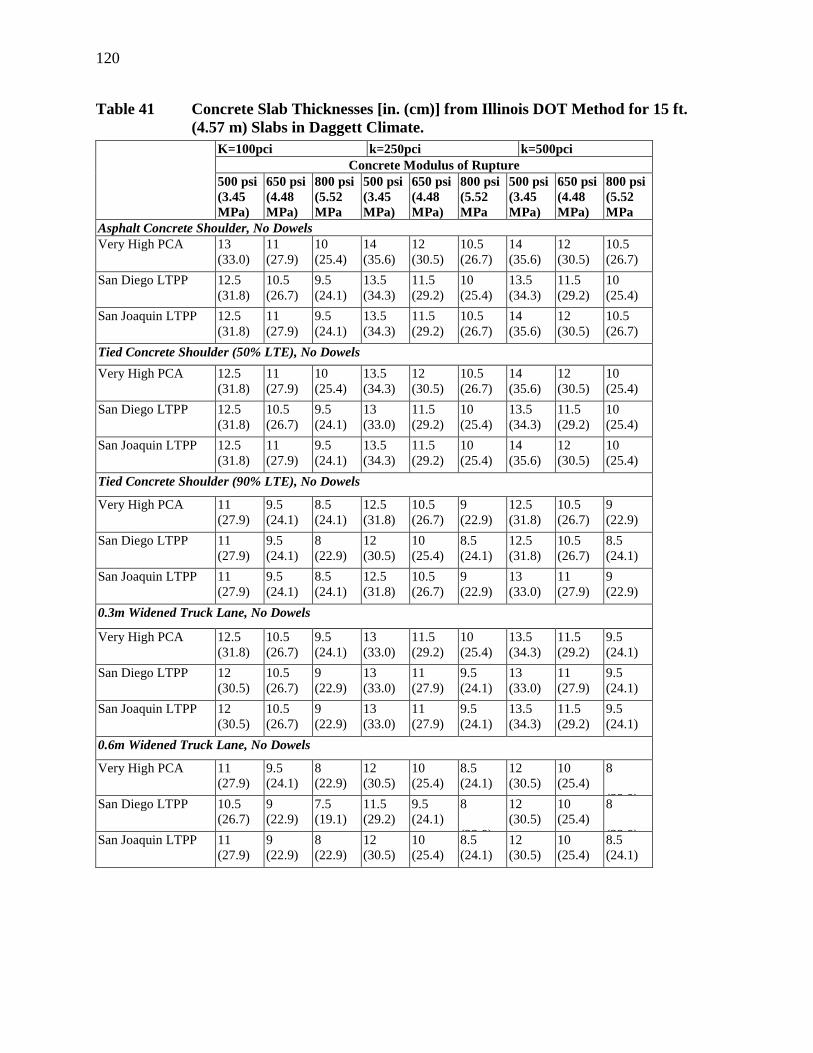
120
Table 41 Concrete Slab Thicknesses [in. (cm)] from Illinois DOT Method for 15 ft.(4.57 m) Slabs in Daggett Climate.
K=100pci k=250pci k=500pciConcrete Modulus of Rupture
500 psi(3.45MPa)
650 psi(4.48MPa)
800 psi(5.52MPa
500 psi(3.45MPa)
650 psi(4.48MPa)
800 psi(5.52MPa
500 psi(3.45MPa)
650 psi(4.48MPa)
800 psi(5.52MPa
Asphalt Concrete Shoulder, No DowelsVery High PCA 13
(33.0)11(27.9)
10(25.4)
14(35.6)
12(30.5)
10.5(26.7)
14(35.6)
12(30.5)
10.5(26.7)
San Diego LTPP 12.5(31.8)
10.5(26.7)
9.5(24.1)
13.5(34.3)
11.5(29.2)
10(25.4)
13.5(34.3)
11.5(29.2)
10(25.4)
San Joaquin LTPP 12.5(31.8)
11(27.9)
9.5(24.1)
13.5(34.3)
11.5(29.2)
10.5(26.7)
14(35.6)
12(30.5)
10.5(26.7)
Tied Concrete Shoulder (50% LTE), No DowelsVery High PCA 12.5
(31.8)11(27.9)
10(25.4)
13.5(34.3)
12(30.5)
10.5(26.7)
14(35.6)
12(30.5)
10(25.4)
San Diego LTPP 12.5(31.8)
10.5(26.7)
9.5(24.1)
13(33.0)
11.5(29.2)
10(25.4)
13.5(34.3)
11.5(29.2)
10(25.4)
San Joaquin LTPP 12.5(31.8)
11(27.9)
9.5(24.1)
13.5(34.3)
11.5(29.2)
10(25.4)
14(35.6)
12(30.5)
10(25.4)
Tied Concrete Shoulder (90% LTE), No Dowels
Very High PCA 11(27.9)
9.5(24.1)
8.5(24.1)
12.5(31.8)
10.5(26.7)
9(22.9)
12.5(31.8)
10.5(26.7)
9(22.9)
San Diego LTPP 11(27.9)
9.5(24.1)
8(22.9)
12(30.5)
10(25.4)
8.5(24.1)
12.5(31.8)
10.5(26.7)
8.5(24.1)
San Joaquin LTPP 11(27.9)
9.5(24.1)
8.5(24.1)
12.5(31.8)
10.5(26.7)
9(22.9)
13(33.0)
11(27.9)
9(22.9)
0.3m Widened Truck Lane, No Dowels
Very High PCA 12.5(31.8)
10.5(26.7)
9.5(24.1)
13(33.0)
11.5(29.2)
10(25.4)
13.5(34.3)
11.5(29.2)
9.5(24.1)
San Diego LTPP 12(30.5)
10.5(26.7)
9(22.9)
13(33.0)
11(27.9)
9.5(24.1)
13(33.0)
11(27.9)
9.5(24.1)
San Joaquin LTPP 12(30.5)
10.5(26.7)
9(22.9)
13(33.0)
11(27.9)
9.5(24.1)
13.5(34.3)
11.5(29.2)
9.5(24.1)
0.6m Widened Truck Lane, No Dowels
Very High PCA 11(27.9)
9.5(24.1)
8(22.9)
12(30.5)
10(25.4)
8.5(24.1)
12(30.5)
10(25.4)
8
(22 9)San Diego LTPP 10.5(26.7)
9(22.9)
7.5(19.1)
11.5(29.2)
9.5(24.1)
8
(22 9)
12(30.5)
10(25.4)
8
(22 9)San Joaquin LTPP 11(27.9)
9(22.9)
8(22.9)
12(30.5)
10(25.4)
8.5(24.1)
12(30.5)
10(25.4)
8.5(24.1)
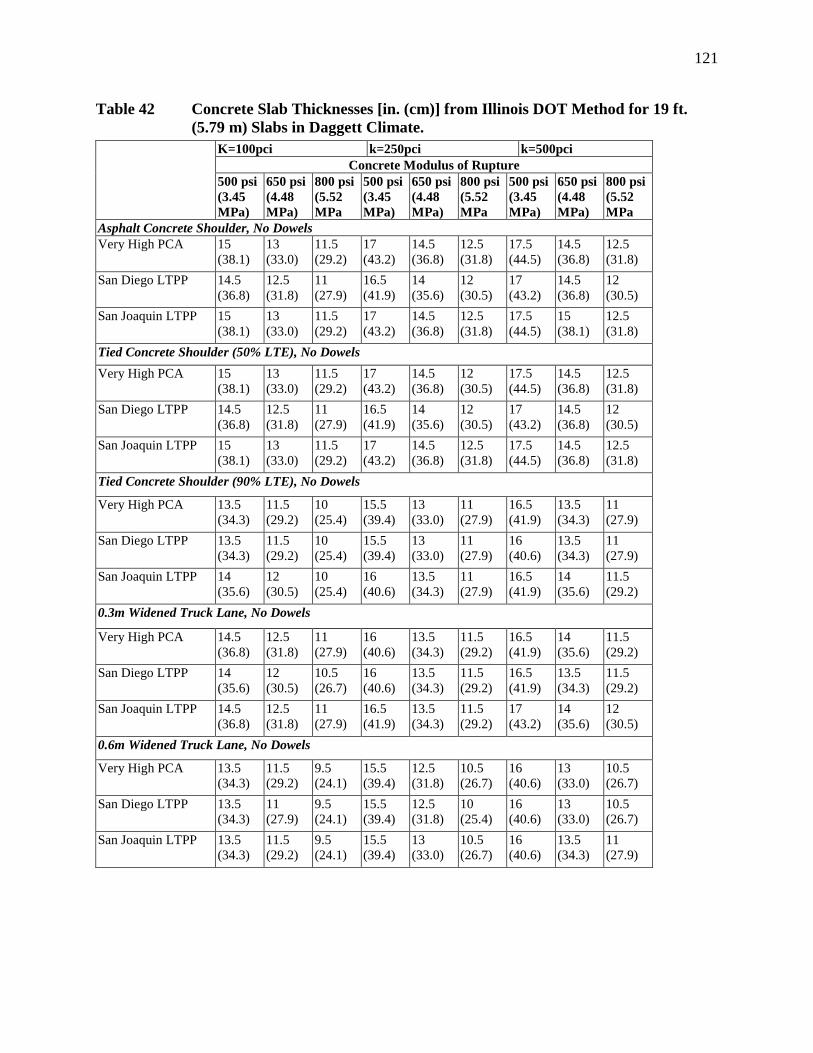
121
Table 42 Concrete Slab Thicknesses [in. (cm)] from Illinois DOT Method for 19 ft.(5.79 m) Slabs in Daggett Climate.
K=100pci k=250pci k=500pciConcrete Modulus of Rupture
500 psi(3.45MPa)
650 psi(4.48MPa)
800 psi(5.52MPa
500 psi(3.45MPa)
650 psi(4.48MPa)
800 psi(5.52MPa
500 psi(3.45MPa)
650 psi(4.48MPa)
800 psi(5.52MPa
Asphalt Concrete Shoulder, No DowelsVery High PCA 15
(38.1)13(33.0)
11.5(29.2)
17(43.2)
14.5(36.8)
12.5(31.8)
17.5(44.5)
14.5(36.8)
12.5(31.8)
San Diego LTPP 14.5(36.8)
12.5(31.8)
11(27.9)
16.5(41.9)
14(35.6)
12(30.5)
17(43.2)
14.5(36.8)
12(30.5)
San Joaquin LTPP 15(38.1)
13(33.0)
11.5(29.2)
17(43.2)
14.5(36.8)
12.5(31.8)
17.5(44.5)
15(38.1)
12.5(31.8)
Tied Concrete Shoulder (50% LTE), No DowelsVery High PCA 15
(38.1)13(33.0)
11.5(29.2)
17(43.2)
14.5(36.8)
12(30.5)
17.5(44.5)
14.5(36.8)
12.5(31.8)
San Diego LTPP 14.5(36.8)
12.5(31.8)
11(27.9)
16.5(41.9)
14(35.6)
12(30.5)
17(43.2)
14.5(36.8)
12(30.5)
San Joaquin LTPP 15(38.1)
13(33.0)
11.5(29.2)
17(43.2)
14.5(36.8)
12.5(31.8)
17.5(44.5)
14.5(36.8)
12.5(31.8)
Tied Concrete Shoulder (90% LTE), No Dowels
Very High PCA 13.5(34.3)
11.5(29.2)
10(25.4)
15.5(39.4)
13(33.0)
11(27.9)
16.5(41.9)
13.5(34.3)
11(27.9)
San Diego LTPP 13.5(34.3)
11.5(29.2)
10(25.4)
15.5(39.4)
13(33.0)
11(27.9)
16(40.6)
13.5(34.3)
11(27.9)
San Joaquin LTPP 14(35.6)
12(30.5)
10(25.4)
16(40.6)
13.5(34.3)
11(27.9)
16.5(41.9)
14(35.6)
11.5(29.2)
0.3m Widened Truck Lane, No Dowels
Very High PCA 14.5(36.8)
12.5(31.8)
11(27.9)
16(40.6)
13.5(34.3)
11.5(29.2)
16.5(41.9)
14(35.6)
11.5(29.2)
San Diego LTPP 14(35.6)
12(30.5)
10.5(26.7)
16(40.6)
13.5(34.3)
11.5(29.2)
16.5(41.9)
13.5(34.3)
11.5(29.2)
San Joaquin LTPP 14.5(36.8)
12.5(31.8)
11(27.9)
16.5(41.9)
13.5(34.3)
11.5(29.2)
17(43.2)
14(35.6)
12(30.5)
0.6m Widened Truck Lane, No Dowels
Very High PCA 13.5(34.3)
11.5(29.2)
9.5(24.1)
15.5(39.4)
12.5(31.8)
10.5(26.7)
16(40.6)
13(33.0)
10.5(26.7)
San Diego LTPP 13.5(34.3)
11(27.9)
9.5(24.1)
15.5(39.4)
12.5(31.8)
10(25.4)
16(40.6)
13(33.0)
10.5(26.7)
San Joaquin LTPP 13.5(34.3)
11.5(29.2)
9.5(24.1)
15.5(39.4)
13(33.0)
10.5(26.7)
16(40.6)
13.5(34.3)
11(27.9)

122
Table 43 Average Concrete Slab Thicknesses, Each Variable Factor Level, IllinoisDOT Method.
Required slab thickness [in. (cm)]Average Minimum Maximum
LA (South Coast) 10.4 (26.4) 5.5 (14.0) 16 (40.6)Fresno (Valley) 12.1 (30.8) 8 (20.3) 17.5 (44.5)Climatic
region Daggett (Desert) 12.1 (30.8) 7.5 (19.1) 17.5 (44.5)15 ft. 10.5 (26.6) 5.5 (14.0) 14.0 (35.6)Slab length 19 ft. 12.6 (32.1) 5.5 (14.0) 17.5 (44.5)Asphalt Concrete 12.4 (31.5) 8.5 (21.6) 17.5 (44.5)Tied, Concrete (50% LTE) 12.3 (31.3) 8.5 (21.6) 17.5 (44.5)Tied, Concrete (90% LTE) 10.9 (27.7) 6.5 (16.5) 16.5 (41.9)Widened Lane 4.0 m 11.8 (29.9) 8.0 (20.3) 17.0 (43.2)
Shoulder type
Widened Lane 4.3 m 10.4 (26.3) 5.5 (14.0) 16.0 (40.6)PCA 11.7 (29.7) 6 (15.2) 17.5 (44.5)San Diego 11.3 (29.8) 5.5 (14.0) 17 (43.2)Axle load
spectra San Joaquin 11.6 (29.6) 5.5 (14.0) 17.5 (44.5)500 psi (3.45 MPa) 13.6 (34.7) 9.5 (24.1) 17.5 (44.5)650 psi (4.48 MPa) 11.4 (28.9) 7.5 (19.1) 15 (38.1)Concrete MR800 psi (5.52 MPa) 9.6 (24.4) 5.5 (14.0) 12.5100 psi/in. 10.9 (27.7) 6.5 (16.5) 15 (38.1)250 psi/in. 11.8 (29.9) 6 (15.2) 17 (43.2)Subgrade
support 500 psi/in. 12.0 (30.4) 5.5 (14.0) 17.5 (44.5)LTE = Load Transfer Efficiency across shoulder/slab joint
Traffic loads passing on the edge of the slab are critical for transverse fatigue cracking
because they cause very large tensile bending stresses. The tensile stresses are greatly reduced
when there is load transfer across the longitudinal joint at the slab edge, or when the loads are
moved to a location away from the slab edge. Compared to asphalt concrete shoulders, tied
concrete shoulders with high load transfer efficiency (90 percent LTE) reduce required slab
thickness by 2 inches (51 mm).
Slab lengths of new concrete slabs on LLPRS projects will need to match those of the
existing adjacent lanes in order to prevent volunteer cracking at mismatched transverse joints.
Those slab lengths vary between about 12 and 19 ft. (3.66 and 5.79). On average, 19-ft. (5.79 m)
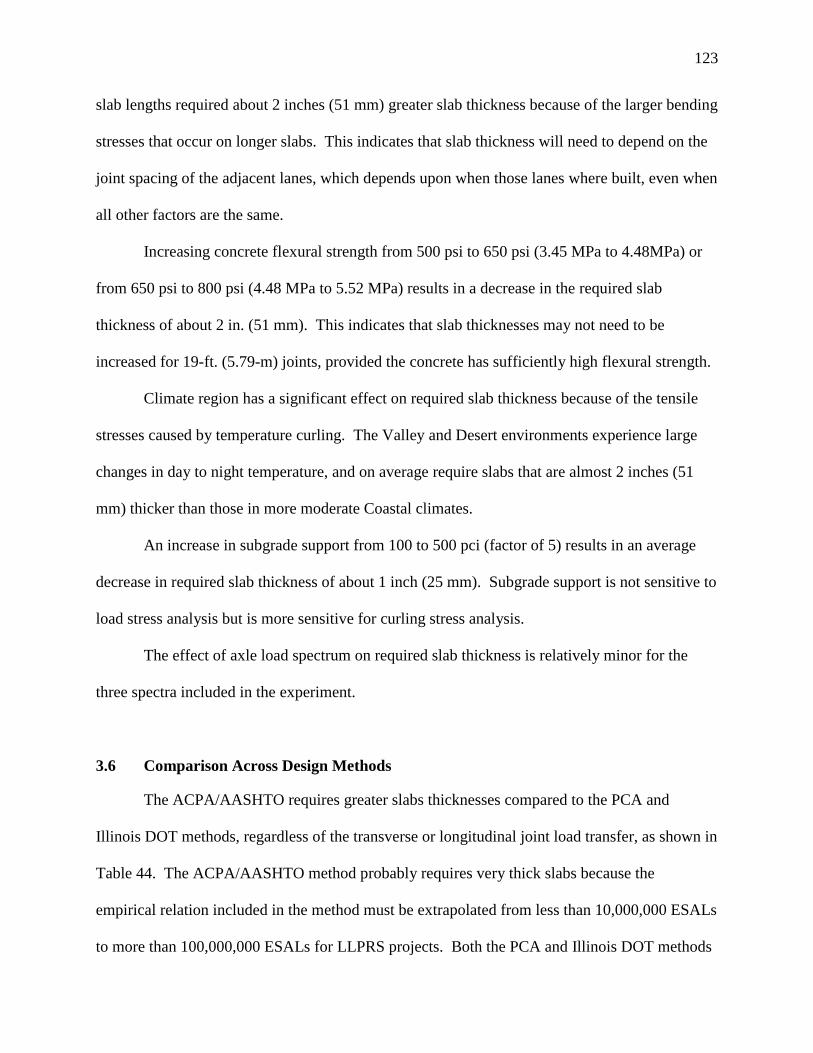
123
slab lengths required about 2 inches (51 mm) greater slab thickness because of the larger bending
stresses that occur on longer slabs. This indicates that slab thickness will need to depend on the
joint spacing of the adjacent lanes, which depends upon when those lanes where built, even when
all other factors are the same.
Increasing concrete flexural strength from 500 psi to 650 psi (3.45 MPa to 4.48MPa) or
from 650 psi to 800 psi (4.48 MPa to 5.52 MPa) results in a decrease in the required slab
thickness of about 2 in. (51 mm). This indicates that slab thicknesses may not need to be
increased for 19-ft. (5.79-m) joints, provided the concrete has sufficiently high flexural strength.
Climate region has a significant effect on required slab thickness because of the tensile
stresses caused by temperature curling. The Valley and Desert environments experience large
changes in day to night temperature, and on average require slabs that are almost 2 inches (51
mm) thicker than those in more moderate Coastal climates.
An increase in subgrade support from 100 to 500 pci (factor of 5) results in an average
decrease in required slab thickness of about 1 inch (25 mm). Subgrade support is not sensitive to
load stress analysis but is more sensitive for curling stress analysis.
The effect of axle load spectrum on required slab thickness is relatively minor for the
three spectra included in the experiment.
3.6 Comparison Across Design Methods
The ACPA/AASHTO requires greater slabs thicknesses compared to the PCA and
Illinois DOT methods, regardless of the transverse or longitudinal joint load transfer, as shown in
Table 44. The ACPA/AASHTO method probably requires very thick slabs because the
empirical relation included in the method must be extrapolated from less than 10,000,000 ESALs
to more than 100,000,000 ESALs for LLPRS projects. Both the PCA and Illinois DOT methods
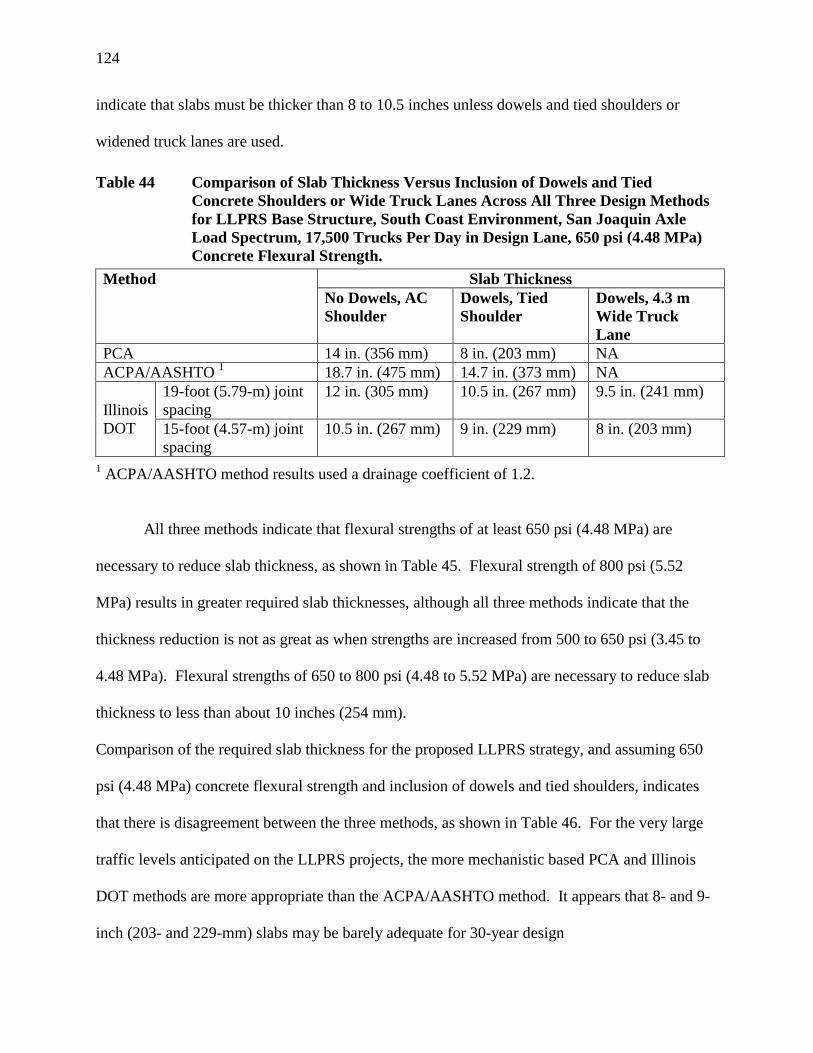
124
indicate that slabs must be thicker than 8 to 10.5 inches unless dowels and tied shoulders or
widened truck lanes are used.
Table 44 Comparison of Slab Thickness Versus Inclusion of Dowels and TiedConcrete Shoulders or Wide Truck Lanes Across All Three Design Methodsfor LLPRS Base Structure, South Coast Environment, San Joaquin AxleLoad Spectrum, 17,500 Trucks Per Day in Design Lane, 650 psi (4.48 MPa)Concrete Flexural Strength.
Slab ThicknessMethodNo Dowels, ACShoulder
Dowels, TiedShoulder
Dowels, 4.3 mWide TruckLane
PCA 14 in. (356 mm) 8 in. (203 mm) NAACPA/AASHTO 1 18.7 in. (475 mm) 14.7 in. (373 mm) NA
19-foot (5.79-m) jointspacing
12 in. (305 mm) 10.5 in. (267 mm) 9.5 in. (241 mm)IllinoisDOT 15-foot (4.57-m) joint
spacing10.5 in. (267 mm) 9 in. (229 mm) 8 in. (203 mm)
1 ACPA/AASHTO method results used a drainage coefficient of 1.2.
All three methods indicate that flexural strengths of at least 650 psi (4.48 MPa) are
necessary to reduce slab thickness, as shown in Table 45. Flexural strength of 800 psi (5.52
MPa) results in greater required slab thicknesses, although all three methods indicate that the
thickness reduction is not as great as when strengths are increased from 500 to 650 psi (3.45 to
4.48 MPa). Flexural strengths of 650 to 800 psi (4.48 to 5.52 MPa) are necessary to reduce slab
thickness to less than about 10 inches (254 mm).
Comparison of the required slab thickness for the proposed LLPRS strategy, and assuming 650
psi (4.48 MPa) concrete flexural strength and inclusion of dowels and tied shoulders, indicates
that there is disagreement between the three methods, as shown in Table 46. For the very large
traffic levels anticipated on the LLPRS projects, the more mechanistic based PCA and Illinois
DOT methods are more appropriate than the ACPA/AASHTO method. It appears that 8- and 9-
inch (203- and 229-mm) slabs may be barely adequate for 30-year design
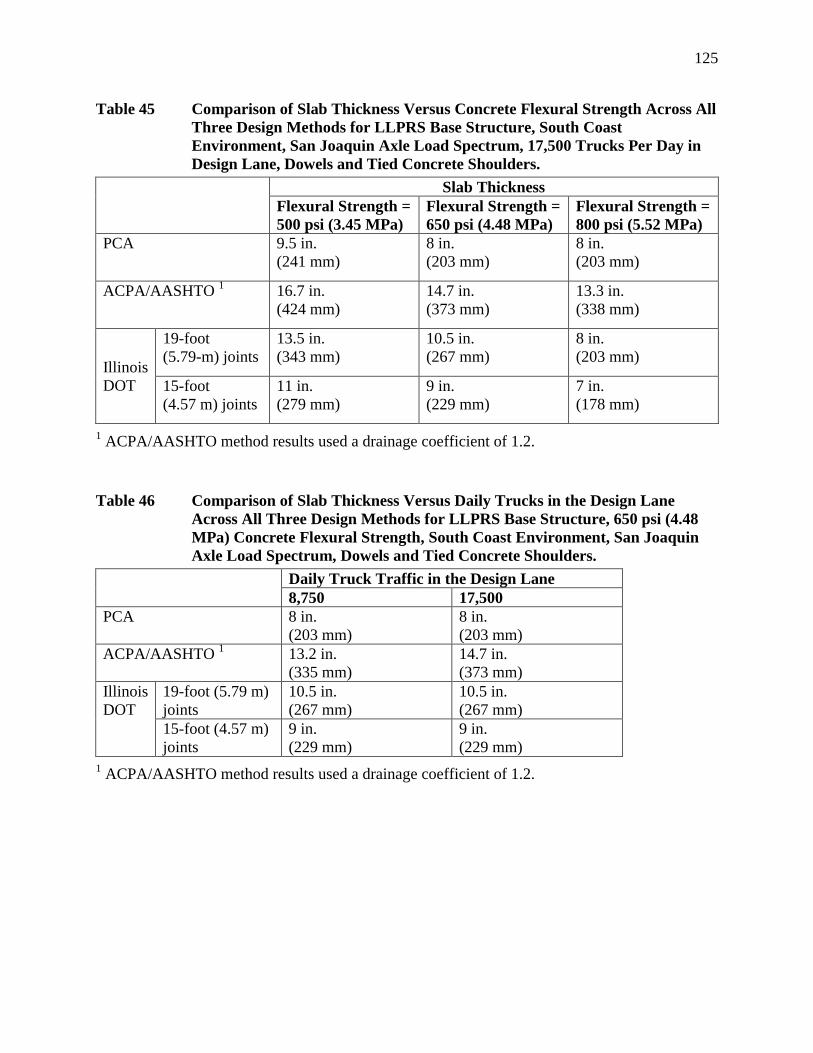
125
Table 45 Comparison of Slab Thickness Versus Concrete Flexural Strength Across AllThree Design Methods for LLPRS Base Structure, South CoastEnvironment, San Joaquin Axle Load Spectrum, 17,500 Trucks Per Day inDesign Lane, Dowels and Tied Concrete Shoulders.
Slab ThicknessFlexural Strength =500 psi (3.45 MPa)
Flexural Strength =650 psi (4.48 MPa)
Flexural Strength =800 psi (5.52 MPa)
PCA 9.5 in.(241 mm)
8 in.(203 mm)
8 in.(203 mm)
ACPA/AASHTO 1 16.7 in.(424 mm)
14.7 in.(373 mm)
13.3 in.(338 mm)
19-foot(5.79-m) joints
13.5 in.(343 mm)
10.5 in.(267 mm)
8 in.(203 mm)
IllinoisDOT 15-foot
(4.57 m) joints11 in.(279 mm)
9 in.(229 mm)
7 in.(178 mm)
1 ACPA/AASHTO method results used a drainage coefficient of 1.2.
Table 46 Comparison of Slab Thickness Versus Daily Trucks in the Design LaneAcross All Three Design Methods for LLPRS Base Structure, 650 psi (4.48MPa) Concrete Flexural Strength, South Coast Environment, San JoaquinAxle Load Spectrum, Dowels and Tied Concrete Shoulders.
Daily Truck Traffic in the Design Lane8,750 17,500
PCA 8 in.(203 mm)
8 in.(203 mm)
ACPA/AASHTO 1 13.2 in.(335 mm)
14.7 in.(373 mm)
19-foot (5.79 m)joints
10.5 in.(267 mm)
10.5 in.(267 mm)
IllinoisDOT
15-foot (4.57 m)joints
9 in.(229 mm)
9 in.(229 mm)
1 ACPA/AASHTO method results used a drainage coefficient of 1.2.
126
lives. If longer joint spacings are used, the Illinois DOT method indicates that thicker slabs are
required. The PCA method recommends joint spacings of 15 ft. (4.57 m) or less.
3.7 Effect of Dowel Size on Bearing Stress and Faulting
A short study was performed to determine the effectiveness of dowels in the reduction of
joint faulting in PCC pavements and to explore the maximum size dowel that can be placed in
200- to 225-mm thick concrete slabs (i.e., typical thickness) of the currently proposed LLPRS
strategy. A performance model based on field sections and several mechanistic variables was
recently published by the FHWA. (6) This model was used to analyze faulting under a number
of conditions. Currently, no good mechanistic-empirical faulting model is available. The
selected conditions represent those typically found in California and, in particular, at the site of
the LLPRS candidate projects. Local environmental and traffic variables were included, as were
possible pavement design parameters, such as joint spacing and base type.
3.7.1 Determination of Bearing Stress Values
Because faulting in doweled pavements is affected by the bearing stress of the dowel on
the concrete, it was first necessary to determine the dowel/concrete bearing stress. If the bearing
stress is high, the tight fit between the dowel and the slab deteriorates, and the effectiveness of
the dowel in transmitting loads across the transverse joint is diminished.
Bearing stress was calculated using a mechanistic model. Bearing stress depends on
several variables as given on pages 12 and 13 of the FHWA report. (6) In this analysis, the
values of the variables used are shown in Table 47. It should be noted that the elastic moduli
used correspond to moduli of rupture of 500, 650, and 800 psi (3.45, 4.48, and 5.52 MPa).
Dowel spacing was not considered in this model because pavements were only surveyed after
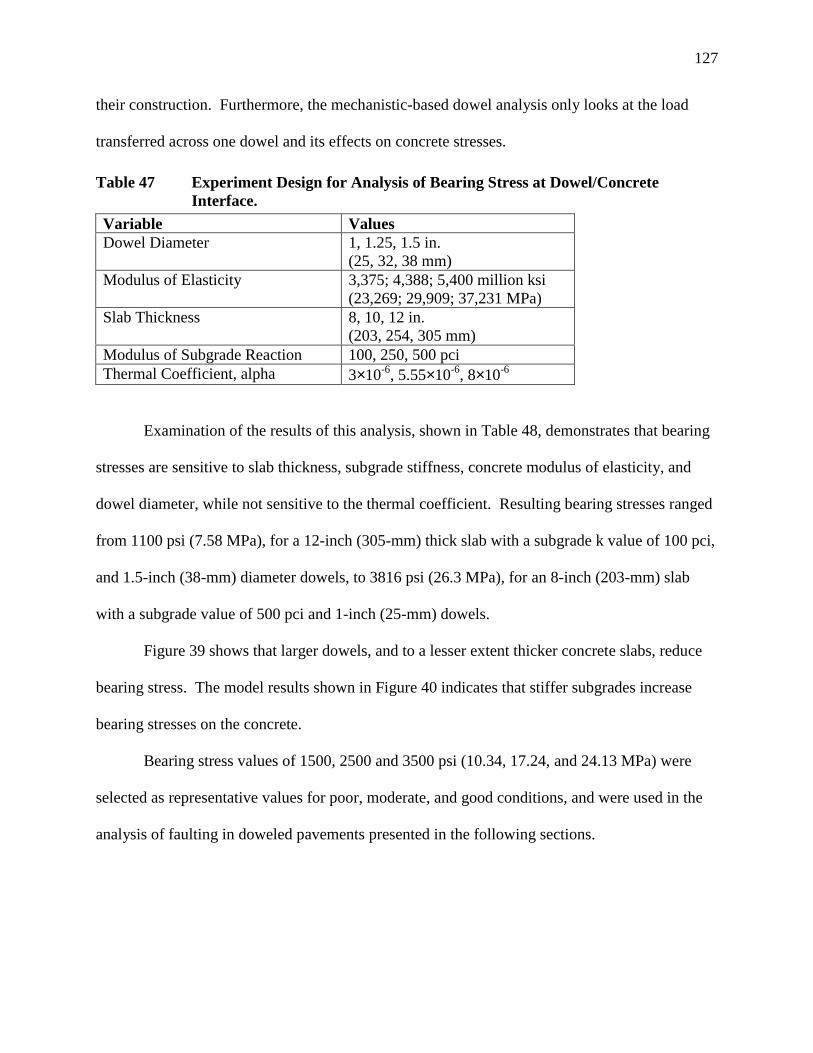
127
their construction. Furthermore, the mechanistic-based dowel analysis only looks at the load
transferred across one dowel and its effects on concrete stresses.
Table 47 Experiment Design for Analysis of Bearing Stress at Dowel/ConcreteInterface.
Variable ValuesDowel Diameter 1, 1.25, 1.5 in.
(25, 32, 38 mm)Modulus of Elasticity 3,375; 4,388; 5,400 million ksi
(23,269; 29,909; 37,231 MPa)Slab Thickness 8, 10, 12 in.
(203, 254, 305 mm)Modulus of Subgrade Reaction 100, 250, 500 pciThermal Coefficient, alpha 3×10⁻⁶, 5.55×10⁻⁶, 8×10⁻⁶
Examination of the results of this analysis, shown in Table 48, demonstrates that bearing
stresses are sensitive to slab thickness, subgrade stiffness, concrete modulus of elasticity, and
dowel diameter, while not sensitive to the thermal coefficient. Resulting bearing stresses ranged
from 1100 psi (7.58 MPa), for a 12-inch (305-mm) thick slab with a subgrade k value of 100 pci,
and 1.5-inch (38-mm) diameter dowels, to 3816 psi (26.3 MPa), for an 8-inch (203-mm) slab
with a subgrade value of 500 pci and 1-inch (25-mm) dowels.
Figure 39 shows that larger dowels, and to a lesser extent thicker concrete slabs, reduce
bearing stress. The model results shown in Figure 40 indicates that stiffer subgrades increase
bearing stresses on the concrete.
Bearing stress values of 1500, 2500 and 3500 psi (10.34, 17.24, and 24.13 MPa) were
selected as representative values for poor, moderate, and good conditions, and were used in the
analysis of faulting in doweled pavements presented in the following sections.
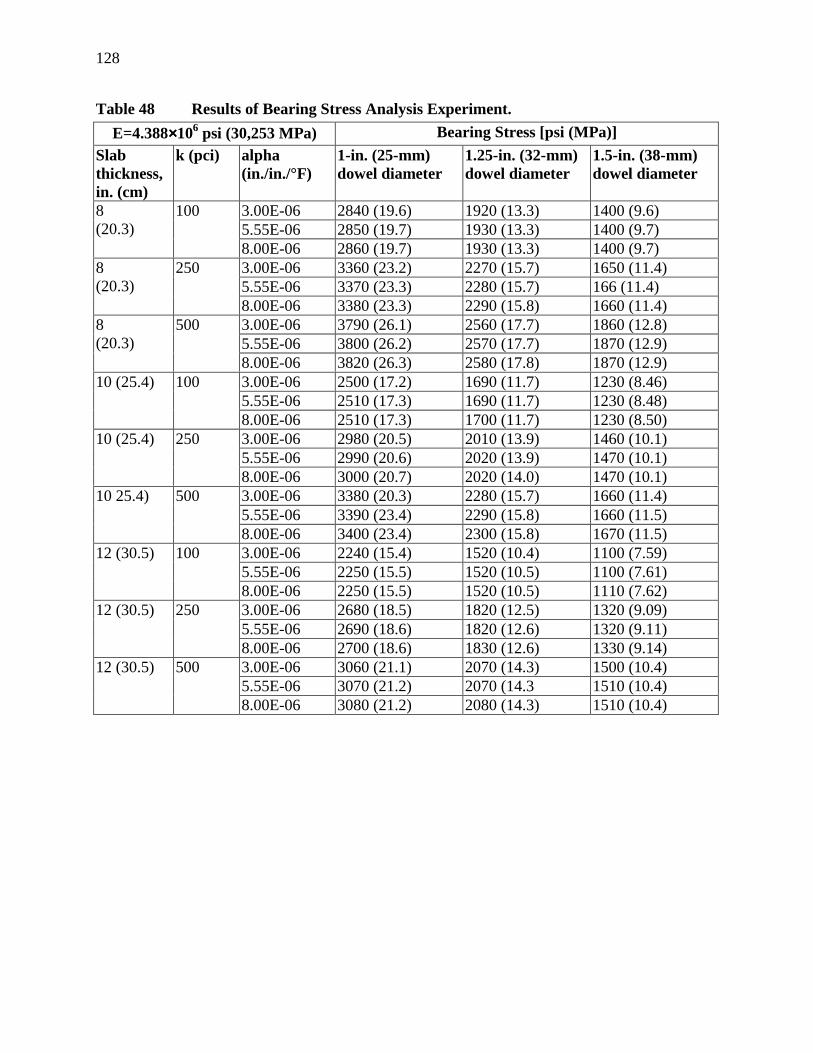
128
Table 48 Results of Bearing Stress Analysis Experiment.E=4.388××××106 psi (30,253 MPa) Bearing Stress [psi (MPa)]
Slabthickness,in. (cm)
k (pci) alpha(in./in./°F)
1-in. (25-mm)dowel diameter
1.25-in. (32-mm)dowel diameter
1.5-in. (38-mm)dowel diameter
3.00E-06 2840 (19.6) 1920 (13.3) 1400 (9.6)5.55E-06 2850 (19.7) 1930 (13.3) 1400 (9.7)
8(20.3)
100
8.00E-06 2860 (19.7) 1930 (13.3) 1400 (9.7)3.00E-06 3360 (23.2) 2270 (15.7) 1650 (11.4)5.55E-06 3370 (23.3) 2280 (15.7) 166 (11.4)
8(20.3)
250
8.00E-06 3380 (23.3) 2290 (15.8) 1660 (11.4)3.00E-06 3790 (26.1) 2560 (17.7) 1860 (12.8)5.55E-06 3800 (26.2) 2570 (17.7) 1870 (12.9)
8(20.3)
500
8.00E-06 3820 (26.3) 2580 (17.8) 1870 (12.9)3.00E-06 2500 (17.2) 1690 (11.7) 1230 (8.46)5.55E-06 2510 (17.3) 1690 (11.7) 1230 (8.48)
10 (25.4) 100
8.00E-06 2510 (17.3) 1700 (11.7) 1230 (8.50)3.00E-06 2980 (20.5) 2010 (13.9) 1460 (10.1)5.55E-06 2990 (20.6) 2020 (13.9) 1470 (10.1)
10 (25.4) 250
8.00E-06 3000 (20.7) 2020 (14.0) 1470 (10.1)3.00E-06 3380 (20.3) 2280 (15.7) 1660 (11.4)5.55E-06 3390 (23.4) 2290 (15.8) 1660 (11.5)
10 25.4) 500
8.00E-06 3400 (23.4) 2300 (15.8) 1670 (11.5)3.00E-06 2240 (15.4) 1520 (10.4) 1100 (7.59)5.55E-06 2250 (15.5) 1520 (10.5) 1100 (7.61)
12 (30.5) 100
8.00E-06 2250 (15.5) 1520 (10.5) 1110 (7.62)3.00E-06 2680 (18.5) 1820 (12.5) 1320 (9.09)5.55E-06 2690 (18.6) 1820 (12.6) 1320 (9.11)
12 (30.5) 250
8.00E-06 2700 (18.6) 1830 (12.6) 1330 (9.14)3.00E-06 3060 (21.1) 2070 (14.3) 1500 (10.4)5.55E-06 3070 (21.2) 2070 (14.3 1510 (10.4)
12 (30.5) 500
8.00E-06 3080 (21.2) 2080 (14.3) 1510 (10.4)
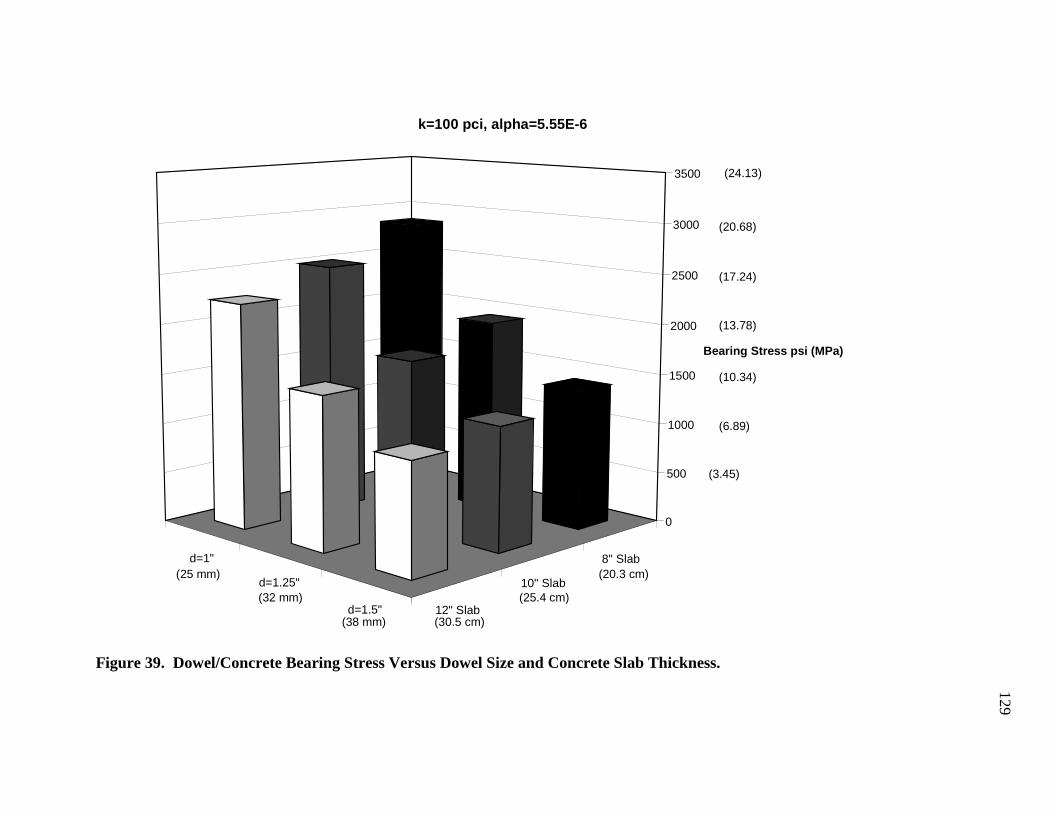
Figur
d=1"
d=1.25"
d=1.5" 12" Slab
10" Slab
8" Slab
0
500
1000
1500
2000
2500
3000
3500
Bearing Stress psi (MPa)
k=100 pci, alpha=5.55E-6
(25 mm)
(32 mm)
(38 mm)
(3.45)
(6.89)
(10.34)
(13.78)
(17.24)
(20.68)
(24.13)
(25.4 cm)
(20.3 cm)
(30.5 cm)
e 39. Dowel/Concrete Bearing Stress Versus Dowel Size and Concrete Slab Thickness.
129
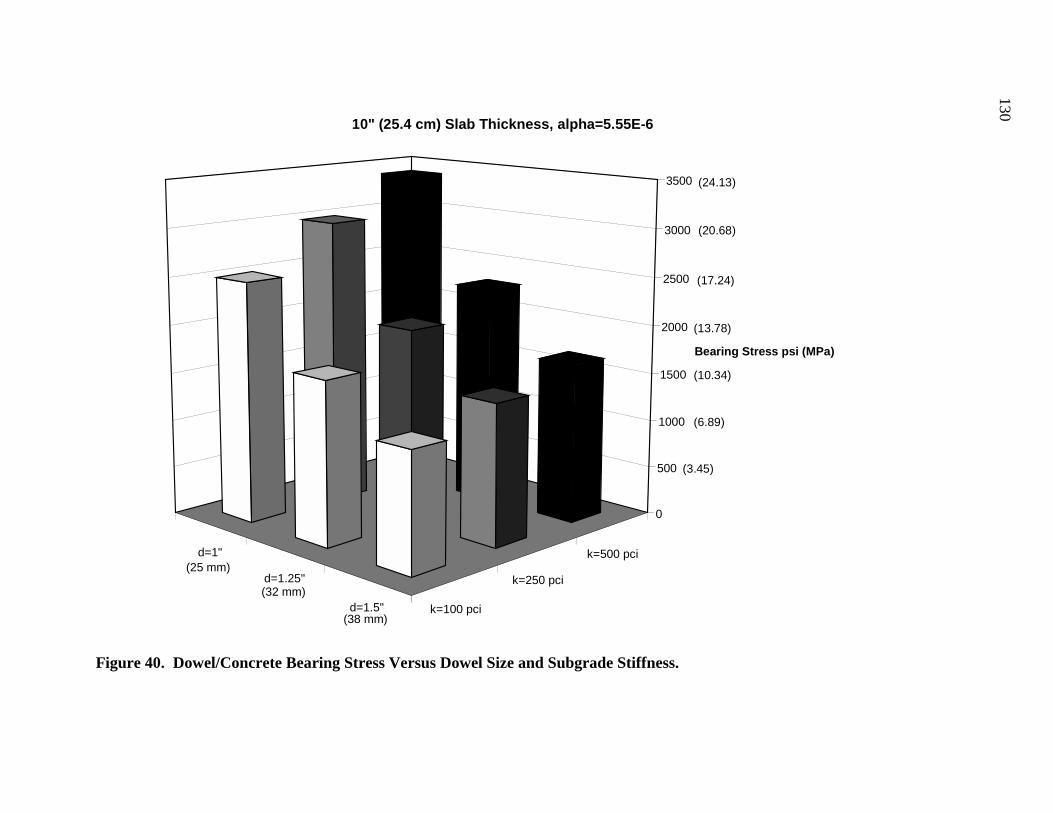
d=1"
d=1.25"
d=1.5" k=100 pci
k=250 pci
k=500 pci
0
500
1000
1500
2000
2500
3000
3500
Bearin
10" (25.4 cm) Slab Thickness, alpha=5.55E-6
(3.45)
(6.89)
(10.34
(13.78
(17.24
(20.68
(24.13
(25 mm)
(32 mm)
(38 mm)
Figure 40. Dowel/Concrete Bearing Stress Versus Dowel Size and Subgrade Stiffness.
g Stress psi (MPa)
)
)
)
)
)
130
131
3.7.2 Variables Considered
3.7.2.1 Doweled Pavements
Having established reasonable values of bearing stress, faulting performance was
calculated using the following model (6):
FaultD = CESAL0.25 * [0.0628 – 0.0628 * Cd + 0.3673 * 10-8 * Bstress2 + 0.4116 * 10-5 *Jtspace2 + 0.7466 * 10-9 * FI2 * Precip0.5 – 0.009503 * Basetype – 0.01917 * Widenlane+ 0.0009217 * Age]
where:
CESAL = Cumulative 18-kip (80-kN) equivalent single axle loads, millionsBstress = Maximum dowel/concrete bearing stress, lb./in.2Jtspace = Mean transverse joint spacing, ft.Basetype = Base type (0 = nonstabilized base; 1 = stabilized base)Widenlane = Widened lane (0 = not widened, 1 = widened)Cd = Modified AASHTO drainage coefficient, calculated from database informationFI = Mean annual freezing index, degree-daysPrecip = Mean annual precipitationAge = Pavement age, years
The model was empirically determined from long term observation of many plain jointed
pavements across the country, including a large number in California.
The model incorporates several different variables, the values of which are shown in
Table 44. In the model, the quantity of precipitation has no bearing on the degree of faulting
when the freezing index was assumed to be zero. Also, the faulting performance depends on
both the age of the pavement and on the cumulative amount of traffic in terms of ESALs.
The traffic volumes used were obtained by converting LTPP axle spectra data from the
San Diego and San Joaquin stations into ESALs using Caltrans procedures, assuming 17,500
trucks per day in the design lane and assuming no increase in the annual traffic volume. The
axle load spectra were not truncated for this study as they were for the comparison of design

132
methods, as discussed in Section 3.2.2. The experiment design for evaluating faulting
performance as a function of dowel size is shown in Table 49. It should be noted that this model
was developed for pavements with less than 20 million ESALs.
Table 49 Experiment Design for Evaluation of Faulting Performance versus DowelSize.
Variable ValuesTraffic, cumulative ESALs 5.0 million (San Diego) and 10.8 million (San
Joaquin) ESALs/yr.Bearing Stress 1500, 2500, 3500 psi (10.34, 17.24, 24.13 MPa)Joint Spacing 15, 19 feet (4.57, 5.79 m)Base Type Granular, StabilizedWidened Lanes Yes, NoACPA/AASHTO Drainage Coefficient, Cd 0.8, 1.2Freezing Index 0Precipitation N/A due to value of freezing indexAge 10, 20, 30 years
3.7.2.2 Undoweled Pavements
Calculation of faulting in undoweled pavements was performed in a similar manner to
that of doweled pavements. The following equation for faulting prediction of undoweled
pavements is also from Reference (6):
Corner Deflection = P * (1.2 – 0.88 * 1.4142 * a/l2) / (Kstatic * l2)
where:
P = Applied wheel load, set to 9000 lbs. (40 kN)l = Radius of relative stiffnessa = Radius of the applied load, set to 5.64 in. (143 mm), assuming a tire pressure of 90
lbs./in2 (621 kPa)Kstatic = Static backcalculated k-value, lbs./in.2/in.
The undoweled model uses many of the same variables as the doweled model, with the
exception of bearing stress and age, although traffic is cumulative over the life of the pavement,
as shown in Table 50.

133
Table 50 Experiment Design for Evaluation of Faulting Performance for UndoweledPavements.
Variable ValuesTraffic, cumulative ESALs 5.0 million (San Diego) and 10.8 million
(San Joaquin) ESALs/yr.Joint Spacing 15, 19 feet (4.57, 5.79 m)Slab Thickness 8, 10, 12 in. (203, 254, 305 mm)Base Type Granular (0), Stabilized (1)Widened Lanes Yes, NoACPA/AASHTO Drainage Coefficient, Cd 0.8, 1.2Freezing Index 0Precipitation N/A due to value of freezing indexNumber of Days with Temperatures over90 °F (32°C)
0, 90, 120
The undoweled model also incorporates slab thickness and the average number of days
per year on which temperatures exceed 90°F (32°C). The latter variable was determined from
hourly temperature data from the National Climatic Data Center. This data was analyzed for
four cities in California: San Francisco, Los Angeles, Fresno, and Daggett. These four cities
were assumed to be typical of the Bay Area, South Coast, Valley, and Desert climates,
respectively.
3.7.3 Results
Although the model was used to calculate fault heights for all combinations of the
variables shown in Tables 49 and 50, only several were selected for preliminary examination of
the results.
Development of faults is shown for the San Diego and San Joaquin traffic distributions
and 8-inch (203-mm) slabs in Tables 51 and 52, and for 12-inch (305-mm) slabs in Tables 53
and 54, respectively. The tables show the faulting for doweled pavements with bearing stresses
of 1500, 2500 and 3500 psi (10.34, 17.24, and 24.13 MPa), and for undoweled pavements as a
134
function of 10, 20 and 30 years of traffic. Lower bearing stresses are associated with larger
dowels, thicker slabs, greater concrete flexural strength, and less stiff subgrades.
Joint spacing was found to have little effect on the degree of faulting, thus a joint spacing
of 15 ft. (4.57 m) was assumed for further analyses. The model was found to be sensitive to the
number of days of high temperature, but little difference was found between the Valley and
Desert climates, or between the Bay Area and South Coast climates. Therefore, Tables 51-54
reflect values for South Coast and Desert climates only.
Base type, lane widening, and drainage coefficients are all very influential in determining
faulting performance. The results are less sensitive to slab thickness. It should be noted that the
model calculated negative values for joint faulting in some cases; these negative values were
assumed to equal zero.
Plots were generated from the 8-inch (20.3-cm) slab results to show general trends in the
data. The first, Figure 41, shows that faulting increases with age and with bearing stress.
Additionally, faulting is substantially greater in undoweled pavements. Figure 42 shows the
degree of faulting in doweled and undoweled pavements for several combinations of base type
and lane width. Both lane widening and base stabilization can contribute to the reduction of joint
faulting. Figure 43 shows that higher drainage coefficients can reduce joint faulting, but that the
effect varies with climatic region. Effective drainage reduces faulting of undoweled pavements
much more significantly in hot climates than in mild, and this effect can surpass the benefit of
doweling according to this model.
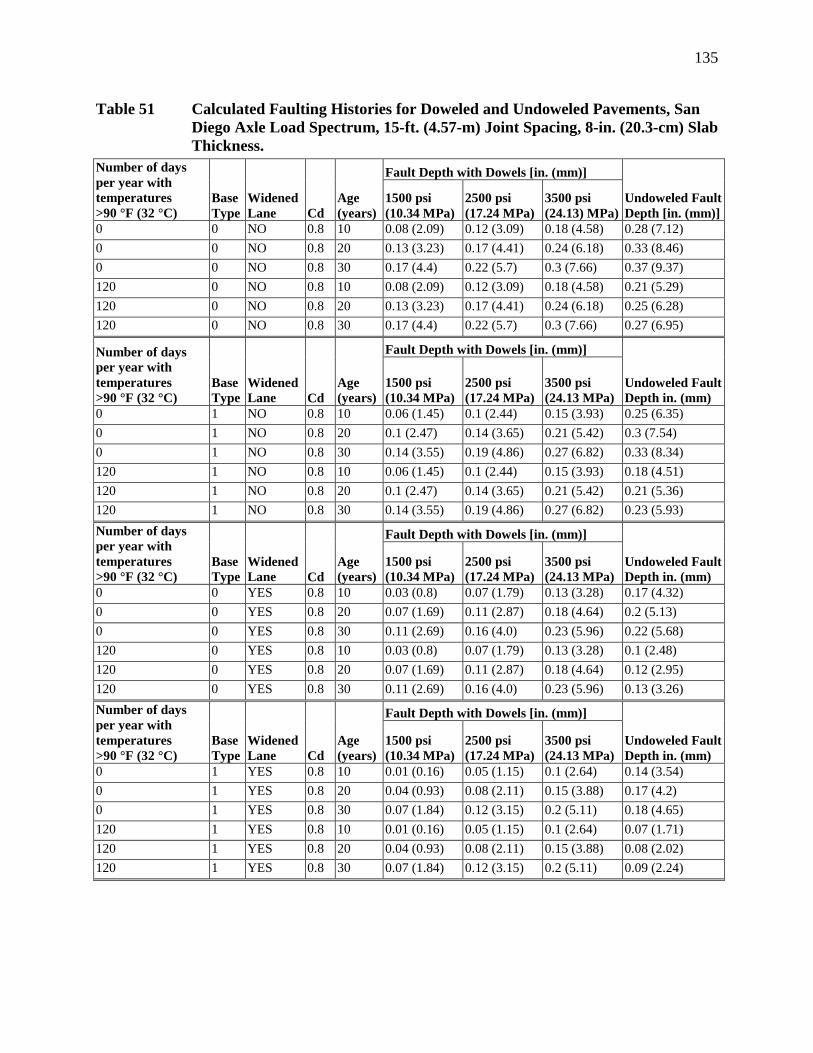
135
Table 51 Calculated Faulting Histories for Doweled and Undoweled Pavements, SanDiego Axle Load Spectrum, 15-ft. (4.57-m) Joint Spacing, 8-in. (20.3-cm) SlabThickness.
Fault Depth with Dowels [in. (mm)]Number of daysper year withtemperatures>90 °F (32 °C)
BaseType
WidenedLane Cd
Age(years)
1500 psi(10.34 MPa)
2500 psi(17.24 MPa)
3500 psi(24.13) MPa)
Undoweled FaultDepth [in. (mm)]
0 0 NO 0.8 10 0.08 (2.09) 0.12 (3.09) 0.18 (4.58) 0.28 (7.12)0 0 NO 0.8 20 0.13 (3.23) 0.17 (4.41) 0.24 (6.18) 0.33 (8.46)0 0 NO 0.8 30 0.17 (4.4) 0.22 (5.7) 0.3 (7.66) 0.37 (9.37)120 0 NO 0.8 10 0.08 (2.09) 0.12 (3.09) 0.18 (4.58) 0.21 (5.29)120 0 NO 0.8 20 0.13 (3.23) 0.17 (4.41) 0.24 (6.18) 0.25 (6.28)120 0 NO 0.8 30 0.17 (4.4) 0.22 (5.7) 0.3 (7.66) 0.27 (6.95)
Fault Depth with Dowels [in. (mm)]Number of daysper year withtemperatures>90 °F (32 °C)
BaseType
WidenedLane Cd
Age(years)
1500 psi(10.34 MPa)
2500 psi(17.24 MPa)
3500 psi(24.13 MPa)
Undoweled FaultDepth in. (mm)
0 1 NO 0.8 10 0.06 (1.45) 0.1 (2.44) 0.15 (3.93) 0.25 (6.35)0 1 NO 0.8 20 0.1 (2.47) 0.14 (3.65) 0.21 (5.42) 0.3 (7.54)0 1 NO 0.8 30 0.14 (3.55) 0.19 (4.86) 0.27 (6.82) 0.33 (8.34)120 1 NO 0.8 10 0.06 (1.45) 0.1 (2.44) 0.15 (3.93) 0.18 (4.51)120 1 NO 0.8 20 0.1 (2.47) 0.14 (3.65) 0.21 (5.42) 0.21 (5.36)120 1 NO 0.8 30 0.14 (3.55) 0.19 (4.86) 0.27 (6.82) 0.23 (5.93)
Fault Depth with Dowels [in. (mm)]Number of daysper year withtemperatures>90 °F (32 °C)
BaseType
WidenedLane Cd
Age(years)
1500 psi(10.34 MPa)
2500 psi(17.24 MPa)
3500 psi(24.13 MPa)
Undoweled FaultDepth in. (mm)
0 0 YES 0.8 10 0.03 (0.8) 0.07 (1.79) 0.13 (3.28) 0.17 (4.32)0 0 YES 0.8 20 0.07 (1.69) 0.11 (2.87) 0.18 (4.64) 0.2 (5.13)0 0 YES 0.8 30 0.11 (2.69) 0.16 (4.0) 0.23 (5.96) 0.22 (5.68)120 0 YES 0.8 10 0.03 (0.8) 0.07 (1.79) 0.13 (3.28) 0.1 (2.48)120 0 YES 0.8 20 0.07 (1.69) 0.11 (2.87) 0.18 (4.64) 0.12 (2.95)120 0 YES 0.8 30 0.11 (2.69) 0.16 (4.0) 0.23 (5.96) 0.13 (3.26)
Fault Depth with Dowels [in. (mm)]Number of daysper year withtemperatures>90 °F (32 °C)
BaseType
WidenedLane Cd
Age(years)
1500 psi(10.34 MPa)
2500 psi(17.24 MPa)
3500 psi(24.13 MPa)
Undoweled FaultDepth in. (mm)
0 1 YES 0.8 10 0.01 (0.16) 0.05 (1.15) 0.1 (2.64) 0.14 (3.54)0 1 YES 0.8 20 0.04 (0.93) 0.08 (2.11) 0.15 (3.88) 0.17 (4.2)0 1 YES 0.8 30 0.07 (1.84) 0.12 (3.15) 0.2 (5.11) 0.18 (4.65)120 1 YES 0.8 10 0.01 (0.16) 0.05 (1.15) 0.1 (2.64) 0.07 (1.71)120 1 YES 0.8 20 0.04 (0.93) 0.08 (2.11) 0.15 (3.88) 0.08 (2.02)120 1 YES 0.8 30 0.07 (1.84) 0.12 (3.15) 0.2 (5.11) 0.09 (2.24)

136
Table 51 continued
Fault Depth with Dowels [in. (mm)]Number of daysper year withtemperatures>90 °F (32 °C)
BaseType
WidenedLane Cd
Age(years)
1500 psi(10.34 MPa)
2500 psi(17.24 MPa)
3500 psi(24.13 MPa)
Undoweled FaultDepth in. (mm)
0 0 NO 1.2 10 0.02 (0.4) 0.05 (1.39) 0.11 (2.88) 0.12 (3.03)0 0 NO 1.2 20 0.05 (1.21) 0.09 (2.39) 0.16 (4.16) 0.14 (3.59)0 0 NO 1.2 30 0.09 (2.16) 0.14 (3.47) 0.21 (5.43) 0.16 (3.97)120 0 NO 1.2 10 0.02 (0.4) 0.05 (1.39) 0.11 (2.88) 0.05 (1.19)120 0 NO 1.2 20 0.05 (1.21) 0.09 (2.39) 0.16 (4.16) 0.06 (1.41)120 0 NO 1.2 30 0.09 (2.16) 0.14 (3.47) 0.21 (5.43) 0.06 (1.56)
Fault Depth with Dowels [in. (mm)]Number of daysper year withtemperatures>90 °F (32 °C)
BaseType
WidenedLane Cd
Age(years)
1500 psi(10.34 MPa)
2500 psi(17.24 MPa)
3500 psi(24.13 MPa)
Undoweled FaultDepth in. (mm)
0 1 NO 1.2 10 0 (0) 0.03 (0.75) 0.09 (2.24) 0.09 (2.25)0 1 NO 1.2 20 0.02 (0.45) 0.06 (1.63) 0.13 (3.4) 0.1 (2.67)0 1 NO 1.2 30 0.05 (1.31) 0.1 (2.62) 0.18 (4.58) 0.12 (2.95)120 1 NO 1.2 10 0 (0) 0.03 (0.75) 0.09 (2.24) 0.02 (0.41)120 1 NO 1.2 20 0.02 (0.45) 0.06 (1.63) 0.13 (3.4) 0.02 (0.48)120 1 NO 1.2 30 0.05 (1.31) 0.1 (2.62) 0.18 (4.58) 0.02 (0.53)
Fault Depth with Dowels [in. (mm)]Number of daysper year withtemperatures>90 °F (32 °C)
BaseType
WidenedLane Cd
Age(years)
1500 psi(10.34 MPa)
2500 psi(17.24 MPa)
3500 psi(24.13 MPa)
Undoweled FaultDepth in. (mm)
0 0 YES 1.2 10 0 (0) 0 (0.09) 0.06 (1.58) 0.01 (0.22)0 0 YES 1.2 20 0 (0) 0.03 (0.85) 0.1 (2.62) 0.01 (0.25)0 0 YES 1.2 30 0.02 (0.45) 0.07 (1.76) 0.15 (3.72) 0.01 (0.28)120 0 YES 1.2 10 0 (0) 0 (0.09) 0.06 (1.58) 0 (0)120 0 YES 1.2 20 0 (0) 0.03 (0.85) 0.1 (2.62) 0 (0)120 0 YES 1.2 30 0.02 (0.45) 0.07 (1.76) 0.15 (3.72) 0 (0)
Fault Depth with Dowels [in. (mm)]Number of daysper year withtemperatures>90 °F (32 °C)
BaseType
WidenedLane Cd
Age(years)
1500 psi(10.34 MPa)
2500 psi(17.24 MPa)
3500 psi(24.13 MPa)
Undoweled FaultDepth in. (mm)
0 1 YES 1.2 10 0 (0) 0 (0) 0.04(0.94) 0 (0)0 1 YES 1.2 20 0 (0) 0 (0.09) 0.07 (1.86) 0 (0)0 1 YES 1.2 30 0 (0) 0.04 (0.92) 0.11 (2.88) 0 (0)120 1 YES 1.2 10 0 (0) 0 (0) 0.04 (0.94) 0 (0)120 1 YES 1.2 20 0 (0) 0 (0.09) 0.07 (1.86) 0 (0)120 1 YES 1.2 30 0 (0) 0.04 (0.92) 0.11 (2.88) 0 (0)
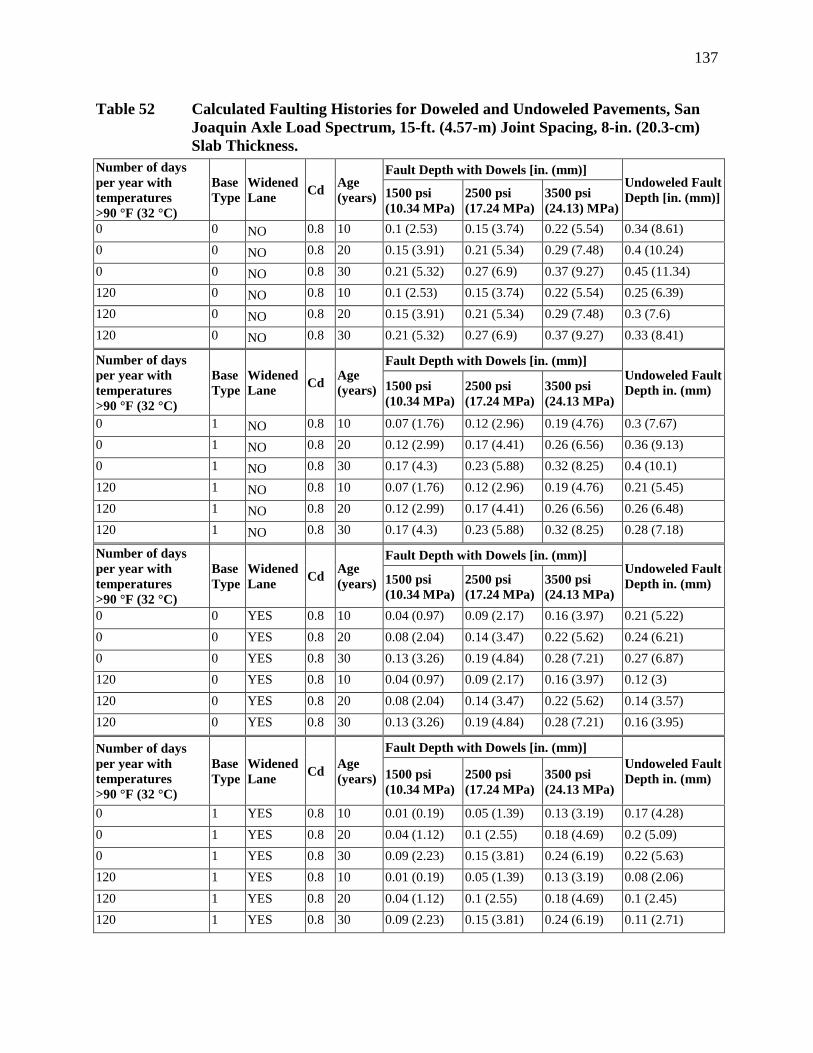
137
Table 52 Calculated Faulting Histories for Doweled and Undoweled Pavements, SanJoaquin Axle Load Spectrum, 15-ft. (4.57-m) Joint Spacing, 8-in. (20.3-cm)Slab Thickness.
Fault Depth with Dowels [in. (mm)]Number of daysper year withtemperatures>90 °F (32 °C)
BaseType
WidenedLane Cd Age
(years) 1500 psi(10.34 MPa)
2500 psi(17.24 MPa)
3500 psi(24.13) MPa)
Undoweled FaultDepth [in. (mm)]
0 0 NO 0.8 10 0.1 (2.53) 0.15 (3.74) 0.22 (5.54) 0.34 (8.61)0 0 NO 0.8 20 0.15 (3.91) 0.21 (5.34) 0.29 (7.48) 0.4 (10.24)0 0 NO 0.8 30 0.21 (5.32) 0.27 (6.9) 0.37 (9.27) 0.45 (11.34)120 0 NO 0.8 10 0.1 (2.53) 0.15 (3.74) 0.22 (5.54) 0.25 (6.39)120 0 NO 0.8 20 0.15 (3.91) 0.21 (5.34) 0.29 (7.48) 0.3 (7.6)120 0 NO 0.8 30 0.21 (5.32) 0.27 (6.9) 0.37 (9.27) 0.33 (8.41)
Fault Depth with Dowels [in. (mm)]Number of daysper year withtemperatures>90 °F (32 °C)
BaseType
WidenedLane Cd Age
(years) 1500 psi(10.34 MPa)
2500 psi(17.24 MPa)
3500 psi(24.13 MPa)
Undoweled FaultDepth in. (mm)
0 1 NO 0.8 10 0.07 (1.76) 0.12 (2.96) 0.19 (4.76) 0.3 (7.67)0 1 NO 0.8 20 0.12 (2.99) 0.17 (4.41) 0.26 (6.56) 0.36 (9.13)0 1 NO 0.8 30 0.17 (4.3) 0.23 (5.88) 0.32 (8.25) 0.4 (10.1)120 1 NO 0.8 10 0.07 (1.76) 0.12 (2.96) 0.19 (4.76) 0.21 (5.45)120 1 NO 0.8 20 0.12 (2.99) 0.17 (4.41) 0.26 (6.56) 0.26 (6.48)120 1 NO 0.8 30 0.17 (4.3) 0.23 (5.88) 0.32 (8.25) 0.28 (7.18)
Fault Depth with Dowels [in. (mm)]Number of daysper year withtemperatures>90 °F (32 °C)
BaseType
WidenedLane Cd Age
(years) 1500 psi(10.34 MPa)
2500 psi(17.24 MPa)
3500 psi(24.13 MPa)
Undoweled FaultDepth in. (mm)
0 0 YES 0.8 10 0.04 (0.97) 0.09 (2.17) 0.16 (3.97) 0.21 (5.22)0 0 YES 0.8 20 0.08 (2.04) 0.14 (3.47) 0.22 (5.62) 0.24 (6.21)0 0 YES 0.8 30 0.13 (3.26) 0.19 (4.84) 0.28 (7.21) 0.27 (6.87)120 0 YES 0.8 10 0.04 (0.97) 0.09 (2.17) 0.16 (3.97) 0.12 (3)120 0 YES 0.8 20 0.08 (2.04) 0.14 (3.47) 0.22 (5.62) 0.14 (3.57)120 0 YES 0.8 30 0.13 (3.26) 0.19 (4.84) 0.28 (7.21) 0.16 (3.95)
Fault Depth with Dowels [in. (mm)]Number of daysper year withtemperatures>90 °F (32 °C)
BaseType
WidenedLane Cd Age
(years) 1500 psi(10.34 MPa)
2500 psi(17.24 MPa)
3500 psi(24.13 MPa)
Undoweled FaultDepth in. (mm)
0 1 YES 0.8 10 0.01 (0.19) 0.05 (1.39) 0.13 (3.19) 0.17 (4.28)0 1 YES 0.8 20 0.04 (1.12) 0.1 (2.55) 0.18 (4.69) 0.2 (5.09)0 1 YES 0.8 30 0.09 (2.23) 0.15 (3.81) 0.24 (6.19) 0.22 (5.63)120 1 YES 0.8 10 0.01 (0.19) 0.05 (1.39) 0.13 (3.19) 0.08 (2.06)120 1 YES 0.8 20 0.04 (1.12) 0.1 (2.55) 0.18 (4.69) 0.1 (2.45)120 1 YES 0.8 30 0.09 (2.23) 0.15 (3.81) 0.24 (6.19) 0.11 (2.71)
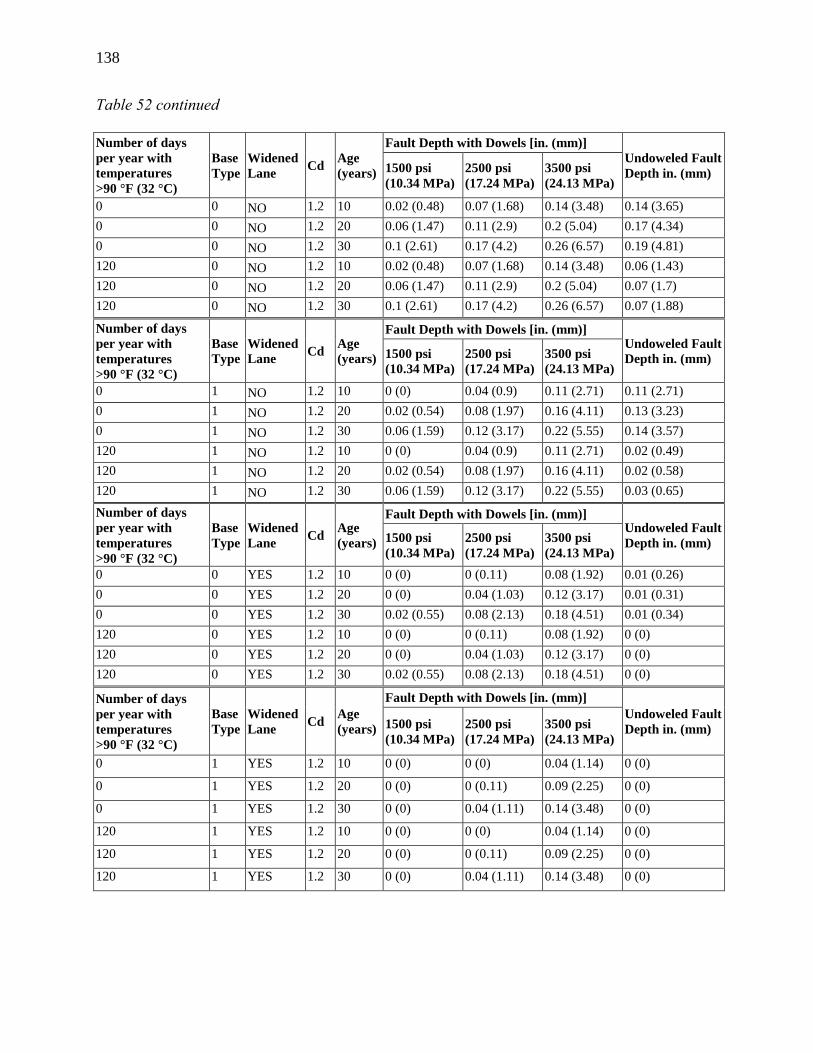
138
Table 52 continued
Fault Depth with Dowels [in. (mm)]Number of daysper year withtemperatures>90 °F (32 °C)
BaseType
WidenedLane Cd Age
(years) 1500 psi(10.34 MPa)
2500 psi(17.24 MPa)
3500 psi(24.13 MPa)
Undoweled FaultDepth in. (mm)
0 0 NO 1.2 10 0.02 (0.48) 0.07 (1.68) 0.14 (3.48) 0.14 (3.65)0 0 NO 1.2 20 0.06 (1.47) 0.11 (2.9) 0.2 (5.04) 0.17 (4.34)0 0 NO 1.2 30 0.1 (2.61) 0.17 (4.2) 0.26 (6.57) 0.19 (4.81)120 0 NO 1.2 10 0.02 (0.48) 0.07 (1.68) 0.14 (3.48) 0.06 (1.43)120 0 NO 1.2 20 0.06 (1.47) 0.11 (2.9) 0.2 (5.04) 0.07 (1.7)120 0 NO 1.2 30 0.1 (2.61) 0.17 (4.2) 0.26 (6.57) 0.07 (1.88)
Fault Depth with Dowels [in. (mm)]Number of daysper year withtemperatures>90 °F (32 °C)
BaseType
WidenedLane Cd Age
(years) 1500 psi(10.34 MPa)
2500 psi(17.24 MPa)
3500 psi(24.13 MPa)
Undoweled FaultDepth in. (mm)
0 1 NO 1.2 10 0 (0) 0.04 (0.9) 0.11 (2.71) 0.11 (2.71)0 1 NO 1.2 20 0.02 (0.54) 0.08 (1.97) 0.16 (4.11) 0.13 (3.23)0 1 NO 1.2 30 0.06 (1.59) 0.12 (3.17) 0.22 (5.55) 0.14 (3.57)120 1 NO 1.2 10 0 (0) 0.04 (0.9) 0.11 (2.71) 0.02 (0.49)120 1 NO 1.2 20 0.02 (0.54) 0.08 (1.97) 0.16 (4.11) 0.02 (0.58)120 1 NO 1.2 30 0.06 (1.59) 0.12 (3.17) 0.22 (5.55) 0.03 (0.65)
Fault Depth with Dowels [in. (mm)]Number of daysper year withtemperatures>90 °F (32 °C)
BaseType
WidenedLane Cd Age
(years) 1500 psi(10.34 MPa)
2500 psi(17.24 MPa)
3500 psi(24.13 MPa)
Undoweled FaultDepth in. (mm)
0 0 YES 1.2 10 0 (0) 0 (0.11) 0.08 (1.92) 0.01 (0.26)0 0 YES 1.2 20 0 (0) 0.04 (1.03) 0.12 (3.17) 0.01 (0.31)0 0 YES 1.2 30 0.02 (0.55) 0.08 (2.13) 0.18 (4.51) 0.01 (0.34)120 0 YES 1.2 10 0 (0) 0 (0.11) 0.08 (1.92) 0 (0)120 0 YES 1.2 20 0 (0) 0.04 (1.03) 0.12 (3.17) 0 (0)120 0 YES 1.2 30 0.02 (0.55) 0.08 (2.13) 0.18 (4.51) 0 (0)
Fault Depth with Dowels [in. (mm)]Number of daysper year withtemperatures>90 °F (32 °C)
BaseType
WidenedLane Cd Age
(years) 1500 psi(10.34 MPa)
2500 psi(17.24 MPa)
3500 psi(24.13 MPa)
Undoweled FaultDepth in. (mm)
0 1 YES 1.2 10 0 (0) 0 (0) 0.04 (1.14) 0 (0)
0 1 YES 1.2 20 0 (0) 0 (0.11) 0.09 (2.25) 0 (0)
0 1 YES 1.2 30 0 (0) 0.04 (1.11) 0.14 (3.48) 0 (0)
120 1 YES 1.2 10 0 (0) 0 (0) 0.04 (1.14) 0 (0)
120 1 YES 1.2 20 0 (0) 0 (0.11) 0.09 (2.25) 0 (0)
120 1 YES 1.2 30 0 (0) 0.04 (1.11) 0.14 (3.48) 0 (0)

139
Table 53 Calculated Faulting Histories for Doweled and Undoweled Pavements, SanDiego Axle Load Spectrum, 15-ft. (4.57-m) Joint Spacing, 12-in. (30.5-cm)Slab Thickness.
Fault Depth with Dowels [in. (mm)]Number of daysper year withtemperatures>90 °F (32 °C)
BaseType
WidenedLane Cd Age
(years) 1500 psi(10.34 MPa)
2500 psi(17.24 MPa)
3500 psi(24.13) MPa)
Undoweled FaultDepth [in. (mm)]
0 0 NO 0.8 10 0.08 (2.09) 0.12 (3.09) 0.18 (4.58) 0.25 (6.44)
0 0 NO 0.8 20 0.13 (3.23) 0.17 (4.41) 0.24 (6.18) 0.3 (7.65)
0 0 NO 0.8 30 0.17 (4.4) 0.22 (5.7) 0.3 (7.66) 0.33 (8.46)
120 0 NO 0.8 10 0.08 (2.09) 0.12 (3.09) 0.18 (4.58) 0.18 (4.6)
120 0 NO 0.8 20 0.13 (3.23) 0.17 (4.41) 0.24 (6.18) 0.22 (5.47)120 0 NO 0.8 30 0.17 (4.4) 0.22 (5.7) 0.3 (7.66) 0.24 (6.05)
Fault Depth with Dowels [in. (mm)]Number of daysper year withtemperatures>90 °F (32 °C)
BaseType
WidenedLane Cd Age
(years) 1500 psi(10.34 MPa)
2500 psi(17.24 MPa)
3500 psi(24.13 MPa)
Undoweled FaultDepth in. (mm)
0 1 NO 0.8 10 0.06 (1.45) 0.1 (2.44) 0.15 (3.93) 0.22 (5.66)
0 1 NO 0.8 20 0.1 (2.47) 0.14 (3.65) 0.21 (5.42) 0.26 (6.72)
0 1 NO 0.8 30 0.14 (3.55) 0.19 (4.86) 0.27 (6.82) 0.29 (7.44)
120 1 NO 0.8 10 0.06 (1.45) 0.1 (2.44) 0.15 (3.93) 0.15 (3.82)
120 1 NO 0.8 20 0.1 (2.47) 0.14 (3.65) 0.21 (5.42) 0.18 (4.54)
120 1 NO 0.8 30 0.14 (3.55) 0.19 (4.86) 0.27 (6.82) 0.2 (5.03)
Fault Depth with Dowels [in. (mm)]Number of daysper year withtemperatures>90 °F (32 °C)
BaseType
WidenedLane Cd Age
(years) 1500 psi(10.34 MPa)
2500 psi(17.24 MPa)
3500 psi(24.13 MPa)
Undoweled FaultDepth in. (mm)
0 0 YES 0.8 10 0.03 (0.8) 0.07 (1.79) 0.13 (3.28) 0.14 (3.63)
0 0 YES 0.8 20 0.07 (1.69) 0.11 (2.87) 0.18 (4.64) 0.17 (4.31)
0 0 YES 0.8 30 0.11 (2.69) 0.16 (4) 0.23 (5.96) 0.19 (4.77)
120 0 YES 0.8 10 0.03 (0.8) 0.07 (1.79) 0.13 (3.28) 0.07 (1.8)
120 0 YES 0.8 20 0.07 (1.69) 0.11 (2.87) 0.18 (4.64) 0.08 (2.13)
120 0 YES 0.8 30 0.11 (2.69) 0.16 (4) 0.23 (5.96) 0.09 (2.36)Fault Depth with Dowels [in. (mm)]Number of days
per year withtemperatures>90 °F (32 °C)
BaseType
WidenedLane Cd Age
(years) 1500 psi(10.34 MPa)
2500 psi(17.24 MPa)
3500 psi(24.13 MPa)
Undoweled FaultDepth in. (mm)
0 1 YES 0.8 10 0.01 (0.16) 0.05 (1.15) 0.1 (2.64) 0.11 (2.85)
0 1 YES 0.8 20 0.04 (0.93) 0.08 (2.11) 0.15 (3.88) 0.13 (3.39)
0 1 YES 0.8 30 0.07 (1.84) 0.12 (3.15) 0.2 (5.11) 0.15 (3.75)
120 1 YES 0.8 10 0.01 (0.16) 0.05 (1.15) 0.1 (2.64) 0.04 (1.02)
120 1 YES 0.8 20 0.04 (0.93) 0.08 (2.11) 0.15 (3.88) 0.05 (1.2)
120 1 YES 0.8 30 0.07 (1.84) 0.12 (3.15) 0.2 (5.11) 0.05 (1.33)
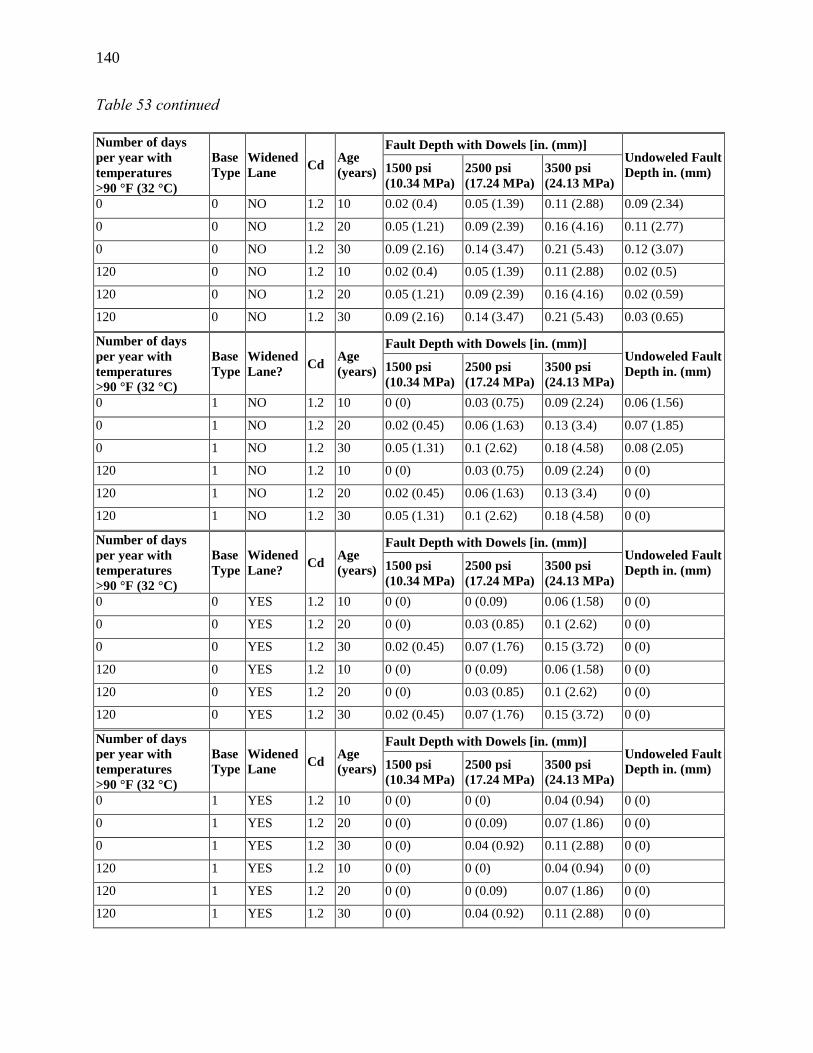
140
Table 53 continued
Fault Depth with Dowels [in. (mm)]Number of daysper year withtemperatures>90 °F (32 °C)
BaseType
WidenedLane Cd Age
(years) 1500 psi(10.34 MPa)
2500 psi(17.24 MPa)
3500 psi(24.13 MPa)
Undoweled FaultDepth in. (mm)
0 0 NO 1.2 10 0.02 (0.4) 0.05 (1.39) 0.11 (2.88) 0.09 (2.34)
0 0 NO 1.2 20 0.05 (1.21) 0.09 (2.39) 0.16 (4.16) 0.11 (2.77)
0 0 NO 1.2 30 0.09 (2.16) 0.14 (3.47) 0.21 (5.43) 0.12 (3.07)
120 0 NO 1.2 10 0.02 (0.4) 0.05 (1.39) 0.11 (2.88) 0.02 (0.5)
120 0 NO 1.2 20 0.05 (1.21) 0.09 (2.39) 0.16 (4.16) 0.02 (0.59)
120 0 NO 1.2 30 0.09 (2.16) 0.14 (3.47) 0.21 (5.43) 0.03 (0.65)
Fault Depth with Dowels [in. (mm)]Number of daysper year withtemperatures>90 °F (32 °C)
BaseType
WidenedLane? Cd Age
(years) 1500 psi(10.34 MPa)
2500 psi(17.24 MPa)
3500 psi(24.13 MPa)
Undoweled FaultDepth in. (mm)
0 1 NO 1.2 10 0 (0) 0.03 (0.75) 0.09 (2.24) 0.06 (1.56)
0 1 NO 1.2 20 0.02 (0.45) 0.06 (1.63) 0.13 (3.4) 0.07 (1.85)
0 1 NO 1.2 30 0.05 (1.31) 0.1 (2.62) 0.18 (4.58) 0.08 (2.05)
120 1 NO 1.2 10 0 (0) 0.03 (0.75) 0.09 (2.24) 0 (0)
120 1 NO 1.2 20 0.02 (0.45) 0.06 (1.63) 0.13 (3.4) 0 (0)
120 1 NO 1.2 30 0.05 (1.31) 0.1 (2.62) 0.18 (4.58) 0 (0)
Fault Depth with Dowels [in. (mm)]Number of daysper year withtemperatures>90 °F (32 °C)
BaseType
WidenedLane? Cd Age
(years) 1500 psi(10.34 MPa)
2500 psi(17.24 MPa)
3500 psi(24.13 MPa)
Undoweled FaultDepth in. (mm)
0 0 YES 1.2 10 0 (0) 0 (0.09) 0.06 (1.58) 0 (0)
0 0 YES 1.2 20 0 (0) 0.03 (0.85) 0.1 (2.62) 0 (0)
0 0 YES 1.2 30 0.02 (0.45) 0.07 (1.76) 0.15 (3.72) 0 (0)
120 0 YES 1.2 10 0 (0) 0 (0.09) 0.06 (1.58) 0 (0)
120 0 YES 1.2 20 0 (0) 0.03 (0.85) 0.1 (2.62) 0 (0)
120 0 YES 1.2 30 0.02 (0.45) 0.07 (1.76) 0.15 (3.72) 0 (0)
Fault Depth with Dowels [in. (mm)]Number of daysper year withtemperatures>90 °F (32 °C)
BaseType
WidenedLane Cd Age
(years) 1500 psi(10.34 MPa)
2500 psi(17.24 MPa)
3500 psi(24.13 MPa)
Undoweled FaultDepth in. (mm)
0 1 YES 1.2 10 0 (0) 0 (0) 0.04 (0.94) 0 (0)
0 1 YES 1.2 20 0 (0) 0 (0.09) 0.07 (1.86) 0 (0)
0 1 YES 1.2 30 0 (0) 0.04 (0.92) 0.11 (2.88) 0 (0)
120 1 YES 1.2 10 0 (0) 0 (0) 0.04 (0.94) 0 (0)
120 1 YES 1.2 20 0 (0) 0 (0.09) 0.07 (1.86) 0 (0)
120 1 YES 1.2 30 0 (0) 0.04 (0.92) 0.11 (2.88) 0 (0)
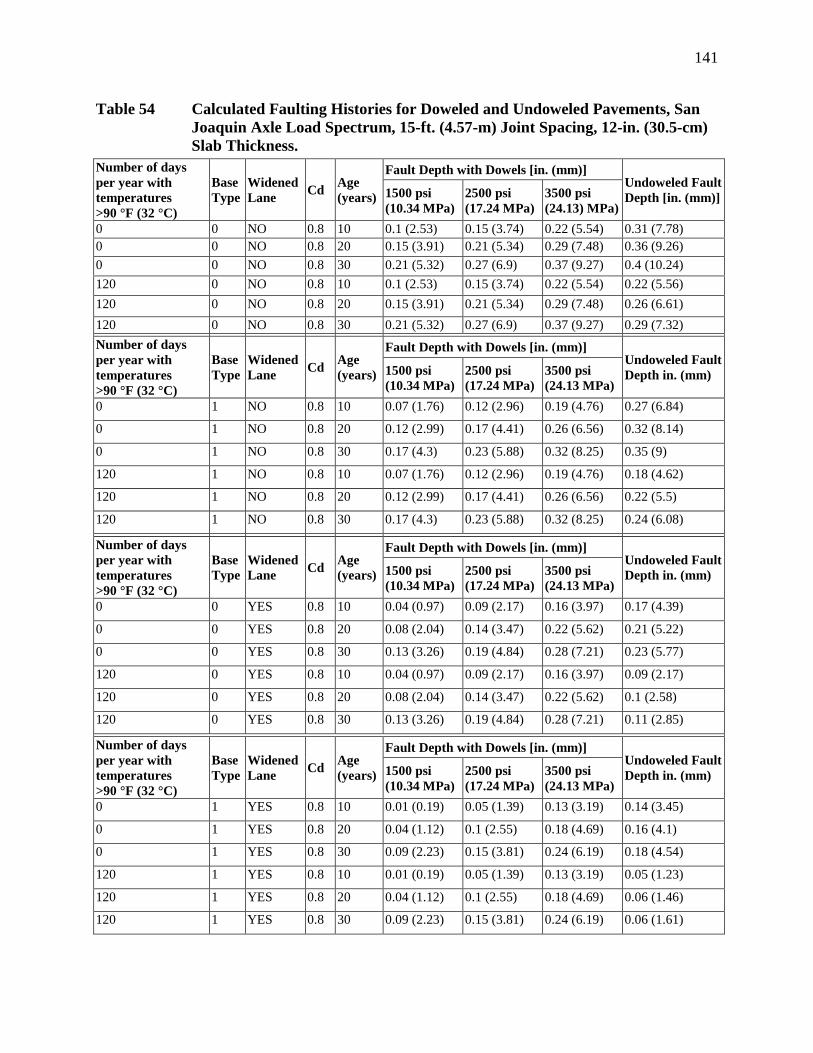
141
Table 54 Calculated Faulting Histories for Doweled and Undoweled Pavements, SanJoaquin Axle Load Spectrum, 15-ft. (4.57-m) Joint Spacing, 12-in. (30.5-cm)Slab Thickness.
Fault Depth with Dowels [in. (mm)]Number of daysper year withtemperatures>90 °F (32 °C)
BaseType
WidenedLane Cd Age
(years) 1500 psi(10.34 MPa)
2500 psi(17.24 MPa)
3500 psi(24.13) MPa)
Undoweled FaultDepth [in. (mm)]
0 0 NO 0.8 10 0.1 (2.53) 0.15 (3.74) 0.22 (5.54) 0.31 (7.78)0 0 NO 0.8 20 0.15 (3.91) 0.21 (5.34) 0.29 (7.48) 0.36 (9.26)0 0 NO 0.8 30 0.21 (5.32) 0.27 (6.9) 0.37 (9.27) 0.4 (10.24)120 0 NO 0.8 10 0.1 (2.53) 0.15 (3.74) 0.22 (5.54) 0.22 (5.56)120 0 NO 0.8 20 0.15 (3.91) 0.21 (5.34) 0.29 (7.48) 0.26 (6.61)120 0 NO 0.8 30 0.21 (5.32) 0.27 (6.9) 0.37 (9.27) 0.29 (7.32)
Fault Depth with Dowels [in. (mm)]Number of daysper year withtemperatures>90 °F (32 °C)
BaseType
WidenedLane Cd Age
(years) 1500 psi(10.34 MPa)
2500 psi(17.24 MPa)
3500 psi(24.13 MPa)
Undoweled FaultDepth in. (mm)
0 1 NO 0.8 10 0.07 (1.76) 0.12 (2.96) 0.19 (4.76) 0.27 (6.84)
0 1 NO 0.8 20 0.12 (2.99) 0.17 (4.41) 0.26 (6.56) 0.32 (8.14)
0 1 NO 0.8 30 0.17 (4.3) 0.23 (5.88) 0.32 (8.25) 0.35 (9)
120 1 NO 0.8 10 0.07 (1.76) 0.12 (2.96) 0.19 (4.76) 0.18 (4.62)
120 1 NO 0.8 20 0.12 (2.99) 0.17 (4.41) 0.26 (6.56) 0.22 (5.5)
120 1 NO 0.8 30 0.17 (4.3) 0.23 (5.88) 0.32 (8.25) 0.24 (6.08)
Fault Depth with Dowels [in. (mm)]Number of daysper year withtemperatures>90 °F (32 °C)
BaseType
WidenedLane Cd Age
(years) 1500 psi(10.34 MPa)
2500 psi(17.24 MPa)
3500 psi(24.13 MPa)
Undoweled FaultDepth in. (mm)
0 0 YES 0.8 10 0.04 (0.97) 0.09 (2.17) 0.16 (3.97) 0.17 (4.39)
0 0 YES 0.8 20 0.08 (2.04) 0.14 (3.47) 0.22 (5.62) 0.21 (5.22)
0 0 YES 0.8 30 0.13 (3.26) 0.19 (4.84) 0.28 (7.21) 0.23 (5.77)
120 0 YES 0.8 10 0.04 (0.97) 0.09 (2.17) 0.16 (3.97) 0.09 (2.17)
120 0 YES 0.8 20 0.08 (2.04) 0.14 (3.47) 0.22 (5.62) 0.1 (2.58)
120 0 YES 0.8 30 0.13 (3.26) 0.19 (4.84) 0.28 (7.21) 0.11 (2.85)
Fault Depth with Dowels [in. (mm)]Number of daysper year withtemperatures>90 °F (32 °C)
BaseType
WidenedLane Cd Age
(years) 1500 psi(10.34 MPa)
2500 psi(17.24 MPa)
3500 psi(24.13 MPa)
Undoweled FaultDepth in. (mm)
0 1 YES 0.8 10 0.01 (0.19) 0.05 (1.39) 0.13 (3.19) 0.14 (3.45)
0 1 YES 0.8 20 0.04 (1.12) 0.1 (2.55) 0.18 (4.69) 0.16 (4.1)
0 1 YES 0.8 30 0.09 (2.23) 0.15 (3.81) 0.24 (6.19) 0.18 (4.54)
120 1 YES 0.8 10 0.01 (0.19) 0.05 (1.39) 0.13 (3.19) 0.05 (1.23)
120 1 YES 0.8 20 0.04 (1.12) 0.1 (2.55) 0.18 (4.69) 0.06 (1.46)
120 1 YES 0.8 30 0.09 (2.23) 0.15 (3.81) 0.24 (6.19) 0.06 (1.61)

142
Table 54 Continued
Fault Depth with Dowels [in. (mm)]Number of daysper year withtemperatures>90 °F (32 °C)
BaseType
WidenedLane Cd Age
(years) 1500 psi(10.34 MPa)
2500 psi(17.24 MPa)
3500 psi(24.13 MPa)
Undoweled FaultDepth in. (mm)
0 0 NO 1.2 10 0.02 (0.48) 0.07 (1.68) 0.14 (3.48) 0.11 (2.82)
0 0 NO 1.2 20 0.06 (1.47) 0.11 (2.9) 0.2 (5.04) 0.13 (3.36)
0 0 NO 1.2 30 0.1 (2.61) 0.17 (4.2) 0.26 (6.57) 0.15 (3.71)
120 0 NO 1.2 10 0.02 (0.48) 0.07 (1.68) 0.14 (3.48) 0.02 (0.6)
120 0 NO 1.2 20 0.06 (1.47) 0.11 (2.9) 0.2 (5.04) 0.03 (0.71)
120 0 NO 1.2 30 0.1 (2.61) 0.17 (4.2) 0.26 (6.57) 0.03 (0.79)
Fault Depth with Dowels [in. (mm)]Number of daysper year withtemperatures>90 °F (32 °C)
BaseType
WidenedLane Cd Age
(years) 1500 psi(10.34 MPa)
2500 psi(17.24 MPa)
3500 psi(24.13 MPa)
Undoweled FaultDepth in. (mm)
0 1 NO 1.2 10 0 (0) 0.04 (0.9) 0.11 (2.71) 0.07 (1.88)
0 1 NO 1.2 20 0.02 (0.54) 0.08 (1.97) 0.16 (4.11) 0.09 (2.24)
0 1 NO 1.2 30 0.06 (1.59) 0.12 (3.17) 0.22 (5.55) 0.1 (2.48)
120 1 NO 1.2 10 0 (0) 0.04 (0.9) 0.11 (2.71) 0 (0)
120 1 NO 1.2 20 0.02 (0.54) 0.08 (1.97) 0.16 (4.11) 0 (0)
120 1 NO 1.2 30 0.06 (1.59) 0.12 (3.17) 0.22 (5.55) 0 (0)
Fault Depth with Dowels [in. (mm)]Number of daysper year withtemperatures>90 °F (32 °C)
BaseType
WidenedLane Cd Age
(years) 1500 psi(10.34 MPa)
2500 psi(17.24 MPa)
3500 psi(24.13 MPa)
Undoweled FaultDepth in. (mm)
0 0 YES 1.2 10 0 (0) 0 (0.11) 0.08 (1.92) 0 (0)
0 0 YES 1.2 20 0 (0) 0.04 (1.03) 0.12 (3.17) 0 (0)
0 0 YES 1.2 30 0.02 (0.55) 0.08 (2.13) 0.18 (4.51) 0 (0)
120 0 YES 1.2 10 0 (0) 0 (0.11) 0.08 (1.92) 0 (0)
120 0 YES 1.2 20 0 (0) 0.04 (1.03) 0.12 (3.17) 0 (0)
120 0 YES 1.2 30 0.02 (0.55) 0.08 (2.13) 0.18 (4.51) 0 (0)
Fault Depth with Dowels [in. (mm)]Number of daysper year withtemperatures>90 °F (32 °C)
BaseType
WidenedLane Cd Age
(years) 1500 psi(10.34 MPa)
2500 psi(17.24 MPa)
3500 psi(24.13 MPa)
Undoweled FaultDepth in. (mm)
0 1 YES 1.2 10 0 (0) 0 (0) 0.04 (1.14) 0 (0)
0 1 YES 1.2 20 0 (0) 0 (0.11) 0.09 (2.25) 0 (0)
0 1 YES 1.2 30 0 (0) 0.04 (1.11) 0.14 (3.48) 0 (0)
120 1 YES 1.2 10 0 (0) 0 (0) 0.04 (1.14) 0 (0)
120 1 YES 1.2 20 0 (0) 0 (0.11) 0.09 (2.25) 0 (0)
120 1 YES 1.2 30 0 (0) 0.04 (1.11) 0.14 (3.48) 0 (0)
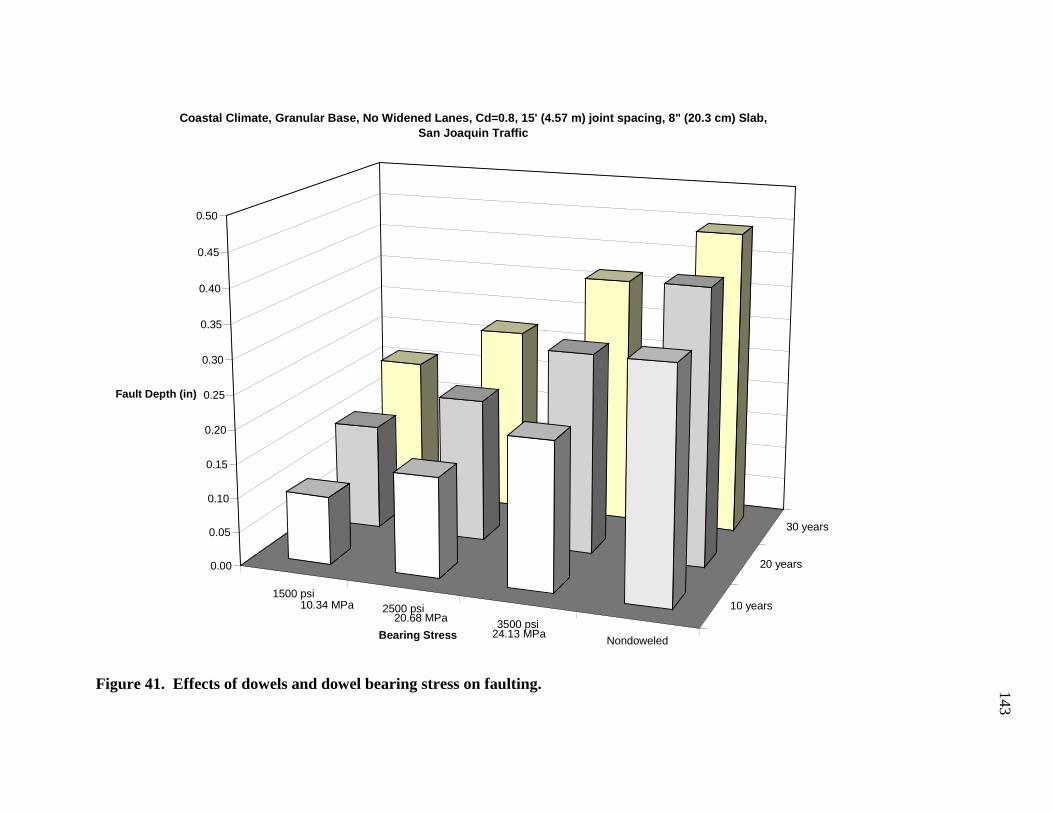
Fau
Figur
1500 psi2500 psi
3500 psiNondoweled
10 years
20 years
30 years
0.00
0.05
0.10
0.15
0.20
0.25
0.30
0.35
0.40
0.45
0.50
lt Depth (in)
Bearing Stress
Coastal Climate, Granular Base, No Widened Lanes, Cd=0.8, 15' (4.57 m) joint spacing, 8" (20.3 cm) Slab, San Joaquin Traffic
10.34 MPa20.68 MPa
24.13 MPa
e 41. Effects of dowels and dowel bearing stress on faulting. 143

Doweled, 2500psi
Nondoweled
StabilizedBase,
Widened
GranularBase,
Widened
StabilizedBase, NotWidened
GranularBase, NotWidened
0.00
0.05
0.10
0.15
0.20
0.25
0.30
0.35
0.40
0.45
0.50
Fault D
Coast, 15' (4.57 m) joint spacing, 8" (20.3 cm) Slab, San Joaquin Traffic, Cd=0.8, at 20 years
(17.24 MPa)
Figure 42. Effects of base type and wide truck lane on faulting.
epth (in)
144
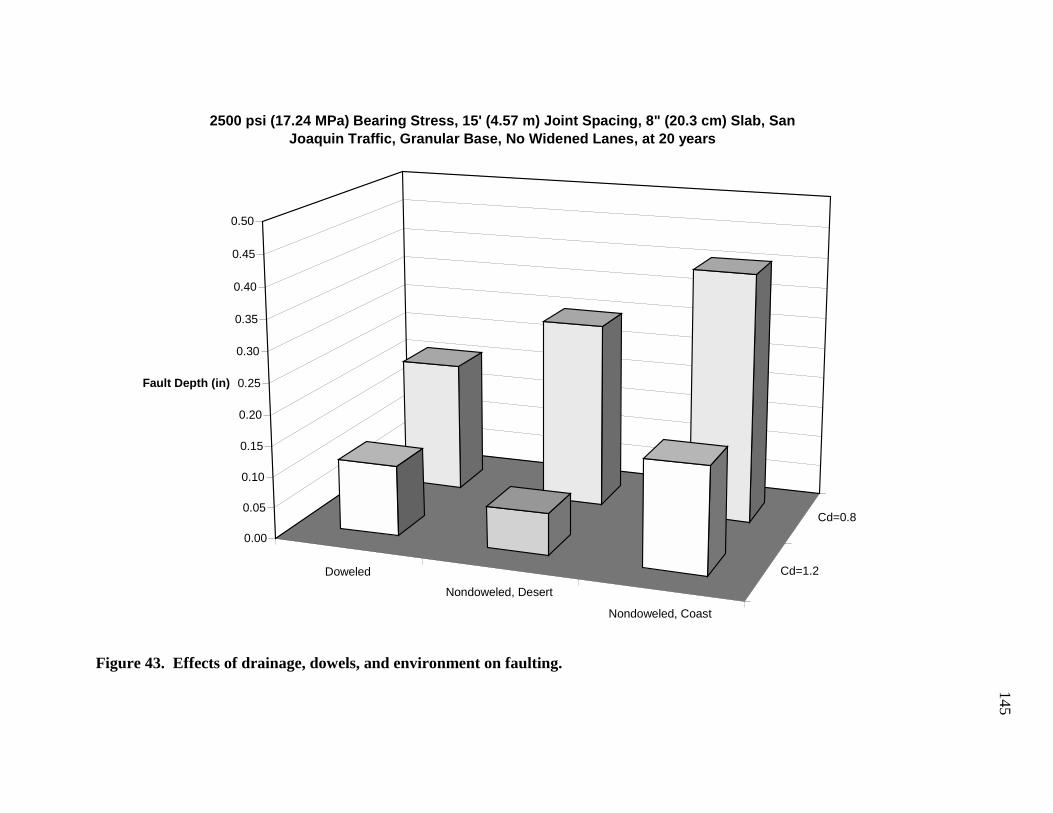
Figur
Doweled
Nondoweled, Desert
Nondoweled, Coast
Cd=1.2
Cd=0.8
0.00
0.05
0.10
0.15
0.20
0.25
0.30
0.35
0.40
0.45
0.50
Fault Depth (in)
2500 psi (17.24 MPa) Bearing Stress, 15' (4.57 m) Joint Spacing, 8" (20.3 cm) Slab, San Joaquin Traffic, Granular Base, No Widened Lanes, at 20 years
e 43. Effects of drainage, dowels, and environment on faulting.
145
146
3.8 Findings: Required Pavement Designs to Provide 30-year Life
The distresses present in current Caltrans rigid pavements and the performance of those
pavements is a function of the structural design, materials, construction, truck traffic, and
environmental conditions. In this chapter, a review has been made of the distresses present in
Caltrans rigid pavements, and the mechanisms for those distresses have been briefly described.
In addition, the designs, materials and construction used for those pavements over the years have
been presented, as well as historical reviews of rigid pavement performance.
The findings of this chapter are summarized in the following sections.
3.8.1 The Various Design Methods Currently in Use Produce Different Results
Several design methods are currently used across the United States. They do not produce
the same required slab thicknesses for the same design inputs. The ACPA/AASHTO and PCA
methods consider both fatigue cracking and distresses associated with loss of support to the slab.
The Illinois DOT method considers transverse fatigue cracking only. The PCA and Illinois DOT
methods use a mechanistic-based approach for transverse fatigue cracking analysis, while the
ACPA/AASHTO method uses an empirical approach. The ACPA/AASHTO method is
extrapolated very far beyond the traffic levels encountered at the AASHO Road Test.
3.8.2 ACPA/AASHTO Design Method Slab Thickness Are Generally Greater than Those ofOther Methods
In general, the required slab thicknesses for the ACPA/AASHTO method are much
thicker than those of the Illinois DOT method. The required thicknesses from the Illinois DOT
method are typically somewhat thicker than those from the PCA method, although at times they
are in agreement.
147
3.8.3 Axle Loads will Probably Increase Over Next 30 Years
It is likely that axle loads will increase over the next 30 years, due to political pressure,
and the need to increase freight throughput without increasing lane capacity for trucks.
3.8.4 Caltrans Flexural Strength Requirements Are Low Compared to Other State DOTs
Current concrete flexural strengths required by Caltrans are less than those required by
many other State DOTs.
3.8.5 Dowels are Necessary to Improve Faulting Performance
The inclusion of dowels to increase load transfer at the transverse joints is necessary to
obtain improved resistance to faulting, based on the results from the PCA and ACPA/AASHTO
methods.
3.8.6 Large Diameter Dowels Increase Dowel Effectiveness
The benefit of including dowels to reduce faulting is substantially increased when large
diameter dowels are used. The largest size dowel possible should be used, up to about 37 mm,
provided that the concrete slab is thick enough to prevent cracking of the concrete cover around
the dowels.
3.8.7 Use of Widened Truck Lanes or Tied Concrete Shoulders Improves Fatigue CrackingPerformance
Use of widened truck lanes or tied concrete shoulders to provide good load transfer
across longitudinal joints is necessary to improve fatigue cracking performance. These features

148
will improve performance with respect to distresses associated with loss of support to the slab as
well.
3.8.8 Use of Non-Erodable Bases Improves Distresses Associated with Loss of SubgradeSupport
Use of non-erodable bases will improve performance for distresses associated with loss
of subgrade support, such as faulting and corner cracking. The use of very stiff bases that cannot
accommodate temperature curling may be detrimental to transverse fatigue cracking
performance.
3.8.9 Concrete Strength and Slab Thickness Are Related in Terms of Cracking Resistance
Concrete strength of at least 650 psi (4.48 MPa) is needed to limit the thickness of the
concrete slabs. Concrete strength of less than 650 psi (4.48 MPa) will require thicker slabs to
prevent cracking.
3.8.10 Coefficient of Thermal Expansion Affects Tensile Stresses in Concrete
The coefficient of thermal expansion of the concrete plays an important role in
determining tensile stresses in the slab due to temperature curling. Much thicker slabs are
required if the new FSHCC coefficient of thermal expansion is greater than that of Portland
cement concrete.

149
3.8.11 Axle Load Spectra Affect Required Slab Thickness
Axle load spectra play a role in determining required slab thickness because the heaviest
loads in the spectrum generally determine pavement performance with respect to both fatigue
cracking and faulting.
3.8.12 Design Methods Mostly Agree on Relative Benefits and Drawbacks of Design Variables
Although the three design methods generally did not require the same slab thicknesses for
similar design inputs, they are nearly always in agreement as to the benefits and drawbacks of
structural design features such as dowels, tied concrete shoulders, concrete flexural strength,
thicker concrete slabs, and axle load spectra. The results from the PCA and Illinois DOT
methods indicate that it may be possible to obtain 30-year design lives using 8- or 9-inch (203-
or 229-mm) concrete slabs. Those methods indicate that in order to obtain 30-year design lives,
the pavements must include all of the following features:
• concrete flexural strengths of 650 psi (4.48 MPa) or higher,
• lower concrete coefficient of thermal expansion (<5×10⁻⁶ in./in./°F),
• dowels, with as large diameters as possible while providing sufficient concrete cover,
• tied concrete shoulders with high load transfer, or widened truck lanes, preferably 0.6
m wider than standard (4.3 m as opposed to 3.7 m),
• non-erodable bases, that at the same time are not so stiff under loading times of
several hours that they cannot deform when the concrete slab is curling under
temperature changes.
150
Even with all of these features included in the proposed pavements, 30-year design lives
with 8- or 9-inch (203- or 229-mm) slabs may not be consistently obtainable under the following
conditions:
• joint spacings greater than 15 ft. (4.57 m),
• the Desert and Valley climatic regions, in which day to night temperature changes
introduce large curling stresses.
151
4.0 RECOMMENDATIONS
The recommendations in the following sections are based on the findings presented in
Sections 3.0 and 4.0 regarding the distresses and conditions that should be addressed in the
LLPRS pavement designs, and the design features that should be included in the design to
provide at least 30-year design lives.
4.1 Faulting
Faulting is the most prevalent distress occurring in Caltrans rigid pavements. Transverse
cracking due to axle loading and temperature curling, corner cracking, and longitudinal cracking
are also present in the network. Each distress must be addressed specifically in the pavement
designs.
4.2 Axle Loads
Axle loads and the number of trucks in the design lanes will undoubtedly increase over
the next 30 years. Designs that may have worked in the past may not work in the future, and
designs that did not provide adequate performance in the past will deteriorate even more quickly
under the increased loading. This traffic and loading growth must be accounted for in the
pavement designs. The efficiency of evaluating truck traffic in terms of ESALs, as opposed to
evaluating distress mechanisms in terms of axle load spectra, merits further investigation.
4.3 Climate and Slab Length
The performance of the LLPRS proposed pavement structures will depend in large part
on the specific climate and the slab lengths of the adjoining lanes. Rigid pavements in the Desert
and Valley climates, with their large day to night temperature changes, will deteriorate with

152
respect to cracking faster than the milder coastal climates. Transverse joint spacings greater than
15 ft. (4.57 m) will also experience more rapid cracking than joint spacing less than 15 ft. (4.57
m), all other variables being equal. Pavement structural designs must be considered on a project
by project basis, rather than applying a uniform structure across a variety of climates and joint
spacings, as well as base, subgrade, and drainage conditions.
4.4 Stiff Bases
The use of very stiff bases may lead to earlier cracking because of temperature curling.
This is particularly the case in the Valley and Desert climates with long slab lengths and large
concrete coefficients of thermal expansion. At the same time, bases should be as non-erodable
as possible in order to minimize loss of support to the slab, which contributes to faulting and
corner cracking. The effectiveness of keeping the existing CTB bears further investigation,
especially to evaluate its strength and condition. New asphalt concrete bases with relatively high
asphalt contents may provide the desired properties of being non-erodable, yet with low stiffness
under loading times of several hours. Alternative bases should be considered with respect to
structural performance and constructability if existing CTB is deemed unsatisfactory.
4.5 Flexural Strength and Coefficient of Thermal Expansion
The most important concrete properties from a pavement structural performance
perspective are flexural strength and coefficient of thermal expansion. Long term durability is
also important, and is addressed in a separate report. (38) Large flexural strengths (650 to 800
psi [4.44 to 5.52 MPa]) and small coefficients of thermal expansion (3×10⁻⁶ to 5×10⁻⁶ in./in./°F)
are needed to minimize slab thicknesses. Development of materials meeting these requirements
is essential if the desired design life of 30 or more years is to be obtained.

153
4.6 Dowels, Tied Concrete Shoulders, and Widened Truck Lanes
It is apparent from the design methods that the use of dowels is necessary to address
faulting. The use of tied concrete shoulders or widened truck lanes is needed to address fatigue
cracking and loss of support to the slab, which contributes to faulting and corner cracking. These
features should be included in the LLPRS-Rigid strategies based on these preliminary
investigations performed using existing design methods.
4.7 Slab Thickness
Although not exactly in agreement, the PCA and Illinois DOT methods indicate that 8-
and 9-inch (203- and 229-mm) concrete slabs may provide adequate design lives, provided that
all of the other factors included in these recommendations are addressed. At this time, it can be
assumed that 8- to 9-in. (203- 229-mm) thicknesses will be adequate for some projects. At the
same time, methods for constructing somewhat thicker slab thicknesses, probably ranging from
10 to 12 inches (254 to 305 mm), should be considered for projects with combinations of the
heaviest truck traffic, Valley and Desert climates, and slab lengths greater than 15 ft. (4.57 m).
These recommendations are based on preliminary investigations conducted using existing
design methods. Except for the study of the effects of bearing stress and dowel sizes on faulting
performance, the design methods used in this report are primarily calibrated for conditions in the
Midwestern states. Despite the Midwestern calibration, the results of this study provide good
indications of the structure and materials requirements necessary to produce LLPRS pavements
that will provide 30 or more years of good performance. Continued investigation of each of the
variables included in this study is necessary for verification and calibration under expected
conditions in California over the next 30 years.

154
155
5.0 REFERENCES
1. Invitation to PCCP Lane Replacement Team meeting from Caltrans Office of RoadwayMaintenance. 1997. (April 1).
2. California Department of Transportation. 1995. CAL/APT Strategic Plan (July 1995 - July1997), adopted by the CAL/APT Steering Committee, May 18, 1995
3. Caltrans Maintenance Program, Pavement Management Information Branch. 1996. 1995State of the Pavement (November).
4. Roberts, J., Marsh, R., and Herritt, K. 1997. Presentations made at Concrete PavementRehabilitation Workshop/Seminar, July 16-18, Ontario, California.
5. ERES Consultants, Inc. 1997. Systems for Design of Highway Pavements. NationalCooperative Highway Research Program, Report 1-32, Washington, D. C.
6. Yu, H. T., Smith, K. D., Darter, M. I., Jiang, J., and Khazanovich, L. 1997. Performance ofConcrete Pavements, Volume III, Improving Concrete Pavement Performance. FederalHighways Administration Report no. FHWA-RD-95-111, Washington, D. C. (December).
7. Darter, M., and Barenberg, E. 1977. Design of Zero Maintenance Plain Jointed ConcretePavements, Vol. 1, Development of Design Procedures. Federal Highway AdministrationReport no. FHWA-RD-77-111.
8. ERES Consultants, Inc. Concrete Pavement Design Manual, National Highway InstituteCourse No. 13111. Federal Highway Administration Report no. FHWA-HI-92-015,Washington, D. C. (January).
9. Roesler, J., J. Harvey, J. Farver, F. Long. 1998. Investigation of Design and ConstructionIssues for Long Life Concrete Pavement Strategies. Draft Report for the CaliforniaDepartment of Transportation, Institute of Transportation Studies, University of California,Berkeley.
10. Wells, G. K. and Nokes, W. A. 1991. Synthesize PCCP Design Parameter Researched byCaltrans and Others. California Department of Transportation, Division of New Technology,Materials and Research, Office of Pavement. (June 10).
11. Harvey, J., Tsai, B., Long, F., and Hung, D. 1997. CAL/APT Program: Asphalt TreatedPermeable Base (ATPB), Laboratory Tests, Performance Predictions and Evaluation ofCaltrans’ and Other Agencies’ Experience. Draft Report for the California Department ofTransportation. Institute of Transportation Studies, University of California, Berkeley.(July).
12. Macleod, D. R., and Monismith, C. L. 1979. Performance of Portland Cement ConcretePavement. Department of Civil Engineering, Institute of Transportation Studies, Universityof California, Berkeley. (February).
13. Vesic, A. S. and Saxena, S. K. 1969. Analysis of Structural Behavior of Road test RigidPavements. Highway Research Record no 291. Highway Research Board, Washington, D.C.
14. Hveem, F. N. 1949. A Report of an Investigation to Determine Causes for Displacement andFaulting at the Joints in Portland Cement Concrete Pavements. California Division ofHighways, Materials and Research Department (M&R), Sacramento, California. (May 17).
15. McNerny, J. M. 1955. Report on Project 7-LA, KER-4-A, D, D, A. Portland CementAssociation, Skokie, Illinois, (26 April).
16. Tremper, B. 1956. Follow-up report to McNerney (Reference 15). California Division ofHighways. (October 2).
156
17. Morrish, L. 1961. The Road Story, GM Project 0.56-6. General Motor Corporation. (June14).
18. Hawks, N. 1998. Draft Summary of Team Presentations. Special Programs, TransportationResearch Board, National Research Council, Washington, D. C. (March 2).
19. Caltrans Maintenance Program, Management Information Branch. 1998. Table ofRehabilitation Projects on ICES Routes Qualified for Long-Life Strategies Based on 1995Pavement Management System Data. Sacramento.
20. Stahl, K. 1998. Notes from discussions with author. Caltrans District 7 Materials Engineer.(summer).
21. Huang, Y. H. 1993. Pavement Analysis and Design. Prentice-Hall: Englewood Cliffs, NewJersey.
22. Synthesis of Highway Practice 189. 1993. Pavement Structural Design Practices. NationalCooperative Highway Research Program, Washington, D. C.
23. Packard, R. G. 1984. Thickness Design for Concrete Highway and Street Pavements.Portland Cement Association, 46 pp.
24. Packard, R. G. and Tayabji, S. D. 1985. New PCA Thickness Design Procedure for ConcreteHighway and Street Pavements. Proceedings, 3rd International Conference on ConcretePavement Design, 225-236. Purdue University, West Lafayette, Indiana.
25. Portland Cement Association, “PCAPAV Computer Program, Version 2.10,” 1990.26. American Association of State Highway and Transportation Officials. 1986. Guide for the
Design of Pavement Structures. Washington, D. C.27. Highway Research Board. 1960. The AASHO Road Test: Report 1, History and Description
of the Project. Highway Research Board, Washington, D. C.28. American Concrete Pavement Association. 1994. Pavement Analysis Software (PAS),
Version 5.01.29. Zollinger, D. G. and Barenberg, E. J. 1989. Proposed Mechanistic Based Design Procedure
for Jointed Concrete Pavements. Illinois Cooperative Highway Research Program - 518,University of Illinois, Urbana, Illinois, (May).
30. Salsilli Murua, R. A. 1991. Calibrated Mechanistic Design Procedure for Jointed PlainConcrete Pavements. Ph.D. diss. University of Illinois, Urbana-Champaign, IL.
31. Dempsey, B. J., Herlache, W. A., and Patel, A. J. 1986. Climatic-Materials-StructuralPavement Analysis Program. Transportation Research Record no. 1095:111-23, TRB.
32. Barenberg, E. J. 1994. ILLICON - Calibrated Mechanistic Structural Procedures for JointedConcrete Pavements. University of Illinois, Department of Civil Engineering, Urbana-Champaign, Illinois.
33. ERES Consultants Inc. 1997. Datapave 97 Version 1.0. Software prepared for FederalHighway Administration, LTPP Database Implementation Team, Washington, D. C.
34. Dempsey, B. et al. 1997. Integrated Climate Model. University of Illinois, Champaign-Urbana, Illinois.
35. American Concrete Paving Association. 1993. Simplified Guide for the Design of ConcretePavements. Arlington Heights, Illinois.
36. Freeman, R. B., Newman, J. K., and Murray, S. D. 1997. Evaluation of Hydraulic Cement-Based Materials for Rapid Repair of Airfield Spalls. US Army Corps of Engineers,Waterways Experiment Station, Report no. GL-97-13. (August) 38 pp.
157
37. Roesler, J., Scheffy, C., Ali, A., and Bush, C. Construction, Instrumentation, and Testing ofFast-Setting Hydraulic Cement Concrete in Palmdale, California, Draft report prepared forCalifornia Department of Transportation, March, 1999.
38. Kurtis, K. and P. Monteiro, Analysis of Durability of Advanced Cementitious Materials forRigid Pavement Construction in California, Report prepared for California Department ofTransportation, Pavement Research Center, CAL/APT Program, Institute of TransportationStudies, University of California, Berkeley, April, 1999.

158
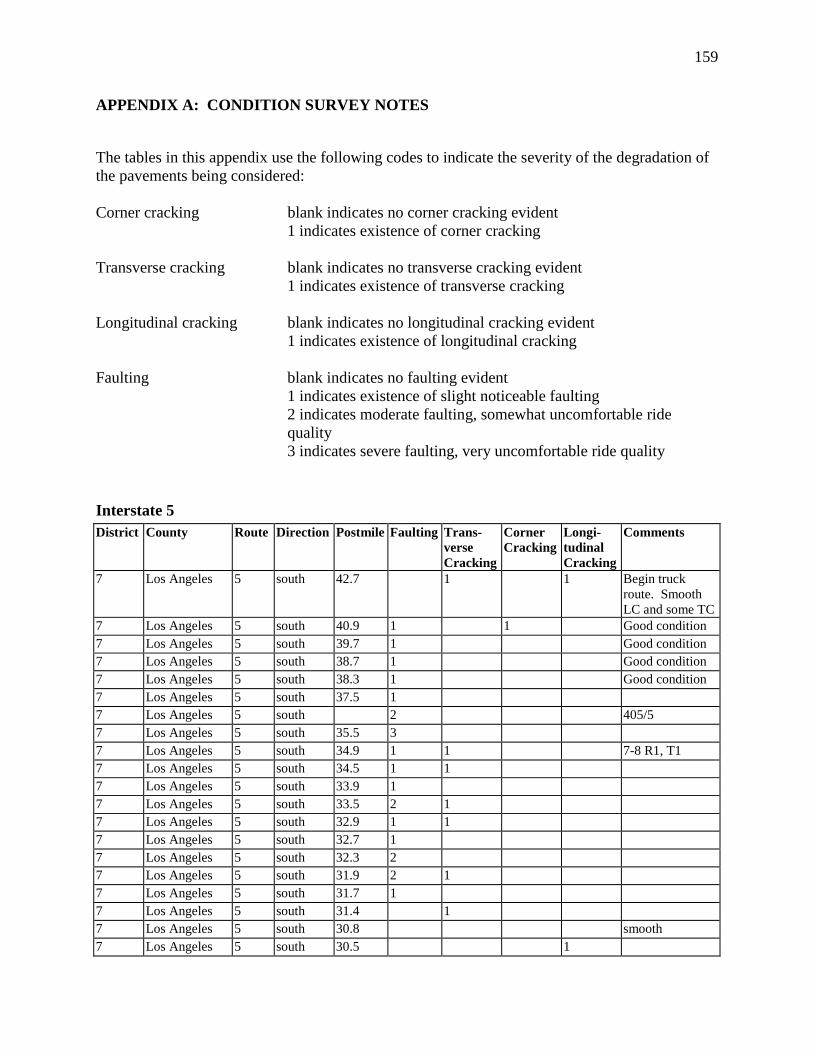
159
APPENDIX A: CONDITION SURVEY NOTES
The tables in this appendix use the following codes to indicate the severity of the degradation ofthe pavements being considered:
Corner cracking blank indicates no corner cracking evident1 indicates existence of corner cracking
Transverse cracking blank indicates no transverse cracking evident1 indicates existence of transverse cracking
Longitudinal cracking blank indicates no longitudinal cracking evident1 indicates existence of longitudinal cracking
Faulting blank indicates no faulting evident1 indicates existence of slight noticeable faulting2 indicates moderate faulting, somewhat uncomfortable ridequality3 indicates severe faulting, very uncomfortable ride quality
Interstate 5District County Route Direction Postmile Faulting Trans-
verseCracking
CornerCracking
Longi-tudinalCracking
Comments
7 Los Angeles 5 south 42.7 1 1 Begin truckroute. SmoothLC and some TC
7 Los Angeles 5 south 40.9 1 1 Good condition7 Los Angeles 5 south 39.7 1 Good condition7 Los Angeles 5 south 38.7 1 Good condition7 Los Angeles 5 south 38.3 1 Good condition7 Los Angeles 5 south 37.5 17 Los Angeles 5 south 2 405/57 Los Angeles 5 south 35.5 37 Los Angeles 5 south 34.9 1 1 7-8 R1, T17 Los Angeles 5 south 34.5 1 17 Los Angeles 5 south 33.9 17 Los Angeles 5 south 33.5 2 17 Los Angeles 5 south 32.9 1 17 Los Angeles 5 south 32.7 17 Los Angeles 5 south 32.3 27 Los Angeles 5 south 31.9 2 17 Los Angeles 5 south 31.7 17 Los Angeles 5 south 31.4 17 Los Angeles 5 south 30.8 smooth7 Los Angeles 5 south 30.5 1
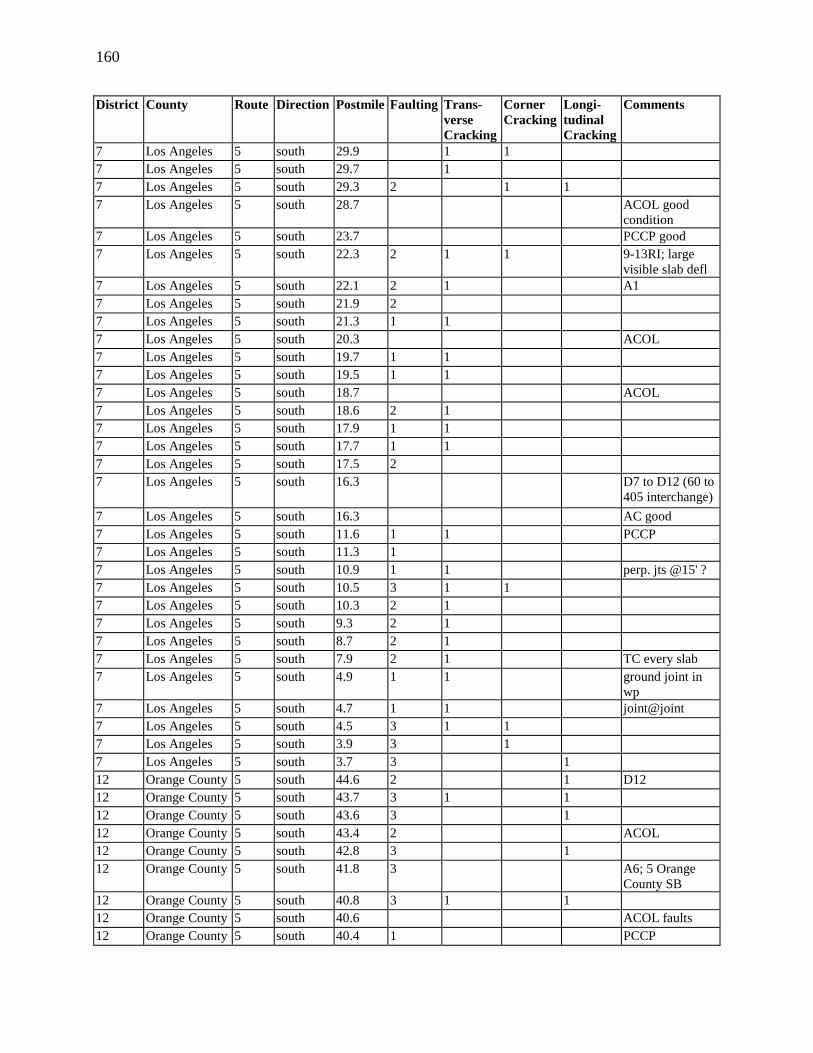
160
District County Route Direction Postmile Faulting Trans-verseCracking
CornerCracking
Longi-tudinalCracking
Comments
7 Los Angeles 5 south 29.9 1 17 Los Angeles 5 south 29.7 17 Los Angeles 5 south 29.3 2 1 17 Los Angeles 5 south 28.7 ACOL good
condition7 Los Angeles 5 south 23.7 PCCP good7 Los Angeles 5 south 22.3 2 1 1 9-13RI; large
visible slab defl7 Los Angeles 5 south 22.1 2 1 A17 Los Angeles 5 south 21.9 27 Los Angeles 5 south 21.3 1 17 Los Angeles 5 south 20.3 ACOL7 Los Angeles 5 south 19.7 1 17 Los Angeles 5 south 19.5 1 17 Los Angeles 5 south 18.7 ACOL7 Los Angeles 5 south 18.6 2 17 Los Angeles 5 south 17.9 1 17 Los Angeles 5 south 17.7 1 17 Los Angeles 5 south 17.5 27 Los Angeles 5 south 16.3 D7 to D12 (60 to
405 interchange)7 Los Angeles 5 south 16.3 AC good7 Los Angeles 5 south 11.6 1 1 PCCP7 Los Angeles 5 south 11.3 17 Los Angeles 5 south 10.9 1 1 perp. jts @15' ?7 Los Angeles 5 south 10.5 3 1 17 Los Angeles 5 south 10.3 2 17 Los Angeles 5 south 9.3 2 17 Los Angeles 5 south 8.7 2 17 Los Angeles 5 south 7.9 2 1 TC every slab7 Los Angeles 5 south 4.9 1 1 ground joint in
wp7 Los Angeles 5 south 4.7 1 1 joint@joint7 Los Angeles 5 south 4.5 3 1 17 Los Angeles 5 south 3.9 3 17 Los Angeles 5 south 3.7 3 112 Orange County 5 south 44.6 2 1 D1212 Orange County 5 south 43.7 3 1 112 Orange County 5 south 43.6 3 112 Orange County 5 south 43.4 2 ACOL12 Orange County 5 south 42.8 3 112 Orange County 5 south 41.8 3 A6; 5 Orange
County SB12 Orange County 5 south 40.8 3 1 112 Orange County 5 south 40.6 ACOL faults12 Orange County 5 south 40.4 1 PCCP
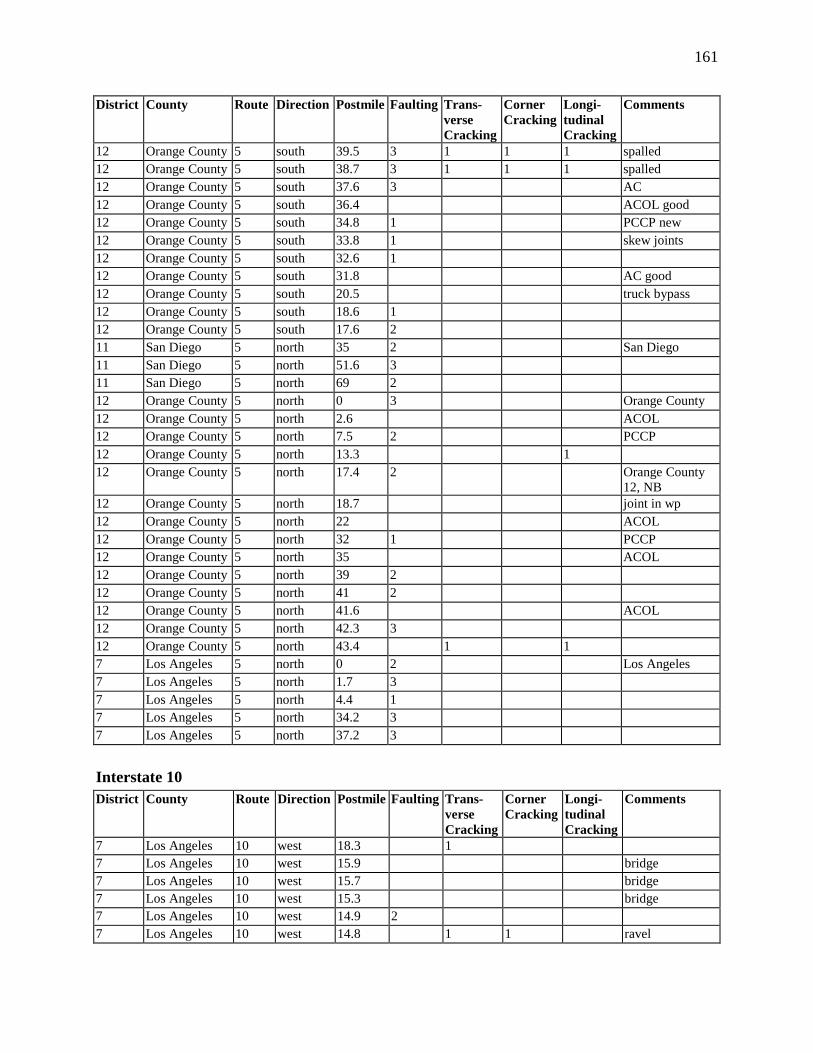
161
District County Route Direction Postmile Faulting Trans-verseCracking
CornerCracking
Longi-tudinalCracking
Comments
12 Orange County 5 south 39.5 3 1 1 1 spalled12 Orange County 5 south 38.7 3 1 1 1 spalled12 Orange County 5 south 37.6 3 AC12 Orange County 5 south 36.4 ACOL good12 Orange County 5 south 34.8 1 PCCP new12 Orange County 5 south 33.8 1 skew joints12 Orange County 5 south 32.6 112 Orange County 5 south 31.8 AC good12 Orange County 5 south 20.5 truck bypass12 Orange County 5 south 18.6 112 Orange County 5 south 17.6 211 San Diego 5 north 35 2 San Diego11 San Diego 5 north 51.6 311 San Diego 5 north 69 212 Orange County 5 north 0 3 Orange County12 Orange County 5 north 2.6 ACOL12 Orange County 5 north 7.5 2 PCCP12 Orange County 5 north 13.3 112 Orange County 5 north 17.4 2 Orange County
12, NB12 Orange County 5 north 18.7 joint in wp12 Orange County 5 north 22 ACOL12 Orange County 5 north 32 1 PCCP12 Orange County 5 north 35 ACOL12 Orange County 5 north 39 212 Orange County 5 north 41 212 Orange County 5 north 41.6 ACOL12 Orange County 5 north 42.3 312 Orange County 5 north 43.4 1 17 Los Angeles 5 north 0 2 Los Angeles7 Los Angeles 5 north 1.7 37 Los Angeles 5 north 4.4 17 Los Angeles 5 north 34.2 37 Los Angeles 5 north 37.2 3
Interstate 10District County Route Direction Postmile Faulting Trans-
verseCracking
CornerCracking
Longi-tudinalCracking
Comments
7 Los Angeles 10 west 18.3 17 Los Angeles 10 west 15.9 bridge7 Los Angeles 10 west 15.7 bridge7 Los Angeles 10 west 15.3 bridge7 Los Angeles 10 west 14.9 27 Los Angeles 10 west 14.8 1 1 ravel
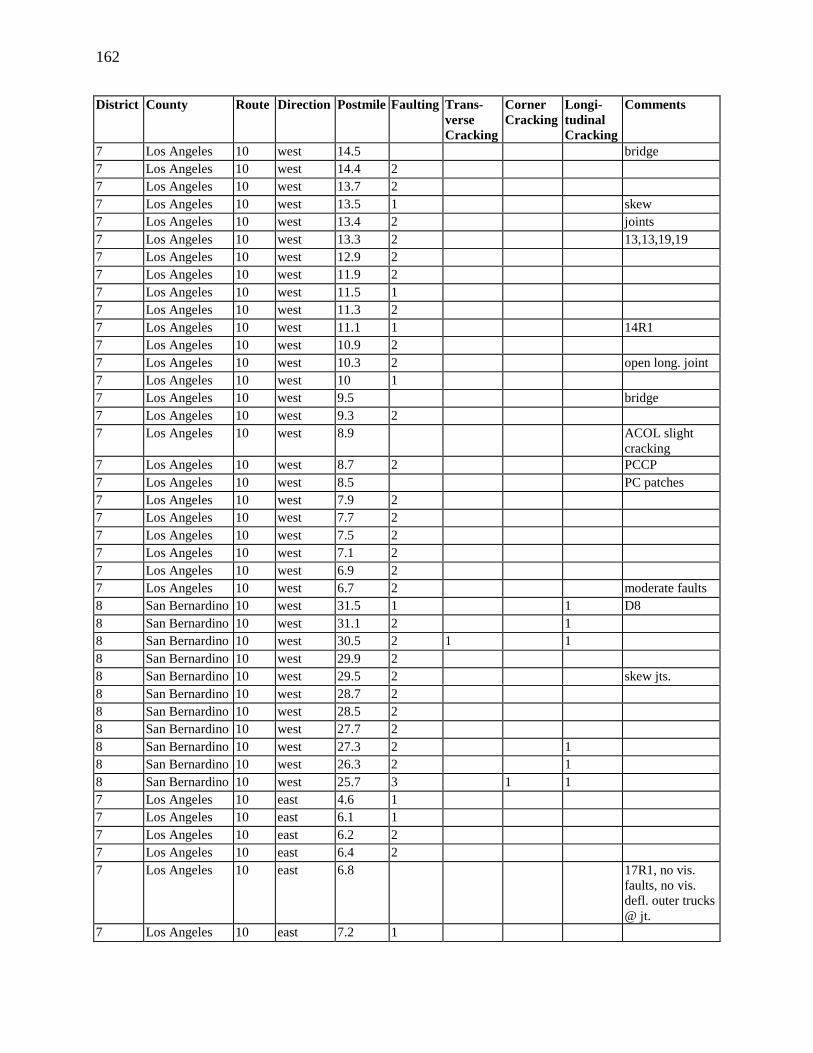
162
District County Route Direction Postmile Faulting Trans-verseCracking
CornerCracking
Longi-tudinalCracking
Comments
7 Los Angeles 10 west 14.5 bridge7 Los Angeles 10 west 14.4 27 Los Angeles 10 west 13.7 27 Los Angeles 10 west 13.5 1 skew7 Los Angeles 10 west 13.4 2 joints7 Los Angeles 10 west 13.3 2 13,13,19,197 Los Angeles 10 west 12.9 27 Los Angeles 10 west 11.9 27 Los Angeles 10 west 11.5 17 Los Angeles 10 west 11.3 27 Los Angeles 10 west 11.1 1 14R17 Los Angeles 10 west 10.9 27 Los Angeles 10 west 10.3 2 open long. joint7 Los Angeles 10 west 10 17 Los Angeles 10 west 9.5 bridge7 Los Angeles 10 west 9.3 27 Los Angeles 10 west 8.9 ACOL slight
cracking7 Los Angeles 10 west 8.7 2 PCCP7 Los Angeles 10 west 8.5 PC patches7 Los Angeles 10 west 7.9 27 Los Angeles 10 west 7.7 27 Los Angeles 10 west 7.5 27 Los Angeles 10 west 7.1 27 Los Angeles 10 west 6.9 27 Los Angeles 10 west 6.7 2 moderate faults8 San Bernardino 10 west 31.5 1 1 D88 San Bernardino 10 west 31.1 2 18 San Bernardino 10 west 30.5 2 1 18 San Bernardino 10 west 29.9 28 San Bernardino 10 west 29.5 2 skew jts.8 San Bernardino 10 west 28.7 28 San Bernardino 10 west 28.5 28 San Bernardino 10 west 27.7 28 San Bernardino 10 west 27.3 2 18 San Bernardino 10 west 26.3 2 18 San Bernardino 10 west 25.7 3 1 17 Los Angeles 10 east 4.6 17 Los Angeles 10 east 6.1 17 Los Angeles 10 east 6.2 27 Los Angeles 10 east 6.4 27 Los Angeles 10 east 6.8 17R1, no vis.
faults, no vis.defl. outer trucks@ jt.
7 Los Angeles 10 east 7.2 1
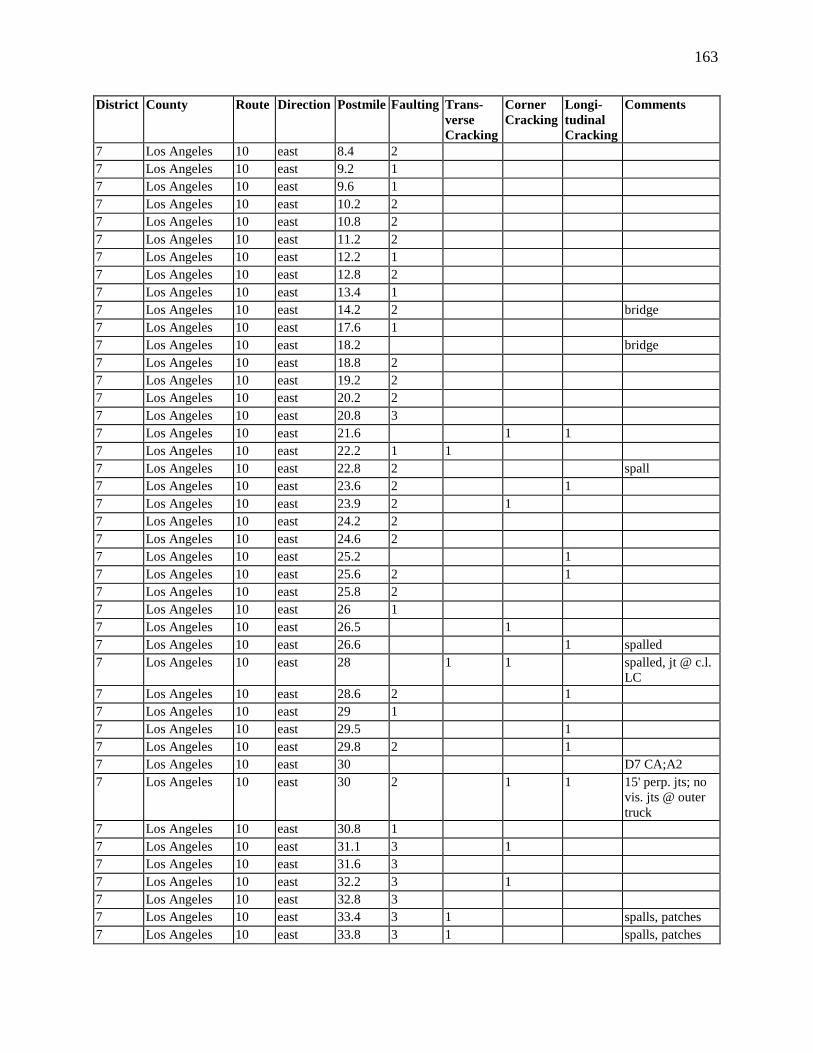
163
District County Route Direction Postmile Faulting Trans-verseCracking
CornerCracking
Longi-tudinalCracking
Comments
7 Los Angeles 10 east 8.4 27 Los Angeles 10 east 9.2 17 Los Angeles 10 east 9.6 17 Los Angeles 10 east 10.2 27 Los Angeles 10 east 10.8 27 Los Angeles 10 east 11.2 27 Los Angeles 10 east 12.2 17 Los Angeles 10 east 12.8 27 Los Angeles 10 east 13.4 17 Los Angeles 10 east 14.2 2 bridge7 Los Angeles 10 east 17.6 17 Los Angeles 10 east 18.2 bridge7 Los Angeles 10 east 18.8 27 Los Angeles 10 east 19.2 27 Los Angeles 10 east 20.2 27 Los Angeles 10 east 20.8 37 Los Angeles 10 east 21.6 1 17 Los Angeles 10 east 22.2 1 17 Los Angeles 10 east 22.8 2 spall7 Los Angeles 10 east 23.6 2 17 Los Angeles 10 east 23.9 2 17 Los Angeles 10 east 24.2 27 Los Angeles 10 east 24.6 27 Los Angeles 10 east 25.2 17 Los Angeles 10 east 25.6 2 17 Los Angeles 10 east 25.8 27 Los Angeles 10 east 26 17 Los Angeles 10 east 26.5 17 Los Angeles 10 east 26.6 1 spalled7 Los Angeles 10 east 28 1 1 spalled, jt @ c.l.
LC7 Los Angeles 10 east 28.6 2 17 Los Angeles 10 east 29 17 Los Angeles 10 east 29.5 17 Los Angeles 10 east 29.8 2 17 Los Angeles 10 east 30 D7 CA;A27 Los Angeles 10 east 30 2 1 1 15' perp. jts; no
vis. jts @ outertruck
7 Los Angeles 10 east 30.8 17 Los Angeles 10 east 31.1 3 17 Los Angeles 10 east 31.6 37 Los Angeles 10 east 32.2 3 17 Los Angeles 10 east 32.8 37 Los Angeles 10 east 33.4 3 1 spalls, patches7 Los Angeles 10 east 33.8 3 1 spalls, patches
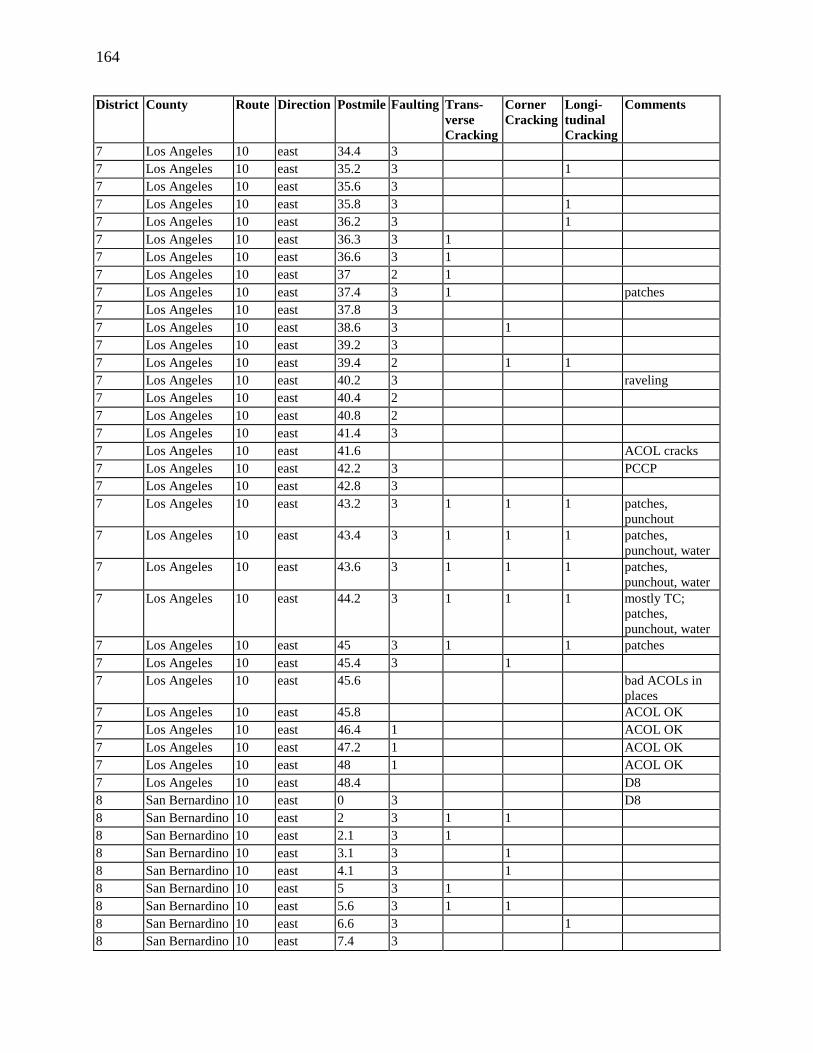
164
District County Route Direction Postmile Faulting Trans-verseCracking
CornerCracking
Longi-tudinalCracking
Comments
7 Los Angeles 10 east 34.4 37 Los Angeles 10 east 35.2 3 17 Los Angeles 10 east 35.6 37 Los Angeles 10 east 35.8 3 17 Los Angeles 10 east 36.2 3 17 Los Angeles 10 east 36.3 3 17 Los Angeles 10 east 36.6 3 17 Los Angeles 10 east 37 2 17 Los Angeles 10 east 37.4 3 1 patches7 Los Angeles 10 east 37.8 37 Los Angeles 10 east 38.6 3 17 Los Angeles 10 east 39.2 37 Los Angeles 10 east 39.4 2 1 17 Los Angeles 10 east 40.2 3 raveling7 Los Angeles 10 east 40.4 27 Los Angeles 10 east 40.8 27 Los Angeles 10 east 41.4 37 Los Angeles 10 east 41.6 ACOL cracks7 Los Angeles 10 east 42.2 3 PCCP7 Los Angeles 10 east 42.8 37 Los Angeles 10 east 43.2 3 1 1 1 patches,
punchout7 Los Angeles 10 east 43.4 3 1 1 1 patches,
punchout, water7 Los Angeles 10 east 43.6 3 1 1 1 patches,
punchout, water7 Los Angeles 10 east 44.2 3 1 1 1 mostly TC;
patches,punchout, water
7 Los Angeles 10 east 45 3 1 1 patches7 Los Angeles 10 east 45.4 3 17 Los Angeles 10 east 45.6 bad ACOLs in
places7 Los Angeles 10 east 45.8 ACOL OK7 Los Angeles 10 east 46.4 1 ACOL OK7 Los Angeles 10 east 47.2 1 ACOL OK7 Los Angeles 10 east 48 1 ACOL OK7 Los Angeles 10 east 48.4 D88 San Bernardino 10 east 0 3 D88 San Bernardino 10 east 2 3 1 18 San Bernardino 10 east 2.1 3 18 San Bernardino 10 east 3.1 3 18 San Bernardino 10 east 4.1 3 18 San Bernardino 10 east 5 3 18 San Bernardino 10 east 5.6 3 1 18 San Bernardino 10 east 6.6 3 18 San Bernardino 10 east 7.4 3
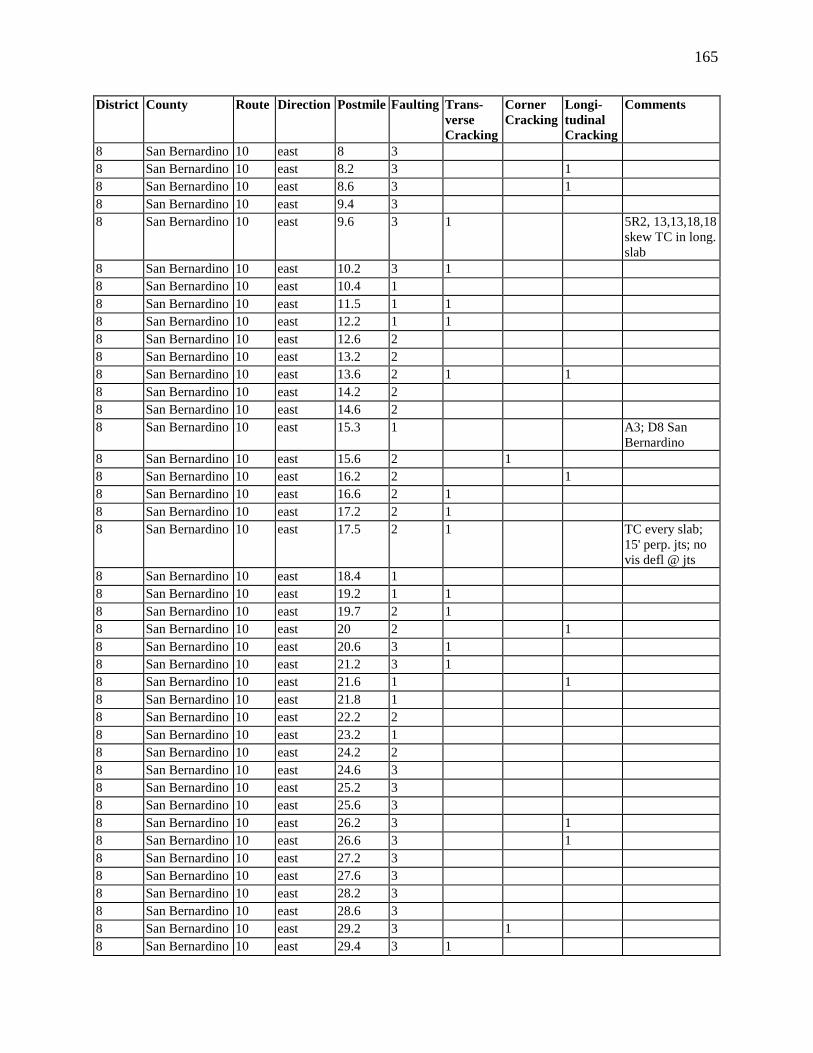
165
District County Route Direction Postmile Faulting Trans-verseCracking
CornerCracking
Longi-tudinalCracking
Comments
8 San Bernardino 10 east 8 38 San Bernardino 10 east 8.2 3 18 San Bernardino 10 east 8.6 3 18 San Bernardino 10 east 9.4 38 San Bernardino 10 east 9.6 3 1 5R2, 13,13,18,18
skew TC in long.slab
8 San Bernardino 10 east 10.2 3 18 San Bernardino 10 east 10.4 18 San Bernardino 10 east 11.5 1 18 San Bernardino 10 east 12.2 1 18 San Bernardino 10 east 12.6 28 San Bernardino 10 east 13.2 28 San Bernardino 10 east 13.6 2 1 18 San Bernardino 10 east 14.2 28 San Bernardino 10 east 14.6 28 San Bernardino 10 east 15.3 1 A3; D8 San
Bernardino8 San Bernardino 10 east 15.6 2 18 San Bernardino 10 east 16.2 2 18 San Bernardino 10 east 16.6 2 18 San Bernardino 10 east 17.2 2 18 San Bernardino 10 east 17.5 2 1 TC every slab;
15' perp. jts; novis defl @ jts
8 San Bernardino 10 east 18.4 18 San Bernardino 10 east 19.2 1 18 San Bernardino 10 east 19.7 2 18 San Bernardino 10 east 20 2 18 San Bernardino 10 east 20.6 3 18 San Bernardino 10 east 21.2 3 18 San Bernardino 10 east 21.6 1 18 San Bernardino 10 east 21.8 18 San Bernardino 10 east 22.2 28 San Bernardino 10 east 23.2 18 San Bernardino 10 east 24.2 28 San Bernardino 10 east 24.6 38 San Bernardino 10 east 25.2 38 San Bernardino 10 east 25.6 38 San Bernardino 10 east 26.2 3 18 San Bernardino 10 east 26.6 3 18 San Bernardino 10 east 27.2 38 San Bernardino 10 east 27.6 38 San Bernardino 10 east 28.2 38 San Bernardino 10 east 28.6 38 San Bernardino 10 east 29.2 3 18 San Bernardino 10 east 29.4 3 1
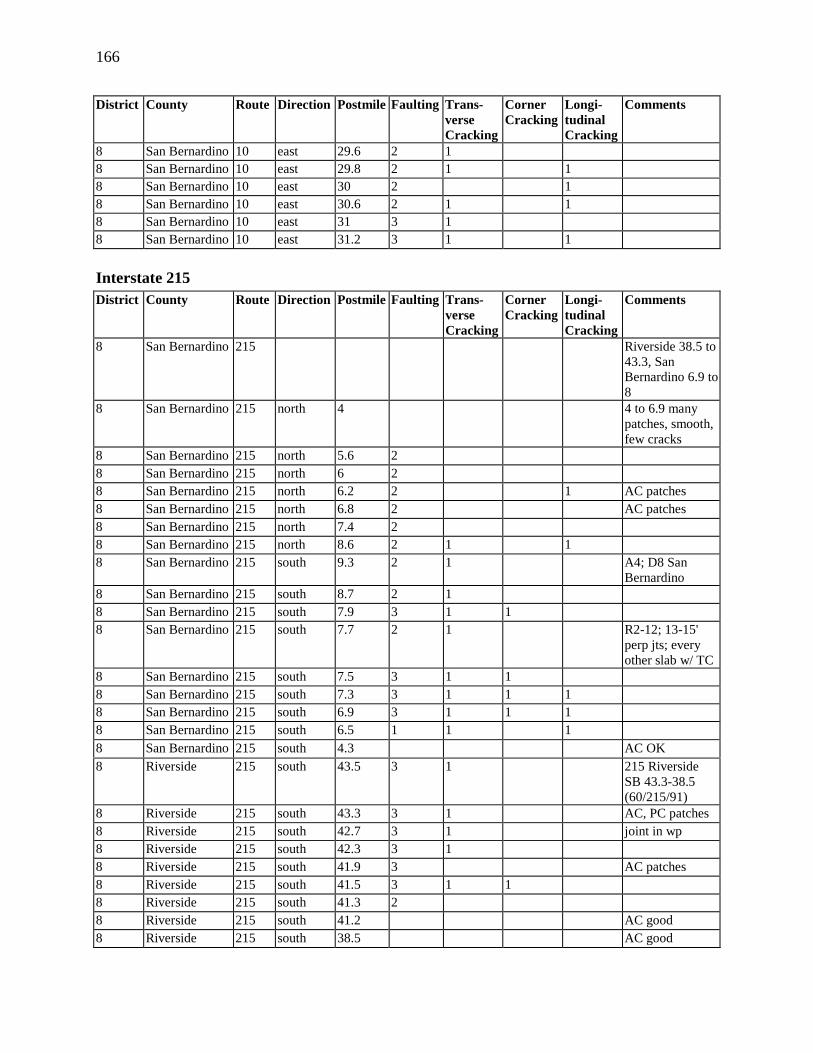
166
District County Route Direction Postmile Faulting Trans-verseCracking
CornerCracking
Longi-tudinalCracking
Comments
8 San Bernardino 10 east 29.6 2 18 San Bernardino 10 east 29.8 2 1 18 San Bernardino 10 east 30 2 18 San Bernardino 10 east 30.6 2 1 18 San Bernardino 10 east 31 3 18 San Bernardino 10 east 31.2 3 1 1
Interstate 215District County Route Direction Postmile Faulting Trans-
verseCracking
CornerCracking
Longi-tudinalCracking
Comments
8 San Bernardino 215 Riverside 38.5 to43.3, SanBernardino 6.9 to8
8 San Bernardino 215 north 4 4 to 6.9 manypatches, smooth,few cracks
8 San Bernardino 215 north 5.6 28 San Bernardino 215 north 6 28 San Bernardino 215 north 6.2 2 1 AC patches8 San Bernardino 215 north 6.8 2 AC patches8 San Bernardino 215 north 7.4 28 San Bernardino 215 north 8.6 2 1 18 San Bernardino 215 south 9.3 2 1 A4; D8 San
Bernardino8 San Bernardino 215 south 8.7 2 18 San Bernardino 215 south 7.9 3 1 18 San Bernardino 215 south 7.7 2 1 R2-12; 13-15'
perp jts; everyother slab w/ TC
8 San Bernardino 215 south 7.5 3 1 18 San Bernardino 215 south 7.3 3 1 1 18 San Bernardino 215 south 6.9 3 1 1 18 San Bernardino 215 south 6.5 1 1 18 San Bernardino 215 south 4.3 AC OK8 Riverside 215 south 43.5 3 1 215 Riverside
SB 43.3-38.5(60/215/91)
8 Riverside 215 south 43.3 3 1 AC, PC patches8 Riverside 215 south 42.7 3 1 joint in wp8 Riverside 215 south 42.3 3 18 Riverside 215 south 41.9 3 AC patches8 Riverside 215 south 41.5 3 1 18 Riverside 215 south 41.3 28 Riverside 215 south 41.2 AC good8 Riverside 215 south 38.5 AC good

167
District County Route Direction Postmile Faulting Trans-verseCracking
CornerCracking
Longi-tudinalCracking
Comments
8 Riverside 215 north 38.5 Riverside 38.5 to43.3
8 Riverside 215 north 38.6 AC good, somelong. refl. cracks
8 Riverside 215 north 41.2 2 1 PC8 Riverside 215 north 41.8 2 18 Riverside 215 north 42.6 2 1
State Route 60District County Route Direction Postmile Faulting Trans-
verseCracking
CornerCracking
Longi-tudinalCracking
Comments
8 Riverside 60 west 0.8 2 1 D8 Riverside 0.0to 0.985
8 Riverside 60 west 0.2 28 San Bernardino 60 west 9.5 2 1 D7 San
Bernardino8 San Bernardino 60 west 8.7 3 18 San Bernardino 60 west 6.1 3 18 San Bernardino 60 west 4.3 18 San Bernardino 60 west 1.4 2 18 San Bernardino 60 west 0.9 17 Los Angeles 60 west 29.4 7 Los Angeles
29.4 TO 1.07 Los Angeles 60 west 29.3 1 17 Los Angeles 60 west 28.7 2 17 Los Angeles 60 west 28.5 1 17 Los Angeles 60 west 28.3 1 17 Los Angeles 60 west 27.9 1 17 Los Angeles 60 west 27.5 1 17 Los Angeles 60 west 27.1 bad ACOL7 Los Angeles 60 west 26.8 1 PCC7 Los Angeles 60 west 25.9 1 1 17 Los Angeles 60 west 25.5 2 17 Los Angeles 60 west 24.7 27 Los Angeles 60 west 24.3 27 Los Angeles 60 west 23.9 2 1 17 Los Angeles 60 west 22.9 27 Los Angeles 60 west 22.5 27 Los Angeles 60 west 22.3 37 Los Angeles 60 west 21.7 3 17 Los Angeles 60 west 21.5 37 Los Angeles 60 west 20.9 37 Los Angeles 60 west 20.5 2 17 Los Angeles 60 west 19.9 37 Los Angeles 60 west 19.5 2
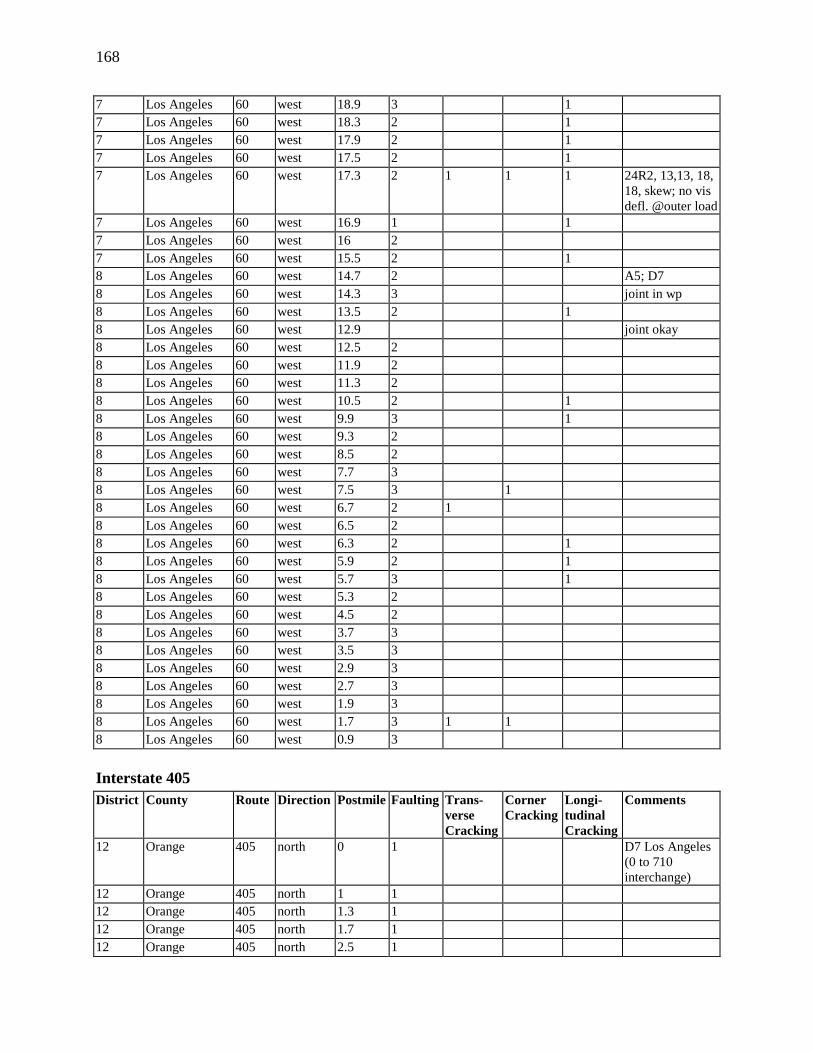
168
7 Los Angeles 60 west 18.9 3 17 Los Angeles 60 west 18.3 2 17 Los Angeles 60 west 17.9 2 17 Los Angeles 60 west 17.5 2 17 Los Angeles 60 west 17.3 2 1 1 1 24R2, 13,13, 18,
18, skew; no visdefl. @outer load
7 Los Angeles 60 west 16.9 1 17 Los Angeles 60 west 16 27 Los Angeles 60 west 15.5 2 18 Los Angeles 60 west 14.7 2 A5; D78 Los Angeles 60 west 14.3 3 joint in wp8 Los Angeles 60 west 13.5 2 18 Los Angeles 60 west 12.9 joint okay8 Los Angeles 60 west 12.5 28 Los Angeles 60 west 11.9 28 Los Angeles 60 west 11.3 28 Los Angeles 60 west 10.5 2 18 Los Angeles 60 west 9.9 3 18 Los Angeles 60 west 9.3 28 Los Angeles 60 west 8.5 28 Los Angeles 60 west 7.7 38 Los Angeles 60 west 7.5 3 18 Los Angeles 60 west 6.7 2 18 Los Angeles 60 west 6.5 28 Los Angeles 60 west 6.3 2 18 Los Angeles 60 west 5.9 2 18 Los Angeles 60 west 5.7 3 18 Los Angeles 60 west 5.3 28 Los Angeles 60 west 4.5 28 Los Angeles 60 west 3.7 38 Los Angeles 60 west 3.5 38 Los Angeles 60 west 2.9 38 Los Angeles 60 west 2.7 38 Los Angeles 60 west 1.9 38 Los Angeles 60 west 1.7 3 1 18 Los Angeles 60 west 0.9 3
Interstate 405District County Route Direction Postmile Faulting Trans-
verseCracking
CornerCracking
Longi-tudinalCracking
Comments
12 Orange 405 north 0 1 D7 Los Angeles(0 to 710interchange)
12 Orange 405 north 1 112 Orange 405 north 1.3 112 Orange 405 north 1.7 112 Orange 405 north 2.5 1

169
District County Route Direction Postmile Faulting Trans-verseCracking
CornerCracking
Longi-tudinalCracking
Comments
12 Orange 405 north 2.7 1 1 13,13,18,19heavy skew; nodefl @jt vis; R3-4
12 Orange 405 north 3.9 2 112 Orange 405 north 4.7 2 112 Orange 405 north 5.3 312 Orange 405 north 5.5 212 Orange 405 north 6.3 2 112 Orange 405 north 6.7 2 112 Orange 405 north 6.9 2 1 grass in long. jt;
jt in C.L.12 Orange 405 north 7.5 joint OK12 Orange 405 north 7.9 212 Orange 405 north 8.5 212 Orange 405 north 8.9 112 Orange 405 north 9.5 112 Orange 405 north 10.3 112 Orange 405 north 11.7 AC good
condition12 Orange 405 north 17.1 1 PCCP12 Orange 405 north 18.7 212 Orange 405 north 20.3 312 Orange 405 north 20.9 212 Orange 405 north 21.7 312 Orange 405 north 24.3 27 Los Angeles 405 north 0 D77 Los Angeles 405 north 0.6 17 Los Angeles 405 north 2.2 27 Los Angeles 405 north 2.4 37 Los Angeles 405 north 4.2 17 Los Angeles 405 north 4.6 37 Los Angeles 405 north 10 27 Los Angeles 405 north 12.6 27 Los Angeles 405 north 13.2 AC7 Los Angeles 405 north 16.2 2 17 Los Angeles 405 north 16.6 AC
Interstate 710District County Route Direction Postmile Faulting Trans-
verseCracking
CornerCracking
Longi-tudinalCracking
Comments
7 Los Angeles 710 north 6.8 ACOL from 0 to6.8
7 Los Angeles 710 north 7 2 1 joint spall7 Los Angeles 710 north 7.2 3 1
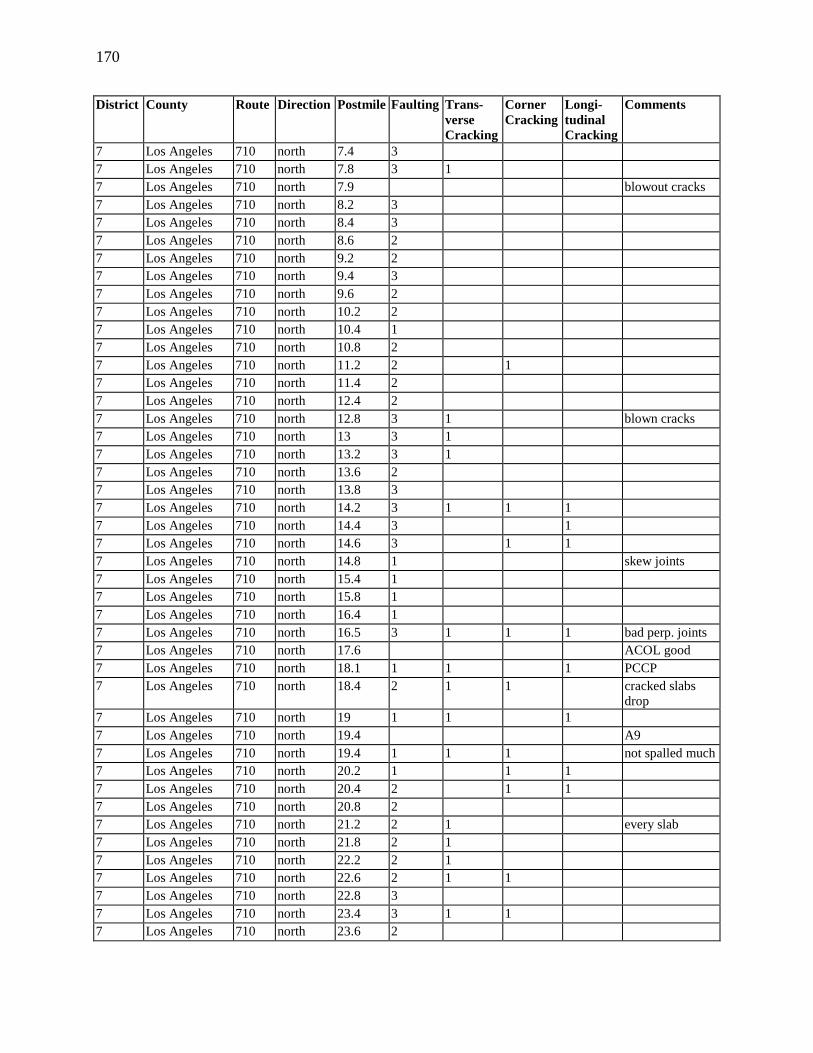
170
District County Route Direction Postmile Faulting Trans-verseCracking
CornerCracking
Longi-tudinalCracking
Comments
7 Los Angeles 710 north 7.4 37 Los Angeles 710 north 7.8 3 17 Los Angeles 710 north 7.9 blowout cracks7 Los Angeles 710 north 8.2 37 Los Angeles 710 north 8.4 37 Los Angeles 710 north 8.6 27 Los Angeles 710 north 9.2 27 Los Angeles 710 north 9.4 37 Los Angeles 710 north 9.6 27 Los Angeles 710 north 10.2 27 Los Angeles 710 north 10.4 17 Los Angeles 710 north 10.8 27 Los Angeles 710 north 11.2 2 17 Los Angeles 710 north 11.4 27 Los Angeles 710 north 12.4 27 Los Angeles 710 north 12.8 3 1 blown cracks7 Los Angeles 710 north 13 3 17 Los Angeles 710 north 13.2 3 17 Los Angeles 710 north 13.6 27 Los Angeles 710 north 13.8 37 Los Angeles 710 north 14.2 3 1 1 17 Los Angeles 710 north 14.4 3 17 Los Angeles 710 north 14.6 3 1 17 Los Angeles 710 north 14.8 1 skew joints7 Los Angeles 710 north 15.4 17 Los Angeles 710 north 15.8 17 Los Angeles 710 north 16.4 17 Los Angeles 710 north 16.5 3 1 1 1 bad perp. joints7 Los Angeles 710 north 17.6 ACOL good7 Los Angeles 710 north 18.1 1 1 1 PCCP7 Los Angeles 710 north 18.4 2 1 1 cracked slabs
drop7 Los Angeles 710 north 19 1 1 17 Los Angeles 710 north 19.4 A97 Los Angeles 710 north 19.4 1 1 1 not spalled much7 Los Angeles 710 north 20.2 1 1 17 Los Angeles 710 north 20.4 2 1 17 Los Angeles 710 north 20.8 27 Los Angeles 710 north 21.2 2 1 every slab7 Los Angeles 710 north 21.8 2 17 Los Angeles 710 north 22.2 2 17 Los Angeles 710 north 22.6 2 1 17 Los Angeles 710 north 22.8 37 Los Angeles 710 north 23.4 3 1 17 Los Angeles 710 north 23.6 2

171
District County Route Direction Postmile Faulting Trans-verseCracking
CornerCracking
Longi-tudinalCracking
Comments
7 Los Angeles 710 north 24.4 37 Los Angeles 710 north 24.6 3 17 Los Angeles 710 north 24.8 3 17 Los Angeles 710 north 25.4 2 17 Los Angeles 710 north 25.6 ACOL7 Los Angeles 710 north 26 27 Los Angeles 710 north 27.2 37 Los Angeles 710 north 27.4 end7 Los Angeles 710 south 27.3 27 Los Angeles 710 south 26.3 17 Los Angeles 710 south 25.9 27 Los Angeles 710 south 25.5 2 17 Los Angeles 710 south 25.2 3 17 Los Angeles 710 south 24.5 37 Los Angeles 710 south 23.9 3 17 Los Angeles 710 south 23.7 3 1 17 Los Angeles 710 south 23.5 27 Los Angeles 710 south 22.9 bridge7 Los Angeles 710 south 22.7 3 17 Los Angeles 710 south 22.3 37 Los Angeles 710 south 21.9 2 17 Los Angeles 710 south 21.7 3 1 bad TC7 Los Angeles 710 south 21.5 17 Los Angeles 710 south 20.7 27 Los Angeles 710 south 20.5 2 17 Los Angeles 710 south 19.9 3 1 17 Los Angeles 710 south 16.7 17 Los Angeles 710 south 15.7 1 spalls7 Los Angeles 710 south 15.5 17 Los Angeles 710 south 14.7 3 1 17 Los Angeles 710 south 14.5 2 1 CC bad7 Los Angeles 710 south 13.5 2 A87 Los Angeles 710 south 13.1 2 1 17 Los Angeles 710 south 12.9 37 Los Angeles 710 south 12.5 3 17 Los Angeles 710 south 11.5 37 Los Angeles 710 south 11.3 2 17 Los Angeles 710 south 10.9 3 1 17 Los Angeles 710 south 10.7 27 Los Angeles 710 south 10.5 17 Los Angeles 710 south 10.3 27 Los Angeles 710 south 9.9 37 Los Angeles 710 south 9.7 3 17 Los Angeles 710 south 9.5 37 Los Angeles 710 south 8.9 3 1 1
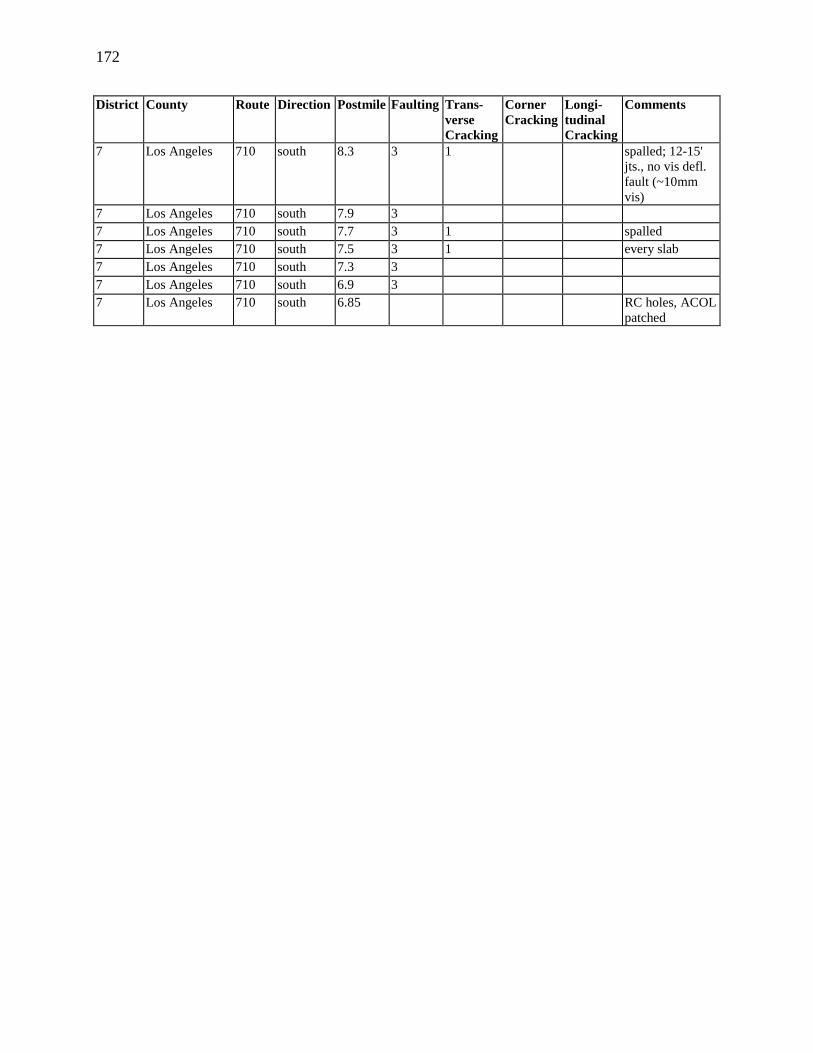
172
District County Route Direction Postmile Faulting Trans-verseCracking
CornerCracking
Longi-tudinalCracking
Comments
7 Los Angeles 710 south 8.3 3 1 spalled; 12-15'jts., no vis defl.fault (~10mmvis)
7 Los Angeles 710 south 7.9 37 Los Angeles 710 south 7.7 3 1 spalled7 Los Angeles 710 south 7.5 3 1 every slab7 Los Angeles 710 south 7.3 37 Los Angeles 710 south 6.9 37 Los Angeles 710 south 6.85 RC holes, ACOL
patched

173
APPENDIX B: PCA SENSITIVITY ANALYSIS
Case Subgrade Kvalue
Axle Load Trucksin Lane
ConcreteModulus ofRupture(psi)
Dowels TiedShoulder
LoadSafetyFactor
SlabThickness (in.)
DistressType
1 170 PCA 8750 500 Yes Yes 1.2 11 Fatigue2 170 PCA 17500 500 Yes Yes 1.2 11.5 Fatigue3 350 PCA 8750 500 Yes Yes 1.2 10 Fatigue4 350 PCA 17500 500 Yes Yes 1.2 10.5 Fatigue5 640 PCA 8750 500 Yes Yes 1.2 9.5 Fatigue6 640 PCA 17500 500 Yes Yes 1.2 10 Fatigue7 170 San Diego 8750 500 Yes Yes 1.2 10 Fatigue8 170 San Diego 17500 500 Yes Yes 1.2 10.5 Fatigue9 350 San Diego 8750 500 Yes Yes 1.2 9 Fatigue10 350 San Diego 17500 500 Yes Yes 1.2 9.5 Fatigue11 640 San Diego 8750 500 Yes Yes 1.2 8.5 Fatigue12 640 San Diego 17500 500 Yes Yes 1.2 9 Fatigue13 170 San Joaquin 8750 500 Yes Yes 1.2 10 Fatigue14 170 San Joaquin 17500 500 Yes Yes 1.2 10.5 Fatigue15 350 San Joaquin 8750 500 Yes Yes 1.2 9 Fatigue16 350 San Joaquin 17500 500 Yes Yes 1.2 9.5 Fatigue17 640 San Joaquin 8750 500 Yes Yes 1.2 8.5 Fatigue18 640 San Joaquin 17500 500 Yes Yes 1.2 9 Fatigue19 170 PCA 8750 650 Yes Yes 1.2 9 Fatigue20 170 PCA 17500 650 Yes Yes 1.2 9.5 Erosion21 350 PCA 8750 650 Yes Yes 1.2 8.5 Erosion22 350 PCA 17500 650 Yes Yes 1.2 9 Erosion23 640 PCA 8750 650 Yes Yes 1.2 8 Erosion24 640 PCA 17500 650 Yes Yes 1.2 8.5 Erosion25 170 San Diego 8750 650 Yes Yes 1.2 8.5 Fatigue26 170 San Diego 17500 650 Yes Yes 1.2 8.5 Fatigue27 350 San Diego 8750 650 Yes Yes 1.2 7.5 Fatigue28 350 San Diego 17500 650 Yes Yes 1.2 8 Fatigue29 640 San Diego 8750 650 Yes Yes 1.2 7 Erosion30 640 San Diego 17500 650 Yes Yes 1.2 7.5 Erosion31 170 San Joaquin 8750 650 Yes Yes 1.2 8.5 Erosion32 170 San Joaquin 17500 650 Yes Yes 1.2 9 Erosion33 350 San Joaquin 8750 650 Yes Yes 1.2 8 Erosion34 350 San Joaquin 17500 650 Yes Yes 1.2 8 Erosion35 640 San Joaquin 8750 650 Yes Yes 1.2 7.5 Erosion36 640 San Joaquin 17500 650 Yes Yes 1.2 8 Erosion37 170 PCA 8750 800 Yes Yes 1.2 9 Erosion
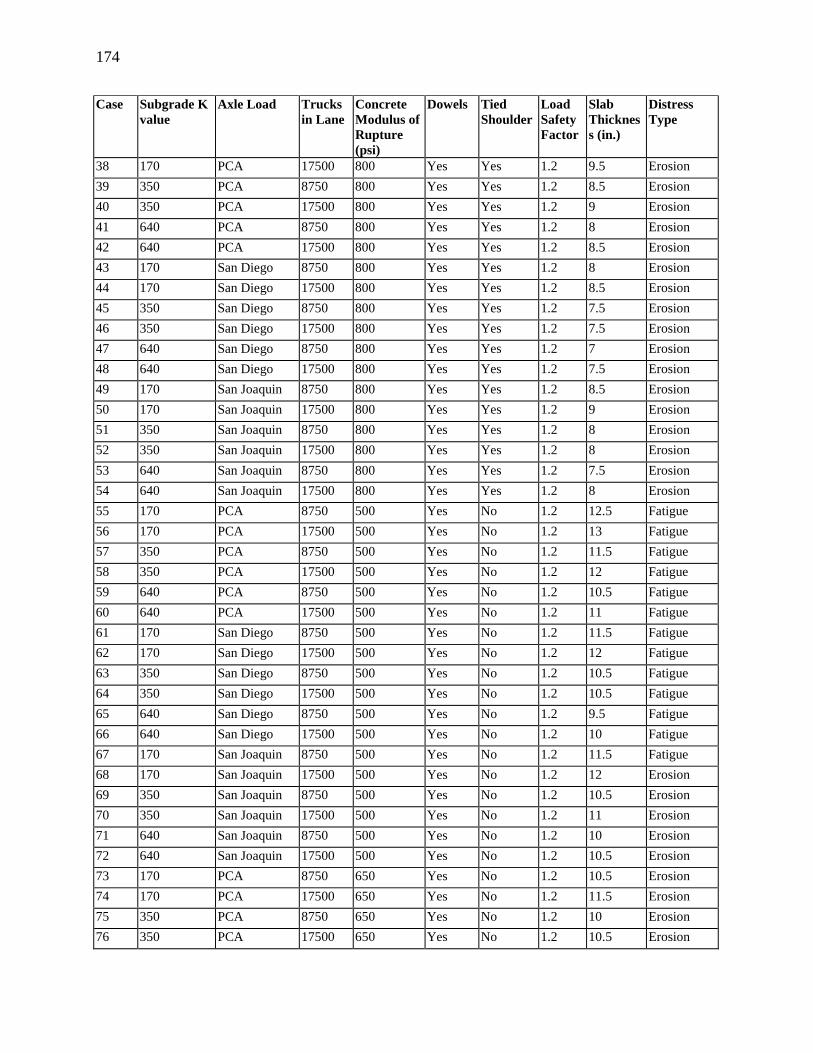
174
Case Subgrade Kvalue
Axle Load Trucksin Lane
ConcreteModulus ofRupture(psi)
Dowels TiedShoulder
LoadSafetyFactor
SlabThickness (in.)
DistressType
38 170 PCA 17500 800 Yes Yes 1.2 9.5 Erosion39 350 PCA 8750 800 Yes Yes 1.2 8.5 Erosion40 350 PCA 17500 800 Yes Yes 1.2 9 Erosion41 640 PCA 8750 800 Yes Yes 1.2 8 Erosion42 640 PCA 17500 800 Yes Yes 1.2 8.5 Erosion43 170 San Diego 8750 800 Yes Yes 1.2 8 Erosion44 170 San Diego 17500 800 Yes Yes 1.2 8.5 Erosion45 350 San Diego 8750 800 Yes Yes 1.2 7.5 Erosion46 350 San Diego 17500 800 Yes Yes 1.2 7.5 Erosion47 640 San Diego 8750 800 Yes Yes 1.2 7 Erosion48 640 San Diego 17500 800 Yes Yes 1.2 7.5 Erosion49 170 San Joaquin 8750 800 Yes Yes 1.2 8.5 Erosion50 170 San Joaquin 17500 800 Yes Yes 1.2 9 Erosion51 350 San Joaquin 8750 800 Yes Yes 1.2 8 Erosion52 350 San Joaquin 17500 800 Yes Yes 1.2 8 Erosion53 640 San Joaquin 8750 800 Yes Yes 1.2 7.5 Erosion54 640 San Joaquin 17500 800 Yes Yes 1.2 8 Erosion55 170 PCA 8750 500 Yes No 1.2 12.5 Fatigue56 170 PCA 17500 500 Yes No 1.2 13 Fatigue57 350 PCA 8750 500 Yes No 1.2 11.5 Fatigue58 350 PCA 17500 500 Yes No 1.2 12 Fatigue59 640 PCA 8750 500 Yes No 1.2 10.5 Fatigue60 640 PCA 17500 500 Yes No 1.2 11 Fatigue61 170 San Diego 8750 500 Yes No 1.2 11.5 Fatigue62 170 San Diego 17500 500 Yes No 1.2 12 Fatigue63 350 San Diego 8750 500 Yes No 1.2 10.5 Fatigue64 350 San Diego 17500 500 Yes No 1.2 10.5 Fatigue65 640 San Diego 8750 500 Yes No 1.2 9.5 Fatigue66 640 San Diego 17500 500 Yes No 1.2 10 Fatigue67 170 San Joaquin 8750 500 Yes No 1.2 11.5 Fatigue68 170 San Joaquin 17500 500 Yes No 1.2 12 Erosion69 350 San Joaquin 8750 500 Yes No 1.2 10.5 Erosion70 350 San Joaquin 17500 500 Yes No 1.2 11 Erosion71 640 San Joaquin 8750 500 Yes No 1.2 10 Erosion72 640 San Joaquin 17500 500 Yes No 1.2 10.5 Erosion73 170 PCA 8750 650 Yes No 1.2 10.5 Erosion74 170 PCA 17500 650 Yes No 1.2 11.5 Erosion75 350 PCA 8750 650 Yes No 1.2 10 Erosion76 350 PCA 17500 650 Yes No 1.2 10.5 Erosion
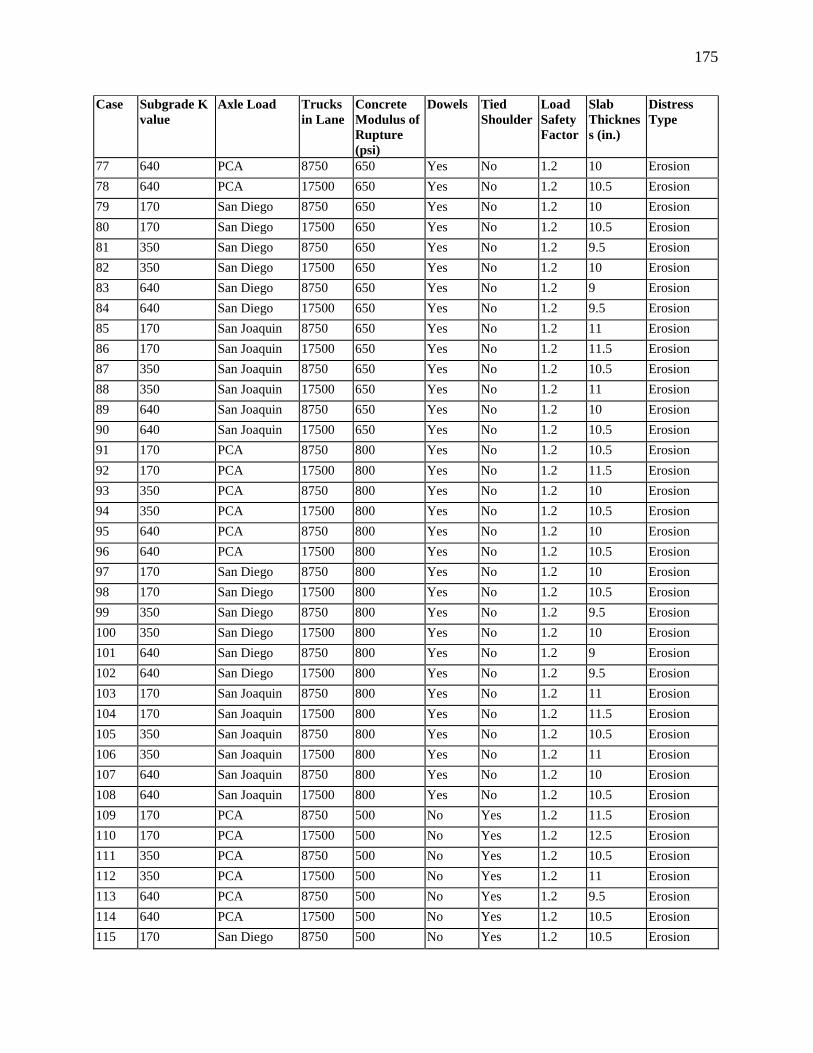
175
Case Subgrade Kvalue
Axle Load Trucksin Lane
ConcreteModulus ofRupture(psi)
Dowels TiedShoulder
LoadSafetyFactor
SlabThickness (in.)
DistressType
77 640 PCA 8750 650 Yes No 1.2 10 Erosion78 640 PCA 17500 650 Yes No 1.2 10.5 Erosion79 170 San Diego 8750 650 Yes No 1.2 10 Erosion80 170 San Diego 17500 650 Yes No 1.2 10.5 Erosion81 350 San Diego 8750 650 Yes No 1.2 9.5 Erosion82 350 San Diego 17500 650 Yes No 1.2 10 Erosion83 640 San Diego 8750 650 Yes No 1.2 9 Erosion84 640 San Diego 17500 650 Yes No 1.2 9.5 Erosion85 170 San Joaquin 8750 650 Yes No 1.2 11 Erosion86 170 San Joaquin 17500 650 Yes No 1.2 11.5 Erosion87 350 San Joaquin 8750 650 Yes No 1.2 10.5 Erosion88 350 San Joaquin 17500 650 Yes No 1.2 11 Erosion89 640 San Joaquin 8750 650 Yes No 1.2 10 Erosion90 640 San Joaquin 17500 650 Yes No 1.2 10.5 Erosion91 170 PCA 8750 800 Yes No 1.2 10.5 Erosion92 170 PCA 17500 800 Yes No 1.2 11.5 Erosion93 350 PCA 8750 800 Yes No 1.2 10 Erosion94 350 PCA 17500 800 Yes No 1.2 10.5 Erosion95 640 PCA 8750 800 Yes No 1.2 10 Erosion96 640 PCA 17500 800 Yes No 1.2 10.5 Erosion97 170 San Diego 8750 800 Yes No 1.2 10 Erosion98 170 San Diego 17500 800 Yes No 1.2 10.5 Erosion99 350 San Diego 8750 800 Yes No 1.2 9.5 Erosion100 350 San Diego 17500 800 Yes No 1.2 10 Erosion101 640 San Diego 8750 800 Yes No 1.2 9 Erosion102 640 San Diego 17500 800 Yes No 1.2 9.5 Erosion103 170 San Joaquin 8750 800 Yes No 1.2 11 Erosion104 170 San Joaquin 17500 800 Yes No 1.2 11.5 Erosion105 350 San Joaquin 8750 800 Yes No 1.2 10.5 Erosion106 350 San Joaquin 17500 800 Yes No 1.2 11 Erosion107 640 San Joaquin 8750 800 Yes No 1.2 10 Erosion108 640 San Joaquin 17500 800 Yes No 1.2 10.5 Erosion109 170 PCA 8750 500 No Yes 1.2 11.5 Erosion110 170 PCA 17500 500 No Yes 1.2 12.5 Erosion111 350 PCA 8750 500 No Yes 1.2 10.5 Erosion112 350 PCA 17500 500 No Yes 1.2 11 Erosion113 640 PCA 8750 500 No Yes 1.2 9.5 Erosion114 640 PCA 17500 500 No Yes 1.2 10.5 Erosion115 170 San Diego 8750 500 No Yes 1.2 10.5 Erosion

176
Case Subgrade Kvalue
Axle Load Trucksin Lane
ConcreteModulus ofRupture(psi)
Dowels TiedShoulder
LoadSafetyFactor
SlabThickness (in.)
DistressType
116 170 San Diego 17500 500 No Yes 1.2 11 Erosion117 350 San Diego 8750 500 No Yes 1.2 9 Erosion118 350 San Diego 17500 500 No Yes 1.2 9.5 Erosion119 640 San Diego 8750 500 No Yes 1.2 8.5 Erosion120 640 San Diego 17500 500 No Yes 1.2 9 Erosion121 170 San Joaquin 8750 500 No Yes 1.2 11 Erosion122 170 San Joaquin 17500 500 No Yes 1.2 11.5 Erosion123 350 San Joaquin 8750 500 No Yes 1.2 10 Erosion124 350 San Joaquin 17500 500 No Yes 1.2 10 Erosion125 640 San Joaquin 8750 500 No Yes 1.2 9.5 Erosion126 640 San Joaquin 17500 500 No Yes 1.2 9.5 Erosion127 170 PCA 8750 650 No Yes 1.2 11.5 Erosion128 170 PCA 17500 650 No Yes 1.2 12.5 Erosion129 350 PCA 8750 650 No Yes 1.2 10.5 Erosion130 350 PCA 17500 650 No Yes 1.2 11 Erosion131 640 PCA 8750 650 No Yes 1.2 9.5 Erosion132 640 PCA 17500 650 No Yes 1.2 10.5 Erosion133 170 San Diego 8750 650 No Yes 1.2 10.5 Erosion134 170 San Diego 17500 650 No Yes 1.2 11 Erosion135 350 San Diego 8750 650 No Yes 1.2 9 Erosion136 350 San Diego 17500 650 No Yes 1.2 9.5 Erosion137 640 San Diego 8750 650 No Yes 1.2 8.5 Erosion138 640 San Diego 17500 650 No Yes 1.2 9 Erosion139 170 San Joaquin 8750 650 No Yes 1.2 11 Erosion140 170 San Joaquin 17500 650 No Yes 1.2 11.5 Erosion141 350 San Joaquin 8750 650 No Yes 1.2 10 Erosion142 350 San Joaquin 17500 650 No Yes 1.2 10 Erosion143 640 San Joaquin 8750 650 No Yes 1.2 9.5 Erosion144 640 San Joaquin 17500 650 No Yes 1.2 9.5 Erosion145 170 PCA 8750 800 No Yes 1.2 11.5 Erosion146 170 PCA 17500 800 No Yes 1.2 12.5 Erosion147 350 PCA 8750 800 No Yes 1.2 10.5 Erosion148 350 PCA 17500 800 No Yes 1.2 11 Erosion149 640 PCA 8750 800 No Yes 1.2 9.5 Erosion150 640 PCA 17500 800 No Yes 1.2 10.5 Erosion151 170 San Diego 8750 800 No Yes 1.2 10.5 Erosion152 170 San Diego 17500 800 No Yes 1.2 11 Erosion153 350 San Diego 8750 800 No Yes 1.2 9 Erosion154 350 San Diego 17500 800 No Yes 1.2 9.5 Erosion

177
Case Subgrade Kvalue
Axle Load Trucksin Lane
ConcreteModulus ofRupture(psi)
Dowels TiedShoulder
LoadSafetyFactor
SlabThickness (in.)
DistressType
155 640 San Diego 8750 800 No Yes 1.2 8.5 Erosion156 640 San Diego 17500 800 No Yes 1.2 9 Erosion157 170 San Joaquin 8750 800 No Yes 1.2 11 Erosion158 170 San Joaquin 17500 800 No Yes 1.2 11.5 Erosion159 350 San Joaquin 8750 800 No Yes 1.2 10 Erosion160 350 San Joaquin 17500 800 No Yes 1.2 10 Erosion161 640 San Joaquin 8750 800 No Yes 1.2 9.5 Erosion162 640 San Joaquin 17500 800 No Yes 1.2 9.5 Erosion163 170 PCA 8750 500 No No 1.2 >>14 Erosion164 170 PCA 17500 500 No No 1.2 >>14 Erosion165 350 PCA 8750 500 No No 1.2 12.5 Erosion166 350 PCA 17500 500 No No 1.2 13.5 Erosion167 640 PCA 8750 500 No No 1.2 12 Erosion168 640 PCA 17500 500 No No 1.2 12.5 Erosion169 170 San Diego 8750 500 No No 1.2 13.5 Erosion170 170 San Diego 17500 500 No No 1.2 >>14 Erosion171 350 San Diego 8750 500 No No 1.2 12 Erosion172 350 San Diego 17500 500 No No 1.2 12.5 Erosion173 640 San Diego 8750 500 No No 1.2 11 Erosion174 640 San Diego 17500 500 No No 1.2 11.5 Erosion175 170 San Joaquin 8750 500 No No 1.2 >>14 Erosion176 170 San Joaquin 17500 500 No No 1.2 >>14 Erosion177 350 San Joaquin 8750 500 No No 1.2 13 Erosion178 350 San Joaquin 17500 500 No No 1.2 14 Erosion179 640 San Joaquin 8750 500 No No 1.2 12 Erosion180 640 San Joaquin 17500 500 No No 1.2 12.5 Erosion181 170 PCA 8750 650 No No 1.2 >>14 Erosion182 170 PCA 17500 650 No No 1.2 >>14 Erosion183 350 PCA 8750 650 No No 1.2 12.5 Erosion184 350 PCA 17500 650 No No 1.2 13.5 Erosion185 640 PCA 8750 650 No No 1.2 12 Erosion186 640 PCA 17500 650 No No 1.2 12.5 Erosion187 170 San Diego 8750 650 No No 1.2 13.5 Erosion188 170 San Diego 17500 650 No No 1.2 >>14 Erosion189 350 San Diego 8750 650 No No 1.2 12 Erosion190 350 San Diego 17500 650 No No 1.2 12.5 Erosion191 640 San Diego 8750 650 No No 1.2 11 Erosion192 640 San Diego 17500 650 No No 1.2 11.5 Erosion193 170 San Joaquin 8750 650 No No 1.2 >>14 Erosion

178
Case Subgrade Kvalue
Axle Load Trucksin Lane
ConcreteModulus ofRupture(psi)
Dowels TiedShoulder
LoadSafetyFactor
SlabThickness (in.)
DistressType
194 170 San Joaquin 17500 650 No No 1.2 >>14 Erosion195 350 San Joaquin 8750 650 No No 1.2 13 Erosion196 350 San Joaquin 17500 650 No No 1.2 14 Erosion197 640 San Joaquin 8750 650 No No 1.2 12 Erosion198 640 San Joaquin 17500 650 No No 1.2 12.5 Erosion199 170 PCA 8750 800 No No 1.2 >>14 Erosion200 170 PCA 17500 800 No No 1.2 >>14 Erosion201 350 PCA 8750 800 No No 1.2 12.5 Erosion202 350 PCA 17500 800 No No 1.2 13.5 Erosion203 640 PCA 8750 800 No No 1.2 12 Erosion204 640 PCA 17500 800 No No 1.2 12.5 Erosion205 170 San Diego 8750 800 No No 1.2 13.5 Erosion206 170 San Diego 17500 800 No No 1.2 >>14 Erosion207 350 San Diego 8750 800 No No 1.2 12 Erosion208 350 San Diego 17500 800 No No 1.2 12.5 Erosion209 640 San Diego 8750 800 No No 1.2 11 Erosion210 640 San Diego 17500 800 No No 1.2 11.5 Erosion211 170 San Joaquin 8750 800 No No 1.2 >>14 Erosion212 170 San Joaquin 17500 800 No No 1.2 >>14 Erosion213 350 San Joaquin 8750 800 No No 1.2 13 Erosion214 350 San Joaquin 17500 800 No No 1.2 14 Erosion215 640 San Joaquin 8750 800 No No 1.2 12 Erosion216 640 San Joaquin 17500 800 No No 1.2 12.5 Erosion
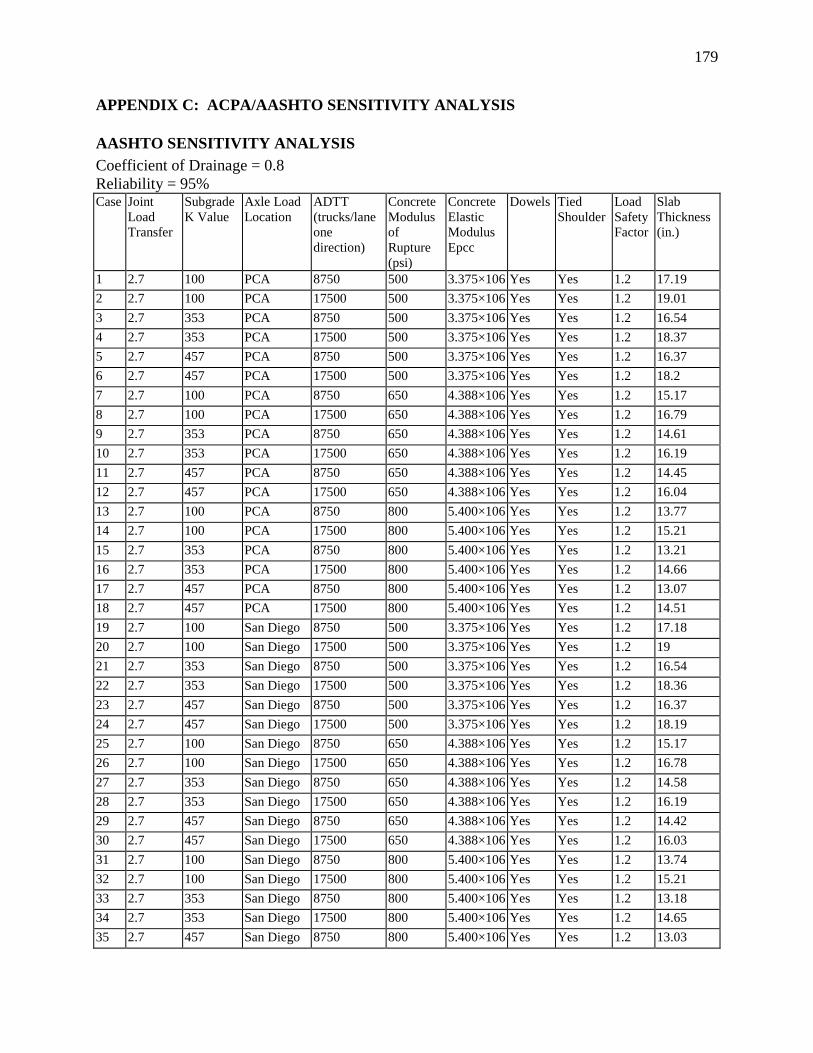
179
APPENDIX C: ACPA/AASHTO SENSITIVITY ANALYSIS
AASHTO SENSITIVITY ANALYSISCoefficient of Drainage = 0.8Reliability = 95%Case Joint
LoadTransfer
SubgradeK Value
Axle LoadLocation
ADTT(trucks/laneonedirection)
ConcreteModulusofRupture(psi)
ConcreteElasticModulusEpcc
Dowels TiedShoulder
LoadSafetyFactor
SlabThickness(in.)
1 2.7 100 PCA 8750 500 3.375×10⁶ Yes Yes 1.2 17.192 2.7 100 PCA 17500 500 3.375×10⁶ Yes Yes 1.2 19.013 2.7 353 PCA 8750 500 3.375×10⁶ Yes Yes 1.2 16.544 2.7 353 PCA 17500 500 3.375×10⁶ Yes Yes 1.2 18.375 2.7 457 PCA 8750 500 3.375×10⁶ Yes Yes 1.2 16.376 2.7 457 PCA 17500 500 3.375×10⁶ Yes Yes 1.2 18.27 2.7 100 PCA 8750 650 4.388×10⁶ Yes Yes 1.2 15.178 2.7 100 PCA 17500 650 4.388×10⁶ Yes Yes 1.2 16.799 2.7 353 PCA 8750 650 4.388×10⁶ Yes Yes 1.2 14.6110 2.7 353 PCA 17500 650 4.388×10⁶ Yes Yes 1.2 16.1911 2.7 457 PCA 8750 650 4.388×10⁶ Yes Yes 1.2 14.4512 2.7 457 PCA 17500 650 4.388×10⁶ Yes Yes 1.2 16.0413 2.7 100 PCA 8750 800 5.400×10⁶ Yes Yes 1.2 13.7714 2.7 100 PCA 17500 800 5.400×10⁶ Yes Yes 1.2 15.2115 2.7 353 PCA 8750 800 5.400×10⁶ Yes Yes 1.2 13.2116 2.7 353 PCA 17500 800 5.400×10⁶ Yes Yes 1.2 14.6617 2.7 457 PCA 8750 800 5.400×10⁶ Yes Yes 1.2 13.0718 2.7 457 PCA 17500 800 5.400×10⁶ Yes Yes 1.2 14.5119 2.7 100 San Diego 8750 500 3.375×10⁶ Yes Yes 1.2 17.1820 2.7 100 San Diego 17500 500 3.375×10⁶ Yes Yes 1.2 1921 2.7 353 San Diego 8750 500 3.375×10⁶ Yes Yes 1.2 16.5422 2.7 353 San Diego 17500 500 3.375×10⁶ Yes Yes 1.2 18.3623 2.7 457 San Diego 8750 500 3.375×10⁶ Yes Yes 1.2 16.3724 2.7 457 San Diego 17500 500 3.375×10⁶ Yes Yes 1.2 18.1925 2.7 100 San Diego 8750 650 4.388×10⁶ Yes Yes 1.2 15.1726 2.7 100 San Diego 17500 650 4.388×10⁶ Yes Yes 1.2 16.7827 2.7 353 San Diego 8750 650 4.388×10⁶ Yes Yes 1.2 14.5828 2.7 353 San Diego 17500 650 4.388×10⁶ Yes Yes 1.2 16.1929 2.7 457 San Diego 8750 650 4.388×10⁶ Yes Yes 1.2 14.4230 2.7 457 San Diego 17500 650 4.388×10⁶ Yes Yes 1.2 16.0331 2.7 100 San Diego 8750 800 5.400×10⁶ Yes Yes 1.2 13.7432 2.7 100 San Diego 17500 800 5.400×10⁶ Yes Yes 1.2 15.2133 2.7 353 San Diego 8750 800 5.400×10⁶ Yes Yes 1.2 13.1834 2.7 353 San Diego 17500 800 5.400×10⁶ Yes Yes 1.2 14.6535 2.7 457 San Diego 8750 800 5.400×10⁶ Yes Yes 1.2 13.03
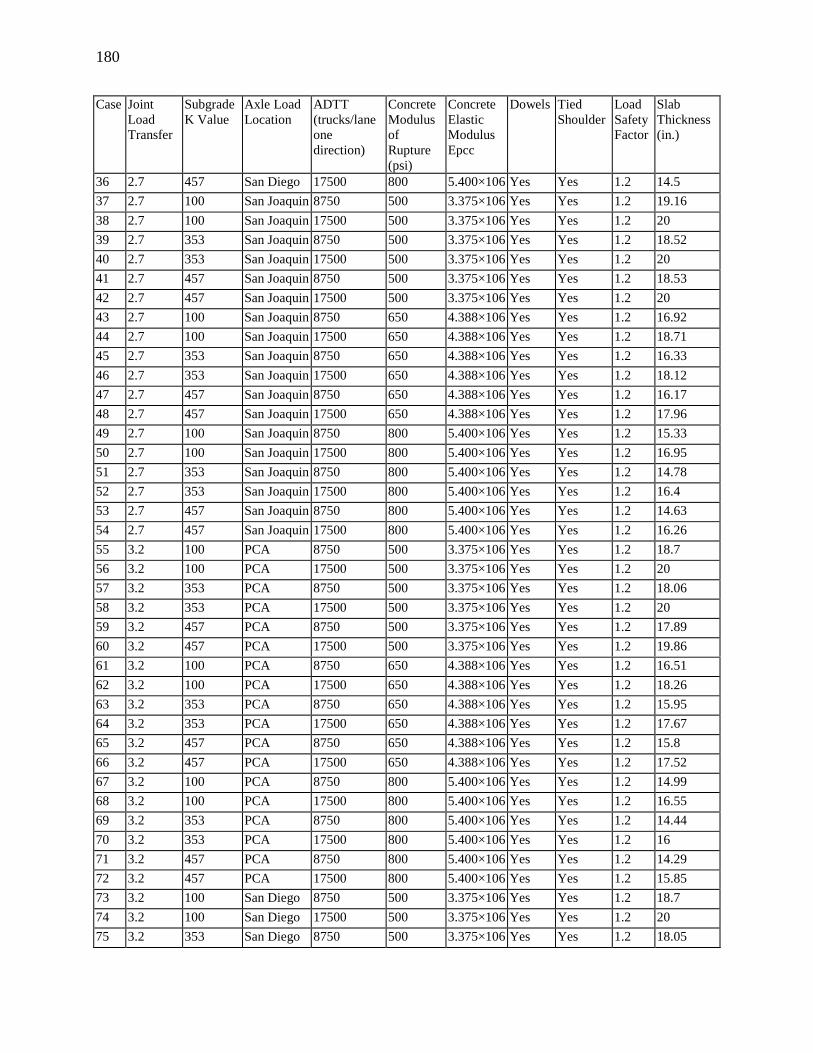
180
Case JointLoadTransfer
SubgradeK Value
Axle LoadLocation
ADTT(trucks/laneonedirection)
ConcreteModulusofRupture(psi)
ConcreteElasticModulusEpcc
Dowels TiedShoulder
LoadSafetyFactor
SlabThickness(in.)
36 2.7 457 San Diego 17500 800 5.400×10⁶ Yes Yes 1.2 14.537 2.7 100 San Joaquin 8750 500 3.375×10⁶ Yes Yes 1.2 19.1638 2.7 100 San Joaquin 17500 500 3.375×10⁶ Yes Yes 1.2 2039 2.7 353 San Joaquin 8750 500 3.375×10⁶ Yes Yes 1.2 18.5240 2.7 353 San Joaquin 17500 500 3.375×10⁶ Yes Yes 1.2 2041 2.7 457 San Joaquin 8750 500 3.375×10⁶ Yes Yes 1.2 18.5342 2.7 457 San Joaquin 17500 500 3.375×10⁶ Yes Yes 1.2 2043 2.7 100 San Joaquin 8750 650 4.388×10⁶ Yes Yes 1.2 16.9244 2.7 100 San Joaquin 17500 650 4.388×10⁶ Yes Yes 1.2 18.7145 2.7 353 San Joaquin 8750 650 4.388×10⁶ Yes Yes 1.2 16.3346 2.7 353 San Joaquin 17500 650 4.388×10⁶ Yes Yes 1.2 18.1247 2.7 457 San Joaquin 8750 650 4.388×10⁶ Yes Yes 1.2 16.1748 2.7 457 San Joaquin 17500 650 4.388×10⁶ Yes Yes 1.2 17.9649 2.7 100 San Joaquin 8750 800 5.400×10⁶ Yes Yes 1.2 15.3350 2.7 100 San Joaquin 17500 800 5.400×10⁶ Yes Yes 1.2 16.9551 2.7 353 San Joaquin 8750 800 5.400×10⁶ Yes Yes 1.2 14.7852 2.7 353 San Joaquin 17500 800 5.400×10⁶ Yes Yes 1.2 16.453 2.7 457 San Joaquin 8750 800 5.400×10⁶ Yes Yes 1.2 14.6354 2.7 457 San Joaquin 17500 800 5.400×10⁶ Yes Yes 1.2 16.2655 3.2 100 PCA 8750 500 3.375×10⁶ Yes Yes 1.2 18.756 3.2 100 PCA 17500 500 3.375×10⁶ Yes Yes 1.2 2057 3.2 353 PCA 8750 500 3.375×10⁶ Yes Yes 1.2 18.0658 3.2 353 PCA 17500 500 3.375×10⁶ Yes Yes 1.2 2059 3.2 457 PCA 8750 500 3.375×10⁶ Yes Yes 1.2 17.8960 3.2 457 PCA 17500 500 3.375×10⁶ Yes Yes 1.2 19.8661 3.2 100 PCA 8750 650 4.388×10⁶ Yes Yes 1.2 16.5162 3.2 100 PCA 17500 650 4.388×10⁶ Yes Yes 1.2 18.2663 3.2 353 PCA 8750 650 4.388×10⁶ Yes Yes 1.2 15.9564 3.2 353 PCA 17500 650 4.388×10⁶ Yes Yes 1.2 17.6765 3.2 457 PCA 8750 650 4.388×10⁶ Yes Yes 1.2 15.866 3.2 457 PCA 17500 650 4.388×10⁶ Yes Yes 1.2 17.5267 3.2 100 PCA 8750 800 5.400×10⁶ Yes Yes 1.2 14.9968 3.2 100 PCA 17500 800 5.400×10⁶ Yes Yes 1.2 16.5569 3.2 353 PCA 8750 800 5.400×10⁶ Yes Yes 1.2 14.4470 3.2 353 PCA 17500 800 5.400×10⁶ Yes Yes 1.2 1671 3.2 457 PCA 8750 800 5.400×10⁶ Yes Yes 1.2 14.2972 3.2 457 PCA 17500 800 5.400×10⁶ Yes Yes 1.2 15.8573 3.2 100 San Diego 8750 500 3.375×10⁶ Yes Yes 1.2 18.774 3.2 100 San Diego 17500 500 3.375×10⁶ Yes Yes 1.2 2075 3.2 353 San Diego 8750 500 3.375×10⁶ Yes Yes 1.2 18.05

181
Case JointLoadTransfer
SubgradeK Value
Axle LoadLocation
ADTT(trucks/laneonedirection)
ConcreteModulusofRupture(psi)
ConcreteElasticModulusEpcc
Dowels TiedShoulder
LoadSafetyFactor
SlabThickness(in.)
76 3.2 353 San Diego 17500 500 3.375×10⁶ Yes Yes 1.2 2077 3.2 457 San Diego 8750 500 3.375×10⁶ Yes Yes 1.2 17.8978 3.2 457 San Diego 17500 500 3.375×10⁶ Yes Yes 1.2 19.8679 3.2 100 San Diego 8750 650 4.388×10⁶ Yes Yes 1.2 16.5180 3.2 100 San Diego 17500 650 4.388×10⁶ Yes Yes 1.2 18.2681 3.2 353 San Diego 8750 650 4.388×10⁶ Yes Yes 1.2 15.9282 3.2 353 San Diego 17500 650 4.388×10⁶ Yes Yes 1.2 17.6783 3.2 457 San Diego 8750 650 4.388×10⁶ Yes Yes 1.2 15.7684 3.2 457 San Diego 17500 650 4.388×10⁶ Yes Yes 1.2 17.5185 3.2 100 San Diego 8750 800 5.400×10⁶ Yes Yes 1.2 14.9686 3.2 100 San Diego 17500 800 5.400×10⁶ Yes Yes 1.2 16.5487 3.2 353 San Diego 8750 800 5.400×10⁶ Yes Yes 1.2 14.4188 3.2 353 San Diego 17500 800 5.400×10⁶ Yes Yes 1.2 15.9989 3.2 457 San Diego 8750 800 5.400×10⁶ Yes Yes 1.2 14.2690 3.2 457 San Diego 17500 800 5.400×10⁶ Yes Yes 1.2 15.8591 3.2 100 San Joaquin 8750 500 3.375×10⁶ Yes Yes 1.2 2092 3.2 100 San Joaquin 17500 500 3.375×10⁶ Yes Yes 1.2 2093 3.2 353 San Joaquin 8750 500 3.375×10⁶ Yes Yes 1.2 2094 3.2 353 San Joaquin 17500 500 3.375×10⁶ Yes Yes 1.2 2095 3.2 457 San Joaquin 8750 500 3.375×10⁶ Yes Yes 1.2 2096 3.2 457 San Joaquin 17500 500 3.375×10⁶ Yes Yes 1.2 2097 3.2 100 San Joaquin 8750 650 4.388×10⁶ Yes Yes 1.2 18.4198 3.2 100 San Joaquin 17500 650 4.388×10⁶ Yes Yes 1.2 2099 3.2 353 San Joaquin 8750 650 4.388×10⁶ Yes Yes 1.2 17.81100 3.2 353 San Joaquin 17500 650 4.388×10⁶ Yes Yes 1.2 19.75101 3.2 457 San Joaquin 8750 650 4.388×10⁶ Yes Yes 1.2 17.66102 3.2 457 San Joaquin 17500 650 4.388×10⁶ Yes Yes 1.2 19.59103 3.2 100 San Joaquin 8750 800 5.400×10⁶ Yes Yes 1.2 16.68104 3.2 100 San Joaquin 17500 800 5.400×10⁶ Yes Yes 1.2 18.44105 3.2 353 San Joaquin 8750 800 5.400×10⁶ Yes Yes 1.2 16.13106 3.2 353 San Joaquin 17500 800 5.400×10⁶ Yes Yes 1.2 17.88107 3.2 457 San Joaquin 8750 800 5.400×10⁶ Yes Yes 1.2 15.98108 3.2 457 San Joaquin 17500 800 5.400×10⁶ Yes Yes 1.2 17.74109 3.6 100 PCA 8750 500 3.375×10⁶ Yes Yes 1.2 19.83110 3.6 100 PCA 17500 500 3.375×10⁶ Yes Yes 1.2 20111 3.6 353 PCA 8750 500 3.375×10⁶ Yes Yes 1.2 19.18112 3.6 353 PCA 17500 500 3.375×10⁶ Yes Yes 1.2 20113 3.6 457 PCA 8750 500 3.375×10⁶ Yes Yes 1.2 19.02114 3.6 457 PCA 17500 500 3.375×10⁶ Yes Yes 1.2 20115 3.6 100 PCA 8750 650 4.388×10⁶ Yes Yes 1.2 17.51
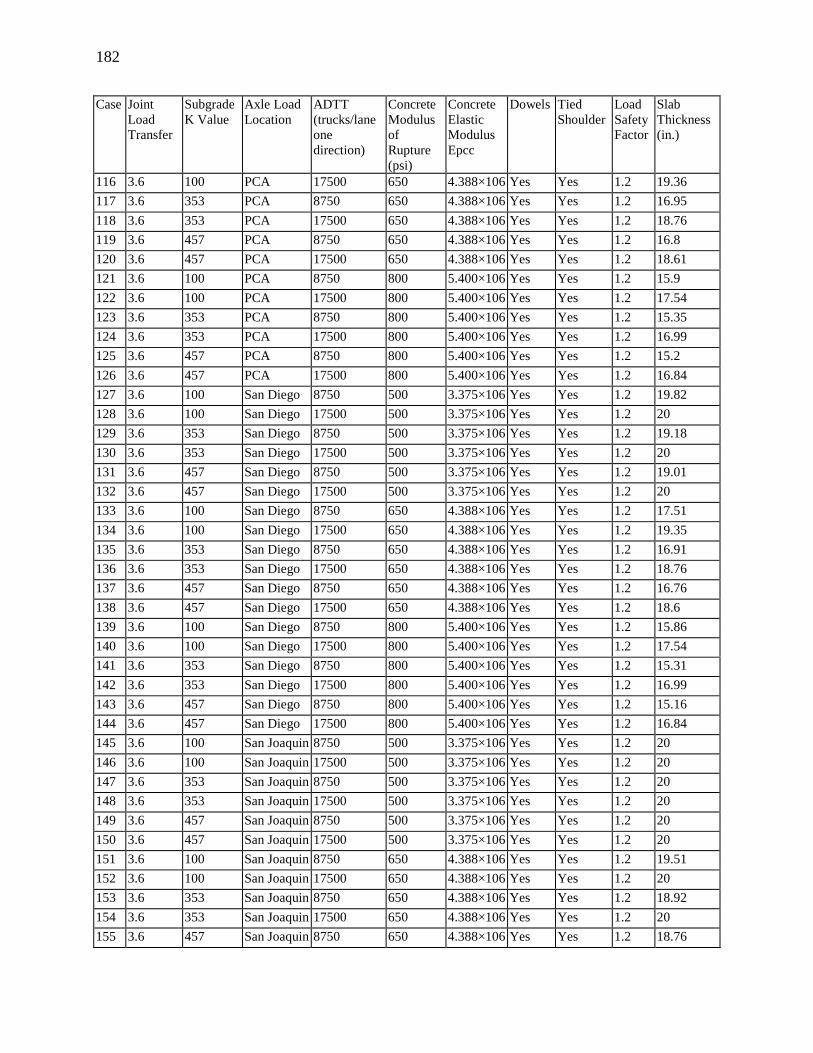
182
Case JointLoadTransfer
SubgradeK Value
Axle LoadLocation
ADTT(trucks/laneonedirection)
ConcreteModulusofRupture(psi)
ConcreteElasticModulusEpcc
Dowels TiedShoulder
LoadSafetyFactor
SlabThickness(in.)
116 3.6 100 PCA 17500 650 4.388×10⁶ Yes Yes 1.2 19.36117 3.6 353 PCA 8750 650 4.388×10⁶ Yes Yes 1.2 16.95118 3.6 353 PCA 17500 650 4.388×10⁶ Yes Yes 1.2 18.76119 3.6 457 PCA 8750 650 4.388×10⁶ Yes Yes 1.2 16.8120 3.6 457 PCA 17500 650 4.388×10⁶ Yes Yes 1.2 18.61121 3.6 100 PCA 8750 800 5.400×10⁶ Yes Yes 1.2 15.9122 3.6 100 PCA 17500 800 5.400×10⁶ Yes Yes 1.2 17.54123 3.6 353 PCA 8750 800 5.400×10⁶ Yes Yes 1.2 15.35124 3.6 353 PCA 17500 800 5.400×10⁶ Yes Yes 1.2 16.99125 3.6 457 PCA 8750 800 5.400×10⁶ Yes Yes 1.2 15.2126 3.6 457 PCA 17500 800 5.400×10⁶ Yes Yes 1.2 16.84127 3.6 100 San Diego 8750 500 3.375×10⁶ Yes Yes 1.2 19.82128 3.6 100 San Diego 17500 500 3.375×10⁶ Yes Yes 1.2 20129 3.6 353 San Diego 8750 500 3.375×10⁶ Yes Yes 1.2 19.18130 3.6 353 San Diego 17500 500 3.375×10⁶ Yes Yes 1.2 20131 3.6 457 San Diego 8750 500 3.375×10⁶ Yes Yes 1.2 19.01132 3.6 457 San Diego 17500 500 3.375×10⁶ Yes Yes 1.2 20133 3.6 100 San Diego 8750 650 4.388×10⁶ Yes Yes 1.2 17.51134 3.6 100 San Diego 17500 650 4.388×10⁶ Yes Yes 1.2 19.35135 3.6 353 San Diego 8750 650 4.388×10⁶ Yes Yes 1.2 16.91136 3.6 353 San Diego 17500 650 4.388×10⁶ Yes Yes 1.2 18.76137 3.6 457 San Diego 8750 650 4.388×10⁶ Yes Yes 1.2 16.76138 3.6 457 San Diego 17500 650 4.388×10⁶ Yes Yes 1.2 18.6139 3.6 100 San Diego 8750 800 5.400×10⁶ Yes Yes 1.2 15.86140 3.6 100 San Diego 17500 800 5.400×10⁶ Yes Yes 1.2 17.54141 3.6 353 San Diego 8750 800 5.400×10⁶ Yes Yes 1.2 15.31142 3.6 353 San Diego 17500 800 5.400×10⁶ Yes Yes 1.2 16.99143 3.6 457 San Diego 8750 800 5.400×10⁶ Yes Yes 1.2 15.16144 3.6 457 San Diego 17500 800 5.400×10⁶ Yes Yes 1.2 16.84145 3.6 100 San Joaquin 8750 500 3.375×10⁶ Yes Yes 1.2 20146 3.6 100 San Joaquin 17500 500 3.375×10⁶ Yes Yes 1.2 20147 3.6 353 San Joaquin 8750 500 3.375×10⁶ Yes Yes 1.2 20148 3.6 353 San Joaquin 17500 500 3.375×10⁶ Yes Yes 1.2 20149 3.6 457 San Joaquin 8750 500 3.375×10⁶ Yes Yes 1.2 20150 3.6 457 San Joaquin 17500 500 3.375×10⁶ Yes Yes 1.2 20151 3.6 100 San Joaquin 8750 650 4.388×10⁶ Yes Yes 1.2 19.51152 3.6 100 San Joaquin 17500 650 4.388×10⁶ Yes Yes 1.2 20153 3.6 353 San Joaquin 8750 650 4.388×10⁶ Yes Yes 1.2 18.92154 3.6 353 San Joaquin 17500 650 4.388×10⁶ Yes Yes 1.2 20155 3.6 457 San Joaquin 8750 650 4.388×10⁶ Yes Yes 1.2 18.76
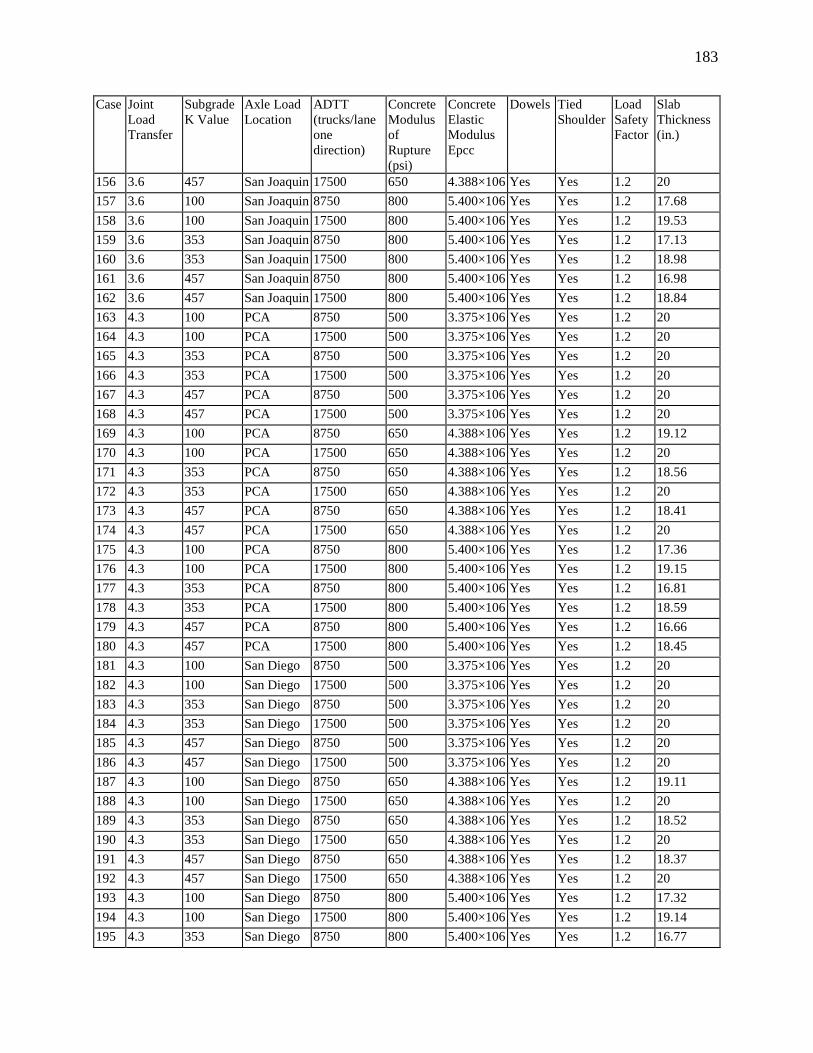
183
Case JointLoadTransfer
SubgradeK Value
Axle LoadLocation
ADTT(trucks/laneonedirection)
ConcreteModulusofRupture(psi)
ConcreteElasticModulusEpcc
Dowels TiedShoulder
LoadSafetyFactor
SlabThickness(in.)
156 3.6 457 San Joaquin 17500 650 4.388×10⁶ Yes Yes 1.2 20157 3.6 100 San Joaquin 8750 800 5.400×10⁶ Yes Yes 1.2 17.68158 3.6 100 San Joaquin 17500 800 5.400×10⁶ Yes Yes 1.2 19.53159 3.6 353 San Joaquin 8750 800 5.400×10⁶ Yes Yes 1.2 17.13160 3.6 353 San Joaquin 17500 800 5.400×10⁶ Yes Yes 1.2 18.98161 3.6 457 San Joaquin 8750 800 5.400×10⁶ Yes Yes 1.2 16.98162 3.6 457 San Joaquin 17500 800 5.400×10⁶ Yes Yes 1.2 18.84163 4.3 100 PCA 8750 500 3.375×10⁶ Yes Yes 1.2 20164 4.3 100 PCA 17500 500 3.375×10⁶ Yes Yes 1.2 20165 4.3 353 PCA 8750 500 3.375×10⁶ Yes Yes 1.2 20166 4.3 353 PCA 17500 500 3.375×10⁶ Yes Yes 1.2 20167 4.3 457 PCA 8750 500 3.375×10⁶ Yes Yes 1.2 20168 4.3 457 PCA 17500 500 3.375×10⁶ Yes Yes 1.2 20169 4.3 100 PCA 8750 650 4.388×10⁶ Yes Yes 1.2 19.12170 4.3 100 PCA 17500 650 4.388×10⁶ Yes Yes 1.2 20171 4.3 353 PCA 8750 650 4.388×10⁶ Yes Yes 1.2 18.56172 4.3 353 PCA 17500 650 4.388×10⁶ Yes Yes 1.2 20173 4.3 457 PCA 8750 650 4.388×10⁶ Yes Yes 1.2 18.41174 4.3 457 PCA 17500 650 4.388×10⁶ Yes Yes 1.2 20175 4.3 100 PCA 8750 800 5.400×10⁶ Yes Yes 1.2 17.36176 4.3 100 PCA 17500 800 5.400×10⁶ Yes Yes 1.2 19.15177 4.3 353 PCA 8750 800 5.400×10⁶ Yes Yes 1.2 16.81178 4.3 353 PCA 17500 800 5.400×10⁶ Yes Yes 1.2 18.59179 4.3 457 PCA 8750 800 5.400×10⁶ Yes Yes 1.2 16.66180 4.3 457 PCA 17500 800 5.400×10⁶ Yes Yes 1.2 18.45181 4.3 100 San Diego 8750 500 3.375×10⁶ Yes Yes 1.2 20182 4.3 100 San Diego 17500 500 3.375×10⁶ Yes Yes 1.2 20183 4.3 353 San Diego 8750 500 3.375×10⁶ Yes Yes 1.2 20184 4.3 353 San Diego 17500 500 3.375×10⁶ Yes Yes 1.2 20185 4.3 457 San Diego 8750 500 3.375×10⁶ Yes Yes 1.2 20186 4.3 457 San Diego 17500 500 3.375×10⁶ Yes Yes 1.2 20187 4.3 100 San Diego 8750 650 4.388×10⁶ Yes Yes 1.2 19.11188 4.3 100 San Diego 17500 650 4.388×10⁶ Yes Yes 1.2 20189 4.3 353 San Diego 8750 650 4.388×10⁶ Yes Yes 1.2 18.52190 4.3 353 San Diego 17500 650 4.388×10⁶ Yes Yes 1.2 20191 4.3 457 San Diego 8750 650 4.388×10⁶ Yes Yes 1.2 18.37192 4.3 457 San Diego 17500 650 4.388×10⁶ Yes Yes 1.2 20193 4.3 100 San Diego 8750 800 5.400×10⁶ Yes Yes 1.2 17.32194 4.3 100 San Diego 17500 800 5.400×10⁶ Yes Yes 1.2 19.14195 4.3 353 San Diego 8750 800 5.400×10⁶ Yes Yes 1.2 16.77
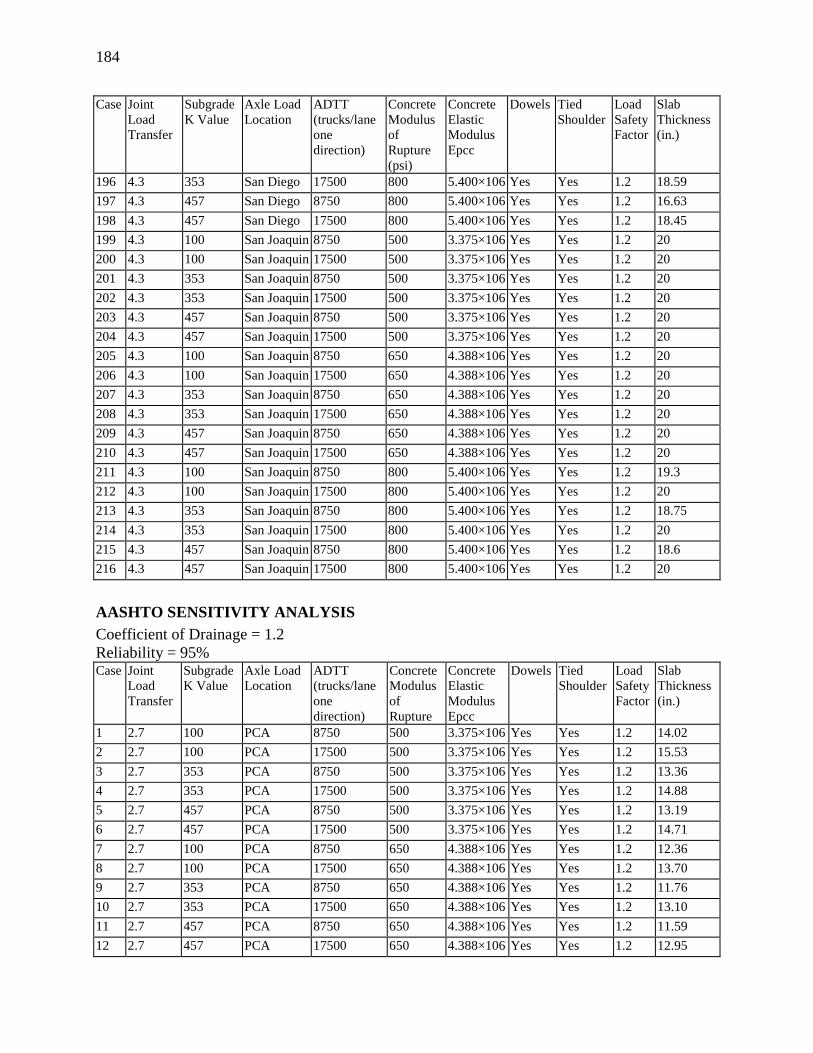
184
Case JointLoadTransfer
SubgradeK Value
Axle LoadLocation
ADTT(trucks/laneonedirection)
ConcreteModulusofRupture(psi)
ConcreteElasticModulusEpcc
Dowels TiedShoulder
LoadSafetyFactor
SlabThickness(in.)
196 4.3 353 San Diego 17500 800 5.400×10⁶ Yes Yes 1.2 18.59197 4.3 457 San Diego 8750 800 5.400×10⁶ Yes Yes 1.2 16.63198 4.3 457 San Diego 17500 800 5.400×10⁶ Yes Yes 1.2 18.45199 4.3 100 San Joaquin 8750 500 3.375×10⁶ Yes Yes 1.2 20200 4.3 100 San Joaquin 17500 500 3.375×10⁶ Yes Yes 1.2 20201 4.3 353 San Joaquin 8750 500 3.375×10⁶ Yes Yes 1.2 20202 4.3 353 San Joaquin 17500 500 3.375×10⁶ Yes Yes 1.2 20203 4.3 457 San Joaquin 8750 500 3.375×10⁶ Yes Yes 1.2 20204 4.3 457 San Joaquin 17500 500 3.375×10⁶ Yes Yes 1.2 20205 4.3 100 San Joaquin 8750 650 4.388×10⁶ Yes Yes 1.2 20206 4.3 100 San Joaquin 17500 650 4.388×10⁶ Yes Yes 1.2 20207 4.3 353 San Joaquin 8750 650 4.388×10⁶ Yes Yes 1.2 20208 4.3 353 San Joaquin 17500 650 4.388×10⁶ Yes Yes 1.2 20209 4.3 457 San Joaquin 8750 650 4.388×10⁶ Yes Yes 1.2 20210 4.3 457 San Joaquin 17500 650 4.388×10⁶ Yes Yes 1.2 20211 4.3 100 San Joaquin 8750 800 5.400×10⁶ Yes Yes 1.2 19.3212 4.3 100 San Joaquin 17500 800 5.400×10⁶ Yes Yes 1.2 20213 4.3 353 San Joaquin 8750 800 5.400×10⁶ Yes Yes 1.2 18.75214 4.3 353 San Joaquin 17500 800 5.400×10⁶ Yes Yes 1.2 20215 4.3 457 San Joaquin 8750 800 5.400×10⁶ Yes Yes 1.2 18.6216 4.3 457 San Joaquin 17500 800 5.400×10⁶ Yes Yes 1.2 20
AASHTO SENSITIVITY ANALYSISCoefficient of Drainage = 1.2Reliability = 95%Case Joint
LoadTransfer
SubgradeK Value
Axle LoadLocation
ADTT(trucks/laneonedirection)
ConcreteModulusofRupture
ConcreteElasticModulusEpcc
Dowels TiedShoulder
LoadSafetyFactor
SlabThickness(in.)
1 2.7 100 PCA 8750 500 3.375×10⁶ Yes Yes 1.2 14.022 2.7 100 PCA 17500 500 3.375×10⁶ Yes Yes 1.2 15.533 2.7 353 PCA 8750 500 3.375×10⁶ Yes Yes 1.2 13.364 2.7 353 PCA 17500 500 3.375×10⁶ Yes Yes 1.2 14.885 2.7 457 PCA 8750 500 3.375×10⁶ Yes Yes 1.2 13.196 2.7 457 PCA 17500 500 3.375×10⁶ Yes Yes 1.2 14.717 2.7 100 PCA 8750 650 4.388×10⁶ Yes Yes 1.2 12.368 2.7 100 PCA 17500 650 4.388×10⁶ Yes Yes 1.2 13.709 2.7 353 PCA 8750 650 4.388×10⁶ Yes Yes 1.2 11.7610 2.7 353 PCA 17500 650 4.388×10⁶ Yes Yes 1.2 13.1011 2.7 457 PCA 8750 650 4.388×10⁶ Yes Yes 1.2 11.5912 2.7 457 PCA 17500 650 4.388×10⁶ Yes Yes 1.2 12.95
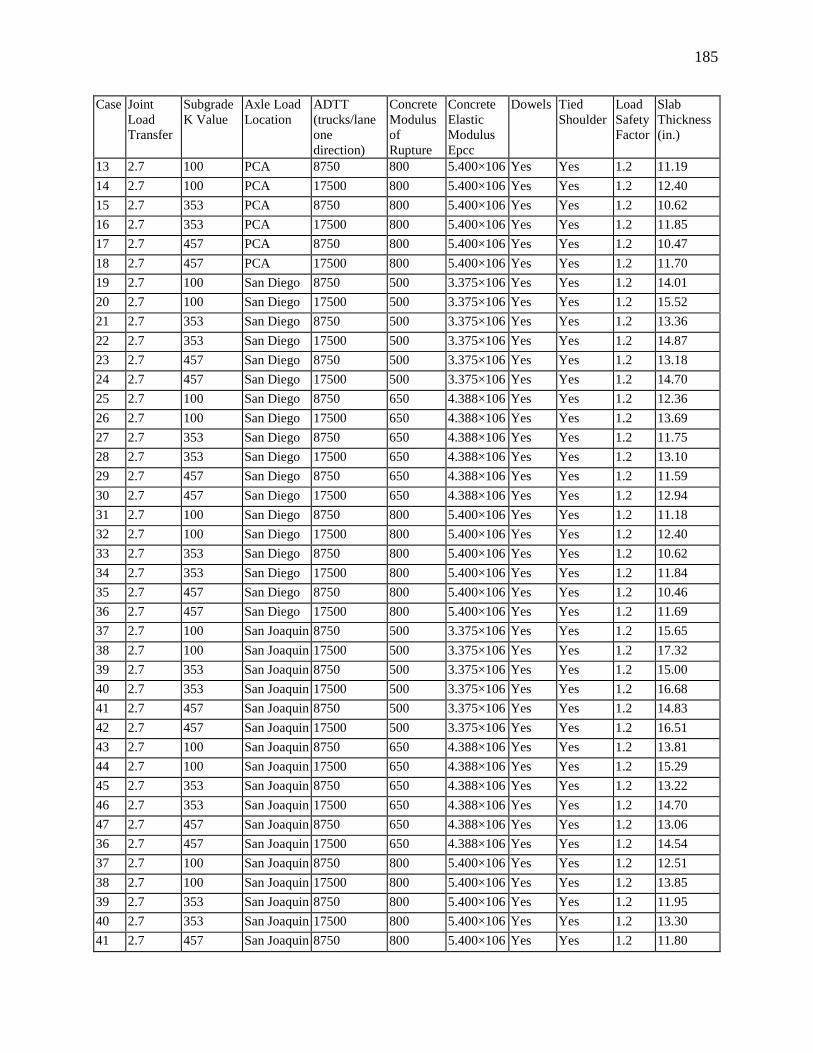
185
Case JointLoadTransfer
SubgradeK Value
Axle LoadLocation
ADTT(trucks/laneonedirection)
ConcreteModulusofRupture
ConcreteElasticModulusEpcc
Dowels TiedShoulder
LoadSafetyFactor
SlabThickness(in.)
13 2.7 100 PCA 8750 800 5.400×10⁶ Yes Yes 1.2 11.1914 2.7 100 PCA 17500 800 5.400×10⁶ Yes Yes 1.2 12.4015 2.7 353 PCA 8750 800 5.400×10⁶ Yes Yes 1.2 10.6216 2.7 353 PCA 17500 800 5.400×10⁶ Yes Yes 1.2 11.8517 2.7 457 PCA 8750 800 5.400×10⁶ Yes Yes 1.2 10.4718 2.7 457 PCA 17500 800 5.400×10⁶ Yes Yes 1.2 11.7019 2.7 100 San Diego 8750 500 3.375×10⁶ Yes Yes 1.2 14.0120 2.7 100 San Diego 17500 500 3.375×10⁶ Yes Yes 1.2 15.5221 2.7 353 San Diego 8750 500 3.375×10⁶ Yes Yes 1.2 13.3622 2.7 353 San Diego 17500 500 3.375×10⁶ Yes Yes 1.2 14.8723 2.7 457 San Diego 8750 500 3.375×10⁶ Yes Yes 1.2 13.1824 2.7 457 San Diego 17500 500 3.375×10⁶ Yes Yes 1.2 14.7025 2.7 100 San Diego 8750 650 4.388×10⁶ Yes Yes 1.2 12.3626 2.7 100 San Diego 17500 650 4.388×10⁶ Yes Yes 1.2 13.6927 2.7 353 San Diego 8750 650 4.388×10⁶ Yes Yes 1.2 11.7528 2.7 353 San Diego 17500 650 4.388×10⁶ Yes Yes 1.2 13.1029 2.7 457 San Diego 8750 650 4.388×10⁶ Yes Yes 1.2 11.5930 2.7 457 San Diego 17500 650 4.388×10⁶ Yes Yes 1.2 12.9431 2.7 100 San Diego 8750 800 5.400×10⁶ Yes Yes 1.2 11.1832 2.7 100 San Diego 17500 800 5.400×10⁶ Yes Yes 1.2 12.4033 2.7 353 San Diego 8750 800 5.400×10⁶ Yes Yes 1.2 10.6234 2.7 353 San Diego 17500 800 5.400×10⁶ Yes Yes 1.2 11.8435 2.7 457 San Diego 8750 800 5.400×10⁶ Yes Yes 1.2 10.4636 2.7 457 San Diego 17500 800 5.400×10⁶ Yes Yes 1.2 11.6937 2.7 100 San Joaquin 8750 500 3.375×10⁶ Yes Yes 1.2 15.6538 2.7 100 San Joaquin 17500 500 3.375×10⁶ Yes Yes 1.2 17.3239 2.7 353 San Joaquin 8750 500 3.375×10⁶ Yes Yes 1.2 15.0040 2.7 353 San Joaquin 17500 500 3.375×10⁶ Yes Yes 1.2 16.6841 2.7 457 San Joaquin 8750 500 3.375×10⁶ Yes Yes 1.2 14.8342 2.7 457 San Joaquin 17500 500 3.375×10⁶ Yes Yes 1.2 16.5143 2.7 100 San Joaquin 8750 650 4.388×10⁶ Yes Yes 1.2 13.8144 2.7 100 San Joaquin 17500 650 4.388×10⁶ Yes Yes 1.2 15.2945 2.7 353 San Joaquin 8750 650 4.388×10⁶ Yes Yes 1.2 13.2246 2.7 353 San Joaquin 17500 650 4.388×10⁶ Yes Yes 1.2 14.7047 2.7 457 San Joaquin 8750 650 4.388×10⁶ Yes Yes 1.2 13.0636 2.7 457 San Joaquin 17500 650 4.388×10⁶ Yes Yes 1.2 14.5437 2.7 100 San Joaquin 8750 800 5.400×10⁶ Yes Yes 1.2 12.5138 2.7 100 San Joaquin 17500 800 5.400×10⁶ Yes Yes 1.2 13.8539 2.7 353 San Joaquin 8750 800 5.400×10⁶ Yes Yes 1.2 11.9540 2.7 353 San Joaquin 17500 800 5.400×10⁶ Yes Yes 1.2 13.3041 2.7 457 San Joaquin 8750 800 5.400×10⁶ Yes Yes 1.2 11.80

186
Case JointLoadTransfer
SubgradeK Value
Axle LoadLocation
ADTT(trucks/laneonedirection)
ConcreteModulusofRupture
ConcreteElasticModulusEpcc
Dowels TiedShoulder
LoadSafetyFactor
SlabThickness(in.)
42 2.7 457 San Joaquin 17500 800 5.400×10⁶ Yes Yes 1.2 13.1543 3.2 100 PCA 8750 500 3.375×10⁶ Yes Yes 1.2 15.2744 3.2 100 PCA 17500 500 3.375×10⁶ Yes Yes 1.2 16.9145 3.2 353 PCA 8750 500 3.375×10⁶ Yes Yes 1.2 14.6346 3.2 353 PCA 17500 500 3.375×10⁶ Yes Yes 1.2 16.2647 3.2 457 PCA 8750 500 3.375×10⁶ Yes Yes 1.2 14.4548 3.2 457 PCA 17500 500 3.375×10⁶ Yes Yes 1.2 16.0949 3.2 100 PCA 8750 650 4.388×10⁶ Yes Yes 1.2 13.4750 3.2 100 PCA 17500 650 4.388×10⁶ Yes Yes 1.2 14.9251 3.2 353 PCA 8750 650 4.388×10⁶ Yes Yes 1.2 12.8852 3.2 353 PCA 17500 650 4.388×10⁶ Yes Yes 1.2 14.3353 3.2 457 PCA 8750 650 4.388×10⁶ Yes Yes 1.2 12.7254 3.2 457 PCA 17500 650 4.388×10⁶ Yes Yes 1.2 14.1755 3.2 100 PCA 8750 800 5.400×10⁶ Yes Yes 1.2 12.2056 3.2 100 PCA 17500 800 5.400×10⁶ Yes Yes 1.2 13.5257 3.2 353 PCA 8750 800 5.400×10⁶ Yes Yes 1.2 11.6458 3.2 353 PCA 17500 800 5.400×10⁶ Yes Yes 1.2 12.9659 3.2 457 PCA 8750 800 5.400×10⁶ Yes Yes 1.2 11.4960 3.2 457 PCA 17500 800 5.400×10⁶ Yes Yes 1.2 12.8261 3.2 100 San Diego 8750 500 3.375×10⁶ Yes Yes 1.2 15.2762 3.2 100 San Diego 17500 500 3.375×10⁶ Yes Yes 1.2 16.9063 3.2 353 San Diego 8750 500 3.375×10⁶ Yes Yes 1.2 14.6264 3.2 353 San Diego 17500 500 3.375×10⁶ Yes Yes 1.2 16.2665 3.2 457 San Diego 8750 500 3.375×10⁶ Yes Yes 1.2 14.4566 3.2 457 San Diego 17500 500 3.375×10⁶ Yes Yes 1.2 16.0967 3.2 100 San Diego 8750 650 4.388×10⁶ Yes Yes 1.2 13.4768 3.2 100 San Diego 17500 650 4.388×10⁶ Yes Yes 1.2 14.9269 3.2 353 San Diego 8750 650 4.388×10⁶ Yes Yes 1.2 12.8770 3.2 353 San Diego 17500 650 4.388×10⁶ Yes Yes 1.2 14.3371 3.2 457 San Diego 8750 650 4.388×10⁶ Yes Yes 1.2 12.7172 3.2 457 San Diego 17500 650 4.388×10⁶ Yes Yes 1.2 14.1773 3.2 100 San Diego 8750 800 5.400×10⁶ Yes Yes 1.2 12.2074 3.2 100 San Diego 17500 800 5.400×10⁶ Yes Yes 1.2 13.5175 3.2 353 San Diego 8750 800 5.400×10⁶ Yes Yes 1.2 11.6476 3.2 353 San Diego 17500 800 5.400×10⁶ Yes Yes 1.2 12.9677 3.2 457 San Diego 8750 800 5.400×10⁶ Yes Yes 1.2 11.4978 3.2 457 San Diego 17500 800 5.400×10⁶ Yes Yes 1.2 12.8179 3.2 100 San Joaquin 8750 500 3.375×10⁶ Yes Yes 1.2 17.0480 3.2 100 San Joaquin 17500 500 3.375×10⁶ Yes Yes 1.2 18.8581 3.2 353 San Joaquin 8750 500 3.375×10⁶ Yes Yes 1.2 16.4082 3.2 353 San Joaquin 17500 500 3.375×10⁶ Yes Yes 1.2 18.21
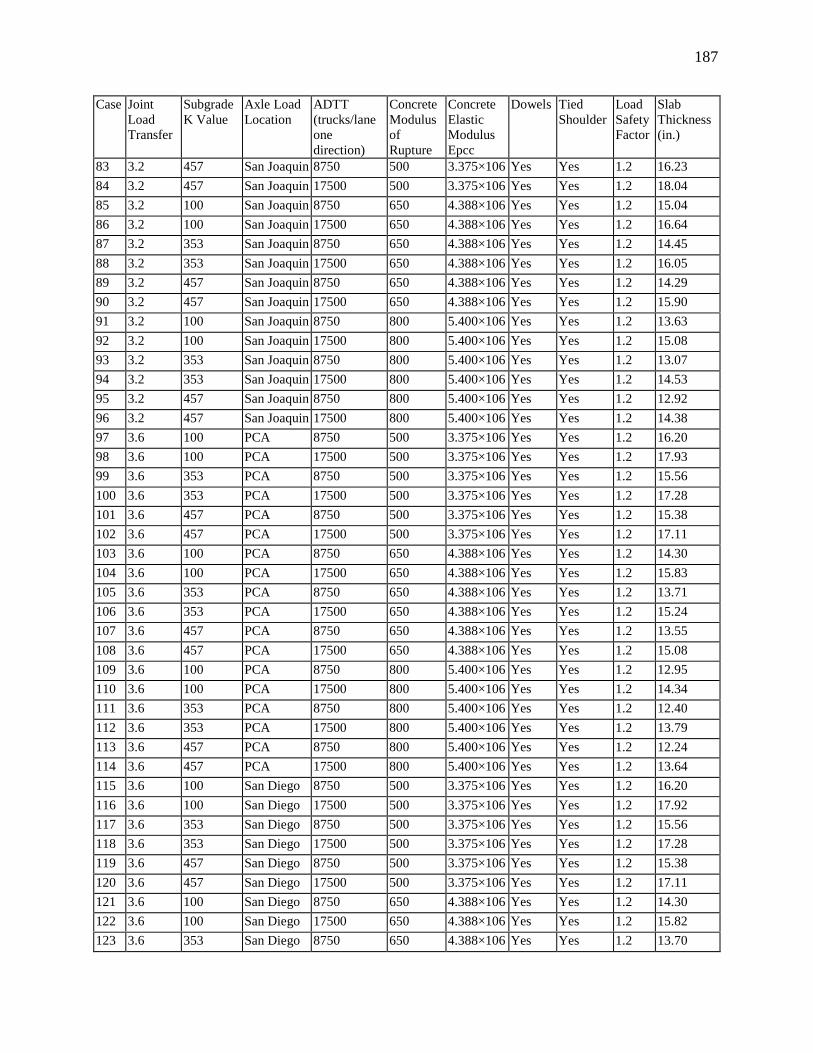
187
Case JointLoadTransfer
SubgradeK Value
Axle LoadLocation
ADTT(trucks/laneonedirection)
ConcreteModulusofRupture
ConcreteElasticModulusEpcc
Dowels TiedShoulder
LoadSafetyFactor
SlabThickness(in.)
83 3.2 457 San Joaquin 8750 500 3.375×10⁶ Yes Yes 1.2 16.2384 3.2 457 San Joaquin 17500 500 3.375×10⁶ Yes Yes 1.2 18.0485 3.2 100 San Joaquin 8750 650 4.388×10⁶ Yes Yes 1.2 15.0486 3.2 100 San Joaquin 17500 650 4.388×10⁶ Yes Yes 1.2 16.6487 3.2 353 San Joaquin 8750 650 4.388×10⁶ Yes Yes 1.2 14.4588 3.2 353 San Joaquin 17500 650 4.388×10⁶ Yes Yes 1.2 16.0589 3.2 457 San Joaquin 8750 650 4.388×10⁶ Yes Yes 1.2 14.2990 3.2 457 San Joaquin 17500 650 4.388×10⁶ Yes Yes 1.2 15.9091 3.2 100 San Joaquin 8750 800 5.400×10⁶ Yes Yes 1.2 13.6392 3.2 100 San Joaquin 17500 800 5.400×10⁶ Yes Yes 1.2 15.0893 3.2 353 San Joaquin 8750 800 5.400×10⁶ Yes Yes 1.2 13.0794 3.2 353 San Joaquin 17500 800 5.400×10⁶ Yes Yes 1.2 14.5395 3.2 457 San Joaquin 8750 800 5.400×10⁶ Yes Yes 1.2 12.9296 3.2 457 San Joaquin 17500 800 5.400×10⁶ Yes Yes 1.2 14.3897 3.6 100 PCA 8750 500 3.375×10⁶ Yes Yes 1.2 16.2098 3.6 100 PCA 17500 500 3.375×10⁶ Yes Yes 1.2 17.9399 3.6 353 PCA 8750 500 3.375×10⁶ Yes Yes 1.2 15.56100 3.6 353 PCA 17500 500 3.375×10⁶ Yes Yes 1.2 17.28101 3.6 457 PCA 8750 500 3.375×10⁶ Yes Yes 1.2 15.38102 3.6 457 PCA 17500 500 3.375×10⁶ Yes Yes 1.2 17.11103 3.6 100 PCA 8750 650 4.388×10⁶ Yes Yes 1.2 14.30104 3.6 100 PCA 17500 650 4.388×10⁶ Yes Yes 1.2 15.83105 3.6 353 PCA 8750 650 4.388×10⁶ Yes Yes 1.2 13.71106 3.6 353 PCA 17500 650 4.388×10⁶ Yes Yes 1.2 15.24107 3.6 457 PCA 8750 650 4.388×10⁶ Yes Yes 1.2 13.55108 3.6 457 PCA 17500 650 4.388×10⁶ Yes Yes 1.2 15.08109 3.6 100 PCA 8750 800 5.400×10⁶ Yes Yes 1.2 12.95110 3.6 100 PCA 17500 800 5.400×10⁶ Yes Yes 1.2 14.34111 3.6 353 PCA 8750 800 5.400×10⁶ Yes Yes 1.2 12.40112 3.6 353 PCA 17500 800 5.400×10⁶ Yes Yes 1.2 13.79113 3.6 457 PCA 8750 800 5.400×10⁶ Yes Yes 1.2 12.24114 3.6 457 PCA 17500 800 5.400×10⁶ Yes Yes 1.2 13.64115 3.6 100 San Diego 8750 500 3.375×10⁶ Yes Yes 1.2 16.20116 3.6 100 San Diego 17500 500 3.375×10⁶ Yes Yes 1.2 17.92117 3.6 353 San Diego 8750 500 3.375×10⁶ Yes Yes 1.2 15.56118 3.6 353 San Diego 17500 500 3.375×10⁶ Yes Yes 1.2 17.28119 3.6 457 San Diego 8750 500 3.375×10⁶ Yes Yes 1.2 15.38120 3.6 457 San Diego 17500 500 3.375×10⁶ Yes Yes 1.2 17.11121 3.6 100 San Diego 8750 650 4.388×10⁶ Yes Yes 1.2 14.30122 3.6 100 San Diego 17500 650 4.388×10⁶ Yes Yes 1.2 15.82123 3.6 353 San Diego 8750 650 4.388×10⁶ Yes Yes 1.2 13.70
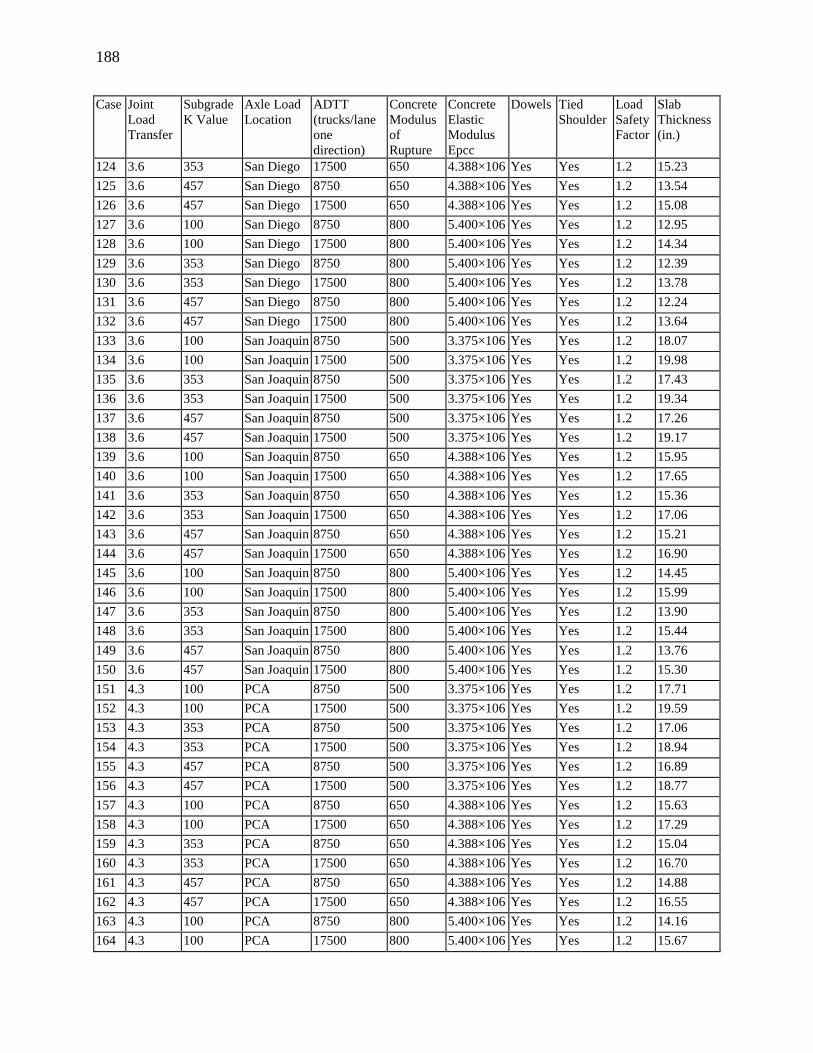
188
Case JointLoadTransfer
SubgradeK Value
Axle LoadLocation
ADTT(trucks/laneonedirection)
ConcreteModulusofRupture
ConcreteElasticModulusEpcc
Dowels TiedShoulder
LoadSafetyFactor
SlabThickness(in.)
124 3.6 353 San Diego 17500 650 4.388×10⁶ Yes Yes 1.2 15.23125 3.6 457 San Diego 8750 650 4.388×10⁶ Yes Yes 1.2 13.54126 3.6 457 San Diego 17500 650 4.388×10⁶ Yes Yes 1.2 15.08127 3.6 100 San Diego 8750 800 5.400×10⁶ Yes Yes 1.2 12.95128 3.6 100 San Diego 17500 800 5.400×10⁶ Yes Yes 1.2 14.34129 3.6 353 San Diego 8750 800 5.400×10⁶ Yes Yes 1.2 12.39130 3.6 353 San Diego 17500 800 5.400×10⁶ Yes Yes 1.2 13.78131 3.6 457 San Diego 8750 800 5.400×10⁶ Yes Yes 1.2 12.24132 3.6 457 San Diego 17500 800 5.400×10⁶ Yes Yes 1.2 13.64133 3.6 100 San Joaquin 8750 500 3.375×10⁶ Yes Yes 1.2 18.07134 3.6 100 San Joaquin 17500 500 3.375×10⁶ Yes Yes 1.2 19.98135 3.6 353 San Joaquin 8750 500 3.375×10⁶ Yes Yes 1.2 17.43136 3.6 353 San Joaquin 17500 500 3.375×10⁶ Yes Yes 1.2 19.34137 3.6 457 San Joaquin 8750 500 3.375×10⁶ Yes Yes 1.2 17.26138 3.6 457 San Joaquin 17500 500 3.375×10⁶ Yes Yes 1.2 19.17139 3.6 100 San Joaquin 8750 650 4.388×10⁶ Yes Yes 1.2 15.95140 3.6 100 San Joaquin 17500 650 4.388×10⁶ Yes Yes 1.2 17.65141 3.6 353 San Joaquin 8750 650 4.388×10⁶ Yes Yes 1.2 15.36142 3.6 353 San Joaquin 17500 650 4.388×10⁶ Yes Yes 1.2 17.06143 3.6 457 San Joaquin 8750 650 4.388×10⁶ Yes Yes 1.2 15.21144 3.6 457 San Joaquin 17500 650 4.388×10⁶ Yes Yes 1.2 16.90145 3.6 100 San Joaquin 8750 800 5.400×10⁶ Yes Yes 1.2 14.45146 3.6 100 San Joaquin 17500 800 5.400×10⁶ Yes Yes 1.2 15.99147 3.6 353 San Joaquin 8750 800 5.400×10⁶ Yes Yes 1.2 13.90148 3.6 353 San Joaquin 17500 800 5.400×10⁶ Yes Yes 1.2 15.44149 3.6 457 San Joaquin 8750 800 5.400×10⁶ Yes Yes 1.2 13.76150 3.6 457 San Joaquin 17500 800 5.400×10⁶ Yes Yes 1.2 15.30151 4.3 100 PCA 8750 500 3.375×10⁶ Yes Yes 1.2 17.71152 4.3 100 PCA 17500 500 3.375×10⁶ Yes Yes 1.2 19.59153 4.3 353 PCA 8750 500 3.375×10⁶ Yes Yes 1.2 17.06154 4.3 353 PCA 17500 500 3.375×10⁶ Yes Yes 1.2 18.94155 4.3 457 PCA 8750 500 3.375×10⁶ Yes Yes 1.2 16.89156 4.3 457 PCA 17500 500 3.375×10⁶ Yes Yes 1.2 18.77157 4.3 100 PCA 8750 650 4.388×10⁶ Yes Yes 1.2 15.63158 4.3 100 PCA 17500 650 4.388×10⁶ Yes Yes 1.2 17.29159 4.3 353 PCA 8750 650 4.388×10⁶ Yes Yes 1.2 15.04160 4.3 353 PCA 17500 650 4.388×10⁶ Yes Yes 1.2 16.70161 4.3 457 PCA 8750 650 4.388×10⁶ Yes Yes 1.2 14.88162 4.3 457 PCA 17500 650 4.388×10⁶ Yes Yes 1.2 16.55163 4.3 100 PCA 8750 800 5.400×10⁶ Yes Yes 1.2 14.16164 4.3 100 PCA 17500 800 5.400×10⁶ Yes Yes 1.2 15.67
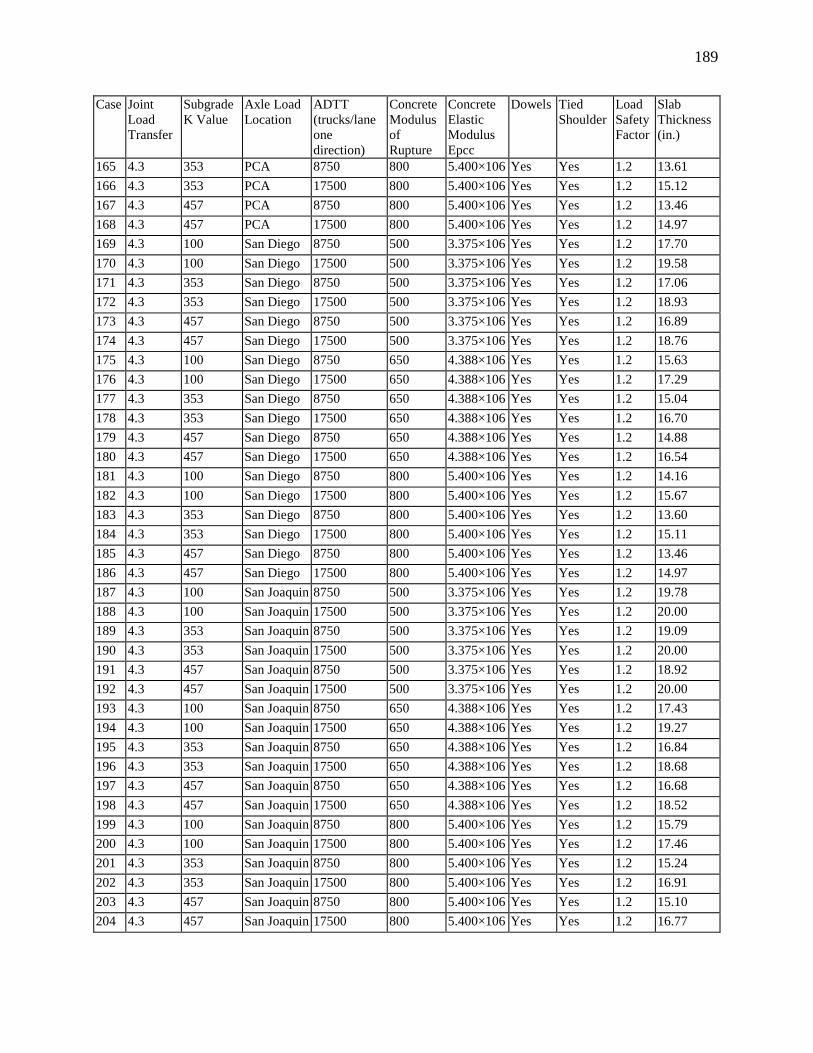
189
Case JointLoadTransfer
SubgradeK Value
Axle LoadLocation
ADTT(trucks/laneonedirection)
ConcreteModulusofRupture
ConcreteElasticModulusEpcc
Dowels TiedShoulder
LoadSafetyFactor
SlabThickness(in.)
165 4.3 353 PCA 8750 800 5.400×10⁶ Yes Yes 1.2 13.61166 4.3 353 PCA 17500 800 5.400×10⁶ Yes Yes 1.2 15.12167 4.3 457 PCA 8750 800 5.400×10⁶ Yes Yes 1.2 13.46168 4.3 457 PCA 17500 800 5.400×10⁶ Yes Yes 1.2 14.97169 4.3 100 San Diego 8750 500 3.375×10⁶ Yes Yes 1.2 17.70170 4.3 100 San Diego 17500 500 3.375×10⁶ Yes Yes 1.2 19.58171 4.3 353 San Diego 8750 500 3.375×10⁶ Yes Yes 1.2 17.06172 4.3 353 San Diego 17500 500 3.375×10⁶ Yes Yes 1.2 18.93173 4.3 457 San Diego 8750 500 3.375×10⁶ Yes Yes 1.2 16.89174 4.3 457 San Diego 17500 500 3.375×10⁶ Yes Yes 1.2 18.76175 4.3 100 San Diego 8750 650 4.388×10⁶ Yes Yes 1.2 15.63176 4.3 100 San Diego 17500 650 4.388×10⁶ Yes Yes 1.2 17.29177 4.3 353 San Diego 8750 650 4.388×10⁶ Yes Yes 1.2 15.04178 4.3 353 San Diego 17500 650 4.388×10⁶ Yes Yes 1.2 16.70179 4.3 457 San Diego 8750 650 4.388×10⁶ Yes Yes 1.2 14.88180 4.3 457 San Diego 17500 650 4.388×10⁶ Yes Yes 1.2 16.54181 4.3 100 San Diego 8750 800 5.400×10⁶ Yes Yes 1.2 14.16182 4.3 100 San Diego 17500 800 5.400×10⁶ Yes Yes 1.2 15.67183 4.3 353 San Diego 8750 800 5.400×10⁶ Yes Yes 1.2 13.60184 4.3 353 San Diego 17500 800 5.400×10⁶ Yes Yes 1.2 15.11185 4.3 457 San Diego 8750 800 5.400×10⁶ Yes Yes 1.2 13.46186 4.3 457 San Diego 17500 800 5.400×10⁶ Yes Yes 1.2 14.97187 4.3 100 San Joaquin 8750 500 3.375×10⁶ Yes Yes 1.2 19.78188 4.3 100 San Joaquin 17500 500 3.375×10⁶ Yes Yes 1.2 20.00189 4.3 353 San Joaquin 8750 500 3.375×10⁶ Yes Yes 1.2 19.09190 4.3 353 San Joaquin 17500 500 3.375×10⁶ Yes Yes 1.2 20.00191 4.3 457 San Joaquin 8750 500 3.375×10⁶ Yes Yes 1.2 18.92192 4.3 457 San Joaquin 17500 500 3.375×10⁶ Yes Yes 1.2 20.00193 4.3 100 San Joaquin 8750 650 4.388×10⁶ Yes Yes 1.2 17.43194 4.3 100 San Joaquin 17500 650 4.388×10⁶ Yes Yes 1.2 19.27195 4.3 353 San Joaquin 8750 650 4.388×10⁶ Yes Yes 1.2 16.84196 4.3 353 San Joaquin 17500 650 4.388×10⁶ Yes Yes 1.2 18.68197 4.3 457 San Joaquin 8750 650 4.388×10⁶ Yes Yes 1.2 16.68198 4.3 457 San Joaquin 17500 650 4.388×10⁶ Yes Yes 1.2 18.52199 4.3 100 San Joaquin 8750 800 5.400×10⁶ Yes Yes 1.2 15.79200 4.3 100 San Joaquin 17500 800 5.400×10⁶ Yes Yes 1.2 17.46201 4.3 353 San Joaquin 8750 800 5.400×10⁶ Yes Yes 1.2 15.24202 4.3 353 San Joaquin 17500 800 5.400×10⁶ Yes Yes 1.2 16.91203 4.3 457 San Joaquin 8750 800 5.400×10⁶ Yes Yes 1.2 15.10204 4.3 457 San Joaquin 17500 800 5.400×10⁶ Yes Yes 1.2 16.77

190

191
APPENDIX D: ILLINOIS DEPARTMENT OF TRANSPORTATION, ILLICONRESULTS
In the “Shoulder” column of the tables in this appendix, the following abbreviations apply:
AC asphalt concrete shoulderHigh LTE High Load Transfer EfficiencyLow LTE Low Load Transfer Efficiency.3m widened lane, .3m additional width.6m widened lane, .6m additional width
ILLICON Results - Main ExperimentClimatic region Slab Length
(ft.)Shoulder Traffic k-value Concrete Modulus of
Rupture (psi)Thickness(in.)
Los Angeles 15 AC PCA 100 500 12Los Angeles 15 AC PCA 100 650 10.5Los Angeles 15 AC PCA 100 800 9Los Angeles 15 AC PCA 250 500 13Los Angeles 15 AC PCA 250 650 11Los Angeles 15 AC PCA 250 800 9.5Los Angeles 15 AC PCA 500 500 13.5Los Angeles 15 AC PCA 500 650 11Los Angeles 15 AC PCA 500 800 9Los Angeles 15 AC San Diego 100 500 11.5Los Angeles 15 AC San Diego 100 650 10Los Angeles 15 AC San Diego 100 800 9Los Angeles 15 AC San Diego 250 500 12.5Los Angeles 15 AC San Diego 250 650 10.5Los Angeles 15 AC San Diego 250 800 9Los Angeles 15 AC San Diego 500 500 13Los Angeles 15 AC San Diego 500 650 10.5Los Angeles 15 AC San Diego 500 800 8.5Los Angeles 15 AC San Joaquin 100 500 11.5Los Angeles 15 AC San Joaquin 100 650 10Los Angeles 15 AC San Joaquin 100 800 9Los Angeles 15 AC San Joaquin 250 500 12.5Los Angeles 15 AC San Joaquin 250 650 10.5Los Angeles 15 AC San Joaquin 250 800 9Los Angeles 15 AC San Joaquin 500 500 13Los Angeles 15 AC San Joaquin 500 650 11Los Angeles 15 AC San Joaquin 500 800 9Los Angeles 15 Low LTE PCA 100 500 12Los Angeles 15 Low LTE PCA 100 650 10.5Los Angeles 15 Low LTE PCA 100 800 9Los Angeles 15 Low LTE PCA 250 500 12.5Los Angeles 15 Low LTE PCA 250 650 10.5Los Angeles 15 Low LTE PCA 250 800 9.5Los Angeles 15 Low LTE PCA 500 500 13
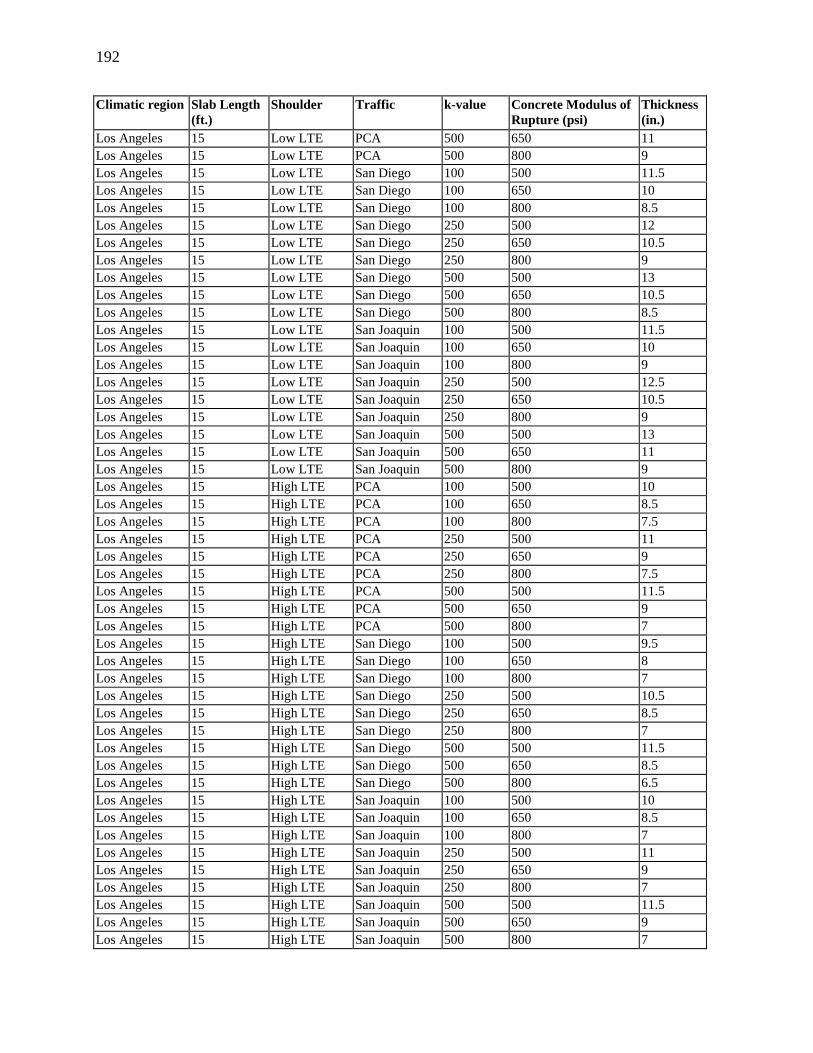
192
Climatic region Slab Length(ft.)
Shoulder Traffic k-value Concrete Modulus ofRupture (psi)
Thickness(in.)
Los Angeles 15 Low LTE PCA 500 650 11Los Angeles 15 Low LTE PCA 500 800 9Los Angeles 15 Low LTE San Diego 100 500 11.5Los Angeles 15 Low LTE San Diego 100 650 10Los Angeles 15 Low LTE San Diego 100 800 8.5Los Angeles 15 Low LTE San Diego 250 500 12Los Angeles 15 Low LTE San Diego 250 650 10.5Los Angeles 15 Low LTE San Diego 250 800 9Los Angeles 15 Low LTE San Diego 500 500 13Los Angeles 15 Low LTE San Diego 500 650 10.5Los Angeles 15 Low LTE San Diego 500 800 8.5Los Angeles 15 Low LTE San Joaquin 100 500 11.5Los Angeles 15 Low LTE San Joaquin 100 650 10Los Angeles 15 Low LTE San Joaquin 100 800 9Los Angeles 15 Low LTE San Joaquin 250 500 12.5Los Angeles 15 Low LTE San Joaquin 250 650 10.5Los Angeles 15 Low LTE San Joaquin 250 800 9Los Angeles 15 Low LTE San Joaquin 500 500 13Los Angeles 15 Low LTE San Joaquin 500 650 11Los Angeles 15 Low LTE San Joaquin 500 800 9Los Angeles 15 High LTE PCA 100 500 10Los Angeles 15 High LTE PCA 100 650 8.5Los Angeles 15 High LTE PCA 100 800 7.5Los Angeles 15 High LTE PCA 250 500 11Los Angeles 15 High LTE PCA 250 650 9Los Angeles 15 High LTE PCA 250 800 7.5Los Angeles 15 High LTE PCA 500 500 11.5Los Angeles 15 High LTE PCA 500 650 9Los Angeles 15 High LTE PCA 500 800 7Los Angeles 15 High LTE San Diego 100 500 9.5Los Angeles 15 High LTE San Diego 100 650 8Los Angeles 15 High LTE San Diego 100 800 7Los Angeles 15 High LTE San Diego 250 500 10.5Los Angeles 15 High LTE San Diego 250 650 8.5Los Angeles 15 High LTE San Diego 250 800 7Los Angeles 15 High LTE San Diego 500 500 11.5Los Angeles 15 High LTE San Diego 500 650 8.5Los Angeles 15 High LTE San Diego 500 800 6.5Los Angeles 15 High LTE San Joaquin 100 500 10Los Angeles 15 High LTE San Joaquin 100 650 8.5Los Angeles 15 High LTE San Joaquin 100 800 7Los Angeles 15 High LTE San Joaquin 250 500 11Los Angeles 15 High LTE San Joaquin 250 650 9Los Angeles 15 High LTE San Joaquin 250 800 7Los Angeles 15 High LTE San Joaquin 500 500 11.5Los Angeles 15 High LTE San Joaquin 500 650 9Los Angeles 15 High LTE San Joaquin 500 800 7
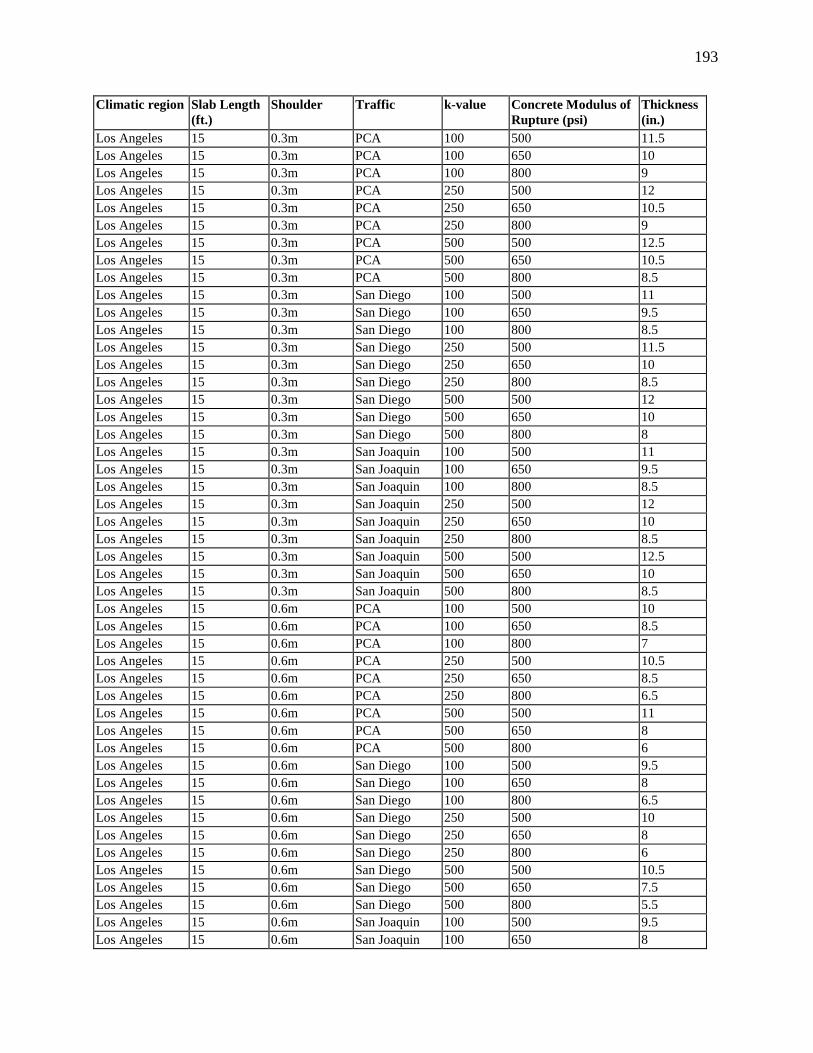
193
Climatic region Slab Length(ft.)
Shoulder Traffic k-value Concrete Modulus ofRupture (psi)
Thickness(in.)
Los Angeles 15 0.3m PCA 100 500 11.5Los Angeles 15 0.3m PCA 100 650 10Los Angeles 15 0.3m PCA 100 800 9Los Angeles 15 0.3m PCA 250 500 12Los Angeles 15 0.3m PCA 250 650 10.5Los Angeles 15 0.3m PCA 250 800 9Los Angeles 15 0.3m PCA 500 500 12.5Los Angeles 15 0.3m PCA 500 650 10.5Los Angeles 15 0.3m PCA 500 800 8.5Los Angeles 15 0.3m San Diego 100 500 11Los Angeles 15 0.3m San Diego 100 650 9.5Los Angeles 15 0.3m San Diego 100 800 8.5Los Angeles 15 0.3m San Diego 250 500 11.5Los Angeles 15 0.3m San Diego 250 650 10Los Angeles 15 0.3m San Diego 250 800 8.5Los Angeles 15 0.3m San Diego 500 500 12Los Angeles 15 0.3m San Diego 500 650 10Los Angeles 15 0.3m San Diego 500 800 8Los Angeles 15 0.3m San Joaquin 100 500 11Los Angeles 15 0.3m San Joaquin 100 650 9.5Los Angeles 15 0.3m San Joaquin 100 800 8.5Los Angeles 15 0.3m San Joaquin 250 500 12Los Angeles 15 0.3m San Joaquin 250 650 10Los Angeles 15 0.3m San Joaquin 250 800 8.5Los Angeles 15 0.3m San Joaquin 500 500 12.5Los Angeles 15 0.3m San Joaquin 500 650 10Los Angeles 15 0.3m San Joaquin 500 800 8.5Los Angeles 15 0.6m PCA 100 500 10Los Angeles 15 0.6m PCA 100 650 8.5Los Angeles 15 0.6m PCA 100 800 7Los Angeles 15 0.6m PCA 250 500 10.5Los Angeles 15 0.6m PCA 250 650 8.5Los Angeles 15 0.6m PCA 250 800 6.5Los Angeles 15 0.6m PCA 500 500 11Los Angeles 15 0.6m PCA 500 650 8Los Angeles 15 0.6m PCA 500 800 6Los Angeles 15 0.6m San Diego 100 500 9.5Los Angeles 15 0.6m San Diego 100 650 8Los Angeles 15 0.6m San Diego 100 800 6.5Los Angeles 15 0.6m San Diego 250 500 10Los Angeles 15 0.6m San Diego 250 650 8Los Angeles 15 0.6m San Diego 250 800 6Los Angeles 15 0.6m San Diego 500 500 10.5Los Angeles 15 0.6m San Diego 500 650 7.5Los Angeles 15 0.6m San Diego 500 800 5.5Los Angeles 15 0.6m San Joaquin 100 500 9.5Los Angeles 15 0.6m San Joaquin 100 650 8
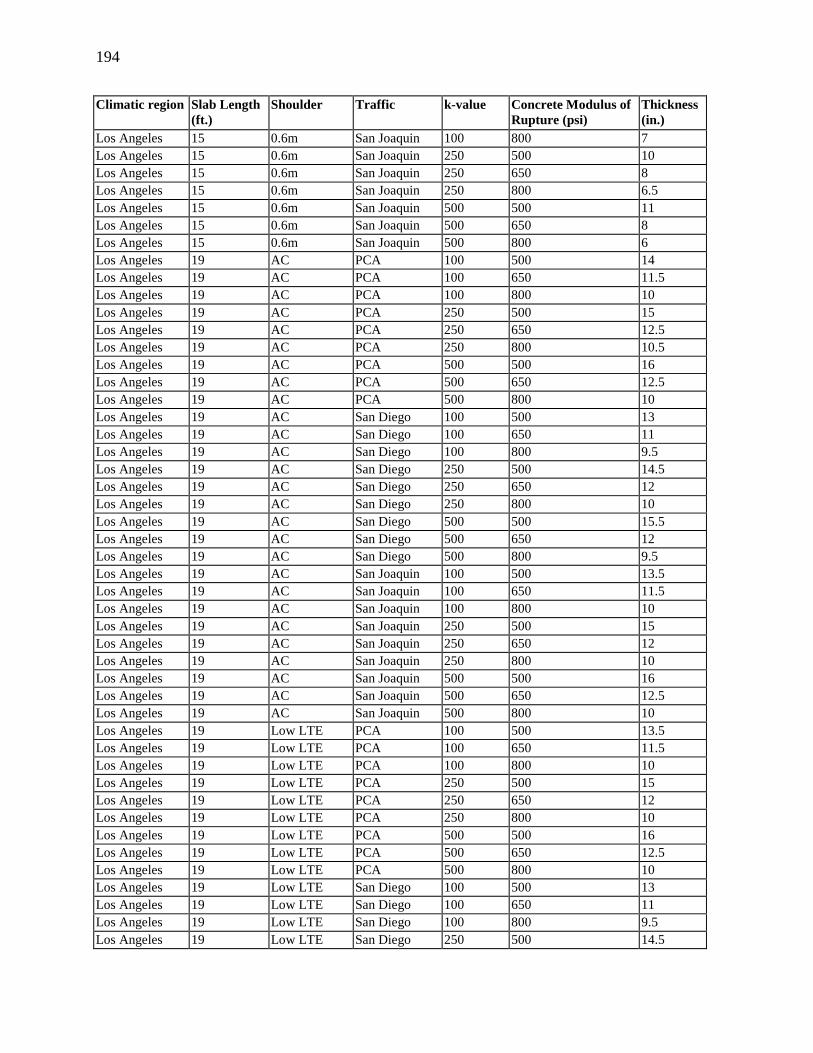
194
Climatic region Slab Length(ft.)
Shoulder Traffic k-value Concrete Modulus ofRupture (psi)
Thickness(in.)
Los Angeles 15 0.6m San Joaquin 100 800 7Los Angeles 15 0.6m San Joaquin 250 500 10Los Angeles 15 0.6m San Joaquin 250 650 8Los Angeles 15 0.6m San Joaquin 250 800 6.5Los Angeles 15 0.6m San Joaquin 500 500 11Los Angeles 15 0.6m San Joaquin 500 650 8Los Angeles 15 0.6m San Joaquin 500 800 6Los Angeles 19 AC PCA 100 500 14Los Angeles 19 AC PCA 100 650 11.5Los Angeles 19 AC PCA 100 800 10Los Angeles 19 AC PCA 250 500 15Los Angeles 19 AC PCA 250 650 12.5Los Angeles 19 AC PCA 250 800 10.5Los Angeles 19 AC PCA 500 500 16Los Angeles 19 AC PCA 500 650 12.5Los Angeles 19 AC PCA 500 800 10Los Angeles 19 AC San Diego 100 500 13Los Angeles 19 AC San Diego 100 650 11Los Angeles 19 AC San Diego 100 800 9.5Los Angeles 19 AC San Diego 250 500 14.5Los Angeles 19 AC San Diego 250 650 12Los Angeles 19 AC San Diego 250 800 10Los Angeles 19 AC San Diego 500 500 15.5Los Angeles 19 AC San Diego 500 650 12Los Angeles 19 AC San Diego 500 800 9.5Los Angeles 19 AC San Joaquin 100 500 13.5Los Angeles 19 AC San Joaquin 100 650 11.5Los Angeles 19 AC San Joaquin 100 800 10Los Angeles 19 AC San Joaquin 250 500 15Los Angeles 19 AC San Joaquin 250 650 12Los Angeles 19 AC San Joaquin 250 800 10Los Angeles 19 AC San Joaquin 500 500 16Los Angeles 19 AC San Joaquin 500 650 12.5Los Angeles 19 AC San Joaquin 500 800 10Los Angeles 19 Low LTE PCA 100 500 13.5Los Angeles 19 Low LTE PCA 100 650 11.5Los Angeles 19 Low LTE PCA 100 800 10Los Angeles 19 Low LTE PCA 250 500 15Los Angeles 19 Low LTE PCA 250 650 12Los Angeles 19 Low LTE PCA 250 800 10Los Angeles 19 Low LTE PCA 500 500 16Los Angeles 19 Low LTE PCA 500 650 12.5Los Angeles 19 Low LTE PCA 500 800 10Los Angeles 19 Low LTE San Diego 100 500 13Los Angeles 19 Low LTE San Diego 100 650 11Los Angeles 19 Low LTE San Diego 100 800 9.5Los Angeles 19 Low LTE San Diego 250 500 14.5
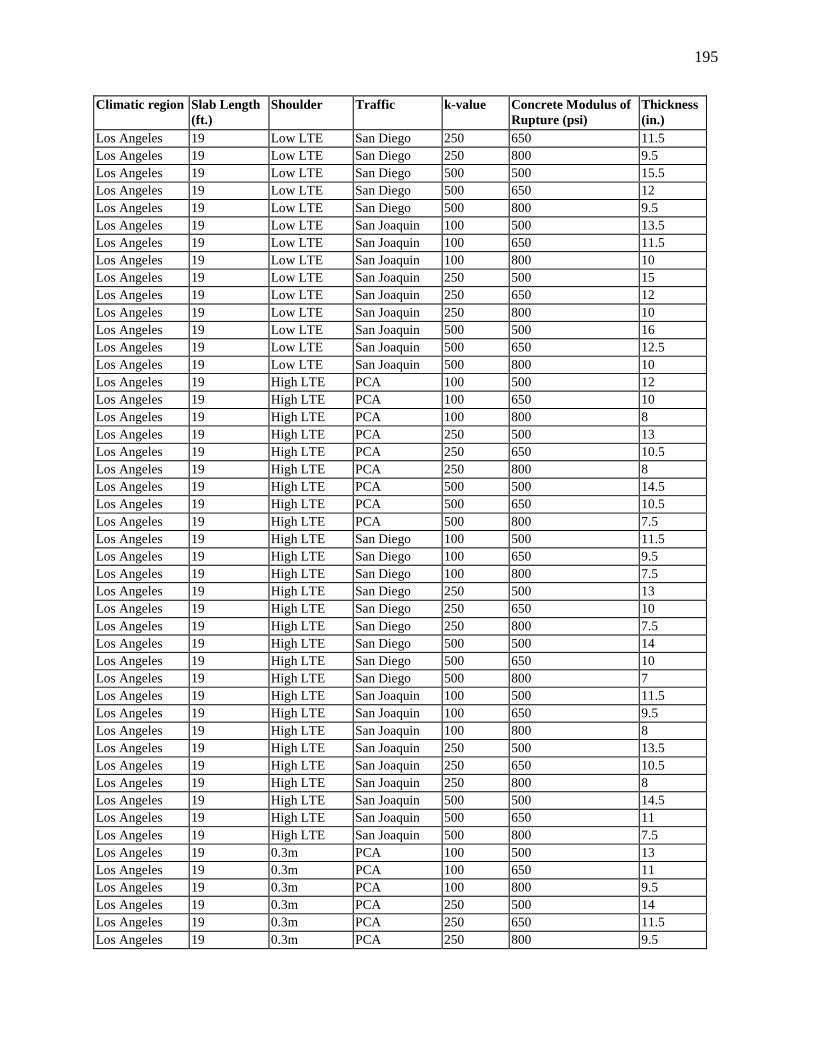
195
Climatic region Slab Length(ft.)
Shoulder Traffic k-value Concrete Modulus ofRupture (psi)
Thickness(in.)
Los Angeles 19 Low LTE San Diego 250 650 11.5Los Angeles 19 Low LTE San Diego 250 800 9.5Los Angeles 19 Low LTE San Diego 500 500 15.5Los Angeles 19 Low LTE San Diego 500 650 12Los Angeles 19 Low LTE San Diego 500 800 9.5Los Angeles 19 Low LTE San Joaquin 100 500 13.5Los Angeles 19 Low LTE San Joaquin 100 650 11.5Los Angeles 19 Low LTE San Joaquin 100 800 10Los Angeles 19 Low LTE San Joaquin 250 500 15Los Angeles 19 Low LTE San Joaquin 250 650 12Los Angeles 19 Low LTE San Joaquin 250 800 10Los Angeles 19 Low LTE San Joaquin 500 500 16Los Angeles 19 Low LTE San Joaquin 500 650 12.5Los Angeles 19 Low LTE San Joaquin 500 800 10Los Angeles 19 High LTE PCA 100 500 12Los Angeles 19 High LTE PCA 100 650 10Los Angeles 19 High LTE PCA 100 800 8Los Angeles 19 High LTE PCA 250 500 13Los Angeles 19 High LTE PCA 250 650 10.5Los Angeles 19 High LTE PCA 250 800 8Los Angeles 19 High LTE PCA 500 500 14.5Los Angeles 19 High LTE PCA 500 650 10.5Los Angeles 19 High LTE PCA 500 800 7.5Los Angeles 19 High LTE San Diego 100 500 11.5Los Angeles 19 High LTE San Diego 100 650 9.5Los Angeles 19 High LTE San Diego 100 800 7.5Los Angeles 19 High LTE San Diego 250 500 13Los Angeles 19 High LTE San Diego 250 650 10Los Angeles 19 High LTE San Diego 250 800 7.5Los Angeles 19 High LTE San Diego 500 500 14Los Angeles 19 High LTE San Diego 500 650 10Los Angeles 19 High LTE San Diego 500 800 7Los Angeles 19 High LTE San Joaquin 100 500 11.5Los Angeles 19 High LTE San Joaquin 100 650 9.5Los Angeles 19 High LTE San Joaquin 100 800 8Los Angeles 19 High LTE San Joaquin 250 500 13.5Los Angeles 19 High LTE San Joaquin 250 650 10.5Los Angeles 19 High LTE San Joaquin 250 800 8Los Angeles 19 High LTE San Joaquin 500 500 14.5Los Angeles 19 High LTE San Joaquin 500 650 11Los Angeles 19 High LTE San Joaquin 500 800 7.5Los Angeles 19 0.3m PCA 100 500 13Los Angeles 19 0.3m PCA 100 650 11Los Angeles 19 0.3m PCA 100 800 9.5Los Angeles 19 0.3m PCA 250 500 14Los Angeles 19 0.3m PCA 250 650 11.5Los Angeles 19 0.3m PCA 250 800 9.5

196
Climatic region Slab Length(ft.)
Shoulder Traffic k-value Concrete Modulus ofRupture (psi)
Thickness(in.)
Los Angeles 19 0.3m PCA 500 500 15Los Angeles 19 0.3m PCA 500 650 11.5Los Angeles 19 0.3m PCA 500 800 9Los Angeles 19 0.3m San Diego 100 500 12.5Los Angeles 19 0.3m San Diego 100 650 10.5Los Angeles 19 0.3m San Diego 100 800 9Los Angeles 19 0.3m San Diego 250 500 13.5Los Angeles 19 0.3m San Diego 250 650 11Los Angeles 19 0.3m San Diego 250 800 9Los Angeles 19 0.3m San Diego 500 500 14.5Los Angeles 19 0.3m San Diego 500 650 11Los Angeles 19 0.3m San Diego 500 800 8.5Los Angeles 19 0.3m San Joaquin 100 500 13Los Angeles 19 0.3m San Joaquin 100 650 11Los Angeles 19 0.3m San Joaquin 100 800 9.5Los Angeles 19 0.3m San Joaquin 250 500 14Los Angeles 19 0.3m San Joaquin 250 650 11.5Los Angeles 19 0.3m San Joaquin 250 800 9.5Los Angeles 19 0.3m San Joaquin 500 500 15Los Angeles 19 0.3m San Joaquin 500 650 11.5Los Angeles 19 0.3m San Joaquin 500 800 9Los Angeles 19 0.6m PCA 100 500 11.5Los Angeles 19 0.6m PCA 100 650 9.5Los Angeles 19 0.6m PCA 100 800 7.5Los Angeles 19 0.6m PCA 250 500 12.5Los Angeles 19 0.6m PCA 250 650 9.5Los Angeles 19 0.6m PCA 250 800 7Los Angeles 19 0.6m PCA 500 500 13.5Los Angeles 19 0.6m PCA 500 650 9Los Angeles 19 0.6m PCA 500 800 6Los Angeles 19 0.6m San Diego 100 500 11Los Angeles 19 0.6m San Diego 100 650 9Los Angeles 19 0.6m San Diego 100 800 7.5Los Angeles 19 0.6m San Diego 250 500 12.5Los Angeles 19 0.6m San Diego 250 650 9Los Angeles 19 0.6m San Diego 250 800 6.5Los Angeles 19 0.6m San Diego 500 500 13.5Los Angeles 19 0.6m San Diego 500 650 8.5Los Angeles 19 0.6m San Diego 500 800 5.5Los Angeles 19 0.6m San Joaquin 100 500 11.5Los Angeles 19 0.6m San Joaquin 100 650 9Los Angeles 19 0.6m San Joaquin 100 800 7.5Los Angeles 19 0.6m San Joaquin 250 500 12.5Los Angeles 19 0.6m San Joaquin 250 650 9.5Los Angeles 19 0.6m San Joaquin 250 800 7Los Angeles 19 0.6m San Joaquin 500 500 14Los Angeles 19 0.6m San Joaquin 500 650 9
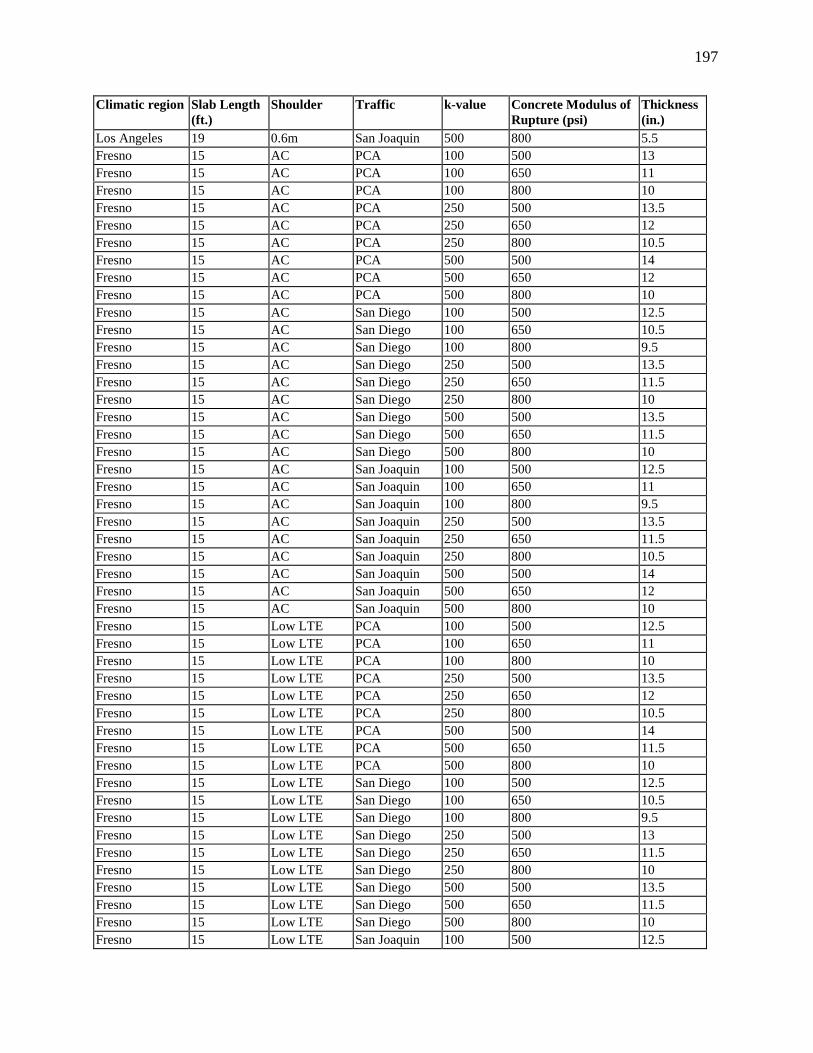
197
Climatic region Slab Length(ft.)
Shoulder Traffic k-value Concrete Modulus ofRupture (psi)
Thickness(in.)
Los Angeles 19 0.6m San Joaquin 500 800 5.5Fresno 15 AC PCA 100 500 13Fresno 15 AC PCA 100 650 11Fresno 15 AC PCA 100 800 10Fresno 15 AC PCA 250 500 13.5Fresno 15 AC PCA 250 650 12Fresno 15 AC PCA 250 800 10.5Fresno 15 AC PCA 500 500 14Fresno 15 AC PCA 500 650 12Fresno 15 AC PCA 500 800 10Fresno 15 AC San Diego 100 500 12.5Fresno 15 AC San Diego 100 650 10.5Fresno 15 AC San Diego 100 800 9.5Fresno 15 AC San Diego 250 500 13.5Fresno 15 AC San Diego 250 650 11.5Fresno 15 AC San Diego 250 800 10Fresno 15 AC San Diego 500 500 13.5Fresno 15 AC San Diego 500 650 11.5Fresno 15 AC San Diego 500 800 10Fresno 15 AC San Joaquin 100 500 12.5Fresno 15 AC San Joaquin 100 650 11Fresno 15 AC San Joaquin 100 800 9.5Fresno 15 AC San Joaquin 250 500 13.5Fresno 15 AC San Joaquin 250 650 11.5Fresno 15 AC San Joaquin 250 800 10.5Fresno 15 AC San Joaquin 500 500 14Fresno 15 AC San Joaquin 500 650 12Fresno 15 AC San Joaquin 500 800 10Fresno 15 Low LTE PCA 100 500 12.5Fresno 15 Low LTE PCA 100 650 11Fresno 15 Low LTE PCA 100 800 10Fresno 15 Low LTE PCA 250 500 13.5Fresno 15 Low LTE PCA 250 650 12Fresno 15 Low LTE PCA 250 800 10.5Fresno 15 Low LTE PCA 500 500 14Fresno 15 Low LTE PCA 500 650 11.5Fresno 15 Low LTE PCA 500 800 10Fresno 15 Low LTE San Diego 100 500 12.5Fresno 15 Low LTE San Diego 100 650 10.5Fresno 15 Low LTE San Diego 100 800 9.5Fresno 15 Low LTE San Diego 250 500 13Fresno 15 Low LTE San Diego 250 650 11.5Fresno 15 Low LTE San Diego 250 800 10Fresno 15 Low LTE San Diego 500 500 13.5Fresno 15 Low LTE San Diego 500 650 11.5Fresno 15 Low LTE San Diego 500 800 10Fresno 15 Low LTE San Joaquin 100 500 12.5

198
Climatic region Slab Length(ft.)
Shoulder Traffic k-value Concrete Modulus ofRupture (psi)
Thickness(in.)
Fresno 15 Low LTE San Joaquin 100 650 11Fresno 15 Low LTE San Joaquin 100 800 9.5Fresno 15 Low LTE San Joaquin 250 500 13.5Fresno 15 Low LTE San Joaquin 250 650 11.5Fresno 15 Low LTE San Joaquin 250 800 10Fresno 15 Low LTE San Joaquin 500 500 14Fresno 15 Low LTE San Joaquin 500 650 12Fresno 15 Low LTE San Joaquin 500 800 10Fresno 15 High LTE PCA 100 500 11Fresno 15 High LTE PCA 100 650 9.5Fresno 15 High LTE PCA 100 800 8.5Fresno 15 High LTE PCA 250 500 12.5Fresno 15 High LTE PCA 250 650 10.5Fresno 15 High LTE PCA 250 800 9.5Fresno 15 High LTE PCA 500 500 12.5Fresno 15 High LTE PCA 500 650 10.5Fresno 15 High LTE PCA 500 800 9Fresno 15 High LTE San Diego 100 500 11Fresno 15 High LTE San Diego 100 650 9.5Fresno 15 High LTE San Diego 100 800 8Fresno 15 High LTE San Diego 250 500 12Fresno 15 High LTE San Diego 250 650 10Fresno 15 High LTE San Diego 250 800 8.5Fresno 15 High LTE San Diego 500 500 12.5Fresno 15 High LTE San Diego 500 650 10.5Fresno 15 High LTE San Diego 500 800 8.5Fresno 15 High LTE San Joaquin 100 500 11Fresno 15 High LTE San Joaquin 100 650 9.5Fresno 15 High LTE San Joaquin 100 800 8.5Fresno 15 High LTE San Joaquin 250 500 12.5Fresno 15 High LTE San Joaquin 250 650 10.5Fresno 15 High LTE San Joaquin 250 800 9Fresno 15 High LTE San Joaquin 500 500 12.5Fresno 15 High LTE San Joaquin 500 650 10.5Fresno 15 High LTE San Joaquin 500 800 9Fresno 15 0.3m PCA 100 500 12.5Fresno 15 0.3m PCA 100 650 10.5Fresno 15 0.3m PCA 100 800 9.5Fresno 15 0.3m PCA 250 500 13Fresno 15 0.3m PCA 250 650 11.5Fresno 15 0.3m PCA 250 800 10Fresno 15 0.3m PCA 500 500 13.5Fresno 15 0.3m PCA 500 650 11.5Fresno 15 0.3m PCA 500 800 9.5Fresno 15 0.3m San Diego 100 500 12Fresno 15 0.3m San Diego 100 650 10.5Fresno 15 0.3m San Diego 100 800 9
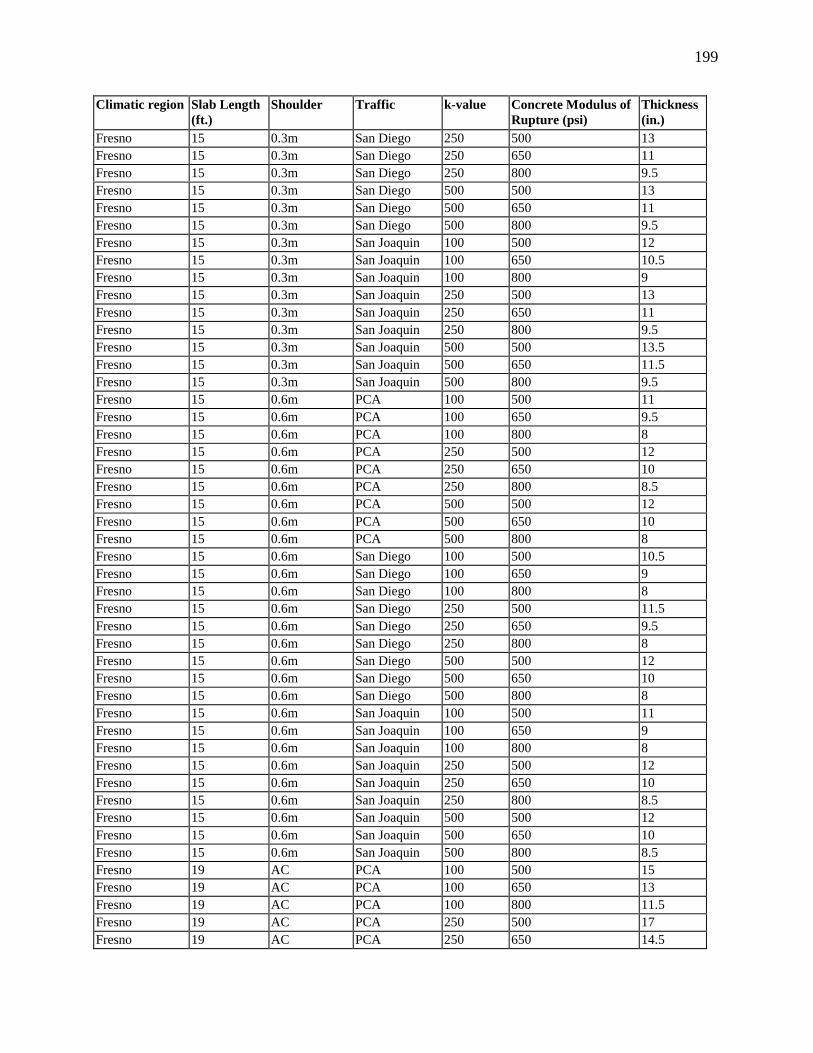
199
Climatic region Slab Length(ft.)
Shoulder Traffic k-value Concrete Modulus ofRupture (psi)
Thickness(in.)
Fresno 15 0.3m San Diego 250 500 13Fresno 15 0.3m San Diego 250 650 11Fresno 15 0.3m San Diego 250 800 9.5Fresno 15 0.3m San Diego 500 500 13Fresno 15 0.3m San Diego 500 650 11Fresno 15 0.3m San Diego 500 800 9.5Fresno 15 0.3m San Joaquin 100 500 12Fresno 15 0.3m San Joaquin 100 650 10.5Fresno 15 0.3m San Joaquin 100 800 9Fresno 15 0.3m San Joaquin 250 500 13Fresno 15 0.3m San Joaquin 250 650 11Fresno 15 0.3m San Joaquin 250 800 9.5Fresno 15 0.3m San Joaquin 500 500 13.5Fresno 15 0.3m San Joaquin 500 650 11.5Fresno 15 0.3m San Joaquin 500 800 9.5Fresno 15 0.6m PCA 100 500 11Fresno 15 0.6m PCA 100 650 9.5Fresno 15 0.6m PCA 100 800 8Fresno 15 0.6m PCA 250 500 12Fresno 15 0.6m PCA 250 650 10Fresno 15 0.6m PCA 250 800 8.5Fresno 15 0.6m PCA 500 500 12Fresno 15 0.6m PCA 500 650 10Fresno 15 0.6m PCA 500 800 8Fresno 15 0.6m San Diego 100 500 10.5Fresno 15 0.6m San Diego 100 650 9Fresno 15 0.6m San Diego 100 800 8Fresno 15 0.6m San Diego 250 500 11.5Fresno 15 0.6m San Diego 250 650 9.5Fresno 15 0.6m San Diego 250 800 8Fresno 15 0.6m San Diego 500 500 12Fresno 15 0.6m San Diego 500 650 10Fresno 15 0.6m San Diego 500 800 8Fresno 15 0.6m San Joaquin 100 500 11Fresno 15 0.6m San Joaquin 100 650 9Fresno 15 0.6m San Joaquin 100 800 8Fresno 15 0.6m San Joaquin 250 500 12Fresno 15 0.6m San Joaquin 250 650 10Fresno 15 0.6m San Joaquin 250 800 8.5Fresno 15 0.6m San Joaquin 500 500 12Fresno 15 0.6m San Joaquin 500 650 10Fresno 15 0.6m San Joaquin 500 800 8.5Fresno 19 AC PCA 100 500 15Fresno 19 AC PCA 100 650 13Fresno 19 AC PCA 100 800 11.5Fresno 19 AC PCA 250 500 17Fresno 19 AC PCA 250 650 14.5

200
Climatic region Slab Length(ft.)
Shoulder Traffic k-value Concrete Modulus ofRupture (psi)
Thickness(in.)
Fresno 19 AC PCA 250 800 12.5Fresno 19 AC PCA 500 500 17.5Fresno 19 AC PCA 500 650 14.5Fresno 19 AC PCA 500 800 12.5Fresno 19 AC San Diego 100 500 15Fresno 19 AC San Diego 100 650 12.5Fresno 19 AC San Diego 100 800 11Fresno 19 AC San Diego 250 500 16.5Fresno 19 AC San Diego 250 650 14Fresno 19 AC San Diego 250 800 12Fresno 19 AC San Diego 500 500 17Fresno 19 AC San Diego 500 650 14.5Fresno 19 AC San Diego 500 800 12.5Fresno 19 AC San Joaquin 100 500 15Fresno 19 AC San Joaquin 100 650 13Fresno 19 AC San Joaquin 100 800 11.5Fresno 19 AC San Joaquin 250 500 17Fresno 19 AC San Joaquin 250 650 14.5Fresno 19 AC San Joaquin 250 800 12.5Fresno 19 AC San Joaquin 500 500 17.5Fresno 19 AC San Joaquin 500 650 14.5Fresno 19 AC San Joaquin 500 800 12.5Fresno 19 Low LTE PCA 100 500 15Fresno 19 Low LTE PCA 100 650 13Fresno 19 Low LTE PCA 100 800 11.5Fresno 19 Low LTE PCA 250 500 17Fresno 19 Low LTE PCA 250 650 14.5Fresno 19 Low LTE PCA 250 800 12.5Fresno 19 Low LTE PCA 500 500 17Fresno 19 Low LTE PCA 500 650 14.5Fresno 19 Low LTE PCA 500 800 12.5Fresno 19 Low LTE San Diego 100 500 14.5Fresno 19 Low LTE San Diego 100 650 12.5Fresno 19 Low LTE San Diego 100 800 11Fresno 19 Low LTE San Diego 250 500 16.5Fresno 19 Low LTE San Diego 250 650 14Fresno 19 Low LTE San Diego 250 800 12Fresno 19 Low LTE San Diego 500 500 17Fresno 19 Low LTE San Diego 500 650 14.5Fresno 19 Low LTE San Diego 500 800 12Fresno 19 Low LTE San Joaquin 100 500 15Fresno 19 Low LTE San Joaquin 100 650 13Fresno 19 Low LTE San Joaquin 100 800 11.5Fresno 19 Low LTE San Joaquin 250 500 17Fresno 19 Low LTE San Joaquin 250 650 14.5Fresno 19 Low LTE San Joaquin 250 800 12.5Fresno 19 Low LTE San Joaquin 500 500 17.5
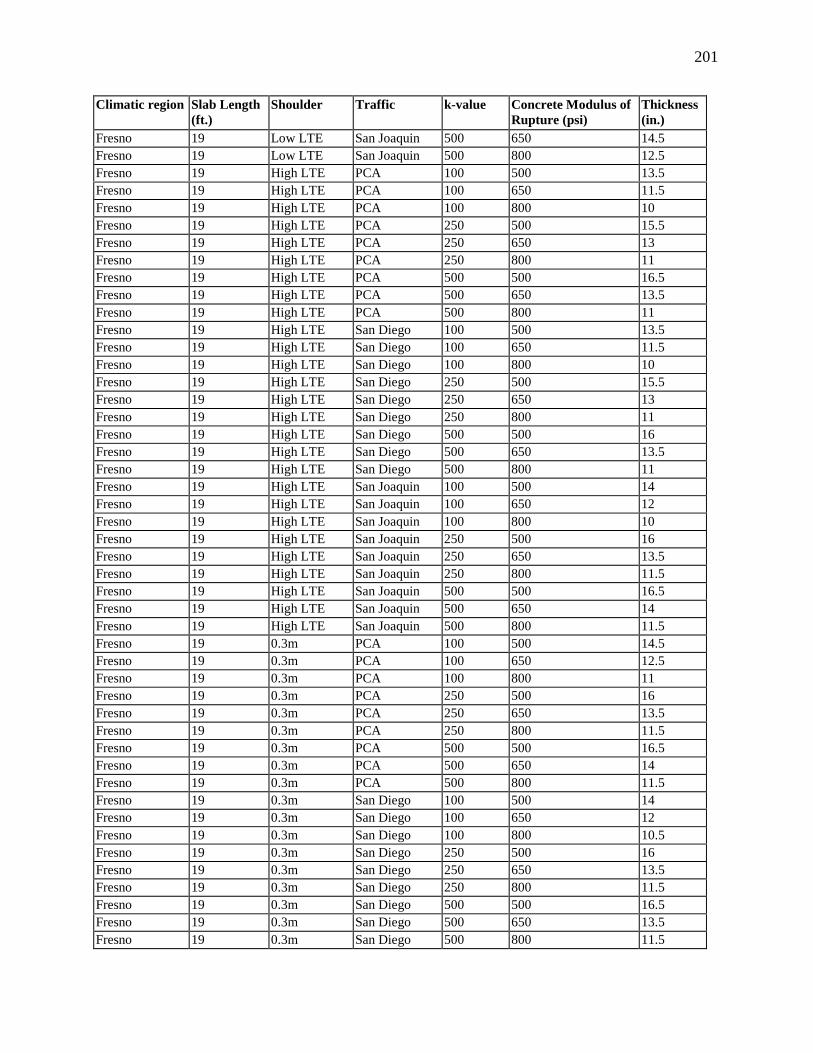
201
Climatic region Slab Length(ft.)
Shoulder Traffic k-value Concrete Modulus ofRupture (psi)
Thickness(in.)
Fresno 19 Low LTE San Joaquin 500 650 14.5Fresno 19 Low LTE San Joaquin 500 800 12.5Fresno 19 High LTE PCA 100 500 13.5Fresno 19 High LTE PCA 100 650 11.5Fresno 19 High LTE PCA 100 800 10Fresno 19 High LTE PCA 250 500 15.5Fresno 19 High LTE PCA 250 650 13Fresno 19 High LTE PCA 250 800 11Fresno 19 High LTE PCA 500 500 16.5Fresno 19 High LTE PCA 500 650 13.5Fresno 19 High LTE PCA 500 800 11Fresno 19 High LTE San Diego 100 500 13.5Fresno 19 High LTE San Diego 100 650 11.5Fresno 19 High LTE San Diego 100 800 10Fresno 19 High LTE San Diego 250 500 15.5Fresno 19 High LTE San Diego 250 650 13Fresno 19 High LTE San Diego 250 800 11Fresno 19 High LTE San Diego 500 500 16Fresno 19 High LTE San Diego 500 650 13.5Fresno 19 High LTE San Diego 500 800 11Fresno 19 High LTE San Joaquin 100 500 14Fresno 19 High LTE San Joaquin 100 650 12Fresno 19 High LTE San Joaquin 100 800 10Fresno 19 High LTE San Joaquin 250 500 16Fresno 19 High LTE San Joaquin 250 650 13.5Fresno 19 High LTE San Joaquin 250 800 11.5Fresno 19 High LTE San Joaquin 500 500 16.5Fresno 19 High LTE San Joaquin 500 650 14Fresno 19 High LTE San Joaquin 500 800 11.5Fresno 19 0.3m PCA 100 500 14.5Fresno 19 0.3m PCA 100 650 12.5Fresno 19 0.3m PCA 100 800 11Fresno 19 0.3m PCA 250 500 16Fresno 19 0.3m PCA 250 650 13.5Fresno 19 0.3m PCA 250 800 11.5Fresno 19 0.3m PCA 500 500 16.5Fresno 19 0.3m PCA 500 650 14Fresno 19 0.3m PCA 500 800 11.5Fresno 19 0.3m San Diego 100 500 14Fresno 19 0.3m San Diego 100 650 12Fresno 19 0.3m San Diego 100 800 10.5Fresno 19 0.3m San Diego 250 500 16Fresno 19 0.3m San Diego 250 650 13.5Fresno 19 0.3m San Diego 250 800 11.5Fresno 19 0.3m San Diego 500 500 16.5Fresno 19 0.3m San Diego 500 650 13.5Fresno 19 0.3m San Diego 500 800 11.5
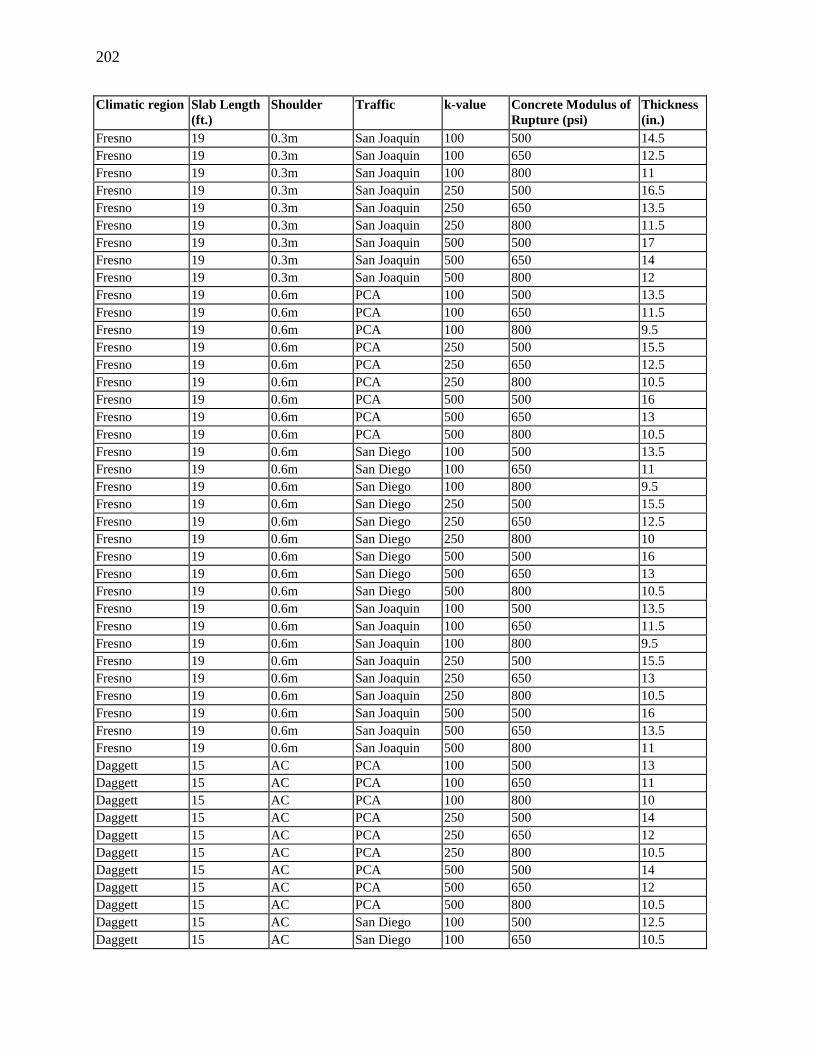
202
Climatic region Slab Length(ft.)
Shoulder Traffic k-value Concrete Modulus ofRupture (psi)
Thickness(in.)
Fresno 19 0.3m San Joaquin 100 500 14.5Fresno 19 0.3m San Joaquin 100 650 12.5Fresno 19 0.3m San Joaquin 100 800 11Fresno 19 0.3m San Joaquin 250 500 16.5Fresno 19 0.3m San Joaquin 250 650 13.5Fresno 19 0.3m San Joaquin 250 800 11.5Fresno 19 0.3m San Joaquin 500 500 17Fresno 19 0.3m San Joaquin 500 650 14Fresno 19 0.3m San Joaquin 500 800 12Fresno 19 0.6m PCA 100 500 13.5Fresno 19 0.6m PCA 100 650 11.5Fresno 19 0.6m PCA 100 800 9.5Fresno 19 0.6m PCA 250 500 15.5Fresno 19 0.6m PCA 250 650 12.5Fresno 19 0.6m PCA 250 800 10.5Fresno 19 0.6m PCA 500 500 16Fresno 19 0.6m PCA 500 650 13Fresno 19 0.6m PCA 500 800 10.5Fresno 19 0.6m San Diego 100 500 13.5Fresno 19 0.6m San Diego 100 650 11Fresno 19 0.6m San Diego 100 800 9.5Fresno 19 0.6m San Diego 250 500 15.5Fresno 19 0.6m San Diego 250 650 12.5Fresno 19 0.6m San Diego 250 800 10Fresno 19 0.6m San Diego 500 500 16Fresno 19 0.6m San Diego 500 650 13Fresno 19 0.6m San Diego 500 800 10.5Fresno 19 0.6m San Joaquin 100 500 13.5Fresno 19 0.6m San Joaquin 100 650 11.5Fresno 19 0.6m San Joaquin 100 800 9.5Fresno 19 0.6m San Joaquin 250 500 15.5Fresno 19 0.6m San Joaquin 250 650 13Fresno 19 0.6m San Joaquin 250 800 10.5Fresno 19 0.6m San Joaquin 500 500 16Fresno 19 0.6m San Joaquin 500 650 13.5Fresno 19 0.6m San Joaquin 500 800 11Daggett 15 AC PCA 100 500 13Daggett 15 AC PCA 100 650 11Daggett 15 AC PCA 100 800 10Daggett 15 AC PCA 250 500 14Daggett 15 AC PCA 250 650 12Daggett 15 AC PCA 250 800 10.5Daggett 15 AC PCA 500 500 14Daggett 15 AC PCA 500 650 12Daggett 15 AC PCA 500 800 10.5Daggett 15 AC San Diego 100 500 12.5Daggett 15 AC San Diego 100 650 10.5
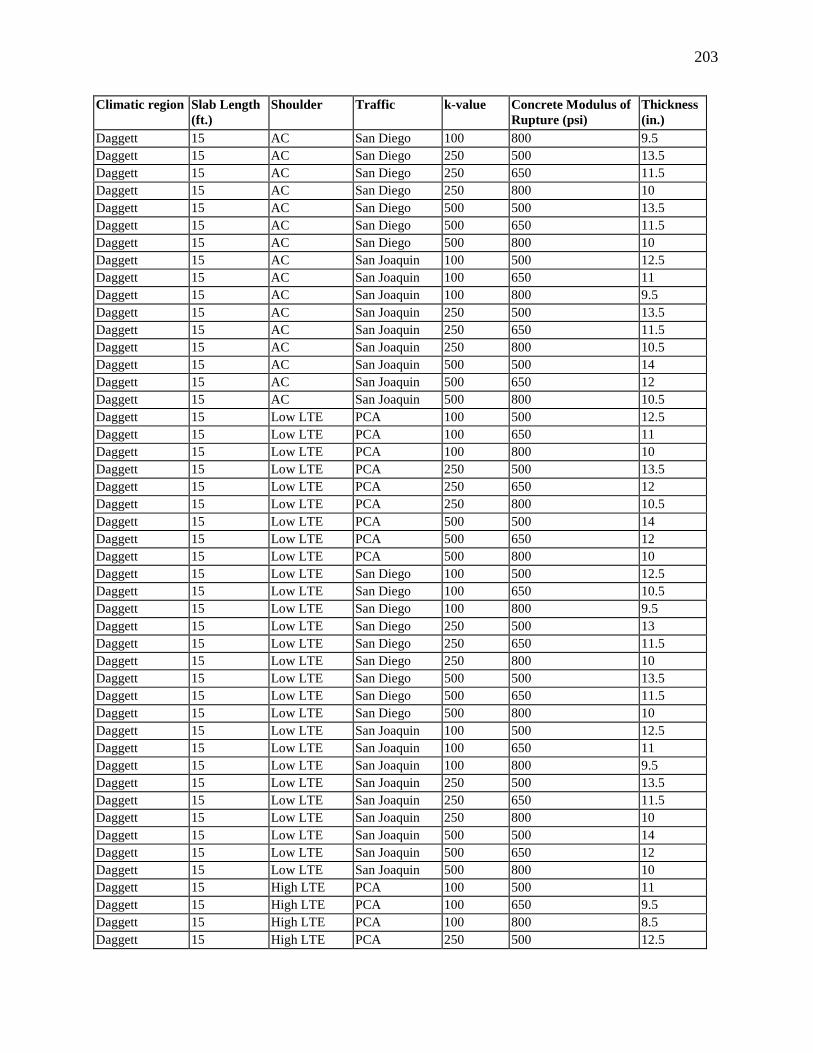
203
Climatic region Slab Length(ft.)
Shoulder Traffic k-value Concrete Modulus ofRupture (psi)
Thickness(in.)
Daggett 15 AC San Diego 100 800 9.5Daggett 15 AC San Diego 250 500 13.5Daggett 15 AC San Diego 250 650 11.5Daggett 15 AC San Diego 250 800 10Daggett 15 AC San Diego 500 500 13.5Daggett 15 AC San Diego 500 650 11.5Daggett 15 AC San Diego 500 800 10Daggett 15 AC San Joaquin 100 500 12.5Daggett 15 AC San Joaquin 100 650 11Daggett 15 AC San Joaquin 100 800 9.5Daggett 15 AC San Joaquin 250 500 13.5Daggett 15 AC San Joaquin 250 650 11.5Daggett 15 AC San Joaquin 250 800 10.5Daggett 15 AC San Joaquin 500 500 14Daggett 15 AC San Joaquin 500 650 12Daggett 15 AC San Joaquin 500 800 10.5Daggett 15 Low LTE PCA 100 500 12.5Daggett 15 Low LTE PCA 100 650 11Daggett 15 Low LTE PCA 100 800 10Daggett 15 Low LTE PCA 250 500 13.5Daggett 15 Low LTE PCA 250 650 12Daggett 15 Low LTE PCA 250 800 10.5Daggett 15 Low LTE PCA 500 500 14Daggett 15 Low LTE PCA 500 650 12Daggett 15 Low LTE PCA 500 800 10Daggett 15 Low LTE San Diego 100 500 12.5Daggett 15 Low LTE San Diego 100 650 10.5Daggett 15 Low LTE San Diego 100 800 9.5Daggett 15 Low LTE San Diego 250 500 13Daggett 15 Low LTE San Diego 250 650 11.5Daggett 15 Low LTE San Diego 250 800 10Daggett 15 Low LTE San Diego 500 500 13.5Daggett 15 Low LTE San Diego 500 650 11.5Daggett 15 Low LTE San Diego 500 800 10Daggett 15 Low LTE San Joaquin 100 500 12.5Daggett 15 Low LTE San Joaquin 100 650 11Daggett 15 Low LTE San Joaquin 100 800 9.5Daggett 15 Low LTE San Joaquin 250 500 13.5Daggett 15 Low LTE San Joaquin 250 650 11.5Daggett 15 Low LTE San Joaquin 250 800 10Daggett 15 Low LTE San Joaquin 500 500 14Daggett 15 Low LTE San Joaquin 500 650 12Daggett 15 Low LTE San Joaquin 500 800 10Daggett 15 High LTE PCA 100 500 11Daggett 15 High LTE PCA 100 650 9.5Daggett 15 High LTE PCA 100 800 8.5Daggett 15 High LTE PCA 250 500 12.5
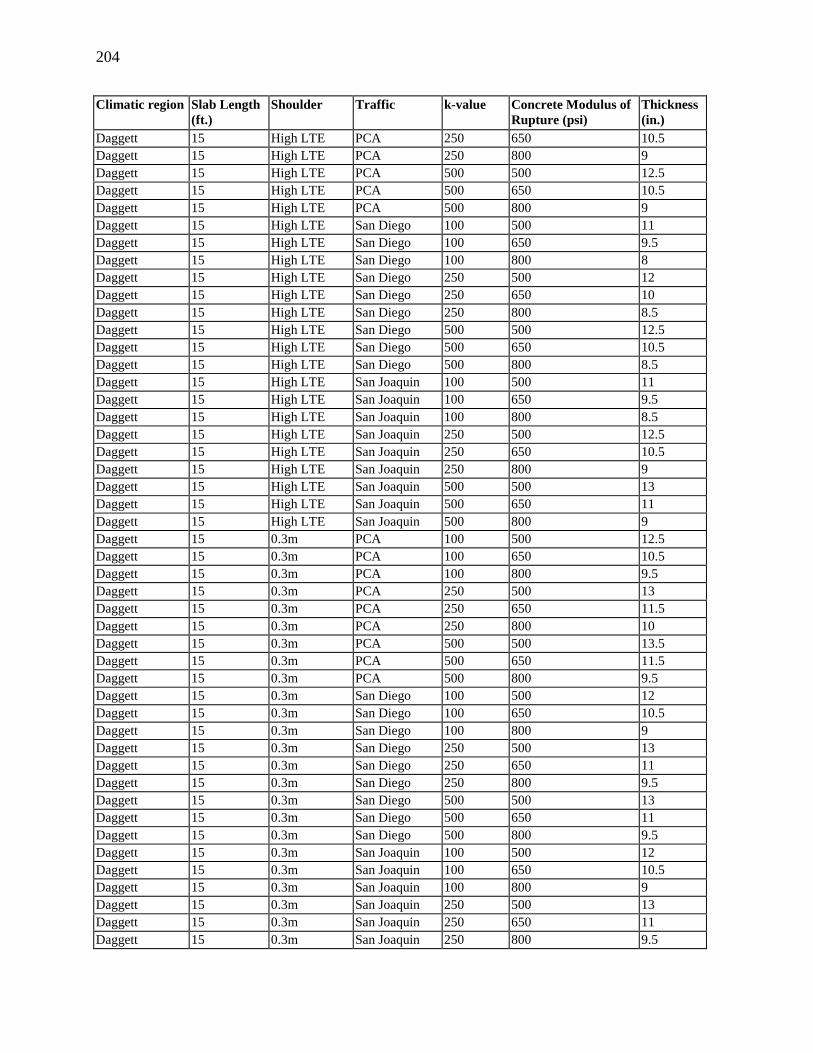
204
Climatic region Slab Length(ft.)
Shoulder Traffic k-value Concrete Modulus ofRupture (psi)
Thickness(in.)
Daggett 15 High LTE PCA 250 650 10.5Daggett 15 High LTE PCA 250 800 9Daggett 15 High LTE PCA 500 500 12.5Daggett 15 High LTE PCA 500 650 10.5Daggett 15 High LTE PCA 500 800 9Daggett 15 High LTE San Diego 100 500 11Daggett 15 High LTE San Diego 100 650 9.5Daggett 15 High LTE San Diego 100 800 8Daggett 15 High LTE San Diego 250 500 12Daggett 15 High LTE San Diego 250 650 10Daggett 15 High LTE San Diego 250 800 8.5Daggett 15 High LTE San Diego 500 500 12.5Daggett 15 High LTE San Diego 500 650 10.5Daggett 15 High LTE San Diego 500 800 8.5Daggett 15 High LTE San Joaquin 100 500 11Daggett 15 High LTE San Joaquin 100 650 9.5Daggett 15 High LTE San Joaquin 100 800 8.5Daggett 15 High LTE San Joaquin 250 500 12.5Daggett 15 High LTE San Joaquin 250 650 10.5Daggett 15 High LTE San Joaquin 250 800 9Daggett 15 High LTE San Joaquin 500 500 13Daggett 15 High LTE San Joaquin 500 650 11Daggett 15 High LTE San Joaquin 500 800 9Daggett 15 0.3m PCA 100 500 12.5Daggett 15 0.3m PCA 100 650 10.5Daggett 15 0.3m PCA 100 800 9.5Daggett 15 0.3m PCA 250 500 13Daggett 15 0.3m PCA 250 650 11.5Daggett 15 0.3m PCA 250 800 10Daggett 15 0.3m PCA 500 500 13.5Daggett 15 0.3m PCA 500 650 11.5Daggett 15 0.3m PCA 500 800 9.5Daggett 15 0.3m San Diego 100 500 12Daggett 15 0.3m San Diego 100 650 10.5Daggett 15 0.3m San Diego 100 800 9Daggett 15 0.3m San Diego 250 500 13Daggett 15 0.3m San Diego 250 650 11Daggett 15 0.3m San Diego 250 800 9.5Daggett 15 0.3m San Diego 500 500 13Daggett 15 0.3m San Diego 500 650 11Daggett 15 0.3m San Diego 500 800 9.5Daggett 15 0.3m San Joaquin 100 500 12Daggett 15 0.3m San Joaquin 100 650 10.5Daggett 15 0.3m San Joaquin 100 800 9Daggett 15 0.3m San Joaquin 250 500 13Daggett 15 0.3m San Joaquin 250 650 11Daggett 15 0.3m San Joaquin 250 800 9.5
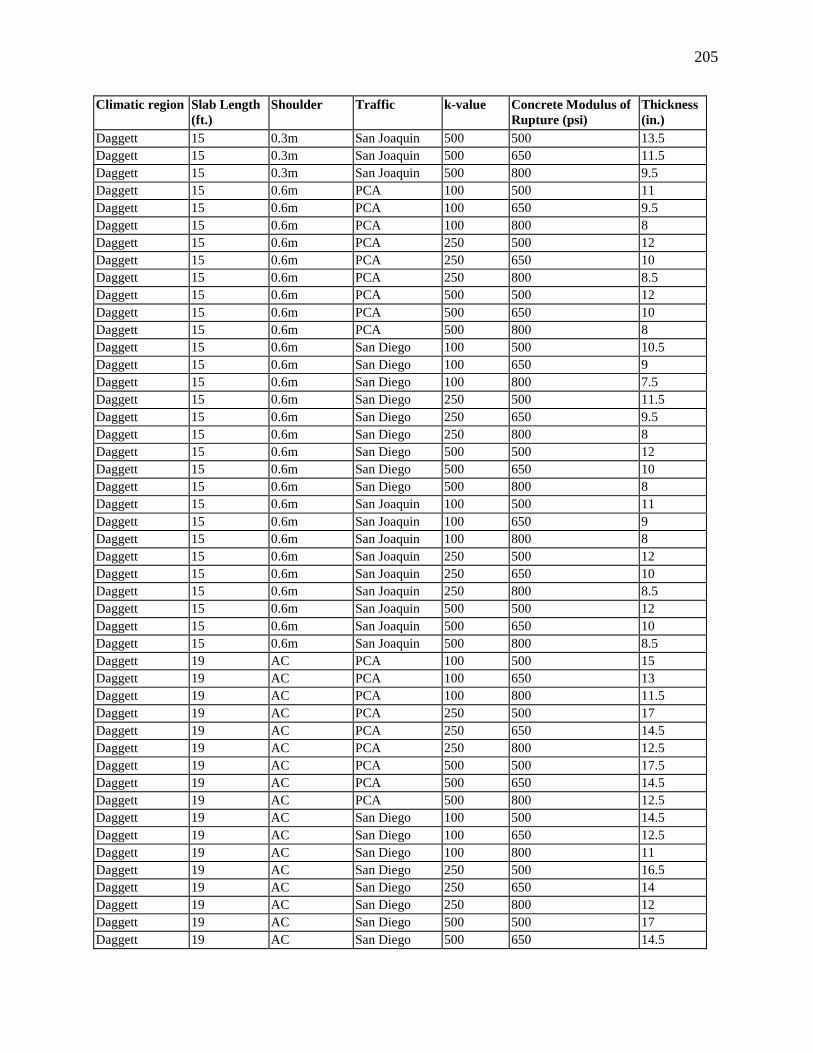
205
Climatic region Slab Length(ft.)
Shoulder Traffic k-value Concrete Modulus ofRupture (psi)
Thickness(in.)
Daggett 15 0.3m San Joaquin 500 500 13.5Daggett 15 0.3m San Joaquin 500 650 11.5Daggett 15 0.3m San Joaquin 500 800 9.5Daggett 15 0.6m PCA 100 500 11Daggett 15 0.6m PCA 100 650 9.5Daggett 15 0.6m PCA 100 800 8Daggett 15 0.6m PCA 250 500 12Daggett 15 0.6m PCA 250 650 10Daggett 15 0.6m PCA 250 800 8.5Daggett 15 0.6m PCA 500 500 12Daggett 15 0.6m PCA 500 650 10Daggett 15 0.6m PCA 500 800 8Daggett 15 0.6m San Diego 100 500 10.5Daggett 15 0.6m San Diego 100 650 9Daggett 15 0.6m San Diego 100 800 7.5Daggett 15 0.6m San Diego 250 500 11.5Daggett 15 0.6m San Diego 250 650 9.5Daggett 15 0.6m San Diego 250 800 8Daggett 15 0.6m San Diego 500 500 12Daggett 15 0.6m San Diego 500 650 10Daggett 15 0.6m San Diego 500 800 8Daggett 15 0.6m San Joaquin 100 500 11Daggett 15 0.6m San Joaquin 100 650 9Daggett 15 0.6m San Joaquin 100 800 8Daggett 15 0.6m San Joaquin 250 500 12Daggett 15 0.6m San Joaquin 250 650 10Daggett 15 0.6m San Joaquin 250 800 8.5Daggett 15 0.6m San Joaquin 500 500 12Daggett 15 0.6m San Joaquin 500 650 10Daggett 15 0.6m San Joaquin 500 800 8.5Daggett 19 AC PCA 100 500 15Daggett 19 AC PCA 100 650 13Daggett 19 AC PCA 100 800 11.5Daggett 19 AC PCA 250 500 17Daggett 19 AC PCA 250 650 14.5Daggett 19 AC PCA 250 800 12.5Daggett 19 AC PCA 500 500 17.5Daggett 19 AC PCA 500 650 14.5Daggett 19 AC PCA 500 800 12.5Daggett 19 AC San Diego 100 500 14.5Daggett 19 AC San Diego 100 650 12.5Daggett 19 AC San Diego 100 800 11Daggett 19 AC San Diego 250 500 16.5Daggett 19 AC San Diego 250 650 14Daggett 19 AC San Diego 250 800 12Daggett 19 AC San Diego 500 500 17Daggett 19 AC San Diego 500 650 14.5

206
Climatic region Slab Length(ft.)
Shoulder Traffic k-value Concrete Modulus ofRupture (psi)
Thickness(in.)
Daggett 19 AC San Diego 500 800 12Daggett 19 AC San Joaquin 100 500 15Daggett 19 AC San Joaquin 100 650 13Daggett 19 AC San Joaquin 100 800 11.5Daggett 19 AC San Joaquin 250 500 17Daggett 19 AC San Joaquin 250 650 14.5Daggett 19 AC San Joaquin 250 800 12.5Daggett 19 AC San Joaquin 500 500 17.5Daggett 19 AC San Joaquin 500 650 15Daggett 19 AC San Joaquin 500 800 12.5Daggett 19 Low LTE PCA 100 500 15Daggett 19 Low LTE PCA 100 650 13Daggett 19 Low LTE PCA 100 800 11.5Daggett 19 Low LTE PCA 250 500 17Daggett 19 Low LTE PCA 250 650 14.5Daggett 19 Low LTE PCA 250 800 12Daggett 19 Low LTE PCA 500 500 17.5Daggett 19 Low LTE PCA 500 650 14.5Daggett 19 Low LTE PCA 500 800 12.5Daggett 19 Low LTE San Diego 100 500 14.5Daggett 19 Low LTE San Diego 100 650 12.5Daggett 19 Low LTE San Diego 100 800 11Daggett 19 Low LTE San Diego 250 500 16.5Daggett 19 Low LTE San Diego 250 650 14Daggett 19 Low LTE San Diego 250 800 12Daggett 19 Low LTE San Diego 500 500 17Daggett 19 Low LTE San Diego 500 650 14.5Daggett 19 Low LTE San Diego 500 800 12Daggett 19 Low LTE San Joaquin 100 500 15Daggett 19 Low LTE San Joaquin 100 650 13Daggett 19 Low LTE San Joaquin 100 800 11.5Daggett 19 Low LTE San Joaquin 250 500 17Daggett 19 Low LTE San Joaquin 250 650 14.5Daggett 19 Low LTE San Joaquin 250 800 12.5Daggett 19 Low LTE San Joaquin 500 500 17.5Daggett 19 Low LTE San Joaquin 500 650 14.5Daggett 19 Low LTE San Joaquin 500 800 12.5Daggett 19 High LTE PCA 100 500 13.5Daggett 19 High LTE PCA 100 650 11.5Daggett 19 High LTE PCA 100 800 10Daggett 19 High LTE PCA 250 500 15.5Daggett 19 High LTE PCA 250 650 13Daggett 19 High LTE PCA 250 800 11Daggett 19 High LTE PCA 500 500 16.5Daggett 19 High LTE PCA 500 650 13.5Daggett 19 High LTE PCA 500 800 11Daggett 19 High LTE San Diego 100 500 13.5
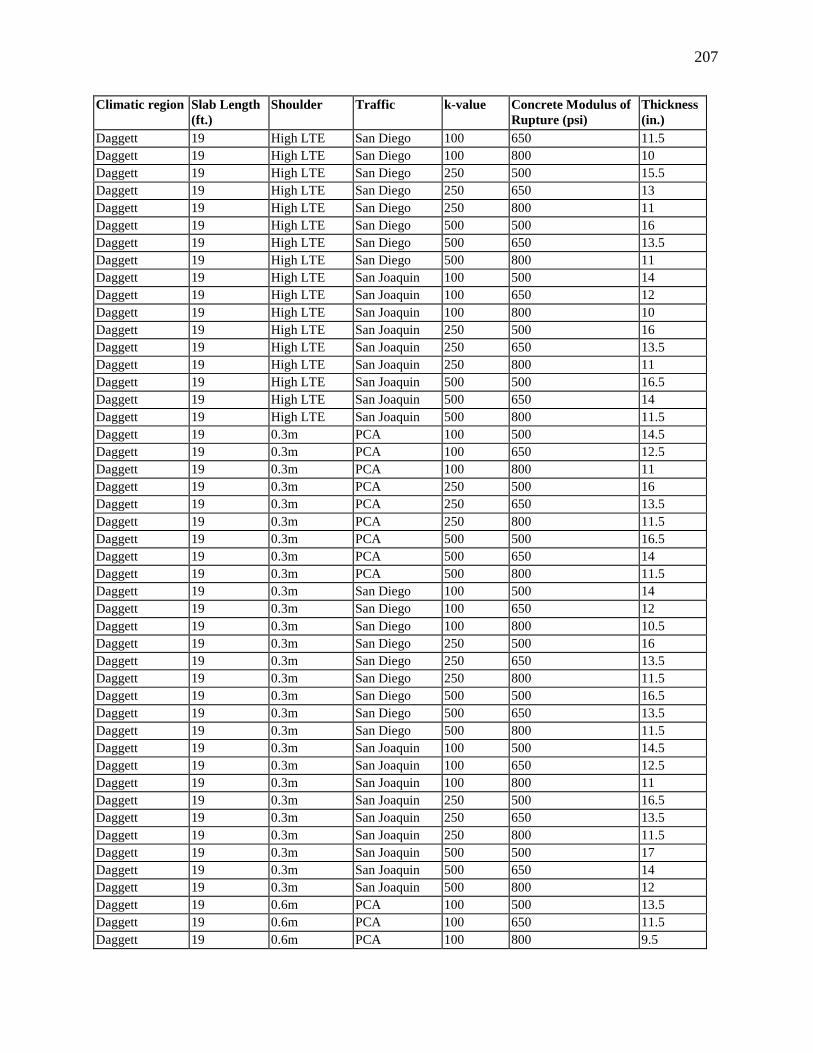
207
Climatic region Slab Length(ft.)
Shoulder Traffic k-value Concrete Modulus ofRupture (psi)
Thickness(in.)
Daggett 19 High LTE San Diego 100 650 11.5Daggett 19 High LTE San Diego 100 800 10Daggett 19 High LTE San Diego 250 500 15.5Daggett 19 High LTE San Diego 250 650 13Daggett 19 High LTE San Diego 250 800 11Daggett 19 High LTE San Diego 500 500 16Daggett 19 High LTE San Diego 500 650 13.5Daggett 19 High LTE San Diego 500 800 11Daggett 19 High LTE San Joaquin 100 500 14Daggett 19 High LTE San Joaquin 100 650 12Daggett 19 High LTE San Joaquin 100 800 10Daggett 19 High LTE San Joaquin 250 500 16Daggett 19 High LTE San Joaquin 250 650 13.5Daggett 19 High LTE San Joaquin 250 800 11Daggett 19 High LTE San Joaquin 500 500 16.5Daggett 19 High LTE San Joaquin 500 650 14Daggett 19 High LTE San Joaquin 500 800 11.5Daggett 19 0.3m PCA 100 500 14.5Daggett 19 0.3m PCA 100 650 12.5Daggett 19 0.3m PCA 100 800 11Daggett 19 0.3m PCA 250 500 16Daggett 19 0.3m PCA 250 650 13.5Daggett 19 0.3m PCA 250 800 11.5Daggett 19 0.3m PCA 500 500 16.5Daggett 19 0.3m PCA 500 650 14Daggett 19 0.3m PCA 500 800 11.5Daggett 19 0.3m San Diego 100 500 14Daggett 19 0.3m San Diego 100 650 12Daggett 19 0.3m San Diego 100 800 10.5Daggett 19 0.3m San Diego 250 500 16Daggett 19 0.3m San Diego 250 650 13.5Daggett 19 0.3m San Diego 250 800 11.5Daggett 19 0.3m San Diego 500 500 16.5Daggett 19 0.3m San Diego 500 650 13.5Daggett 19 0.3m San Diego 500 800 11.5Daggett 19 0.3m San Joaquin 100 500 14.5Daggett 19 0.3m San Joaquin 100 650 12.5Daggett 19 0.3m San Joaquin 100 800 11Daggett 19 0.3m San Joaquin 250 500 16.5Daggett 19 0.3m San Joaquin 250 650 13.5Daggett 19 0.3m San Joaquin 250 800 11.5Daggett 19 0.3m San Joaquin 500 500 17Daggett 19 0.3m San Joaquin 500 650 14Daggett 19 0.3m San Joaquin 500 800 12Daggett 19 0.6m PCA 100 500 13.5Daggett 19 0.6m PCA 100 650 11.5Daggett 19 0.6m PCA 100 800 9.5
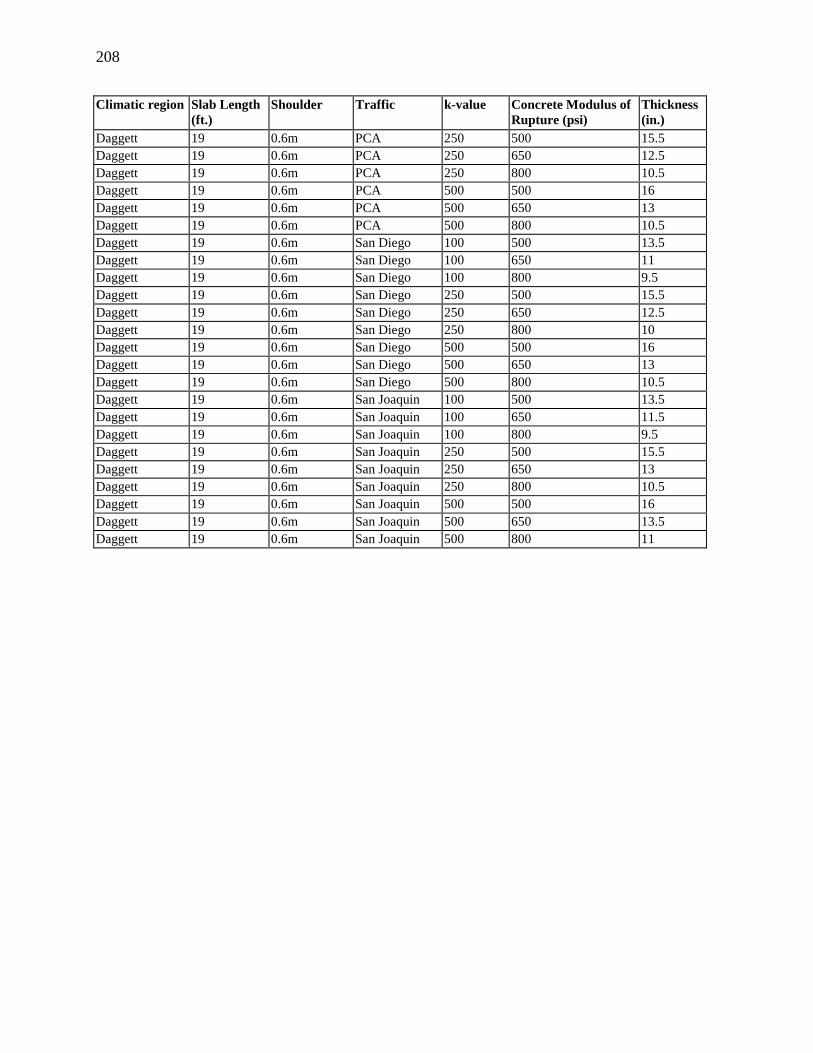
208
Climatic region Slab Length(ft.)
Shoulder Traffic k-value Concrete Modulus ofRupture (psi)
Thickness(in.)
Daggett 19 0.6m PCA 250 500 15.5Daggett 19 0.6m PCA 250 650 12.5Daggett 19 0.6m PCA 250 800 10.5Daggett 19 0.6m PCA 500 500 16Daggett 19 0.6m PCA 500 650 13Daggett 19 0.6m PCA 500 800 10.5Daggett 19 0.6m San Diego 100 500 13.5Daggett 19 0.6m San Diego 100 650 11Daggett 19 0.6m San Diego 100 800 9.5Daggett 19 0.6m San Diego 250 500 15.5Daggett 19 0.6m San Diego 250 650 12.5Daggett 19 0.6m San Diego 250 800 10Daggett 19 0.6m San Diego 500 500 16Daggett 19 0.6m San Diego 500 650 13Daggett 19 0.6m San Diego 500 800 10.5Daggett 19 0.6m San Joaquin 100 500 13.5Daggett 19 0.6m San Joaquin 100 650 11.5Daggett 19 0.6m San Joaquin 100 800 9.5Daggett 19 0.6m San Joaquin 250 500 15.5Daggett 19 0.6m San Joaquin 250 650 13Daggett 19 0.6m San Joaquin 250 800 10.5Daggett 19 0.6m San Joaquin 500 500 16Daggett 19 0.6m San Joaquin 500 650 13.5Daggett 19 0.6m San Joaquin 500 800 11