Embed Size (px)
Citation preview

FLL Master Plan Update
Policy Advisory Committee (PAC)
Briefing #1
September 22, 2016
Preliminary Draft – For Discussion and Review Purposes Only

2
PAC Committee
Internal
Stakeholders
Provides:
• Input on macro-level policy
issues
• Comments relative to the
near-term and long-term
aviation goals of Broward
County
• Guidance on FLL’s role in
the region
• Community and
Regulatory Perspectives
Preliminary Draft – For Discussion and Review Purposes Only

3
Briefing Agenda
Background
Master Planning Team
Study Overview
Master Planning Process and Schedule
FLL – The Airport in Context
Internal Visioning Charrette – Key Themes
Aviation Activity Forecasts
Landside Analyses and Integration with Regional
Transportation Modes and Initiatives
Next Steps
Preliminary Draft – For Discussion and Review Purposes Only

4
Background
October 2014 – County Commission Board approved RFP No. R1277707P1
for Airport Master Plan Update Consultant Services
January 2015 – Final Evaluations and Rankings Completed
March 2015 – County Commission Board Approved Ranking and Negotiations Commenced
October 2015 – County Commission Board Approves Agreement with
Ricondo & Associates, Inc. for Airport Master Plan Update Consultant Services
November 2015 – Notice to Proceed Issued
Preliminary Draft – For Discussion and Review Purposes Only

5
Master Planning Team Preliminary Draft – For Discussion and Review Purposes Only

6
Study Overview
Changes in the overall aviation market
and the global economy warrant master
plan updates.
Federal Aviation Administration (FAA)
and the Florida Department of
Transportation (FDOT) will partly fund
the master plans.
Two sequential phases were identified to
correlate with federal and state funding.
C O M P L E T E D
2010
2009 C O M P L E T E D
Preliminary Draft – For Discussion and Review Purposes Only
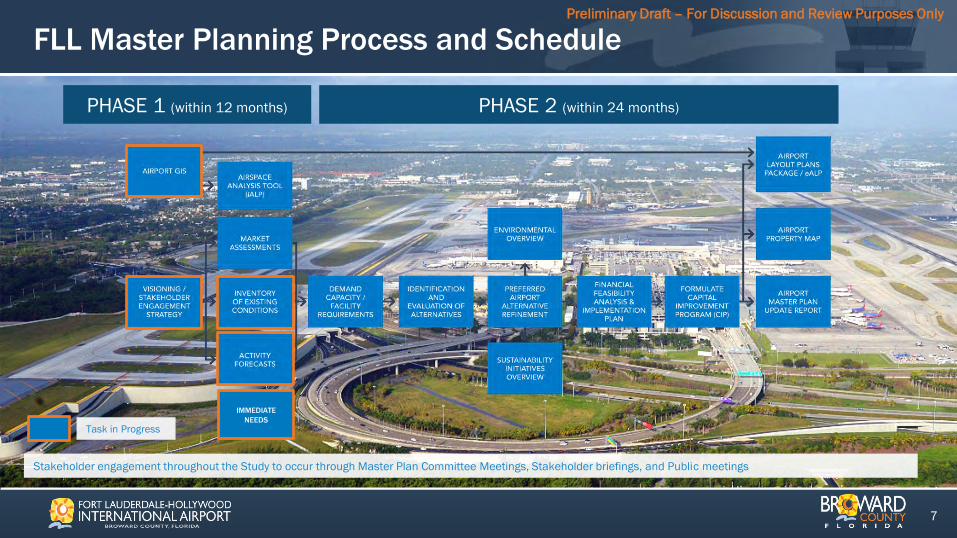
FLL Master Planning Process and Schedule
7
PHASE 1 (within 12 months) PHASE 2 (within 24 months)
Task in Progress
IMMEDIATE
NEEDS
Stakeholder engagement throughout the Study to occur through Master Plan Committee Meetings, Stakeholder briefings, and Public meetings
Preliminary Draft – For Discussion and Review Purposes Only

8
The Airport in Context
A. FLL Historical PerspectiveB. FLL’s Role Today
Preliminary Draft – For Discussion and Review Purposes Only

9
FLL Historical Perspective: 1996-2006
N
0
2
4
6
8
10
12
14
16
18
1996 1997 1998 1999 2000 2001 2002 2003 2004 2005 2006
Millio
ns E
np
lan
ed
Pa
sse
nge
rs (
ME
P)
FY 2015 Passenger Enplanements: 13.2 MEP
ote: Passenger
nplanements from FY1996
o FY2004 do not include
on-Revenue Passengers.
E
t
N
Sources: Airport Passenger
nplanements Data
FY2005-FY2015), Broward
ounty Aviation Department;
irport Passenger
nplanements Data
FY1996-FY2004), Terminal
rea Forecast (TAF).
E
(
C
A
E
(
A
Preliminary Draft – For Discussion and Review Purposes Only

10
FLL Historical Perspective: 2006-Present
0
2
4
6
8
10
12
14
16
18
2006 2007 2008 2009 2010 2011 2012 2013 2014 2015
Millio
ns E
np
lan
ed
Pa
sse
nge
rs (M
EP
)
Note: Partial opening of
oncourse G at FLL
ncludes the west
ortion of the
oncourse only. The
pening of the eastern
ortion of Concourse G
s scheduled to occur in
017.
ource: Airport
assenger
nplanements Data
FY2005-FY2015),
roward County
viation Department.
C
i
p
c
o
p
i
2
S
P
E
(
B
A
Preliminary Draft – For Discussion and Review Purposes Only

11
FLL Role Today
Sources: Woods & Poole Economics, Inc., March 2016; Map Resources, March 2016.
Preliminary Draft – For Discussion and Review Purposes Only

12
Physical Constraints of the Airport FLL Physical Airport Attributes
Sources: Broward County
Aviation Department, FLL
Airport Layout Plan,
August 2013; Broward
County Aviation
Department, Interlocal
Agreement Entered into
by and between City of
Dania Beach and Broward
County, November 2013.
Preliminary Draft – For Discussion and Review Purposes Only

Physical Constraints of the Airport Comparable Airport Boundaries
Baltimore/Washington
International Airport Miami International Airport
(Ratio 2.2:1) (Ratio 1.8:1)
(Ratio 7.3:1)
Atlanta-Hartfield
International Airport
(Ratio 2.6:1)
Dallas-Fort Worth
International Airport
(Ratio 9.5:1)
Denver International Airport
(Ratio 18.5:1)
Orlando International Airport
13
Preliminary Draft – For Discussion and Review Purposes Only

14
Preliminary Draft – For Discussion and Review Purposes Only Physical Constraints of the Airport FLL Development Opportunities and Constraints

FLL Current Long-term Airport Plan
15
Preliminary Draft – For Discussion and Review Purposes Only

Internal Visioning Charrette – March 2016
Key Themes
16
Preliminary Draft – For Discussion and Review Purposes Only

17
General Themes for the Airport
• Planning process needs to include partners (transit, port, CVB) to ensure
synergy; Be creative and innovative with key stakeholder partners,
particularly FLL’s three airlines that have emphasized that they want to
grow and grow quickly.
• Keep that easy-in/easy-out and hometown feel as best we can at FLL.
• Maintain “balance” among all facilities.
Preliminary Draft – For Discussion and Review Purposes Only

18
Market Opportunities for the Airport
• Maintain a diverse air carrier base; consideration for potential mergers
among FLL’s dominant airlines.
• International Airlines and traffic growth – how much should BCAD be in the
forefront of pursuing international activity? Do we want to compete with
Miami? What does international growth mean in terms of facility
development for FLL?
• Can we expand cargo? Is it truly in our future (why or why not)? Expansion
of cargo needs to provide consideration for potential noise impacts.
Preliminary Draft – For Discussion and Review Purposes Only

19
Operational and Safety Considerations for the Airport Preliminary Draft – For Discussion and Review Purposes Only
• Roadway system and parking facilities are becoming deficient; Are there things that we can do to increase our accessibility?
• Ensure that users can get in and out safely and efficiently. Focus on both terminal and non-terminal roadways, curbfront/passenger roadway crossings and overall walking distances.
• Leverage multimodal opportunities to Port, convention center, and beyond.
• How will the demographics affect airport facility and regional transportation needs?
• How do we ensure seemless connectivity for all passengers (and their baggage) between transportation modes?

20
Strategic and Business Considerations for the Airport Preliminary Draft – For Discussion and Review Purposes Only
• Avoid or minimize building throw-away investments.
• Identify the highest and best value use of scarce airport property including
assessing facility needs as tenant leases expire; explore opportunities to
optimize real estate holdings.
• How do we make sure that people can safely and quickly get from one end
of where you start out to the very end?

21
Existing Cargo Tenants
Source: Fort Lauderdale Hollywood International Airport 2015 Aerial, Provided By Broward County Aviation Department.
Preliminary Draft – For Discussion and Review Purposes Only

22
Existing General Aviation Facilities
Source: Fort Lauderdale Hollywood International Airport 2015 Aerial, Provided By Broward County Aviation Department.
Preliminary Draft – For Discussion and Review Purposes Only

AVIATION ACTIVITY FORECASTS
23
Preliminary Draft – For Discussion and Review Purposes Only

Forecasts – Enplaned Passengers
Baseline, Accelerated Baseline, and FAA 2015 TAF
0
5
10
15
20
25
30
35
20
05
20
06
20
07
20
08
20
09
20
10
20
11
20
12
20
13
20
14
20
15
20
16
20
17
20
18
20
19
20
20
20
21
20
22
20
23
20
24
20
25
20
26
20
27
20
28
20
29
20
30
20
31
20
32
20
33
20
34
20
35
An
nu
al E
np
lan
ed
Pa
sse
nge
rs (
millio
ns)
13.2m
(Actual)
F
Fiscal Year Historical Accelerated Baseline FAA TAF
Baseline
22.3m
2.7% CAGR
NOTES: FAA 2015 TAF excludes non-revenue
passengers. CAGR = Compound Annual Growth
Rate. CAGR may not match due to rounding of
enplaned passenger values.
SOURCES: Broward County Aviation
Department (Historical); Innovata; JetBlue
Airways; Southwest Airlines; Spirit Airlines; FAA
Terminal Area Forecasts; US DOT O&D Survey
(DB1B); Ricondo & Associates, Inc.
Accelerated
26.2 m
3.5% CAGR
AA 2015 TAF
20.8m
2.5% CAGR
24
Preliminary Draft – For Discussion and Review Purposes Only

0
5
10
15
20
25
302
00
5
20
06
20
07
20
08
20
09
20
10
20
11
20
12
20
13
20
14
20
15
20
16
20
17
20
18
20
19
20
20
20
21
20
22
20
23
20
24
20
25
20
26
20
27
20
28
20
29
20
30
20
31
20
32
20
33
20
34
An
nu
al E
np
lan
ed
Pa
sse
nge
rs (
millio
ns)
2.7% CAGR
2.5% Originating
4.0% Connecting
3.5% CAGR
3.0% Originating
5.8% Connecting
13.2m
90% - Originating
10% - Connecting
20
35
Originating Connecting Adjusted Baseline
26.2m
80% - Originating
20% -Connecting
22.3m
86% - Originating
14% -Connecting
25
Master Plan Forecasts Draft Forecasts – Enplaned Passengers (Originating vs. Connecting)
NOTES: CAGR = Compound Annual Growth
Rate. CAGR may not match due to rounding
of enplaned passenger values.
SOURCES: Broward County Aviation
Department; Innovata; JetBlue Airways;
Southwest Airlines; Spirit Airlines; Ricondo &
Associates, Inc.
Preliminary Draft – For Discussion and Review Purposes Only

26
Master Plan Forecasts Draft Forecasts – Enplaned Passengers (Domestic vs. International)
0
5
10
15
20
25
302
00
5
20
06
20
07
20
08
20
09
20
10
20
11
20
12
20
13
20
14
20
15
20
16
20
17
20
18
20
19
20
20
20
21
20
22
20
23
20
24
20
25
20
26
20
27
20
28
20
29
20
30
20
31
An
nu
al E
np
lan
ed
Pa
sse
nge
rs (
millio
ns)
Domestic International Adjusted Baseline
2.7% CAGR
2.4% Domestic
3.8% International
3.5% CAGR
2.8% Domestic
5.5% International
13.2m
80% - Domestic
20% - International
20
32
20
33
20
34
20
35
26.2m
70% - Domestic
30% - International
22.3m
77% - Domestic
23% - International
NOTES: CAGR = Compound Annual Growth
Rate. CAGR may not match due to rounding
of enplaned passenger values.
SOURCES: Broward County Aviation
Department; Innovata; JetBlue Airways;
Southwest Airlines; Spirit Airlines; Ricondo &
Associates, Inc.
Preliminary Draft – For Discussion and Review Purposes Only

27
Master Plan Forecasts Resulting Airport Shares of Total O&D Passengers
-
10
20
30
40
50
2015 2020 2025 2035
MIA/PBI FLL
0
10
20
30
40
50
2015 2020 2025 2035
MIA/PBI FLL
Accelerated O&D Enplanements (mil) Baseline O&D Enplanements (mil)
45% 50% 50%
50%
45% 52%
53% 53%
Sources: Broward County Aviation Department,; US DOT O&D Survey (DB1B), Ricondo & Associates, Inc. (Historical O&D estimates and forecasts).
Preliminary Draft – For Discussion and Review Purposes Only
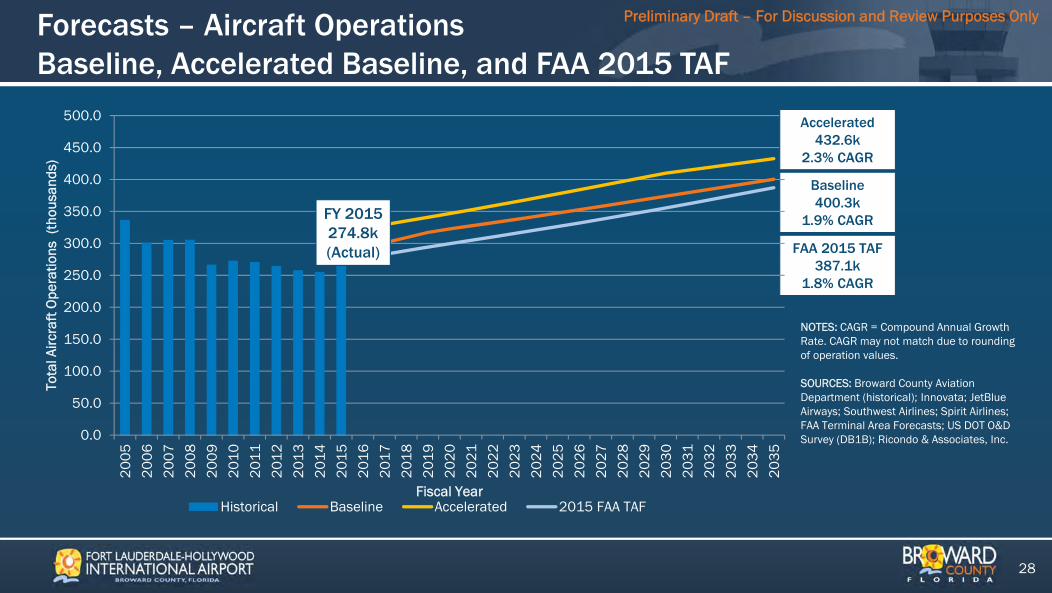
28
Forecasts – Aircraft OperationsBaseline, Accelerated Baseline, and FAA 2015 TAF
FAA 2015 TAF387.1k
1.8% CAGR
Baseline400.3k
1.9% CAGR
0.0
50.0
100.0
150.0
200.0
250.0
300.0
350.0
400.0
450.0
500.02
00
5
20
06
20
07
20
08
20
09
20
10
20
11
20
12
20
13
20
14
20
15
20
16
20
17
20
18
20
19
20
20
20
21
20
22
20
23
20
24
20
25
20
26
20
27
20
28
20
29
20
30
20
31
20
32
20
33
20
34
20
35
Tota
l Airc
raft
Ope
ratio
ns (
thou
sand
s)
Fiscal YearHistorical Baseline Accelerated 2015 FAA TAF
FY 2015274.8k(Actual)
Accelerated432.6k
2.3% CAGR
NOTES: CAGR = Compound Annual Growth Rate. CAGR may not match due to rounding of operation values.
SOURCES: Broward County Aviation Department (historical); Innovata; JetBlue Airways; Southwest Airlines; Spirit Airlines; FAA Terminal Area Forecasts; US DOT O&D Survey (DB1B); Ricondo & Associates, Inc.
Preliminary Draft – For Discussion and Review Purposes Only

FLL Immediate Needs
29
5-Year (2020) Capacity Assessment,
Needs and Solutions/Options for:
• Gates
• Hardstands
• Terminal/Passenger
Processing Facilities
• Public Parking
• Terminal Access
West Side Land Use Plan and
Integrated Facility Layout Plan and
Airside Access Plan
North Side Land Use Plan and
Integrated Facility Layout and
Airside Access Plan
Preliminary Draft – For Discussion and Review Purposes Only

Study Area Boundary
FLL Landside Analyses Study Area
30
Preliminary Draft – For Discussion and Review Purposes Only

FLL Landside and Access Flows
31
Terminal 1
Terminal 4
Terminal 2
Terminal 3
Cypress
Garage/RAC
Hibiscus
Garage
Palm
Garage
Legend:
Entry Flow
Exit Flow
Recirculation
Preliminary Draft – For Discussion and Review Purposes Only

Regional Roadway Studies to be Inventoried
32
FDOT District 4 Exit Ramp Assessment
for FLL, August 2014
FDOT District 4 US1 and Griffin
Road Intersection Study (2015)
Broward County Intermodal Center and People Mover
System – FLL to Port Everglades (June 2009)
FDOT I-95 Interchange Master Plan Study
FDOT I-95 Express Lanes Phase 2 Project
Corridor Traffic Analysis Report for I-95 Express
Phase 3C
I-95/I-595 Interchange Modification Report
Preliminary Draft – For Discussion and Review Purposes Only

Integration with Regional Transportation Modes and Initiatives
33
Study Area • MPO’s Transportation Improvement Program
• Commitment 2040 – MPO’s Long Range
Transportation Plan
• SR-7 Multimodal Improvements Corridor Study
• The WAVE
• All Aboard Florida
• Tri-Rail Coastal Link Commuter Rail Service
• Airport/Seaport Connectivity
• State Transportation Improvement Program –
FDOT District 4’s Five Year Adopted Work Program
• FLL Connectivity with Freeway Management
System
Preliminary Draft – For Discussion and Review Purposes Only
34
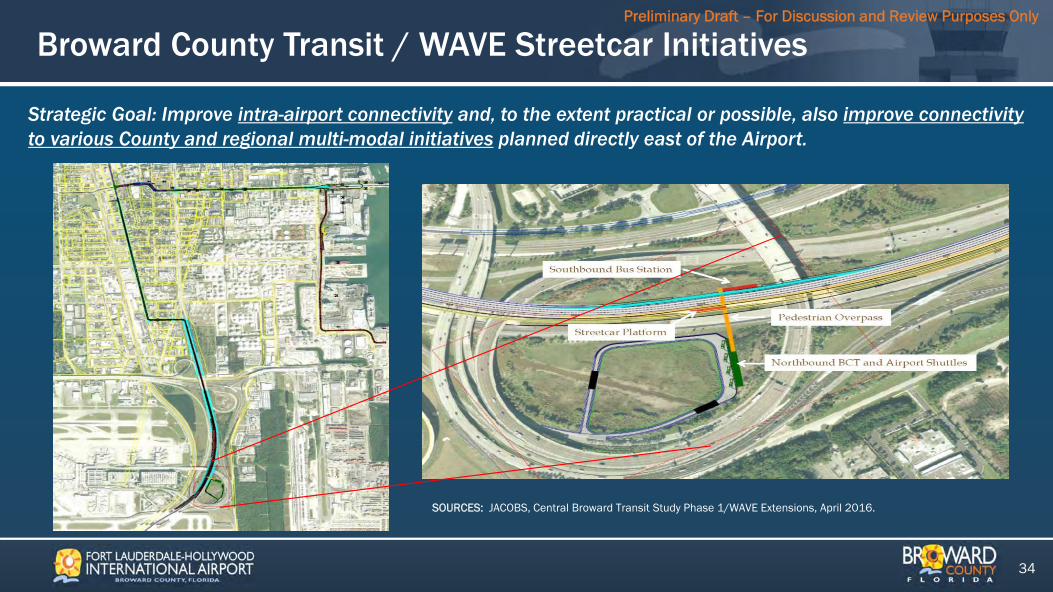
Broward County Transit / WAVE Streetcar Initiatives
Strategic Goal: Improve intra-airport connectivity and, to the extent practical or possible, also improve connectivity to various County and regional multi-modal initiatives planned directly east of the Airport.
Preliminary Draft – For Discussion and Review Purposes Only
SOURCES: JACOBS, Central Broward Transit Study Phase 1/WAVE Extensions, April 2016.

35
Regional Transportation Initiatives
Strategic Goal: Improve intra-airport connectivity and, to the extent practical or possible, also improve connectivity to various County and regional multi-modal initiatives planned directly east of the Airport.
Source: Kimley Horn And Associates, Inc., April 2016.
Preliminary Draft – For Discussion and Review Purposes Only

Next Steps
36
Demand/Capacity – Landside Systems and non-
Terminal Area Facilities
Other Immediate Needs – Public Safety Facilities,
North and West Side Land Use Plans
Preliminary Draft – For Discussion and Review Purposes Only

THANK YOU
Preliminary Draft – For Discussion and Review Purposes Only