Embed Size (px)
Citation preview

1
PRELIMINARY ASSESSMENT OF SURFACE WATER CLARITY CHANGES IN KEY WEST DURING THE
COVID19 ANTHROPAUSE
Henry Briceno
Florida International University.
Institute of Environment.
Water Quality Monitoring Lab
SERC contribution number 1009T
March 31, 2021

2
PRELIMINARY ASSESSMENT OF SURFACE WATER CLARITY CHANGES IN KEY WEST DURING THE
COVID19 ANTHROPAUSE
Henry Briceno
Florida International University. Institute of Environment. Water Quality Monitoring Lab
SUMMARY OF FINDINGS
While the Anthropocene encompass the period since the beginning of significant human
impact on the atmosphere, biosphere and hydrosphere, the recently named Anthropause is
characterized by a substantial slowdown in human activity due to the COVID19 pandemic (Rutz
et al. 2020). This slowdown has driven changes of environmental conditions around the world
(Rutz et al. 2020; Forti et al. 2020; Manenti et al. 2020), fostering research programs to
evaluate its impact (https://www.bio-logging.net). Preliminary evaluation of these changes
suggest that air quality improves significantly in cities around the world, water pollution and
noise are cut-down, and greenhouse gas emissions also decline (Rume and Didar-Ul 2020). In
this context the slow-down has the potential of reverting or abating the effects of the
Anthropocene.
There have been countless reports of improving water clarity during the COVID19 shut-
down, and the ban on cruise-ship traffic in Key West, but no hard data has been presented to
back-up those statements. We have attempted to detect changes in water quality during the
COVID19 shutdown from measurements performed by Florida International University the last
25+ years in the Florida Keys National Marine Sanctuary and from data gathered by MODIS
instruments onboard Aqua and Terra satellites provided by University of South Florida Optical
Oceanography Lab. We used turbidity and water clarity as water quality indexes, two
quantifiable properties amenable of detection by the human eye, which would relate to citizens
perception. Additionally we used a “first-responder” water quality index, dissolved oxygen, to
complement the assessment of changes in water quality.

3
We began by comparing the ShutDown period against a 25-year Baseline spanning from
1995 to 2019, and testing the changes with two different statistical procedures, conventional
ANOVA tests and Welch’s approach for ANOVA. We contrasted the median and the mean from
the Baseline to those of the Shutdown. As shown in Figure I for Box-and-Whisker method,
median turbidity in surface waters south of Key West during the ShutDown, was significantly
lower than the median of the previous 25 years (green arrow), while median dissolved oxygen
concentrations were higher during 2020 and Kd was lower. Bottom waters in reef samples also
had lower median turbidity and Kd, and higher DO, but the differences with the median of
previous years were not statistically significant (blue arrows). All those changes are signs of
water quality improvements with respect to median Baseline.
Tests contrasting the mean of parameters between Baseline and Shutdown (Fig I;
MINITAB Welch’s) was even more dramatic. Mean for turbidity, Kd, and DO for surface and
bottom waters in reef sites were all significantly different (meaning better) from those of the
Baseline (green arrows in Fig i). Mean turbidity in surface waters north of Key West was lower
during the ShutDown, while DO in bottom waters was higher. Mean DO in surface waters and
Kd of the water column did not change from Baseline to 2020, for northern stations.
Figure i: Summary of changes in turbidity, DO, and Kd in surface and bottom waters of the Reef and North of Key West areas.
MODIS data to compare and test differences between pre-shutdown (2019-Feb 2020)
and COVID-ShutDown (March 2020-Dec 2020) indicate that most stations in reef waters
REEF NORTH REEF NORTH
SurfaceTurbidity
Dissolved
Oxygen
BottomTurbidity
Dissolved
Oxygen
Column Kd
Box-and-whisker MINITAB Welch's

4
experienced drops in Kd (#275, #276, #280, #281) and/or turbidity (#275, #276, #278, #281) in
2020 as compared to 2019. Breaks in the mean function derived from Rodionov test were
statistically significant.
Waters south of Key West, during year 2020 were among the less turbid waters in the
last 25 years, together with 2012, 2013 and 2015. Kd was low, but similar to several previous
years. Turbidity and Kd in waters in Garrison Bight and Man of War Bay, north of Key West, are
not different from most previous years. In all instances, magnitude of changes were very small,
underscoring the sensitivity of these ecosystem to even very small changes. What is interesting
is that small improvements in turbidity and Kd swiftly cascade into observable changes in water
quality perceived by Keys neighbors, and surely by the rich biota of the Florida Keys National
Marine Sanctuary.
CITATION: Briceño, Henry. 2021. Preliminary Assessment of Surface Water Clarity Changes in
Key West during the COVID19 Anthropause. Florida International University, Institute of
Environment, SERC contribution number 1009T. 30p

5
TABLE OF CONTENT
SUMMARY OF FINDINGS …………………………………………………………………… 2
INTRODUCTION …………………………………………………………………… 6
STUDY AREA …………………………………………………………………… 8
DATA SOURCES …………………………………………………………………… 9
METHODS …………………………………………………………………… 9
Field Measurements …………………………………………………………………… 9
Statistical analysis …………………………………………………………………… 10
PRESENTATION & DISCUSSION OF RESULTS …………………………………. 11
Reef area …………………………………………………………………… 11
North Area …………………………………………………………………… 13
MINITAB ANOVA Tests …………………………………………………………………… 15
Seasonal comparisons …………………………………………………………………… 19
Annual variability …………………………………………………………………… 19
Long-term trend …………………………………………………………………… 21
Remote Sensing Data …………………………………………………………………… 24
Comparing Remote Sensing and FIU Field Data …………………………………. 25
REFERENCES …………………………………………………………………… 29

6
PRELIMINARY ASSESSMENT OF SURFACE WATER CLARITY CHANGES IN KEY WEST DURING THE
COVID19 ANTHROPAUSE
Henry Briceno
Florida International University. Institute of Environment. Water Quality Monitoring Lab
INTRODUCTION
While the Anthropocene encompass the period since the beginning of significant human
impact on the atmosphere, biosphere and hydrosphere, the recently named Anthropause is
characterized by a substantial slowdown in human activity due to the COVID19 pandemic (Rutz
et al. 2020). This slowdown has driven changes of environmental conditions around the world
(Rutz et al. 2020; Forti et al. 2020; Manenti et al. 2020), fostering research programs to
evaluate its impact (https://www.bio-logging.net). Preliminary evaluation of these changes
suggest that air quality improves significantly in cities around the world, water pollution and
noise are cut-down, and greenhouse gas emissions also decline (Rume and Didar-Ul 2020). In
this context the slow-down has the potential of reverting or abating the effects of the
Anthropocene.
Since March 2020, when the pandemic shutdown was imposed, Key West residents
began to observe improvements in water clarity. Experiencing these beneficial environmental
changes cascaded into the inception of a strong social movement aiming to preserve what their
followers interpret as environmental gains brought about by the shutdown. This report
summarizes a preliminary evaluation of water clarity changes in waters around Key West,
Florida Keys, since March 2020, when the shutdown due to COVI19 began. Florida International
University, under contract with the Environmental Protection Agency, is responsible for the
execution of the Water Quality Monitoring Project (WQMP) for the Florida Keys National
Marine Sanctuary, as part of the Water Quality Protection Program. The Sanctuary extends in a
NE to SW direction from offshore Biscayne Bay to Dry Tortugas National Park (some 340
kilometers). There are 112 active monitoring stations in the Sanctuary (Fig 1), where water

7
samples are collected, and water properties are measured every quarter
(http://serc.fiu.edu/wqmnetwork/FKNMS-CD/), including waters surrounding Key West.
This study is a preliminary evaluation of differences in selected water quality
parameters between year 2020 and the previous 24 years. The parameters selected for
evaluation are physical-chemical properties of waterbodies that respond rapidly to imposing
conditions (Briceño and Boyer 2009). We will discuss first, the long-term data from FIU
monitoring program, and later a preliminary look at remote sensing data derived for the same
FIU localities south of Key West.
Figure 1: Map of FKNMS showing segments derived from biogeochemical data: OFF=Offshore;
MAR=Marquesas; BKS=Back Shelf; BKB= Back Bay; LK= Lower Keys; MK= Middle Keys; UK= Upper
Keys

8
STUDY AREA
In order to assess potential water quality changes since the beginning of the
Anthropause, we selected data from a series of WQMP monitoring stations around Key West.
Five stations (white sites in Fig 2) located on the Atlantic side south of Key West, and two
stations to the north of Key West (yellow sites in Fig 2). Stations to the extreme south (#276
and #280) overlie mostly coral barrier-reefs areas (reef-track) and are characterized by their
extremely low nutrient concentrations and high clarity (low turbidity). Stations #275, #278 and
#281 are in the Hawk Channel, between the reef-track and the keys. Bottom in the channel
contains sandy bottom, and reef patches. Those waters are characterized by low nutrient
concentrations and a little higher turbidity than reef samples. Both, reef-track and Hawk
Channel samples are so similar that we bundled them together as a group (Reef area) for the
purpose of this study.
Figure 2. FIU active monitoring stations near Key West. White stations to the south overlie coral reefs (Reef Area). Yellow stations are in Garrison Bight (#317) and Man of War Harbor Bay (#316), north of Key West (North Area). Light blue line is approximate track of navigation channel

9
Finally, stations north of Key West (North area sites; yellow in Fig 2) display moderate to
high turbid, and are relatively richer in nutrients and chlorophyll-a, due to the impacts from
nearby urban centers and contributions from the Gulf Shelf. There are no stations located in the
navigation channel, and the closest site (station #278) is one mile west of the southern
extension of the channel (Fig 2).
DATA SOURCES
Data for this study comes from two sources. First, the Florida Keys National Marine
Sanctuary (FKNMS) Water Quality Monitoring Project (WQMP) executed by FIU, and second,
remote sensing data from the Virtual Buoys Project at University of South Florida’s Optical
Oceanography Laboratory (https://optics.marine.usf.edu/projects/vbs.html). FIU’s monitoring
entails both, field measurements of physical-chemical properties of the water column, and the
collection and chemical analysis of water samples. Data was downloaded from FIU’s Water
Quality Monitoring Network website http://serc.fiu.edu/wqmnetwork/FKNMS-CD/.
METHODS
Field Measurements
The period of record for field measurements of water quality parameters was from
March 1995 to December 2020 (25.5 years), which included 102 quarterly sampling events.
Variables used for this study included dissolved oxygen, turbidity and light attenuation
coefficient. Given the shallow depth of #316 and #317, there is no bottom turbidity data for
those sites. Field measurements were made with a Seabird SBE 19 and a Lamotte 2020 turbidity
meter. The vertical light attenuation coefficient for downward irradiance (Kd, m-1) was
calculated at 0.5 m intervals from photosynthetically active radiation (PAR) and depth data
using the standard exponential equation (Kirk 1994) and averaged over the station depth. The
LICOR PAR sensor uses a diffusive sphere and filters to create nearly uniform sensitivity to light

10
between 400 and 700 nm, which closely corresponds to light used by most terrestrial and
aquatic plants and algae.
Statistical analysis
We have tested the hypothesis that water quality has changed significantly during the
Anthropause on the coral reefs south of Key West, and to the north of Key West. Levels of
surface and bottom turbidity (TURB), dissolved oxygen (DO), and light attenuation coefficient
(Kd) during the COVID19 shut down, were compared to baselines of the same water quality
indexes, calculated for the period 1995-2019. Comparison was primarily with box-and-whisker
plots. The box-and-whisker plot is a simple but powerful statistic as it shows the median, range,
the data distribution as well as serving as a graphical, nonparametric Analysis of Variance
(ANOVA).
The example in Figure 3 highlights the components of box-and-whisker plots. Turbidity
data from two sites, A and B, are compared with box-and-whisker plots. In a box-plot, the
center horizontal line of the box is the median of the dataset (the median is the value
separating the higher half from the lower half of a data sample). The top and bottom of the box
are the 75th and 25th percentiles, and the upper and lower ends of the whiskers are the 95th and
5th percentiles, respectively. The notches indicate the span of the confidence interval for the
median. When notches overlap, the median of the comparing distributions are not significantly
different at a given confidence level, here established as 5%. The software package used for the
Box-and-Whisker statistical calculations was StatView®.
An additional ANOVA tests to complement/validate StatView box-plot results was
performed with MINITAB 19® statistical software. This verification was necessary because of
the substantial differences in sample size and differences of variance, between pre-
Anthropause and Anthropause, for which conventional One-Way ANOVA used by StatView is
not very reliable.

11
Figure 3: Example of Box-plot. Center horizontal line is the median of the data, the top and bottom of the box are the 75th and 25th percentiles, and the upper and lower ends of the whiskers are the 95th and 5th percentiles. In this example the notches overlap, indicating the median of the comparing distributions are not significantly different
PRESENTATION & DISCUSSION OF RESULTS
The dataset was subdivided into two periods for comparison, Baseline and ShutDown.
Baseline includes all measurements performed since inception of the monitoring program in
1995 until December 2019 (24 years). ShutDown corresponds to all those measurements done
since March 2020, when the shutdown began, until December 2020.
Reef area
Figure 4 show the distribution of values for each period for Turbidity (TURB-S), dissolved
oxygen (DO-S), and temperature (TEMP-S) in surface waters, as well as light attenuation
coefficient (Kd), for the overall water column. As seen in Figure 4, the median (horizontal line
within box) for the ShutDown distributions south of Key West do not match those of the
Baseline, suggesting some deviation in 2020 from the “normal” of the previous 24 years.
Median turbidity in 2020 was lower than the median of previous years in surface and bottom
waters. Confidence interval (notches) for the median turbidity in surface waters do not overlap,
indicating the difference with Baseline is statistically significant. That would explain the
generalized perception of the citizens of Key West that waters were cleaner (less turbid) since
95th pctle
75th pctle
25th pctle
5th pctle
overlap
Median A
Median B

12
the shutdown began. Bottom turbidity was lower than Baseline in 2020, but the difference is
not statistically significant.
Figure 4: Box-plots of turbidity (TURB-S, NTU), light attenuation coefficient (Kd; m-1), dissolved oxygen (DO-S, mg L-1) and temperature (°C) for surface and bottom waters in reef areas south of Key West.
Likewise, median Kd for the ShutDown is smaller than the Baseline median, indicating
clearer waters during 2020. That said, Figure 4 also shows that the notches of the distributions
for Kd in Baseline and ShutDown overlap, indicating that the differences are not statistically
NTU
mg
/L°C
m-1
Reef
13
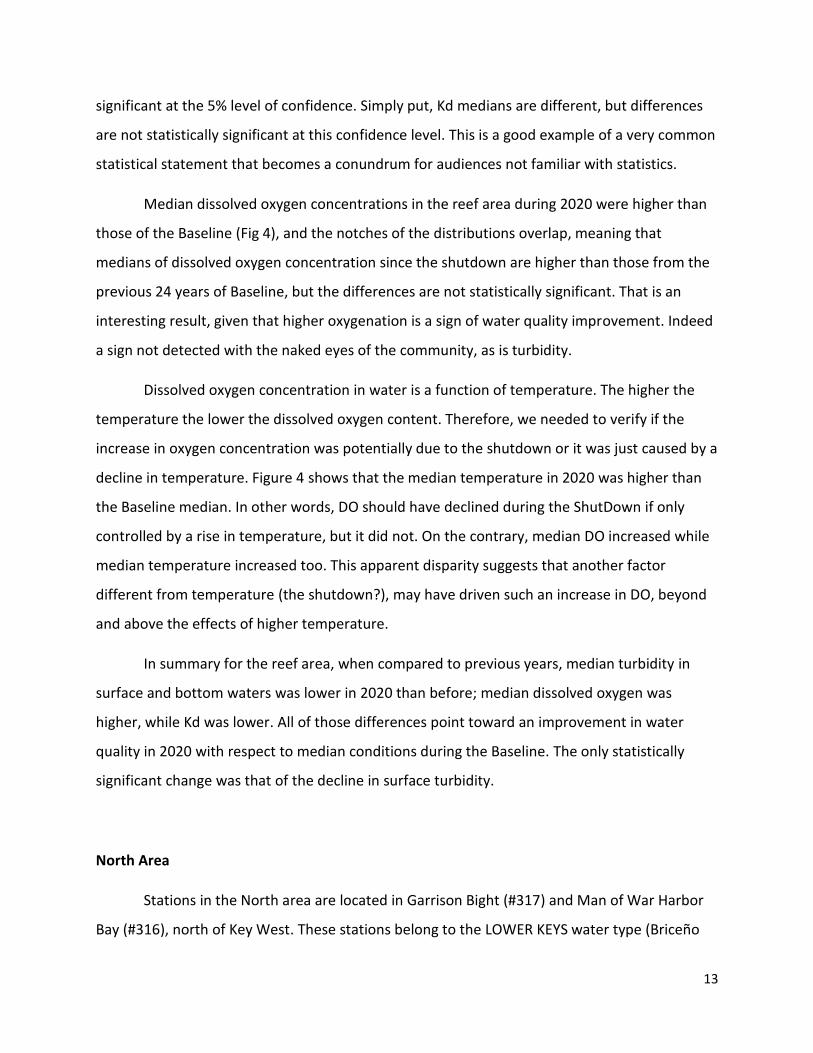
significant at the 5% level of confidence. Simply put, Kd medians are different, but differences
are not statistically significant at this confidence level. This is a good example of a very common
statistical statement that becomes a conundrum for audiences not familiar with statistics.
Median dissolved oxygen concentrations in the reef area during 2020 were higher than
those of the Baseline (Fig 4), and the notches of the distributions overlap, meaning that
medians of dissolved oxygen concentration since the shutdown are higher than those from the
previous 24 years of Baseline, but the differences are not statistically significant. That is an
interesting result, given that higher oxygenation is a sign of water quality improvement. Indeed
a sign not detected with the naked eyes of the community, as is turbidity.
Dissolved oxygen concentration in water is a function of temperature. The higher the
temperature the lower the dissolved oxygen content. Therefore, we needed to verify if the
increase in oxygen concentration was potentially due to the shutdown or it was just caused by a
decline in temperature. Figure 4 shows that the median temperature in 2020 was higher than
the Baseline median. In other words, DO should have declined during the ShutDown if only
controlled by a rise in temperature, but it did not. On the contrary, median DO increased while
median temperature increased too. This apparent disparity suggests that another factor
different from temperature (the shutdown?), may have driven such an increase in DO, beyond
and above the effects of higher temperature.
In summary for the reef area, when compared to previous years, median turbidity in
surface and bottom waters was lower in 2020 than before; median dissolved oxygen was
higher, while Kd was lower. All of those differences point toward an improvement in water
quality in 2020 with respect to median conditions during the Baseline. The only statistically
significant change was that of the decline in surface turbidity.
North Area
Stations in the North area are located in Garrison Bight (#317) and Man of War Harbor
Bay (#316), north of Key West. These stations belong to the LOWER KEYS water type (Briceño

14
and Boyer 2013), with higher nutrient, chlorophyll-a (CHLA) and Kd than reef waters. They are
different statistical populations. Both station receive an important contribution from the Gulf
Shelf and their nutrient concentrations and Kd are rather similar.
Box-and-whisker plots for Baseline and ShutDown for the northern area are in Figure 5.
Surface turbidity, was slightly higher in 2020 than before, but the difference with the Baseline is
non-significant (notches overlap). Likewise, Kd is slightly lower but the difference is not
statistically significant. Dissolved oxygen is a little higher in surface and bottom waters in year
2020, but differences with Baseline are non-significant. Finally, the slightly higher temperature
during the ShutDown is non-significant.
Figure 5: Box-plots of turbidity (TURB-S, NTU), light attenuation coefficient (Kd; m-1), dissolved oxygen (DO-S, mg L-1) and temperature (°C) for surface and bottom waters north of Key West (Garrison Bight and Man of War Bay).
mg/
L°C
m-1
NTU
NORTH
No data

15
MINITAB ANOVA Tests
An additional ANOVA tests to complement/validate StatView box-plot results was
performed with MINITAB 19® statistical software. This validation is necessary because the
substantial differences in sample size between Baseline (98 sampling events) and ShutDown
(four sampling events) as well as differences in variance, for which conventional One-Way
ANOVA is not totally reliable. MINITAB 19’s ANOVA uses Welch’s approach (Welch 1951; Moder
2010), which does not assume or require that the statistical samples have equal variances.
Furthermore, Welch’s test performs well with unequal variances, disregarding the sample sizes.
This test is performed on the mean, not the median as with the box-plots.
As shown in Table 1, surface mean turbidity during ShutDown (0.40 NTU) in the Reef
area is significantly smaller than that during Baseline (0.81 NTU), and the confidence intervals
do not overlap, so the difference is statistically significant. Mean surface turbidity in the north
area are very similar for Baseline and ShutDown and their confidence intervals overlap. In
summary surface turbidity declined significantly in reef areas during the shutdown, but there
were not significant changes in turbidity in stations north of Key West.
Results for Kd (Table 2) indicate that for the reef area, mean Kd during Baseline (0.21 m
-1) was significantly higher than mean Kd during the shutdown of year 2020 (0.13 m-1),
suggesting water clarity improvements. Changes in Kd north of Key West were not statistically
significant during Baseline and ShutDown.
Finally, Table 3 shows the results of the MINITAB 19 ANOVA test for mean dissolved
oxygen. There was a statistically significant increase in dissolved oxygen in reef stations, but no
change was observed in sites north of Key West.
In summary, Box-and-Whisker ANOVA on the median and MINITAB ANOVA test on the
mean lead to similar conclusions regarding direction of changes from Baseline to shutdown
periods. Significant declines in turbidity and light attenuation (Kd), and increase in dissolved

16
oxygen in reef sites, but not statistically significant changes in sites to the north in Garrison
Bight and Man of War Harbor.
Table 1: Results of ANOVA tests for Turbidity

17
Table 2: Results of ANOVA tests for Kd

18
Table 3: Results of ANOVA tests for Dissolved Oxygen
19
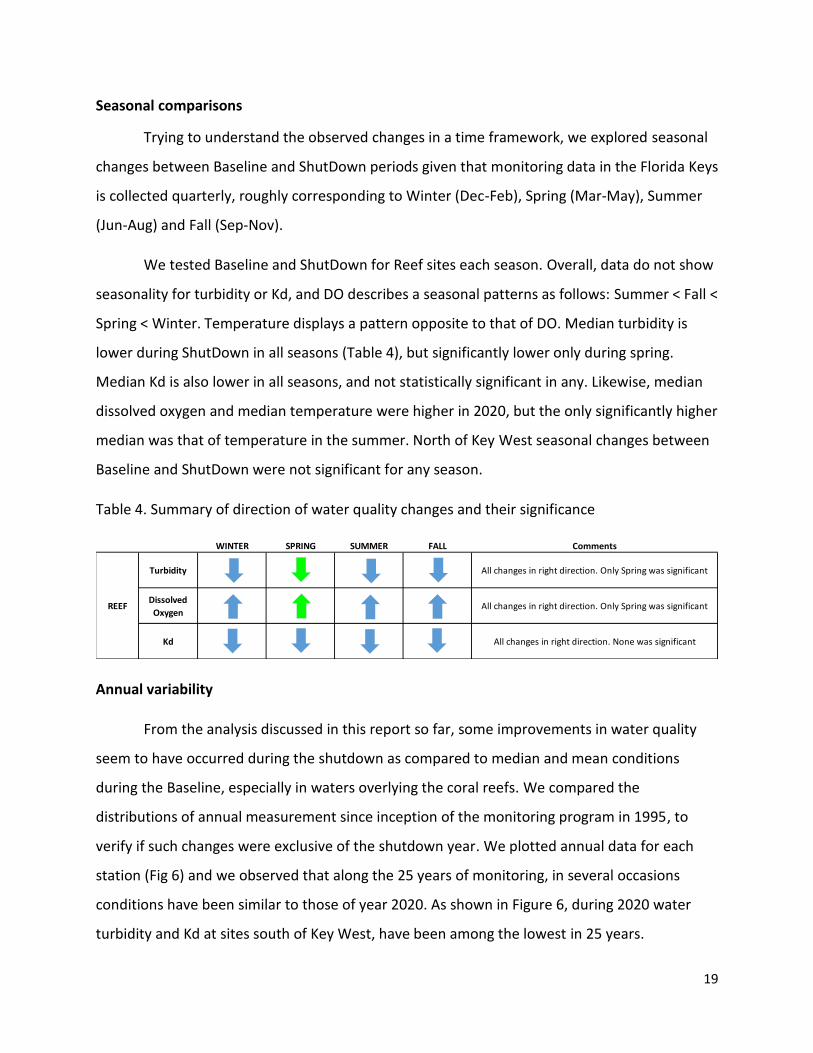
Seasonal comparisons
Trying to understand the observed changes in a time framework, we explored seasonal
changes between Baseline and ShutDown periods given that monitoring data in the Florida Keys
is collected quarterly, roughly corresponding to Winter (Dec-Feb), Spring (Mar-May), Summer
(Jun-Aug) and Fall (Sep-Nov).
We tested Baseline and ShutDown for Reef sites each season. Overall, data do not show
seasonality for turbidity or Kd, and DO describes a seasonal patterns as follows: Summer < Fall <
Spring < Winter. Temperature displays a pattern opposite to that of DO. Median turbidity is
lower during ShutDown in all seasons (Table 4), but significantly lower only during spring.
Median Kd is also lower in all seasons, and not statistically significant in any. Likewise, median
dissolved oxygen and median temperature were higher in 2020, but the only significantly higher
median was that of temperature in the summer. North of Key West seasonal changes between
Baseline and ShutDown were not significant for any season.
Table 4. Summary of direction of water quality changes and their significance
Annual variability
From the analysis discussed in this report so far, some improvements in water quality
seem to have occurred during the shutdown as compared to median and mean conditions
during the Baseline, especially in waters overlying the coral reefs. We compared the
distributions of annual measurement since inception of the monitoring program in 1995, to
verify if such changes were exclusive of the shutdown year. We plotted annual data for each
station (Fig 6) and we observed that along the 25 years of monitoring, in several occasions
conditions have been similar to those of year 2020. As shown in Figure 6, during 2020 water
turbidity and Kd at sites south of Key West, have been among the lowest in 25 years.
WINTER SPRING SUMMER FALL Comments
Turbidity All changes in right direction. Only Spring was significant
Dissolved
OxygenAll changes in right direction. Only Spring was significant
Kd All changes in right direction. None was significant
REEF

20
Figure 6: Annual comparison of turbidity and Kd, in waters around Key West since 1995. Year 2020 is among the lowest for turbidity and Kd, especially in the reef area (stations #275, #276, #278, #280 and #281). Turbidity and Kd at stations #316 and #317 are not especially different from other years since 1995.
275 275
276 276
278 278
280 280
281 281
316 316
317 317

21
Long-term trend
Changes from 2019 to 2020 around Key West must be framed within the general
variability of long-term changes region wide. The annual reports published by FIU for the Water
Quality Monitoring Program for the Florida Keys National Marine Sanctuary provide such a
regional long-term framework. Briceño and Boyer (2020) indicate that during the last 25 years
the greatest increases in DO occurred on the Atlantic side of the Keys, Marquesas, and in some
inshore areas on the Bay side (Fig 7). Likewise, water column turbidity (cloudiness) declined
throughout the FKNMS during the 25 year period (beneficial trend), especially around the
Marquesas. These changes also cascaded into a decline of the light attenuation coefficient Kd,
and an increase in light reaching the bottom, benefitting benthic communities.
Waters around Key West are in an extremely dynamic environment. It is the site of
mayor interaction of the Gulf Shelf, the Florida Current and the islands chain, as can be seen in
Figure 7. Those regional players may blur local changes very easily.
In order to downscale those regional trends to Key West surroundings, we performed
regression analysis for surface and bottom turbidity and DO, as well as Kd along the complete
period of record for stations #275. #276, #278, #280, #281, #316 and #317 (Fig. 2) to gain
insight on those long term trends. An example of the detailed tests performed on the time
series is in Figure 8 and a summary of results for all studied sites is on Figure 9. Most surface
turbidity has declined over the last 25 years south of Key West, but the drop has not been
statistically significant. North of Key West surface turbidity has increased long-term but without
statistical significance, either.
Likewise, bottom turbidity has increased south of Key West except at #281 where it
declined. Again, these changes have no statistical significance. Dissolved oxygen, on the other
hand, has increased at all stations in surface and bottom waters. Those DO changes have been
statistically significant for stations south of Key West, in coral reef waters. In summary, as
expected, those local changes follow very closely the regional pattern of change.

22
Figure 7. Total change in turbidity, light attenuation coefficient Kd, Bottom light and DO saturation, in surface waters of the Florida Keys National Marine Sanctuary the last 25-year period.

23
Figure 8: Regression analysis for long-term trend of surface turbidity at station #275
Figure 9: Tendency of 1995-2020 long-term trends at each study site. Arrow up= increase; arrow down=decline; green=significant; blue=non-significant
Kd
Station Surface Bottom Surface Bottom
275
276
278
280
281
316
317
Turbidity Dissolved Oxygen

24
Remote Sensing Data
Given that FIU monitoring is done quarterly we have had only four sampling events at
each station during the shutdown, which is a very small statistical sample. In order to increase
the observations through sampling frequency we resorted to remote sensing data from the
MODIS instrument (Moderate Resolution Imaging Spectroradiometer) onboard the Aqua and
Terra satellites. Those satellites provide view of the entire Earth’s surface every 1-2 days. We
selected data extraction sites at the same reef locations as FIU monitoring stations during 2019
and 2020 and an additional virtual buoy close to the Port of Key West (St 01) where no FIU site
exists ( Fig 9). Remote sensing data come from the Virtual Buoys Project at University of South
Florida’s Optical Oceanography Laboratory (https://optics.marine.usf.edu/projects/vbs.html)
kindly provided by Dr. Brian Barnes.
Figure 9. Location of virtual buoy stations for data extraction from MODIS data.
This initial assessment with virtual buoy data for this specific area was done only with
data for 2019 and 2020. Remote sensing data comes from MODIS instruments onboard satellite
platforms. Extracted data include Remote Sensing Reflectance at 645 nm (Rrs_645), used as a
proxy for in-water turbidity, and Kd_488, as a proxy for the multispectral diffuse attenuation

25
coefficient (Kd) derived from MODIS/Aqua measurements and validated against in situ Kd(488)
data (Hu et al 2004, 2013; Chen et al. 2010; Barnes et al 2013). Virtual buoys if located in clear
waters, usually need water columns deeper than 5 m (͠16.5 ft) to avoid signal contamination by
bottom reflectance. Therefore, water depth hinders the possibility of retrieving water column
data in shallower waters close to Key West.
Comparing Remote Sensing and FIU Field Data
First, we compared remote sensing time series with the available quarterly sampling
data from FIU monitoring program for 2019 and 2020 (Fig 10). Diagrams of Figure 10 indicate:
There is in general very good agreement between FIU Kd and USF estimates from
MODIS modkd_488
Initial Rrs_645 units are “per steradians” and values were converted to turbidity using
Chen et al (2010) equation as follows:
o turbidity = 1203.9 × Rrs(645)^1.087
Transformed values are within the range of FIU’s measured data (Fig 10), despite not
being collected on the same date.
In summary, satellite-derived data seems to match within the margins of acceptable error those
of the field measurements. Next would be to compare changes from 2019 to 2020 in satellite-
derived proxies for Kd and turbidity.

26
Figure 10. Comparison of remote sensing derived Kd (modkd_488) and turbidity (Rrs_654) with FIU field measurements. We plotted lines connecting points, only to help visualization.
0
2
4
6
8
10
12
14
16
18
20
Oct
-18
Dec
-18
Feb
-19
Ap
r-1
9
Jun
-19
Au
g-1
9
Oct
-19
Dec
-19
Jan
-20
Mar
-20
May
-20
Jul-
20
Sep
-20
No
v-2
0
Jan
-21
Mar
-21
St275 645 Rrs & FIU Turb
St275 646 Turb FIU Turb S FIU Turb B
0.00
0.20
0.40
0.60
0.80
1.00
1.20
1.40
Oct
-18
Dec
-18
Feb
-19
Ap
r-1
9
Jun
-19
Au
g-1
9
Oct
-19
Dec
-19
Jan
-20
Mar
-20
May
-20
Jul-
20
Sep
-20
No
v-2
0
Jan
-21
Mar
-21
Sta 276 Rrs645 & FIU Turb
Sta276 Rrs_645 Tur Sta 276 Turb B Sta 276 Turb S
0.00
2.00
4.00
6.00
8.00
10.00
12.00
Dec
-18
Feb
-19
Ap
r-1
9
Jun
-19
Au
g-1
9
Oct
-19
Dec
-19
Feb
-20
Ap
r-2
0
Jun
-20
Au
g-2
0
Oct
-20
Dec
-20
Feb
-21
Sta 278 Rrs 645 & FIU Turb
Rrs_645 Tur FIUTurb S FIUTurb B
0.00
0.50
1.00
1.50
2.00
2.50
3.00
Oct
-18
Dec
-18
Feb
-19
Ap
r-1
9
Jun
-19
Au
g-1
9
Oct
-19
Dec
-19
Jan
-20
Mar
-20
May
-20
Jul-
20
Sep
-20
No
v-2
0
Jan
-21
Mar
-21
Sta 280 Rrs 645 & FIU Turb
St280 Rrs_645 Tur FIUTurb S FIUTurb B
0.00
1.00
2.00
3.00
4.00
5.00
6.00
7.00
8.00
9.00
Oct
-18
Dec
-18
Feb
-19
Ap
r-1
9
Jun
-19
Au
g-1
9
Oct
-19
Dec
-19
Jan
-20
Mar
-20
May
-20
Jul-
20
Sep
-20
No
v-2
0
Jan
-21
Mar
-21
St281 Rrs_645& FIU Turb
St281 Rrs_646 FIUTurb S FIUTurb B

27
We explored changes in the remote sensing time-series and tested differences between
pre-shutdown (2019-Feb 2020) and COVID-ShutDown (March 2020-Dec 2020) using the regime-
shift detection method of Rodionov (2004; https://www.beringclimate.noaa.gov/regimes/).
Results shown in Fig 11 indicate:
Station St01: There were no significant changes in 2020 with respect to 2019 in Kd or
turbidity. Perhaps the incomplete time series does not allow for clear discrimination, if it
existed.
Station St275: There was a drop in modkd at station 275 starting in Jan 2020 and lasting
until October. Likewise, there was a drop in turbidity from Jan to Oct 2020.
Station St276: Kd and turbidity at Station 276 experienced declines in April 2020 and
extending to October 2020
Station St278: From January to December 2020, Kd at station 278 stayed about the
average of 2019 when multiple changes occurred. Turbidity dropped in March and
stayed low until October 2020
Station St280: Kd at Station 280 was lowest from April to early October 2020, but
turbidity in 2020 was high as compared to most of 2019
Station St281: Kd at station 281 clearly dropped from March to September 2020, and
turbidity followed suit starting in January 2020, and remaining low until late December
2020.
Most stations show drops in Kd (#275, #276, #280, #281) and/or turbidity (#275, #276,
#278, #281) in 2020 as compared to 2019. Breaks in the mean function derived from Rodionov
test are statistically significant. Two additional comments are necessary. First, in some
instances (stations #275, #278 and #281), the drop seems to begins in Jan 2020 before the
onset of shutdown, but after detailed observation of the data, it is clear the drops started in
March 2020 and the shift to January is an artifact of the regime-shift software (Fig 11). Second,
declines of turbidity and Kd from 2019 to 2020 as observed from MODIS data occurred, but
their magnitude was small in the studied reef stations.

28
Figure 11. Regime-shift (Rodionov 2005) for satellite-derived Kd (modKd_488) and turbidity
(Rrs_645) from virtual buoy sites on FIU reef stations.
0.000
0.020
0.040
0.060
0.080
0.100
0.120
0.140
0.160
0.180
0.200
Oct
-18
Dec-
18
Feb-
19
Apr-
19
Jun-
19
Aug-
19
Oct
-19
Dec-
19
Jan-
20
Mar
-20
May
-20
Jul-2
0
Sep-
20
Nov
-20
Jan-
21
Mar
-21
St276 modkd 488
St276 modkd 488 Mean
Kd drop
0
0.0002
0.0004
0.0006
0.0008
0.001
0.0012
0.0014
0.0016
0.0018
0.002
Oct
-18
Dec-
18
Feb-
19
Apr-
19
Jun-
19
Aug-
19
Oct
-19
Dec-
19
Jan-
20
Mar
-20
May
-20
Jul-2
0
Sep-
20
Nov
-20
Jan-
21
Mar
-21
Sta276 Rrs_645
Sta276 Rrs_645 Mean
Turbidity drop
0
0.1
0.2
0.3
0.4
0.5
0.6
Oct
-18
Dec-
18
Feb-
19
Apr-
19
Jun-
19
Aug-
19
Oct
-19
Dec-
19
Jan-
20
Mar
-20
May
-20
Jul-2
0
Sep-
20
Nov
-20
Jan-
21
Mar
-21
St278 modkd 488
St278 modkd 488 Mean
-0.004
-0.002
0
0.002
0.004
0.006
0.008
0.01
0.012
0.014
Oct
-18
Dec-
18
Feb-
19
Apr-
19
Jun-
19
Aug-
19
Oct
-19
Dec-
19
Jan-
20
Mar
-20
May
-20
Jul-2
0
Sep-
20
Nov
-20
Jan-
21
Mar
-21
St278 Rrs_645
St278 Rrs_645 Mean
Turbidity dropNo change
-0.002
-0.001
0
0.001
0.002
0.003
0.004
Oct
-18
Dec-
18
Feb-
19
Apr-
19
Jun-
19
Aug-
19
Oct
-19
Dec-
19
Jan-
20
Mar
-20
May
-20
Jul-2
0
Sep-
20
Nov
-20
Jan-
21
Mar
-21
St280 Rrs_645
St280 Rrs_645 Mean
Turbidity increase
0
0.05
0.1
0.15
0.2
0.25
0.3
Oct
-18
Dec-
18
Feb-
19
Apr-
19
Jun-
19
Aug-
19
Oct
-19
Dec-
19
Jan-
20
Mar
-20
May
-20
Jul-2
0
Sep-
20
Nov
-20
Jan-
21
Mar
-21
St280 modkd 488
St280 modkd 488 Mean
Kd drop
0
0.1
0.2
0.3
0.4
0.5
0.6
Oct
-18
Dec-
18
Feb-
19
Apr-
19
Jun-
19
Aug-
19
Oct
-19
Dec-
19
Jan-
20
Mar
-20
May
-20
Jul-2
0
Sep-
20
Nov
-20
Jan-
21
Mar
-21
St281 modkd_488
St281 modkd_488 Mean
Kd drop
0
0.002
0.004
0.006
0.008
0.01
0.012
Oct
-18
Dec-
18
Feb-
19
Apr-
19
Jun-
19
Aug-
19
Oct
-19
Dec-
19
Jan-
20
Mar
-20
May
-20
Jul-2
0
Sep-
20
Nov
-20
Jan-
21
Mar
-21
St281 Rrs_645
St281 Rrs_645 Mean
Turbidity drop
0
0.1
0.2
0.3
0.4
0.5
0.6
0.7
0.8
Dec-
18
Feb-
19
Apr-
19
Jun-
19
Aug-
19
Oct
-19
Dec-
19
Jan-
20
Mar
-20
May
-20
Jul-2
0
Sep-
20
Nov
-20
Jan-
21
St 275 modkd 488
St275 488 Mean
Kd drop
-0.002
0
0.002
0.004
0.006
0.008
0.01
0.012
0.014
0.016
0.018
Dec-
18
Feb-
19
Apr-
19
Jun-
19
Aug-
19
Oct
-19
Dec-
19
Jan-
20
Mar
-20
May
-20
Jul-2
0
Sep-
20
Nov
-20
Jan-
21
Mar
-21
St275 Rsr 645
St275 Rsr 645 Mean
Turbidity drop
-0.004
-0.002
0
0.002
0.004
0.006
0.008
0.01
Dec-
18
Feb-
19
Apr-
19
Jun-
19
Aug-
19
Oct
-19
Dec-
19
Jan-
20
Mar
-20
May
-20
Jul-2
0
Sep-
20
St01 Rrs645
St01 Rrs645 Mean
No detected change
0
0.1
0.2
0.3
0.4
0.5
0.6
0.7
Dec-
18
Feb-
19
Apr-
19
Jun-
19
Aug-
19
Oct
-19
Dec-
19
Jan-
20
Mar
-20
May
-20
Jul-2
0
Sep-
20
St01 modKd 488
St01 modKd 488 Mean
No detected change

29
REFERENCES
Barnes, B. B., C. Hu, B. A. Schaeffer, Z. Lee, D. A. Palandro, & J. C. Lehrter (2013) MODIS-derived
spatiotemporal water clarity patterns in optically shallow Florida Keys waters: A new
approach to remove bottom contamination. Remote Sens. Environ., 134:377-391.
Briceño, H. and J. Boyer. 2009. Little Venice Water Quality Monitoring Project: Final Report. US-
Report submitted by Florida International University Southeast Environmental Research
Center to EPA Region 4 Science and Ecosystem Support Division. 81 p.
Briceño, H. and J. Boyer. 2020. 25 YEARS OF WATER QUALITY MONITORING IN THE FLORIDA
KEYS NATIONAL MARINE SANCTUARY. Annual Report of the Water Quality Monitoring
Project for the Florida Keys National Marine Sanctuary. EPA Agreement #X7-00049716.
974T from the Southeast Environmental Research Center in the Institute of Environment
at Florida International University
Briceño, Henry, Joseph N. Boyer, Joffre Castro and Peter Harlem. 2013. Biogeochemical
classification of South Florida estuarine and coastal waters. Marine Pollution Bulletin
Volume 75, Issues 1–2, 15 October 2013, Pages 187-204
Chen, Z., C. Hu, F.E. Muller-Karger and M Luther. 2010. Short-term variability of suspended
sediment and phytoplankton in Tampa Bay, Florida: Observations from a coastal
oceanographic tower and ocean color satellites. Estuarine Coastal and Shelf Science
89(1):62-72
Forti, Lucas, Hilton Japyassu, Jaime Bosch and Judit Szabo. 2020. Ecological inheritance for a
post COVID-19 World. Biodivers Conserv. 2020 Aug 13 : 1–4. doi: 10.1007/s10531-020-
02036-z
Frost, Jim. 2021. Benefits of Welch’s ANOVA Compared to the Classic One-Way ANOVA.
https://statisticsbyjim.com/anova/welchs-anova-compared-to-classic-one-way-anova/
Hu, Chuanmin, Brian B. Barnes, Brock Murch, Paul R. Carlson. 2013. Satellite-based virtual buoy
system to monitor coastal water quality. Optical Engineering, 53(5), 051402 (2013).
https://doi.org/10.1117/1.OE.53.5.051402
Hu, Chuanmin, Zhiqiang Chena, Tonya D. Claytonb, Peter Swarzenskib, John C. Brockb, Frank E.
Muller-Karger. 2004. Assessment of estuarine water-quality indicators using MODIS
medium-resolution bands: Initial results from Tampa Bay, FL. Remote Sensing of
Environment 93, 423–441
Kirk, J. T. O. 1994. Light and Photosynthesis in Aquatic Ecosystems, 2nd edition. Cambridge
University Press, Cambridge, U.K.
Manenti, Raoul, Emiliano Mori, Viola Di Canio, Silvia Mercurio, Marco Picone, Mario Caffi,
Mattia Brambilla, Gentile Francesco Ficetola and Diego Rubolini.2020. The good, the bad
30
and the ugly of COVID-19 lockdown effects on wildlife conservation: Insights from the
first European locked down country. Biol Conserv. 2020 Sep; 249: 108728.
doi: 10.1016/j.biocon.2020.108728
Moder, K. (2010). Alternatives to F-Test in One Way ANOVA in case of heterogeneity
of variances (a simulation study). Psychological Test and Assessment Modeling, Volume
52, 2010 (4), 343-353
Murray, Thomas J. 2005. The Impacts of the Cruise ship Industry on the Quality of Life in Key
West. City of Key West Naval Properties Local Redevelopment Authority. Thomas J.
Murray & Associates, Inc. RFQ No: 04-001
Rodionov, S.N., and J.E. Overland, 2005: Application of a sequential regime shift detection
method to the Bering Sea ecosystem. ICES J. Mar. Sci., 62: 328-332.
Rutz, Christian, Matthias-Claudio Loretto, Amanda E. Bates, Sarah C. Davidson, Carlos M.
Duarte, Walter Jetz, Mark Johnson, Akiko Kato, Roland Kays, Thomas Mueller, Richard B.
Primack, Yan Ropert-Coudert, Marlee A. Tucker, Martin Wikelski and Francesca
Cagnacci. 2020. COVID-19 lockdown allows researchers to quantify the effects of human
activity on wildlife. Nature Ecology and Evolution, Vol 4 , 1156–1159.
Rume, Tanjena and S.M. Didar-Ul Islam. 2020. Environmental effects of COVID-19 pandemic and
potential strategies of sustainability Heliyon. 6(9): e04965.
doi: 10.1016/j.heliyon.2020.e04965
Welch, B. L. (1951). "On the Comparison of Several Mean Values: An Alternative Approach".
Biometrika. 38 (3/4): 330–336. doi:10.2307/2332579. JSTOR 2332579.