Embed Size (px)
Citation preview
Preliminary Analysis of the ChinchillaBlast Overpressure Data
Preliminary Analysis of the ChinchillaBlast Overpressure Data
William J. Murphy
Amir Khan
Peter B. ShawHearing Loss Prevention Section
Division of Applied Research and Technology
National Institute for Occupational Safety and Health
September 29,2008
William J. Murphy
Amir Khan
Peter B. ShawHearing Loss Prevention Section
Division of Applied Research and Technology
National Institute for Occupational Safety and Health
September 29,2008
The results reported in this paper represent the opinions of the authors and are not representative of the policies of the
National Institute for Occupational Safety and Health.
The results reported in this paper represent the opinions of the authors and are not representative of the policies of the
National Institute for Occupational Safety and Health.
2
OutlineOutline Summary of Exposures
Spectrum
Interstimulus Interval
Level
Exposure Metrics
MilStd 1474D
LAeq8hr Unprotected
AHAAH Warned & Unwarned
Pfander
Smoorenburg
Summary of Exposures
Spectrum
Interstimulus Interval
Level
Exposure Metrics
MilStd 1474D
LAeq8hr Unprotected
AHAAH Warned & Unwarned
Pfander
Smoorenburg
3
Statistical Analysis of BOP DataStatistical Analysis of BOP Data
Statistical model for effects threshold
Linear Mixed Effects Models
Statistical Fits
Questions to consider for the analysis
Trading Ratios?
Log(AHAAH)
Frequency Dependency
Statistical model for effects threshold
Linear Mixed Effects Models
Statistical Fits
Questions to consider for the analysis
Trading Ratios?
Log(AHAAH)
Frequency Dependency
4
101
102
-70
-60
-50
-40
-30
-20
-10
0
10
Frequency (kHz)
Wel
ch P
ower
Spe
ctra
l Den
sity
Est
imat
eP
ower
/fre
quen
cy (
dB/H
z)
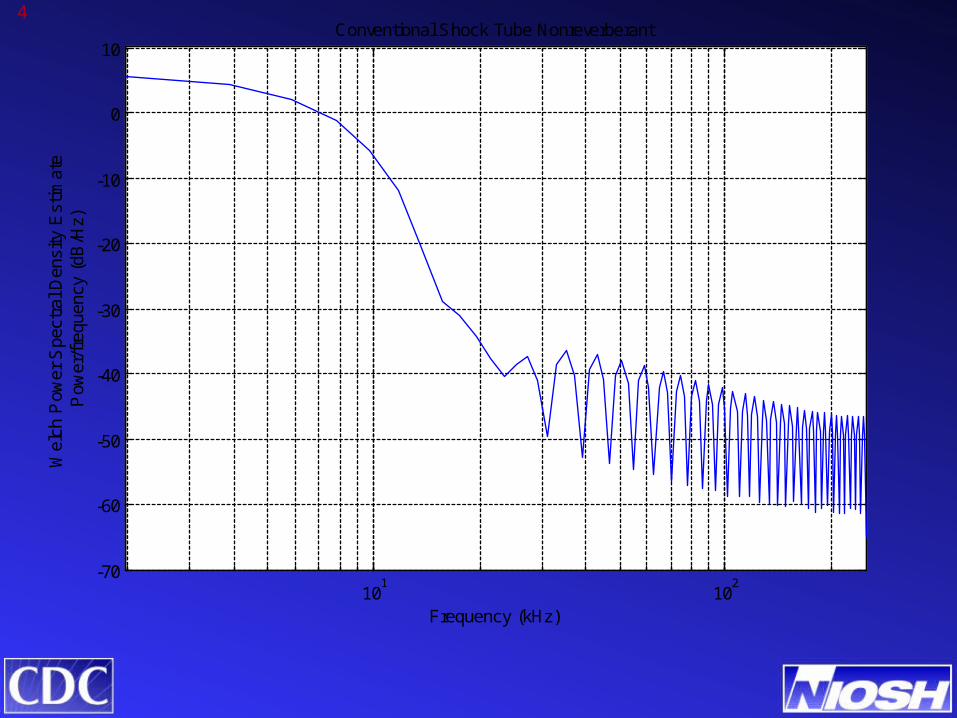
Conventional Shock Tube Nonreverberant
5
101
102
-45
-40
-35
-30
-25
-20
-15
-10
-5
Frequency (kHz)
Wel
ch P
ower
Spe
ctra
l Den
sity
Est
imat
eP
ower
/fre
quen
cy (
dB/H
z)
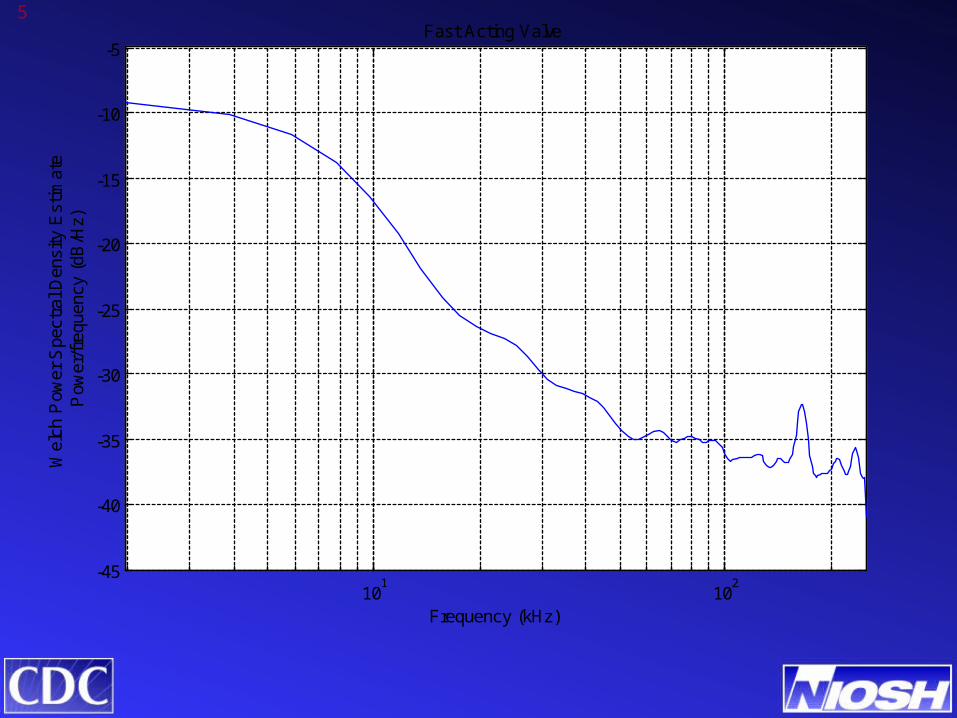
Fast Acting Valve
6
101
102
-40
-35
-30
-25
-20
-15
-10
Frequency (kHz)
Wel
ch P
ower
Spe
ctra
l Den
sity
Est
imat
eP
ower
/fre
quen
cy (
dB/H
z)
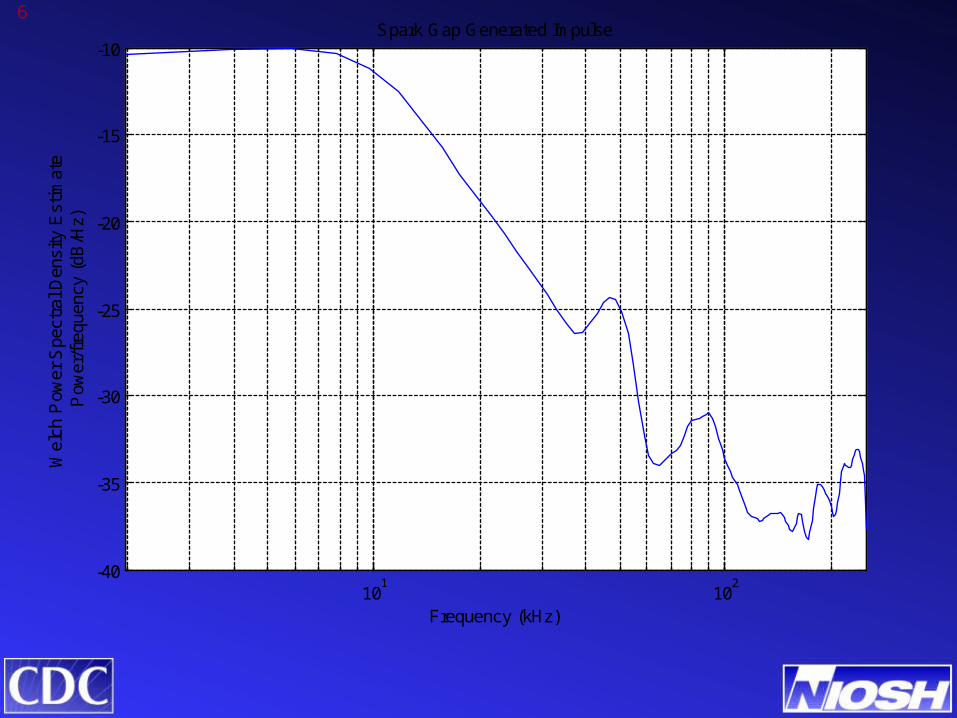
Spark Gap Generated Impulse
7
10-1
100
101
-70
-60
-50
-40
-30
-20
-10
0
10
Frequency Hz
Welc
h P
ow
er
Spectr
al D
ensity E
stim
ate
Pow
er/
Fre
quency (
dB
/Hz)
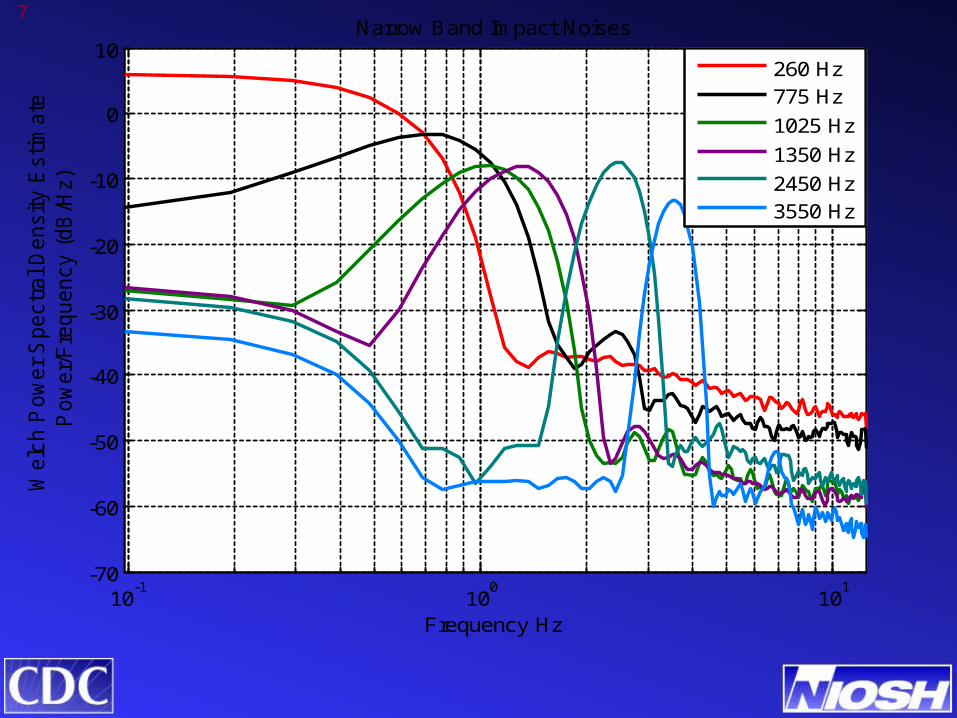
Narrow Band Impact Noises
260 Hz775 Hz
1025 Hz
1350 Hz
2450 Hz3550 Hz

8
500
2000
8000
140
150
160
170
180
190-10
0
10
20
30
40
50
60
70
80
90
Frequency (Hz)
Temporary Threshold Shift vs MIL-STD-1474D
MIL-STD-1474D (dB)
Tem
pora
ry T
hres
hold
Shi
ft (
dB)
9
500
2000
8000
120
140
160
180
200-10
0
10
20
30
40
50
60
70
80
90
Frequency (Hz)
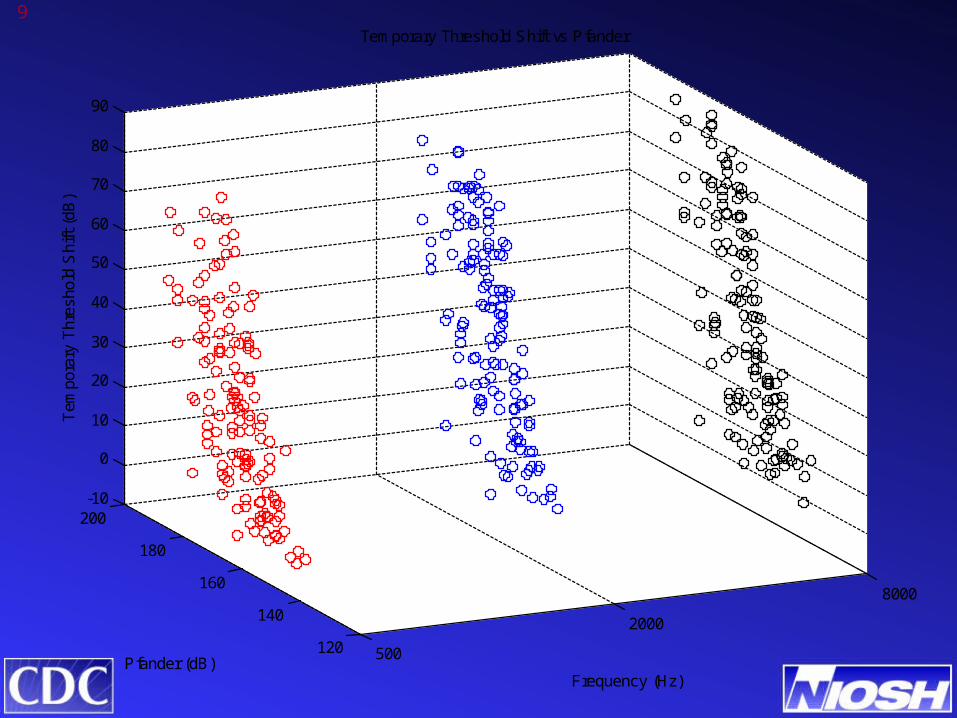
Temporary Threshold Shift vs Pfander
Pfander (dB)
Tem
pora
ry T
hres
hold
Shi
ft (
dB)

10
500
2000
8000
140
150
160
170
180
190-10
0
10
20
30
40
50
60
70
80
90
Frequency (Hz)
Temporary Threshold Shift vs Smoorenburg
Smoorenburg (dB)
Tem
pora
ry T
hres
hold
Shi
ft (
dB)
11
500
2000
8000
100
102
104
106
-10
0
10
20
30
40
50
60
70
80
90
Frequency (Hz)
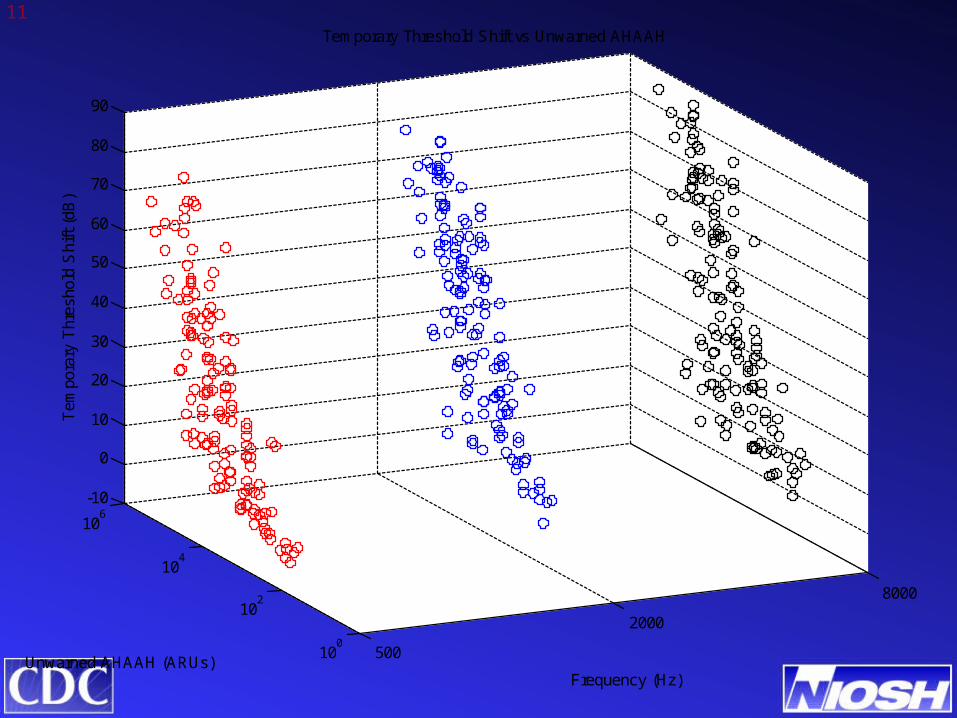
Temporary Threshold Shift vs Unwarned AHAAH
Unwarned AHAAH (ARUs)
Tem
pora
ry T
hres
hold
Shi
ft (
dB)
12
500
2000
8000
100
105
-10
0
10
20
30
40
50
60
70
80
90
Frequency (Hz)
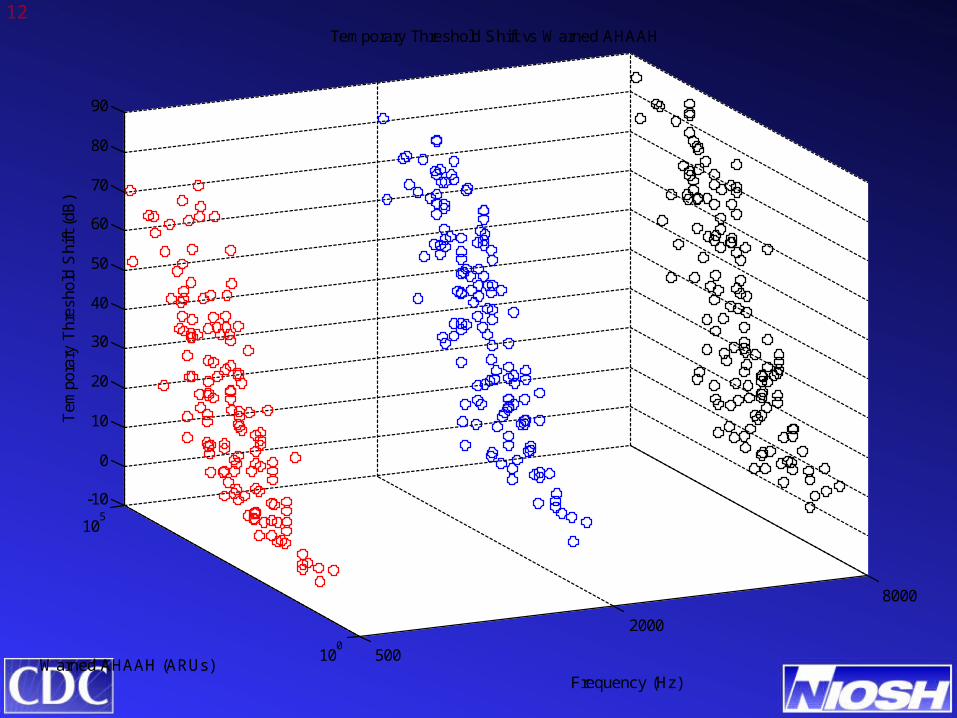
Temporary Threshold Shift vs Warned AHAAH
Warned AHAAH (ARUs)
Tem
pora
ry T
hres
hold
Shi
ft (
dB)
13
500
2000
8000
100
110
120
130
140
150-10
0
10
20
30
40
50
60
70
80
90
Frequency (Hz)
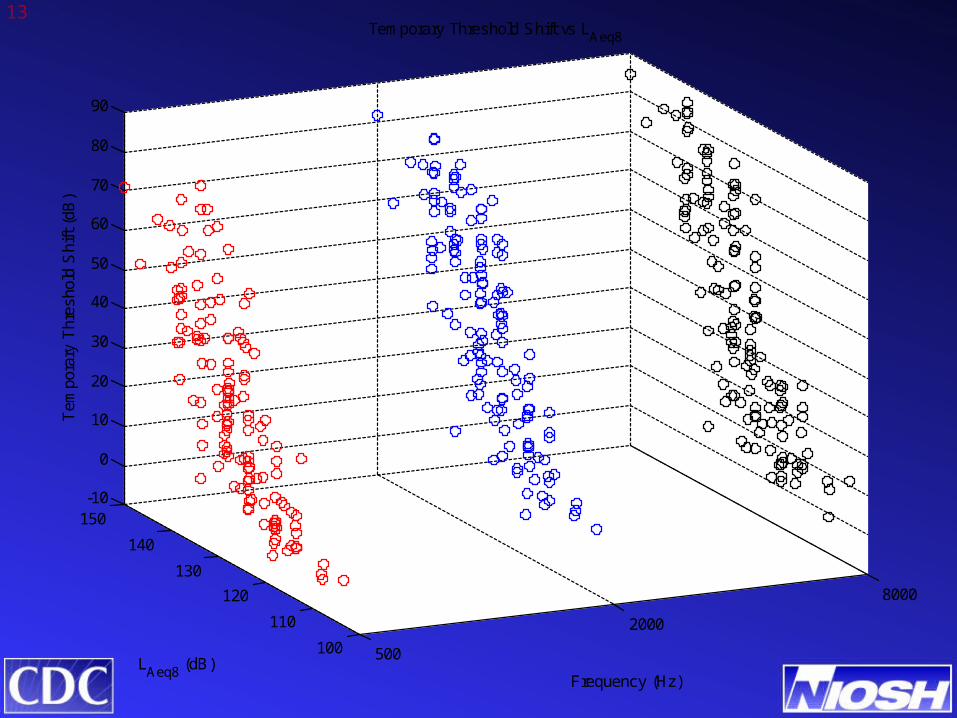
Temporary Threshold Shift vs LAeq8
LAeq8
(dB)
Tem
pora
ry T
hres
hold
Shi
ft (
dB)
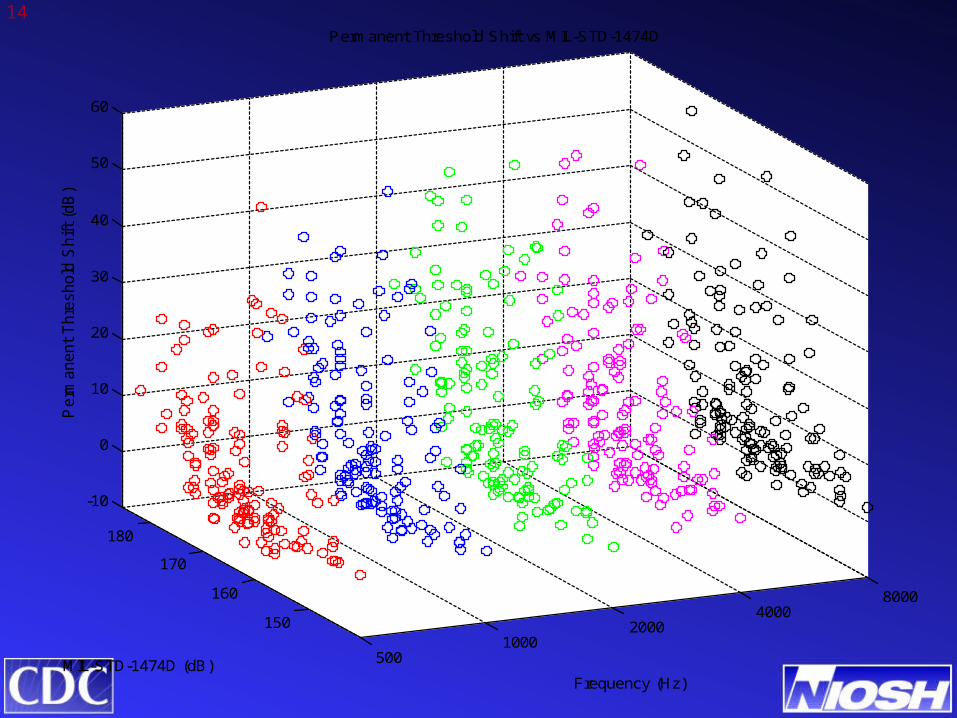
14
5001000
20004000
8000
150
160
170
180
-10
0
10
20
30
40
50
60
Frequency (Hz)
Permanent Threshold Shift vs MIL-STD-1474D
MIL-STD-1474D (dB)
Perm
anent
Thre
shold
Shift
(dB
)

15
5001000
20004000
8000
120
140
160
180
200-10
0
10
20
30
40
50
60
Frequency (Hz)
Permanent Threshold Shift vs Pfander
Pfander (dB)
Perm
anent
Thre
shold
Shift
(dB
)
16
5001000
20004000
8000
150
160
170
180
-10
0
10
20
30
40
50
60
Frequency (Hz)
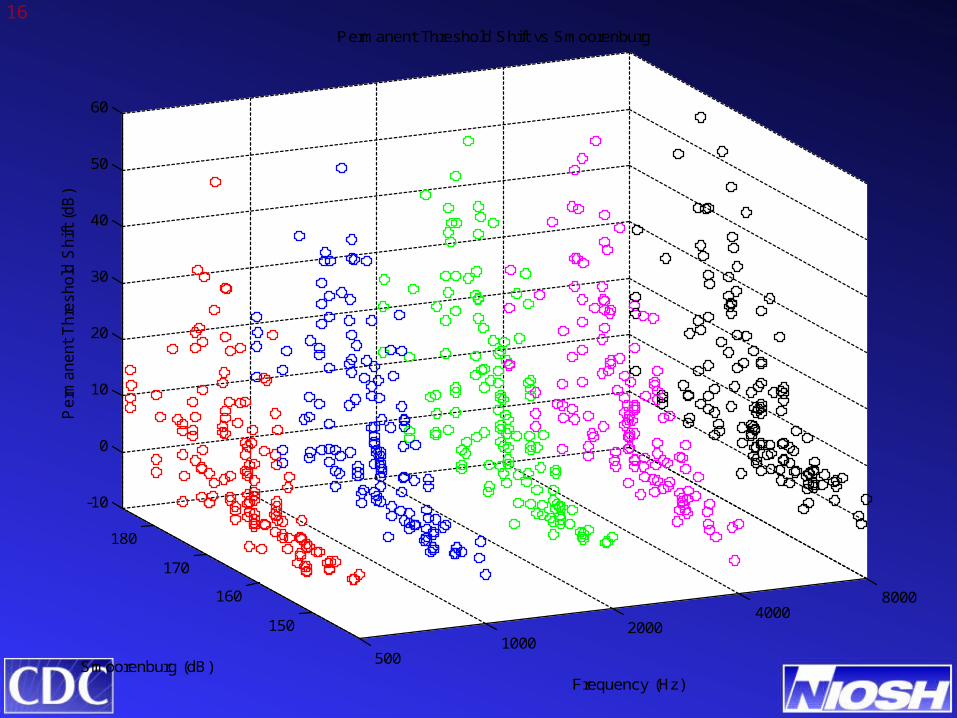
Permanent Threshold Shift vs Smoorenburg
Smoorenburg (dB)
Perm
anent
Thre
shold
Shift
(dB
)
17
5001000
20004000
8000
100
105
-10
0
10
20
30
40
50
60
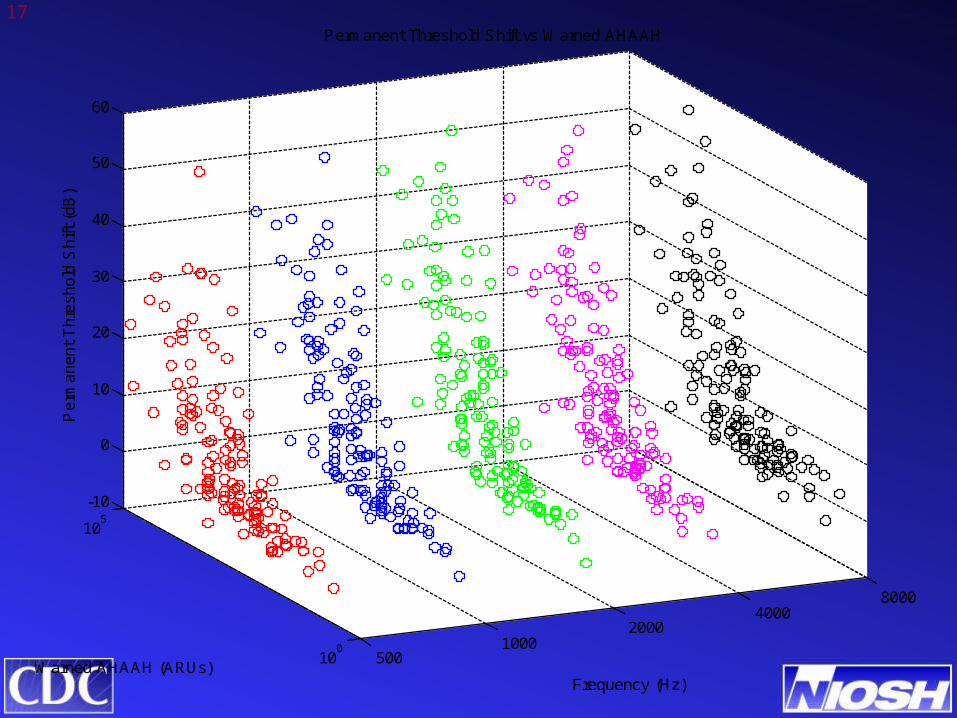
Frequency (Hz)
Permanent Threshold Shift vs Warned AHAAH
Warned AHAAH (ARUs)
Perm
anent
Thre
shold
Shift
(dB
)
18
5001000
20004000
8000
100
102
104
106
-10
0
10
20
30
40
50
60
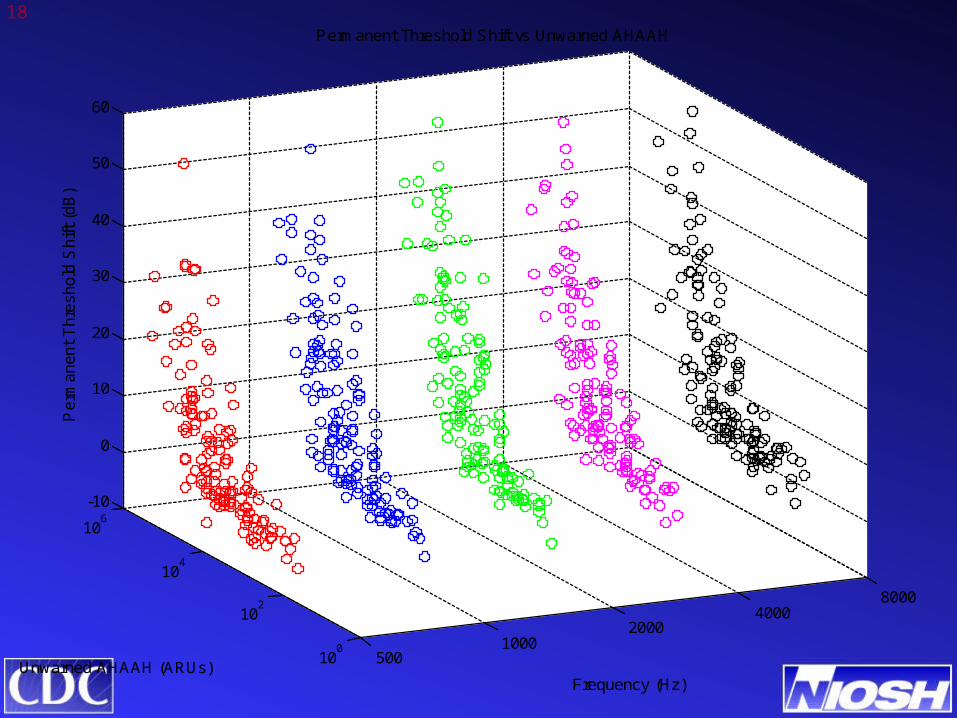
Frequency (Hz)
Permanent Threshold Shift vs Unwarned AHAAH
Unwarned AHAAH (ARUs)
Perm
anent
Thre
shold
Shift
(dB
)

19
5001000
20004000
8000
100
110
120
130
140
150-10
0
10
20
30
40
50
60
Frequency (Hz)
Permanent Threshold Shift vs LAeq8
LAeq8
(dB)
Perm
anent
Thre
shold
Shift
(dB
)
20
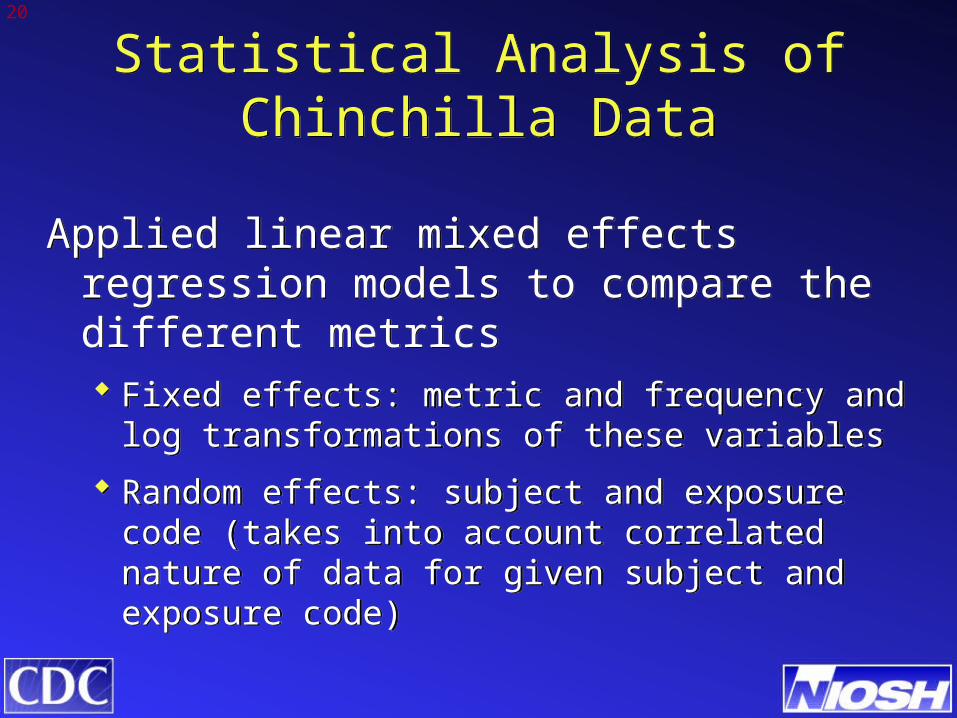
Applied linear mixed effects regression models to compare the different metrics
Fixed effects: metric and frequency and log transformations of these variables
Random effects: subject and exposure code (takes into account correlated nature of data for given subject and exposure code)
Applied linear mixed effects regression models to compare the different metrics
Fixed effects: metric and frequency and log transformations of these variables
Random effects: subject and exposure code (takes into account correlated nature of data for given subject and exposure code)
Statistical Analysis of Chinchilla Data
Statistical Analysis of Chinchilla Data
21
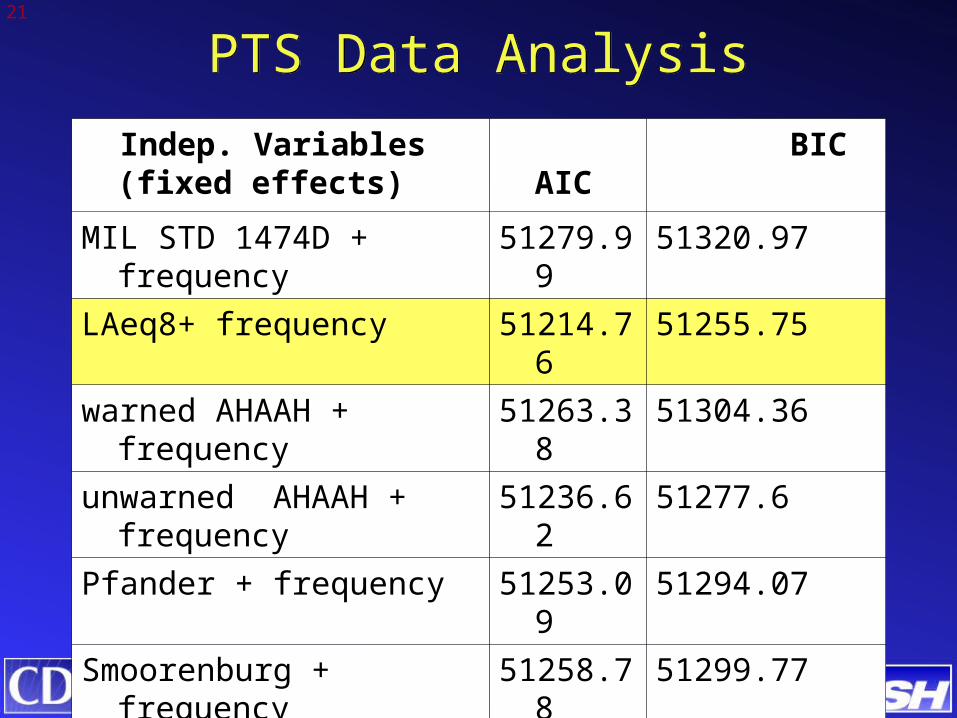
PTS Data AnalysisPTS Data Analysis
Indep. Variables (fixed effects)
AIC BIC
MIL STD 1474D + frequency 51279.99 51320.97
LAeq8+ frequency 51214.76 51255.75
warned AHAAH + frequency 51263.38 51304.36
unwarned AHAAH + frequency
51236.62 51277.6
Pfander + frequency 51253.09 51294.07
Smoorenburg + frequency 51258.78 51299.77
25
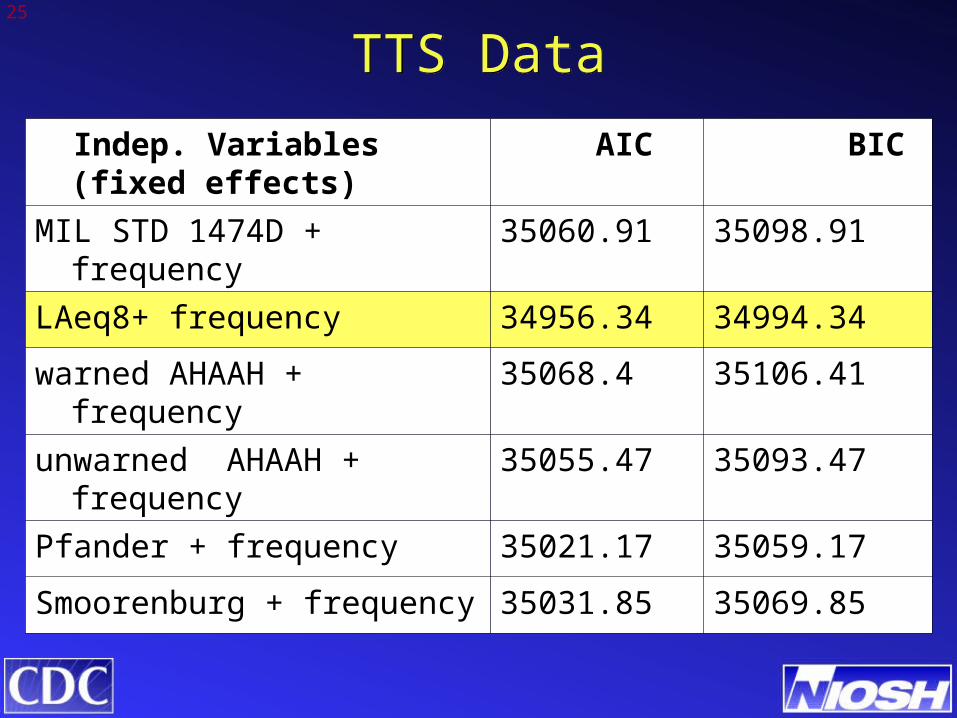
TTS DataTTS Data
Indep. Variables (fixed effects) AIC BIC
MIL STD 1474D + frequency 35060.91 35098.91
LAeq8+ frequency 34956.34 34994.34
warned AHAAH + frequency 35068.4 35106.41
unwarned AHAAH + frequency 35055.47 35093.47
Pfander + frequency 35021.17 35059.17
Smoorenburg + frequency 35031.85 35069.85
29
Preliminary FindingsPreliminary Findings
LAeq8 provides the best fit to the TTS data of the competing metrics.
Unwarned AHAAH tends to provide the best fit to the PTS data after a log(AHAAH) transformation.
LAeq8 provides the best fit to the TTS data of the competing metrics.
Unwarned AHAAH tends to provide the best fit to the PTS data after a log(AHAAH) transformation.
30
Discussion TopicsDiscussion Topics
Utility of providing a transformation of AHAAH estimates.
Sampling Rate questions for all models.
Frequency dependency for the models.
AHAAH model may have predictive capability for frequency that other models do not.
Should we pursue finding best trading ratios?
10 log(N), 5 log(N), x log(N)
Utility of providing a transformation of AHAAH estimates.
Sampling Rate questions for all models.
Frequency dependency for the models.
AHAAH model may have predictive capability for frequency that other models do not.
Should we pursue finding best trading ratios?
10 log(N), 5 log(N), x log(N)
31
Discussion topicsDiscussion topics
What outcome variable is the most useful here?
Are we interested in developing a better model to fit the data or just existing models?
What outcome variable is the most useful here?
Are we interested in developing a better model to fit the data or just existing models?