Embed Size (px)
Citation preview

Instructions for use
Title Predominance of clonal reproduction, but recombinant origins of new genotypes in the free-floating aquatic bladderwortUtricularia australis f. tenuicaulis (Lentibulariaceae)
Author(s) Kameyama, Yoshiaki; Ohara1, Masashi
Citation Journal of Plant Research, 119(4), 357-362https://doi.org/10.1007/s10265-006-0282-2
Issue Date 2006-07
Doc URL http://hdl.handle.net/2115/14628
Rights The original publication is available at www.springerlink.com
Type article (author version)
File Information JPR2006-119-4.pdf
Hokkaido University Collection of Scholarly and Academic Papers : HUSCAP

Corresponding author:
YOSHIAKI KAMEYAMA
Graduate School of Environmental Earth Science, Hokkaido University, Kita 10, Nishi 5, Sapporo, Hokkaido 060-0810, Japan
e-mail: [email protected] fax: +81-11-706-4954 phone: +81-11-706-2267

2
Predominance of Clonal Reproduction, but Recombinant Origins of New Genotypes in the Free-Floating Aquatic Bladderwort Utricularia australis f. tenuicaulis (Lentibulariaceae)
YOSHIAKI KAMEYAMA AND MASASHI OHARA
Section of Environmental Biology, Graduate School of Environmental Earth Science, Hokkaido University, Sapporo, Hokkaido 060-0810, Japan
削除: Effects
削除: Sexual and
削除: on Population Genetic Structure
3
Abstract
Aquatic plant is a biological group sharing several adaptations to aquatic conditions. The most striking
evolutionary convergence in this group is the extensive reliance on clonal reproduction, which largely
determine the patterns and process of evolution in aquatic plants. Utricularia australis f. tenuicaulis is a
free-floating aquatic bladderwort that reproduces both sexually via seeds and clonally via turions and
shoot fragments. Amplified fragment length polymorphism analysis was conducted on 267 ramets
collected from 30 populations in Japan. The genotypic diversity within populations was extremely low
regardless of the geographical distribution range: the mean number of genotypes per population (G) was
1.4 and the mean genotypic diversity (D), including monoclonal populations, was 0.17. In contrast to the
predominance of a few clones within populations, many of the populations investigated had different
genotypes; a large portion of the genetic variation was explained by variation among populations.
Character compatibility analysis clearly revealed that somatic mutations did not contribute to the origin of
genotypic diversity in this aquatic bladderwort; instead, rare to sporadic sexual reproduction likely
generated new genotypes. Thus, future studies should examine the role of sexual reproduction in this
species from the viewpoint of long-term evolutionary benefits.
Key words: AFLP, aquatic plant, character compatibility analysis, genotypic
diversity,sexual and clonal reproduction, somatic mutation.
削除: aquatic plants
削除: and the high dispersal ability of clonal offspring, which is considered to reduce the selective disadvantage of asexual reproduction and to largely determine the genetic structure of aquatic plants
削除: A strong correlation existed between genets distributed within 150 km of one another. The long-distance dispersal of clonal offspring was evidenced by the same genotypes existing across populations several to several tens of kilometers apart. C
削除: , spatial autocorrelation
4
Introduction
As a biological group, aquatic plants share several adaptations to aquatic conditions,
such as a reduction in vascular tissue and highly polymorphic vegetative forms (Les and
Philbrick 1993; Philbrick and Les 1996). One of the most striking cases of convergence
in this group is the extensive reliance on clonal reproduction (Grace 1993; Les and
Philbrick 1993). For example, some forms of clonal offspring, such as turions, winter
buds, and shoot fragments are highly effective means of numerical increase, resource
acquisition, and dispersal under aquatic conditions (Grace 1993; Les and Philbrick
1993), which largely determine the patterns and process of evolution in aquatic plants
(Barrett et al. 1993).
Utricularia australis R. Br. (Lentibulariaceae) is a free-floating aquatic
bladderwort widely distributed in temperate and tropical regions (Taylor 1989). In spite
of its widespread distribution, this taxon displays almost complete sterility (Taylor
1989). A fertile group has been observed only in Japan, where U. australis is classified
into two forma: sterile U. australis f. australis and fertile U. australis f. tenuicaulis
(Komiya and Shibata 1980; Taylor 1989; but see also Kadono 1994). The taxonomic
and phylogenetic relationships between U. australis and its two forma distributed in
Japan, U. australis f. australis and U. australis f. tenuicaulis, remain unclear. However,
it has been clearly demonstrated that (1) U. australis f. australis is a diploid hybrid that
originated by asymmetric hybridization between U. australis f. tenuicaulis (mostly as
the female parent) and its close relative U. macrorhiza; and (2) the absence of post-F1
generation in natural hybrid population is confirmed by the additive patterns of AFLP
bands (Kameyama et al. 2005).
Clonal reproduction plays a dominant role for the establishment of sterile U.
australis f. australis, because propagation of this hybrid depends solely on clonal
offspring in the form of many turions and shoot fragments. In contrast, the two parental
species, U. australis f. tenuicaulis and U. macrorhiza, use both of these forms of clonal
reproduction as well as sexual reproduction via seed. Thus, population genetic structure
of these parental species is determined by the balance of the two reproductive modes:
sexual and clonal reproduction.
書式変更: インデント : 最初の行 : 35.4 pt
削除: , which influences the patterns and process of evolution in aquatic plants
削除: Barrett et al. 1993;
5
In flowering plants, the balance of sexual and clonal reproduction can vary
widely across geographical range. For example, sexual reproduction in a clonal plant
Decodon verticillatus at the northern periphery of the geographical range is severely
reduced due to both ecological and genetic factors (Dorken and Eckert 2001; Eckert
2002). Population genetic structure of clonal plants, therefore, should be examined
across the whole distribution range of the focal species. In addition, it is required to
reveal whether genotypic diversity resulted from sexual recombination or somatic
mutation. Recently, it became possible to determine the relative contribution of sexual
recombination and somatic mutation on the origin of new genotypes by employing a
new molecular genetic approach: character compatibility analysis (Mes 1998).
In the present study, we focus on the role of sexual and clonal reproduction in
the free-floating aquatic bladderwort, U. australis f. tenuicaulis, addressing the
following questions: (1) how much genotypic diversity is maintained within
populations, (2) are the levels of genotypic diversity associated with geographical
distribution range, and (3) whether genotypic differences result from sexual
recombination or somatic mutation.
Materials and methods
Study sites and sample collection
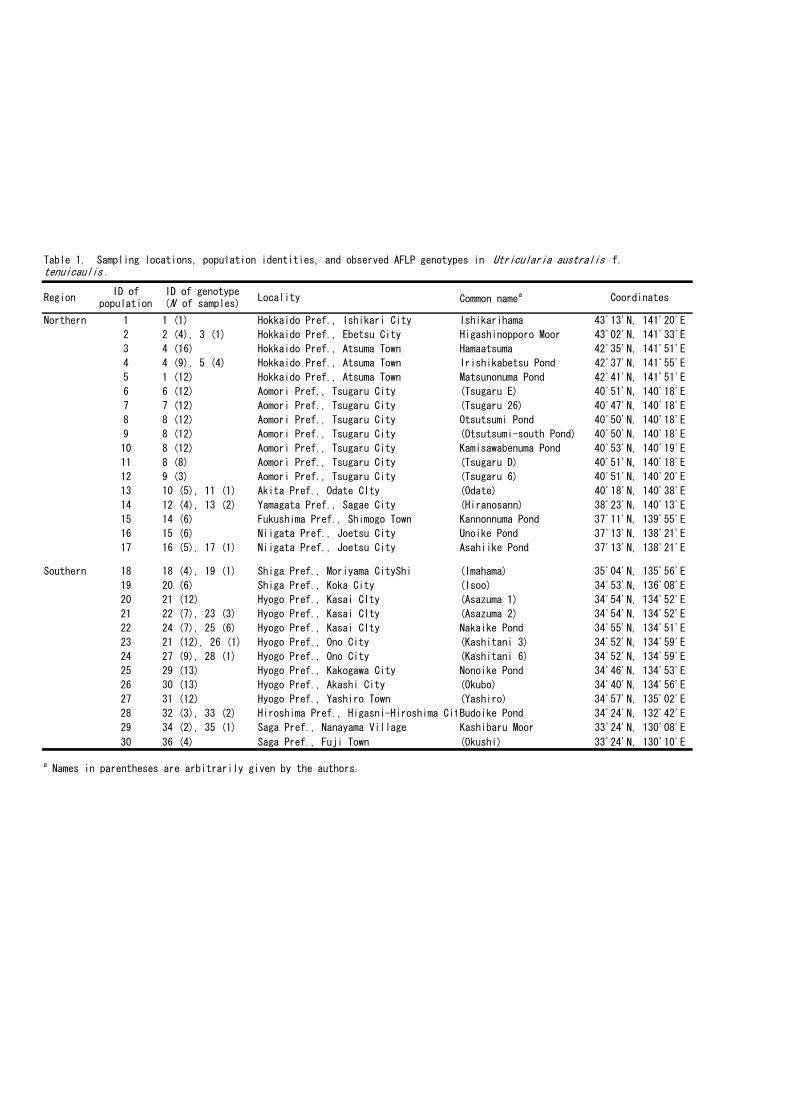
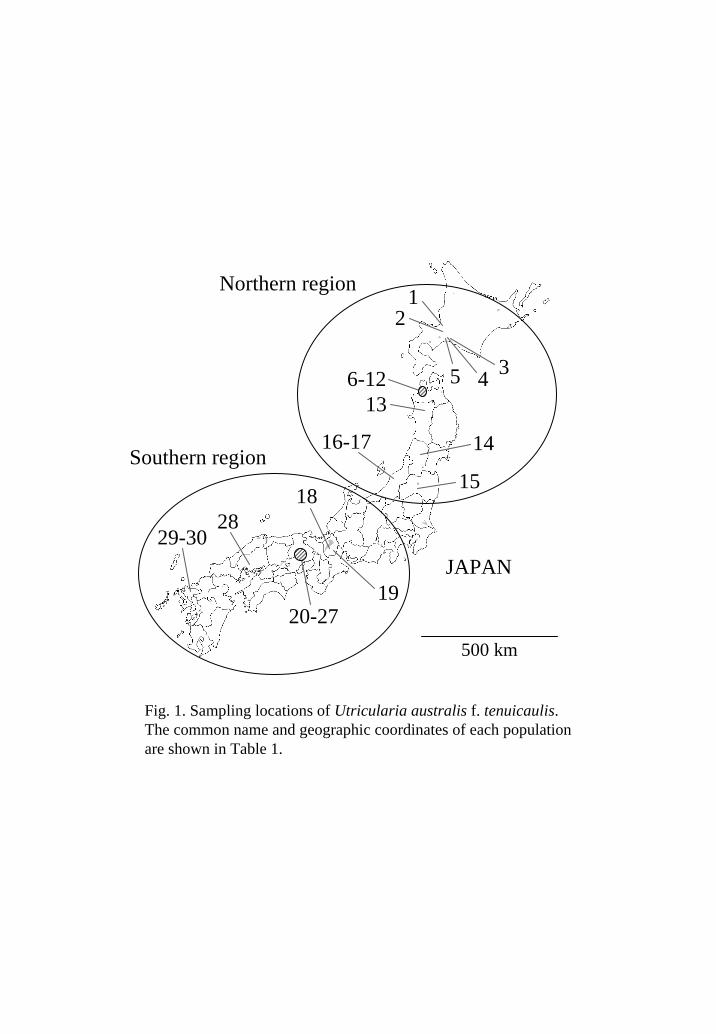
Plant materials were sampled from 30 populations in Japan: 17 from the northern region
and 13 from the southern region (Table 1; Fig. 1). In the northern region, most lakes and
ponds are large, have a relatively scattered distribution, and originated naturally. In
contrast, most lakes and ponds in the southern region are relatively small, densely
distributed, and artificially managed for the irrigation of paddy fields. Stems of 1–13
samples were collected from each population (267 in total), cleaned with deionized
water, and frozen at –80 °C for later DNA extraction.
書式変更: heading1
削除:
削除: Although most terrestrial plants also have the ability to produce clonally, a trait that originated independently in numerous lineages (Klimeš et al. 1997), one of the most notable features of aquatic plants is the ability of clonal offspring to disperse over long distances (Grace 1993; Les and Philbrick 1993). In terrestrial plants, sexually produced seeds are usually smaller than clonal offspring and have various specialized dispersal mechanisms (Starfinger and Stöcklin 1996). Thus, sexual reproduction is indispensable for the persistence of most terrestrial plants at the metapopulation level, even if clonal reproduction is favored at the population level (Olivieri et al. 1995; Piquot et al. 1998; Stöcklin and Winkler 2004). Unlike terrestrial plants, however, many aquatic plants possess vegetative structures that can be dispersed exceptionally long distances, such as turions, winter buds, and shoot fragments (Grace 1993). Thus, the long-distance dispersal ability of clonal offspring may reduce the selective disadvantages of asexual reproduction (Les and Philbrick 1993) even at the metapopulation level.
The extensive reliance on clonal reproduction combined with the strong dispersal ability of clonal offspring should largely determine the population genetic structure of aquatic plants. However, the importance of the two reproductive modes and their relationship to genetic variation have rarely been studied in aquatic plants, especially floating-leaved, submerged, or free-floating taxa (Barrett et al. 1993). In
削除: Study speciesUtricularia australis f. tenuicaulis is a free-floating bladderwort that reproduces clonally via turions and shoot fragments and sexually via seeds. The taxonomic classification of this species has long remained unclear because of the existence of the morphologically similar taxa U. australis f. australis and U. macrorhiza (Taylor 1989; Kadono 1994; Komiya et al. 1997; see also Kameyama et al. 2005). Recently, it was revealed that U. australis f.
... [1]
... [2]
6
AFLP analysis
Total genomic DNA was isolated from about 50 mg of tissue from each of the 267
frozen stems by means of the CTAB (hexadecyltrimethylammonium bromide) miniprep
procedure (Stewart and Via 1993).
AFLP analysis was performed according to the method of Vos et al. (1995), with
some modifications (see Kameyama et al. 2005). Selective amplifications were
conducted with three combinations of primer pairs: MseI-CC and EcoRI-ACT (FAM),
MseI-CA and EcoRI-ACG (VIC), and MseI-CC and EcoRI-AGC (NED). The AFLP
Amplification Core Mix (Applied Biosystems, Foster City, California, USA) and the
GeneAmp PCR system thermal cycler (Applied Biosystems) were used for both
amplifications. AFLP fragments were detected with an ABI Prism 3100 automated
sequencer (Applied Biosystems) and the GENESCAN analysis software (Applied
Biosystems).
Statistical analysis
The number of genotypes observed (G) and the genotypic diversity (D) within
populations were calculated for each population. Genotypic diversity (D) was estimated
as D = 1 – Σ[ni(ni – 1)/n(n – 1)], where n is the number of ramets sampled and ni is the
number of ramets with genotype i. The value of D ranges from 0, when all ramets
sampled have the same genotype, to 1, when each ramet sampled has a different
genotype (Pielou 1969).
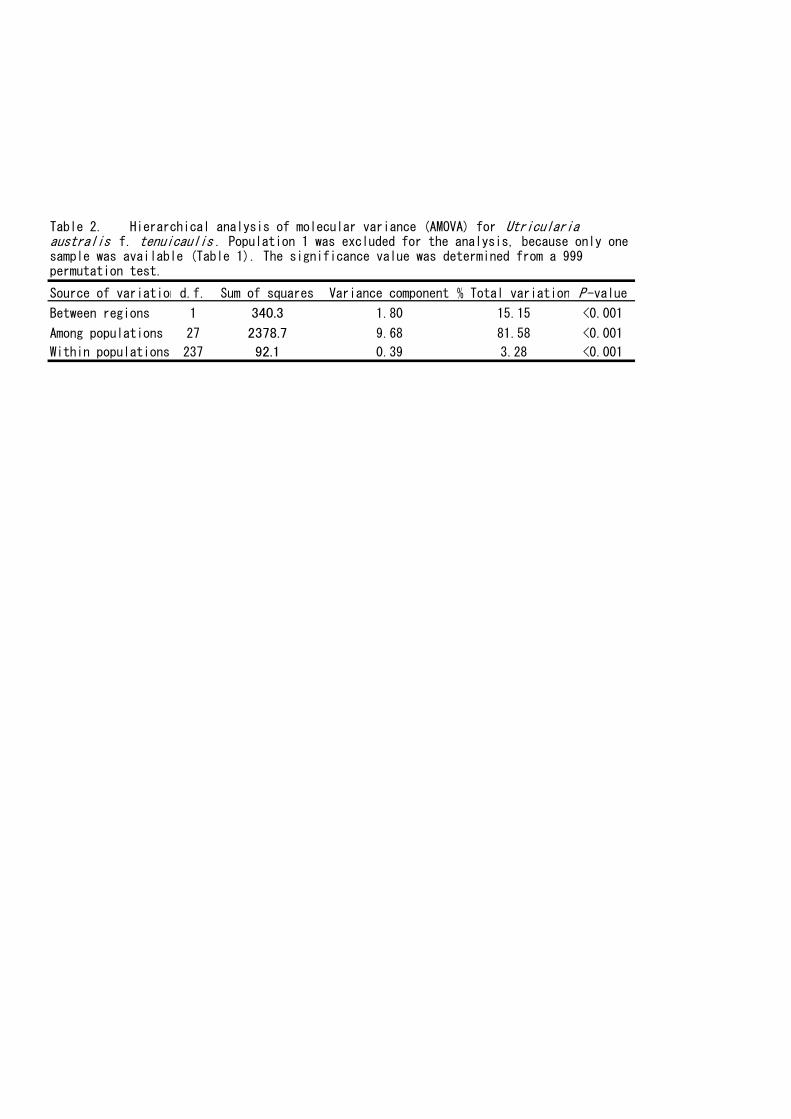
Population genetic structure was assessed by analysis of molecular variance
(AMOVA; Excoffier et al. 1992), which partitioned the total variance in the AFLP data
into regional, among-population, and within-population components. Of the 267 ramets
collected, 266 were used for this analysis because only one sample was available from
population 1 (Table 1). The statistical significance of the variance components was
determined by 999 random permutations. These analyses were performed with the
GenAlEx 5.1 software (Peakall and Smouse 2001).
An UPGMA dendrogram of AFLP genotypes was constructed based on the
standard genotypic similarity: Sij = 2Nij/(Ni + Nj), where Nij is the number of shared
bands between genotypes i and j and Ni and Nj are the number of bands found in
削除: We calculated the standard measure of g
削除: within populations:
7
genotypes i and j, respectively (Dice 1945). All calculations were conducted using the R
Package 4.0 software (Casgrain and Legendre 1999).
Character compatibility analysis was conducted to reveal whether the genotypic
diversity originated from sexual recombination or somatic mutations (Mes 1998; van
der Hulst et al. 2000). In two binary character data, such as the presence or absence of
AFLP bands at two loci, the presence of all four possible combinations of characters
(0/0, 1/0, 0/1, 1/1) is more parsimoniously explained by recombination than by three
mutation events. The presence of all four possible combinations is referred to as
“incompatibility,” and it can be used as a measure of recombination when summed over
all pairwise comparisons (matrix incompatibility; Wilkinson 2001).
In the present study, the contribution of a particular genotype to matrix
incompatibility was calculated by jackknifing using the JACTAX option in PICA
(Wilkinson 2001), and then the genotypes with the highest contribution were
successively removed from the dataset until the matrix incompatibility count became
zero. The analyses were conducted for the genotypes distributed in the northern region
(n = 17), southern region (n = 19), and whole region (n = 36). If only a few recombinant
genotypes contribute to overall matrix incompatibility, there would be a sharp decrease
of the incompatibility count upon deletion of these genotypes (van der Hulst et al.
2000). However, if the deletion of nearly all genotypes is required to remove matrix
incompatibility, then the genotypic diversity originated mostly from sexual
recombination.
Results
Genotypic diversity
A total of 97 polymorphic bands were identified by AFLP analysis, which discriminated
36 genotypes from the 267 ramets (Table 1). The number of genotypes in the northern
and southern regions were 17 from 17 populations and 19 from 13 populations,
respectively (Table 1). The mean number of genotypes within each population (G) was
1.29 (SE = 0.11) in the northern region, 1.54 (SE = 0.14) in the southern region, and
1.40 (SE = 0.09) in total. Mean genotypic diversity (D), including monoclonal
削除: The relationship between
genotypic similarity (Sij) and geographic distance was estimated using the normalized Mantel statistic value (RM) to examine: (1) the correlation between the genetic similarity matrix and geographic distance matrix (simple Mantel test; Mantel 1967), and (2) the degree of spatial autocorrelation (Mantel correlogram; Oden and Sokal 1986). The second approach is a modification of the simple Mantel test in which geographic distance is divided into several classes and the successive RM values are calculated (Stehlik et al. 2001). In the present study, geographic distance was divided into 10 classes at 150–km intervals from class 0 (within populations, 0 km) to class 10 (1350–1500 km). To reveal the geographic distribution of sexually produced genotypes (genets), one representative was used for each genotype within populations and those genotypes that were distributed across multiple populations were excluded from the analysis. All calculations were conducted using the R Package 4.0 software (Casgrain and Legendre 1999) and tested for significance with 999 permutations.
削除: Each population had only one or two genotypes that were occasionally observed in distant populations: genotype 1 in populations 1 and 5 (distance between the populations, 65.2 km); genotype 4 in populations 3 and 4 (5.7 km); genotype 8 in populations 8, 9, 10, and 11 (mean, 2.5 km; range, 0.4–4.2 km); and genotype 21 in populations 20 and 23 (11.2 km).
8
populations, was 0.12 (SE = 0.05) in the northern region, 0.23 (SE = 0.07) in the
southern region, and 0.17 (SE = 0.04) in total.
Hierarchical AMOVA partitioned the overall genetic variation into three levels:
between regions, among populations, and within populations (Table 2). Only 3.3% of
the total variation was explained by the differences within populations (Table 2),
reflecting the small number of genotypes within each population. A relatively small
amount of the genetic variation was attributed to regional differences (15.2%), and a
large portion was explained by the differences among populations (81.6%; Table 2).
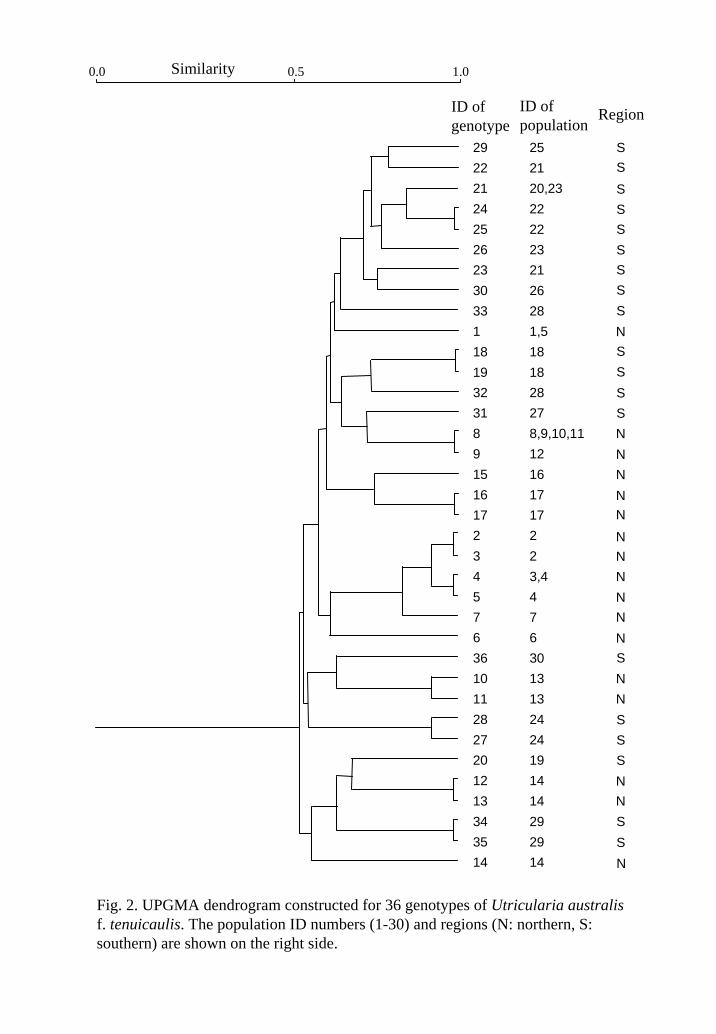
The UPGMA dendrogram constructed for 36 genotypes showed that the genets
distributed within the same populations were genetically similar with each other (Fig.
2). In contrast, no apparent group was detected among populations or between regions
(Fig. 2).
Character compatibility
Results of the character compatibility analyses were shown as the pattern of matrix
incompatibility count (MIC) after successive removal of the genotypes that contribute
most to the overall MIC (Fig. 4). If the deletion of nearly all genotypes is required to
remove matrix incompatibility (MIC = 0), then the genotypic diversity would have
originated mostly from sexual recombination.
The analysis conducted for all genotypes (whole region) revealed that most
genotypic diversity was derived from sexual recombination: 30 of 36 genotypes (83.3%)
had to be deleted to obtain the strictly clonal genetic structure (MIC = 0; Fig. 4). When
the analysis was conducted separately for the northern and southern regions, a relatively
sharp decline of MIC was observed in the northern region compared with the southern
region (Fig. 4). The sharp decline of MIC suggests that there are major groups of
genotypes that are more incompatible with each other (as the measure of recombination)
than with other individuals (van der Hulst et al. 2000). The total number of genotypes
that needed to be deleted to eliminate all MIC, however, was similar between the two
regions: 11 of 17 genotypes (64.7%) and 13 of 19 (68.4%) in the northern and southern
regions, respectively (Fig. 4).
書式変更: インデント : 最初の行 : 35.4 pt
削除:
削除: Genetic structure
削除: The simple Mantel test revealed a
significant correlation between pairwise genotypic similarity and pairwise geographic distance (RM = –0.274, P < 0.001). The Mantel correlogram, in which geographic distance was divided into 10 classes and the successive RM values were calculated, clearly showed significant positive correlations at the first (within populations) and second (among populations within 150 km of one another) distance classes (Fig. 3).
9
Discussion
Low genotypic diversity within populations
Clonal plants usually exhibit substantial genotypic diversity within populations, even if
sexual recruitment is absent or extremely limited (Ellstrand and Roose 1987; Widén et
al. 1994). For example, a broad comparison of 27 studies involving 21 clonal species
(Ellstrand and Roose 1987) showed that the mean number of genotypes per population
(G) was 16.1 (range, 1–167) and the mean genotypic diversity (D) of multiclonal
populations was 0.62 (range, 0.1–1.0). It may be notable that most of these studies were
conducted in small number of populations employing the markers such as allozyme.
In contrast, Utricularia australis f. tenuicaulis showed extremely low genotypic
diversity within all surveyed populations, in spite of the use of highly polymorphic and
reliable DNA marker (AFLP): the mean number of genotypes within populations (G) in
the northern region, southern region and in total was 1.29, 1.54 and 1.40, the mean
genotypic diversity (D), including monoclonal populations, was 0.12, 0.23 and 0.17,
respectively.
Clonal reproduction in aquatic plants is highly effective for both numerical
increase and expansion of the area of distribution (Grace 1993). The rapid expansion of
a few founder genotypes via extensive clonal reproduction greatly impedes the
subsequent establishment of seedling and clonal offspring. In addition, self-fertilization
in U. australis f. tenuicaulis reduces the success of sexual reproduction; previous
studies showed that the mean number of seeds per fruit in selfed and outcrossed fruit
was 16 and 48 (Kameyama et al. 2005), and the mean seed set ratio was 7.6% and
45.7% in selfing and outcrossing treatments, respectively (Araki and Kadono 2003).
Thus, the rapid and widespread expansion of a few founders may not only excludes the
subsequent establishment of seedlings and clonal offspring, but also inhibits sexual
reproduction because of reduced seed production caused by increased selfing.
書式変更: インデント : 最初の行 : 35.4 pt
削除: In contrast to this general trend, U.
削除: was 1.4, and D, including monoclonal populations, was 0.17.
削除: pollination
削除: Spatial genetic structure and gene flowContrary to the low genotypic diversity within populations, genotypes across populations were highly diverse (Fig. 2) and the great extent of genetic variation was explained by the differences among populations (Table 2). This pattern is apparently because of the restricted gene flow via pollen and seeds. A significant relationship between pairwise genotypic similarity and pairwise geographic distance (that is, a pattern of isolation-by-distance) was found among genets at the whole region (simple Mantel test, P < 0.001). In addition, the Mantel correlogram demonstrated significant positive correlations only at the first (within populations) and second (among populations within 150 km of one another) distance classes (Fig. 3). Thus, in this aquatic bladderwort, gene flow among populations via pollen and seeds appears to be limited to less than 150 km.
The dispersal ability of clonal offspring is revealed by the existence of the same genotypes in distant populations: four genotypes (10 ramets in total) were distributed in multiple populations separated by several to several tens of kilometers. A wide distribution of a single clone was also found in U. australis f. australis: populations separated by about 250 km across the Tsugaru Straits in Japan were dominated by a single genotype (Y. Kameyama and M. Ohara, unpublished data). Thus, clonal offspring of aquatic bladderworts can disperse relatively long distances, possibly comparable with that of sexually produced seeds and pollen grains.
10
The origin of new genotypes: sexual recombination or somatic mutations?
The genotypic diversity within aquatic blatterworts is extremely low compared to any
other clonal plants. Many of the populations investigated, however, had different and
highly variable genotypes (Table 1, Fig. 2); a large portion of the genetic variation was
explained by variation among populations (Table 2). How were these genotypes
produced regardless of the predominance of clonal reproduction within populations?
Somatic mutations can generate new genotypes without sexual reproduction.
Recently, character compatibility analysis has made it possible to determine whether
genotypic differences resulted from somatic mutations or sexual recombination (Mes
1998). In the terrestrial plant Allium vineale (wild garlic), in spite of extensive reliance
on clonal reproduction, most genotypes originated by sexual recombination rather than
by mutations within asexual lineages (Ceplitis 2001). Similarly, in a population of
apomictic dandelions, somatic mutations did not contribute to the generation of new
genotypes (van der Hulst et al. 2000, 2003, but see also Mes et al. 2002). In contrast,
genotypes of the aquatic plant Butomus umbellatus largely originated by somatic
mutations with almost no contribution of sexual recombination (Eckert et al. 2003).
In this study of the aquatic bladderwort U. australis f. tenuicaulis, the character
compatibility analysis revealed that most genotypic diversity was derived from sexual
recombination. Six genotypes showed a strictly clonal genetic structure (MIC = 0) in all
analyses (Fig. 4). However, character compatibility analysis requires at least four
genotypes to detect incompatibilities (van der Hulst et al. 2003), which is close to the
number of genotypes that remained in the present study. Thus, we conclude that somatic
mutations may not contribute the origin of genotypic diversity in this aquatic
bladderwort; instead, rare to sporadic sexual reproduction likely generated new
genotypes.
Future studies should examine the role of sexual reproduction in U. australis f.
tenuicaulis from the viewpoint of long-term evolutionary benefits, such as rapid
adaptation by recombination (Crow and Kimura 1965), escape from coevolving
pathogens (Maynard Smith 1978), and prevention of mutational meltdown (Lynch and
Lande 1993).
削除: The relatively long-distance dispersal ability of clonal offspring may reduce the selective disadvantage of asexual reproduction (Les and Philbrick 1993) even at the metapopulation level (see Introduction). These findings raise the question of whether any clonal lineages are maintained solely by somatic mutations.
削除: did
削除: .
削除: I
削除: , which is difficult to detect in the field,

11
Acknowledgements
We acknowledge the helpful advice of Dr. Satoru Araki, Research Center for Coastal
Lagoon Environments, Shimane University, and Prof. Yasuro Kadono, Faculty of
Science, Kobe University. We are also grateful to Mr. Masahiro Toyama, Ebetsu City,
Hokkaido; Mr. Shigeru Uematsu, Sapporo City, Hokkaido; Mr. Seikoh Iwamura, Saga
City, Saga Prefecture; Mr. Noriyuki Sanemitsu, Kozan Town, Hiroshima Prefecture;
and Prof. Michiko Shimoda, College of Environment and Disaster Research, Fuji
Tokoha University, for helpful information. We also thank Dr. Yoshihisa Suyama,
Graduate School of Agricultural Science, Tohoku University, for his technical advice
about AFLP analysis. This study was supported by a Grant-in-Aid from the Ministry of
Education, Culture, Sports, Science and Technology for the 21st Century Center of
Excellence Program (E-01) and from the Japan Society for the Promotion of Science
(JSPS) for Scientific Research (15370006 and 16370007) and Research Fellowships for
Young Scientists.
12
Figure legends
Fig. 1. Sampling locations of Utricularia australis f. tenuicaulis. The common name
and geographic coordinates of each population are shown in Table 1.
Fig. 2. UPGMA dendrogram constructed for 36 genotypes of Utricularia australis f.
tenuicaulis. The population ID numbers (1–30) and regions (N, northern; S, southern)
are shown on the right side.
Fig. 3. Matrix incompatibility count (MIC) after successive removal of the genotypes
that contribute most to the overall MIC.
削除: Fig. 3. Correlogram of Mantel’s r (RM) for each 150-km distance class. Distance class 0 represents comparisons within populations. One representative was used for each genotype within populations. Correlations were calculated for 32 genets, excluding the four genotypes distributed across multiple populations. Filled circles indicate RM values that are significantly different from zero after Bonferroni correction (α = 0.05).
削除: 4
13
References
Araki S, Kadono Y (2003) Restricted seed contribution and clonal dominance in a free-floating aquatic plant
Utricularia australis R. Br. in southwestern Japan. Ecol Res 18:599–609
Barrett SCH, Eckert CG, Husband BC (1993) Evolutionary processes in aquatic plant populations. Aquat Bot
44:105–145
Casgrain P, Legendre P (1999) The R package for multivariate and spatial analysis, version 4.0. User’s manual.
Department of Biological Sciences, University of Montreal, Montreal.
http://www.bio.umontreal.ca/Casgrain/en/labo/R/v4/index.html
Ceplitis A (2001) The importance of sexual and asexual reproduction in the recent evolution of Allium vineale.
Evolution 55:1581–1591
Crow JF, Kimura M (1965) Evolution in sexual and asexual populations. Am Nat 99:439–450
Dice LR (1945) Measures of the amount of ecological association between species. Ecology 26:297–302
Dorken ME, Eckert CG (2001) Severely reduced sexual reproduction in northern populations of a clonal plant,
Decodon verticillatus (Lythraceae). J Ecol 89:339–350
Eckert CG (2002) The loss of sex in clonal plants. Evolutionary Ecology 15:501–520
Eckert CG, Lui K, Bronson K, Corradini P, Bruneau A (2003) Population genetic consequences of extreme variation
in sexual and clonal reproduction in an aquatic plant. Mol Ecol 12:331–344
Ellstrand NC, Roose ML (1987) Patterns of genotypic diversity in clonal plant species. Am J Bot 74:123–131
Excoffier L, Smouse PE, Quattro JM (1992) Analysis of molecular variance inferred from metric distances among
DNA haplotypes: application to human mitochondrial DNA restriction data. Genetics 131:479–491
Grace JB (1993) The adaptive significance of clonal reproduction in angiosperms: an aquatic perspective. Aquat Bot
44:159–180
Kadono Y (1994) Aquatic plants of Japan. Bun-ichi Sogo-Shuppan, Tokyo (in Japanese)
Kameyama Y, Toyama M, Ohara M (2005) Hybrid origins and F1 dominance in the free-floating, sterile bladderwort,
Utricularia australis f. australis (Lentibulariaceae). Am J Bot 92:469–476
Komiya S, Shibata C (1980) Distribution of the Lentibulariaceae in Japan. Bulletin of Nippon Dental University
9:163–212
Les DH, Philbrick CT (1993) Studies of hybridization and chromosome number variation in aquatic angiosperms:
evolutionary implications. Aquat Bot 44:181–228
Lynch M, Lande R (1993) Evolution and extinction in response to environmental change. In: Kareiva PM, Kingsolver
JG, Huey RB (eds) Biotic interactions and global change. Sinauer Associates, Sunderland, pp 234–250
Maynard Smith J (1978) The evolution of sex. Cambridge University Press, Cambridge
Mes THM (1998) Character compatibility of molecular markers to distinguish asexual and sexual reproduction. Mol
Ecol 7:1719–1727
Mes THM, Kuperus P, Kirschner J, Štepánek J, Štorchová H, Oosterveld P, den Nijs CM (2002) Detection of
genetically divergent clone mates in apomictic dandelions. Mol Ecol 11:253–265
Peakall R, Smouse PE (2001) GenAlEx V5: genetic analysis in Excel—population genetic software for teaching and
research. Australian National University, Canberra. http://www.anu.edu.au/Bo
Philbrick CT, Les DH (1996) Evolution of aquatic angiosperm reproductive systems. Bioscience 46:813–826
Pielou EC (1969) An introduction to mathematical ecology. Wiley-Interscience, New York
削除:
削除:
削除: Klimeš J, Klimšová J, Hendriks R, van Groenendael J (1997) Clonal plant architecture: a comparative analysis of form and function. In: de Kroon H, van Groenendael J (eds) The ecology and evolution of clonal plants. Backbuys Publishers, Leiden, pp 1–29Komiya S, Shibata C, Toyama M, Katsumata K (1997) Carnivorous plants in Hokkaido, northern Japan. Bull Nippon Dental Univ, Gen Ed 26:153–188 (in Japanese)
削除: Mantel N (1967) The detection of disease clustering and a generalized regression approach. Cancer Res 27:209–220
削除: Oden NL, Sokal RF (1986) Directional autocorrelation: an extension of spatial correlograms to two dimensions. Syst Zool 35:608–617Olivieri I, Michalakis Y, Gouyon PH (1995) Metapopulation genetics and the evolution of dispersal. Am Nat 146:202–228
削除: Piquot Y, Petit D, Valero M, de Cuguen J, Laguerie P, Vernet P (1998) Variation in sexual and asexual reproduction among young and old populations of the perennial macrophyte Sparganium erectum. Oikos 82:139–148
14
Stewart CN Jr, Via LE (1993) A rapid CTAB DNA isolation technique useful for RAPD fingerprinting and other
PCR applications. BioTechniques 14:748–750
Taylor P (1989) The genus Utricularia: a taxonomic monograph. Royal Botanical Gardens, Kew
van der Hulst RGM, Mes THM, den Nijs JCM, Bachmann K (2000) Amplified fragment length polymorphism
(AFLP) markers reveal that population structure of triploid dandelions (Taraxacum officinale) exhibits both clonality
and recombination. Mol Ecol 9:1–8
van der Hulst RGM, Mes THM, Falque M, Stam P, den Nijs JCM, Bachmann K (2003) Genetic structure of a
population sample of apomictic dandelions. Heredity 90:326–335
Vos P, Hogers R, Bleeker M, Reijans M, van de Lee T, Hornes M, Frijters A, Pot J, Peleman J, Kuiper M, Zabear M
(1995) AFLP: a new technique for DNA fingerprinting. Nucleic Acids Res 23:4407–4414
Widén B, Cronberg N, Widén M (1994) Genotypic diversity, molecular markers and spatial distribution of genets in
clonal plants, a literature survey. Folia Geobotan Phytotaxonom 29:245–263
Wilkinson M (2001) PICA 4.0: software and documentation. Department of Zoology, The National History Museum,
London. http://www.nhm.ac.uk/research-curation/projects/software/mwphylogeny.html
削除: Starfinger U, Stöcklin J (1996) Seed, pollen, and clonal dispersal and their role in structuring plants populations. Prog Bot 57:336–355Stehlik I, Schneller JJ, Bachmann K (2001) Resistance or emigration: response of the high-alpine plant Eritrichium nanum (L.) Gaudin to the ice age within the central Alps. Mol Ecol 10:357–370
削除: t
削除: Stöcklin J, Winkler E (2004) Optimum reproduction and dispersal strategies of a clonal plant in a metapopulation: a simulation study with Hieracium pilosella. Evol Ecol 18:563–584
ページ 5: [1] 削除 kameyama 2006/01/11 14:21:00
Although most terrestrial plants also have the ability to produce clonally, a trait
that originated independently in numerous lineages (Klimeš et al. 1997), one of the most
notable features of aquatic plants is the ability of clonal offspring to disperse over long
distances (Grace 1993; Les and Philbrick 1993). In terrestrial plants, sexually produced
seeds are usually smaller than clonal offspring and have various specialized dispersal
mechanisms (Starfinger and Stöcklin 1996). Thus, sexual reproduction is indispensable
for the persistence of most terrestrial plants at the metapopulation level, even if clonal
reproduction is favored at the population level (Olivieri et al. 1995; Piquot et al. 1998;
Stöcklin and Winkler 2004). Unlike terrestrial plants, however, many aquatic plants
possess vegetative structures that can be dispersed exceptionally long distances, such as
turions, winter buds, and shoot fragments (Grace 1993). Thus, the long-distance
dispersal ability of clonal offspring may reduce the selective disadvantages of asexual
reproduction (Les and Philbrick 1993) even at the metapopulation level.
The extensive reliance on clonal reproduction combined with the strong
dispersal ability of clonal offspring should largely determine the population genetic
structure of aquatic plants. However, the importance of the two reproductive modes and
their relationship to genetic variation have rarely been studied in aquatic plants,
especially floating-leaved, submerged, or free-floating taxa (Barrett et al. 1993). In the
present study, we address the spatial genetic structure of the free-floating aquatic
bladderwort Utricularia australis f. tenuicaulis, focusing on the roles of sexual and
clonal reproduction. Amplified fragment length polymorphism (AFLP) analysis was
conducted to examine the genotypic diversity within populations, the spatial genetic
structure at the geographical scale (0–1500 km), and the origin of new genotypes via
sexual recombination and somatic mutation.
ページ 5: [2] 削除 kameyama 2006/01/11 15:38:00
Study species
Utricularia australis f. tenuicaulis is a free-floating bladderwort that reproduces
clonally via turions and shoot fragments and sexually via seeds. The taxonomic
classification of this species has long remained unclear because of the existence of the
morphologically similar taxa U. australis f. australis and U. macrorhiza (Taylor 1989;
Kadono 1994; Komiya et al. 1997; see also Kameyama et al. 2005). Recently, it was
revealed that U. australis f. tenuicaulis and U. macrorhiza are strict species, whereas U.
australis f. australis is a sterile F1 hybrid between them (Kameyama et al. 2005). In the
present study, we focus solely on the genetic structure of U. australis f. tenuicaulis,
because of its wide distributional range across Japan.
t
Table 1. Sampling locations, population identities, and observed AFLP genotypes in Utricularia australis f.tenuicaulis .
RegionID of
populationID of genotype(N of samples)
Locality Common namea Coordinates
Northern 1 1 (1) Hokkaido Pref., Ishikari City Ishikarihama 43゚13'N, 141゚20'E
2 2 (4), 3 (1) Hokkaido Pref., Ebetsu City Higashinopporo Moor 43゚02'N, 141゚33'E
3 4 (16) Hokkaido Pref., Atsuma Town Hamaatsuma 42゚35'N, 141゚51'E
4 4 (9), 5 (4) Hokkaido Pref., Atsuma Town Irishikabetsu Pond 42゚37'N, 141゚55'E
5 1 (12) Hokkaido Pref., Atsuma Town Matsunonuma Pond 42゚41'N, 141゚51'E
6 6 (12) Aomori Pref., Tsugaru City (Tsugaru E) 40゚51'N, 140゚18'E
7 7 (12) Aomori Pref., Tsugaru City (Tsugaru 26) 40゚47'N, 140゚18'E
8 8 (12) Aomori Pref., Tsugaru City Otsutsumi Pond 40゚50'N, 140゚18'E
9 8 (12) Aomori Pref., Tsugaru City (Otsutsumi-south Pond) 40゚50'N, 140゚18'E
10 8 (12) Aomori Pref., Tsugaru City Kamisawabenuma Pond 40゚53'N, 140゚19'E
11 8 (8) Aomori Pref., Tsugaru City (Tsugaru D) 40゚51'N, 140゚18'E
12 9 (3) Aomori Pref., Tsugaru City (Tsugaru 6) 40゚51'N, 140゚20'E
13 10 (5), 11 (1) Akita Pref., Odate CIty (Odate) 40゚18'N, 140゚38'E
14 12 (4), 13 (2) Yamagata Pref., Sagae City (Hiranosann) 38゚23'N, 140゚13'E
15 14 (6) Fukushima Pref., Shimogo Town Kannonnuma Pond 37゚11'N, 139゚55'E
16 15 (6) Niigata Pref., Joetsu City Unoike Pond 37゚13'N, 138゚21'E
17 16 (5), 17 (1) Niigata Pref., Joetsu City Asahiike Pond 37゚13'N, 138゚21'E
Southern 18 18 (4), 19 (1) Shiga Pref., Moriyama CityShi (Imahama) 35゚04'N, 135゚56'E
19 20 (6) Shiga Pref., Koka City (Isoo) 34゚53'N, 136゚08'E
20 21 (12) Hyogo Pref., Kasai CIty (Asazuma 1) 34゚54'N, 134゚52'E
21 22 (7), 23 (3) Hyogo Pref., Kasai CIty (Asazuma 2) 34゚54'N, 134゚52'E
22 24 (7), 25 (6) Hyogo Pref., Kasai CIty Nakaike Pond 34゚55'N, 134゚51'E
23 21 (12), 26 (1) Hyogo Pref., Ono City (Kashitani 3) 34゚52'N, 134゚59'E
24 27 (9), 28 (1) Hyogo Pref., Ono City (Kashitani 6) 34゚52'N, 134゚59'E
25 29 (13) Hyogo Pref., Kakogawa City Nonoike Pond 34゚46'N, 134゚53'E
26 30 (13) Hyogo Pref., Akashi City (Okubo) 34゚40'N, 134゚56'E
27 31 (12) Hyogo Pref., Yashiro Town (Yashiro) 34゚57'N, 135゚02'E
28 32 (3), 33 (2) Hiroshima Pref., Higasni-Hiroshima Ci Budoike Pond 34゚24'N, 132゚42'E
29 34 (2), 35 (1) Saga Pref., Nanayama Village Kashibaru Moor 33゚24'N, 130゚08'E
30 36 (4) Saga Pref., Fuji Town (Okushi) 33゚24'N, 130゚10'E
a Names in parentheses are arbitrarily given by the authors.
12
3456-1213
14
15
16-17
18
1920-27
2829-30
Fig. 1. Sampling locations of Utricularia australis f. tenuicaulis. The common name and geographic coordinates of each population are shown in Table 1.
500 km
JAPAN
Northern region
Southern region
n n -value
Table 2. Hierarchical analysis of molecular variance (AMOVA) for Utriculariaaustralis f. tenuicaulis . Population 1 was excluded for the analysis, because only onesample was available (Table 1). The significance value was determined from a 999permutation test.
Source of variatio d.f. Sum of squares Variance component % Total variatio P
Between regions 1 340.3 1.80 15.15 <0.001
Among populations 27 2378.7 9.68 81.58 <0.001
Within populations 237 92.1 0.39 3.28 <0.001
Similarity 1.00.0 0.5
Fig. 2. UPGMA dendrogram constructed for 36 genotypes of Utricularia australisf. tenuicaulis. The population ID numbers (1-30) and regions (N: northern, S: southern) are shown on the right side.
292221242526233033118193231891516172345763610112827201213343514
SSSSSSSSSNSSSSNNNNNNNNNNNSNNSSSNNSSN
ID of genotype
ID of population
Region
252120,232222232126281,5181828278,9,10,1112161717223,44763013132424191414292914

0
200
400
600
800
1000
1200
1400
Mat
rix in
com
patib
ility
0 5 10 15 20 25 30 36
Whole region (n = 36)Northern region (n =17)Southern region (n = 19)
Fig. 3. Matrix incompatibility count (MIC) after successive removal of the genotypes that contribute most to the overall MIC.
Number of genotypes removed