Embed Size (px)
Citation preview

PredictSNP: Robust and Accurate Consensus Classifier forPrediction of Disease-Related MutationsJaroslav Bendl1,2,3, Jan Stourac1,3, Ondrej Salanda2, Antonin Pavelka1¤, Eric D. Wieben4,
Jaroslav Zendulka2, Jan Brezovsky1*, Jiri Damborsky1,3*
1 Loschmidt Laboratories, Department of Experimental Biology and Research Centre for Toxic Compounds in the Environment, Faculty of Science, Masaryk University,
Brno, Czech Republic, 2 Department of Information Systems, Faculty of Information Technology, Brno University of Technology, Brno, Czech Republic, 3 Center of
Biomolecular and Cellular Engineering, International Centre for Clinical Research, St. Anne’s University Hospital Brno, Brno, Czech Republic, 4 Department of Biochemistry
and Molecular Biology, Mayo Clinic, Rochester, New York, United States of America
Abstract
Single nucleotide variants represent a prevalent form of genetic variation. Mutations in the coding regions are frequentlyassociated with the development of various genetic diseases. Computational tools for the prediction of the effects ofmutations on protein function are very important for analysis of single nucleotide variants and their prioritization forexperimental characterization. Many computational tools are already widely employed for this purpose. Unfortunately, theircomparison and further improvement is hindered by large overlaps between the training datasets and benchmark datasets,which lead to biased and overly optimistic reported performances. In this study, we have constructed three independentdatasets by removing all duplicities, inconsistencies and mutations previously used in the training of evaluated tools. Thebenchmark dataset containing over 43,000 mutations was employed for the unbiased evaluation of eight establishedprediction tools: MAPP, nsSNPAnalyzer, PANTHER, PhD-SNP, PolyPhen-1, PolyPhen-2, SIFT and SNAP. The six bestperforming tools were combined into a consensus classifier PredictSNP, resulting into significantly improved predictionperformance, and at the same time returned results for all mutations, confirming that consensus prediction represents anaccurate and robust alternative to the predictions delivered by individual tools. A user-friendly web interface enables easyaccess to all eight prediction tools, the consensus classifier PredictSNP and annotations from the Protein Mutant Databaseand the UniProt database. The web server and the datasets are freely available to the academic community at http://loschmidt.chemi.muni.cz/predictsnp.
Citation: Bendl J, Stourac J, Salanda O, Pavelka A, Wieben ED, et al. (2014) PredictSNP: Robust and Accurate Consensus Classifier for Prediction of Disease-RelatedMutations. PLoS Comput Biol 10(1): e1003440. doi:10.1371/journal.pcbi.1003440
Editor: Paul P. Gardner, University of Canterbury, New Zealand
Received August 20, 2013; Accepted December 3, 2013; Published January 16, 2014
Copyright: � 2014 Bendl et al. This is an open-access article distributed under the terms of the Creative Commons Attribution License, which permitsunrestricted use, distribution, and reproduction in any medium, provided the original author and source are credited.
Funding: The research of JS, AP and JD was supported by the project FNUSA-ICRC (CZ.1.05/1.1.00/02.0123) from the European Regional Development Fund. Thework of JB was supported by the Program of ‘‘Employment of Best Young Scientists for International Cooperation Empowerment’’ (CZ1.07/2.3.00/30.0037) co-financed from European Social Fund and the state budget of the Czech Republic. The work of JB, OS and JZ was supported by the project Security-OrientedResearch in Information Technology (CEZ MSM0021630528) and the BUT FIT specific research grant (FIT-S-11-2). MetaCentrum is acknowledged for providingaccess to their computing facilities, supported by the Czech Ministry of Education of the Czech Republic (LM2010005). CERIT-SC is acknowledged for providingaccess to their computing facilities, under the program Center CERIT scientific Cloud (CZ.1.05/3.2.00/08.0144). The work of AP was supported by Brno Ph.D. TalentScholarship provided by Brno City Municipality. The funders had no role in study design, data collection and analysis, decision to publish, or preparation of themanuscript.
Competing Interests: The authors have declared that no competing interests exist.
* E-mail: [email protected] (JB); [email protected] (JD)
¤ Current address: Human-Computer Interaction Laboratory, Department of Computer Graphics and Design, Faculty of Informatics, Masaryk University, Brno,Czech Republic.
This is a PLOS Computational Biology Software Article
Introduction
The single nucleotide variants (SNVs) are the most frequent
type of genetic variation in humans, responsible for almost 90% of
known sequence differences [1,2]. Although many of these
changes are neutral, some variants do affect gene expression or
the function of the translated proteins [3,4]. Such SNVs often have
dramatic phenotypic consequences leading to the development of
various diseases [5]. Approximately half of the known disease-
related mutations stems from non-synonymous SNVs, manifested
as amino acid mutations [6,7]. Although it is extremely important
to uncover the links between SNVs and associated diseases, it is
difficult to distinguish pathogenic substitutions from those that are
functionally neutral by any experimental assay due to rapid
growth of the number of known SNVs [8,9]. Therefore,
computational prediction tools became valuable for the initial
analysis of SNVs and their prioritization for experimental
characterization.
There are many computational tools for prediction of the effects
of amino acid substitution on protein function, e.g., MutPred [10],
nsSNPAnalyzer [11], PolyPhen-1 (PPH-1) [12], PolyPhen-2 (PPH-
2) [13], SNAP [14], MAPP [15], PANTHER [16], PhD-SNP [17],
SIFT [18] and SNPs&GO [19]. Most of these tools are designed to
predict whether a particular substitution is neutral or deleterious,
based on various parameters derived from the evolutionary,
physico-chemical or structural characteristics [20,21]. These tools
mainly employ machine learning methods to derive their decision
PLOS Computational Biology | www.ploscompbiol.org 1 January 2014 | Volume 10 | Issue 1 | e1003440

rules based on a training datasets of annotated mutations. Since
overlaps between the training datasets of evaluated tools and the
benchmark datasets have been shown to result in illegitimately
high performance estimates of such tools [22,23], it is of the utmost
importance to carry out any comparisons on fully independent
datasets [24,25]. Variability of the training datasets utilized by
individual prediction tools coupled with the public inaccessibility
of these datasets represent a serious obstacle to unbiased
comparison of predictive power of the tools [21]. Since individual
prediction tools have been developed using different: (i) training
datasets, (ii) machine learning methods and (iii) underlying
principles, it is generally believed that some of them can be
combined to give a single consensus prediction with improved
accuracy [26]. Recent examples of consensus tools are CONDEL
[27], PON-P [28] and Meta-SNP [29], all of which reported
improved performance over individual integrated tools.
In this paper, we constructed three fully independent datasets,
one benchmark and two testing datasets, suitable for assessment of
the performance of eight selected prediction tools in an unbiased
manner. We then combined six best performing methods into a
consensus classifier PredictSNP. The developed consensus of these
prediction tools provided significant improvement in prediction
performance over the individual tools and also over three
previously developed consensus classifiers. Finally, we developed
a web interface to allow an easy access to all eight prediction tools
and consensus PredictSNP. Predictions from the computational
tools are supplemented by experimental annotations from Protein
Mutant Database [30] and UniProt database [31].
Design and Implementation
Prediction ToolsInitially, eight selected prediction tools were chosen for the
evaluation (Table 1). The tools had to satisfy following criteria: (i)
to allow submission of user-defined sequence, (ii) to be available as
a stand-alone application to allow large-scale evaluations and
provide stable service, and (iii) not to require a protein structure
for the prediction since structural information is available only for
a small portion of known sequences. Four selected tools –
nsSNPAnalyzer, PhD-SNP, PPH-2, SNAP – each use a decision
model trained by various machine-learning methods. Out of the
remaining tools, SIFT and PANTHER use solely evolutionary
information, while MAPP also considers the differences in
physicochemical properties between wild-type and mutant amino
acids. Finally, PPH-1 employs an expert set of empirical rules for
the classification [32]. All selected tools were installed on local
server and run using their default settings with the following
modifications. A pipeline developed in the framework of the
HotSpot Wizard server [33] was used for construction of multiple
sequence alignments and a phylogenetic tree for MAPP. In short,
a BLAST sequence search [34] against the non-redundant
database at NCBI [35] is performed to gather protein sequences
similar to the query. Sequences are clustered by CD-HIT 4.6 [36]
and representatives of the clusters aligned using MUSCLE 3.8
[37]. Then, a phylogenetic tree is calculated by Rate4Site 2.01
[38]. PPH-2 offers a choice from two machine-learning models
trained by Naıve Bayes on different datasets – HumDiv [13] and
HumVar [13]. Only the HumDiv-trained model was employed in
this study since HumDiv dataset was constructed using additional
criteria to reduce the number of possibly erroneous annotations
[13]. SIFT can employ two sequence databases for homologues
identification: the non-redundant database at NCBI or UniProt
[31], the former being used in this study. Since the SIFT algorithm
is unable to process very long sequences, we automatically
truncated these sequences into a fragments of 700 amino acids
with analyzed mutation located in theirs centers as recommended
in the user manual. Finally, median sequence conservation of
SIFT method was set to three according to the recommended
range.
DatasetsBenchmark dataset. The benchmark dataset used for the
evaluation of the selected prediction tools and training of
consensus classifier PredictSNP was compiled from five different
sources. The first four constitute training datasets of the tools,
which were not selected for evaluation since they did not meet the
selection criteria defined in the previous section. These sources
were following: SNPs&GO [19] dataset of 58,057 mutations
compiled from SwissProt, the MutPred [10] dataset of 65,654
mutations compiled from SwissProt and HGMD [39] and the
PON-P [28] training dataset of 39,670 mutations compiled from
dbSNP, PhenCode [40], IDbases [41] and 16 individual locus-
specific databases. Since only the HumDiv-trained model of
PPH-2 was employed in this study, we could include its second
dataset HumVar containing 41,918 mutations from SwissProt
and dbSNP into the benchmark dataset. The final source was
Humsavar [42], which is a distinct unit of UniProt containing
36,994 neutral and disease-related mutations found in Uni-
protKB/SwissProt entries. Such combination of sources should
result into a large and diverse dataset. On the other hand, this
dataset will certainly contain many duplicate records as some
particular mutations are in more than one source datasets.
Table 1. Principles and training datasets of eight evaluated tools.
Tool name Version Principle Training dataset Reference
MAPP 28.6.2005 Physicochemical properties and alignment score No training dataset [15]
nsSNPAnalyzer 12.2.2004 Random forest SwissProt 3,511 neutral/502 deleterious [11]
PANTHER 1.02 Hidden Markov model and alignment score No training dataset [16,54]
PhD-SNP 2.06 Support vector machine SwissProt 17,983 neutral/16,330 deleterious [17]
PolyPhen-1 1.18 Expert set of empirical rules No training dataset [12]
PolyPhen-2 2.2.2 Naıve Bayes SwissProt, dbSNP 7,070 neutral/5,322 deleterious [13]
SIFT 4.0.4 Alignment score No training dataset [59]
SNAP 1.1.30 Neural network SwissProt, Protein Mutant Database 40,830neutral/39,987 deleterious
[14]
doi:10.1371/journal.pcbi.1003440.t001
PredictSNP: Robust Consensus Classifier
PLOS Computational Biology | www.ploscompbiol.org 2 January 2014 | Volume 10 | Issue 1 | e1003440

Moreover, this dataset will definitely have large overlaps with the
training datasets of prediction tools selected for evaluation. To
resolve these issues and thus construct fully independent dataset,
we applied following procedures. Pairs of mutations with the
conflict functional annotations were purged, e.g., one particular
mutation is considered as a deleterious in one source dataset, but
neutral in another source dataset. All duplicate mutations were
excluded. The training datasets of all evaluated prediction tools
were collected and mutations overlapping between the training
datasets and our dataset were removed to create fully indepen-
dent PredictSNP benchmark dataset. All selected prediction tools
use at least some position-specific parameters derived from
evolutionary information as significant indicators of pathogenic-
ity. Therefore, we removed both directly overlapping mutations
and mutations at any overlapping positions, i.e., positions which
were mutated in the training datasets of selected prediction tools.
The positions were considered overlapping if they were located in
the fragments of two sequences aligned by BLAST search with e-
value 10210 and the aligned fragments had at least 50% identity.
Finally, all mutations at positions overlapping with testing
datasets described in the next section were removed to assure
independence between PredictSNP benchmark and the testing
datasets. As a complement to the independent PredictSNP
benchmark dataset, another dataset containing only mutations
present also in the training sets of evaluated tools (nsSNPAna-
lyzer, PhD-SNP, PolyPhen-2 and SNAP) was compiled. The
OVERFIT dataset was compiled to estimate the effect of the
overlap between the training datasets of evaluated tools and the
testing dataset on performances of these tools.
Testing datasets. Two testing datasets were prepared for
evaluation of PredictSNP performance. The Protein Mutant
Database (PMD) dataset was derived from PMD (version
07Mar26) which contains experimental information about effects
of 165,880 single point mutations on protein activity, stability and
connections to diseases; extracted from more than 10,000 articles
[30]. The records with annotations [ = ], i.e., no change of activity,
were considered as neutral, while the records with any other
annotations were considered as deleterious. All mutations with
conflicting annotations, e.g., [ = ] and [++] at the same time, were
excluded. Similar to the process employed during the preparation
of the PredictSNP benchmark dataset, all mutations at the
positions overlapping with the training datasets of the evaluated
tools were removed. The subset of PMD testing dataset containing
only the mutations associated with sequences from the UniProt
database, called PMD-UNIPROT, was prepared to enable the
evaluation by CONDEL during the comparison of PredictSNP
classifier to other consensus classifiers.
The second testing dataset was compiled from experimental
studies summarized by Yampolsky and Stoltzfus [43]. One
protein out of twelve was excluded due to very short length (30
amino acid residues). This set was complemented by mutations
gathered from two patent applications issued by Danisco Inc.
describing the effect of mutations on serine protease from Bacillus
subtilis [44] and alpha-amylase from Geobacillus stearothermophilus
[45]. This dataset of thirteen massively mutated proteins (MMP)
initially contained 16,500 mutations. For all mutations originat-
ing from experimental studies, change of activity is provided in
the form of a categorical value. In correspondence with the
construction of PMD testing dataset, only the mutations
maintaining the wild-type level of activity were considered as
neutral. In the case of patent applications, the specific ratio of
activity change for each mutation is known, and accordingly to
the information enclosed in the source materials, the mutations
with the activity changes larger than 50% were considered as
deleterious. Finally, the mutations at the positions overlapping
with training datasets of the evaluated tools or PMD testing
dataset were removed from MMP dataset.
Consensus ClassifierA key step for the development of the consensus classifier is the
design and implementation of computational framework, which
defines the way of combining the results from the individual tools.
In the previous steps, we prepared the datasets and selected the
tools suitable for their evaluation. Then, we retrieved predicted
effects of mutations together with their corresponding confidence
scores, which reflect the degree to which individual tools trust to
their predictions. With the exception of PPH-1, all of the
integrated tools classify the effect of mutation into two classes:
neutral or deleterious. PPH-1 provides extra class of possibly
deleterious, which can be considered as a deleterious class with the
confidence score equal to 0.5. Unfortunately, all integrated tools
use different scales for reporting their confidence scores, which
renders their combination and direct comparison problematic.
Therefore, we transformed the individual confidence scores to one
comparable scale in range of 0–100% using the values of their
observed accuracies, which express the fraction of correct
predictions by a given tool on the particular level of confidence.
The transformation functions defining the relationships between
the confidence score of each tool and their corresponding observed
accuracies were derived using PredictSNP benchmark dataset. For
the integrated tools providing the confidence score in a form of
categorical value (PhD-SNP, PolyPhen-1 and SNAP), the observed
accuracies were calculated as the number of correct predictions to
the number of all predictions separately for each category. For the
remaining tools, all evaluated mutations from PredictSNP dataset
were sorted by the continuous value, indicating confidence score
and consequently partitioned into 60 bins consisting of equivalent
number of members. Finally, these bins were averaged over five
neighboring bins. Since the relationship between the confidence
score and the observed accuracy can be different for deleterious
and neutral prediction classes, the transformation functions were
developed for both classes separately (Figure S1). After the overall
predictions and corresponding transformed confidence scores were
obtained, the PredictSNP consensus prediction was calculated
using the following equation:
PredictSNP score~
PN
i~1
di:Sið Þ
PN
i~1
Si
,
where N is the number of integrated tools, di represents the overall
prediction (+1 for the deleterious prediction, 21 for the neutral
prediction) and Si expresses the transformed confidence scores.
The output value of PredictSNP score belongs to the continuous
interval ,21, +1.. The mutations are considered to be neutral
for the values in the interval ,21, 0. and deleterious for the
values in the interval (0, +1.. The absolute distance of the
PredictSNP score from zero expresses the confidence of the
consensus classifier about its prediction. For easy comparison with
the confidence scores of individual integrated tools, we trans-
formed the confidence of the PredictSNP consensus classifier to
the observed accuracy in the same way as described for confidence
scores of the integrated tools (Figure S1).
Besides implementing the advanced weighted majority vote
model, the induction of the consensus model was performed by
using six different machine learning methods of WEKA 3.75
PredictSNP: Robust Consensus Classifier
PLOS Computational Biology | www.ploscompbiol.org 3 January 2014 | Volume 10 | Issue 1 | e1003440

software package [46]. The first selected method was the Naıve
Bayes (weka.classifiers.bayes.NaiveBayes), representing a probabilistic
classifier based on the Bayesian theorem [47]. As a representative
of the class of regression analysis models, we used the multinomial
logistic regression model with a ridge estimator (weka.classifiers.-
functions.Logistic) [48]. Neural networks were represented by the
voted perceptron algorithm in the implementation by Freund and
Schapire (weka.classifiers.functions.VotedPerceptron) [49]. From the class
of Support Vector Machine (SVM) classifiers, the SVM with
polynomial kernel function as implemented in LIBSVM was
selected (weka.classifiers.functions.LibSVM) [50]. The K-nearest
neighbor classifier represented the class of classifiers based on
the assumption that similar cases belong to the same class
(weka.classifiers.lazy.IBk) [51]. Finally, the ensemble-based approach
– Random forest – was selected, which constructs set of decision
trees and the classification is based on the consensus of their
decisions (weka.classifiers.trees.RandomForest) [52]. All models were
derived using the default parameters.
Results
Construction of DatasetsIn this study, we performed an evaluation of eight tools for
prediction of the effects of mutations on protein function and
combined six of them into the consensus classifier PredictSNP (for
explanation of employed evaluation metrics see Supporting text
S1). The proper benchmark dataset is of prime importance for the
evaluation of prediction tools since overlaps between the
composition of the benchmark dataset and the training datasets
of a tool would result into overly optimistic performance
evaluation of such tool [22,23]. These overlaps can also hinder
the construction of consensus classifier as an unwarranted degree
of significance could be given to the tools with overlap between
datasets [22]. For these reasons, we strived to secure the full
independence of the PredictSNP benchmark dataset for unbiased
evaluation of selected tools and proper training of our consensus
classifier. The same care was also taken when preparing both
Figure 1. Workflow diagram describing construction of independent datasets. The various sources of mutation data are shown in yellow,intermediate datasets in white, Protein Mutant Database (PMD) testing dataset and the testing dataset compiled from studies on massively mutatedproteins (MMP) in blue, and PredictSNP benchmark dataset in green. The data from the original training datasets of all evaluated tools shown in redwere removed from newly constructed datasets.doi:10.1371/journal.pcbi.1003440.g001
PredictSNP: Robust Consensus Classifier
PLOS Computational Biology | www.ploscompbiol.org 4 January 2014 | Volume 10 | Issue 1 | e1003440

testing datasets for the comparison of performance of PredictSNP
consensus classifier, its constituent tools and other consensus
classifiers.
The independent benchmark dataset was combined from five
redundant datasets by removing all duplicates and subtracting all
mutations present at the positions used in the training of the
evaluated tools or in any of the two testing datasets (Figure 1). This
procedure resulted in the PredictSNP benchmark dataset of
43,882 mutations (24,082 neutral and 19,800 deleterious) in the
10,085 protein sequences (Dataset S1). Complementary OVER-
FIT dataset was compiled from mutations present in the training
sets of evaluated tools (Dataset S2). This dataset contained 32,776
mutations (15,081 neutral and 17,695 deleterious) in the 6,889
protein sequences.
Similarly, two testing datasets for evaluation of consensus
classifier were prepared from Protein Mutant Database (PMD)
and studies on massively mutated proteins (MMP) (Figure 1). The
testing datasets consisted of 3,497 mutations (1,248 neutral and
2,249 deleterious) in 1,189 protein sequences for PMD dataset
(Dataset S3) and 11,994 mutations (4,456 deleterious and
7,538neutral) in 13 protein sequences for MMP dataset (Dataset
S4). The PMD-UNIPROT subset of PMD dataset with mapping
on UniProt database was compiled from 1,430 mutations (518
neutral and 912 deleterious) in the 433 protein sequences.
The distributions of wild-type and mutant residues for all four
datasets were compared with the expected distributions (Table S1,
S2, S3, S4) and the Pearson correlation coefficients between
observed and expected distributions were calculated. This analysis
showed that all datasets are biased. Following correlation
coefficients were observed: 0.69 for OVERFIT dataset, 0.54 for
Figure 2. Distribution of amino acids in PredictSNP benchmarkdataset. Expected distributions of amino acid residues were extractedfrom 105,990 sequences in the non-redundant OWL protein database(release 26.0) [58].doi:10.1371/journal.pcbi.1003440.g002
Table 2. Performance of individual and PredictSNP prediction tools with three independent datasets.
Performance metricsa Dataset MAPP nsSNPAnalyzer PANTHER PhD-SNP PPH-1 PPH-2 SIFT SNAP PredictSNP
Percent of evaluatedmutations
PredictSNP 87.8 33.5 54.6 100.0 98.8 100.0 97.1 99.1 100.0
PMD 81.1 63.4 38.1 100.0 97.1 98.3 77.6 95.1 100.0
MMP 99.8 91.5 61.9 100.0 97.7 97.7 95.4 100.0 100.0
Overall 89.9 47.0 55.1 100.0 98.5 99.4 95.6 99.0 100.0
Accuracyb PredictSNP 0.711 0.632 0.642 0.746 0.682 0.701 0.723 0.670 0.747
PMD 0.653 0.629 0.651 0.633 0.654 0.632 0.643 0.631 0.642
MMP 0.707 0.618 0.603 0.629 0.684 0.677 0.646 0.709 0.708
Overall 0.707 0.629 0.635 0.715 0.681 0.692 0.703 0.676 0.733
Matthews correlationcoefficientb
PredictSNP 0.423 0.219 0.296 0.494 0.364 0.407 0.447 0.346 0.492
PMD 0.327 0.243 0.303 0.258 0.299 0.289 0.312 0.253 0.281
MMP 0.400 0.228 0.227 0.255 0.357 0.359 0.308 0.406 0.408
Overall 0.413 0.223 0.282 0.432 0.358 0.390 0.411 0.353 0.463
Area under the receiveroperating characteristicscurveb
PredictSNP 0.773 0.634 0.692 0.812 0.695 0.776 0.784 0.732 0.808
PMD 0.695 0.630 0.697 0.676 0.658 0.704 0.685 0.667 0.700
MMP 0.759 0.620 0.676 0.685 0.720 0.774 0.710 0.769 0.787
Overall 0.766 0.631 0.689 0.778 0.698 0.771 0.763 0.735 0.797
PPH-1 – PolyPhen-1; PPH-2 – PolyPhen-2; PMD dataset – dataset from Protein Mutant Database; MMP – dataset of massively mutated proteins;a– detailed evaluation is available in Tables S5, S6, S7;b– these metrics were calculated with normalized numbers.doi:10.1371/journal.pcbi.1003440.t002
PredictSNP: Robust Consensus Classifier
PLOS Computational Biology | www.ploscompbiol.org 5 January 2014 | Volume 10 | Issue 1 | e1003440

PredictSNP benchmark dataset, 0.52 for MMP dataset and 0.21
for PMD dataset. In the case of PMD dataset, the observed bias is
largely due to fivefold overrepresentation of alanine in the mutant
distribution - an obvious consequence of the frequent use of
alanine scanning technique. Although the weak correlation
calculated for PredictSNP benchmark suggested considerable
differences between observed and expected distribution, the
individual deviations for particular amino acids are rarely extreme
(Figure 2) with the average 33% difference from the expected
numbers (Table S1). The most striking difference was observed for
arginine and cysteine, which were twice more frequently present in
the wild-type distribution, while cysteine and tryptophan were
twice more frequently present in the mutant distribution (Table
S1). Underrepresentation by more than 25% was observed for
phenylalanine, lysine and glutamine in the wild-type distribution
and alanine, glutamine, leucine and aspartic acid in the mutant
distribution (Table S1).
Evaluation of Individual Prediction ToolsThe performance of individual prediction methods was
compared using the PredictSNP benchmark dataset (Table 2
and S5). The evaluation showed that the applicability of some of
the tools is limited to only a part of the dataset. 66% of the
dataset was not evaluated by nsSNPAnalyzer due to a require-
ment for the existence of a homologous protein to the
investigated sequence in the ASTRAL database [53], a condition
which was not fulfilled by many protein sequences in PredictSNP
benchmark dataset. PANTHER was not able to evaluate 45% of
the dataset mainly due to the fact that the investigated mutations
could not be found at given positions in the pre-computed
multiple sequence alignments of PANTHER library [54]. In the
case of MAPP, 12% of the PredictSNP benchmark dataset was
not evaluated due to mutations located within gaps of multiple
sequence alignments.
Concerning the overall performance of individual tools,
PANTHER and nsSNPAnalyzer exhibited significantly lower
accuracies, Matthews correlation coefficients and area under the
receiver operating characteristics curve (AUC) than other evalu-
ated tools on PredictSNP benchmark dataset (Table 2). The other
six evaluated prediction tools achieved very good performances
with the accuracy ranging from 0.68 to 0.75, and Matthews
correlation coefficient ranging from 0.35 to 0.49.
Additionally, we assessed the effect of the dataset independence
on the tool performance. The individual tools were evaluated with
OVERFIT dataset containing only the mutations from the
training datasets of the evaluated tools (Table S8). In comparison
with the independent dataset, the increase of accuracy by 5% was
observed for PPH-2 and SNAP. The most striking difference was
measured for PhD-SNP for which the accuracy increased by more
than 11%. Training dataset of PhD-SNP constituted over 94% of
the OVERFIT dataset.
The performances of individual tools observed with PredictSNP
benchmark dataset were in good correspondence with a recent
comprehensive evaluation of nine prediction methods by Thus-
berg et al. [25]. The differences in performance can be attributed
to differences in benchmark datasets, and the fact that a fully
Figure 3. Overall receiver operating characteristic curves for allthree independent datasets. Comparison of PredictSNP and itsconstituent tools with PredictSNP benchmark dataset (A). Comparisonof PredictSNP and other consensus classifiers with MMP data set (B) andPMD-UNIPROT dataset (C). The dashed line represents random rankingwith AUC equal to 0.5.doi:10.1371/journal.pcbi.1003440.g003
PredictSNP: Robust Consensus Classifier
PLOS Computational Biology | www.ploscompbiol.org 6 January 2014 | Volume 10 | Issue 1 | e1003440

independent dataset has not been used for evaluation due to the
inaccessibility of training datasets for several evaluated tools [25].
We analyzed benchmark dataset of Thusberg et al. in detail and
found out that only about 33% of mutations (13,467 cases) is
shared with our benchmark dataset and about 56% of mutations
(22,652 cases) is shared with training sets of evaluated tools, i.e.,
MutPred, nsSNPAnalyzer, PhD-SNP, PolyPhen-2 and SNAP,
SNPs&GO (Table S9). Despite of these differences in composition
of the benchmark datasets, all shared tools differ in accuracy by
less than 5% with the exception of SIFT and PANTHER. The
difference of about 7% for SIFT can be explained by different
settings or selection of different database for identification of
homologues. In the case of PANTHER, the difference of about
12% can be caused by newer version of the decision core (cSNP
1.02 instead of cSNP 1.00) and updated version of PANTHER
library (7.2 instead of 6.0).
Development of Consensus ClassifierWith the exception of PANTHER and nsSNPAnalyzer, all
other six evaluated tools were selected for the development of
consensus classifier. The prediction tools employed in the
consensus system should be as accurate as possible and also have
different decision boundaries. Therefore, we verified the absence
of strong correlation between any pair of tools that could
negatively affect the consensus prediction (Table S10). To identify
the most suitable method for combining the selected tools, we
trained seven consensus classifiers on the PredictSNP benchmark
dataset using seven machine learning methods, which represent
the most important classification principles [55]. To our surprise,
none of the methods provided a clearly superior performance
despite very different level of complexity of employed model
(Table S11). The majority vote weighted by the transformed
confidence scores of the integrated tools provided the most
balanced performance over the investigated datasets. Therefore,
motivated by its good performance and small probability of over-
fitting [56,57], we utilized the majority vote weighted by the
transformed confidence scores for the development of our
consensus classifier PredictSNP. The comparison of overall
performance of the PredictSNP classifier and its integrated tools
over all three independent datasets showed that the combining
these tools into the consensus lead to significantly improved
prediction with respect to the best of the integrated tools (Table 2
and Figure 3A). Since a single tool could be the best choice for
one dataset and moderate or even a poor choice for another
dataset (Table 2), the combination of their predictions by
PredictSNP represents a robust alternative for users who are
not experts on the prediction tools or miss information about
involvement of studied protein in the training of some particular
tool.
Comparison of PredictSNP with Other ConsensusClassifiers
The performance of newly developed PredictSNP was compared
to other consensus classifiers CONDEL, PON-P and Meta-SNP
using the PMD-UNIPROT and MMP testing datasets. The nature
of these datasets is very different. While PMD-UNIPROT dataset
contains a large number of proteins with only about three mutations
per protein, MMP dataset consists of only a few proteins associated
with a very large number of mutations. CONDEL, Meta-SNP and
Table 3. Performance of consensus classifiers with PMD-UNIPROT and MMP datasets.
Performancemetricsa PMD-UNIPROT MMP
CONDEL Meta-SNP PredictSNP CONDEL Meta-SNP PredictSNP
Percent of evaluated mutations 100.0 100.0 100.0 100.0 99.7 100.0
Accuracyb 0.562 0.670 0.679 0.640 0.673 0.708
Matthews correlation coefficientb 0.202 0.343 0.366 0.349 0.351 0.433
Area under the receiver operating characteristicscurveb
0.755 0.709 0.732 0.770 0.730 0.780
a– detailed evaluation is available in Table S12;b– these metrics were calculated with normalized numbers.doi:10.1371/journal.pcbi.1003440.t003
Figure 4. Workflow diagram of PredictSNP. Upon submission ofthe input sequence and specification of investigated mutations,integrated predictors of pathogenicity are employed for evaluation ofthe mutation and the consensus prediction is calculated. In themeantime, UniProt and PMD databases are queried to gather therelevant annotations.doi:10.1371/journal.pcbi.1003440.g004
PredictSNP: Robust Consensus Classifier
PLOS Computational Biology | www.ploscompbiol.org 7 January 2014 | Volume 10 | Issue 1 | e1003440
PredictSNP consensus tools were able to evaluate almost all
mutations from both PMD-UNIPROT and MMP testing datasets
enabling their mutual comparison (Table 3, Table S12 and
Figure 3B,C). The best performing tool on PMD-UNIPROT testing
dataset varies according to the evaluation metrics. The highest
accuracy (0.679) and Matthews coefficient (0.366) was observed for
PredictSNP, while CONDEL achieved better result for AUC. For
MMP dataset, the results confirmed a significantly improved
performance of PredictSNP in all three employed metrics. Obtained
significant difference in the accuracy of Meta-SNP and CONDEL is
in good correspondence with 4% difference previously reported for
the comparison of these tools with the NSV-2012 dataset consisting
of 972 mutations from the SwissVar database [29].
The prediction by PON-P was obtained only for 62% and 58%
of PMD-UNIPROT and MMP datasets, respectively. This is
because PON-P assigns the effect of mutations as unknown for
cases with less reliable prediction. To evaluate the benefit of PON-
P approach, we compared the performance of PON-P with
modified version of PredictSNP, which returned predictions for
the same number of mutations as PON-P (Table S13). These
mutations have the highest PredictSNP score reflecting the degree
of confidence in its own decision. In the case of PMD-UNIPROT
dataset, the accuracy of modified PredictSNP predictions was
increased by 3.7% to 71.6%, compared to PON-P accuracy
72.9%. In the case of MMP dataset, the accuracy of modified
PredictSNP was increased by 7.6% to 78.4%, compared to PON-
P accuracy 75.7%. The significant reduction in the number of
evaluated mutations led to the large improvement in the
prediction accuracy.
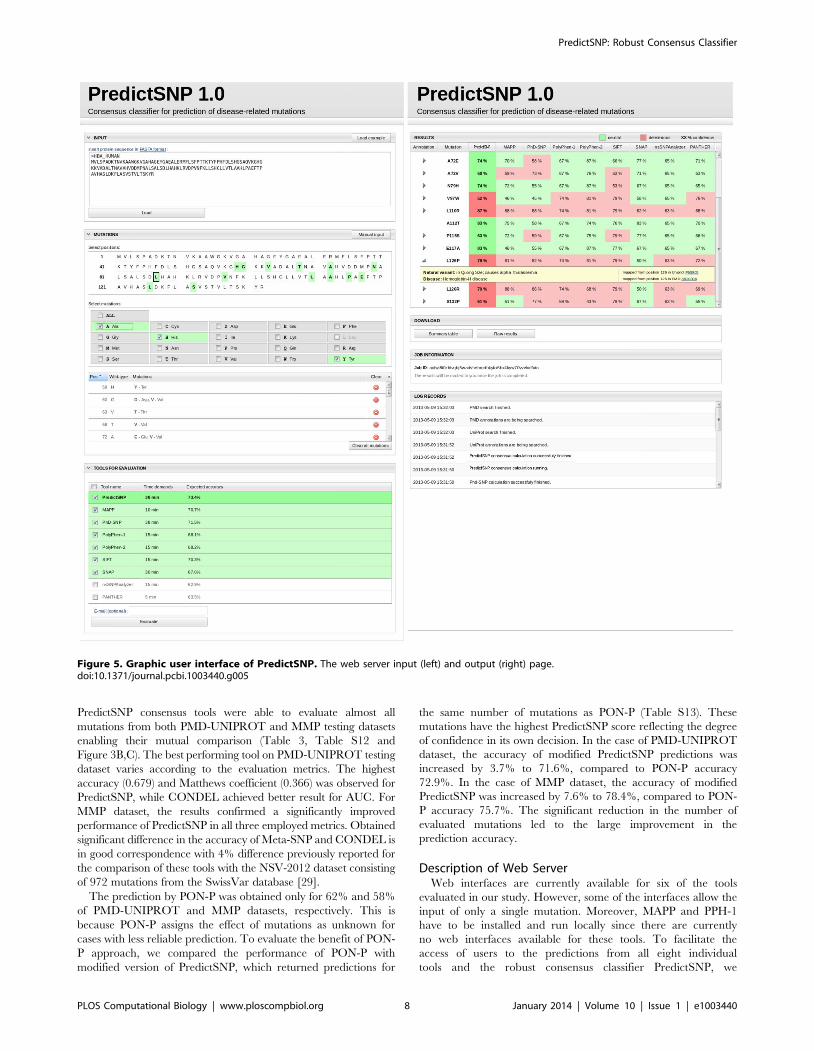
Description of Web ServerWeb interfaces are currently available for six of the tools
evaluated in our study. However, some of the interfaces allow the
input of only a single mutation. Moreover, MAPP and PPH-1
have to be installed and run locally since there are currently
no web interfaces available for these tools. To facilitate the
access of users to the predictions from all eight individual
tools and the robust consensus classifier PredictSNP, we
Figure 5. Graphic user interface of PredictSNP. The web server input (left) and output (right) page.doi:10.1371/journal.pcbi.1003440.g005
PredictSNP: Robust Consensus Classifier
PLOS Computational Biology | www.ploscompbiol.org 8 January 2014 | Volume 10 | Issue 1 | e1003440

developed a web interface to allow comfortable submission of jobs
and retrieval of the results from the individual tools and databases
as well as the consensus classifier PredictSNP (Figure 4).
Using this web server, a user can load an amino acid sequence
of a query protein in FASTA format, select positions for mutations
and desired mutations using the input page (Figure 5). Alterna-
tively, the user can submit a list of mutations in a text format. After
all desired mutations are specified, the user can select tools to be
employed for the evaluation of selected mutations. A time estimate
is provided for each tool and a number of mutations, based on an
average evaluation time for individual tools.
The server then runs the prediction using all selected tools. In
the cases where MAPP is included in the selection, the necessary
multiple sequence alignment and phylogenetic tree are automat-
ically calculated. The confidence scores of integrated tools are
transformed to observed accuracies and together with correspond-
ing prediction combined into PredictSNP prediction using the
weighted majority vote consensus. The prediction is finalized by
calculation of the PredictSNP confidence score. To provide a full
picture about an inferred effect of mutation on protein function,
the predictions are complemented with the experimental annota-
tions. The UniProt and the Protein Mutant Databases are queried
for any annotation regarding mutated positions in closely
homologous proteins with identity over 95%, supplying informa-
tion on the importance of the given position for the protein
function, the overview of known natural variations at the position,
the experimentally characterized mutations at the position as well
as their connection to disease.
The predictions of individual tools and the consensus
prediction by PredictSNP for all selected mutations are
provided together with the confidence of these predictions on
the output page (Figure 5). If available, the experimental
annotations for studied mutations are provided along with links
to respective records in the databases to complement the
prediction. The user can download the summary of results in
the form of a comma separated values (CSV) file or the detailed
results including also the output files from individual tools as a
single zip file.
Availability and Future Directions
The PredictSNP web server is freely available to the community
at http://loschmidt.chemi.muni.cz/predictsnp. The developed
datasets (Dataset S1, S2, S3, S4), the user manual (Supporting
text S2) and standalone version of PredictSNP consensus
calculator (Software S1) are also available from the website. The
standalone version represents an alternative to web server that is
suitable for massive mutagenesis studies. In contrast to the online
version, the standalone version requires pre-calculated predictions
from all six integrated tools as an input. For the best performance,
a user should use the same version and settings of integrated tools
as described in the method section.
Concerning the future development, authors plan to assess new
emerging tools for the prediction of the effect of mutations and to
consider integrating any stand-alone tool that would provide
additional improvement in the collective prediction. Particular
attention will be focused on the tools employing principles or
attributes not considered by currently integrated tools, e.g.
mutations on the correlated positions, protein-protein interaction
sites and others.
Supporting Information
Dataset S1 Composition of PredictSNP benchmark dataset.
(XLSX)
Dataset S2 Composition of OVERFIT testing dataset.
(XLSX)
Dataset S3 Composition of PMD testing dataset.
(XLSX)
Dataset S4 Composition of MMP testing dataset.
(XLSX)
Figure S1 Transformation functions between confidence score of
individual tools and developed consensus classifier, and observed
accuracies of these tools on PredictSNP benchmark dataset.
(TIF)
Software S1 Standalone version of PredictSNP for calculation
of consensus prediction.
(GZ)
Table S1 Composition of PredictSNP benchmark dataset.
(PDF)
Table S2 Composition of PMD testing dataset.
(PDF)
Table S3 Composition of MMP testing dataset.
(PDF)
Table S4 Composition of OVERFIT testing dataset.
(PDF)
Table S5 Performance of prediction tools with PredictSNP
benchmark dataset.
(PDF)
Table S6 Performance of prediction tools with PMD testing
dataset.
(PDF)
Table S7 Performance of prediction tools with MMP testing
dataset.
(PDF)
Table S8 Performance of prediction tools with OVERFIT
testing dataset.
(PDF)
Table S9 Comparison of performance evaluation with Thusberg
dataset and PredictSNP benchmark dataset.
(PDF)
Table S10 Pairwise correlation of integrated tools.
(PDF)
Table S11 Performance of selected machine learning methods
with PredictSNP, PMD and MMP datasets.
(PDF)
Table S12 Performance of consensus classifiers with PMD-
UNIPROT and MMP datasets.
(PDF)
Table S13 Performance of consensus classifiers PON-P and
PredictSNP with PMD-UNIPROT and MMP datasets.
(PDF)
Text S1 Performance evaluation metrics.
(PDF)
Text S2 PredictSNP user guide.
(PDF)
Acknowledgments
The authors would like to express many thanks to Dr. Tomas Kara
(International Centre for Clinical Research, Brno, Czech Republic) for
PredictSNP: Robust Consensus Classifier
PLOS Computational Biology | www.ploscompbiol.org 9 January 2014 | Volume 10 | Issue 1 | e1003440

valuable discussions which initiated this project and Dr. Wolfgang Aehle
(BRAIN, Zwingenberg, Germany) for pointing to us the mutation data
from patent applications.
Author Contributions
Conceived and designed the experiments: JBe JS OS AP EDW JZ JBr JD.
Performed the experiments: JBe JS OS. Analyzed the data: JBe JZ JBr JD.
Wrote the paper: JBe JBr JD. Contributed the software code: JBe JS.
Edited the manuscript: JS OS AP EDW JZ.
References
1. Collins FS, Brooks LD, Chakravarti A (1998) A DNA polymorphism discovery
resource for research on human genetic variation. Genome Res 8: 1229–1231.
2. Abecasis GR, Altshuler D, Auton A, Brooks LD, Durbin RM, et al. (2010) A
map of human genome variation from population-scale sequencing. Nature 467:
1061–1073. doi:10.1038/nature09534.
3. Collins FS, Guyer MS, Charkravarti A (1997) Variations on a theme: cataloging
human DNA sequence variation. Science 278: 1580–1581.
4. Risch N, Merikangas K (1996) The future of genetic studies of complex human
diseases. Science 273: 1516–1517.
5. Studer RA, Dessailly BH, Orengo CA (2013) Residue mutations and their
impact on protein structure and function: detecting beneficial and pathogenic
changes. Biochem J 449: 581–594. doi:10.1042/BJ20121221.
6. Cargill M, Altshuler D, Ireland J, Sklar P, Ardlie K, et al. (1999)
Characterization of single-nucleotide polymorphisms in coding regions of
human genes. Nat Genet 22: 231–238. doi:10.1038/10290.
7. Halushka MK, Fan JB, Bentley K, Hsie L, Shen N, et al. (1999) Patterns of
single-nucleotide polymorphisms in candidate genes for blood-pressure homeo-
stasis. Nat Genet 22: 239–247. doi:10.1038/10297.
8. Tranchevent L-C, Capdevila FB, Nitsch D, De Moor B, De Causmaecker P, et
al. (2011) A guide to web tools to prioritize candidate genes. Brief Bioinform 12:
22–32. doi:10.1093/bib/bbq007.
9. Capriotti E, Nehrt NL, Kann MG, Bromberg Y (2012) Bioinformatics for
personal genome interpretation. Brief Bioinform 13: 495–512. doi:10.1093/bib/
bbr070.
10. Li B, Krishnan VG, Mort ME, Xin F, Kamati KK, et al. (2009) Automated
inference of molecular mechanisms of disease from amino acid substitutions.
Bioinforma Oxf Engl 25: 2744–2750. doi:10.1093/bioinformatics/btp528.
11. Bao L, Zhou M, Cui Y (2005) nsSNPAnalyzer: identifying disease-associated
nonsynonymous single nucleotide polymorphisms. Nucleic Acids Res 33: W480–
W482. doi:10.1093/nar/gki372.
12. Ramensky V, Bork P, Sunyaev S (2002) Human non-synonymous SNPs: server
and survey. Nucleic Acids Res 30: 3894–3900. doi:10.1093/nar/gkf493.
13. Adzhubei IA, Schmidt S, Peshkin L, Ramensky VE, Gerasimova A, et al. (2010)
A method and server for predicting damaging missense mutations. Nat Methods
7: 248–249. doi:10.1038/nmeth0410-248.
14. Bromberg Y, Rost B (2007) SNAP: predict effect of non-synonymous
polymorphisms on function. Nucleic Acids Res 35: 3823–3835. doi:10.1093/
nar/gkm238.
15. Stone EA, Sidow A (2005) Physicochemical constraint violation by missense
substitutions mediates impairment of protein function and disease severity.
Genome Res 15: 978–986. doi:10.1101/gr.3804205.
16. Thomas PD, Kejariwal A (2004) Coding single-nucleotide polymorphisms
associated with complex vs. Mendelian disease: Evolutionary evidence for
differences in molecular effects. Proc Natl Acad Sci U S A 101: 15398–15403.
doi:10.1073/pnas.0404380101.
17. Capriotti E, Calabrese R, Casadio R (2006) Predicting the insurgence of human
genetic diseases associated to single point protein mutations with support vector
machines and evolutionary information. Bioinformatics 22: 2729–2734.
doi:10.1093/bioinformatics/btl423.
18. Ng PC, Henikoff S (2003) SIFT: Predicting amino acid changes that affect
protein function. Nucleic Acids Res 31: 3812–3814.
19. Calabrese R, Capriotti E, Fariselli P, Martelli PL, Casadio R (2009) Functional
annotations improve the predictive score of human disease-related mutations in
proteins. Hum Mutat 30: 1237–1244. doi:10.1002/humu.21047.
20. Karchin R (2009) Next generation tools for the annotation of human SNPs. Brief
Bioinform 10: 35–52. doi:10.1093/bib/bbn047.
21. Ng PC, Henikoff S (2006) Predicting the effects of amino acid substitutions on
protein function. Annu Rev Genomics Hum Genet 7: 61–80. doi:10.1146/
annurev.genom.7.080505.115630.
22. Castaldi PJ, Dahabreh IJ, Ioannidis JPA (2011) An empirical assessment of
validation practices for molecular classifiers. Brief Bioinform 12: 189–202.
doi:10.1093/bib/bbq073.
23. Baldi P, Brunak S (2001) Bioinformatics: The machine learning approach.
CambridgeMA: MIT Press. 492 p.
24. Simon R (2005) Roadmap for developing and validating therapeutically relevant
genomic classifiers. J Clin Oncol Off J Am Soc Clin Oncol 23: 7332–7341.
doi:10.1200/JCO.2005.02.8712.
25. Thusberg J, Olatubosun A, Vihinen M (2011) Performance of mutation
pathogenicity prediction methods on missense variants. Hum Mutat 32: 358–
368. doi:10.1002/humu.21445.
26. Polikar R (2006) Ensemble based systems in decision making. IEEE Circuits Syst
Mag 6: 21–45. doi:10.1109/MCAS.2006.1688199.
27. Gonzalez-Perez A, Lopez-Bigas N (2011) Improving the assessment of theoutcome of nonsynonymous SNVs with a consensus deleteriousness score,
Condel. Am J Hum Genet 88: 440–449. doi:10.1016/j.ajhg.2011.03.004.
28. Olatubosun A, Valiaho J, Harkonen J, Thusberg J, Vihinen M (2012) PON-P:
Integrated predictor for pathogenicity of missense variants. Hum Mutat 33:1166–1174. doi:10.1002/humu.22102.
29. Capriotti E, Altman RB, Bromberg Y (2013) Collective judgment predicts
disease-associated single nucleotide variants. BMC Genomics 14: S2.doi:10.1186/1471-2164-14-S3-S2.
30. Kawabata T, Ota M, Nishikawa K (1999) The Protein Mutant Database.
Nucleic Acids Res 27: 355–357.
31. The UniProt Consortium (2011) Reorganizing the protein space at the Universal
Protein Resource (UniProt). Nucleic Acids Res 40: D71–D75. doi:10.1093/nar/
gkr981.
32. Sunyaev S, Ramensky V, Koch I, Lathe W 3rd, Kondrashov AS, et al. (2001)
Prediction of deleterious human alleles. Hum Mol Genet 10: 591–597.
33. Pavelka A, Chovancova E, Damborsky J (2009) HotSpot Wizard: a web server
for identification of hot spots in protein engineering. Nucleic Acids Res 37:W376–W383. doi:10.1093/nar/gkp410.
34. Altschul SF, Madden TL, Schaffer AA, Zhang J, Zhang Z, et al. (1997) Gapped
BLAST and PSI-BLAST: a new generation of protein database searchprograms. Nucleic Acids Res 25: 3389–3402.
35. Sayers EW, Barrett T, Benson DA, Bolton E, Bryant SH, et al. (2010) Database
resources of the National Center for Biotechnology Information. Nucleic AcidsRes 38: D5–D16. doi:10.1093/nar/gkp967.
36. Huang Y, Niu B, Gao Y, Fu L, Li W (2010) CD-HIT Suite: a web server for
clustering and comparing biological sequences. Bioinformatics 26: 680–682.
doi:10.1093/bioinformatics/btq003.
37. Edgar RC (2004) MUSCLE: a multiple sequence alignment method with
reduced time and space complexity. BMC Bioinformatics 5: 113. doi:10.1186/
1471-2105-5-113.
38. Friedman N, Ninio M, Pe’er I, Pupko T (2002) A structural EM algorithm for
phylogenetic inference. J Comput Biol J Comput Mol Cell Biol 9: 331–353.
doi:10.1089/10665270252935494.
39. Stenson PD, Ball EV, Mort M, Phillips AD, Shaw K, et al. (2012) The Human
Gene Mutation Database (HGMD) and its exploitation in the fields of
personalized genomics and molecular evolution. Curr Protoc Bioinforma
Chapter 1: Unit1.13. doi:10.1002/0471250953.bi0113s39.
40. Giardine B, Riemer C, Hefferon T, Thomas D, Hsu F, et al. (2007) PhenCode:
connecting ENCODE data with mutations and phenotype. Hum Mutat 28:
554–562. doi:10.1002/humu.20484.
41. Piirila H, Valiaho J, Vihinen M (2006) Immunodeficiency mutation databases
(IDbases). Hum Mutat 27: 1200–1208. doi:10.1002/humu.20405.
42. Wu CH, Apweiler R, Bairoch A, Natale DA, Barker WC, et al. (2006) TheUniversal Protein Resource (UniProt): an expanding universe of protein
information. Nucleic Acids Res 34: D187–D191. doi:10.1093/nar/gkj161.
43. Yampolsky LY, Stoltzfus A (2005) The exchangeability of amino acids inproteins. Genetics 170: 1459–1472. doi:10.1534/genetics.104.039107.
44. Aehle W, Cascao-Pereira LG, Estell DA, Goedegebuur F, Kellis JJT, et al.
(2010) Compositions and methods comprising serine protease variants.
45. Cuevas WA, Estell DE, Hadi SH, Lee S-K, Ramer SW, et al. (2009) Geobacillus
Stearothermophilus Alpha-Amylase (AmyS) Variants with Improved Properties.
46. Hall M, Frank E, Holmes G, Pfahringer B, Reutemann P, et al. (2009) TheWEKA data mining software: an update. SIGKDD Explor Newsl 11: 10–18.
doi:10.1145/1656274.1656278.
47. John GH, Langley P (1995) Estimating continuous distributions in Bayesian
classifiers. Proceedings of the Eleventh conference on Uncertainty in artificialintelligence. UAI’95. San Francisco, CA, USA: Morgan Kaufmann Publishers
Inc. pp. 338–345. Available: http://dl.acm.org/citation.cfm?id = 2074158.
2074196. Accessed 25 June 2013.
48. Cessie L, Houwelingen V (1992) Ridge estimators in logistic regression. Appl
Stat 41: 191–201. doi:10.2307/2347628.
49. Freund Y, Schapire RE (1999) Large margin classification using the perceptronalgorithm. Mach Learn 37: 277–296. doi:10.1023/A:1007662407062.
50. Chang C-C, Lin C-J (2011) LIBSVM: A library for support vector machines.
ACM Trans Intell Syst Technol 2: 27:1–27:27. doi:10.1145/1961189.1961199.
51. Aha DW, Kibler D, Albert MK (1991) Instance-based learning algorithms.
Mach Learn 6: 37–66. doi:10.1023/A:1022689900470.
52. Breiman L (2001) Random forests. Mach Learn 45: 5–32. doi:10.1023/A:1010933404324.
53. Chandonia J-M, Hon G, Walker NS, Lo Conte L, Koehl P, et al. (2004) The
ASTRAL Compendium in 2004. Nucleic Acids Res 32: D189–192.
doi:10.1093/nar/gkh034.
PredictSNP: Robust Consensus Classifier
PLOS Computational Biology | www.ploscompbiol.org 10 January 2014 | Volume 10 | Issue 1 | e1003440

54. Thomas PD, Campbell MJ, Kejariwal A, Mi H, Karlak B, et al. (2003)
PANTHER: A Library of protein families and subfamilies indexed by function.Genome Res 13: 2129–2141. doi:10.1101/gr.772403.
55. Larranaga P, Calvo B, Santana R, Bielza C, Galdiano J, et al. (2006) Machine
learning in bioinformatics. Brief Bioinform 7: 86–112. doi:10.1093/bib/bbk007.56. Baldi P, Brunak S, Chauvin Y, Andersen CAF, Nielsen H (2000) Assessing the
accuracy of prediction algorithms for classification: An overview. Bioinformatics16: 412–424. doi:10.1093/bioinformatics/16.5.412.
57. Cooper GM, Shendure J (2011) Needles in stacks of needles: finding disease-
causal variants in a wealth of genomic data. Nat Rev Genet 12: 628–640.doi:10.1038/nrg3046.
58. Bleasby AJ, Akrigg D, Attwood TK (1994) OWL–a non-redundant composite
protein sequence database. Nucleic Acids Res 22: 3574–3577.59. Sim N-L, Kumar P, Hu J, Henikoff S, Schneider G, et al. (2012) SIFT web
server: predicting effects of amino acid substitutions on proteins. Nucleic AcidsRes 40: W452–W457. doi:10.1093/nar/gks539.
PredictSNP: Robust Consensus Classifier
PLOS Computational Biology | www.ploscompbiol.org 11 January 2014 | Volume 10 | Issue 1 | e1003440