Embed Size (px)
Citation preview
Article
Predictors of COVID-19 Vaccine Hesitancy:Socio-Demographics, Co-Morbidity, and Past Experience ofRacial Discrimination
Elena Savoia 1,2,*, Rachael Piltch-Loeb 1, Beth Goldberg 3, Cynthia Miller-Idriss 4, Brian Hughes 4,Alberto Montrond 1, Juliette Kayyem 5 and Marcia A. Testa 1,2,6
�����������������
Citation: Savoia, E.; Piltch-Loeb, R.;
Goldberg, B.; Miller-Idriss, C.;
Hughes, B.; Montrond, A.; Kayyem, J.;
Testa, M.A. Predictors of COVID-19
Vaccine Hesitancy: Socio-
Demographics, Co-Morbidity,
and Past Experience of Racial
Discrimination. Vaccines 2021, 9, 767.
https://doi.org/10.3390/
vaccines9070767
Academic Editor: Barbara Rath
Received: 27 May 2021
Accepted: 4 July 2021
Published: 9 July 2021
Publisher’s Note: MDPI stays neutral
with regard to jurisdictional claims in
published maps and institutional affil-
iations.
Copyright: © 2021 by the authors.
Licensee MDPI, Basel, Switzerland.
This article is an open access article
distributed under the terms and
conditions of the Creative Commons
Attribution (CC BY) license (https://
creativecommons.org/licenses/by/
4.0/).
1 Emergency Preparedness Research Evaluation & Practice (EPREP) Program, Division of Policy Translation &Leadership Development, Harvard T.H. Chan School of Public Health, 90 Smith Street,Boston, MA 02115, USA; [email protected] (R.P.-L.); [email protected] (A.M.);[email protected] (M.A.T.)
2 Department of Biostatistics, Harvard T.H. Chan School of Public Health, 677 Huntington Avenue,Boston, MA 02115, USA
3 Jigsaw, Google LLC, 82th 10th Ave, New York, NY 10024, USA; [email protected] Center for University Excellence (CUE) and Polarization and Extremism Research and Innovation
Lab (PERIL), American University, 4400 Massachusetts Avenue NW, Washington, DC 20016, USA;[email protected] (C.M.-I.); [email protected] (B.H.)
5 Belfer Center for Science and International Affairs, Harvard Kennedy School, Harvard University,79 John F. Kennedy Street, Cambridge, MA 02138, USA; [email protected]
6 Massachusetts Association of Health Boards, 20 Walnut Street, Suite 110, Wellesley, MA 02481, USA* Correspondence: [email protected]
Abstract: The goal of this study is to explore predictors of COVID-19 vaccine hesitancy, includingsocio-demographic factors, comorbidity, risk perception, and experience of discrimination, in asample of the U.S. population. We used a cross-sectional online survey study design, implementedbetween 13–23 December 2020. The survey was limited to respondents residing in the USA, belongingto priority groups for vaccine distribution. Responses were received from 2650 individuals (responserate 84%) from all 50 states and Puerto Rico, American Samoa, and Guam. The five most representedstates were California (13%), New York (10%), Texas (7%), Florida (6%), and Pennsylvania (4%).The majority of respondents were in the age category 25–44 years (66%), male (53%), and workingin the healthcare sector (61%). Most were White and non-Hispanic (66%), followed by Black andnon-Hispanic (14%) and Hispanic (8%) respondents. Experience with racial discrimination was apredictor of vaccine hesitancy. Those reporting racial discrimination had 21% increased odds of beingat a higher level of hesitancy compared to those who did not report such experience (OR = 1.21, 95%C.I. 1.01–1.45). Communication and logistical aspects during the COVID-19 vaccination campaignneed to be sensitive to individuals’ past-experience of racial discrimination in order to increasevaccine coverage.
Keywords: COVID-19; vaccine hesitancy; discrimination
1. Introduction
Within a year, the SARS-CoV-2 pandemic spread worldwide infecting millions ofindividuals and causing thousands of deaths. Under the federal Operation Warp Speedprogram, administered by the U.S. Department of Health and Human Services, $10 billiondollars were invested in six candidate vaccines [1]. In November 2020, Pfizer-BioNTech [2]and Moderna [3] reported that their much-anticipated vaccines demonstrated over 90%effectiveness in protecting people from the disease. Both vaccines were developed andtested at record speed and given U.S. Food and Drug Administration (FDA) emergency useauthorization (EUA) in December 2020 [4,5]. Vaccine distribution of the Pfizer/BioNTechvaccine began on 8 December 2020. Two months prior to the approval of the vaccines,
Vaccines 2021, 9, 767. https://doi.org/10.3390/vaccines9070767 https://www.mdpi.com/journal/vaccines
Vaccines 2021, 9, 767 2 of 13
the Centers for Disease Control and Prevention (CDC) released its interim playbook forjurisdictional operations which outlined a phased approach to COVID-19 vaccinationstarting from those most at risk due to their job, age, and health status [6].
While the scientific efforts to produce the vaccine have been successful, the delivery ofthe vaccine has faced vast logistical, distribution, and communication challenges, the lattermostly related to hesitancy of individuals to take the vaccine. Immunization programs areonly successful when there are high rates of acceptance and coverage. Addressing vaccinehesitancy, while delivering billions of doses across the world, is and will continue to beone of the greatest public health risk communication efforts ever undertaken. As such,it is critical to understand the reasons why specific segments of the population are morehesitant than others to accept the vaccine and address those reasons when implementingdistribution and communication plans [7].
A recent review of 39 U.S. based polls shows that though there is potential for amajority of Americans to take COVID-19 vaccines, many people are still making up theirminds [8]. This review concludes that while there is a good understanding that safety, effec-tiveness, and the desire of going back to a normal life are overall major motivating factors,communication approaches should be customized to the group that is undecided within apopulation. Polls conducted prior to the approval of the vaccines, as well as more recentsurveys, indicate that in particular Black respondents are less likely to accept a potentialCOVID-19 vaccine [7–10]. This low acceptance is consistent with historical disparities ininfluenza immunization behavior and perceptions in the U.S. population, with Black adultssignificantly less likely to receive the influenza vaccine than White adults [11–13]. This isparticularly concerning considering that Black individuals shoulder a disproportionateburden of many chronic conditions, placing them at a higher risk for complications frompreventable diseases like influenza [14] and now for COVID-19. Research on the racial dis-parities in influenza immunization rates in the general population have identified severalpsychosocial and behavioral factors associated with vaccine uptake including: perceivedrisk, trust, vaccine attitudes, social norms, and experiences of racism [15,16]. The goalof this study is to explore the predictors of COVID-19 vaccine hesitancy including socio-demographic factors, co-morbidity, risk perception, and more specifically to investigate therole of past-experience with discrimination in predicting hesitancy, in particular amongthose identified as priority groups for vaccination. To our knowledge, this is the firsttime that experience with discrimination has been studied in relation to vaccine hesitancy.The study is based on a rapid survey conducted when the Pfizer-BioNTech and Modernavaccines were approved and the ultimate goal is to inform public officials on how toenhance vaccine communication efforts during the vaccination campaign.
2. Materials and Methods2.1. Patient and Public Involvement
There were no patients involved in the study.
2.2. Study Design
We used a cross-sectional online survey study design. The survey was implementedvia mobile phones by the use of the survey platform Pollfish, and it was limited to respon-dents over 18 years of age residing in the USA. Similar to third-party advertising companies,Pollfish pays mobile application developers to display and promote the surveys to theirusers. To incentivize participation, relatively small monetary reimbursements are providedto randomly selected users who complete the surveys. An initial survey instrument draftwas implemented for cognitive testing with 20 individuals, and the survey was subse-quently revised after feedback to include 36 questions. Questions and response choiceswere kept short using “yes/no” or Likert-type and rating scales to facilitate completionby the use of mobile phones. The survey was launched on 13 December and closed on23 December 2020. A screening question was used to identify respondents belonging to oneof 19 job categories that were identified as priority groups for vaccine distribution based

Vaccines 2021, 9, 767 3 of 13
on national guidance available at the time of the survey [6]. The study protocol and surveyinstrument were approved by the Harvard T.H. Chan School of Public Health InstitutionalReview Board. A copy of the survey instrument can be found in Supplementary Materials.
2.3. Dependent Variable
Multivariable ordinal regression was undertaken to model the underlying constructof vaccine hesitancy measured by the creation of a Likert-type scale. Respondents wereasked how likely they would be to take a COVID-19 vaccine if offered to them at no costwithin two months. Answer options were ordered as follows: very likely (1), somewhatlikely (2), would consider it after two months (3), not sure (4), somewhat unlikely (5),very unlikely (6). Results were interpreted with a range of values from 1 (low hesitancy) to6 (high hesitancy) maintaining the original order the answer options without grouping theanswers into categories.
2.4. Independent Variables
Independent predictor variables included socio-demographics such as age, gender,race, level of education, and employment status. Other predictors included job type(working in the healthcare sector vs. other priority groups for vaccination), having hada diagnosis of COVID-19 (with no symptoms, mild or severe symptoms), clinical risk ofsevere consequences from COVID-19, risk perception of contracting the disease or infectingothers, and past experience with discrimination. Risk perception was measured by askingrespondents to report their level of concern with contracting COVID-19 at work, outsidetheir work environment, and infecting family members or friends. A factor analysis wasperformed to assess the structure of the risk perception questions, and as a result a scalewas created with scores ranging from 0 to 6, with lower values indicating lower risk per-ception. Kaiser–Meyer–Olkin (KMO) measure of sampling adequacy was used to test forthe suitability of the data for factor analysis and Cronbach’s alpha to assess the reliabilityof the scale. The respondents’ clinical risk for severe consequences from COVID-19 wasmeasured by asking about the underlying health conditions most frequently associatedwith severe disease or death (diabetes, cardiovascular disease, obesity, pulmonary dis-ease, immunocompromised status, rheumatological condition, or cancer), responses wereconverted into a dichotomous variable describing presence of at least one comorbidityvs. absence of comorbidities. Finally, respondents were asked about past experience withunfair treatment they attributed to their race, religion, gender or sexual orientation usingan adaptation of the discrimination scale developed by Sternthal, M.J. et al. [16]. This scaleincludes six questions on unfair treatment experienced in the work environment, at school,by a police officer and by financial institutions (i.e., bank loan). The adaptation consistedof adding a question about unfair treatment by a physician or nurse and by limiting thecause of the unfair treatment to race, religion, gender, and sexual orientation.
2.5. Statistical Analyses
We first performed descriptive statistics for each variable. We then applied simpleand multiple ordinal regression models to study the association between the independentvariables and COVID-19 vaccine hesitancy (dependent variable). We tested for bivariateassociations between each predictor (age, gender, race, education, employment status,job type, having had a diagnosis of COVID-19, clinical risk profile, risk perception, and ex-perience of discrimination) and the dependent variable, by means of ordinal and logisticregression using a p-value < 0.05 as cut-off for inclusion of the independent variables inthe multiple regression model. We tested the parallel regression assumption by meansof the Brant test for the ordinal logistic model which did not show statistical significance.The goodness-of-fit of the multiple variables model was tested by the use of the Hosmer-Lemeshow and Pulstenis-Robinson tests. The Stata Statistical Software 16 was used.
Vaccines 2021, 9, 767 4 of 13
3. Results3.1. Socio-Demographic Characteristics of the Study Population
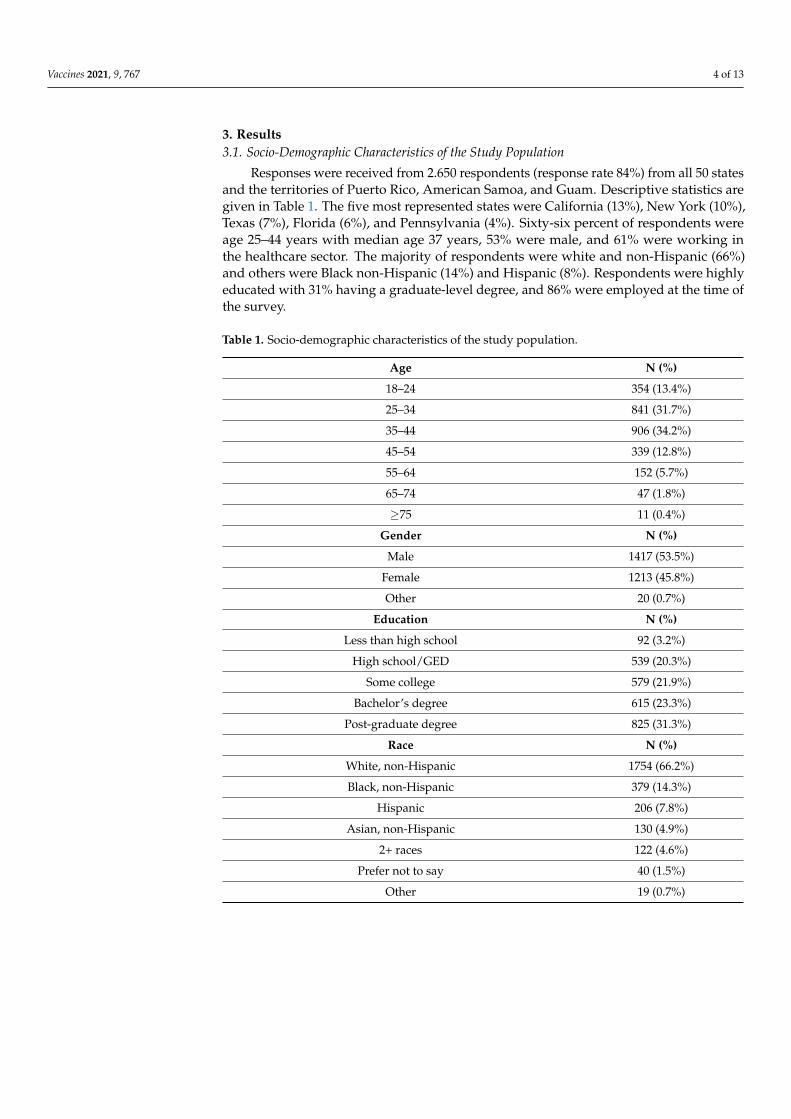
Responses were received from 2.650 respondents (response rate 84%) from all 50 statesand the territories of Puerto Rico, American Samoa, and Guam. Descriptive statistics aregiven in Table 1. The five most represented states were California (13%), New York (10%),Texas (7%), Florida (6%), and Pennsylvania (4%). Sixty-six percent of respondents wereage 25–44 years with median age 37 years, 53% were male, and 61% were working inthe healthcare sector. The majority of respondents were white and non-Hispanic (66%)and others were Black non-Hispanic (14%) and Hispanic (8%). Respondents were highlyeducated with 31% having a graduate-level degree, and 86% were employed at the time ofthe survey.
Table 1. Socio-demographic characteristics of the study population.
Age N (%)
18–24 354 (13.4%)
25–34 841 (31.7%)
35–44 906 (34.2%)
45–54 339 (12.8%)
55–64 152 (5.7%)
65–74 47 (1.8%)
≥75 11 (0.4%)
Gender N (%)
Male 1417 (53.5%)
Female 1213 (45.8%)
Other 20 (0.7%)
Education N (%)
Less than high school 92 (3.2%)
High school/GED 539 (20.3%)
Some college 579 (21.9%)
Bachelor’s degree 615 (23.3%)
Post-graduate degree 825 (31.3%)
Race N (%)
White, non-Hispanic 1754 (66.2%)
Black, non-Hispanic 379 (14.3%)
Hispanic 206 (7.8%)
Asian, non-Hispanic 130 (4.9%)
2+ races 122 (4.6%)
Prefer not to say 40 (1.5%)
Other 19 (0.7%)
Vaccines 2021, 9, 767 5 of 13
Table 1. Cont.
Employment status N (%)
Paid employee 2032 (76.7%)
Self-employed 243 (9.2%)
On unemployment 101 (3.8%)
Not working-searching for work 96 (3.6%)
On paid leave or furloughed 41 (1.6%)
Retired 41 (1.6%)
Not working-and not looking for a job 39 (1.4%)
On disability or worker’s compensation 35 (1.3%)
Other 22 (0.8%)
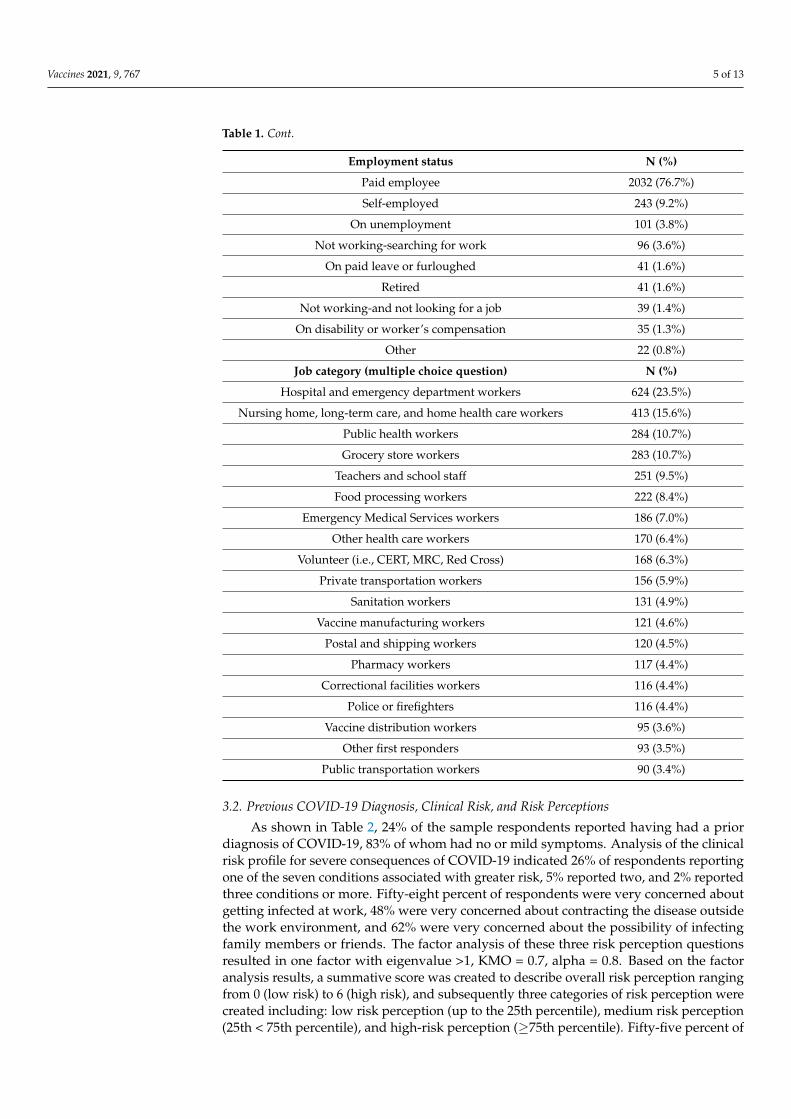
Job category (multiple choice question) N (%)
Hospital and emergency department workers 624 (23.5%)
Nursing home, long-term care, and home health care workers 413 (15.6%)
Public health workers 284 (10.7%)
Grocery store workers 283 (10.7%)
Teachers and school staff 251 (9.5%)
Food processing workers 222 (8.4%)
Emergency Medical Services workers 186 (7.0%)
Other health care workers 170 (6.4%)
Volunteer (i.e., CERT, MRC, Red Cross) 168 (6.3%)
Private transportation workers 156 (5.9%)
Sanitation workers 131 (4.9%)
Vaccine manufacturing workers 121 (4.6%)
Postal and shipping workers 120 (4.5%)
Pharmacy workers 117 (4.4%)
Correctional facilities workers 116 (4.4%)
Police or firefighters 116 (4.4%)
Vaccine distribution workers 95 (3.6%)
Other first responders 93 (3.5%)
Public transportation workers 90 (3.4%)
3.2. Previous COVID-19 Diagnosis, Clinical Risk, and Risk Perceptions
As shown in Table 2, 24% of the sample respondents reported having had a priordiagnosis of COVID-19, 83% of whom had no or mild symptoms. Analysis of the clinicalrisk profile for severe consequences of COVID-19 indicated 26% of respondents reportingone of the seven conditions associated with greater risk, 5% reported two, and 2% reportedthree conditions or more. Fifty-eight percent of respondents were very concerned aboutgetting infected at work, 48% were very concerned about contracting the disease outsidethe work environment, and 62% were very concerned about the possibility of infectingfamily members or friends. The factor analysis of these three risk perception questionsresulted in one factor with eigenvalue >1, KMO = 0.7, alpha = 0.8. Based on the factoranalysis results, a summative score was created to describe overall risk perception rangingfrom 0 (low risk) to 6 (high risk), and subsequently three categories of risk perception werecreated including: low risk perception (up to the 25th percentile), medium risk perception(25th < 75th percentile), and high-risk perception (≥75th percentile). Fifty-five percent of
Vaccines 2021, 9, 767 6 of 13
respondents were in the high-risk perception category, 31% in the medium risk categoryand 14.5% in the low risk.
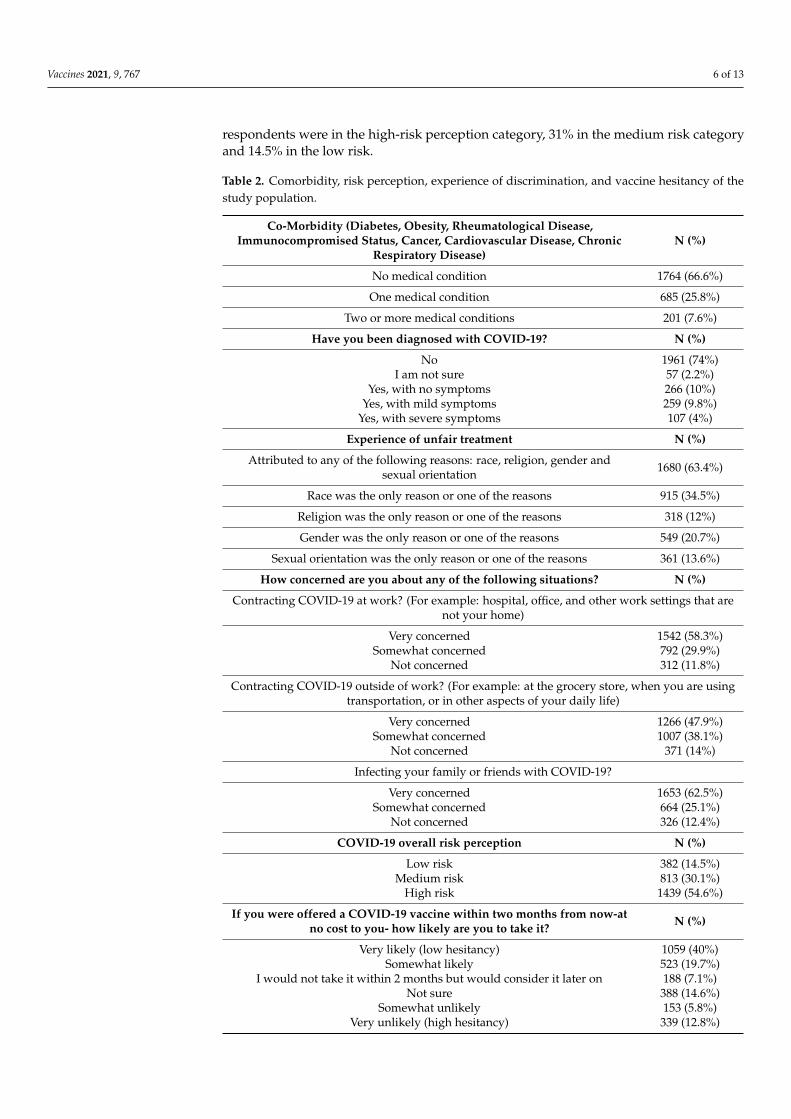
Table 2. Comorbidity, risk perception, experience of discrimination, and vaccine hesitancy of thestudy population.
Co-Morbidity (Diabetes, Obesity, Rheumatological Disease,Immunocompromised Status, Cancer, Cardiovascular Disease, Chronic
Respiratory Disease)N (%)
No medical condition 1764 (66.6%)
One medical condition 685 (25.8%)
Two or more medical conditions 201 (7.6%)
Have you been diagnosed with COVID-19? N (%)
No 1961 (74%)I am not sure 57 (2.2%)
Yes, with no symptoms 266 (10%)Yes, with mild symptoms 259 (9.8%)
Yes, with severe symptoms 107 (4%)
Experience of unfair treatment N (%)
Attributed to any of the following reasons: race, religion, gender andsexual orientation 1680 (63.4%)
Race was the only reason or one of the reasons 915 (34.5%)
Religion was the only reason or one of the reasons 318 (12%)
Gender was the only reason or one of the reasons 549 (20.7%)
Sexual orientation was the only reason or one of the reasons 361 (13.6%)
How concerned are you about any of the following situations? N (%)
Contracting COVID-19 at work? (For example: hospital, office, and other work settings that arenot your home)
Very concerned 1542 (58.3%)Somewhat concerned 792 (29.9%)
Not concerned 312 (11.8%)
Contracting COVID-19 outside of work? (For example: at the grocery store, when you are usingtransportation, or in other aspects of your daily life)
Very concerned 1266 (47.9%)Somewhat concerned 1007 (38.1%)
Not concerned 371 (14%)
Infecting your family or friends with COVID-19?
Very concerned 1653 (62.5%)Somewhat concerned 664 (25.1%)
Not concerned 326 (12.4%)
COVID-19 overall risk perception N (%)
Low risk 382 (14.5%)Medium risk 813 (30.1%)
High risk 1439 (54.6%)
If you were offered a COVID-19 vaccine within two months from now-atno cost to you- how likely are you to take it? N (%)
Very likely (low hesitancy) 1059 (40%)Somewhat likely 523 (19.7%)
I would not take it within 2 months but would consider it later on 188 (7.1%)Not sure 388 (14.6%)
Somewhat unlikely 153 (5.8%)Very unlikely (high hesitancy) 339 (12.8%)
Vaccines 2021, 9, 767 7 of 13
3.3. Past Experience with Discrimination and Vaccine Hesitancy
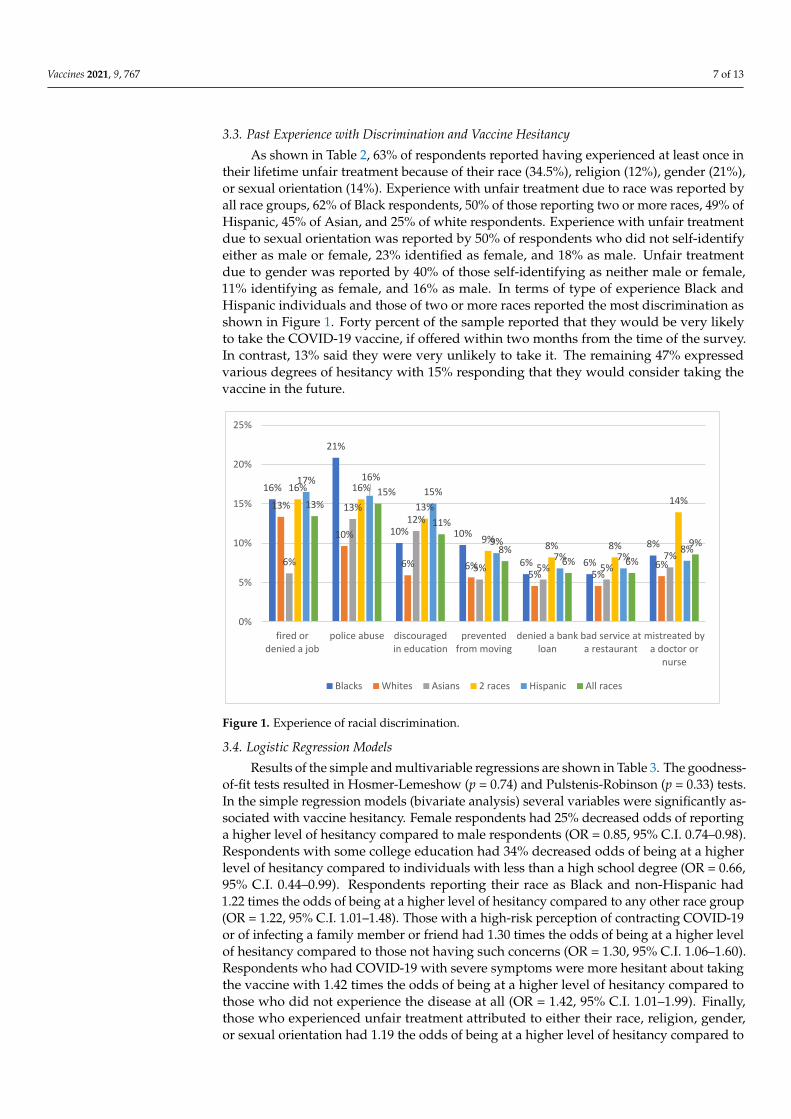
As shown in Table 2, 63% of respondents reported having experienced at least once intheir lifetime unfair treatment because of their race (34.5%), religion (12%), gender (21%),or sexual orientation (14%). Experience with unfair treatment due to race was reported byall race groups, 62% of Black respondents, 50% of those reporting two or more races, 49% ofHispanic, 45% of Asian, and 25% of white respondents. Experience with unfair treatmentdue to sexual orientation was reported by 50% of respondents who did not self-identifyeither as male or female, 23% identified as female, and 18% as male. Unfair treatmentdue to gender was reported by 40% of those self-identifying as neither male or female,11% identifying as female, and 16% as male. In terms of type of experience Black andHispanic individuals and those of two or more races reported the most discrimination asshown in Figure 1. Forty percent of the sample reported that they would be very likelyto take the COVID-19 vaccine, if offered within two months from the time of the survey.In contrast, 13% said they were very unlikely to take it. The remaining 47% expressedvarious degrees of hesitancy with 15% responding that they would consider taking thevaccine in the future.
Vaccines 2021, 9, x 7 of 13
or female, 11% identifying as female, and 16% as male. In terms of type of experience Black
and Hispanic individuals and those of two or more races reported the most discrimination
as shown in Figure 1. Forty percent of the sample reported that they would be very likely
to take the COVID-19 vaccine, if offered within two months from the time of the survey.
In contrast, 13% said they were very unlikely to take it. The remaining 47% expressed
various degrees of hesitancy with 15% responding that they would consider taking the
vaccine in the future.
Figure 1. Experience of racial discrimination.
3.4. Logistic Regression Models
Results of the simple and multivariable regressions are shown in Table 3. The good-
ness-of-fit tests resulted in Hosmer-Lemeshow (p = 0.74) and Pulstenis-Robinson (p = 0.33)
tests. In the simple regression models (bivariate analysis) several variables were signifi-
cantly associated with vaccine hesitancy. Female respondents had 25% decreased odds of
reporting a higher level of hesitancy compared to male respondents (OR = 0.85, 95% C.I.
0.74–0.98). Respondents with some college education had 34% decreased odds of being at
a higher level of hesitancy compared to individuals with less than a high school degree
(OR = 0.66, 95% C.I. 0.44–0.99). Respondents reporting their race as Black and non-His-
panic had 1.22 times the odds of being at a higher level of hesitancy compared to any other
race group (OR = 1.22, 95% C.I. 1.01–1.48). Those with a high-risk perception of contracting
COVID-19 or of infecting a family member or friend had 1.30 times the odds of being at a
higher level of hesitancy compared to those not having such concerns (OR = 1.30, 95% C.I.
1.06–1.60). Respondents who had COVID-19 with severe symptoms were more hesitant
about taking the vaccine with 1.42 times the odds of being at a higher level of hesitancy
compared to those who did not experience the disease at all (OR = 1.42, 95% C.I 1.01–1.99).
Finally, those who experienced unfair treatment attributed to either their race, religion,
gender, or sexual orientation had 1.19 the odds of being at a higher level of hesitancy
compared to those who did experience discrimination due to the above-mentioned rea-
sons (OR = 1.19, 95% C.I. 1.03–1.37).
16%
21%
10% 10%
6% 6%
8%
13%
10%
6% 6%5% 5%
6%6%
13%12%
5% 5% 5%7%
16% 16%
13%
9%8% 8%
14%
17% 16%
15%
9%
7% 7%8%
13%15%
11%
8%6% 6%
9%
0%
5%
10%
15%
20%
25%
fired ordenied a job
police abuse discouragedin education
preventedfrom moving
denied a bankloan
bad service ata restaurant
mistreated bya doctor or
nurse
Blacks Whites Asians 2 races Hispanic All races
Figure 1. Experience of racial discrimination.
3.4. Logistic Regression Models
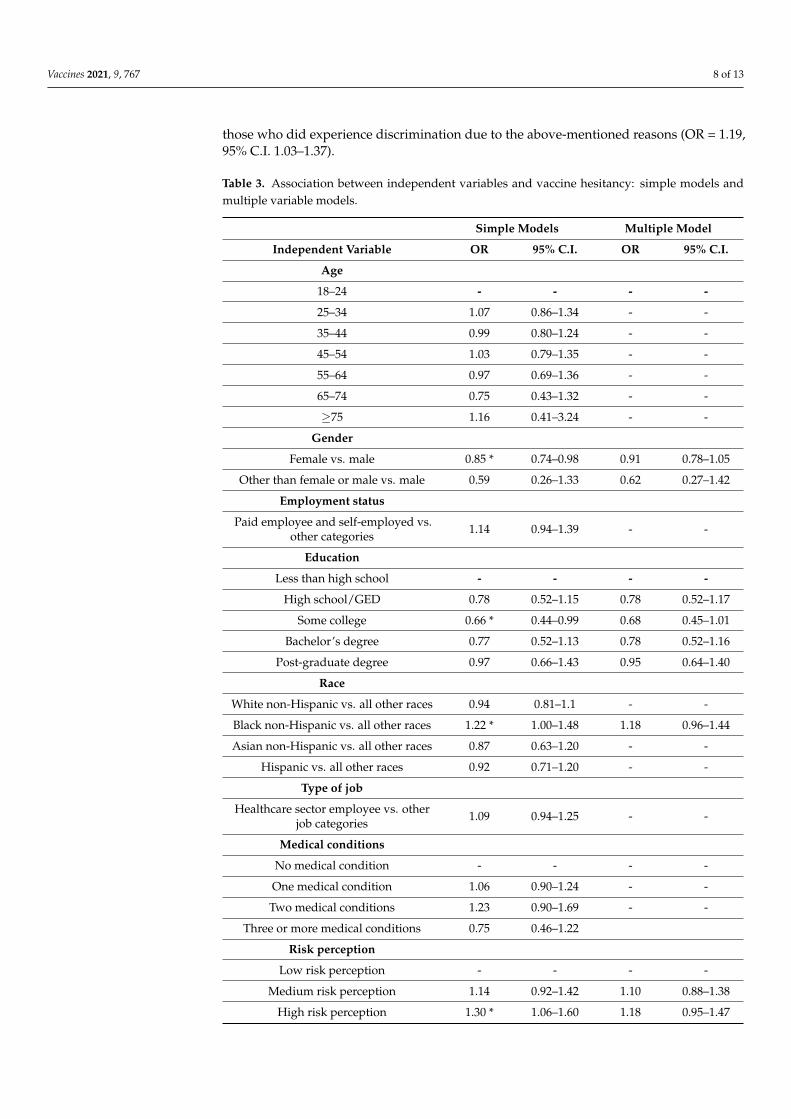
Results of the simple and multivariable regressions are shown in Table 3. The goodness-of-fit tests resulted in Hosmer-Lemeshow (p = 0.74) and Pulstenis-Robinson (p = 0.33) tests.In the simple regression models (bivariate analysis) several variables were significantly as-sociated with vaccine hesitancy. Female respondents had 25% decreased odds of reportinga higher level of hesitancy compared to male respondents (OR = 0.85, 95% C.I. 0.74–0.98).Respondents with some college education had 34% decreased odds of being at a higherlevel of hesitancy compared to individuals with less than a high school degree (OR = 0.66,95% C.I. 0.44–0.99). Respondents reporting their race as Black and non-Hispanic had1.22 times the odds of being at a higher level of hesitancy compared to any other race group(OR = 1.22, 95% C.I. 1.01–1.48). Those with a high-risk perception of contracting COVID-19or of infecting a family member or friend had 1.30 times the odds of being at a higher levelof hesitancy compared to those not having such concerns (OR = 1.30, 95% C.I. 1.06–1.60).Respondents who had COVID-19 with severe symptoms were more hesitant about takingthe vaccine with 1.42 times the odds of being at a higher level of hesitancy compared tothose who did not experience the disease at all (OR = 1.42, 95% C.I. 1.01–1.99). Finally,those who experienced unfair treatment attributed to either their race, religion, gender,or sexual orientation had 1.19 the odds of being at a higher level of hesitancy compared to
Vaccines 2021, 9, 767 8 of 13
those who did experience discrimination due to the above-mentioned reasons (OR = 1.19,95% C.I. 1.03–1.37).
Table 3. Association between independent variables and vaccine hesitancy: simple models andmultiple variable models.
Simple Models Multiple Model
Independent Variable OR 95% C.I. OR 95% C.I.
Age
18–24 - - - -
25–34 1.07 0.86–1.34 - -
35–44 0.99 0.80–1.24 - -
45–54 1.03 0.79–1.35 - -
55–64 0.97 0.69–1.36 - -
65–74 0.75 0.43–1.32 - -
≥75 1.16 0.41–3.24 - -
Gender
Female vs. male 0.85 * 0.74–0.98 0.91 0.78–1.05
Other than female or male vs. male 0.59 0.26–1.33 0.62 0.27–1.42
Employment status
Paid employee and self-employed vs.other categories 1.14 0.94–1.39 - -
Education
Less than high school - - - -
High school/GED 0.78 0.52–1.15 0.78 0.52–1.17
Some college 0.66 * 0.44–0.99 0.68 0.45–1.01
Bachelor’s degree 0.77 0.52–1.13 0.78 0.52–1.16
Post-graduate degree 0.97 0.66–1.43 0.95 0.64–1.40
Race
White non-Hispanic vs. all other races 0.94 0.81–1.1 - -
Black non-Hispanic vs. all other races 1.22 * 1.00–1.48 1.18 0.96–1.44
Asian non-Hispanic vs. all other races 0.87 0.63–1.20 - -
Hispanic vs. all other races 0.92 0.71–1.20 - -
Type of job
Healthcare sector employee vs. otherjob categories 1.09 0.94–1.25 - -
Medical conditions
No medical condition - - - -
One medical condition 1.06 0.90–1.24 - -
Two medical conditions 1.23 0.90–1.69 - -
Three or more medical conditions 0.75 0.46–1.22
Risk perception
Low risk perception - - - -
Medium risk perception 1.14 0.92–1.42 1.10 0.88–1.38
High risk perception 1.30 * 1.06–1.60 1.18 0.95–1.47

Vaccines 2021, 9, 767 9 of 13
Table 3. Cont.
Simple Models Multiple Model
Independent Variable OR 95% C.I. OR 95% C.I.
COVID-19 diagnosis
No diagnosis - - - -
Not sure 1.05 0.65–1.68 1.01 0.62–1.63
Yes–no symptoms 1.02 0.81–1.29 0.89 0.69–1.13
Yes–mild symptoms 1.13 0.89–1.43 1.02 0.80–1.29
Yes–severe symptoms 1.42 * 1.01–1.99 1.27 0.90–1.79
Experience of unfair treatment
Attributed to any of the followingreasons: race, religion, gender or
sexual orientation1.19 * 1.03–1.37 0.97 0.82–1.16
Race was the only reason or one ofthe reasons 1.30 ** 1.12–1.50 1.21 * 1.01–1.45
Religion was the only reason or one ofthe reasons 1.21 0.98–1.49 - -
Gender was the only reason or one ofthe reasons 0.97 0.83–1.14 - -
Sexual orientation was the only reasonor one of the reasons 0.97 0.80–1.19 - -
* p < 0.05. ** p < 0.001.
When the specific reasons for the perceived discrimination were analyzed as indepen-dent variables, racial discrimination was the only variable with a significant associationwith vaccine hesitancy. Those who experienced racial discrimination had 1.3 times theodds of being at a higher level of hesitancy compared to those who had not reportedexperiencing this type of discrimination (OR = 1.30, 95% C.I. 1.12–1.50) (see Figure 1).For the multivariable model, of vaccine hesitancy, the overall LR chi-square test statisticswas significant (χ2, p < 0.01). Brant test p-value resulted 0.68.
In the multivariable models, the only variable associated with vaccine hesitancy wasexperience of racial discrimination. Individuals with past experience had 21% increasedodds of being at a higher level of vaccine hesitancy compared to those who did not reportsuch experience. (OR = 1.21, 95% C.I. 1.01–1.45). The most frequently reported racialdiscrimination situation r was abuse from a police officer (15%), followed by havingbeen denied a job or unfairly fired (13%), discouragement in pursuing an education wasexperienced by 11% of respondents. While all racial groups reported experience with unfairtreatment due to their race, Black and Hispanic respondents and those of two or more racesreported this experience most frequently.
4. Discussion
COVID-19 vaccine hesitancy has developed in a context where many showed fatiguedue to the pandemic mitigation strategies, seeing them as ineffective, and in some caseseven punitive. High acceptance of COVID-19 vaccines is critical to ending the pandemicespecially among population groups for which high transmission rates have been recorded.Based on historical immunization data and recent polls, vaccine hesitancy is higher amongBlack persons compared to White persons [9–17]. The low likelihood of getting a COVID-19 vaccine among Black persons is especially concerning because of the high rates oftransmission in Black communities [16]. Policymakers and public health professionalsneed to implement strategic plans to insure the vaccine reaches all Americans—particularly
Vaccines 2021, 9, 767 10 of 13
people of color belonging to the priority groups for the vaccination. Their concerns mustbe addressed throughout the course of the vaccination campaign.
Public information and warning is one of the preparedness capabilities that publichealth agencies across the country will need to implement to support the vaccinationcampaign [18]. This capability entails the implementation of systems and proceduresto mobilize communication activities such as fact gathering, rumor control, messagetesting, monitoring of media, social-media outlets and public opinions, and ultimately thepublishing of content across print, Internet, social, and other media. They can also providesupport to spokespersons by developing talking points, speeches, and visuals.
The results from our study emphasize the need to potentiate public opinions’ moni-toring strategies by gathering information on concerns and reasons for hesitancy towardsthe COVID-19 vaccine that get to the roots of such hesitancy, beyond the use of responsesrelated to safety and effectiveness. The ultimate goal is to provide information that allowsrisk communicators and spokespersons to do a better job in targeting communicationefforts to individuals’ informational needs, concerns, and past experiences. This studyhas the advantage of focusing on individuals belonging to priority groups receiving thevaccine. This is important as a successful vaccination campaign must demonstrate initialacceptance by the first to be vaccinated. Early adopters of immunization can have a stronginfluence on the likelihood that others will accept the vaccine and will be compliant withthe immunization recommendations. In particular, our sample included a large fraction ofindividuals working in the healthcare sector who could play a key role in advocating forthe vaccine among the general population.
To our knowledge, our study is the first to date to include a measure of past expe-rience of discrimination as a predictor of COVID-19 vaccine hesitancy, enriching currentknowledge on the relationship between vaccine hesitancy and race. This result is importantto inform communication and logistical aspects of the COVID-19 vaccination campaign.While our study does not specifically address the association between experience of dis-crimination and trust in the organizations in charge of the vaccination efforts, previousresearch demonstrates that trust remains distinct from vaccine confidence in both thegeneral and flu vaccine. Specific models show that trust in information sources alonedoes not explain the observed relationship between race and vaccination beliefs [19–21]and that Black persons have a different type of mistrust related to the COVID-19 vaccinecompared to White persons: a mistrust in the government entities’ motives rather thanin their competence [22]. A discussion regarding the importance of developing strategiesso that members of the Black and other communities not only trust that the COVID-19vaccines are safe and effective, but also believe that the organizations offering them aretrustworthy was initiated back in 2020 when low rates of the vaccine trial participation insubgroups, including Black communities, were reported [22]. While we recognize that trustis a complex construct which we have not investigated in our study, we also believe thatour results indicate that future research should focus in understanding how experience ofdiscrimination might be a mediator of mistrust in the vaccine and the system delivering it,as suggested by other authors [19,20].
It is certainly clear that during the short timeframe of this vaccination campaign,even with the best of intentions, policy makers and public health practitioners will notbe able to undo centuries of distrust based on unfair treatment and discrimination expe-rienced by specific segments of the population in sectors such as health care, education,finance, and safety. However, they can be sensitive to individuals’ concerns and pastexperiences and educate clinicians and spokespersons on historical facts, avoiding use oflaw enforcement to surveil the safety of vaccination sites, engaging individuals from Blackcommunities in vaccination efforts, and educating policy makers and vaccine distributionplanners on the potential root causes of mistrust. We believe that enhancing the vaccine up-take among Black Americans requires much more than disseminating facts about safety—itis likely to require overcoming barriers of mistrust in the system. Policy makers and publicofficials need to start by acknowledging, appreciating, and discussing public concerns.
Vaccines 2021, 9, 767 11 of 13
Labeling those hesitant about the vaccine as conspiracy theorists or individuals unwillingto prevent the spread of the disease, may be counterproductive when hesitancy is rootedin a history of unfair treatment which will not be overturned by denying the existenceof fear and doubts. Given the complexity of vaccine hesitancy in general and the limitedevidence available on how it can be addressed, communication and distribution strategiesshould be carefully tailored according to the target population, their reasons for hesitancy,and the specific context as demonstrated by a recent literature review [21]. The tailoringof messages is important to address communication inequalities in individual or groupspecific exposure and reactions to public health communication messages [22–25], whichmay lead to further enhance existing disparities across segments of the population in theability to comply with recommended preventive behaviors.
Opinion surveys, at the time of crisis, are a tool to understand people’s concernsso that such concerns can be addressed and taken into consideration when developingbetter communication efforts. These concerns are currently further fueled by an emotionaldimension driven by social isolation, daily life restrictions, and difficulties experiencedduring the pandemic. Public health agencies need to enhance their public informationcapabilities to address multiple dimensions of the vaccine communication strategy inorder to be successful and meet growing needs of information and reassurance across adiverse audience.
Study Limitations
Because we used a cross sectional study design, the timing of the survey must beconsidered in interpreting the results. The survey was fielded in December 2020 whenvaccines were announced but not yet available to the public. Due to the evolving epidemi-ology of the disease and the developing public communication and vaccine distributionefforts, the predictors of vaccine hesitancy are likely to change over time. In particular,we acknowledge that in our study we did not find a statistical significant associationbetween vaccine hesitancy and risk perception of contracting COVID-19 which is likely tobe relevant for future studies. From a methodological point of view the dependent variable“vaccine hesitancy” can be categorized in different ways. For the purpose of this study weelected to capture different degrees of hesitancy and use ordinal logistic regression to do so.We believe this is a strength rather than a weakness but we do acknowledge that differentcategorizations may lead to different results and that ROC analysis should be applied tostudy potential for misclassification [26]. We also remind the reader that our sample is nota representative sample of the US population as such study results are not generalizableoutside the study population. We purposefully focused on the demographic characteristicsof the population eligible for the vaccine at the time of the survey because we believevaccine hesitancy needs to be measured taking into consideration for whom and when thevaccine is available. While our sample included a distribution of racial-ethnic groups thatallowed us to analyze predictors of vaccine hesitancy based on race it did not include asufficient number of individuals over 65 which based on previous studies are more likelythan others to accept the COVID-19 vaccine due the increased risk of severity in the elderly.Yet, the reason for such limitation is related to the fact that we were interested in surveyingindividuals eligible for the vaccine at the time of the survey, such eligibility was mainlybased on job categories rather than age. Given changes in the vaccine distribution criteria,future studies should include a wider distribution of demographic categories.
5. Conclusions
Results from this survey of a convenience sample of the US population show that pastexperience with discrimination is a predictor of vaccine hesitancy. This result is important toinform communication and logistical aspects during the COVID-19 vaccination campaignwhich need to be sensitive to individuals’ past experience with systemic unfair treatmentby different types of institutions including law enforcement, education and healthcare.

Vaccines 2021, 9, 767 12 of 13
Supplementary Materials: The following are available online at https://www.mdpi.com/article/10.3390/vaccines9070767/s1.
Author Contributions: Conceptualization, E.S. and A.M.; methodology, R.P.-L., B.G., C.M.-I., B.H.,and A.M.; formal analysis, E.S., B.G., C.M.-I., B.H. and M.A.T.; investigation, R.P.-L.; writing—originaldraft preparation, E.S. and A.M.; writing—review and editing, J.K. and R.P.-L. All authors have readand agreed to the published version of the manuscript.
Funding: Research reported in this publication was supported by Jigsaw Google LLC under awardnumber 37088-A210057-S001. The content is solely the responsibility of the authors and does notnecessarily represent the official views of Jigsaw Google LLC.
Institutional Review Board Statement: This study was conducted according to the guidelines ofthe Declaration of Helsinki and met the criteria for exemption per the regulations found at 45 CFR46.104(d) (2)(2) per determination from the Harvard T.H. Chan School of Public Health Office ofRegulatory Affairs and Research Compliance (protocol number IRB20-2032).
Informed Consent Statement: Informed consent was obtained from all subjects participating inthe study.
Data Availability Statement: Data are available at: https://github.com/esavoia123/Vaccine-hesitancy-data-Dec-2020-USA.git (accessed on 6 July 2021).
Conflicts of Interest: The authors declare no conflict of interest.
References1. Fact Sheet: Explaining Operation Warp Speed. Available online: https://www.hhs.gov/coronavirus/explaining-operation-warp-
speed/index.html (accessed on 11 January 2021).2. Pfizer and BioNTech Announce Vaccine Candidate against COVID-19 Achieved Success in First Interim Analysis from Phase 3
study. Press Release. 9 November 2020. Available online: https://www.pfizer.com/news/press-release/press-release-detail/pfizer-and-biontech-announce-vaccine-candidate-against (accessed on 8 January 2021).
3. Moderna Announces Primary Efficacy Analysis in Phase 3 COVE Study for Its COVID-19 Vaccine Candidate and Filing Today withU.S. FDA for Emergency Use Authorization. Press Release. 30 November 2020. Available online: https://investors.modernatx.com/news-releases/news-release-details/moderna-announces-primary-efficacy-analysis-phase-3-cove-study (accessed on8 January 2021).
4. FDA Takes Key Action in Fight against COVID-19 by Issuing Emergency Use Authorization for First COVID-19 Vaccine.Press Release. 11 December 2020. Available online: https://www.fda.gov/news-events/press-announcements/fda-takes-key-action-fight-against-covid-19-issuing-emergency-use-authorization-first-covid-19 (accessed on 8 January 2021).
5. FDA Takes Additional Action in Fight against COVID-19 by Issuing Emergency Use Authorization for Second COVID-19 Vaccine.Press Release. 18 December 2020. Available online: https://www.fda.gov/news-events/press-announcements/fda-takes-additional-action-fight-against-covid-19-issuing-emergency-use-authorization-second-covid (accessed on 8 January 2021).
6. COVID-19 Vaccination Program Interim Playbook for Jurisdictional Operations. CDC. 29 October 2020. Version 2.0. Availableonline: https://www.cdc.gov/vaccines/imz-managers/downloads/COVID-19-Vaccination-Program-Interim_Playbook.pdf(accessed on 11 January 2021).
7. Malik, A.A.; McFadden, S.M.; Elharake, J.; Omer, S.B. Determinants of COVID-19 vaccine acceptance in the US. EClinicalMedicine2020, 26, 100495. [CrossRef] [PubMed]
8. SteelFisher, G.K.; Blendon, R.J.; Caporello, H. An Uncertain Public—Encouraging Acceptance of Covid-19 Vaccines. N. Engl.J. Med. 2021, 384, 1483–1487. [CrossRef] [PubMed]
9. Jamison, A.M.; Quinn, S.C.; Freimuth, V.S. “You don’t trust a government vaccine”: Narratives of institutional trust and influenzavaccination among African American and white adults. Soc. Sci. Med. 2019, 221, 87–94. [CrossRef]
10. Hamel, L.; Kirzinger, A.; Munana, C.; Brodie, M. KFF COVID-19 Vaccine Monitor. Press Release. December 2020. Available online:https://www.kff.org/coronavirus-covid-19/report/kff-covid-19-vaccine-monitor-december-2020/?utm_campaign=KFF-2020-polling-surveys&utm_medium=email&_hsmi=2&_hsenc=p2ANqtz-9EpdM8wscJHy__FjpP9PJ67CUSXfk4f_VyZdVC652V5zIy4qBzDeO-0b5iDXeDertNU8W0VOp6xcGENlKJvugasI_0OA&utm_content=2&utm_source=hs_email (accessed on 8 January 2021).
11. Centers for Disease Control and Prevention. Flu Vaccination Coverage, United States, 2015–2016 Influenza Season. 2016. Availableonline: https://www.cdc.gov/flu/fluvaxview/coverage-1516estimates.htm (accessed on 7 July 2021).
12. Bleser, W.K.; Miranda, P.Y.; Jean-Jacques, M. Racial/Ethnic Disparities in Influenza Vaccination of Chronically Ill US Adults:The Mediating Role of Perceived Discrimination in Health Care. Med. Care 2016, 54, 570–577. [CrossRef] [PubMed]
13. Quinn, S.C.; Jamison, A.M.; An, J.; Hancock, G.R.; Freimuth, V.S. Measuring vaccine hesitancy, confidence, trust and flu vaccineuptake: Results of a national survey of White and African American adults. Vaccine 2019, 37, 1168–1173. [CrossRef] [PubMed]
Vaccines 2021, 9, 767 13 of 13
14. Artiga, S.; Michaud, J.; Kates, J.; Orgera, K. Racial Disparities in Flu Vaccination: Implications for COVID-19 Vaccination Ef-forts. Available online: https://www.kff.org/policy-watch/racial-disparities-flu-vaccination-implications-covid-19-vaccination-efforts/ (accessed on 8 January 2021).
15. Dooling, K.; Marin, M.; Wallace, M.; McClung, N.; Chamberland, M.; Lee, G.; Talbot, H.K.; Romero, J.R.; Bell, B.P.; Oliver, S.E.The Advisory Committee on Immunization Practices’ Updated Interim Recommendation for Allocation of COVID-19 Vaccine—United States, December 2020. MMWR Morb. Mortal. Wkly Rep. 2021, 69, 1657–1660. [CrossRef] [PubMed]
16. Sternthal, M.J.; Slopen, N.; Williams, D.R. Racial Disparities in Health. Du Bois Rev. Soc. Sci. Res. Race 2011, 8, 95–113. [CrossRef][PubMed]
17. Woko, C.; Siegel, L.; Hornik, R. An Investigation of Low COVID-19 Vaccination Intentions among Black Americans: The Role ofBehavioral Beliefs and Trust in COVID-19 Information Sources. J. Health Commun. 2020, 25, 819–826. [CrossRef] [PubMed]
18. Public Health Emergency Preparedness and Response Capabilities. Centers for Disease Control and Prevention. October 2018. Up-dated January 2019. Available online: https://www.cdc.gov/cpr/readiness/00_docs/CDC_PreparednesResponseCapabilities_October2018_Final_508.pdf (accessed on 11 January 2021).
19. Warren, R.C.; Forrow, L.; Hodge, D.A., Sr.; Truog, R.D. Trustworthiness before Trust—Covid-19 Vaccine Trials and the BlackCommunity. N. Engl. J. Med. 2020, 383, e121. [CrossRef] [PubMed]
20. Bajaj, S.S.; Stanford, F.C. Beyond Tuskegee—Vaccine Distrust and Everyday Racism. N. Engl. J. Med. 2021, 384, e12. [CrossRef][PubMed]
21. Jarrett, C.; Wilson, R.; O’Leary, M.; Eckersberger, E.; Larson, H.J. SAGE Working Group on Vaccine Hesitancy. Strategies foraddressing vaccine hesitancy—A systematic review. Vaccine 2015, 33, 4180–4190. [CrossRef] [PubMed]
22. Taylor-Clark, K.; Viswanath, K.; Blendon, R. Communication inequalities during Public Health disasters: Katrina’s wake.Health Commun. 2010, 25, 221–229. [CrossRef] [PubMed]
23. Lin, L.; Savoia, E.; Agboola, F.; Viswanath, K. What have we learned about communication inequalities during the H1N1pandemic: A systematic review of the literature. BMC Public Health 2014, 14, 484. [CrossRef] [PubMed]
24. Savoia, E.; Testa, M.A.; Viswanath, K. Predictors of knowledge of H1N1 infection and transmission in the U.S. population.BMC Public Health 2012, 12, 328. [CrossRef]
25. Blendon, R.J.; Benson, J.M.; Desroches, C.M.; Weldon, K.J. Using opinion surveys to track the public’s response to a bioterroristattack. J. Health Commun. 2003, 8 (Suppl. 1), 83–92. [CrossRef] [PubMed]
26. Hand, D.J.; Till, R.J. A Simple Generalization of the Area Under the ROC Curve for Multiple Class Classification Problems.Mach. Learn. 2001, 45, 171–186. [CrossRef]