Embed Size (px)
Citation preview

The Pennsylvania State University
The Graduate School
School of Public Affairs
Predictors of Alumni Donor Behavior
in Graduates of the Traditional MBA and iMBA Programs
at The Pennsylvania State University
A Dissertation in
Public Administration
by
Jason W. Ketter
© 2013 Jason W. Ketter
Submitted in Partial Fulfillment of the Requirements
for the Degree of
Doctorate of Philosophy
December 2013
ii
The dissertation of Jason Ketter was reviewed and approved* by the following:
Jeremy Plant Professor of Public Policy and Public Administration Dissertation Advisor Committee Chair Steven A. Peterson
Director, School of Public Affairs Professor of Politics and Public Affairs
Stephen P. Schappe Director, School of Business Administration
Associate Professor of Management
Triparna Vasavada
Assistant Professor of Public Administration *Signatures are on file at the Graduate School

iii
ABSTRACT
The affordability of a degree from a public university is the subject of much
heated debate in the halls of many state governments. The taxpayer, as well as the
individual paying tuition, is asking the question: What is the return on investment for the
millions of dollars used to support public higher education? The taxpayer views public
universities as bloated, inefficient, staffed with overpaid faculty, prioritizing athletics
over academics, and unable to control costs. The recent graduate is asking: Was
obtaining a degree worth the thousands of dollars of debt only to find no job upon
graduation? Furthermore, local governments under pressure to meet balanced budgets are
asking local non-profits, including universities, who pay no local taxes to help with
expenses for such items as fire protection.
Public universities are asked to be competitive and control costs, but are not given
the autonomy to increase tuition or to close a branch campus to cut costs because state
legislators hear from their constituent that rising tuition is making the degree cost
prohibitive or closing a branch campus would be a disaster to a local economy. This
study aims to help expand the knowledge base for higher education administrators who
are seeking to enhance revenue streams, policy makers who are implementing
performance based funding for public higher education, and researchers who are seeking
to better understand predictors of alumni giving and the impact of the online program
graduate may have on philanthropy.
Online education is growing at a rapid pace in the United States. According to the
2012 Survey of Online Learning conducted by the Babson Survey Research Group in
collaboration with the Sloan Consortium found students taking at least online course now

iv
exceeds 6.7 million and this is an increase of over 570,000 from the year prior (Sloan
Constortium, 2013). Further the survey results found thirty-two percent of higher
education students now take at least one course online and seventy-seven percent of
academic leaders found learning outcomes coming from online education as the same or
superior to those in face-to-face classes.
This study examined predictors of alumni donor behavior of graduates of the
traditional and online MBA programs from a public research university. Logistic
regression was used to analyze the variables of student experience and alumni
experience. The study is grounded in the organizational identity theoretical framework
and a questionnaire was mailed to collect the data for the study.
The results suggest that online graduates have higher levels of student and alumni
experiences, and that student and alumni experiences overall are predictors of alumni
donor behavior. This study can be useful for professionals in the fundraising field and for
policy makers who are seeking enhanced revenue streams to support public higher
education. Additionally, this study fills the gap in the literature with the introduction of
research looking at online and traditional graduate alumni and student experiences.
Philanthropy can play a significant role in helping to secure more funds to support
student scholarships, fund annual operating expenses, new initiatives, and to help build
endowments that can help secure the future of a particular university.

v
TABLE OF CONTENTS
LIST OF FIGURES………………………………………………………………………………………….…...vii
LIST OF TABLES…………………………………………………………………………………………………viii
ACKNOWLEDGEMENTS………………………………………………………………………………….xi
CHAPTER 1: THE PROBLEM STATEMENT …………..………..………………………….1 Introduction.…………………………………………………..………………………………………….1
Problem Statement………………………………………………………….…………………………8 Significance of Study………………………………………………………………………………..12 Research Question…………………………………………………………………………………….14 Predictive Model…………………………………………………………………….…….18
CHAPTER 2: LITERATURE REVIEW………………………………………………….………….22 Higher Education Fundraising ………………………………………………………….…....22 Reasons People Give…………………………………………………………………………………25
Giving Back to One’s Alma Mater……………………………………………..31 Fundraising in the U.S.…………………………………………………………………….……….37 CHAPTER 3: METHODOLOGY……………………………………………………………..…………39 Quantitative Method………………………………………………………………………………….39 Theoretical Framework…………………………………………………………………………….40
Research Design and Data Collection…………………………..………………………...42 Population and Participants………………………………………………………...42
Definition of Terms...……………………………………………………………………47 Independent and Dependent Variables…………………..…………………..47
Questionnaire……………………………………………………………………………………..……..47 Issues of Validity and Reliability ……………………………………………..…………….49 Delimitations………………………………………………………………………..…..……….……...50
CHAPTER 4: DATA ANALYSIS………………………………………………………..…………...51 Overview………………………………………………………………………………………………..….51 Descriptive Statistics……………………………………………………………..……………….…51 Distribution of Data………………………………………………………………….……………….57 Individual T-test……………………………………………………..…………………………………58 Independent Sample T-test Results for Each Item……………………….…………61
Descriptive Statistics for the Constructs………………………………………….……...65 Hypothesis Testing…………………………………………………………………………………….68
H1: The MBA graduate will demonstrate higher levels of student experience—relationships…………………….…………………..…..68 H2: The MBA graduate will demonstrate higher levels of student experience—academic…………………………………….…………..…72 H3: There is a difference in student experience—impact on

vi
career between the iMBA and MBA graduates……………………......75 H4: There is a difference in alumni experience—alumni association between iMBA and MBA graduates………………..……..77 H5: There is a difference in alumni experience—engagement between iMBA and MBA graduates………………………………………....80 H6: Student experience distinguishes alumni donors from non-donors………………………………………...………………………………………………….82 H7: Alumni experience distinguishes alumni donors from non-donors……………………………………………………………………………………..…....87
CHAPTER 5: DISCUSSION AND ANALYSIS OF FINDINGS……….……………92 Discussion……………..……………………………………………………………………..…………...92 Overview of Findings………………..……………………………………………………………..93 Limitations of Study…………………………………..…………………………………..…………97 Future Research..………………………………………………………..…………………………....99
CHAPTER 6: CONCLUSION……………………………………………………………….……….....100 Introduction………..……………………………………………..........................................100
Summary………………..………………………………………………………………………………….103
REFERENCES……...…………………………………………………….………………………..……………..108
APPENDIX A Cover Letter and Questionnaire……………………………………..............119
APPENDIX B Reminder Post Card……………………………………………………………………..128

vii
LIST OF FIGURES
Figure 1.1 Predictive Model Questions for Alumni and Student Experience……..…18
Figure 1.2 Predictive Model Factors for Alumni Donor Behavior………….....………….19
Figure 2.1 Donor Giving Cycle………..………………………………………………………………..………29

viii
LIST OF TABLES
Table 2.1 Seven Faces of Philanthropy…………………………………………………………………….27
Table 2.2 Theoretical Frameworks……………………………………………………………………………30
Table 3.1 Sample Population………………………………………...............................................43
Table 3.2 Response Rate Comparison…………………………………………..………………………....46
Table 3.3 Chi-Square Test for Response Rate Comparison…………………………………….46
Table 4.1 Descriptive Statistics for Demographic Information……..………................52
Table 4.2 Descriptive Statistics for Gender……………………………………..………………….…..52
Table 4.3 Descriptive Statistics for Salary……………………………………….………………………53
Table 4.4 Descriptive Statistics for Age……………………………………………..……………………54
Table 4.5 Descriptive Statistics for Ethnicity……………………………..……………………………55
Table 4.6 Descriptive Statistics for Marital Status………………………….……………………….56
Table 4.7 Descriptive Statistics for Philanthropy…………………………………………………….57
Table 4.8 Descriptive Statistics of each item for MBA and iMBA…..…………………..59
Table 4.9 Independent Sample T-test Results for Select Items..……………….……………64
Table 4.10 Descriptive Statistics for Constructs……………………………............................66
Table 4.11 Cases by Constructs and Group…………………………………….………….………........67
Table 4.12 Item-Total Statistics for Cronbach’s Alpha Impact on Relationships….69
Table 4.13 Cronbach’s Alpha for Items Underlying Impact on Relationships……...70
Table 4.14 Descriptive Statistics on Student Experience, Impact on Relationship.71
Table 4.15 One-way ANOVA for Student Experience, Impact on Relationship....71
Table 4.16 Cronbach’s Alpha Item-Total Statistics of Academic Experience…….…73
Table 4.17 Cronbach’s Alpha for Items Underlying Academic Experience………....73
ix
Table 4.18 Descriptive Statistics on Student Experience, Academic………………….....74
Table 4.19 ANOVA for Student Experience, Academic………………………………..………..74
Table 4.20 Item-Total Statistics for Cronbach’s Alpha of Impact on Career.………..75
Table 4.21 Cronbach’s Alpha for Items Underlying Impact on Career…………………..76
Table 4.22 Descriptive Statistics for Student Experience, Impact on Career…………76
Table 4.23 ANOVA for Student Experience, Impact on Career……………………………...76
Table 4.24 Item-Total Statistics for Cronbach’s Alpha of Alumni Association…...78
Table 4.25 Cronbach’s Alpha for Items Underlying Alumni Association……….……..78
Table 4.26 Descriptive Statistics for Alumni Association………………………………………..79
Table 4.27 ANOVA for Alumni Association…………………………………………………………….79
Table 4.28 Item-Total Statistics for Cronbach’s Alpha Alumni Engagement……....80
Table 4.29 Cronbach’s Alpha for Items Underlying Alumni Engagement……........81
Table 4.30 Descriptive Statistics for Alumni Engagement……………………………………….81
Table 4.31 ANOVA for Alumni Engagement……………………………………………..…….........81
Table 4.32 Iteration History Student Experience of Donors and Non-Donor….....…83
Table 4.33 Block Classification Student Experience of Donors and Non-Donors..83
Table 4.34 Omnibus Tests for Model Coefficients Student Experience……….……....84
Table 4.35 Model Summary for Student Experience ………………………….……………….....84
Table 4.36 Hosmer and Lemeshow Goodness of Fit Test for Student Experience..85
Table 4.37 Classification of Donor and Non-Donor for Student Experience…..…….85
Table 4.38 Block 1 Method Variables in Equation for Student Experience…..…......86
Table 4.39 Iteration History Alumni Experience of Donors and Non-Donors……....87
Table 4.40 Block Classification Alumni Experience of Donors and Non-Donors...88

x
Table 4.41 Omnibus Tests for Model Coefficients Alumni Experience………..……….88
Table 4.42 Model Summary for Student Experience………………………………………………..89
Table 4.43 Hosmer and Lemeshow Goodness of Fit Test for Alumni Experience..89
Table 4.44 Classification of Donor and Non-Donor for Alumni Experience…..…….90
Table 4.45 Block 1 Method Variables in Equation for Alumni Experience……..…...90

xi
ACKNOWLEDGEMENTS
I would like to thank everyone who supported me on my journey. A special thank you is for my wife Nayana, son Nishantha, and daughter Nishani who were extremely supportive and sacrificed family time in order for me to pursue my doctoral degree. I also want to thank the extended Ketter family and friends Lew Tucker, Tom Leamer, and Yongjae Kim for their encouragement and support. Finally, I want to thank the chair of my dissertation committee Dr. Jeremy Plant and remaining members of the committee Drs. Steven Peterson, Stephen Schappe, and Triparna Vasavada for their insight, assistance, and support of my research.

xii
This dissertation is dedicated to
John F. Ketter

1
CHAPTER 1
THE PROBLEM STATEMENT
Introduction
The nonprofit sector is an integral part of our civil society. The line between the
nonprofit sector and the public sector began to blur in earnest in the 1960s, when
traditional relationships between state, federal, and local government and nonprofit
organizations changed. Through government contracts during the War on Poverty the
number of nonprofit organizations increased to carry out social and health programs,
mental health centers, and child welfare (Smith, 2008; Smith, 2010). The growth of the
nonprofit sector has continued since the 1960s and today warrants increased evaluation
and review within the public administration literature. This heightened need for review
stems from the need to examine issues such as accountability, performance management,
and future funding sources given the use of taxpayers’ funds to support the plethora of
nonprofits operating in the United States (Brooks A. C., 2002; Smith, 2008; Smith,
2010). Public higher education has been the recipient of such government support for
many years. Although not considered public agencies per se they are integral to a civil
society, and their welfare is a barometer on the future health of our democracy.
The coordination of a public higher education system is a complex process. Prior
to the 1950’s governance of the public higher education systems resembled that of private
colleges, with lay boards that made the fiduciary and policy decisions with a fair amount
of autonomy (McLendon, Deaton, & Hearn, 2007). This structure created competition
between state universities. With the postwar boom of enrollments states began to
examine efficiencies and long-term planning for the state universities to tackle the influx
of student enrollments never before experienced. The solution was seen to be
2
consolidation. From the 1950’s to the late 1980’s states embraced consolidating
governing boards “States achieved a highly centralized form of campus governance.
Under such arrangements, states granted a central board line authority over constituent
campuses, empowering the board to make many day-to-day decisions over institutions
with a given system, sector, or state” (McLendon, Deaton, & Hearn, 2007, p. 647).
Since the 1980’s, along with the decrease in state funds available for state public
higher education there has been a considerable amount of change in the governance of
public higher education. The state-wide board structure is seen to help regulate increases
in tuition and other policy decisions to control and coordinate a state system of higher
education to promote equity, standardization, and centralized decision making processes.
The deregulating of a central board is seen as favoring efficiency, choice, decentralized
decision making, and performance (McLendon, Deaton, & Hearn, 2007).
Governance structures are not the same across public higher education.
“Different states use different types of governance structures…most states are organized
with either regulatory or consolidate coordinating boards” (Delaney & Doyle, 2011, p.
354). In 2004 43 percent of states used a regulatory governance structure and 47 percent
used a centralized structure (Delaney & Doyle, 2011). For example, The Pennsylvania
State University was chartered in 1855 by the legislature of the Commonwealth of
Pennsylvania and today has a shared governance structure:
The Pennsylvania State University’s 32-member Board of Trustees is composed
of the following: Five trustees serve in an ex officio capacity by virtue of their position
within the University or the Commonwealth of Pennsylvania. They are the President of
the University; the Governor of the Commonwealth; and the state secretaries of the
3
departments of Agriculture; Education, and Conversation and Natural Resources. Six
trustees are appointed by the Governor; nine trustees are elected by the alumni, six are
elected by organized agricultural societies, within the Commonwealth; and six are elected
by the Board of Trustees representing business and industry endeavors. (Pennsylvania
State University, 2013)
Conversely the Pennsylvania State System of Higher Education’s governance
structure has more political appointees with the exception of student representatives:
The 20-member Board of Governors is responsible for planning and
coordinating the development and operation of the Pennsylvania State System of
Higher Education [PASSHE]. The Board establishes broad educational, fiscal
and human resources (including labor relations) policies, and oversees the
efficient management of PASSHE. Among other tasks, the Board appoints the
Chancellor and university presidents, approves new academic programs, sets
tuition, approves human resources policies and collective bargaining agreements
and approves PASSHE’s annual operating budget.
Eleven Board members are appointed to four-year terms by the Governor
of Pennsylvania. Their appointments are confirmed by the Pennsylvania State
Senate. Three students, selected from among the universities’ student government
association presidents, serve on the Board until graduation. Four legislators are
selected by the majority and minority leaders of the Pennsylvania State Senate
and House of Representatives. The Governor of Pennsylvania or a designee also
is a Board member, as is the state secretary of education or a designee.
(Pennsylvania State System of Higher Education, 2013)

4
Despite the view that public universities may not be seen as public agencies they
play an integral part in public policy given the level of resources allocated. The Morrill
Act of 1862 provided the framework for federal assistance for higher education and the
National Defense Education Act of 1958 affected higher education institutions by
providing support to students to study science, mathematics, and foreign languages (Dye,
2008). Government plays a role in supporting higher education through student
assistance, e.g., Pell Grants, low interest loans, and federal research dollars through
government agencies such as the National Science Foundation. States are responsible for
establishing higher education institutions. “The first state university to be chartered by a
state legislature was the University of Georgia in 1794” (Dye, 2008, p. 141). Although
the federal government provides support, the majority of the financial burden to support
public higher education rests with state governments (Dye, 2008; Fethke & Policano,
2012). And, unfortunately, these funds have been steadily decreasing.
For generations public universities have been supported by state funding;
however, there now appears to be a permanent decline of state support. The decrease of
this government subsidy means higher tuition for students and parents. Consider these
statistical indices “Following each recession starting in the early 1980s, the percentage of
educational expense paid by net tuition increased: in 1985 net tuition amounted to 23.3
percent; in 2000 it increased to 29.3 percent; and by 2010 it accounted for 40.3 percent.”
(Fethke & Policano, 2012, p. 12). A small change in a state subsidy requires a significant
increase in tuition, but because the state subsidy remains a significant part of the overall
state budget legislators clamor for tuition to be held constant or to rise less than the rate
of inflation. Higher education has had to respond to the tremendous pressure from rising

5
costs in health care, employee benefits, higher construction and maintenance costs. The
end result is that public higher education must broaden and/or enhance current funding
sources. Public universities must remain vigilant in operational efficiency and
effectiveness to maintain state funding levels that continue to trickle in.
Public higher education institutions have traditionally relied upon philanthropy to
help advance their mission, to distinguish themselves from their competitors, or to
transform themselves, e.g., moving from college to university status. A college may elect
to add programming, i.e., graduate degrees, and reorganize existing college majors into
undergraduate schools/colleges to seek university status from state and regional
accreditation agencies. From an international recruitment perspective this may aid a
university, as in certain parts of the world colleges are known as high schools or colleges
are actually the residence halls within a university. Private donations can assist with the
resource investment needed to carry forward with the accreditation process. Reliance on
philanthropy is no longer just for added extras, but for some universities for its survival,
as noted by Drezner (2011).
Although private institutions have solicited alumni, friends, foundations, and
corporations for support for centuries, public colleges and universities are turning
more to private giving to meet budgetary demands. As government support of
higher education decreases and the cost to educate a student rises, the need for
philanthropic support to maintain higher education’s excellence and increased
access is great. (Drezner, 2011, p. ix)
Public higher education, therefore, is turning more and more to philanthropy to
make up for financial shortfalls. A targeted source to fill this financial gap is the body of

6
alumni. Of the $28 billion donated to support higher education in 2010, $7.10 billion,
over 25 percent came from alumni (Council for Aid to Education, 2011). The only group
which gave more was private foundations, which donated $8.40 billion or 30 percent of
total support in 2010 (Council for Aid to Education, 2011). Private foundations,
however, use the alumni participation rate as a factor in awarding a grant to an
institution—the higher the rate the better. Philanthropy in public higher education has
become big business. Many four-year public institutions are currently conducting very
aggressive fundraising campaigns. For example, The University of Texas at Austin has
raised $1,198,752,800 of a $3,000,000,000 campaign; The University of Illinois has
raised $1,964,000,000 of a $2,250,000,000 campaign; and The Pennsylvania State
University has raised $1,031,284,673 of a $2,000,000,000 campaign (Chronicle of Higher
Education, 2012). In light of the financial need, the changing landscape of public higher
education, and the magnitude of fundraising campaigns, more research is needed on
voluntary support (Drezner, 2011; Frumkin, 2000; Lindahl & Conley, 2002; Mael &
Ashforth, 1992). Despite this call for research most literature on fundraising is centered
on generic best practices and is atheoretical (Drezner, 2011). Furthermore, research on
an entirely new type of constituent, the online alumnus, is virtually nonexistent (Distance
Education Report, 2009).
A significant portion of the future alumni body will have had a non-traditional
college delivery experience. Total enrollment of at least one online course, i.e., private
and public universities, in the fall of 2007 was reported to be 3.9 million (Lei & Gupta,
2010). The Sloan Online Survey of 2,500 colleges and universities in 2009, reported 5.6
million students enrolled in at least one online course. The growth rate for online

7
students was twenty-one percent compared to the less than two percent growth of the
overall higher education student population (Allen & Seaman, 2010).
David Schejbal, Dean, Continuing Education, Outreach and E-Learning Division
at the University of Wisconsin questions whether “to the extent that universities are
developing online programs, they might be eroding their alumni giving base and, i.e.,
shooting themselves in the foot” (Distance Education Report, 2002, p. 8). The online
college experience does not afford a student, a future alumnus, the same traditional
college delivery experiences such as face-to-face interaction with professors and fellow
students during class or during class breaks, interaction in study areas or dining areas
within the university community, or opportunities to participate in extracurricular
activities. Therefore, it is important for universities to learn about the impact an
increased number of online graduates will likely have on future philanthropy.
This study is aimed to aid the nonprofit sector and public higher education by
studying alumni experience (alumni association and alumni engagement) and student
experience (academic, impact on career, and impact on relationships), factors to help
predict alumni donation behavior, with an examination of traditional MBA graduates and
online MBA graduates. The field of Public Administration will benefit from this study
because of its relevancy to the funding and management of non-profit organizations,
governance issues and the relationship of these issues to political institutions.
Furthermore, this study will help contribute to the dialogue for public legislators as they
grapple with the myriad of public policies surrounding the support of public higher
education.

8
Problem Statement
Motivations to attend college are varied, but most individuals graduate with an
expectation that, armed with a university degree, there will be a better job with higher
pay waiting. Results from the U.S. Census Bureau (2011) show the 2008 mean annual
earnings for levels of educational attainment: high school degree $31,283; associate’s
degree $39,506; bachelor’s degree $58,613; master’s degree $70,856; professional degree
$125,019; and doctorate degree $99,697. Financial reward remains a valid rationale for
pursuing a degree beyond the contributions of enlightenment, socialization, pursuit of a
passion, or playing sports. However, the cost of achieving a university degree continues
to rise.
The average published tuition and fee charges for undergraduates to attend a
public four-year in-state institution for the 2011-2012 academic year was $8,244, an 8.3
percent increase from the previous year. At a public four-year out-of-state institution the
cost was $20,770, a 5.7 percent increase from the previous year; at a private nonprofit
four-year institution it was $28,500, a 4.5 percent increase from the previous year; and at
a for-profit institution it was $14,487, a 3.2 percent increase from the previous year
(College Board, 2012). The increased costs can be attributed to many issues, but for
public institutions across the U.S the decrease in appropriations per full-time equivalent
student (FTE) is a serious one. The trend in state funding is long-term and downward.
The annual percentage changes in state appropriations per FTE, excluding the federal
stimulus, decreased 11.29 percent in 2008-2009, decreased 8.71 percent in 2009-2010,
and decreased 1.76 percent in 2010-2011 (College Board, 2012).

9
Higher education fundraising appeals attempt to communicate the philosophy that
a philanthropic investment is making a difference in the lives of today’s students and
helps to promote a better future for the individual student and for society as a whole. The
theme is that a better educated society is a better society. In the solicitation of alumni it
is often communicated that their education was subsidized in part by contributions made
by alumni before them, friends, faculty, staff, parents, foundations, and corporations. In
other words, a person was not charged the true cost of his or her education; therefore, a
donor gives back because it is deemed “owed” for the received subsidy. Additionally, a
solicitation will communicate how a donation makes possible the ability for a current
student to attend via a scholarship and the reality that without said scholarship, regardless
of the already subsided total costs, the student could not pursue his or her educational
dreams.
Alumni support their alma mater philanthropically for a plethora of reasons, such
as alignment with a personal passion, affinity, feelings of gratitude, organization identity,
pride, tax incentives, feeling of giving back, or altruism (Baade & Sundberg, 1996;
Bruce, 2007; Clotfelter, 2003; Lindahl & Conley, 2002; Mann, 2007; Sun, Hoffman, &
Grady, 2007; Tsao & Coll, 2005). Additionally, alumni who strongly identify with their
alma mater are shown to exhibit higher levels of volunteerism and support (Drezner,
2009; Mael & Ashforth, 1992). The emotional element in giving back to one’s alma
mater stems traditionally from the social exchange that took place during the educational
experience. The more positive this educational experience the greater the likelihood of
making a donation when solicited (Baade & Sundberg, 1996; Clotfelter, 2001; Sun,
Hoffman, & Grady, 2007). This experience is thought of in terms of the traditional

10
educational experience: living on campus, attending class in person, participating in
extracurricular activities, and having personal face-to-face interaction with fellow
students and faculty. In addition to these assumptions one can also assume a certain
degree of economic reward achieved from obtaining a degree that may influence the
likelihood of giving back as an expression of appreciation.
With the rising costs of higher education and the financial pressures public
institutions are facing, the need for philanthropic support will increasingly become more
important for the future of higher education in the U.S. Institutions run the risk of pricing
themselves out of business if the return on investment from tuition paying students and
parents fails to yield good paying jobs that pays for the initial investment. If state
governments are forced to continue to cut higher education appropriations, institutions
will be required to make up the difference through higher tuition, expansion of
educational programming with lower delivery costs, e.g., online education, auxiliary
services revenue, and private charitable contributions.
The online educational model, however, breaks with the traditional social
exchange that takes place in the traditional residential education delivery model. There is
no in-person class interaction with faculty and fellow students, no in-person office hours
interaction with faculty, no involvement in in-person extracurricular activities, or no
leadership opportunities beyond strictly online groups or discussions. A strict online
educational experience is vastly different than the traditional model. Therefore, what
impact may this have on future alumni giving? If, as aforementioned, institutions of
higher education must rely more and more on alternative sources of funding to include

11
philanthropy, will online education produce an apathetic alumni body that views the
educational experience in a more purely economic and transactional sense?
The online education model sprung from the for-profit private sector. It continues
to produce thousands of private sector higher education alumni who were charged actual
costs (Buchen, 2005; Distance Education Report, 2009). Under this model the tuition
dollars contribute to the profits of shareholders and provide less emotional ties and
incentives to give back philanthropically after graduation. This reinforces the notion of a
college education as a commodity (Slaughter & Rhoades, 2004) and future alumni will
socially construct the college experience as transactional and not transformational
(Wastyn, 2009). Do online students at non-profit institutions view their educational
experience as merely an economic transaction as well because the online model lacks the
experiences of the traditional educational model?
In other words, higher education leadership faces a dilemma. If non-profit higher
education institutions continue to promote and expand the online educational model to
deal with immediate and projected funding issues, what impact will this have on alumni
giving in the future? Larger graduating classes under the traditional model already
present challenges to development offices to maintain respectable alumni giving
participation rates. It is more challenging to secure a 15 percent giving participation rate
for a graduating class of 1,000 than one of 500, and the giving participation rate is a
factor foundations consider when deciding to award an institution’s grant application.
Also, are institutions treating all alumni the same in their respective databases, i.e., not
differentiating between traditional and online? If not, this will present significant
messaging problems that attempt to invoke emotional connections for the purpose of

12
philanthropic investment. For example, a solicitation appeal that attempts to take an
alumnus down memory lane with references to buildings or on campus activities would
be inappropriate for an online graduate.
Significance of Study
Public institutions are under enormous financial pressure to cut costs, freeze
tuition, consolidate programming, and seek alternative funding sources. One avenue of
alternative funding is through fundraising; therefore, universities benefit from a graduate
who has demonstrated a strong organizational identity to his or her alma mater as this
identity can translate into charitable contributions (Drezner, 2009; Mael & Ashforth,
1992; Mann, 2007; McDearmon & Shirley, 2009; Sun, Hoffman, & Grady, 2007;
Tsiotsou, 2007). In addition to current financial pressures, institutions recognized years
ago that, with the ebb and flow in student demographics, there was a need to broaden the
range beyond the traditional students by instituting adult education and continuing
education programs (Pfeffer & Salancik, 1978). Today the question is not just about
expanding the age demographic of potential students, but also the location of potential
students. Traditionally, education was offered within a geographic region so a student
could live on campus or make a reasonable commute. This is no longer the case with
online education, or distance education. Today, students can literally attend from all
corners of the globe through a variety of distance based education models.
Distance education is the phenomenon where the student and instructor are
removed from each other and there is mediated interaction during the learning transaction
(Kanuka & Conrad, 2003). Originally established as correspondence courses, distance
education has evolved today into “web-based form of instruction [that] allows instructors

13
to reach a much larger audience and encourages more flexibility with a student’s
schedule” (Lei & Gupta, 2010, p. 616). As distance education has evolved, in many ways
it has revolutionized higher education.
This revolution sprang, ironically, from the for-profit private sector of higher
education. Walden University, founded in 1970, was one of the first, followed by
Capella University (originally called the Graduate School of America) and, most notable,
the University of Phoenix, which enrolls over 200,000 students (Buchen, 2005). The
public sector institutions, awakening to the revenue potential and demands of the market,
are inundating their curricula with distance education courses and programs. Total
enrollment, i.e., private and public universities, was reported to be 3.9 million students
enrolled in at least one online course by the fall of 2007 (Lei & Gupta, 2010). The
success that private sector educational institutions have had with distance education in
building their customer base has awakened the sleeping giants, i.e., the traditional public
institutions.
Distance education revenue is fast becoming a new foundation of higher
education delivery. This is shifting the tuition dependency from the sole traditional
education delivery model for institutions. Additionally, pertinent to higher education
fundraising, it will produce an ever-increasing online graduate alumni body.
Understanding this critical shift in terms of what it means for tuition revenue and future
philanthropic dollars is paramount for the financial sustainability of a public higher
education institution. Historically, the funds given by state government to public
institutions were in exchange to control access and tuition. State governments continue
to want this control despite providing less funding. Traditional restrictions are hindering

14
universities’ ability to react to the market place. According to one study, “the most
critical of these factors are rising competition from local and international competitors,
shifting technologies for delivering instruction, greater understanding and appreciation of
what tuition and fees actually purchase, and an altered willingness to pay students,
parents, and taxpayer” (Fethke & Policano, 2012, p. 216). Public institutions need to
prepare for financial diversification, e.g., away from dependence on state funding for
survival. Private funding can play a significant role in achieving this objective.
Research Question
The study tested whether the student experience and alumni experience,
traditional versus online, can help predict alumni donor behavior. The study also tested if
there is a difference in the alumni and student experience between online and traditional
MBA graduates. A student who was satisfied with his or her academic experience, and
felt that it contributed to his or her career success, would be more likely to give back to
his or her alma mater. However, academic experience regarding career is just a part of
the student experience. There is also the student experience of relationship building
during a student’s educational experience and student’s experiences that had an impact on
their career. Sun, Hoffman, and Grady (2007) found among seven significant predictor
variables for alumni giving, student experience –impact on career was not found to be
significant, but student experience – relationships and student experience –
extracurricular activities was found to be significant.
Their study did not, however, distinguish between online students and traditional
attending students. Additionally, this study categorized alumni experience as a one-way
communication focusing solely on what the alumni receive from the university, e.g.,

15
newsletter, website, and not the interaction between the alumni association and the
alumni. Identifying those predictors that an institution can influence such as the alumni
association and levels of alumni engagement would be valuable information for
fundraising operations. Sun, Hoffman, and Grady (2007) also did not look at the student
academic experience as a potential factor in predicting alumni donation behavior. Unlike
offering one educational delivery system, i.e., the traditional method, universities now
offer the online educational experience which is distinctly different. To accommodate
this significant change, this study explores two groups that attended the same university,
but did not have the same educational delivery experience. This study does not address
the economic motivators as a predicator of future giving even though the MBA is a
graduate degree and an assumption could be made that graduate alumni are more likely to
be economically motivated than undergraduates.
The MBA and iMBA are the two groups examined in the study. The independent
variables employed were types of alumni experiences (alumni association and
engagement) and student experiences (academic, impact on career, impact on
relationships). The dependent variable was donation behavior. A greater understanding
of any links between the independent and dependent variables will provide guidance to
university development operations in targeting potential alumni donors. Gender, age,
income, marital status and ethnicity were controlled variables. These variables were
controlled to better understand the relationship between the independent and dependent
variables. Additionally, controlling for these variables will help avoid confounding
variables that could jeopardize internal validity.

16
The iMBA student is a student that is studying for his or her master of business
administration from The Pennsylvania State University by taking courses exclusively
online. The Pennsylvania State University iMBA program employs the cohort model and
provides some personal interaction for students during a two week in-person workshop.
The iMBA student must work independently, and be self-reliant in dealing with the
technology and securing answers to questions that arise during his or her educational
experience. Like the iMBA student, the residential MBA can also interact with fellow
students and professor electronically or participate in the open-source structure.
However, the residential MBA student has more opportunity to interact with fellow
students and professors because of the informal opportunities that are presented, such as
breaks during lectures or chance hallway or dining hall meetings. In addition, by
attending the physical location of the university the residential MBA student is exposed
to more extra-curricular opportunities, including flyers on bulletin boards or student club
recruitment desks.
A sample taken from alumni of The Pennsylvania State University was used to
test the following hypotheses:
Hypothesis 1: The MBA graduate will demonstrate higher levels of student
experience—relationships.
Hypothesis 2: The MBA graduate will demonstrate higher levels of student
experience—academic.
Unless asked, and told, during an interview, a potential employer would be unable
to differentiate between an iMBA and a MBA graduate from The Pennsylvania State

17
University. There is nothing on the graduate’s record or diploma other than he or she
received his or her MBA. The following hypothesis was tested:
Hypothesis 3: There is a difference in student experience—impact on career
between the iMBA and MBA graduates.
Hypotheses testing the alumni association and alumni engagement experiences
was done:
Hypothesis 4: There is a difference in alumni experience—alumni association
between iMBA and MBA graduates.
Hypothesis 5: There is a difference in alumni experience—engagement between
iMBA and MBA graduates.
Finally, hypotheses testing alumni giving was conducted:
Hypothesis 6: Student experience distinguishes alumni donors from non-donors.
Hypothesis 7: Alumni experience distinguishes alumni donors from non-donors.
The study has both practical and theoretical significance. A better understanding
of the differences between the experiences of the MBA and iMBA graduate will assist
universities as they allocate resources in fundraising initiatives and in the area of alumni
relations. Philanthropy and associated development functions operate much like a private
business within a university. It is easier to measure outcomes and understand the return
on investment than in other aspects of university administration. For example, investing
funds in direct mail or phonathon activities, or an Annual Fund program, can be easily
compared to the funds these activities raised. If an Annual Fund expends more than it is
receiving in donations and alumni participation continues to decline this provides

18
valuable information to decision makers and suggest that changes are needed in the
operation of the Annual Fund.
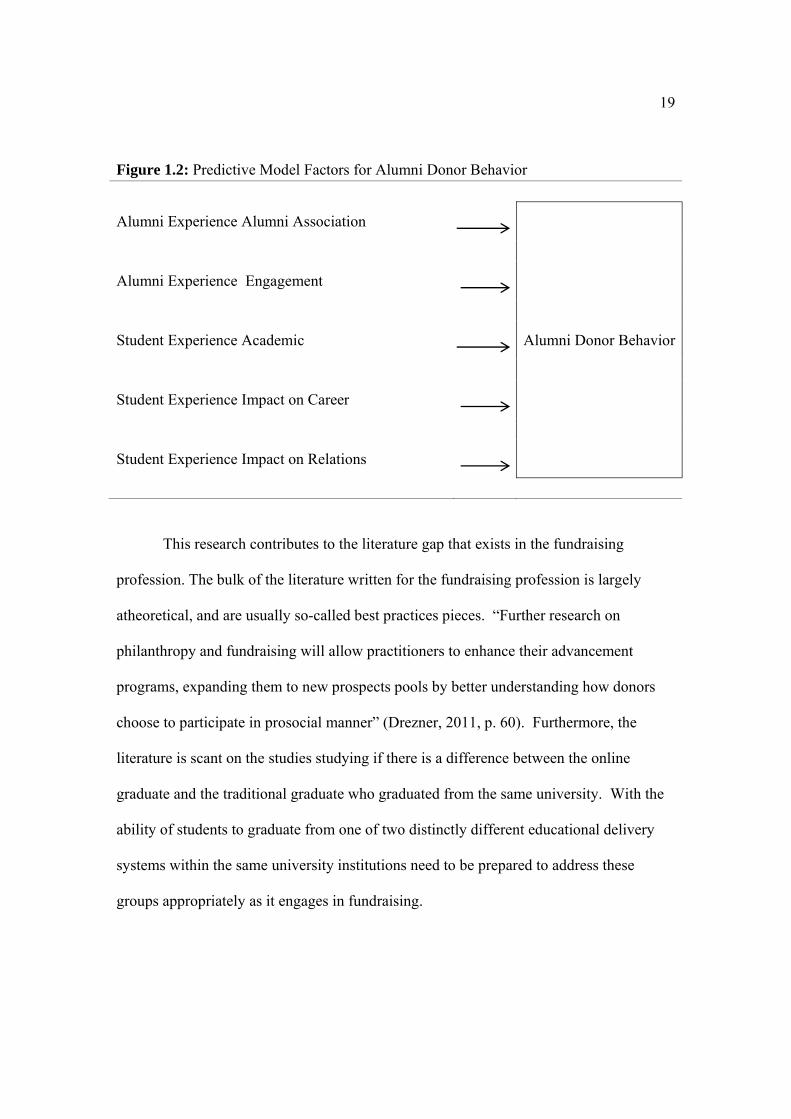
Predictive Model
Thirty-eight questions were used in the questionnaire to collect data on student
and alumni experiences. Figure 1.1 delineates the questions that measure each of the five
variables. For details of each question see the questionnaire, Appendix A. The Likert-
scale to measure respondents’ answers was utilized. The scale ranged from 1 (disagree)
to 5 (agree) and if a respondent answered N/A (non-applicable) this case was dropped
and assigned a 0. Figure 1.1 delineates the questions that measure each variable and
Figure 1.2. delineates the model’s measurements to be used to predict alumni donor
behavior.
Figure 1.1: Predictive Model Questions for Alumni and Student Experiences Q1, 2, 3, 4, 5,
6, 7, 8, 9 , 10
Alumni Experience Alumni AssociationMBA Q11, 12, 13,
14, 15, 16, 17 Alumni Experience Engagement
Q18, 19, 20,
21, 22, 23, 24, 25
Student Experience Academic
iMBA Q26, 27, 28,
29, 30, 31 Student Experience Impact on Career
Q32, 33, 34,
35, 36, 37, 38
Student Experience Impact on Relations
19
Figure 1.2: Predictive Model Factors for Alumni Donor Behavior
Alumni Experience Alumni Association
Alumni Donor Behavior
Alumni Experience Engagement
Student Experience Academic
Student Experience Impact on Career
Student Experience Impact on Relations
This research contributes to the literature gap that exists in the fundraising
profession. The bulk of the literature written for the fundraising profession is largely
atheoretical, and are usually so-called best practices pieces. “Further research on
philanthropy and fundraising will allow practitioners to enhance their advancement
programs, expanding them to new prospects pools by better understanding how donors
choose to participate in prosocial manner” (Drezner, 2011, p. 60). Furthermore, the
literature is scant on the studies studying if there is a difference between the online
graduate and the traditional graduate who graduated from the same university. With the
ability of students to graduate from one of two distinctly different educational delivery
systems within the same university institutions need to be prepared to address these
groups appropriately as it engages in fundraising.

20
This research has implications for professionals in the field of university
development. A better understanding of the prospect pool will assist with better
fundraising campaigns and improve efficiency of the fundraising operation.
Understanding a donor’s motivation from a theoretical viewpoint can be used to help
implement more successful fundraising activities for the practitioner. Also, this research
has implications for public policy.
Despite the decline in state appropriations, state governments are still allocating
millions of dollars for public higher education. The Commonwealth of Pennsylvania
allocated 4.6 percent of the $27.3 billion budget for higher education in 2011-2012
(Commonwealth of Pennsylvania, 2012). Part of the allocation process involves
performance base funding. Although the Pennsylvania State System of Higher Education
(PASSHE) is separate from The Pennsylvania State University the following point
illustrates the movement towards performance based funding for public higher education.
All of the indicators will be based on the three basic themes of student success,
access and stewardship, which, in turn, support PASSHE’s recently developed
strategic initiatives. The strategic initiatives are predicated on the need to
transform how, when and where student learning occurs; how the resources
necessary to ensure learning need to be recruited, retained and sustained; how the
PASSHE universities relate to their various communities; and how the State
System partners with the Commonwealth in creating and delivering a shared
vision of the future The performance funding program will measure how well the
universities succeed in transforming teaching and learning, securing resources,
21
engaging their communities and regions and providing leadership for the future.
(Pennsylvania State System of Higher Education, 2011)
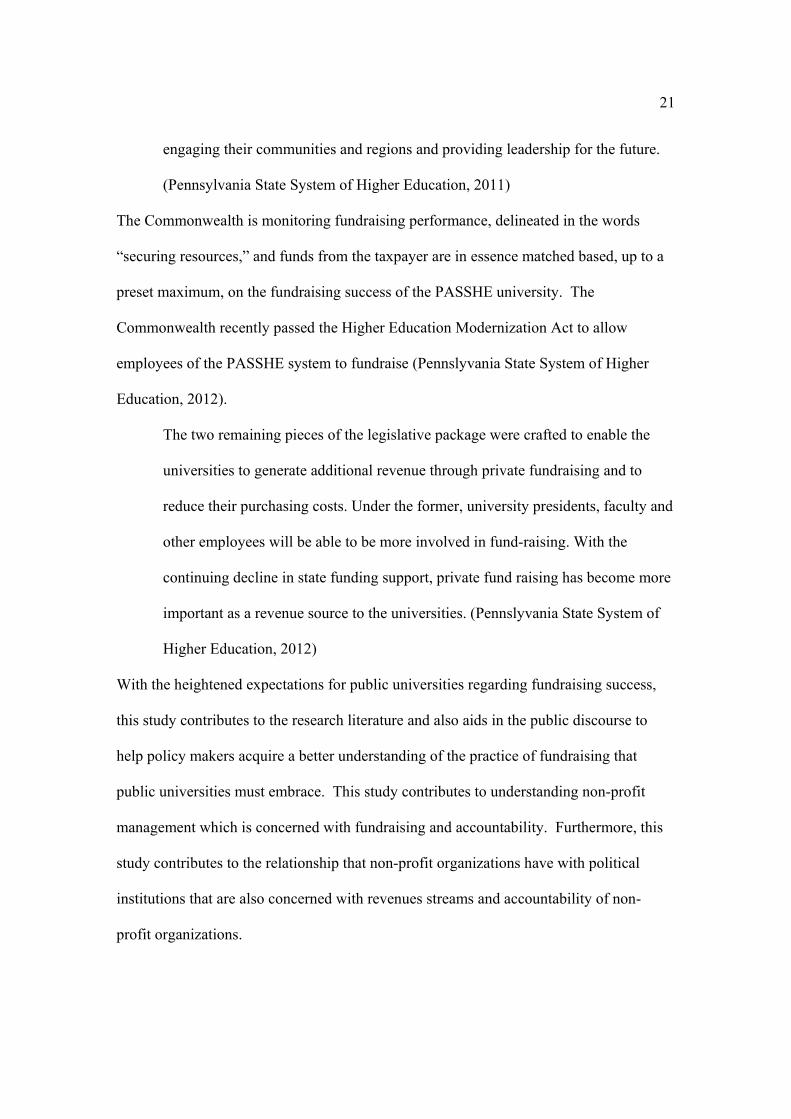
The Commonwealth is monitoring fundraising performance, delineated in the words
“securing resources,” and funds from the taxpayer are in essence matched based, up to a
preset maximum, on the fundraising success of the PASSHE university. The
Commonwealth recently passed the Higher Education Modernization Act to allow
employees of the PASSHE system to fundraise (Pennslyvania State System of Higher
Education, 2012).
The two remaining pieces of the legislative package were crafted to enable the
universities to generate additional revenue through private fundraising and to
reduce their purchasing costs. Under the former, university presidents, faculty and
other employees will be able to be more involved in fund-raising. With the
continuing decline in state funding support, private fund raising has become more
important as a revenue source to the universities. (Pennslyvania State System of
Higher Education, 2012)
With the heightened expectations for public universities regarding fundraising success,
this study contributes to the research literature and also aids in the public discourse to
help policy makers acquire a better understanding of the practice of fundraising that
public universities must embrace. This study contributes to understanding non-profit
management which is concerned with fundraising and accountability. Furthermore, this
study contributes to the relationship that non-profit organizations have with political
institutions that are also concerned with revenues streams and accountability of non-
profit organizations.

22
CHAPTER 2
LITERATURE REVIEW
Higher Education Fundraising
In 1638 John Harvard’s bequest to the Colonies’ first college can be viewed as the
start of higher education philanthropy in the United States (Cutlip, 1965; Drezner, 2011).
The notion of securing private donations for a college motivated individuals to take
action. Cotton Mather, a Harvard alumnus who was passed up for the presidency at
Harvard, solicited Elihu Yale, a wealthy individual who made his fortune working with
the East India Company to support another college, not Harvard. As a result of Reverend
Mather’s request, “Mr. Yale despite his great wealth, responded with a quantity of
assorted day goods which in the end realized over £550 in the American market place and
placed a new name on the American collegiate landscape” (Rudolph, 1990, p. 9). It was
not long after that securing private donations helped to launch other colleges; in addition
to Harvard and Yale, William and Mary, Dartmouth, Brown, Columbia, Rutgers,
Princeton, Pennsylvania, and Delaware (Rudolph, 1990). These private donations were
in addition to some of the public funds that some of these colleges were receiving, e.g.,
Dartmouth from New Hampshire and Vermont.
Fundraising originally in the U.S. was ad hoc, “the first systematic effort to raise
money on this continent was for a college” (Cutlip, 1965, p. 3). The key word in this
statement is systematic. Higher education fundraising was responsible for developing
systems for funding, systems that would eventually include paid fundraisers, to secure the
needed resources to run their endeavors. Higher education institutions today employ
predictive dialing phonathon operations, variable data infused direct mail campaigns,
high level donor research to identify top prospects, sophisticated planned (estate) giving

23
vehicles, and large-scale fundraising (marketing) campaigns. These campaigns are used
to energize the donor base and to reach lofty fundraising goals, some that exceed $1
billion.
As a result of the absence of direct state government support, private institutions
are more versed in the art of fundraising than public institutions. Private institutions have
been forced to learn and expand their fundraising craft. This expertise is demonstrated by
the recent or ongoing fundraising campaigns conducted by private institutions. For
example, Stanford University just completed a campaign that raised $6.2 billion, Cornell
University has raised more than $3 billion towards a $4.75 billion goal, and Columbia
University just raised its goal from $4 billion to $5 billion because of early success
(Chronicle of Higher Education, 2012). In comparison, The Pennsylvania State
University is working towards a goal of $2 billion to be raised by June 2014. Although
some select public institutions have broken the $1 billion fundraising goal, public
institutions are presently no match in keeping pace with the private institutions in
fundraising initiatives. Public institutions also do not have the comparable endowments
that the leading private institution counterparts enjoy.
Some public institutions are tailoring their fundraising campaign message to
highlight that the need of the campaign is a direct result of the decline in state funding.
Public institutions are increasingly becoming more dependent on charitable giving. Some
institutions utilize the earned income from endowments, made possible by private
support, to cover annual operating expenses. Often, these resources are lacking. A recent
example can be seen in the state of Wisconsin and the financial hit the University of
Wisconsin (UW) took from declining State appropriations. “In June 2011 the UW Board

24
of Regents raised tuition 5.5 percent to generate $37.5 million, which offset only about
one-third of the budget cut from the state. If, instead, private funds had been raised, the
additional endowment necessary would be about $770 million’’ (Fethke & Policano,
2012, p. 51). The Commonwealth of Pennsylvania also experienced steep cuts in higher
education in funding is recent years.
For the second year in a row, Pennsylvania Gov. Tom Corbett announced in his
budget for 2012-2013 that it would include cuts in higher education funding. The state-
related universities The Pennsylvania State University, Temple and Pitt would experience
a 30 percent reduction in funds (on top of the 20 percent cut they took last year) and the
14 state colleges and universities would see cuts in state funding by 25 percent (WHYY,
2012).
Significantly for fundraisers, donors do not want to make up the difference from
the budget cuts that public higher institutions are experiencing. Although the institution
may have experienced a cut in its budget, potential donors as taxpayers did not
experience a comparable savings in their taxes. Understanding the motivations of
individuals in the prospect and donor pool is critical for public higher education
fundraising because fundraising has certainly changed since the days of Reverend Mather
and Mr. Yale.
There are many challenges facing public higher education. The research
conducted for public higher education covers, for example, curriculum, access, diversity,
and efficiency. Furthermore, higher education fundraising research covers such topics as
annual funds, planned giving, and mega campaigns (Drezner, 2011). The literature
review for this study is focused on understanding the donor and the knowledge to help

25
predict donor behavior. The next section reviews the literature concerned with donor
behavior as it applies to philanthropy generally, i.e., not limited to public higher
education, and the various theoretical frameworks used in the study of donor behavior.
The chapter concludes by looking at donor behavior as it applies to higher education.
Reasons People Give
As philanthropy has becomes more sophisticated so too have donors. They seek a
return on their investment and want to make gifts that are more personal. The decision to
give is much more thoughtful and seeks to align passion with interest. Birkholz (2008)
speaks to this challenge:
There is a fundamental change emerging in the 21st-century fundraising.
This change is not driven by increasingly sophisticated nonprofit
organizations; nor is it propelled primarily by the integration of MBAs or
other smart people into the sector. Not even the compelling need for
support of worthy causes produced this evolutionary leap. In fact, the
most important component of the philanthropic partnership that is moving
us forward: We are changing because of our donors. (p. 1)
Public universities are starting to accept the reality that fundraising is part of the
fabric of the university operation. Knowledge acquired in understanding the prospect and
the donor will contribute significantly to the fundraising bottom line and ultimately the
university’s revenue base. Researchers continue to expand upon the more traditional
notion of altruism. It is no longer assumed to be the sole reason as to why people donate
to charitable organizations (Lindahl & Conley, 2002; Mann, 2007). In addition to
altruistic motives individuals can view charitable giving from the lens of economics,

26
organizational identity, social identity, or service lenses. An individual may donate
because he or she views the nonprofit sector as more efficient than the government in
delivering a particular service. Therefore, perceived efficiency of the nonprofit is
important in donor decision making (Bennett & Savani, 2003; Brooks A. C., 2006;
Hyndman, 1990; Iwaarden, Wiele, William, & Moxham, 2009). Under an economic
theory of charitable giving the donor seeks to understand the need and value of the gift in
economic terms. The economic theory may also be combined with the traditional
altruism viewpoint suggesting that the donor is not always exhibiting the self-interest
model of rational choice theory because the rational choice fails to explain those
occasional acts by these same individuals that are selfless acts of kindness (Frank, 1996).
Individuals give to nonprofit organizations for a plethora of reasons: alignment
with the mission and objectives of the organization, tax incentives, he or she is altruistic,
or he or she directly benefited or had a close loved one who directly benefited from the
organization (Prince & File, 1994). Prince and File (1994) conducted research to assist
fundraisers in developing a donor-centered fundraising approach. Using a preliminary
segmentation study of 476 affluent individuals donors (donor maintains $1 million or
more in discretionary investment and has made a gift to a nonprofit of $50,000 or more in
the past two years) followed by an intensive testing of the motivational items derived
from the initial donor segments the seven faces of philanthropy was developed. The
objective in developing these identity tags is to assist fundraisers in properly targeting the
nonprofit’s message that would best resonate with a particular donor, see Table 2.1.

27
Table 2.1: Seven Faces of Philanthropy. ______________________________________________________________________________
Donor personality Utilization of charity network ______________________________________________________________________________
Altruists Small charity network made up of close friends and family.
Communitarians Charity network made up of other business
owners and network overlaps with other affiliations.
Devout Religious based network. Dynasts Break away from parent’s charity network
and develop own from his or her own generation of friends.
Investors Qualify organizations through business
contacts. Repayers The exception: selection of nonprofit based
on own beneficiary experience. Socialites Charity network very important, group
decision-making regarding support of nonprofits.
______________________________________________________________________________
Adapted from The Seven Faces of Philanthropy, by Russ Prince and Karen File, 1994.
However, one cannot assume that the seven faces of philanthropy are mutually
exclusive. These identity tags may overlap. For example, a donor may indeed feel the
need to repay the institution, but this same donor may also be a business owner in the
local community where the institution is located, an altruistic person, and very sociable.
The more the institution can align the multiple faces of philanthropy of the donor, the
better position the institution is in when soliciting the donor.
28
Williams (2007), in a study to learn donor preferences among young donors (18 –
39 years old), baby boomers (40 – 58 years old), and mature donors (59 years and older)
found baby boomers valued information more than mature donors; and young donors
valued the efficiency of nonprofits less. “When making a decision to give, 72 percent of
young donors used the internet and 74 percent used a charity’s website to look for
information about a charity. Mature donors were the least likely group to use the internet
or a website” (Williams, 2007, p. 185). Understanding not only what motivates the
donor, but also how and what the donor needs regarding information is paramount. For
older adults the personal relationship, more face-to-face interaction, between organization
and donor is a critical component.
For older donors the social exchange, i.e., the personal relationship, significantly
impacted gift giving (Mathur, 1996). Using data collected from 240 surveys from
residents, 50 and older, living in a single metropolitan statistical area in a Midwestern
state Mathur (1996) found that the expectation of social interaction resulting from giving
a gift is positively related to gift giving behavior. Donors may provide a smaller gift to
test the stewardship program of the nonprofit. Stewardship is the action (thank you letter,
sending a birthday card, providing special invitations to events, and the like) taken by the
nonprofit to demonstrate appreciation for a gift given or volunteer work provided by an
individual. If after giving a smaller gift the older individual feels appreciated and
receives the expected social interaction from the nonprofit additional, and possibly larger
gifts, often follow.
The social exchange theory helps professionals in the field understand the donor
giving cycle (see Figure 2.1). Social exchange involves the communication necessary to

29
build a relationship with an individual (Blau, 1964). Without this communication an
individual cannot engage in the donor giving cycle and move from prospect to donor.
Additionally, it is not enough having the nonprofit’s outward actions (attempts to contact,
letters, etc.) towards a potential donor. The prospect needs to reciprocate and accept
incoming messages by acting on them, either negatively or positively.
Figure 2.1: Donor Giving Cycle.
Communication for all stages of the cycle (Repeat cycle to seek another gift in the future)
Suspect Prospect Cultivation Pre-Solicitation Solicitation Stewardship
Identify potential
donor
Begin Relationship
Strengthen Relationship
Confirmation of aligning passion and interest with university needs
Present proposal
and ask for gift
Report on impact of gift and thank
Table 2.2 summarizes theoretical frameworks used to understand or predict donor
behavior. The challenge in attempting to place an individual into one framework, e.g.,
economic is that it fails to take into account the complexity of the individual. Much like
the seven faces of philanthropy aforementioned the line for the theoretical framework can
be blurred as motivations for giving can be multifaceted. This study used the
organizational identity framework, which is covered in the next chapter.

30
Table 2.2: Theoretical Frameworks.
Theory Attributes Importance to Fundraising Charitable giving People are motivated to
give because they are altruistic, reciprocity, and direct benefits.
Donors feel an obligation to give back to make society a better place.
Economics Donors look at the
efficiency of the organization and impact from a resource allocation point of view.
Donors that see a good return on their philanthropic investment are more inclined to support the organization.
Service Donor behavior is shaped
by service value, service quality, and his or her level of satisfaction.
Donors feel they received professional service and value from the nonprofit they are likely to respond positively to fundraising appeals.
Social exchange/relationship marketing
Donors require an exchange with the organization that is personal and their social identity is partially defined via association with the organization. Relationships with donors can range from transactional to highly relational.
Some donors need a personal exchange with a segment of the organization so the donors does not feel like a just another number, i.e., donor. Other donors are satisfied with more of a transactional relationship.
Adapted from College fund raising using theoretical perspectives, by Timothy Mann, 2010.
In higher education one expectation, or hope, is that alumni give back because
they are repaying the institution that did not charge the full cost of their educational
experience. Another element could be that an alumnus feels a debt of gratitude to a
mentor, or that the degree acquired is linked to career advancement. Public institutions

31
benefit in many ways from strong relations with alumni. The stakes are high in
fundraising campaigns, some with billion dollar plus goals, and understanding the alumni
body warrants extensive research. The next section reviews alumni giving and alumni
donor behavior studies.
Giving Back to One’s Alma Mater
Researchers have sought to assist fundraising professionals in the field of higher
education to help understand more specific predictors of alumni donor behavior. In
addition to the demographic variables and personal motivation variables, alumni
predictors can be categorized into the student experience and the alumni experience
(Baade & Sundberg, 1996; Clotfelter, 2003; Sun, Hoffman, & Grady, 2007; Tsao & Coll,
2005). The latter, alumni experience, the fundraising and alumni teams at the university
can more readily influence. Therefore, it behooves higher education leadership,
fundraising professionals, and academic researchers to expand the knowledge base in the
area of student experience with an examination of the online student experience.
The ability to identify reasons or factors for giving back to one’s alma mater is
critical for university fundraisers in the highly competitive fundraising world. There are
demographic variables such as income, age, and gender, and other factors that have been
researched in search of the holy-grail of predictors of alumni giving. For example,
Bristol (1990) found that the number of years since graduation and initial giving to one’s
alma mater related to the level of alumni giving. More importantly, however, are those
factors the university can influence as it relates to alumni giving. A university cannot
influence demographic variables nor directly influence deep-seated internal motivation

32
for giving in general to nonprofits, but it can influence two specific areas that factor into
alumni giving: student experiences and alumni experiences.
One factor to consider is the efficiency of fundraising activities as delineated by
Hashemi et al., “Identification of potential donor for any charitable and philanthropic
organizations is essential because it saves considerable amounts of money, including the
time of professional staff” (Hashemi, Le Blanc, Bahrami, Bahar, & Traywick, 2009, p.
28). For example, if the university in a direct mail campaign is able to weed out non-
potential donors from the list considerable resources can be saved in postage and printing
costs. Hashemi et al. (2009) found the identification of data items, participation in
university events as a student, select class years, graduation from a select college within
the university, and a wealth index score that appear frequently together may be a key in
the identification of the potential donors.
In a study using a subset of the College and Beyond survey, a collection of
information from three cohorts of 34 colleges and universities, Clotfelter (2003) found
higher levels of contributions are associated with alumni income, if the alumnus
graduated from the university he or she first attended, and if the individual level of
satisfaction with his or her undergraduate experience was positive. This survey applied
only to the traditional education experience. Satisfaction is partially explained by overall
satisfaction with extracurricular activities and athletics. Another critical aspect of
satisfaction collected in the survey was a mentor variable, defined as someone taking an
interest in the individual during his or her college time. “Especially noteworthy is the
significance of the MENTOR variable, which speaks to the importance that alumni attach
to personal contacts with faculty and other college staff” (Clotfelter, 2003, p. 117). This
33
raises the question as to whether online education can provide the mentoring experience
found to be significant in the securing of donations from alumni.
In a study of 125 public and private doctoral-grant research universities, Baade
and Sundberg (1996) examined variables to represent student characteristics because
understanding the student body is helpful is determining alumni giving as students of
today are alumni of the future. The results indicate better students and the higher quality
of the experience, measured by instructional spending per student, and the experience a
student has influences attitudes toward the institution as an alumnus/alumna all correlate
with higher levels of giving. As in other research this study did not isolate online
students from traditional students.
Students who received scholarships were more likely to give back to his or her
alma mater while students who graduated with student loans were less engaged in alumni
giving (Monk, 2003). Monk (2003) examined patterns of giving of young graduates from
28 highly selective private institutions and found satisfaction with undergraduate
experience was the single most significant determinant of alumni giving. “Respondents
who reported that they are ‘very satisfied’ with the undergraduate experience gave over
2.6 times as much to their alma mater as graduates who were ‘ambivalent,’ ‘generally
dissatisfied,’ or ‘very dissatisfied.’” (Monk, 2003, p. 126). Previous studies have found
that an individual’s salary is also a determinant. Career earnings information is difficult
to obtain, but the level of debt acquired as a student or receipt of a scholarship is
information that universities can use in soliciting alumni.
Using the database of public doctoral-granting research universities in the U.S.,
Newman (2011) found that being a current member of the alumni association was a

34
strong predictor of alumni giving. The results of the study demonstrated that when an
alumnus was a member of the alumni association he or she was 4.8 times more likely to
be a current donor than non-members of the association. Additionally, life-time members
of the alumni association were the best donors, defined as making participation gifts
(Newman, 2011). Related to the notion of belonging and organizational identity is this
notion of legacy.
Meer and Rosen (2010) found that alumni who currently had a relative attending
their alma mater had strong effect on alumni giving behavior. This was particularly
strong when the student was a child or a niece/nephew of the alumnus or alumna. The
effect if the student was of an older generation, e.g., parent or grandparent, was not as
great. Additionally, there was no difference in the effect if the student was male or
female.
There are many motivations to giving to one’s alma mater as noted by Tsunoda,
“Motivations of alumni giving associated with institutional prestige and academic
quality, alumni college experience, alumni-institutional relationships and background
characteristics of the donors to be significant determinants of alumni giving” (Tsunoda,
2010, p. 6). Alumni satisfied with their MBA experience, university prestige, and salary
were all found to be significant predictors of donating behavior (Baruch & Sang, 2012).
Baruch and Sang also found in their constructed model using a database of 3,677 MBA
graduates that the level of engagement with the university, e.g., alumni activities, was a
significant mediating factor related to donating behavior.
Weerts and Ronca (2007) developed a model looking at inclination variables:
social exchange, expectation theory, and investment model against capacity variables.
35
The results demonstrated that alumni donors who are likely to give and who volunteered
expected to be involved. This level of involvement translates into supporting institutions
and built lifelong relationships. The motivations behind why graduates voluntarily
contribute vary, including for example, altruism, reciprocity, or direct benefits (Mann,
2007; Liu, 2006; Tom & Elmer, 1994). Furthermore, a graduate’s decision to support his
or her alma mater is influenced by the level of organizational identity the graduate
exhibits (Drezner, 2009; Mael & Ashforth, 1992; Sun, Hoffman, & Grady, 2007).
In an interesting qualitative study that examined non-donors and why they do not
give, Wastyn (2009) found both donors and non-donors did have positive feelings toward
their alma mater, had good experiences, and remained engaged as alumni, but they
differed in how they socially constructed those experiences into personal narratives. Four
major themes came to light in why these alumni do not give: “they considered college a
commodity not a charity, they do not believe the college needs their money, they have
misperceptions and uncertainties about giving and they do not make their giving
decisions logically” (Wastyn, 2009, p. 100). The theme of considering college a
commodity and not a charity is interesting, given that the subjects in this study all had the
traditional education experience. The online educational experience, launched via the
private sector, has its roots as transactional and can be viewed more as a commodity than
a traditional college experience.
Considering college education a commodity and not a charity is perhaps a view
that will increasingly complicate the fundraising efforts of universities. The online
education experience was launched by the for-profit companies/universities. This
development inherently undermines the traditional notion that students were not actually

36
paying the full cost of his or her educational experience. Paying for an online education
was viewed as comparable to purchasing any other commodity online. However,
consumers do not, or are expected, to make donations to for-profit companies from which
they have purchased an item or service. The traditional educational experience provides
more than just the classroom experience and helps to rationalize why the actual costs of
education exceeds what a student is charged.
The online educational experience is more transactional: the purchase of an item
or service is in exchange for a certain purchase price. Is the production of an online
degree, a degree without the traditional educational experience, going to produce a higher
percentage of future alumni that will view the experience as a purely transactional
economic exchange because the student was charged the actual costs for the delivery of
the education received? If so, this raises the question: is there any motivation for the
online alumnus to give back to the degree granting institution?
Alumni often identify strongly with their alma mater. In recognition of this,
organizational identity theory has been used to examine levels of philanthropic support
exhibited by graduates of educational institutions (Mael & Ashforth, 1992). When
alumni identify with their alma mater, sharing with people who are alumni of institutions
from which they graduated or taking very personally the actions of their alma mater, even
if they live on the other side of the world, they are exhibiting traits of an organizational
identity with their university. Organizational identity level can influence levels of
external philanthropic support institutions receive and, as delineated by resource
dependency theory (Pfeffer & Salancik, 1978), institutions are dependent on various
37
sources of external support, including philanthropic support. A positive alumni and
student experience may be viewed as creating positive organization identity.
There are many reasons why an individual donates to a nonprofit organization.
Again, some of the reasons people give are tax incentives, prestige, name recognition,
personal relationships with internal members of the organization, fulfilling a spiritual
need, or seeking to build a relationship with an organization for future business gain.
However, “one of the best reasons to give to a charity is that it has communicated a clear
and compelling mission to which donors can identify” (Frumkin & Kim, 2001, p. 274).
Although there is a plethora of public institutions, having seen one does not imply one
has seen them all. The last section of this chapter briefly addresses the rising competition
of fundraising in the U.S.
Fundraising in the U.S.
The growth of institutional fundraising is an example of the interdependence
between donor and institution. The donor has to satisfy a charitable need, perhaps his or
her altruistic gap, and the institution needs the financial resources to sustain itself or to
secure a competitive advantage in differentiating itself. Resource dependency theory
implies the creation of alliances that are interdependent. This interdependency can create
uncertainty for institutions as they become more reliant on philanthropic dollars.
Therefore, institutions seek to steward donors to increase behavioral interdependence
between donor and institution. “Interdependence is a consequence of the open-systems
nature of organizations—the fact that organizations must transact with elements in the
environment in order to obtain the resources necessary for survival” (Pfeffer & Salancik,
1978, p. 43). This interdependence is certainly not limited to public universities. The

38
increased sophistication of nonprofits is demonstrated through targeted campaigns, co-
branding, a robust consulting industry benefiting nonprofits, and the billions of dollars
raised annually.
In 2011 contributions reached $298.42 billion in the United States. The top
recipients of the contributions were religious organizations with 32 percent, educational
institutions with 13 percent and human service organizations with 12 percent (Urban
Institute, 2013). There are over 1.5 million nonprofit organizations incorporated in the
U.S, with a combined total revenue of $1.4 trillion, expenses of $1.4 trillion, and assets of
$2.7 trillion (Urban Institute, 2013). Explosion of nonprofits has heightened competition
for philanthropic dollars, increasing the pressure on institutions to sustain existing
relationships with current donors, lest they write checks elsewhere. Institutions are
dependent on a variety of sources for revenue as delineated by resource dependency
theory. Donors are one source of this revenue.
The degree to which an institution relies on philanthropic support to sustain its
reputation or even keep its doors open varies. With rapid growth in online education, the
future alumnus/alumna segment is building rapidly. However, the literature is scant on
the impact this will have on alumni donations and alumni giving participation rates. This
study addresses this gap in understanding the constituent’s level of organizational identity
and donor behavior that is critical to successful fundraising.

39
CHAPTER 3
METHODOLOGY
Quantitative Method
The study tested if the student educational and alumni experience between the
traditional MBA graduates and the online MBA graduates can help predict alumni donor
behavior. A quantitative approach to measure predictors of alumni donors was used.
This research strategy involves the “collection of numerical data, as exhibiting a view of
the relationship between theory and research as deductive and a predilection for a natural
science approach (and of positivism in particular), and as having an objectivist
conception of social reality” (Bryman, 2008, p. 140). Using a quantitative approach
allows a researcher to help understand the best predictors of outcomes (Creswell, 2009).
The following variables were used in the study: alumni experiences in alumni
association and engagement; and student experiences in academic, impact on
relationships, and impact on career. Sun, Hoffman, & Grady (2007) found among seven
significant predictor variables for alumni giving, student experience –impact on career
was not found to be significant, but student experience – relationships and student
experience – extracurricular activities were found to be significant. Their study did not,
however, distinguish between online students and traditional attending students.
Additionally, Sun et al. (2007) categorized alumni experience as a one-way
communication focusing solely on what the alumni receive from the university, e.g.,
newsletter, website, and not the interaction between the alumni association and the
alumni. Unlike offering only the traditional educational delivery system many
universities now offer the online educational experience which is distinctly different.
Therefore, this study aims to fill the gap in the literature by exploring two groups that
40
attended the same university pursuing a similar graduate degree, but who did not have the
same educational delivery experience.
Furthermore, the importance of the study is not only to shed light on this new
development but also to assist universities with resource allocation for fundraising and
alumni relations purposes. With the introduction of the online option for students,
university fundraisers are faced with the additional challenge of reaching a segment of
the alumni population that has had distinctly different student and educational
experiences than the traditional student. The pursuit of a higher education degree is
largely looked at in today’s market by potential students, and their parents, in terms of the
return on investment. This has created pressure on universities to keep tuition costs
stable while at the same time expenses, such as health care for staff and retirement costs,
continue to rise. Philanthropy is a viable option to help subsidize the costs for student
scholarships and other ways of reducing the cost of attending college. This chapter
includes an outline of the theoretical framework, the research design and collection of the
data, and a discussion of the population and sample.
Theoretical Framework
Alumni are assumed to identify with their alma mater. Organizational identity
theory has been used to examine levels of philanthropic supported exhibited by graduates
of educational institutions (Mael & Ashforth, 1992). Mael and Ashforth found that
alumni identifying with their alma mater correlates with participation in fundraising
campaigns. In their words, “Organizational identification is defined as a perceived
oneness with an organization and the experience of the organization’s successes and
failures as one’s own” (Mael & Ashforth, 1992, p. 103). Individuals need to define the

41
relationship with an organization by answering “Who am I?” and “Who are we?” (Albert,
Ashforth, & Dutton, 2000). Therefore, an individual can identify himself or herself as an
alumnus/alumna of his or her university. There are many factors that can influence
alumni donation behavior: the fondness an individual holds towards his or her alma
mater is influenced by his or her time spent at the university, interaction with
faculty/students/mentor, time spent on extracurricular activities, outcome of career
placement upon graduation, and even how the individual feels towards his or her alma
mater’s actions taken today, e.g., budget allocation towards athletics instead of the liberal
arts (Gaier, 2005; Mael & Ashforth, 1992; Miller & Casebeer, 1990).
Organizational identity can influence the levels of external philanthropic support
institutions receive and, as delineated by resource dependency theory (Pfeffer &
Salancik, 1978), institutions are dependent on various sources of external support,
including philanthropic support. A positive alumni and student experience can be viewed
as influencing positive organization identity. By defining oneself in part by the
associations he or she keeps the person is setting a course for his or her future action. If
the organization is successful the individual will join in the celebration of said success.
On the other hand if the organization is failing the individual may elect to disassociate
him or herself from the organization. If an individual has positive and distinctive identity
with an organization, this can translate into support and loyalty (Ashforth & Mael, 1989;
Mann, 2007).
Of course the ability to donate, i.e., resources to give, is different than the
willingness to give. If an individual has the resources but does not identify positively
with his or her alma mater, then securing a donation is a challenge. On the other hand

42
there are alumni who positively identify with their alma mater; however, they do not have
the financial ability to donate. “The consideration of organization identification theory in
college fundraising is significant because it provides a rational explanation of why people
make donations” (Mann, 2007, p. 40). Fundraising is not unlike business in that time is
best spent with prospects who can provide the most business, i.e., donations. For
fundraisers, spending time with those alumni with the ability to provide the leadership or
the largest gift and who have a positive institutional identification can contribute to a
more efficient and effective fundraising operation.
Research Design and Data Collection
This section commences with a review of the data collected used to complete the
study. The sampling frame, the participants, and the definition of terms is discussed.
The quantitative approach allowed for the testing of the hypotheses by collecting data.
Confirmation or refutation of the hypotheses through observation and measuring results
numerically was done.
Population and Participants
The sampling frame used consists of MBA and iMBA graduates from The
Pennsylvania State University. There are several programs across the university; the
sample frame contained MBA and iMBA graduates from all the programs. The
university has a traditional MBA program that requires a student to attend classes in
person and have in person time with professors and his or her fellow students throughout
the life of the program. The iMBA is comprised of 19 online courses and two one-week
residency experiences (Pennsylvania State University, 2010).

43
The university tracks whether a student enrolled and graduated from the MBA
program or the iMBA program. Therefore, a stratified random sample was utilized. The
advantage of this method is that it “ensures that the resulting sample will be distributed in
the same way as the population in terms of the stratifying criterion” (Bryman, 2008, p.
173). There are several subcategories codes of MBA graduates: ACCTG, B ADM,
BUS, BUSAD, FIN, MGMT, MKTG, etc. There were no similar subcategories, i.e.,
ACCTG, B ADM, BUS, BUSAD, FIN, MGMT, MKTG, etc. for the iMBA graduates.
For the iMBA graduates there was only iMBA classification and no subcategories;
therefore, the subcategory B ADM of the traditional MBA program was utilized as it
represents the most generic rubric, Business Administration, for the overall general study
programs for the MBA program. The population for the B ADM subcategory was 860
and the iMBA population was 527, for a total population size of N = 1387 (see Table
3.1). A sample size of 500 was used. This size was based on providing a reasonable
response target number. Using the stratified method the sample was randomly selected
for the B ADM MBA and iMBA graduates.
Table 3.1: Sample Population. ______________________________________________________________________________
Graduates Population % of Total Stratified Sample ______________________________________________________________________________
B ADM MBA 860 62% 310 iMBA 527 38% 190 Total 1387 100% 500 ______________________________________________________________________________

44
A total of 181 usable questionnaires were returned for a 36 percent response rate.
In an analysis of 1607 academic studies published from 2000 to 2005 Baruch and Holtom
(2008) found the mean mail response rate was 44.7 percent with a standard deviation of
21.8 percent. This study was less than the mean found by Baruch and Holtom (2008).
Despite the numerous studies they were not able to include because the response rate was
not reported, Rogelberg and Stanton (2007) state putting response rates into acceptable
categories fails to help demonstrate that the report research is free from nonresponse bias.
Rogelberg and Stanton (2007) further explain,
If the standard response rate in one’s research area is 45% and a new article in the
same area achieves 55%, we suggest that using this achievement to claim superior
results is folly because the difference between the new study’s response rate and the
standard contain little if any information about the presence, magnitude, or direction
of nonresponse bias present in the data…in contrast, if a study does obtain a
response rate well below some industry or area standard, this also does not
automatically signify that the data obtained from the research were biased. (p. 198)
In an evaluation of Information Systems research, Sivo et al., (2006) found in the
publications of the Journal of AIS, Information Systems Research, Management
Information Systems Quarterly, European Journal of Information Systems, Management
Science, and Journal of MIS the average response rate in research in which data were
gathered by questionnaire averaged 22 percent to 59.4 percent. In an evaluation of mail
surveys for election forecasting Vissner et al., (1996) found mail surveys were more
accurate than telephone surveys, even with a response rate below 30 percent. “Mail
surveys have limitations, and low response rates are clearly one of them, but it is also

45
clear that these limitations are not necessarily as debilitating as some assume” (Visser,
Krosnick, Marquette, & Curtin, 1996, p. 216). Visser et al., further state, “So to view a
high response rate as a necessary condition of accuracy is not necessarily sensible, nor is
the notion that a low response rate necessarily means low accuracy” (p. 216).
For this study nine respondents were dropped from the final analysis because their
questionnaires arrived after the analysis had begun or were not filled out. Ninety-five
questionnaires were returned from the MBA graduates for a 31 percent response rate and
eighty-six questionnaires were returned from the iMBA graduates for a 45 percent
response rate. Chi-square test, see Tables 3.2 and 3.3, was used to explore the
relationship between the iMBA and the MBA by returned and no returned surveys. The
Continuity Correction value is 10.275 and has an associated significance value of .001.
The result is significant; the proportion of iMBA that returned the survey is significantly
different from the proportion of the MBA surveys that were returned.

46
Table 3.2: Response Rate Comparison.
No returned Returned VAR00002
iMBA Count 104 86 190 Expected Count 121.2 68.8 190.0 % within VAR00002
54.7% 45.3% 100.0%
% within VAR00003
32.6% 47.5% 38.0%
% of Total 20.8% 17.2% 38.0% MBA Count 215 95 310
Expected Count 197.8 112.2 310.0 % within VAR00002
69.4% 30.6% 100.0%
% within VAR00003
67.4% 52.5% 62.0%
% of Total 43.0% 19.0% 62.0% Total Count 319 181 500
Expected Count 319.0 181.0 500.0 % within VAR00002
63.8% 36.2% 100.0%
% within VAR00003
100.0% 100.0% 100.0%
% of Total 63.8% 36.2% 100.0%
Table 3.3: Chi-Square Test for Response Rate Comparison.
Value df
Asymp. Sig. (2-sided)
Exact Sig. (2-sided)
Exact Sig. (1-sided)
Pearson Chi-Square 10.899a 1 .001
Continuity Correctionb 10.275 1 .001
Likelihood Ratio 10.808 1 .001
Fisher's Exact Test .001 .001Linear-by-Linear Association
10.877 1 .001
N of Valid Cases 500
a. 0 cells (.0%) have expected count less than 5. The minimum expected count is 68.78. b. Computed only for a 2x2 table
47
Definition of Terms
iMBA graduate is defined as an alumnus or alumna of The Pennsylvania State
University who received his or her educational learning experience online.
MBA graduate is defined an alumnus or alumna of The Pennsylvania State
University who received his or her education learning experience in person.
Online program is defined as the online educational learning experience.
Traditional program is defined as the in person education learning experience.
Independent and Dependent Variables
The independent variables are types of alumni experiences (alumni association and
engagement) and student experiences (academic, impact on career, impact on
relationships). These factors were used as predicators of alumni donation behavior. For
example, alumni who were treated well as students and had a positive student experience,
both in relationships and impact on career, are more receptive to making gifts. The
alumni experience is also a factor in predicting alumni donation behavior as the engaged
alumnus or alumna is likely to be better informed and aware of the philanthropic needs of
the institution. The dependent variable is donation behavior. Gender, age, income,
marital status and ethnicity were all controlled in order to determine if there is a
relationship between the independent and dependent variables.
Questionnaire
The questionnaire was mailed in September 2012 to collect the data. The five page
questionnaire (see Appendix A) was printed on both the back and front pages to minimize
weight and save on postage expense. The questionnaire included an introduction letter
(see Appendix A) that explained the purpose of the research, that participation was

48
strictly voluntary, that all responses would be kept confidential and no personal
identifying information will be recorded, the respondent could elect to stop at any time or
not answer any questions they did not want to, and finally, they could contact me or The
Pennsylvania State University Institutional Review Board with any questions.
To promote a high response rate each envelope was hand-addressed and each
envelope had a postage stamp affixed rather than metered postage. Twenty-eight days
following the questionnaire a reminder postcard (see Appendix B) was mailed to the
entire population and because the survey is anonymous the reminder postcard was written
in such fashion so as to be appropriate for both those individuals who had not yet
returned the questionnaire and for those that had. The return envelope was addressed to
the researcher both in the addressee block and the return address block to discourage
individuals from placing his or her return address on the envelope. Additionally, each
return envelope had a postage stamp affixed rather than metered postage.
The survey was a self-administered questionnaire and used a 5-point value
congruence Likert-scale to measure determinants of alumni donation behavior. The
questionnaire used to collect the data had forty-six questions, including demographic
questions. The instrument’s questions represent the subscales alumni experience—alumni
association, alumni experience—engagement, student experience—impact on career,
student experience—relationships, and student experience—academic for The
Pennsylvania State University MBA.
The instrument provided preselected options for the respondent to answer using
the 5-point value congruence Likert scale: 5 points for agree, 4 points for somewhat
agree, 3 points for neutral, 2 points for somewhat disagree, 1 point for disagree, and no

49
points assigned for N/A (non-applicable). There were ten questions to measure the
alumni experience—alumni association, seven questions to measure the alumni
experience—engagement, eight questions to measure the student experience—academic,
six questions to measure the student experience—impact on career, and seven questions
to measure student experience—impact on relationships. Questions to measure and
control for the variables age, gender, income, ethnicity, and marital status were asked.
The variables were controlled to better understand the relationship between the dependent
and independent variables.
Issues of Validity and Reliability
Research must consider the validity and reliability of the data along with the
methods used to collect the data in analyzing the data. Overall this provides confidence
in the research results. Validity is whether an instrument measures what the instrument
sets out to measure. Reliability is whether an instrument is consistent when repeated
(Bryman, 2008; Field, 2009). Validity and reliability provide the necessary confidence
for the evaluation. To assist in minimizing issues related to validity and reliability is to
use questionnaires and constructs that have demonstrated validity and reliability.
The questionnaire was developed based on some of the constructs of the student
experience and alumni experience from Sun, Hoffman, and Grady (Sun, Hoffman, &
Grady, 2007). The validity and reliability of the data was checked in the analysis stage
delineated in the next chapter. The next chapter presents the analysis of the data that was
collected.

50
Delimitations
The research was limited to MBA graduates and not bachelor graduates because
the ability to secure an online graduate degree from The Pennsylvania State University
has more history than the undergraduate degree. The sample was limited to B ADM
MBA traditional graduates rather the entire population of traditional MBA graduates. It
was cost prohibitive to expand the study to the entire traditional MBA graduates and to
have a representative iMBA graduate sample in portion to a group of traditional
graduates so the B ADM population was used. The iMBA graduate does not graduate
with a specialization; therefore, the B ADM, the general rubric MBA was used in
comparing the online iMBA graduates and the traditional MBA graduates.
The study was limited with respect to graduate degree holders at The
Pennsylvania State University. This study was limited in that only MBA graduates were
studied, not other graduate degrees or undergraduates. Further, the study was of
graduates of a public university versus a private university because of the university’s
link to state government funding and public policy. Finally, the collection of the data
was limited by mail only and no online or over the phone option was available. The data
provided had physical addresses for each record, but an email was not available for each
record. Also, surveys were mailed out first class and if a participant had moved the
survey would be forwarded. If an email is no longer current the email becomes
undelivable. The next chapter covers in detail the analysis of the data.
51
CHAPTER 4
DATA ANALYSIS
Overview
This chapter reviews the data analysis that was used for the data collected from
the questionnaire. The data was analyzed using the Statistical Package for Social
Sciences (SPSS). Statistical methods included correlation coefficients analyses, t-tests,
analyses of variances, One-way ANOVA, and logistic regression. The data was used for
the model to determine predictors of alumni donor behavior and to understand the
differences between the MBA graduate and the iMBA graduate alumni and student
experiences. The results of the descriptive statistics are first explained, followed by how
the data was distributed.
This design allowed testing of the hypotheses by using analysis of One-way
ANOVA and logistic regression to analyze results and report the findings. The procedure
in conducting the data analysis was as follows: descriptive statistics, individual T-tests,
and to test H1- H5, One-way ANOVA was used and to test H6 and H7, logistic
regression was used.
Descriptive Statistics
Descriptive statistics on the data were run to acquire an understanding of the
respondent pool and to check how the data was distributed. Table 4.1 provides the
summary of the demographic information. Only marital status had a higher percentage of
missing cases compared with all other demographic information. The higher number of
missing cases of marital status could be attributed to the fact the survey did not provide
the option of “partner” as an option.

52
Table 4.1: Descriptive Statistics for Demographic Information.
Cases
Valid Missing Total N Percent N Percent N Percent
Gender 179 98.9% 2 1.1% 181 100.0%Salary 173 95.6% 8 4.4% 181 100.0%Age 179 98.9% 2 1.1% 181 100.0%Ethnicity 177 97.8% 4 2.2% 181 100.0%Marital status 155 85.6% 26 14.4% 181 100.0%
As indicated by Table 4.2 a majority of the respondents were male (69%) to
female (31%) and these percentages held both for the overall group and within the MBA
and iMBA groups. A Chi-square test was performed to determine if the males and
females were distributed differently across the MBA and iMBA groups. The test failed
to indicate a significant difference, X2 (1, N=179) = .037, p >.05.
Table 4.2: Descriptive Statistics for Gender.
Total Female Male Group MBA Count 30 64 94
% within Group 31.9% 68.1% 100.0% % within Gender 53.6% 52.0% 52.5% % of Total 16.8% 35.8% 52.5%
iMBA Count 26 59 85
% within Group 30.6% 69.4% 100.0% % within Gender 46.4% 48.0% 47.5% % of Total 14.5% 33.0% 47.5%
Total Count 56 123 179
% within Group 31.3% 68.7% 100.0% % within Gender 100.0% 100.0% 100.0%

53
The MBA group fared slightly better at the highest end of the salary scale, thirty-
five percent, compared to twenty-one percent for the iMBA group as indicated by Table
4.3. This could be attributed to an older population in the MBA group (see Table 4.4)
and having spent more time in the workforce that provided more opportunity for
increases in salary. Sixty percent of all respondents indicated an annual salary greater
than $100,000. From a fundraising perspective both groups, based on salary alone, are
viable prospects for a major gift ($5,000 or more a year for five years). Ninety-five
percent of the group based on salary alone appeared to be excellent prospects for a
leadership annual gift of at least $1,000 or more a year.
A Chi-square test was performed to determine if salary was distributed differently
across the MBA and iMBA groups. The test failed to indicate a significant difference, X2
(4, N=173) = 8.646, p >.05.
Table 4.3: Descriptive Statistics for Salary
Less than
$50K
$50K-
$74.9K
$75K-
$99.9K
$100K-
$149.9K
More than
$150K Total
Group MBA Count 7 10 20 21 31 89
% within Group 7.9% 11.2% 22.5% 23.6% 34.8% 100.0%
% within Salary 87.5% 41.7% 52.6% 41.2% 59.6% 51.4%
% of Total 4.0% 5.8% 11.6% 12.1% 17.9% 51.4%
iMBA Count 1 14 18 30 21 84
% within Group 1.2% 16.7% 21.4% 35.7% 25.0% 100.0%
% within Salary 12.5% 58.3% 47.4% 58.8% 40.4% 48.6%
% of Total .6% 8.1% 10.4% 17.3% 12.1% 48.6%
Total Count 8 24 38 51 52 173
% within Group 4.6% 13.9% 22.0% 29.5% 30.1% 100.0%
% within Salary 100.0% 100.0% 100.0% 100.0% 100.0% 100.0%
% of Total 4.6% 13.9% 22.0% 29.5% 30.1% 100.0%

54
It was not surprising to learn that the majority of the older respondents would be
in the MBA group, see Table 4.4. The traditional MBA program has been in operation
longer. Furthermore, younger generations have embraced new technology at a higher
rate than the older generations and may be less intimidated in pursuing the online
education delivery option. A Chi-square test was performed to determine if age was
distributed differently across the MBA and iMBA groups. The test indicated a significant
difference, X2 (4, N=179) = 51.708, p <.05.
Table 4.4: Descriptive Statistics for Age. 25 less 26-35 36-45 46-55 56+ Total
Group MBA Count 1 13 26 29 26 95
% within Group 1.1% 13.7% 27.4% 30.5% 27.4% 100.0%
% within Age 100.0% 23.6% 44.1% 78.4% 96.3% 53.1%
% of Total .6% 7.3% 14.5% 16.2% 14.5% 53.1%
iMBA Count 0 42 33 8 1 84
% within Group .0% 50.0% 39.3% 9.5% 1.2% 100.0%
% within Age .0% 76.4% 55.9% 21.6% 3.7% 46.9%
% of Total .0% 23.5% 18.4% 4.5% .6% 46.9%
Total Count 1 55 59 37 27 179
% within Group .6% 30.7% 33.0% 20.7% 15.1% 100.0%
% within Age 100.0% 100.0% 100.0% 100.0% 100.0% 100.0%
% of Total .6% 30.7% 33.0% 20.7% 15.1% 100.0%
Table 4.5 delineates the ethnicity between the two groups and it showed it did not
differ much. The majority (83.6%) of all respondents were white. A Chi-square test was
performed to determine if ethnicity was distributed differently across the MBA and
iMBA groups. The test failed to indicate a significant difference, X2 (5, N=177) = 3.413,
p >.05.
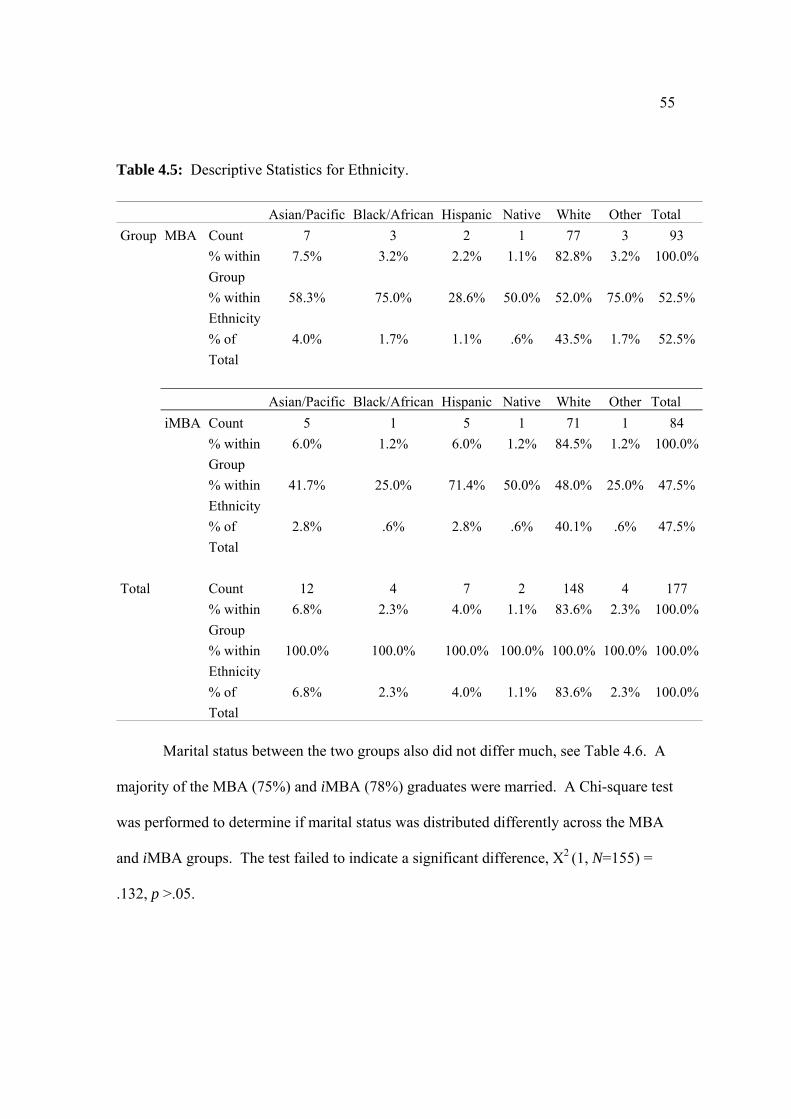
55
Table 4.5: Descriptive Statistics for Ethnicity.
Asian/Pacific Black/African Hispanic Native White Other Total
Group MBA Count 7 3 2 1 77 3 93
% within
Group
7.5% 3.2% 2.2% 1.1% 82.8% 3.2% 100.0%
% within
Ethnicity
58.3% 75.0% 28.6% 50.0% 52.0% 75.0% 52.5%
% of
Total
4.0% 1.7% 1.1% .6% 43.5% 1.7% 52.5%
Asian/Pacific Black/African Hispanic Native White Other Total
iMBA Count 5 1 5 1 71 1 84
% within
Group
6.0% 1.2% 6.0% 1.2% 84.5% 1.2% 100.0%
% within
Ethnicity
41.7% 25.0% 71.4% 50.0% 48.0% 25.0% 47.5%
% of
Total
2.8% .6% 2.8% .6% 40.1% .6% 47.5%
Total Count 12 4 7 2 148 4 177
% within
Group
6.8% 2.3% 4.0% 1.1% 83.6% 2.3% 100.0%
% within
Ethnicity
100.0% 100.0% 100.0% 100.0% 100.0% 100.0% 100.0%
% of
Total
6.8% 2.3% 4.0% 1.1% 83.6% 2.3% 100.0%
Marital status between the two groups also did not differ much, see Table 4.6. A
majority of the MBA (75%) and iMBA (78%) graduates were married. A Chi-square test
was performed to determine if marital status was distributed differently across the MBA
and iMBA groups. The test failed to indicate a significant difference, X2 (1, N=155) =
.132, p >.05.
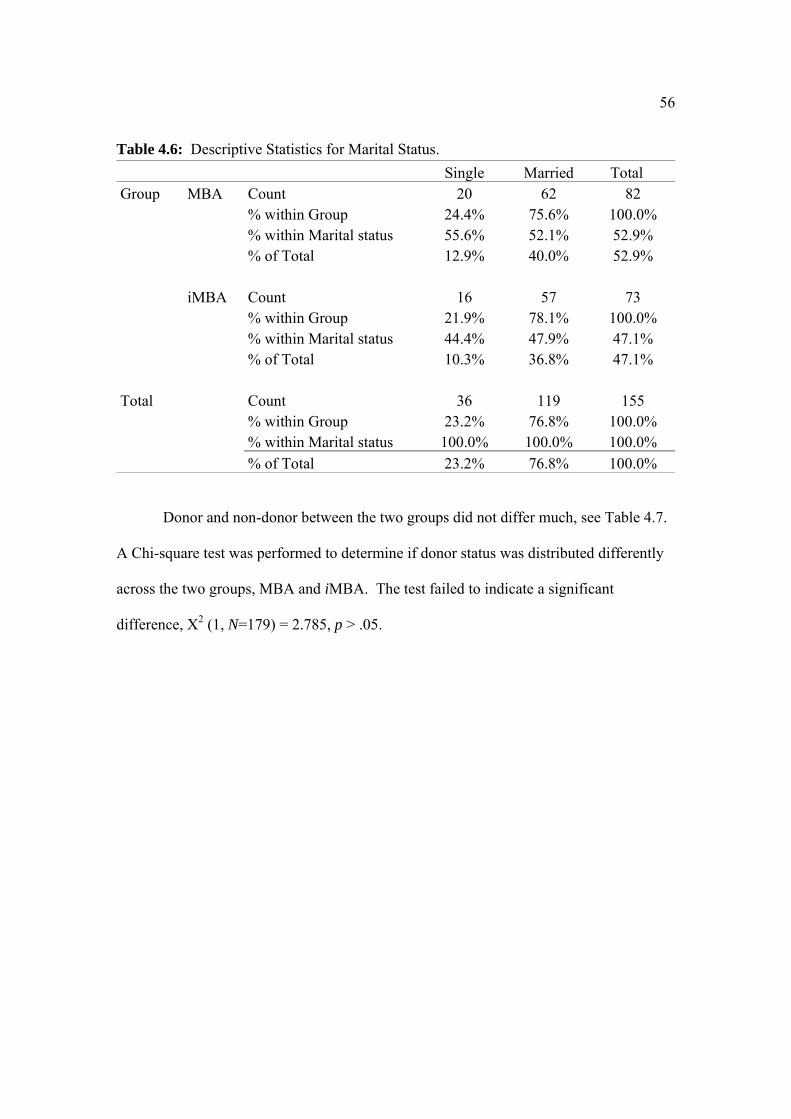
56
Table 4.6: Descriptive Statistics for Marital Status.
Single Married Total Group MBA Count 20 62 82
% within Group 24.4% 75.6% 100.0% % within Marital status 55.6% 52.1% 52.9% % of Total 12.9% 40.0% 52.9%
iMBA Count 16 57 73
% within Group 21.9% 78.1% 100.0% % within Marital status 44.4% 47.9% 47.1% % of Total 10.3% 36.8% 47.1%
Total Count 36 119 155
% within Group 23.2% 76.8% 100.0% % within Marital status 100.0% 100.0% 100.0% % of Total 23.2% 76.8% 100.0%
Donor and non-donor between the two groups did not differ much, see Table 4.7.
A Chi-square test was performed to determine if donor status was distributed differently
across the two groups, MBA and iMBA. The test failed to indicate a significant
difference, X2 (1, N=179) = 2.785, p > .05.

57
Table 4.7: Descriptive Statistics for Philanthropy.
Donor Non Donor Total Group MBA Count 45 48 93
% within Group 48.4% 51.6% 100.0%% within Philanthropy 59.2% 46.6% 52.0% % of Total 25.1% 26.8% 52.0%
iMBA Count 31 55 86
% within Group 36.0% 64.0% 100.0% % within Philanthropy 40.8% 53.4% 48.0% % of Total 17.3% 30.7% 48.0%
Total Count 76 103 179
% within Group 42.5% 57.5% 100.0% % within Philanthropy 100.0% 100.0% 100.0% % of Total 42.5% 57.5% 100.0%
Distribution of Data
Assumptions of normality tests for each variable were found to be acceptable
despite a slight distribution to the right. The slight distribution is attributed to all survey
question answers having the same scale running in the same direction, i.e., there were no
reverse questions where a higher score actually meant a negative indication. The scores
for Kurtosis, a measure of the "peakedness" or "flatness" of a distribution, were found to
be less than ± 2 and for skewness, the extent to which a distribution of values deviates
from symmetry around the mean scores, were found to be less than ± 2. Although these
scores are not ideal they are acceptable (Field, 2009). Negatives values of skewness
indicate scores are more on the right of the distribution and positive values of kurtosis
indicate a pointy and heavy-tailed distribution (Field, 2009). Kolmogorov-Smirnov and

58
the Shapiro-Wilk tests were conducted to check for normality of the data and the test
results suggested violation of the assumption of normality.
Transforming data comes with additional challenges in analyzing data. “By
transforming the data you change the hypothesis being tested (when using a log
transformation and comparing means you change from comparing arithmetic means to
comparing geometric means). Transformation also means that you’re now addressing a
different construct to the one originally measured” (Field, 2009, p. 156). The log
transformation method for the data to test the assumption of normality was conducted.
After performing the log transformation method the test results indicated that the data
still violated the assumption of normality.
To examine the data visually Q-Q plots was run. This test and Boxplots affirmed
the scores fell to the right in the distribution. This case is not special. Often scales and
measures used in the social sciences have scores that are skewed. This does not
necessarily indicate a problem with the scale, but rather reflects the underlying nature of
the construct being measured (Tabachnick & Fidell, 2001). For example, student
teaching evaluation scores are often skewed, with most students being reasonably
satisfied with instructors’ performance. Even though the data had distribution to the right
that does indicate higher scores, i.e., positive responses to alumni and student
experiences, indicating positive feelings by respondents to his or her Pennsylvania State
University educational experience.
Individual T-test
An individual T-test for each item was run to find the mean and standard
deviation for each of the items measuring for alumni experience—alumni association,

59
alumni experience—engagement, student experience—impact on career, student
experience—relationships, and student experience—academic for the MBA and the
iMBA graduate. Overall the two groups did not show great disparity, but many of the
questions provided results indicating a higher level of satisfaction of one group over the
other. Higher mean scores were demonstrated by the iMBA group in all but six of the
questions (3, 4, 6, 10, 26, and 28) out of 38 questions. The descriptive statistics of each
item are delineated in Table 4.8.
Table 4.8: Descriptive Statistics of each item for MBA and iMBA Group N Mean Std. Deviation Std. Error MeanAlumni Assoc. Exp Q1 MBA 76 3.2368 .99154 .11374
iMBA 78 3.2821 1.03067 .11670Alumni Assoc. Exp Q2 MBA 65 3.2462 .90192 .11187
iMBA 70 3.3143 .86045 .10284Alumni Assoc. Exp Q3 MBA 63 3.2698 .90173 .11361
iMBA 68 3.2353 1.12127 .13597Alumni Assoc. Exp Q4 MBA 74 2.3784 1.17861 .13701
iMBA 69 2.3333 1.13328 .13643Alumni Assoc. Exp Q5 MBA 81 3.7901 1.08069 .12008
iMBA 74 4.1216 .96447 .11212Alumni Assoc. Exp Q6 MBA 76 3.4868 1.12538 .12909
iMBA 74 3.3243 1.00830 .11721Alumni Assoc. Exp Q7 MBA 69 3.4783 1.18332 .14246
iMBA 77 3.5455 .96716 .11022Alumni Assoc. Exp Q8 MBA 78 3.5000 1.31673 .14909
iMBA 74 4.1216 .96447 .11212Alumni Assoc. Exp Q9 MBA 83 1.9277 1.35055 .14824
iMBA 82 2.0244 1.36965 .15125Alumni Assoc. Exp Q10 MBA 83 2.3614 1.26470 .13882
iMBA 75 2.2533 1.25303 .14469Alumni Engage Exp Q11 MBA 87 3.1724 1.14330 .12257
iMBA 83 3.3012 1.26621 .13898Alumni Engage Exp Q12 MBA 87 3.4483 1.05388 .11299
iMBA 84 3.5595 1.23553 .13481

60
Group N Mean Std. Deviation Std. Error MeanAlumni Engage Exp Q13 MBA 88 3.3750 1.10706 .11801
iMBA 84 3.7619 1.18849 .12967Alumni Engage Exp Q14 MBA 87 3.8276 1.03662 .11114
iMBA 84 4.2500 .92976 .10145Alumni Engage Exp Q15 MBA 87 3.9310 .98587 .10570
iMBA 84 4.2738 .98606 .10759Alumni Engage Exp Q16 MBA 88 3.9091 1.02426 .10919
iMBA 85 3.9176 1.00252 .10874Alumni Engage Exp Q17 MBA 87 3.4598 1.18914 .12749
iMBA 85 3.6706 1.14838 .12456Academic Exp Q18 MBA 91 4.3407 .88468 .09274
iMBA 86 4.5814 .62243 .06712Academic Exp Q19 MBA 92 4.1304 .89218 .09302
iMBA 86 4.4419 .72930 .07864Academic Exp Q20 MBA 93 4.2258 .91044 .09441
iMBA 86 4.4884 .77830 .08393Academic Exp Q21 MBA 93 4.4839 .78868 .08178
iMBA 85 4.6588 .60853 .06600Academic Exp Q22 MBA 93 4.5699 .63242 .06558
iMBA 66 4.6364 .69363 .08538Academic Exp Q23 MBA 93 4.5806 .71205 .07384
iMBA 82 4.7439 .56242 .06211Academic Exp Q24 MBA 92 4.2935 .97820 .10198
iMBA 85 4.7412 .51531 .05589Academic Exp Q25 MBA 81 4.2346 .89821 .09980
iMBA 79 4.6582 .63823 .07181Impact on Career Q26 MBA 92 3.8696 1.14082 .11894
iMBA 85 3.8235 1.13574 .12319Impact on Career Q27 MBA 92 4.0543 1.04160 .10859
iMBA 86 4.1512 .98837 .10658Impact on Career Q28 MBA 92 4.3804 .83656 .08722
iMBA 86 4.2907 .87939 .09483Impact on Career Q29 MBA 94 3.2447 1.24163 .12806
iMBA 86 3.4070 1.13114 .12197Impact on Career Q30 MBA 95 4.1263 .93675 .09611
iMBA 86 4.2326 1.02526 .11056Impact on Career Q31 MBA 95 4.0842 1.03824 .10652
iMBA 86 4.1977 1.04959 .11318

61
Group N Mean Std. Deviation Std. Error MeanImpact on Relations Q32 MBA 95 3.0316 1.42510 .14621
iMBA 86 3.9186 1.15009 .12402Impact on Relations Q33 MBA 73 3.2329 1.37962 .16147
iMBA 42 3.2619 1.28897 .19889Impact on Relations Q34 MBA 81 3.5556 1.22474 .13608
iMBA 56 4.0179 .99984 .13361Impact on Relations Q35 MBA 94 4.1277 1.06996 .11036
iMBA 85 4.6118 .63797 .06920Impact on Relations Q36 MBA 94 4.1383 1.01177 .10436
iMBA 86 4.3953 .78634 .08479Impact on Relations Q37 MBA 91 3.3626 1.06996 .11216
iMBA 84 3.8095 1.04681 .11422Impact on Relations Q38 MBA 85 3.3294 1.13796 .12343
iMBA 77 4.1818 1.08491 .12364
Independent Sample T-test Results for Each Item
The T-test for equality of means was run to determine if there was a significant
difference in the means between the two groups for each question. The iMBA graduates
indicated higher levels of pride as a member of the alumni association, survey question
eight, (M= 4.12, SD = .96) compared to MBA graduate (M = 3.5, SD = 1.31) and this
difference was found to be significant t(141) = -3.332, p =.001. Membership into the
alumni association requires payment annually and graduates may or may not renew his or
her membership if he or she does not feel membership is providing an adequate return on
investment. The iMBA graduates are younger and may have a higher initial sense of
pride belonging to the alumni association that could wane over time if a graduate does
not feel the benefit of the membership.
Interesting results on the individual T-test were found in the student experience—
academic. Of the eight questions asked five were found to have a significant difference.
In each case the iMBA graduate indicated higher levels of preparedness and positive
62
experience than the traditional MBA graduate. The iMBA graduates indicated on
question 18, coursework preparedness, higher levels (M= 4.58, SD = .62) compared to
MBA graduates (M = 4.34, SD = .88) and this difference was found to be significant
t(161) = -2.103, p =.008. iMBA graduates indicated higher levels of positive experiences
with regards to interaction with faculty and fellow students despite the fact that MBA
students would have more opportunity for personal interaction. The iMBA graduates
indicated on question 21, interaction with MBA faculty, a higher positive experience
(M=4.65, SD=.60) compared to MBA graduates (M = 4.48, SD = .78). This difference
was found to be significant t(171) = -1.665, p = .013.
The experience of interaction with fellow students, during class (question 23) and
outside of class (question 24), was also found to be higher among iMBA graduates than
MBA graduates. For question 23 the mean and standard deviation for each group was
iMBA graduates (M = 4.74, SD = .56) and MBA graduates (M = 4.58, SD = .71). This
difference was significant t(171) = -1.692, p = .005. For question 24 the mean score was
also higher among iMBA graduates. The means and standard deviation for iMBA (M =
4.74, SD = .51) and for MBA (M = 4.29, SD = .97). This difference was significant
t(140) = -3.850, p = .000. Finally, in the academic experience the iMBA graduates (M =
4.65, SD = .63) found interaction with faculty outside of the classroom, question 25, a
more positive experience than the MBA graduates (M = 4.23, SD = .89). Again, this
difference was significant t(144) = -3.446, p = .001.
It would be natural to assume that face-to-face interaction during class and during
classroom breaks would provide higher levels of interaction experiences. However,
perhaps the online experience is more focused, i.e., to reply to questions or inquiries
63
online requires a higher level of attentiveness to the questions than during the course of a
conversation, i.e., listening to someone versus hearing someone. Perhaps individuals
conducting his or her studies online is more cautious in replying or participating because
online responses are recorded permanently in cyberspace, i.e., people give more
thoughtful answers. Thoughtful answers could lead higher interaction experience
because the individual feels the person providing the answer really cares to help.
Finally, an examination of student experience—impact on relationships questions
32, 34, and 35 all were found to have a difference that was significant. For each question
iMBA graduates indicated a higher level of positive experience than MBA graduates.
Question 32, providing new lifelong relationships, iMBA (M = 3.91, SD = 1.15) and
MBA (M = 3.03, SD = 1.42), significant t(176) = -4.627, p = .008; question 34, attending
outside university events, iMBA (M = 4.01, SD = .99), significant t(131) = -3.424, p =
.022 and MBA (M = 3.55, SD = 1.22); and question 35, impact relationship on own
student experience, iMBA (M = 4.61, SD = .63) and MBA (M = 4.12, SD = 1.06),
significant t(154) = -3.717, p = .000. It appears that online networking may encourage
long-term relationships because the structure for maintaining the relationship was
reinforced during the course, i.e., communicating via electronic means and not socially in
person. For question 34, attending events other than athletic events a positive experience
in building relationships, only 56 replied (a lower number of N/A would be expected
because online students are not located in proximity to campus to attend events);
however, of those that did attend replied they had a higher experience in building
relationships. Additionally, the experience of meeting individuals for the iMBA
graduate at events could be reinforcing the relationship that was already established

64
through the online experience; therefore, the event provided the positive experience of
meeting someone the graduate “already knows” but not yet in person. The result of the
Independent Sample T-test for the select items discussed is shown in Table 4.9.
Table 4.9: Independent Sample T-test Results for Select Items.
Levene's Test for Equality of Variances
t-test for Equality of Means
F Sig. t df
Sig.
(2-
tailed)
Mean
Difference
Std. Error
Difference
95% Confidence
Interval of the
Difference
Lower Upper
Alumni Assoc.
Exp8Q8
Equal variances
assumed
10.648 .001 -3.306 150 .001 -.62162 .18804 -.99317 -.25007
Equal variances not
assumed
-3.332 141.113 .001 -.62162 .18654 -.99040 -.25284
Academic
Exp1Q18
Equal variances
assumed
7.187 .008 -2.083 175 .039 -.24074 .11558 -.46885 -.01262
Equal variances not
assumed
-2.103 161.932 .037 -.24074 .11448 -.46680 -.01467
Academic
Exp4Q21
Equal variances
assumed
6.311 .013 -1.646 176 .102 -.17495 .10631 -.38475 .03485
Equal variances not
assumed
-1.665 171.289 .098 -.17495 .10509 -.38240 .03250
Academic
Exp6Q23
Equal variances
assumed
7.954 .005 -1.667 173 .097 -.16326 .09791 -.35651 .02999
Equal variances not
assumed
-1.692 171.010 .092 -.16326 .09648 -.35371 .02720
Academic
Exp7Q24
Equal variances
assumed
32.923 .000 -3.764 175 .000 -.44770 .11894 -.68244 -.21295
Equal variances not
assumed
-3.850 140.176 .000 -.44770 .11630 -.67762 -.21778
Academic
Exp8Q25
Equal variances
assumed
10.788 .001 -3.432 158 .001 -.42366 .12346 -.66750 -.17982
Equal variances not
assumed
-3.446 144.538 .001 -.42366 .12295 -.66667 -.18065

65
Levene's Test for Equality of Variances
t-test for Equality of Means
F Sig. t df
Sig.
(2-
tailed)
Mean
Difference
Std. Error
Difference
95% Confidence
Interval of the
Difference
Lower Upper
Impact on
Relationships1Q32
Equal variances
assumed
7.213 .008 -4.578 179 .000 -.88703 .19376 -1.26937 -.50468
Equal variances not
assumed
-4.627 176.742 .000 -.88703 .19172 -1.26539 -.50866
Impact on
Relationships3Q34
Equal variances
assumed
5.370 .022 -2.337 135 .021 -.46230 .19786 -.85360 -.07100
Equal variances not
assumed
-2.424 131.218 .017 -.46230 .19071 -.83956 -.08504
Impact on
Relationships4Q35
Equal variances
assumed
14.386 .000 -3.628 177 .000 -.48411 .13343 -.74742 -.22079
Equal variances not
assumed
-3.717 154.127 .000 -.48411 .13026 -.74143 -.22678
Descriptive Statistics for the Constructs
For further analysis, the mean score of all items underlying a construct was
calculated to represent each construct measure. An examination of the mean scores
demonstrated that a higher percentage of scores did fall on the right side of the
distribution for: Alumni engagement—engagement (M = 3.69, SD = .8600), alumni
experience—alumni association (M = 3.24, SD = .7870), student experience—impact on
career (M = 3.98, SD = .8034), student experience—impact on relationships (M = 3.71,
SD = .8842), and student experience—academic (M = 4.47, SD = .5541). This indicated
that graduates had positive alumni and student experiences as greater than 3 on the
Likert-scale indicated an affirmed reply to the question asked. The descriptive statistics
for each construct: Alumni experience—alumni association and engagement and student
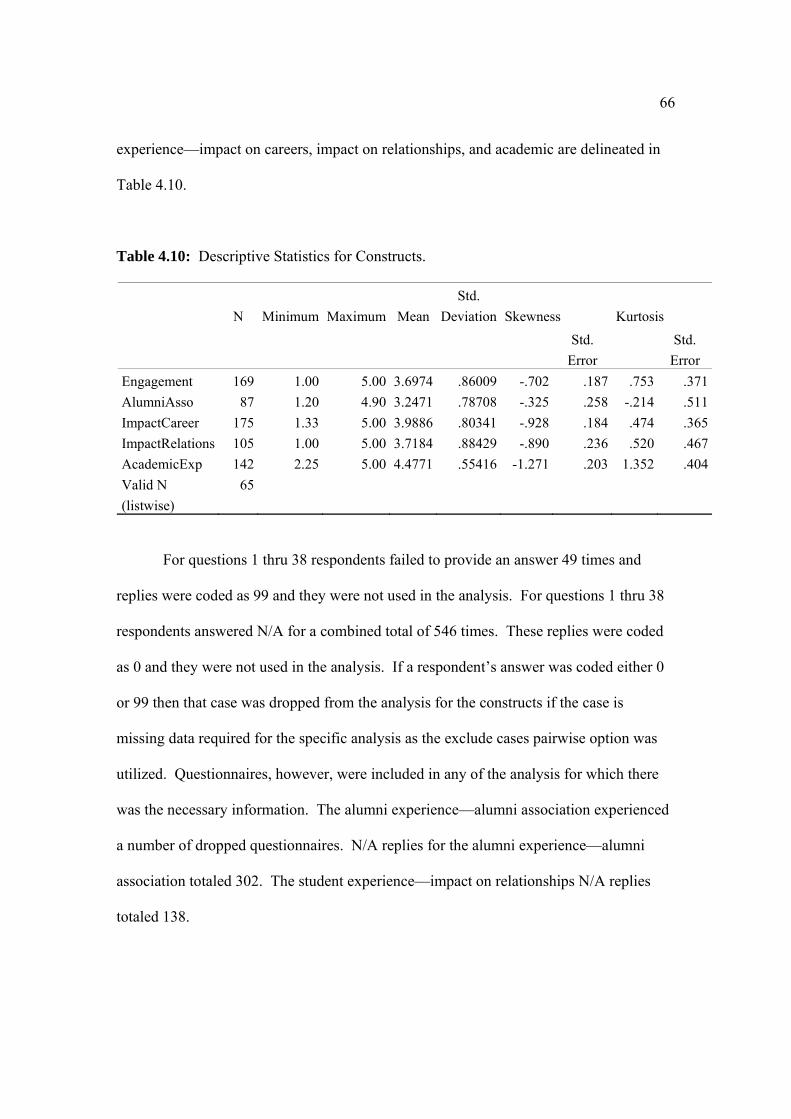
66
experience—impact on careers, impact on relationships, and academic are delineated in
Table 4.10.
Table 4.10: Descriptive Statistics for Constructs.
N Minimum Maximum Mean
Std.
Deviation Skewness Kurtosis
Std.
Error
Std.
Error
Engagement 169 1.00 5.00 3.6974 .86009 -.702 .187 .753 .371
AlumniAsso 87 1.20 4.90 3.2471 .78708 -.325 .258 -.214 .511
ImpactCareer 175 1.33 5.00 3.9886 .80341 -.928 .184 .474 .365
ImpactRelations 105 1.00 5.00 3.7184 .88429 -.890 .236 .520 .467
AcademicExp 142 2.25 5.00 4.4771 .55416 -1.271 .203 1.352 .404
Valid N
(listwise)
65
For questions 1 thru 38 respondents failed to provide an answer 49 times and
replies were coded as 99 and they were not used in the analysis. For questions 1 thru 38
respondents answered N/A for a combined total of 546 times. These replies were coded
as 0 and they were not used in the analysis. If a respondent’s answer was coded either 0
or 99 then that case was dropped from the analysis for the constructs if the case is
missing data required for the specific analysis as the exclude cases pairwise option was
utilized. Questionnaires, however, were included in any of the analysis for which there
was the necessary information. The alumni experience—alumni association experienced
a number of dropped questionnaires. N/A replies for the alumni experience—alumni
association totaled 302. The student experience—impact on relationships N/A replies
totaled 138.
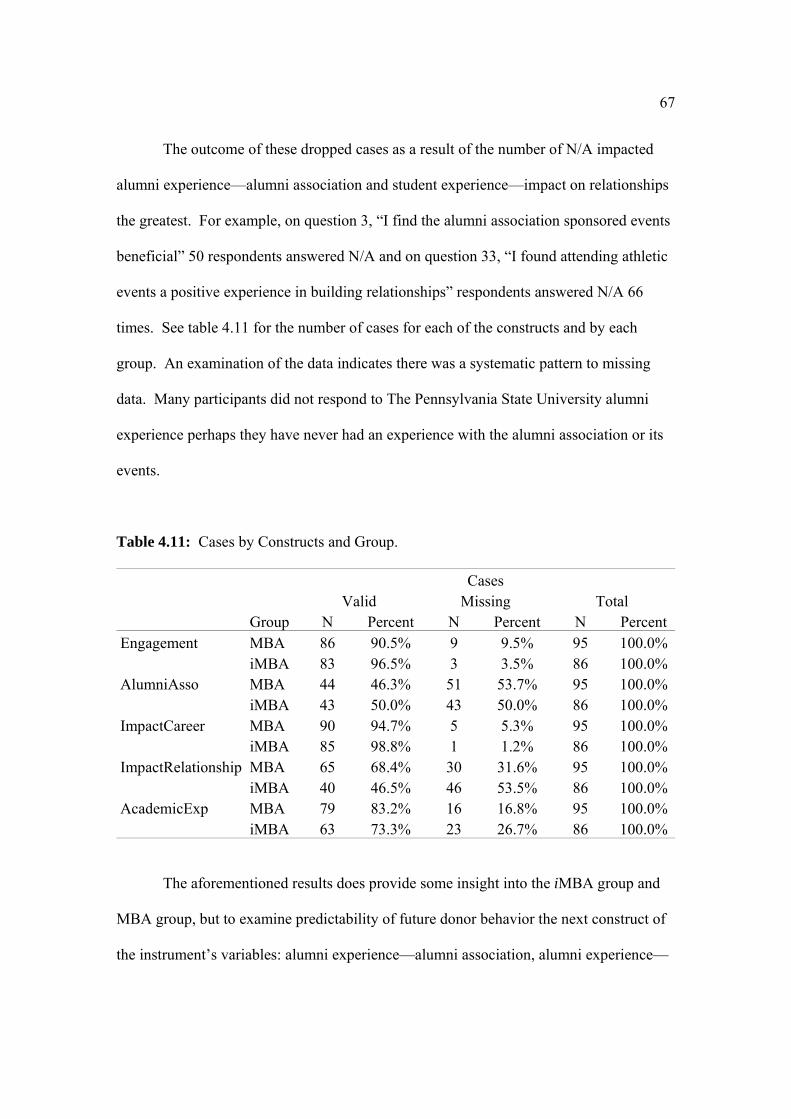
67
The outcome of these dropped cases as a result of the number of N/A impacted
alumni experience—alumni association and student experience—impact on relationships
the greatest. For example, on question 3, “I find the alumni association sponsored events
beneficial” 50 respondents answered N/A and on question 33, “I found attending athletic
events a positive experience in building relationships” respondents answered N/A 66
times. See table 4.11 for the number of cases for each of the constructs and by each
group. An examination of the data indicates there was a systematic pattern to missing
data. Many participants did not respond to The Pennsylvania State University alumni
experience perhaps they have never had an experience with the alumni association or its
events.
Table 4.11: Cases by Constructs and Group.
Group
Cases Valid Missing Total N Percent N Percent N Percent Engagement MBA 86 90.5% 9 9.5% 95 100.0%
iMBA 83 96.5% 3 3.5% 86 100.0%AlumniAsso MBA 44 46.3% 51 53.7% 95 100.0%
iMBA 43 50.0% 43 50.0% 86 100.0%ImpactCareer MBA 90 94.7% 5 5.3% 95 100.0%
iMBA 85 98.8% 1 1.2% 86 100.0%ImpactRelationship MBA 65 68.4% 30 31.6% 95 100.0%
iMBA 40 46.5% 46 53.5% 86 100.0%AcademicExp MBA 79 83.2% 16 16.8% 95 100.0%
iMBA 63 73.3% 23 26.7% 86 100.0%
The aforementioned results does provide some insight into the iMBA group and
MBA group, but to examine predictability of future donor behavior the next construct of
the instrument’s variables: alumni experience—alumni association, alumni experience—

68
engagement, student experience—impact on career, student experience—relationships,
and student experience—academic was tested.
Hypotheses Testing
One-way ANOVA and logistic regression was conducted with alumni and student
experiences as independent variables and alumni donor behavior as a dependent variable.
One-way ANOVA is used to determine whether there are any significant differences
between the means of the MBA and iMBA groups. Logistic regression is used to predict
whether the alumnus will donate or not using alumni and student experiences as the
predicator. The study used the level of statistical significant at the standard p < .05 and p
< .01 levels (Field, 2009). The Cronbach’s alpha was calculated as a traditional method
of scale reliability (Bryman, 2008). Income, gender, age, ethnicity, and marital status
were controlled to help in determining the true influence of the independent variable on
the dependent variable (Creswell, 2009).
Because the data challenged the assumption of normality it was elected also to run
the Mann-Whitney test. The Mann-Whitney test is a non-parametric test that carries out
the data based on the ranks rather than the actual data (Field, 2009). The results of the
analysis for each of the seven hypotheses follows.
H1: The MBA graduate will demonstrate higher levels of student experience—
impact on relationships.
The first hypothesis, the MBA graduate will demonstrate higher levels of student
experience—impact on relationships, is based on the added in person interaction that a
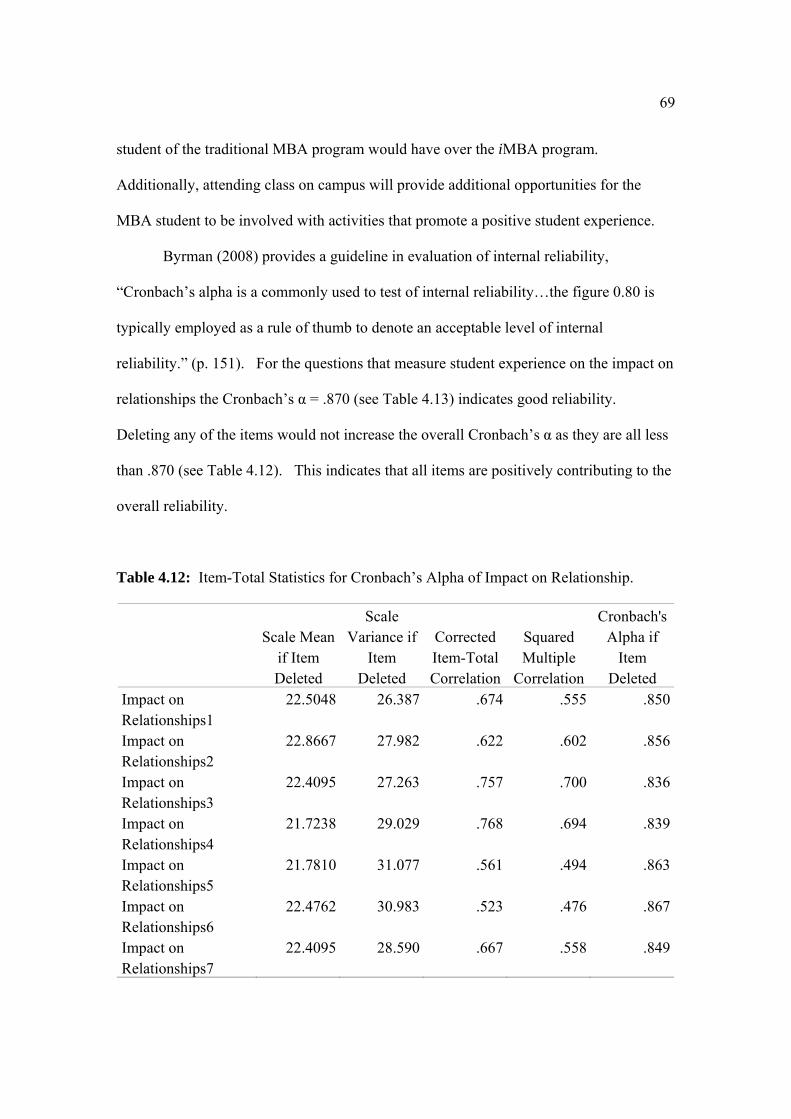
69
student of the traditional MBA program would have over the iMBA program.
Additionally, attending class on campus will provide additional opportunities for the
MBA student to be involved with activities that promote a positive student experience.
Byrman (2008) provides a guideline in evaluation of internal reliability,
“Cronbach’s alpha is a commonly used to test of internal reliability…the figure 0.80 is
typically employed as a rule of thumb to denote an acceptable level of internal
reliability.” (p. 151). For the questions that measure student experience on the impact on
relationships the Cronbach’s α = .870 (see Table 4.13) indicates good reliability.
Deleting any of the items would not increase the overall Cronbach’s α as they are all less
than .870 (see Table 4.12). This indicates that all items are positively contributing to the
overall reliability.
Table 4.12: Item-Total Statistics for Cronbach’s Alpha of Impact on Relationship.
Scale Mean
if Item Deleted
Scale Variance if
Item Deleted
Corrected Item-Total Correlation
Squared Multiple
Correlation
Cronbach's Alpha if
Item Deleted
Impact on Relationships1
22.5048 26.387 .674 .555 .850
Impact on Relationships2
22.8667 27.982 .622 .602 .856
Impact on Relationships3
22.4095 27.263 .757 .700 .836
Impact on Relationships4
21.7238 29.029 .768 .694 .839
Impact on Relationships5
21.7810 31.077 .561 .494 .863
Impact on Relationships6
22.4762 30.983 .523 .476 .867
Impact on Relationships7
22.4095 28.590 .667 .558 .849
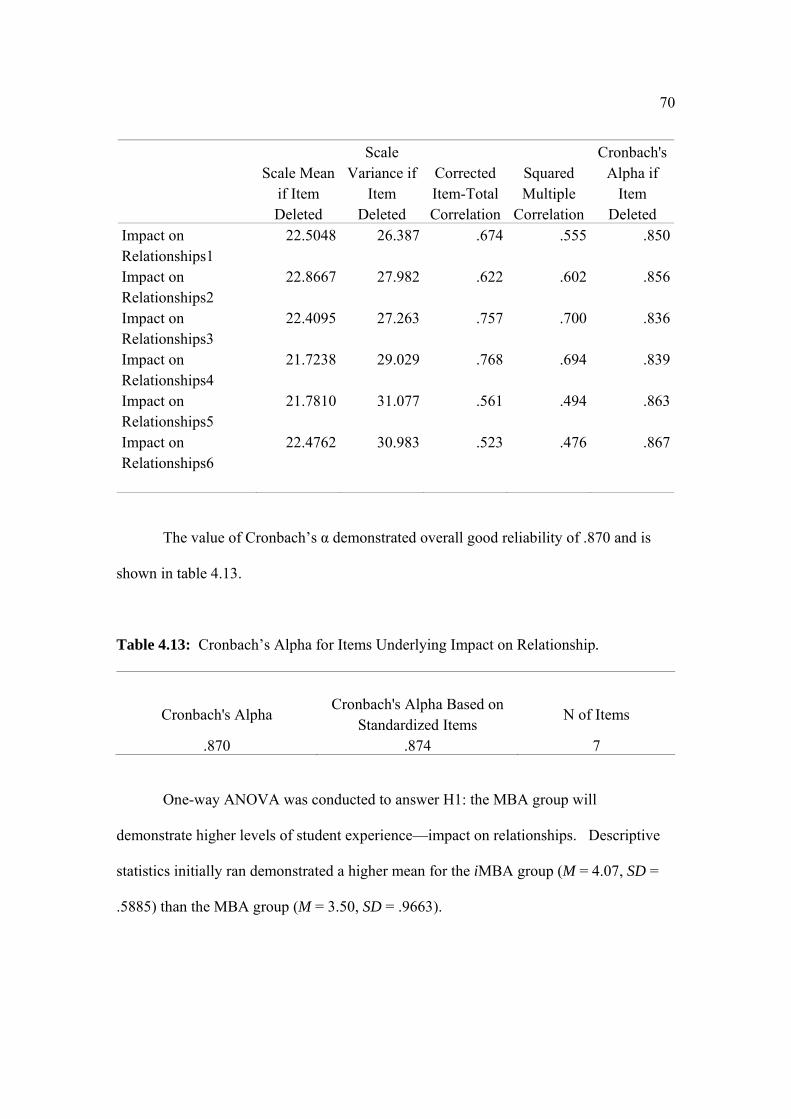
70
Scale Mean
if Item Deleted
Scale Variance if
Item Deleted
Corrected Item-Total Correlation
Squared Multiple
Correlation
Cronbach's Alpha if
Item Deleted
Impact on Relationships1
22.5048 26.387 .674 .555 .850
Impact on Relationships2
22.8667 27.982 .622 .602 .856
Impact on Relationships3
22.4095 27.263 .757 .700 .836
Impact on Relationships4
21.7238 29.029 .768 .694 .839
Impact on Relationships5
21.7810 31.077 .561 .494 .863
Impact on Relationships6
22.4762 30.983 .523 .476 .867
The value of Cronbach’s α demonstrated overall good reliability of .870 and is
shown in table 4.13.
Table 4.13: Cronbach’s Alpha for Items Underlying Impact on Relationship.
Cronbach's Alpha Cronbach's Alpha Based on
Standardized Items N of Items
.870 .874 7
One-way ANOVA was conducted to answer H1: the MBA group will
demonstrate higher levels of student experience—impact on relationships. Descriptive
statistics initially ran demonstrated a higher mean for the iMBA group (M = 4.07, SD =
.5885) than the MBA group (M = 3.50, SD = .9663).

71
Table 4.14: Descriptive Statistics on Student Experience—Impact on Relationships.
N Mean Std.
DeviationStd.
Error
95% Confidence Interval for Mean
Minimum MaximumLower Bound
Upper Bound
MBA 65 3.5011 .96631 .11986 3.2617 3.7405 1.00 5.00iMBA 40 4.0714 .58857 .09306 3.8832 4.2597 2.29 5.00Total 105 3.7184 .88429 .08630 3.5472 3.8895 1.00 5.00
The results of One-way ANOVA test indicated that there was a significant mean
difference between the MBA and the iMBA graduate, F(1, 103) = 11.323, p < .05. The
effect size, r = .31, indicates a medium effect. Although there is a significant difference
between the MBA and iMBA, the iMBA group demonstrated higher levels of student
experience—impact on relationships than the MBA group: MBA (M = 3.50, SD = .9663)
and iMBA (M = 4.07, SD = .5885). The findings did not support H1, the MBA graduate
will demonstrate higher levels of student experience—impact on relationships.
Table 4.15: One-way ANOVA for Student Experience—Impact on Relationships.
Sum of Squares df Mean Square F Sig. Between Groups 8.054 1 8.054 11.323 .001 Within Groups 73.270 103 .711
Total 81.325 104
As a result of the distribution of the data that addressed above in this chapter, a
non-parametric test, Mann-Whitney, was run to analyze the data. The non-parametric
tests make fewer assumptions than parametric tests and analysis is based on the ranks of
the data rather than the actual data (Field, 2009). The non-parametric test confirmed the
One-way ANOVA result. The student experience—impact on relationships for MBA (M

72
= 3.50) did differ significantly from iMBA (M = 4.07), U = 834.50, z = -3.080, p < .005, r
= .30. The effect size, r = .30 indicates a medium effect. Additionally, a Chi-square test
was performed and the findings, X2(5, N=181) = 16.90, p < .05 did support the findings
of the One-way ANOVA.
H2: The MBA graduate will demonstrate higher levels of student experience—
academic.
The same procedure to analyze H2, that the MBA graduate will demonstrate
higher levels of student experience—academic, was followed.
The overall α for testing H2 was .864 (see Table 4.17). Table 4.16, Cronbach’s
Alpha Item-Total Statistics, shows that only AcademicExp3 (questionnaire question 20)
would provide a .002 increase if deleted. All questions were kept and an α of .864
demonstrated good reliability.

73
Table 4.16: Cronbach’s Alpha Item-Total Statistics of Academic Experience.
Scale Mean
if Item Deleted
Scale Variance if
Item Deleted
Corrected Item-Total Correlation
Squared Multiple
Correlation
Cronbach's Alpha if Item
Deleted Academic Exp1
31.3592 14.969 .649 .566 .843
Academic Exp2
31.5282 14.776 .675 .591 .840
Academic Exp3
31.4648 15.910 .457 .257 .866
Academic Exp4
31.2465 15.265 .678 .517 .840
Academic Exp5
31.2254 15.637 .667 .529 .842
Academic Exp6
31.1479 16.311 .557 .470 .853
Academic Exp7
31.3451 14.908 .623 .474 .846
Academic Exp8
31.4014 14.951 .628 .431 .845
The value of Cronbach’s α demonstrated overall good reliability of .864 and is shown in
Table 4.17.
Table 4.17: Cronbach’s Alpha for Items Underlying Academic Experience.
Cronbach's Alpha Cronbach's Alpha Based on
Standardized Items N of Items .864 .866 8
Descriptive statistics for student experience—academic showed iMBA (M = 4.61,
SD = .4192) with a higher mean score than MBA (M = 4.36, SD = .6233) and is shown in
Table 4.18.

74
Table 4.18: Descriptive Statistics on Student Experience—Academic.
N Mean Std.
DeviationStd.
Error
95% Confidence Interval for Mean
Minimum MaximumLower Bound
Upper Bound
MBA 79 4.3687 .62336 .07013 4.2290 4.5083 2.25 5.00iMBA 63 4.6131 .41924 .05282 4.5075 4.7187 3.63 5.00Total 142 4.4771 .55416 .04650 4.3852 4.5690 2.25 5.00
The One-way ANOVA test found there was a significant difference between the
MBA and the iMBA groups, F (1, 140) = 7.114, p < .05. The effect size, r = .21,
indicated a small effect. Although there is a significant difference between the MBA and
the iMBA, the iMBA group (M = 4.61, SD = .4192) demonstrated higher levels of
student experience—academic than the MBA group (M = 4.36, SD = .6233). The
findings do not support H2 that the MBA group demonstrates higher level of student
experience—academic.
Table 4.19. ANOVA for Student Experience—Academic.
Sum of Squares df Mean Square F Sig.
Between Groups 2.094 1 2.094 7.114 .009 Within Groups 41.207 140 .294
Total 43.301 141
The Mann-Whitney test for H2 found MBA (M = 4.36) did differ significantly
from iMBA (M = 4.61), U = 1942.00, z = -2.265, p < .005, r = .19. The effect size of r =
.19 indicated a small effect. The non-parametric test confirmed the findings of the One-

75
way ANOVA. Additionally, a Chi-square test was performed and the findings, X2(4,
N=181) = 11.857, p < .05 did support the findings of the One-way ANOVA.
H3: There is a difference between the iMBA group and the MBA group student
experience—impact on career.
H3 analyses test whether there is a difference in student experience—impact on
career between the iMBA and MBA group.
The overall Cronbach’s alpha for impact on career was .867 (Table 4.21). Table
2.20 shows that none of the questions if deleted would increase the overall α of .867
because all scores were less than .867.
Table 4.20: Item-Total Statistics for Cronbach’s Alpha of Impact on Career.
Scale Mean
if Item Deleted
Scale Variance if
Item Deleted
Corrected Item-Total Correlation
Squared Multiple
Correlation
Cronbach's Alpha if
Item DeletedImpact on Career1
20.0971 15.732 .690 .518 .839
Impact on Career2
19.8457 16.488 .693 .605 .839
Impact on Career3
19.5886 17.450 .721 .634 .838
Impact on Career4
20.6000 15.954 .616 .416 .855
Impact on Career5
19.7543 17.416 .588 .372 .857
Impact on Career6
19.7714 16.361 .711 .570 .836
The value of α = .867 demonstrated overall good reliability, see Table 4.23.

76
Table 4.21: Cronbach’s Alpha for Items Underlying Impact on Career.
Cronbach's Alpha Cronbach's Alpha Based on
Standardized Items N of Items .867 .871 6
Descriptive statistics showed the mean for iMBA (M = 4.01, SD = .8037) was
greater than MBA (M = 3.96, SD = .0869) and are shown in Table 4.22.
Table 4.22: Descriptive Statistics for Student Experience—Impact on Career.
N Mean Std.
DeviationStd.
Error
95% Confidence Interval for Mean
Minimum MaximumLower Bound
Upper Bound
MBA 90 3.9667 .80696 .08506 3.7977 4.1357 1.50 5.00iMBA 85 4.0118 .80376 .08718 3.8384 4.1851 1.33 5.00Total 175 3.9886 .80341 .06073 3.8687 4.1084 1.33 5.00
The One-way ANOVA found that there was not a significant difference in student
experience—impact on career between the iMBA and MBA groups, F (1,173) = .137, p >
.05. The effect was negligible at r = .08. Because there was not a significant difference
between the iMBA group and the MBA group student experience—impact on career H3
is not supported.
Table 4.23: ANOVA for Student Experience—Impact on Career.
Sum of Squares df Mean Square F Sig.
Between Groups .089 1 .089 .137 .712 Within Groups 112.222 173 .649
Total 112.310 174

77
The Mann-Whitney test for H3 found the student experience—impact on career
for MBA (M = 3.966) did not differ significantly from iMBA (M = 4.011), U = 3691.50,
z = -.400, p > .05, r = .03. The r score indicates the effect was negligible. Mann-
Whitney confirmed the findings of the One-way ANOVA. Additionally, a Chi-square
test was performed and the findings, X2(5, N=181) = 6.743, p > .05 did support the
findings of the One-way ANOVA.
H4: There is a difference in alumni experience—alumni association between iMBA
and MBA graduates.
H4 analyses tested if there is a difference in alumni experience—association
between iMBA and MBA graduates. The overall Cronbach’s α for alumni association
experience was .891, indicating good reliability (see Table 4.25). Table 4.24 shows that
none of the items deleted would increase the overall α.

78
Table 4.24: Item-Total Statistics for Cronbach’s Alpha of Alumni Association.
Scale Mean if
Item Deleted
Scale
Variance if
Item Deleted
Corrected
Item-Total
Correlation
Squared
Multiple
Correlation
Cronbach's
Alpha if Item
Deleted
Alumni Assoc.
Exp1
29.1379 50.190 .808 .780 .871
Alumni Assoc.
Exp2
29.2069 51.538 .748 .759 .875
Alumni Assoc.
Exp3
29.1264 52.554 .626 .578 .882
Alumni Assoc.
Exp4
29.9310 51.460 .556 .386 .886
Alumni Assoc.
Exp5
28.5287 51.764 .572 .515 .885
Alumni Assoc.
Exp6
29.0345 51.917 .566 .649 .885
Alumni Assoc.
Exp7
28.9310 49.646 .709 .660 .875
Alumni Assoc.
Exp8
28.4368 51.691 .606 .470 .882
Alumni Assoc.
Exp9
30.1034 47.559 .620 .558 .884
Alumni Assoc.
Exp10
29.8046 49.531 .614 .490 .882
The value of Cronbach’s α demonstrated overall good reliability of .891, see
Table 4.25.
Table 4.25: Cronbach’s Alpha for Items Underlying Alumni Association.
Cronbach's Alpha Cronbach's Alpha Based on
Standardized Items N of Items .891 .898 10
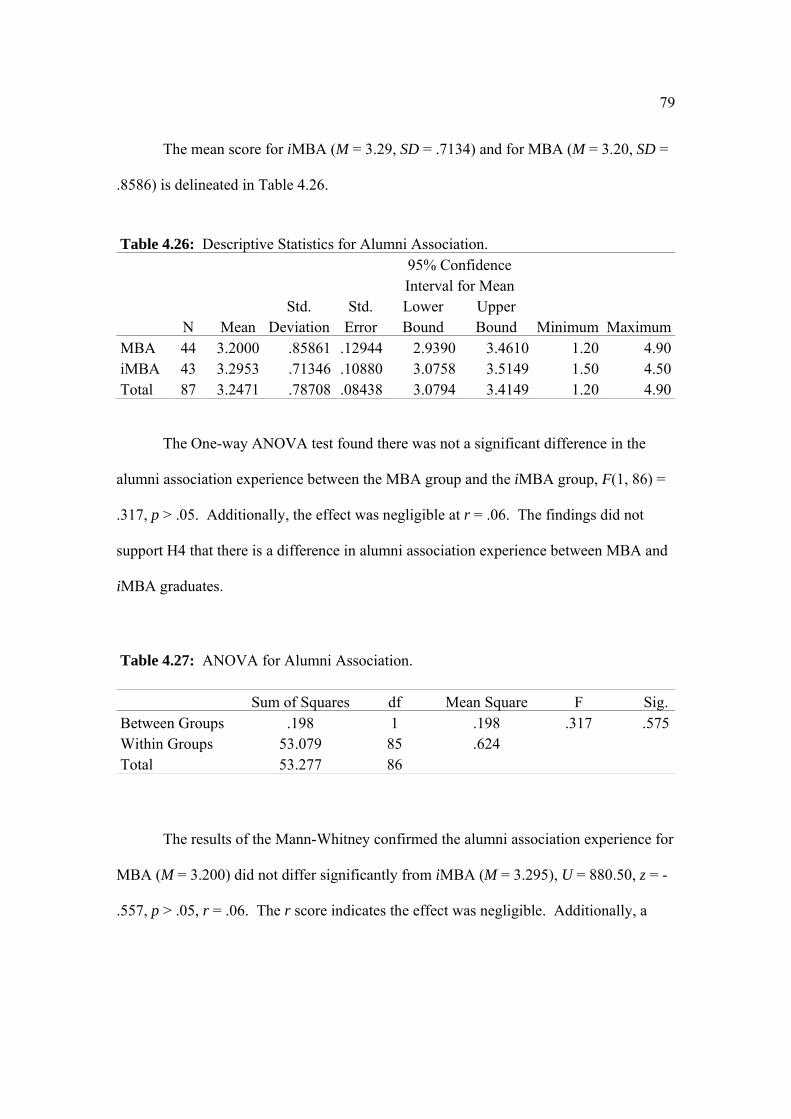
79
The mean score for iMBA (M = 3.29, SD = .7134) and for MBA (M = 3.20, SD =
.8586) is delineated in Table 4.26.
Table 4.26: Descriptive Statistics for Alumni Association.
N Mean Std.
DeviationStd.
Error
95% Confidence Interval for Mean
Minimum MaximumLower Bound
Upper Bound
MBA 44 3.2000 .85861 .12944 2.9390 3.4610 1.20 4.90iMBA 43 3.2953 .71346 .10880 3.0758 3.5149 1.50 4.50Total 87 3.2471 .78708 .08438 3.0794 3.4149 1.20 4.90
The One-way ANOVA test found there was not a significant difference in the
alumni association experience between the MBA group and the iMBA group, F(1, 86) =
.317, p > .05. Additionally, the effect was negligible at r = .06. The findings did not
support H4 that there is a difference in alumni association experience between MBA and
iMBA graduates.
Table 4.27: ANOVA for Alumni Association.
Sum of Squares df Mean Square F Sig.Between Groups .198 1 .198 .317 .575Within Groups 53.079 85 .624
Total 53.277 86
The results of the Mann-Whitney confirmed the alumni association experience for
MBA (M = 3.200) did not differ significantly from iMBA (M = 3.295), U = 880.50, z = -
.557, p > .05, r = .06. The r score indicates the effect was negligible. Additionally, a

80
Chi-square test was performed and the findings, X2(5, N=181) = 3.825, p > .05 did
support the findings of the One-way ANOVA.
H5: There is a difference in alumni experience—engagement between iMBA and
MBA graduates
H5 analyses tested if there is a difference in alumni experience—engagement
between iMBA and MBA graduates. For the seven questions making the variable,
alumni experience—engagement, the overall Cronbach’s α was .891 (see Table 4.29).
All items remained in the analysis because the Cronbach’s α would not increase if an
item were to be deleted and is shown in table 4.28.
Table 4.28: Item-Total Statistics for Cronbach’s Alpha Alumni Engagement.
Scale Mean
if Item Deleted
Scale Variance if
Item Deleted
Corrected Item-Total Correlation
Squared Multiple
Correlation
Cronbach's Alpha if
Item Deleted
Alumni Engage Exp1
22.6509 25.812 .734 .724 .869
Alumni Engage Exp2
22.3846 26.464 .715 .727 .872
Alumni Engage Exp3
22.3314 25.973 .751 .637 .867
Alumni Engage Exp4
21.8580 27.777 .704 .582 .874
Alumni Engage Exp5
21.7811 27.351 .751 .641 .869
Alumni Engage Exp6
21.9704 28.838 .588 .499 .886
Alumni Engage Exp7
22.3136 27.586 .587 .377 .888

81
Table 4.29: Cronbach’s Alpha for Items Underlying Alumni Engagement.
Cronbach's Alpha Cronbach's Alpha Based on
Standardized Items N of Items .891 .892 7
The mean score for the MBA group (M = 3.58, SD = .8500) was less than the
iMBA group mean score (M = 3.81, SD = .8589) as delineated in Table 4.30.
Table 4.30: Descriptive Statistics for Alumni Engagement.
N Mean Std.
DeviationStd.
Error
95% Confidence Interval for Mean
Minimum MaximumLower Bound
Upper Bound
MBA 86 3.5814 .85005 .09166 3.3991 3.7636 1.00 5.00iMBA 83 3.8176 .85897 .09428 3.6300 4.0051 1.00 5.00Total 169 3.6974 .86009 .06616 3.5668 3.8280 1.00 5.00
The results of the One-way ANOVA test indicated that the difference between the
mean scores was not significant, F(1, 168) = 3.227, p > .05, as delineated in Table 4.30.
The effect was r = .13, indicating a small effect. The findings do not support H5 that
there is a difference in alumni experience—engagement between the two groups.
Table 4.31: ANOVA for Alumni Engagement.
Sum of Squares df Mean Square F Sig. Between Groups 2.356 1 2.356 3.227 .074 Within Groups 121.923 167 .730
Total 124.278 168

82
The results of the Mann-Whitney confirmed that the alumni engagement
experience for MBA (M = 3.581) did differ significantly from iMBA (M = 3.817), U =
2915.50, z = -2.059, p < .05, r = .15. However, the r score indicates a rather small effect.
The Mann-Whitney nonparametric test differed from the One-way ANOVA test results.
The One-way ANOVA test involves more assumptions than the Mann-Whitney test;
therefore, the result of the One-way ANOVA that the findings do not support H5 is
retained. Additionally, a Chi-square test was performed and the findings, X2(5, N=181) =
7.059,
p > .05 did support the findings of the One-way ANOVA.
H6: Student experience distinguishes alumni donors from non-donors.
H6, student experience distinguishes alumni donors from non-donors, seeks to
help determine predictors of alumni donor behavior. For fundraising operations at public
universities to utilize resources effectively acquiring a better understanding of what
impacts alumni to donate is warranted. Logistic regression was utilized to test H6.
Logistic regression was used because to donate or not is a dichotomous and categorical
dependent variable and was used to understand predictors of alumni donor behavior. The
test was conducted to determine the impact the factors, student experience—
relationships, academic, and impact on career presented simultaneously to predict alumni
donor behavior.
The initial -2 Log Likelihood of 127.496 is at step 0 when none of the variables
are in the model. The -2 Log Likelihood is a measure of how much unexplained
variability there is in the data. “The difference in the log-likelihood indicates how much

83
new variances have been explained by the model” (Field, 2009, p. 308). The results are
delineated in Table. 4.32.
Table 4.32: Iteration History Student Experience of Donors and Non-Donors.
Iteration -2 Log likelihood Coefficients
Constant Step 0 1 127.496 .043
2 127.496 .043 a. Constant is included in the model. b. Initial -2 Log Likelihood: 127.496 c. Estimation terminated at iteration number 2 because parameter estimates changed by less than .001.
Block 0 is the results with only the constant included before the variable student
experience—relationships, academic, and impact on career are entered into the equation.
SPSS correctly classified cases as 51.1% would not be a donor, Table 4.33.
Table 4.33: Block Classification Student Experience of Donors and Non-Donors.
Observed
Predicted Philanthropy Percentage
Correct Non-Donor Donor Step 0 Philanthropy Non-Donor 0 45 .0
Donor 0 47 100.0 Overall Percentage 51.1
a. Constant is included in the model. b. The cut value is .500
The predictive model chi-square had 3 degrees of freedom, a value of 19.05, and a
probability of p < 0.000, indicating the model has poor fit prior to entering the predictors,
Table 4.34.

84
Table 4.34: Omnibus Tests for Model Coefficients Student Experience.
Chi-square df Sig.
Step 1 Step 19.005 3 .000 Block 19.005 3 .000 Model 19.005 3 .000
The Cox and Snell R Square and Nagelkerke R Squares (Table 4.35) provided an
indication of the amount of variation in the dependent variable (donor or non-donor)
explained by the model. The results indicate that between 18.7% and 24.9% of the
variability is explained by the set of variables. Compared to the model prior to the step
(the measure of the improvement in the predictive power of the model since the previous
step) the -2 Log Likelihood improved to 108.491 from 127.496, indicating an
improvement in the fit of the predictive model.
Table 4.35: Model Summary for Student Experience.
Step -2 Log likelihood Cox & Snell R Square Nagelkerke R Square 1 108.491a .187 .249 a. Estimation terminated at iteration number 4 because parameter estimates changed by
less than .001.
The results of the Hosmer and Lemeshow test in Table 4.36 shows the model is a
good fit as the significance of .868 is not statistically significant, p > .05.

85
Table 4.36: Hosmer and Lemeshow Goodness of Fit Test for Student Experience.
Step Chi-square df Sig. 1 3.878 8 .868
The classification table provides an indication of how well the model is able to
predict the correct category (donor or non-donor) for each case in comparison with the
classification table shown in Table 4.37 to see how much improvement there is when the
predictor variables are included in the model. The model correctly classified 72.8% of
cases overall (Table 4.37), an improvement over the initial finding of 51.1%. The
predictive success was 69.9% for non-donor and 76.6% for donor.
Table 4.37: Classification of Donor and Non-Donor for Student Experience.
Observed
Predicted Philanthropy Percentage
Correct Non-Donor Donor Step 1 Philanthropy Non-Donor 31 14 68.9
Donor 11 36 76.6 Overall Percentage 72.8
The predictive model found two of the three factors, student experience—impact
on career and student experience—impact on relationships are significant (p < .05), p =
.017 and p = .011 respectively. These two factors contribute significantly to the
predictive ability of the model for alumni donors and non-donors.

86
Table 4.38: Block 1 Method Variables in the Equation for Student Experience.
B S.E. Wald df Sig. Exp(B)
95% C.I.for EXP(B)
Lower UpperStep 1a
ImpactCareer 1.062 .443 5.744 1 .017 2.891 1.213 6.887ImpactRelationship .982 .386 6.473 1 .011 2.669 1.253 5.687AcademicExp -.793 .668 1.410 1 .235 .452 .122 1.675Constant -4.439 1.855 5.729 1 .017 .012
a. Variable(s) entered on step 1: ImpactCareer, ImpactRelationship, AcademicExp.
Logistic regression was used to predict to donate or not (0 = non-donor and 1 =
donor) for 92 alumni using student experience as the predictor. A test of the full model
against a constant only model was statistically significant, indicating predictors as a set
reliably distinguished between donor and non-donor (chi-square = 19.005, p < .000, df =
3).
Nagelkerke’s R2 of .249 indicated a small relationship between predication and
grouping. Prediction success overall was 72.8 percent (68.9 percent for non-donor and
76.6 percent for donor). The Wald criterion demonstrated that impact on career (p =
.017) and impact on relationship (p = .011) did make a significant contribution to
prediction. Academic experience was not a significant predictor. Based on the odds ratio
alumni with positive student experience—impact on career was 2.8 times higher to
donate than alumni that did not have a positive experience. Alumni with positive student
experience—impact on relationships was 2.6 times higher to donate than alumni that did
not. The findings support H6, that student experience distinguishes alumni donors from
non-donors.

87
H7: Alumni experience distinguishes alumni donors from non-donors.
H7, alumni experience distinguishes alumni donors from non-donors, seeks to
help determine predictors of alumni donor behavior by examining alumni experiences a
graduate has with the university.
The initial -2 Log Likelihood of 119.175 is at step 0 when none of the
variables are in the model is delineated in Table 4.39.
Table 4.39: Iteration History Alumni Experience of Donors and Non-Donors.
Iteration -2 Log likelihood Coefficients
Constant Step 0 1 119.175 .047
2 119.175 .047 a. Constant is included in the model. b. Initial -2 Log Likelihood: 119.175 c. Estimation terminated at iteration number 2 because parameter estimates changed by less than .001.
Block 0 is the results with only the constant included before the variable alumni
experience—alumni association and engagement are entered into the equation. SPSS
correctly classified cases as 51.2 percent would not be a donor.

88
Table 4.40: Block Classification Alumni Experience of Donors and Non-Donors.
Observed
Predicted Philanthropy Percentage
Correct Non-Donor Donor Step 0 Philanthropy Non-Donor 0 42 .0
Donor 0 44 100.0 Overall Percentage 51.2
a. Constant is included in the model. b. The cut value is .500
The predictive model chi-square has 2 degrees of freedom, a value of 22.865, and
a probability of p < 0.000, indicating the model has poor fit prior to entering the
predictors (Table 4.41).
Table 4.41: Omnibus Tests for Model Coefficients Alumni Experience.
Chi-square df Sig. Step 1 Step 22.865 2 .000
Block 22.865 2 .000 Model 22.865 2 .000
The Cox and Snell R Square and Nagelkerke R Squares (Table 4.42) provide an
indication of the amount of variation in the dependent variable (donor or non-donor)
explained by the model. The results indicate that between 23.3 percent and 31.1 percent
of the variability is explained by the set of variables. The model improved from a -2 Log
Likelihood of 119.175 to 93.310.

89
Table 4.42: Model Summary for Student Experience.
Step -2 Log likelihood Cox & Snell R Square Nagelkerke R Square 1 96.310a .233 .311 a. Estimation terminated at iteration number 5 because parameter estimates changed by less than .001.
After entering the items, the results of the Hosmer and Lemeshow test (Table
4.43) shows the model is a good fit as the significance of .382 is not statistically
significant, p > .05.
Table 4.43: Hosmer and Lemeshow Goodness of Fit Test for Alumni Experience.
Step Chi-square df Sig. 1 7.468 7 .382
The classification table provides an indication of how well the model is able to
predict the correct category (donor and non-donor) for each case in comparison with the
classification table shown in Table 4.44 to see how much improvement there is when the
predictor variables are included in the model. The model correctly classified 69.8 percent
of case overall (Table 4.44), an improvement over the finding of 51.2 percent. The
predictive success was 71.4 percent for non-donor and 68.2 percent for donor.

90
Table 4.44: Classification of Donor and Non-Donor for Alumni Experience.
Observed
Predicted Philanthropy Percentage
Correct Non-Donor Donor Step 1 Philanthropy Non-Donor 30 12 71.4
Donor 14 30 68.2 Overall Percentage 69.8
a. The cut value is .500
For the predictive model one of the two factors, alumni experience—association
was significant (p < .05), p = .000.
Table 4.45: Block 1 Method Variables in the Equation for Alumni Experience.
B S.E. Wald df Sig. Exp(B)
95% C.I.for EXP(B)
Lower UpperStep 1a
Engagement -.030 .388 .006 1 .938 .970 .453 2.077AlumniAsso 1.657 .472 12.350 1 .000 5.245 2.081 13.219Constant -5.260 1.549 11.534 1 .001 .005
a. Variable(s) entered on step 1: Engagement, AlumniAsso.
Logistic regression was used to predict to donate or not (0 = non-donor and 1 =
donor) for 86 alumni using student experience as the predictor. A test of the full model
against a constant only model was statistically significant, indicating that the predictors
as a set reliably distinguished between donor and non-donor (chi-square = 22.865, p <
.000, df = 2).
Nagelkerke’s R2 of .311 indicated a small relationship between predication and
grouping. Prediction success overall was 69.8 percent (71.4 percent for non-donor and
68.2 percent for donor). The Wald criterion demonstrated that engagement did not make

91
a significant contribution to prediction. Alumni association was a significant predictor (p
=.000). Additionally, based on the odds ratio alumni with alumni association experience
are 5.24 times higher to donate than alumni that did not have an alumni association
experience. The findings support H7 that alumni experience distinguishes alumni donors
from non-donors.
The next chapter provides an overview of the findings, limitations of the study,
and suggestions for future research.

92
CHAPTER 5
DISCUSSION AND ANALYSIS OF FINDINGS
Discussion
With the increased pressure from legislators to keep tuition costs down for
students while at the same time decreasing state appropriations to support public higher
education, public universities are experiencing tremendous economic stress. Private
philanthropy will continue to play an increasingly critical role in the quality of education
delivered by public institutions. State governments are facing enormous financial
pressures as result of pension benefits to be paid out, rising healthcare costs, rising
infrastructure costs, and competition from others states, as well as other countries,
seeking businesses to relocate. Institutions of higher education will likely continue to
experience cuts in state appropriations. Additionally, some of the government
appropriation funds are used for research purposes. The average taxpayer is more
concerned about the access and costs of public higher education for his or her
son/daughter than the research that is taking place at the university. As a result, public
universities must seek alternative sources of funding. This has put increased pressure on
the development operations of these institutions to undertake extremely ambitious
fundraising goals, regardless of the state of the economy.
Public higher education is finding itself in a position of selling itself more than
ever. Universities must sell themselves to state governments by showing that they are
worthy of the limited resources available. They must sell themselves to the taxpayer who
is frustrated by higher taxes and who does not value having a public university, perhaps
because the taxpayer is frustrated that his or her son or daughter was unable to secure
placement to said university. Institutions must also sell themselves to the potential

93
student who sees costs of going to school rising only to find it difficult to secure
employment after graduation. Public universities need to review their business model—
which entails fundraising.
Public universities are facing competition from the private universities and for-
profit organizations. Public universities need to continue to sell themselves as a viable
and sustainable solution to the challenges facing the world to secure charitable giving. A
plethora of constituents must continue to have confidence in public universities. If public
universities are to thrive, the alumni of public universities need to embrace the
philanthropic culture that is found in private universities. For example, private
universities often solicit the parents of incoming freshman prior to the first day of class,
and they have very strong senior class-gift programs to indoctrinate students prior to
becoming a graduate.
The added challenge of creating this culture of philanthropy with traditional
students is the new type of student who has never set foot on campus—the online
graduate. It is evident that online programming can be a tremendous resource to an
institution, but if universities think beyond the student’s academic career then this group
represents a viable source of future philanthropic revenue.
Overview of Findings
The notion that personal face-to-face interaction in the traditional MBA would
enhance the student’s experience as it pertains to relationships and academic over the
iMBA graduate was not supported. The results of the study demonstrated there was a
significant difference between the MBA and iMBA groups in student experience—
impact on relationship and academic. However, the iMBA graduates demonstrated higher

94
levels than the MBA graduates. Therefore, H1 and H2 were not supported. These
findings were somewhat surprising given existing literature on alumni giving.
It appears that iMBA graduates forged stronger and more lasting relationships
while students than traditional graduates. This may be attributed to the staying power via
the ease of communication through the Internet. Additionally, the fact that the iMBA
group does study in cohorts and does have a two week in-person workshop experience
could contribute to the outcome of the findings. Unlike the traditional system of delivery
where a relationship is forged through in person class time, the online experience has less
social boundaries, e.g., communication is ongoing and not primarily during class time.
Granted that the in-class experience does not preclude students from communicating
online, it typically does not happen unless the faculty member assigns class projects
forcing communication outside of class. Often online courses require students to provide
dialogue online and interact with their fellow classmates. It could also be that the online
class encourages students to utilize or establish class groups using social media sites such
as LinkedIn.
The graduates of the iMBA demonstrated higher levels of academic experience
(H2). This is encouraging for public universities seeking to increase their revenue stream
by expanding the online delivery option. The fact that the traditional delivery experience
would be an enhancement or advantage over the online experience was not supported.
Further research focused on comparing the online educational experience and the
traditional experience for students attending the same university and enrolled in the same
program or taking a class taught both online and in the traditional method is warranted.

95
H3, H4, and H5 were not supported because a significant difference was not
found between the MBA and the iMBA graduates. The impact on career, alumni
experience—alumni association, and alumni experience—engagement are all after the
fact, i.e., experiences after the student graduated from the MBA program. Although a
significant difference was not found, it is encouraging that development professionals
working at public universities can view MBA graduates as viable source of philanthropic
dollars and influence these areas. The alumnus/alumna that is engaged and involved with
his or her alma mater is more likely to donate. Taking a proactive approach allows the
development and alumni offices to test programming, seek feedback, and then target
fundraising campaigns. This will allow universities to use resources more wisely. The
influence that the alumni and development offices can have on the student experiences is
limited.
The importance of having effective communication to target alumni is paramount.
For example, reaching out to alumni and asking them to participate in a 20 year reunion
to connect with former classmates to see how individuals have “changed” over time may
not be appropriate for those online alumni who have never personally met their
classmates. Perhaps alumni offices could explore the possibility of online reunions
targeted to those alumni that never set foot on campus.
The findings of the study support H6 and H7. This is in keeping with previous
studies. Further examination of alumni predictors of alumni donor behavior with greater
segmentation of the alumni body, e.g., online undergraduates who are members of the
Alumni Association and have volunteered after graduation, is warranted. Most
importantly, public universities need to improve their use of the alumni database and stop

96
treating all alumni as having the same likelihood of making a donation to the university,
as the research has proven that not all alumni are likely to donate. In other words, mass
solicitations (mailing to the entire database) are not an effective use of resources. This
requires a change in the mindset of university fundraiser as note by Birkholz (2008) “The
concept of likelihood is rarely used to prequalify potential donors in advance of prospect
research or even roll-out to the frontline gift officers” (Birkholz, 2008, p. 4). This needs
to change. The initial investment for improved database mining and surveying alumni
will pay dividends for public universities for target solicitations.
The private for-profit education sector has done an excellent job is utilizing data
obtained to improve marketing using target marketing—reaching the correct population
who are most likely to response positively to the call to action. The online alumnus
provides an advantage to a university’s development target marketing plan. The
traditional graduate could have a plethora of experiences that resonates. It could be a
certain professor or class, the time studying in the library, participation in an on campus
club, or attendance at a football game, etc. Therefore, these students have many possible
affinity groups and possible connections that will be critical for that graduate to make his
or her first gift to the university.
The online student has limited connections or affinities. This will help the
university in their targeted fundraising appeals. The classroom experience is limited to
the material or topic under review and not the breaks taken during class, e.g., socializing
among students. Granted, an online student may have additional experiences with
university outside the classroom. For example, a student may take the courses online but
live near enough to attend football games. But the first targeted mass approach that

97
aligns with the online experience to the online graduate will incur a higher associated
response than seeking to target some other associated, and unknown, affinity association.
In light of the vast amount of philanthropic dollars given every year in the U.S.
and the need for resources public universities’ fundraising operations must become more
sophisticated. It is equally important for researchers continue to work to fill the gaps that
exist in the literature surrounding public higher education fundraising. With performance
based funding and the financial challenges facing policy makers a greater understanding
and knowledge of this area of public higher education is warranted. This study does add
to the literature, but there are limitations.
Limitations of Study
Some of the questionnaires returned replied N/A on certain questions. This
limited the study as this answer disqualified the case from analysis in measuring the
variables. In reviewing the questionnaire it could have restricted certain questions such
that the scale was of importance and not actual action; for example, attending a university
sponsored event. Analysis of the data demonstrated there was a systematic pattern of no
answers for the alumni associated experiences related questions. Limiting the N/A option
would have provided more data to be used for analysis in the study.
The stratified sample used to capture appropriate representation from the
traditional MBA program and the iMBA program did not provide expected results. The
samples returned from the traditional MBA graduates was disappointing, 31 precent,
compared to the iMBA return of 45 precent. Although the overall response rate of 36
percent is acceptable it was disappointing that the return rates from the two groups were
not closer. The return discrepancy of the two groups was compounded by the high

98
number of N/A responses for the alumni associated experiences related questions.
Future studies would benefit from having the resources to expand the number of
questionnaires mailed out, although that does not insure a different outcome. Further,
future studies may benefit from targeting alumni association members.
The data pushed the bounds regarding the assumption of normality, the data fell to
the right. This indicated a majority of the respondents had a positive experience at The
Pennsylvania State University. This begs the question if an individual who did not have a
good experience or was indifferent felt returning a questionnaire associated with The
Pennsylvania State University was not worth the effort. Additionally, because the
researcher was not involved at a senior management level with the university perhaps
individuals who had negative experiences felt that communicating via the questionnaire
would not reach the individuals who could act on the information he or she provided.
Another limitation of the study was the two groups were graduates of the MBA
program from the same university for their graduate degree, but it was unknown where
the respondents did their undergraduate degree. Therefore, some of the respondents
could have acquired their undergraduate degree from The Pennsylvania State University
as well and this could have influenced his or her response to the questionnaire.
The study was limited to a quantitative approach, and research results may have
benefited from conducting a qualitative study of random alumni in the population frame
to compare to the quantitative results obtained. Additional research could be undertaken
to expand the knowledge base for the fundraising professional, the field of public
administration and public policy concerning public higher education.

99
Future Research
The study contributes to the literature gap that exists in predicting donor behavior
by examining the online alumnus and the traditional alumnus. Additionally, the study
examined alumni that graduated from the same university, The Pennsylvania State
University, with the same degree, but from a different system of delivery.
The literature would benefit by further examination into the online alumni pool to
build on the results acquired from this study and further support predictors of alumni
donor behavior. Future research should expand the study to other universities
(comparing traditional and online alumni) for comparison purposes.
The literature would also benefit from comparing the online alumni from two
different universities. This would provide insight on the educational delivery system and
provide enhanced understanding of the differences among online students. This segment
of the alumni population continues to grow and with improved technology (perhaps the
future will provide a version of the online program that involves holograms or video that
will mimic the traditional classroom experience virtually) is it likely to continue growing.
It would also be beneficial to have a longitudinal study done to understand donor
behavior over time. A study that would commence when the students enroll to acquire
student experiences combined with studies once the student becomes an alumnus/alumna
would help provide a better understanding of how alumni donor behavior changes over
time. The next chapter provides the conclusion of the study.

100
CHAPTER 6
CONCLUSION
Introduction
Online education is here to stay and is growing rapidly (Harper, 2008; Mayadas,
Bourne, & Bacsich, 2009). Nearly 17 percent of all students are learning online and the
program offerings are diverse with 43 percent of colleges with traditional face-to-face
programs offer online business programs, liberal arts and sciences, and general studies;
40 percent offer online humanities, 35 percent offer online computer and information
sciences, and other online programs stand at 36 percent (Harper, 2008). The diversity of
these programs will continue to grow as universities see the aging population as a target
audience to deliver online course. Twenty percent of the U.S. population or 70 million
people will be aged 65 by 2030 and universities are targeting this group for academic
involvement. As reported by Harper, “Many universities have targeted the adult back-to-
school market with Internet-based programs. Over two-thirds of Public and Private
Institutions now report the online education is critical to their long-term strategy”
(Harper, 2008, p. 2694). The online option has broadened the notion of life-long learning
because of increased access.
The adult back-to-school online degree is seeing growth through the master’s
degree. The private for-profit universities are leading the charge, “Traditional colleges
still produce most the bachelor’s degrees in teaching—ASU topped the list with 979
bachelor’s degrees in 2011. But online schools such as Phoenix and Walden University
awarded thousands more master’s degrees than even the top traditional schools, all of
which are pushing to offer online coursework” (Toppo & Schnaars, 2012). Public
universities are taking note of this growth by the for-profit sector and recognize that

101
business as usual is a death sentence. As noted by a team of researchers, “Of the public
institutions with large online enrollments are recognizing the strategic advantages of
online…our discussion with presidents with the presidents or chancellors of Pennsylvania
State University, University of Massachusetts…University of Illinios indicate clearly that
they are including online instruction as a strategic asset that is integral to the planning
activities of their institutions” (Mayadas, Bourne, & Bacsich, 2009, p. 88)
Online programs and courses are providing much needed revenues to universities.
Furthermore, after the initial start-up costs associated with launching an online course or
program the long-term net revenue for the university is higher than for the traditional
delivery model because of lowered expenses in maintaining a university campus. Of
course, with a university that has a serious deferred maintenance expense the net revenue
of the traditional revenue would be even more compromised. Data show that since the
2008 recession public universities have seen their deferred maintenance bill balloon with
some universities stating the figure is in the hundreds of millions of dollars. Some state
system institutions stating the figure is in the billions (Carlson, 2012).
Another interesting evolution of the online movement is the massive open online
courses or MOOC’s. These are online courses open on the web and are offered free
through organizations such as Coursera, EdX, and Udacity. An in-depth examination of
the MOOC’s is beyond the scope of this study, e.g. agreements with these MOOC’s
between professors and not necessarily between MOOC’s and the university, but it is
worth noting a recent development launched by Coursera. Coursera announced an
employee-matching service called Coursera Career Services (Young, 2012). The
relevance of this new service is that a student regardless of where they are conducting

102
their studies may enroll in just one MOOC’s course and become eligible to be placed in
the employment pool that potential employers may review. If an employer is interested
in contacting the student the student may elect to have his or her contact information
forwarded to the potential employer. The company is charged for each introduction that
Coursera makes. This provides potential employers with a database of potential
candidates. In addition, this benefits student and parents who will see that “online
courses are undeniable chipping at the traditional boundaries of higher education. Until
now, most of the millions of students who register for them [MOOC course] could not
earn credit for their work. But that is changing…the three leading providers, Udacity,
EdX and Coursera, are all offering proctored exams, and in some cases, certification for
transfer credit through the American Council on Education” (Lewin, 2013).
Attending a MOOC allows students attending universities with a lesser reputation
to get noticed. This was the case of one online computer-science course that was offered;
“the online students took the same quizzes and tests as a group of students enrolled at
Stanford University at the same time. The top 411 students all from came the thousands
of students who took the course online, with the strongest-performing Stanford student
ranking 412th in the final standings…that Stanford student earned a 98 percent in the
course” (Young, 2012).
As confidence continues to grow among employers that online students can offer
the skill set they need, public universities must shape the argument that the traditional
student experience provides something, not just for the benefit of the student, but for the
potential employer. In other words, will students who restrict their educational
experience to the online delivery system appear to be more serious and focused than a

103
student who is seeking the traditional education experience in the eyes of the potential
employers? As the employment market remains a challenge for recent graduates and the
global competition remains, students and their parents will be more and more focused on
the return on investment for a university degree and will be keen to understand how
companies will be hiring and from what student population—traditional or online.
Therefore, a student can benefit both from receiving credit for taking a course offered by
a MOOC provider and be entered in a significant potential employment pool.
Summary
The reaction of public universities to decreases in state funding has resulted in
increases in tuition. These increases are forcing some potential qualified students out of
the market. As a matter of public policy this runs contrary to the intent of public higher
education that was established to provide access for the citizenry of a particular state.
Taxpayers have viewed public universities as helping to fulfill societal needs. At the
heart of the debate are control, access, and money. “The traditional contract between
universities and taxpayers provided financial support to universities in return for their
giving up the decision making regarding access criteria and tuition rates. As support
wanes, restrictions on access and tuition hamper universities’ ability to adapt to
threatening external forces” (Fethke & Policano, 2012, p. 216). This new paradigm is
shaping public universities.
The performance of an institution’s development and alumni relations division
hinges on the division building and sustaining alumni relationships. These relationships
are shaped in part by a student’s educational experience and his or her alumni experience.
Increasing our understanding of organizational identity between traditional and online

104
graduates will assist the fundraising divisions in meeting their objectives. The projected
increase in the number of alumni graduating from online programs translates into
increased pressure to maintain acceptable levels of alumni participation rates.
Foundations base the decision to support a university partially on the participation rates
exhibited by alumni. The education sector should be concerned about the future
relationship of online graduates as it relates to philanthropy because the competition for
philanthropic dollars is stiff. In a report released by Giving USA and the Center on
Philanthropy at Indiana University, giving to education declined for the second straight
year, while giving to human services, health, international aid, and the environment
increased (Indiana University, 2010).
The findings of this study place a spot light on the potential long-term missed
philanthropic revenue opportunity universities will experience if the online alumni
segment is not properly targeted. Many universities are currently not differentiating
online alumni from traditional alumni. Although online students experienced higher
positive outcomes in the areas of student and alumni experiences they are not treated by
alumni operations as a specific affinity group, e.g., a fraternity or the baseball team, when
it is evident their university experience is unlike the traditional student experience.
Therefore, the mode of receiving their education is in itself a unique affinity category.
Today’s traditional student is exposed to the impact philanthropy has had on a
campus, e.g., having class in a lecture hall named after a university benefactor or
engaging with students between classes who are seeking participation in student lead
fundraising efforts such as The Pennsylvania State University’s student Dance-A-Thon
for cancer research. The donor plaque on the wall may actually be for the benefit of

105
recognizing the donor and is a condition of the gift, but the residual benefit is the
promotion of philanthropy and creating awareness among today’s students—future
alumni and donors. For the online student universities must begin to incorporate
philanthropy into the communication that takes place between the student and the
university during the course of the student’s online educational experience. For example,
the university could secure a donor to sponsor a course such that every student signed up
for the course receives a discount off the tuition price of the course and this is
communicated throughout the student’s experience, e.g., this course is sponsored by Joe
Donor, alumnus of the class 1975; therefore, all students are receiving a $250 discount
for the semester.
Finally, this study contributes to the gap in the literature that exists in
understanding the online graduate and donor behavior. Additionally, this contributes to
the field of public administration research in the area of public higher education. The
field of public administration needs to do more in the study of public education, including
public higher education. “Despite the significance of public education to Americans in
terms of the size of expenditures and the number of government employee and
governments in this area the field of public administration has virtually ignored this
important area” (Raffel, 2007, p. 137). Raffel identifies the position with an examination
in several areas.
First, an index entries of public administration textbooks by substantive category
lists education number 12 out of 15; analysis of the five leading journals of public
administration (Public Administration Review, Administration and Society, Journal of
Public Administration Research and Theory, American Review of Public Administration,

106
and Public Administration Quarterly) indicates few articles on public education are
published, with the exception of the Public Administration Review which published on
average two articles per year. The great books of the field compiled by Frank P.
Sherwood for the March/April 1990 Public Administration Review issue only had
Mosher’s Democracy and the Public Service that highlighted education and the need for
universities to educate future public administrators; and a curriculum search of the
National Association of Schools of Public Affairs and Administration education does not
receive the specialization like criminal justice, health or the environment (Raffel, 2007).
Public administration researchers should be reaching across traditional academic
lines to the educational and political science programs to enhance the significance of
research in higher education within the field of public administration. Public higher
education will continue to evolve and transform in the future and at a faster pace than
what the industry has experienced traditionally. This study contributes to the theoretical
literature in donor behavior and, more specifically, pertaining to the online alumni.
Online education has demonstrated its staying power and is a source of new
revenue opportunities. It provides a lower cost of delivery per student, helps to increase a
university’s brand, and is creating a new group of alumni. These alumni will need to be
targeted differently than the traditional alumni body for future giving. Their educational
experiences will be distinctly different. The relationships they form with the university
will be generated differently from the beginning, i.e., lack of in-person relationship
building. However, the technological advancement can aid in this regard with the feel
that video conferencing can bring to the online experience.

107
The future online alumnus most likely will enter into the donor stream via giving
online. How will universities move these alumni through the donor cycle in hopes of
securing a major gift is still unknown. The online alumnus will not find the campus visit
to take a trip down memory lane necessary or find the need to meet face-to-face with
fundraising professionals to increase their giving. Universities will need to be sensitive
to the online student experience as they seek to understand the online student university
affinity much like traditional students who have an affinity for a particular experience
while attending university. Universities should be taking action today to develop their
online alumni engagement and development programs to build and strengthen these
relationships. The evidence is clear that there is a high level of satisfaction with their
student and alumni experiences and significant potential for philanthropic resources.

108
References
Albert, S., Ashforth, B. E., & Dutton, J. E. (2000). Organizational Identification:
Charting New Water and Building New Bridges. Academy of Management
Review, 25(1), 13-17.
Allen, E. I., & Seaman, J. (2010). Class differences: Online education in the United
States, 2010. U.S.: Babson Survey Research Group.
Ashforth, B. E., & Mael, F. (1989). Social identity theory and the organization. Academy
of Management Review, 14(1), 20-39.
Baade, R. A., & Sundberg, J. O. (1996). What determines alumni generosity. Economics
of Education Review, 15(1), 75-81.
Baruch, Y., & Holtom, B. C. (2008). Survey response rate levels and trends in
organizational research. Human Relations, 61(8), 1139-1160.
Baruch, Y., & Sang, K. J. (2012). Predicting MBA graduates' donation behavior to their
alma mater. The Journal of Management Development, 31(8), 808-825.
Bennett, R., & Savani, S. (2003). Predicting the accuracy of public perceptions of charity
performance. Journal of Targeting, Measurement and Analysis for Marketing,
11(4), 326-342.
Birkholz, J. A. (2008). Fundraising analytics. Hoboken, New Jersy: John Wiley and
Sons.
Blau, P. M. (1964). Exchange and power in social life. New York: John Wiley and Sons,
Inc.

109
Bristol Jr., R. (1990). The life cycle of alumni donations. The Review of Higher
Education, 13, 503-518.
Brooks, A. C. (2002). Can nonprofit management help answer public management's "Big
Questions"? Public Administration Review, 62(3), 259-266.
Brooks, A. C. (2006). Efficient nonprofits? Policy Studies Journal, 35(3), 303-312.
Bruce, G. A. (2007). Exploring the Likelihood and Reality of MBA Alumni Financial
Donations. McLean, VA: Graduate Management Admission Council.
Bryman, A. (2008). Social research methods (3rd ed.). Oxford, England: Oxford
University Press.
Buchen, I. H. (2005). The future of higher education and professional training. The
Journal of Future Studies, Strategic Thinking and Policy, 7(4), 13-21.
Carlson, S. (2012, May). Administration: How the Campus Crumbles. Retrieved from
The Chronicle of Higher Education: http://chronicle.com/article/article-
content/131920/
Chronicle of Higher Education. (2012, November). Capital Campaign Update. Retrieved
from Chronicle of Higher Education: http://chronicle.com/article/Stanford-Raises-
62-Billion/130698/?sid=at&utm_source=at&utm_medium=en
Chronicle of Higher Education. (2012, Feburary). Finance. Retrieved from Chronicle of
Higher Education: http://chronicle.com/article/Stanford-Raises-62-
Billion/130698/?sid=at&utm_source=at&utm_medium=en

110
Clotfelter, C. (2001). Who are the alumni donors? Giving by two generations of alumni
from selective colleges. Nonprofit Management and Leadership, 119-138.
Clotfelter, C. (2003). Alumni giving to elite private colleges and universities. Economics
of Education Review, 22, 109-120.
College Board. (2012). Trends in Higher Education. Retrieved from College Board
Advocacy and Policy Center: http://trends.collegeboard.org/
Commonwealth of Pennsylvania. (2012, January). Governor's Budget. Retrieved from
PA Office of the Budget:
http://www.portal.state.pa.us/portal/server.pt?open=512&objID=4571&mode=2#
2011-12
Council for Aid to Education. (2011). 2010 voluntary support of education. New York,
New York: Council for Aid to Education.
Creswell, J. W. (2009). Research design: Qualitative, quantitative, and mixed methods
approaches (3rd ed.). Thousand Oaks, CA: Sage Publications.
Cutlip, S. M. (1965). Fund raising in the United States. New Brunswick, NJ: Rutgers
Univesity Press.
Delaney, J. A., & Doyle, W. R. (2011). State spending on higher education: testing the
balance wheel over time. The Journal of Education Finance, 36(4), 343-368.
Distance Education Report. (2002). Will distance alumni become donors? Distance
Education Report.

111
Distance Education Report. (2009). Is distance ed shrinking the alumni donor pool?
Distance Education Report, 13(4), 1-8.
Drezner, N. D. (2009). Why give?: Exploring social exchange and organization theories
in the promotion of philanthropic behaviors of African-American millennials at
private-HBCUs. International Journal of Educational Advancement, 9(3), 147-
165.
Drezner, N. D. (2011). Philanthrophy and fundraising in American higher education.
Hoboken, NJ: Wiley Periodicals.
Dye, T. R. (2008). Understanding public policy. Upper Saddle Rive, NJ: Pearson
Education, Inc.
Fethke, G. C., & Policano, A. J. (2012). Public no more, a new path to excellence for
America's public universities. Stanford, CA: Stanford University Press.
Field, A. (2009). Discovering statistics using SPSS (3rd ed.). Thousand Oaks, CA: SAGE
Publications.
Frank, R. (1996). Motivation, Cognition, and Charitable Giving. In J. B. Schneewind,
Giving: western ideas of philanthropy (pp. 130-152). Bloomington: Indiana
University Press.
Frumkin, P. (2000). Philanthorpic leverage. Society, 40-46.
Frumkin, P., & Kim, M. T. (2001). Strategic positioning and the financing of nonprofit
organizations: Is efficiency rewarded in the contributions markplace? Public
Administration Review, 61(3), 266-275.

112
Gaier, S. (2005). Alumni satisfaction with their undergraduate academic experience and
the impact on alumni giving and participation. International Journal of
Educational Advancement, 5(4), 279-288.
Harper, R. L. (2008). Online Education in the United States Higher Education System. In
C. Bonk, & L. Hyunkyung, Proceedings of World Conference on E-Leanering in
Corporate, Government, Healthcare, and Higher Education (pp. 2691-2708).
Cheseapeake, VA: AACE.
Hashemi, R. R., Le Blanc, L. A., Bahrami, A. A., Bahar, M., & Traywick, B. (2009).
Association analysis of alumni giving: a formal concept analysis. International
Journal of Intelligent Information Technologies, 5(2), 17-32.
Hyndman, N. (1990). Charity accounting: An empirical study of the information needs of
contributors to UK fund raising charities. Financial Accountability and
Management, 6(4), 295-307.
Indiana University. (2010, June). Center on Philanthropy at Indiana University.
Retrieved from Center on Philanthropy at Indiana University:
http://www.philanthropy.iupui.edu/news/2010/06/pr-GUSA2010.aspx
Iwaarden, J. v., Wiele, T. v., William, R., & Moxham, C. (2009). Charities: How
important is performance to donors? International Journal of Quality and
Reliability Management, 26(1), 5-22.
Kanuka, H., & Conrad, D. (2003). The name of the game: Why distance education says it
all. The Quarterly Review of Distance Education, 4(4), 385-393.

113
Lei, S. A., & Gupta, R. K. (2010). College distance education courses: Evaluating
benefits and costs from institutional, faculty and students' perspectives.
Education, 130(4), 616-631.
Lewin, T. (2013, April 30). Technology: Colleges Adapt Online Courses to Ease Burden.
Retrieved from The New York Times:
http://www.nytimes.com/2013/04/30/education/colleges-adapt-online-courses-to-
ease-burden.html?pagewanted=all&_r=0
Lindahl, W. E., & Conley, A. T. (2002). Literature review: Philanthropic Fundraising.
Nonprofit Managment and Leadership, 13(1), 91-112.
Liu, Y. (2006). Determinants of private giving to public colleges and universities.
International Journal of Educational Advancement, 6(2), 119-140.
Mael, F., & Ashforth, B. E. (1992). Alumni and their alma mater: A partial test of the
reformulated model of organizational identification. Journal of Organizational
Behavior, 13(2), 103-123.
Mann, T. (2007). College fund raising using theoretical perspectives to understand donor
motives. International Journal of Educational Advancement, 7(1), 35-45.
Mathur, A. (1996). Older adults' motivations for gift giving to charitable organizations:
An exchange theory perspective. Psychology and Marketing, 13(1), 107-123.
Mayadas, A. F., Bourne, J., & Bacsich, P. (2009). Online education today. Science,
323(2), 85-89.
114
McDearmon, J. T., & Shirley, K. (2009). Characteristics and institutional factors related
to young alumni donors and non-donors. International Journal of Educational
Advancement, 9(2), 83-95.
McLendon, M. K., Deaton, S. B., & Hearn, J. C. (2007). The enactment of reforms in
state governance of higher education: Testing the political instability hypothesis.
The Journal of Higher Education, 78(6), 645-675.
Meer, J., & Rosen, H. S. (2010). Family bonding with universities. Research in Higher
Education, 51, 641-658.
Miller, M. T., & Casebeer, A. L. (1990). Donor characteristics of college of education
alumni: examining undergraduate involvement. Retrieved from ERIC database
(ED 323836).
Monk, J. (2003). Patterns of giving to one's alma mater amoung young graduates from
selective institutions. Economic of Education Review, 22(2), 121-130.
Newman, M. D. (2011). Does members matter? Examing the relationship between
Alumni Association membership and alumni giving. International Journal of
Educational Advancement, 10(4), 163-179.
Pennslyvania State System of Higher Education. (2012, July). Press Releases. Retrieved
from Pennslyvania State System of Higher Education:
http://www.passhe.edu/inside/ne/press/Lists/Press%20Releases/pressup.aspx?ID=
525&ContentTypeId=0x01006B3D98C5084ABB47927D422E92C00C3300058D
FAF00E84824A8F87467AD4FF8E26

115
Pennsylvania State System of Higher Education. (2011, January). Press Releases.
Retrieved from Pennsylvania State System of Higher Education:
http://www.passhe.edu/inside/ne/press/Lists/Press%20Releases/pressup.aspx?ID=
461&ContentTypeId=0x01006B3D98C5084ABB47927D422E92C00C3300058D
FAF00E84824A8F87467AD4FF8E26
Pennsylvania State System of Higher Education. (2013, March 5). Board of Governors.
Retrieved from PASSHE: http://www.passhe.edu/inside/bog/Pages/BOG-
Home.aspx
Pennsylvania State University. (2010). Penn State Online. Retrieved from Worldcampus:
http://www.worldcampus.psu.edu/iMBA.shtml
Pennsylvania State University. (2013, March). Trustees. Retrieved from Pennsylvania
State University: http:/www.psu.edu/trustees/governance.html
Pfeffer, J., & Salancik, G. R. (1978). The external control of organizations: A resource
dependence perspective. New York, NY: Haper and Row Publishers.
Prince, R. A., & File, K. M. (1994). The seven faces of philanthropy. San Franciso:
Jossey Bass.
Raffel, J. A. (2007, January/February). Why has public admininstration ignored public
education, and does it matter? Public Administration Review, 135-151.
Rogelberg, S. C., & Stanton, J. M. (2007, April). Understanding and dealing with
organizational survey nonresponse. Organizational Research Methods, 10(2),
195-209.

116
Rudolph, F. J. (1990). The American and college and university: A history. Athens, GA:
University of Georgia Press.
Sivo, S. A., Saunders, C., Chang, Q., & Jiang, J. (2006). How low should you go? Low
response rates and the validity of inference in IS questionnaire research. Journal
of the Association for Information Systems, 7(6), 351-414.
Slaughter, S., & Rhoades, G. (2004). Academic capitalism and the new economy:
Markets, states, and higher education. Baltimore: John Hopkins University Press.
Sloan Constortium. (2013, January 8). Survey Results. Retrieved from The Sloan
Constortium: http://sloanconsortium.org/news_press/january2013_new-study-
over-67-million-students-learning-online
Smith, S. R. (2008). The challenge of strenthening nonprofits and civil society. Public
Administration Review, S132-S145.
Smith, S. R. (2010). Nonprofits and public administration: Reconciling performance
management and citizen engagement. The American Review of Public
Administration, 129-152.
Sun, X., Hoffman, S. C., & Grady, M. L. (2007). A multivariate causal model of alumni
giving: Implications for alumni fundraisers. International Journal of Educational
Advancement, 7(4), 307-332.
Tabachnick, B. G., & Fidell, L. S. (2001). Using multivariate statistics (4th ed.). Boston:
Allyn & Bacon.

117
Tom, G., & Elmer, L. (1994). Alumni willingness to give and contribution behavior. The
Journal of Services Marketing, 8(2), 57-62.
Toppo, G., & Schnaars, C. (2012, August 7). Online education degrees skyrocket.
Retrieved from USAToday:
http://usatoday30.usatoday.com/news/education/story/2012-08-07/online-
teaching-degrees/56849026/1
Tsao, J. T., & Coll, G. (2005). To give or not to give: factors determining alumni intent to
make donations as a PR outcome. Journalism and Mass Communication
Educator, 381-392.
Tsiotsou, R. (2007). An empirically based typology of intercollegiate athletic donors:
High and low motivation scenarios. Journal of Targeting, Measurement and
Analysis for Marketing, 15(2), 79-92.
Tsunoda, K. (2010). Asian American giving to US higher education. International
Journal of Education Advancement, 10(1), 2-23.
U.S. Census Bureau. (2011). The 2011 statistical abstract, the national data book.
Retrieved from U.S. Census Bureau:
http://www.census.gov/compendia/statab/cats/education.html
Urban Institute. (2013). Quick facts about nonprofits. Retrieved from National center for
charitable statistics: http://nccs.urban.org/statistics/quickfacts.cfm

118
Visser, P. S., Krosnick, J. A., Marquette, J., & Curtin, M. (1996). Mail surveys for
evaluation forecasting? An evaluation of the Columbus Dispatch poll. Public
Opinion Quarterly, 60, 181-227.
Wastyn, M. L. (2009). Why alumni don't give: A qualitative study of what motivates
non-donors to higher education. International Journal of Educational
Advancement, 96-108.
Weerts, D. J., & Ronca, J. M. (2007). Profiles of supportive alumni: donors, volunteers,
and those who "do it all". International Journal of Educational Advancement,
7(1), 20-34.
WHYY. (2012, February). Radio Times with Marty Moss-Coane. Retrieved from
WHYY: http://whyy.org/cms/radiotimes/2012/02/16/higher-education-in-
pennsylvania-what-cuts-mean-for-students-educators-and-the-economy/
Williams, S. R. (2007). Donor preferences and charitable giving. International Journal of
Educational Advancement, 7(3), 176-189.
Young, J. R. (2012, December). Providers of Free MOOC's Now Charge Employers for
Access to Student Data-Technology. Retrieved from The Chronicle of Higher
Education: http://chronicle.com/article/Providers-of-Free-MOOCs-Now/136117/

119
Appendix A: Cover Letter and Questionnaire
Dear Participant:
I am a Ph.D. student in the Public Administration program at Penn State University. I am a Penn State student researcher and I am conducting this study for research purposes. The attached survey is part of my dissertation for the completion of my Ph.D. in Public Administration from Penn State University. The purpose of my study is to attempt to understand student educational and alumni experiences between traditional and online MBA graduates. I hope you will take a few minutes to complete the survey, it would be greatly appreciated. Please do not write your name on the survey, all responses will be kept confidential. No personally identifying information will be recorded on the survey. In the event of a publication or presentation resulting from the research, there will be no personally identifiable information. Your participation in this study is voluntary and you can stop at any time. You may choose not to answer any questions you do not want to. I would greatly appreciate if you could spare the 12 minutes to complete the enclosed questionnaire and send it back to me in the enclosed postage-paid envelope. Without your help, this research could not be conducted. You may ask me any questions about this study. Please contact me at your convenience at [email protected] or at 484-400-6005. If you have questions about your rights in participating in this study you may contact the Penn State University Institutional Review Board (IRB) at by mail at 330 Building, Suite 205, University Park, PA 16802, by phone at 814-865-1775, or by email at [email protected]. Thank you for your help! Sincerely, Jason W. Ketter Ph.D. candidate, Penn State University PS Thank you for returning the enclosed survey.

120
Survey
Participant:
Thank you. Thank you for taking a few minutes to complete this questionnaire. The
questionnaire is designed so you need only check off your answers [X] or [√]. All
information is keep confidential and no individual will be identified. The information
you provide will be combined with many others for statistical analysis. Please check
your answer from disagree to agree, or no application (NA) if the question does apply to
you. Again, thank you for your help.
PSU Alumni Experience – Alumni Association
1. I find the alumni association in general helpful.
[ ] disagree [ ] somewhat disagree [ ] neutral [ ] somewhat agree [ ] agree
[ ] NA
2. I find the alumni association website helpful.
[ ] disagree [ ] somewhat disagree [ ] neutral [ ] somewhat agree [ ] agree
[ ] NA
3. I find the alumni association sponsored events beneficial.
[ ] disagree [ ] somewhat disagree [ ] neutral [ ] somewhat agree [ ] agree
[ ] NA
4. The alumni association has been a helpful resource for my career.
[ ] disagree [ ] somewhat disagree [ ] neutral [ ] somewhat agree [ ] agree
[ ] NA
5. I find the alumni magazine of high quality.
[ ] disagree [ ] somewhat disagree [ ] neutral [ ] somewhat agree [ ] agree
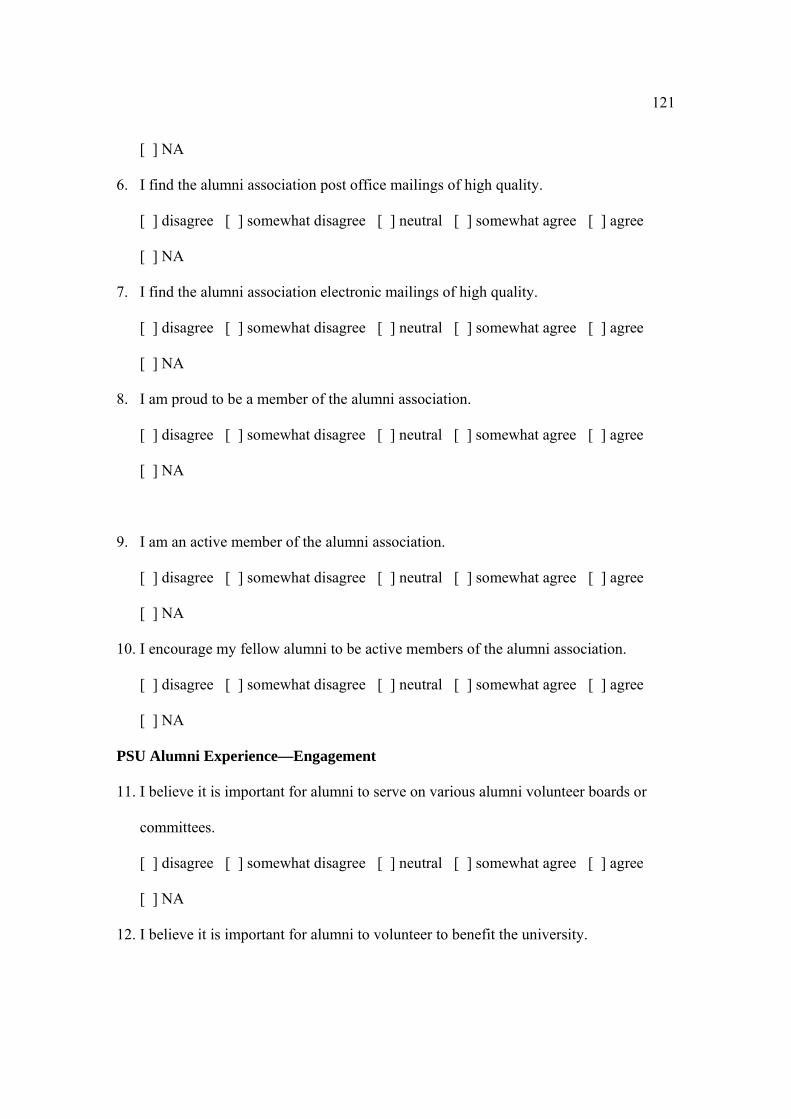
121
[ ] NA
6. I find the alumni association post office mailings of high quality.
[ ] disagree [ ] somewhat disagree [ ] neutral [ ] somewhat agree [ ] agree
[ ] NA
7. I find the alumni association electronic mailings of high quality.
[ ] disagree [ ] somewhat disagree [ ] neutral [ ] somewhat agree [ ] agree
[ ] NA
8. I am proud to be a member of the alumni association.
[ ] disagree [ ] somewhat disagree [ ] neutral [ ] somewhat agree [ ] agree
[ ] NA
9. I am an active member of the alumni association.
[ ] disagree [ ] somewhat disagree [ ] neutral [ ] somewhat agree [ ] agree
[ ] NA
10. I encourage my fellow alumni to be active members of the alumni association.
[ ] disagree [ ] somewhat disagree [ ] neutral [ ] somewhat agree [ ] agree
[ ] NA
PSU Alumni Experience—Engagement
11. I believe it is important for alumni to serve on various alumni volunteer boards or
committees.
[ ] disagree [ ] somewhat disagree [ ] neutral [ ] somewhat agree [ ] agree
[ ] NA
12. I believe it is important for alumni to volunteer to benefit the university.

122
[ ] disagree [ ] somewhat disagree [ ] neutral [ ] somewhat agree [ ] agree
[ ] NA
13. I believe it is important for alumni to attend university events.
[ ] disagree [ ] somewhat disagree [ ] neutral [ ] somewhat agree [ ] agree
[ ] NA
14. I believe it is important for alumni to network with fellow alumni.
[ ] disagree [ ] somewhat disagree [ ] neutral [ ] somewhat agree [ ] agree
[ ] NA
15. I believe it is important for alumni to serve as mentors to current students.
[ ] disagree [ ] somewhat disagree [ ] neutral [ ] somewhat agree [ ] agree
[ ] NA
16. I believe it is important for alumni to speak in class to share their experiences.
[ ] disagree [ ] somewhat disagree [ ] neutral [ ] somewhat agree [ ] agree
[ ] NA
17. I believe it is important for alumni to help in the admission process to help recruit
students.
[ ] disagree [ ] somewhat disagree [ ] neutral [ ] somewhat agree [ ] agree
[ ] NA
PSU MBA Student Experience—Academic
18. My MBA academic coursework prepared me well for my career.
[ ] disagree [ ] somewhat disagree [ ] neutral [ ] somewhat agree [ ] agree
[ ] NA
19. I found the majority of my MBA coursework provided the skills I need for my career.

123
[ ] disagree [ ] somewhat disagree [ ] neutral [ ] somewhat agree [ ] agree
[ ] NA
20. I found the majority of my MBA coursework challenging.
[ ] disagree [ ] somewhat disagree [ ] neutral [ ] somewhat agree [ ] agree
[ ] NA
21. I found my interaction with my MBA faculty during class a positive experience.
[ ] disagree [ ] somewhat disagree [ ] neutral [ ] somewhat agree [ ] agree
[ ] NA
22. I found the MBA classroom experience a positive experience.
[ ] disagree [ ] somewhat disagree [ ] neutral [ ] somewhat agree [ ] agree
[ ] NA
23. I found my interaction with my fellow MBA students during class a positive
experience.
[ ] disagree [ ] somewhat disagree [ ] neutral [ ] somewhat agree [ ] agree
[ ] NA
24. I found my interaction for MBA coursework purposes with my fellow MBA students
outside of class a positive experience.
[ ] disagree [ ] somewhat disagree [ ] neutral [ ] somewhat agree [ ] agree
[ ] NA
25. I found my interaction for MBA coursework purposes with my MBA faculty outside
of class a positive experience.
[ ] disagree [ ] somewhat disagree [ ] neutral [ ] somewhat agree [ ] agree

124
[ ] NA
PSU MBA Student Experience—Impact on Career
26. I credit my MBA for my career advancement.
[ ] disagree [ ] somewhat disagree [ ] neutral [ ] somewhat agree [ ] agree
[ ] NA
27. I credit my MBA for my increase in earnings potential.
[ ] disagree [ ] somewhat disagree [ ] neutral [ ] somewhat agree [ ] agree
[ ] NA
28. I credit my MBA for my increased career options.
[ ] disagree [ ] somewhat disagree [ ] neutral [ ] somewhat agree [ ] agree
[ ] NA
29. I credit my MBA for my job security.
[ ] disagree [ ] somewhat disagree [ ] neutral [ ] somewhat agree [ ] agree
[ ] NA
30. I credit my MBA for giving me added confidence in my workplace.
[ ] disagree [ ] somewhat disagree [ ] neutral [ ] somewhat agree [ ] agree
[ ] NA
31. I credit my MBA for allowing me to seek new career opportunities that I otherwise
would be not qualified for.[ ] disagree [ ] somewhat disagree [ ] neutral [ ]
somewhat agree [ ] agree [ ] NA
PSU MBA Student Experience – Impact on Relationships
32. My MBA program provided me with new lifelong relationships.
[ ] disagree [ ] somewhat disagree [ ] neutral [ ] somewhat agree [ ] agree

125
[ ] NA
33. I found attending athletic events a positive experience in building relationships.
[ ] disagree [ ] somewhat disagree [ ] neutral [ ] somewhat agree [ ] agree
[ ] NA
34. I found attending events other than athletic events a positive experience in building
relationships.
[ ] disagree [ ] somewhat disagree [ ] neutral [ ] somewhat agree [ ] agree
[ ] NA
35. I found my relationships with my fellow MBA students impacted positively on my
own student experience.
[ ] disagree [ ] somewhat disagree [ ] neutral [ ] somewhat agree [ ] agree
[ ] NA
36. I found my relationships with my MBA faculty impacted positively on my own
student experience.
[ ] disagree [ ] somewhat disagree [ ] neutral [ ] somewhat agree [ ] agree
[ ] NA
37. I found the registration process for enrolling into the MBA program positively
enhanced my relationship with the university.
[ ] disagree [ ] somewhat disagree [ ] neutral [ ] somewhat agree [ ] agree
[ ] NA
38. I found the graduation experience positively enhanced my relationship with the
university.
[ ] disagree [ ] somewhat disagree [ ] neutral [ ] somewhat agree [ ] agree

126
[ ] NA
PSU Philanthropy Experience
39. Which of the following best describes your financial philanthropic support of the
university?
Select only one:
[ ] I philanthropically support the university and plan to continue at the same
level of support.
[ ] I philanthropically support the university and plan to increase my support in
the future.
[ ] I philanthropically support the university and plan to decrease my support in
the future.
[ ] I have never philanthropically supported the university and do not plan to in
the future.
[ ] I have never philanthropically supported the university but plan to in the
future.
[ ] I have philanthropically supported the university but do not plan to continue.
Demographic Information
40. Gender: [ ] Female [ ] Male
41. Please indicate your annual salary:
[ ] less than $50,000 [ ] $50,000 - $74,999[ ] $75,000 - $99,999
[ ] $100,000 - $149,999[ ] $150,000 or more
42. Please indicate your age:
[ ] 25 years of age or younger [ ] 26 – 35 years of age [ ] 36 – 45 years of age
[ ] 46 – 55 years of age [ ] 56 years of age and older
43. Ethnicity:
[ ] Asian or Pacific Islander [ ] Black/African American [ ] Hispanic

127
[ ] Native American [ ] White/Caucasian [ ] Other
44. Marital Status: [ ] Single [ ] Married
45. PSU MBA graduation year: _________
FINISHED!
Thank you for your help!
Please fold this survey and return in the postage‐paid envelope
provided.

128
Appendix B: Reminder Post Card
JasonW.KetterBriefCurriculumVitae
EDUCATION DoctorateofPhilosophy,PublicAdministration,ThePennsylvaniaStateUniversity,Harrisburg,PA,(2013).Researchinterests:Fundraising,nonprofitmanagementandleadership,andpublic‐privatepartnerships.
MasterofBusinessAdministration,KutztownUniversityofPennsylvania,Kutztown,PA,(2005)MasterofPublicAdministration,UniversityofWisconsinOshkosh,Oshkosh,WI,(1995)BachelorofArts,TheUniversityofIowa,IowaCity,IA,(1988).Major:Economics,Minor:BusinessAdministration
PROFESSIONALEXPERIENCEDirectorofAdvancementforFacultyofBusiness,Economics,andLaw,TheUniversityofQueensland,Brisbane,Australia,(3/2013–present)ExecutiveDirector,KutztownUniversityFoundation,Kutztown,PA,(2/2011–2/2013)DirectorofDevelopment,ThePennsylvaniaStateUniversity,Harrisburg,PA,(1/2008–1/2011)
VPforInstitutionalAdvancement,DelawareValleyCollege,Doylestown,PA,(3/2004–01/2008)
AssociateVicePresidentforDevelopment,AlbrightCollege,Reading,PA,(08/2001–03/2004)
Dir.ofDevelopment&Dir.ofMajorGiftsValleyForgeMilitaryAcademyandCollege,Wayne,PA,(01/2000–07/2001)IndependentConsultant,Muscat,SultanateofOman,(08/1999–11/1999)Lecturer,SultanQaboosUniversity,Muscat,SultanateofOman,(02/1997–08/1999)DirectorofMajorGiving,DelawareValleyCollege,Doylestown,PA,(09/1995–01/1997)DirectoroftheAnnualFund,WidenerUniversity,Chester,PA,(08/1994–08/1995)
DirectoroftheAnnualFund,UniversityofWisconsinOshkosh,Oshkosh,WI,(01/1990–08/1994)Manager,ReeseBrothers,IowaCity,IA,(09/1988–11/1989)ADDITIONALPROFESSIONALACTIVITIESANDCONFERENCESExecutiveVicePresidentandmemberoftheBoardofDirectors,PleinFoundation,Henderson,NV(11/2004–present)BoardMember,NortheastBerksChamberofCommerce,Kutztown,PA(11/2011–2/2013)VicePresident,DoctoralStudentOrganization,ThePennsylvaniaStateUniversity,Harrisburg,PA,(1/2009–10/2010)ConferencePresenter,InternationalSocietyforThirdSectorResearch,Istanbul,Turkey,(07/2010).WomenLeadersandManagementofPublicRelationsinNonprofitOrganizations.Consultant,CalcuttaHouse,Philadelphia,PA,(Summer2006)MemberandSpeaker,AssociationofFundraisingProfessionals.NationalPhilanthropyDayForumSpeaker,Fogelsville,PA,(November2004and2005).NortheastWisconsinChapter,WI:MembershipCommitteeViceChairman(1994),BoardofDirectors(1993‐1994),PhilanthropyDayCommittee(1993),ProgramSpeaker(January1992),ProfessionalDevelopmentCommittee(1992‐1994)MemberandSpeaker,CouncilofAdvancementandSupportofEducation.DistrictTwoAnnualConference,Philadelphia,PA,(February2004),ProgramSpeaker;ConferenceonMakingTheMajorGiftAsk,SanAntonio,TX,(2002);DistrictTwoAnnualConference,Philadelphia,PA,(1996);DistrictFiveAnnualConference,Chicago,IL,(1992);ConferenceonAnnualGiving,Montreal,Canada,(1990)