Embed Size (px)
Citation preview
ACPD7, 11049–11089, 2007
Predictions of purecomponent vapour
pressures
S. L. Clegg et al.
Title Page
Abstract Introduction
Conclusions References
Tables Figures
J I
J I
Back Close
Full Screen / Esc
Printer-friendly Version
Interactive Discussion
EGU
Atmos. Chem. Phys. Discuss., 7, 11049–11089, 2007www.atmos-chem-phys-discuss.net/7/11049/2007/© Author(s) 2007. This work is licensedunder a Creative Commons License.
AtmosphericChemistry
and PhysicsDiscussions
Effects of uncertainties in thethermodynamic properties of aerosolcomponents in an air quality model – PartII: Predictions of the vapour pressures oforganic compounds
S. L. Clegg1, M. J. Kleeman2, R. J. Griffin3, and J. H. Seinfeld4
1School of Environmental Sciences, University of East Anglia, Norwich NR4 7TJ, UK2Department of Civil and Environmental Engineering, University of California, Davis CA95616, USA3Institute for the Study of Earth, Oceans and Space, and Department of Earth Sciences,University of New Hampshire, Durham, NH 03824, USA4Department of Chemical Engineering, California Institute of Technology, Pasadena, CA91125, USA
Received: 1 June 2007 – Accepted: 18 June 2007 – Published: 26 July 2007
Correspondence to: S. L. Clegg ([email protected])
11049
ACPD7, 11049–11089, 2007
Predictions of purecomponent vapour
pressures
S. L. Clegg et al.
Title Page
Abstract Introduction
Conclusions References
Tables Figures
J I
J I
Back Close
Full Screen / Esc
Printer-friendly Version
Interactive Discussion
EGU
Abstract
Air quality models that generate the concentrations of semi-volatile and other condens-able organic compounds using an explicit reaction mechanism require estimates of thevapour pressures of the organic compounds that partition between the aerosol andgas phases. The model of Griffin, Kleeman and co-workers (e.g., Griffin et al., 2005)5
assumes that aerosol particles consist of an aqueous phase, containing inorganic elec-trolytes and soluble organic compounds, and a hydrophobic phase containing mainlyprimary hydrocarbon material. Thirty eight semi-volatile reaction products are groupedinto ten surrogate species. In Part I of this work (Clegg et al., 2007) the thermodynamicelements of the gas/aerosol partitioning calculation are examined, and the effects of10
uncertainties and approximations assessed, using a simulation for the South Coast AirBasin around Los Angeles as an example. Here we compare several different methodsof predicting vapour pressures of organic compounds, and use the results to determinethe likely uncertainties in the vapour pressures of the semi-volatile surrogate speciesin the model. These are typically an order of magnitude or greater, and are further in-15
creased when the fact that each compound represents a range of reaction products (forwhich vapour pressures can be independently estimated) is taken into account. Theeffects of the vapour pressure uncertainties associated with the water-soluble semi-volatile species are determined over a wide range of atmospheric liquid water contents.The vapour pressures of the eight primary hydrocarbon surrogate species present in20
the model, which are normally assumed to be involatile, are also predicted. The resultssuggest that they have vapour pressures high enough to exist in both the aerosol andgas phases under typical atmospheric conditions.
1 Introduction
A generalised scheme for including the organic components of aerosols in air quality25
and other atmospheric models, and used in the UCD-CACM model of Griffin, Kleeman
11050
ACPD7, 11049–11089, 2007
Predictions of purecomponent vapour
pressures
S. L. Clegg et al.
Title Page
Abstract Introduction
Conclusions References
Tables Figures
J I
J I
Back Close
Full Screen / Esc
Printer-friendly Version
Interactive Discussion
EGU
and co-workers (where CACM stands for the Caltech Atmospheric Chemistry Mech-anism), is shown in Fig. 1 of Clegg et al. (2007). The partitioning of semi-volatileorganic compounds between gas and aerosol phases is driven by their (subcooled) liq-uid vapour pressures and the associated enthalpies of vaporisation, and their activitiesin the aqueous and hydrophobic phases, according to the equation:5
pi = xi fip◦i (1)
where poi is the subcooled liquid vapour pressure of component i at the temperature
of interest, and xi is the mole fraction of organic compound i in the aqueous and/orhydrophobic phases. The activity coefficient f is relative to a pure liquid referencestate (i.e., fi=1.0 when xi=1.0). Consequently, values of fi for semi-volatile, water10
soluble, organic solutes in a largely aqueous aerosol will not approximate unity (aswould probably be the case if Eq. (1) were formulated using a Henry’s law constant)and may have very large values. These need to be taken into account in practicalcalculations, and in the UCD-CACM model are estimated using UNIFAC.
The thermodynamic properties of even the relatively small number of secondary15
compounds that have been identified in controlled laboratory experiments (e.g., Yuet al., 1999; Jaoui et al., 2005) have generally not been measured, and must there-fore be estimated using structure-based or other methods. In this work, which is acompanion paper to that of Clegg et al. (2007), hereafter referred to as Paper I, weexamine uncertainties in predictions of the sub-cooled liquid vapour pressures p◦
i that20
control the gas/aerosol partitioning of semi-volatile compounds. We also estimate thevapour pressures of the primary surrogate compounds in the UCD-CACM model, whichare currently assumed to be involatile, because there is evidence that high molecularweight hydrocarbons and other primary emissions are able to partition between gasand aerosol phases (Fraser et al., 1997, 1998).25
At least two approaches are possible: the first is to assess predictive methodsagainst reliable data for compounds of a similar molecular weight and functional groupcomposition to those of the secondary organic aerosol (SOA) compounds likely to oc-
11051
ACPD7, 11049–11089, 2007
Predictions of purecomponent vapour
pressures
S. L. Clegg et al.
Title Page
Abstract Introduction
Conclusions References
Tables Figures
J I
J I
Back Close
Full Screen / Esc
Printer-friendly Version
Interactive Discussion
EGU
cur in the atmosphere. The compounds are in many cases the products of oxidationand are likely to be highly polar, containing multiple –COOH and –OH groups for exam-ple. While such a study is now being carried out (M. Barley, personal communication),and see also Camredon and Aumont (2006), there are very few data for such com-pounds especially in the sub-cooled liquid state that is thought to apply to atmospheric5
aerosols. An alternative, complementary, approach which we adopt is to apply currentpredictive methods to both the surrogate organic compounds in the UCD-CACM modeland the reaction products they represent. This enables us (i) to establish approximateranges of uncertainty of the vapour pressures of compounds present in the model;(ii) to assess the further approximations inherent in grouping multiple compounds into10
surrogates to which single values of fi and p◦i are applied and, (iii) to determine (in
Paper I) the significance of uncertainties in terms of gas/aerosol partitioning and SOAformation.
The results are relevant, first, to the general development of atmospheric aerosolmodels based upon an explicit chemistry and corresponding to Fig. 1 in Paper I, high-15
lighting particular areas in which a better quantitative understanding of the physicalchemistry is needed. Second, they identify elements of the UCD-CACM model onwhich future work is likely to focus.
2 The organic compounds and surrogates
The Caltech Atmospheric Chemistry Mechanism is used to describe the photochemical20
reactions in the atmosphere including the formation of semi-volatile products leadingto the production of secondary organic aerosol. The modelled system consists of 139gas-phase species participating in 349 chemical reactions, and inorganic ions, gases,and solids (Griffin et al., 2002). For the purpose of calculating gas/aerosol partitioning,the semi-volatile species generated by chemical reaction, and capable of forming SOA,25
are combined into a set of 10 surrogate species A1-5 and B1-5 (Griffin et al., 2003).We note that the structure of compound B5 (S10 in Fig. 1 of Griffin et al.) has been
11052
ACPD7, 11049–11089, 2007
Predictions of purecomponent vapour
pressures
S. L. Clegg et al.
Title Page
Abstract Introduction
Conclusions References
Tables Figures
J I
J I
Back Close
Full Screen / Esc
Printer-friendly Version
Interactive Discussion
EGU
corrected as described by Griffin et al. (2005), and is shown in Fig. 22 of Paper I. Thereare, in addition, 8 primary organic hydrocarbon surrogate compounds (P1-8).
3 Vapour pressures
In the UCD-CACM model, subcooled vapour pressures of secondary organic surro-gates A1-5 and B1-5 are estimated by the method of Myrdal and Yalkowsky (1997).5
This uses the boiling temperature at atmospheric pressure (Tb), the entropy of boil-
ing (∆Sb), and the heat capacity change upon boiling (∆C(gl )p ). The normal boiling
points used in previous applications of the UCD-CACM model were obtained eitherfrom measurements or using the estimation software of Advanced Chemistry Devel-opments (ACD) which is described in a manuscript by Kolovanov and Petrauskas (un-10
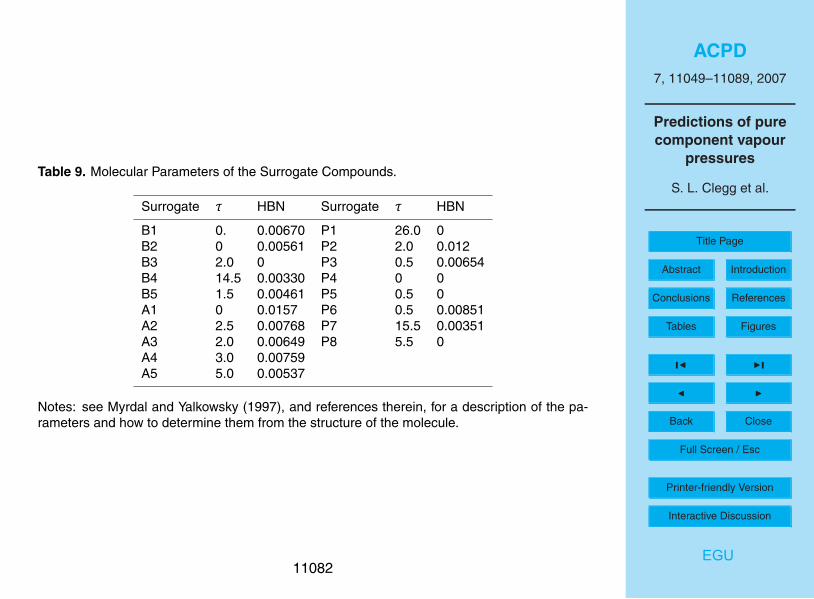
dated), (B. L. Hemming, personal communication). Estimates of ∆Sb are obtainedfrom the molecular structure and are expressed in terms of the numbers of torsionalbonds (τ, Eq. 8 of Myrdal and Yalkowsky) and a hydrogen bonding term HBN (theirEq. 9). Values of τ used previously for some of the SOA surrogate compounds werein error. The correct values of τ and HBN, used in all calculations in this work, are15
given for the 8 primary and 10 semi-volatile surrogate compounds in the Appendix.The heat capacity change ∆C(gl )
p is expressed as a function of τ (Eq. 11 of Myrdal andYalkowsky). The overall accuracy of the method, assuming that the boiling temperatureTb is known, is dependent upon the accuracy of ∆Sb and the assumption that ∆C(gl )
p
varies little with temperature. The expressions for ∆Sb and ∆C(gl )p were obtained by20
Myrdal and Yalkowsky by fitting to experimental data for 297 compounds. From theirFig. 3 it is apparent that only 19 of the compounds have pressures <10−6 atm, 7 below10−8 atm, and 2 below 10−10 atm. For experimental vapour pressures less than 10−6
atm the residuals in the figure correspond to errors ranging from ×2.2 too high, to toolow by about a factor of 5.25
The accuracy of the method for the polar multifunctional compounds of interest to
11053
ACPD7, 11049–11089, 2007
Predictions of purecomponent vapour
pressures
S. L. Clegg et al.
Title Page
Abstract Introduction
Conclusions References
Tables Figures
J I
J I
Back Close
Full Screen / Esc
Printer-friendly Version
Interactive Discussion
EGU
atmospheric chemists, and represented by surrogates here, is hard to establish dueto the lack of data. However, it seems certain to be very much poorer than the 23%obtained by Myrdal and Yalkowsky with a test data set of compounds not used in theirfit, even without taking into account the fact that the boiling temperatures have to beestimated here. The test data used by Myrdal and Yalkowsky consisted of a group of 195
compounds which, though structurally diverse, are mostly mono-functional. Measuredpressures, with one exception, range from 10−1.02 to 10−2.99 atmospheres. Thesevalues are orders of magnitude greater than those of the semi-volatile compounds ofinterest in this study. Errors in the vapour pressures predicted by Myrdal and Yalkowskyranged from 0 to a factor of 2.45 for the test data set.10
We note that Zhao et al. (1999) later proposed an alternative expression for theentropy of boiling, and Sangvi and Yalkowsky (2006a) one for the heat capacity change.Neither have so far been evaluated for the prediction of vapour pressures. Our owntests, using data for multifunctional alcohols, suggest that the original HBN term ofMyrdal and Yalkowsky (1997) is preferable to the equivalent used in Eq. (5) of Zhao15
et al. (1999) because, first, the hydrogen bonding effect (which acts to lower vapourpressure) is reduced as molecular mass increases. This is realistic: the effect of an–OH or –COOH group on the vapour pressure of a very large molecule, with manycarbon atoms, is less than on a small molecule. Second, the effect of adding furtherpolar groups results in a less than linear increase in the hydrogen bonding influence20
on the predicted entropy of boiling.The effect of molecular structure and functional group composition on vapour pres-
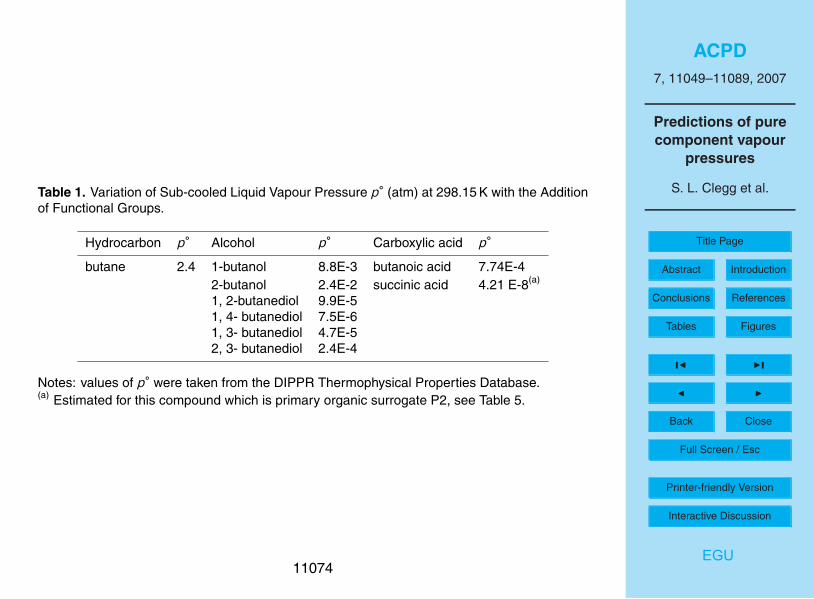
sure is very important. Table 1 lists vapour pressures for butane and related C4 alcoholsand carboxylic acids. The addition of first one, and then two polar functional groupsto the butane molecule results in a lowering of p◦ by orders of magnitude. The posi-25
tions of the groups on the molecule make a large difference, by more than an order ofmagnitude in some of the examples shown.
In this work we compare estimates of subcooled liquid vapour pressures p◦ and en-thalpies of vaporisation ∆Ho
vap for the semi-volatile surrogate compounds using: (i) the
11054
ACPD7, 11049–11089, 2007
Predictions of purecomponent vapour
pressures
S. L. Clegg et al.
Title Page
Abstract Introduction
Conclusions References
Tables Figures
J I
J I
Back Close
Full Screen / Esc
Printer-friendly Version
Interactive Discussion
EGU
Myrdal and Yalkowsky (1997) method combined with a range of current techniques forpredicting the boiling points Tb, (ii) the UNIFAC-based method of Asher and Pankow(2006) and Asher et al. (2002), and (iii) the approach of Nannoolal (2007) which is anextension of the boiling point method of Nannoolal et al. (2004). The 8 primary hydro-carbons in the UCD-CACM model (which are currently assumed to be involatile) are5
included in these comparisons. Vapour pressures calculated for the 38 semi-volatilecompounds assigned to the semi-volatile surrogates in the UCD-CACM model are alsocompared to those for the surrogates themselves. Finally, the effects of uncertaintiesin the values of p◦ of water-soluble compounds are examined using simple partitioningcalculations for a range of atmospheric liquid water contents.10
3.1 Estimation of normal boiling points
The boiling points of all the surrogate compounds are unknown, with the exceptionof primary hydrocarbon surrogate P4. Most values used in the UCD-CACM modelto date have been estimated using the ACD software package ACDLabs 8.0. Herewe compare boiling temperatures Tb estimated using eight selected predictive meth-15
ods, whose characteristics and claimed accuracy are summarised in the Appendix(Nannoolal et al., 2004; Cordes and Rarey, 2002; Wen and Qiang, 2002a, b; Marrero-Morejon and Pardillo-Fontdevila, 1999; Stein and Brown, 1994; Constantinou and Gani,1994; Joback and Reid, 1987; Advanced Chemistry Developments (Kolovanov andPetrauskas, undated)). The methods are based upon molecular structure. With the20
exception of the ACD method, all calculations have been carried out using softwareavailable from DDBST Software and Separation Technology GmbH. This also providessummaries of the accuracies of the methods, based upon comparisons with all theavailable normal boiling points in the Dortmund Data Bank. Note that no values areyet available for the method of Wen and Qiang (2002a, b). These summaries are pre-25
sented as average absolute deviations in Tb for each class of compounds (defined interms of the functional group(s) and types of bonds present) to which the compoundof interest belongs. Many molecules, including those considered here, fall into several
11055
ACPD7, 11049–11089, 2007
Predictions of purecomponent vapour
pressures
S. L. Clegg et al.
Title Page
Abstract Introduction
Conclusions References
Tables Figures
J I
J I
Back Close
Full Screen / Esc
Printer-friendly Version
Interactive Discussion
EGU
classes. In these cases we follow the DDBST recommendation and take the largest er-ror listed as being representative, but recognise that for multifunctional compounds theerrors for each class to which the compound belongs are likely to be additive to somedegree. The ACD method provides an error estimate with each predicted Tb value. Itis not clear how this is obtained.5
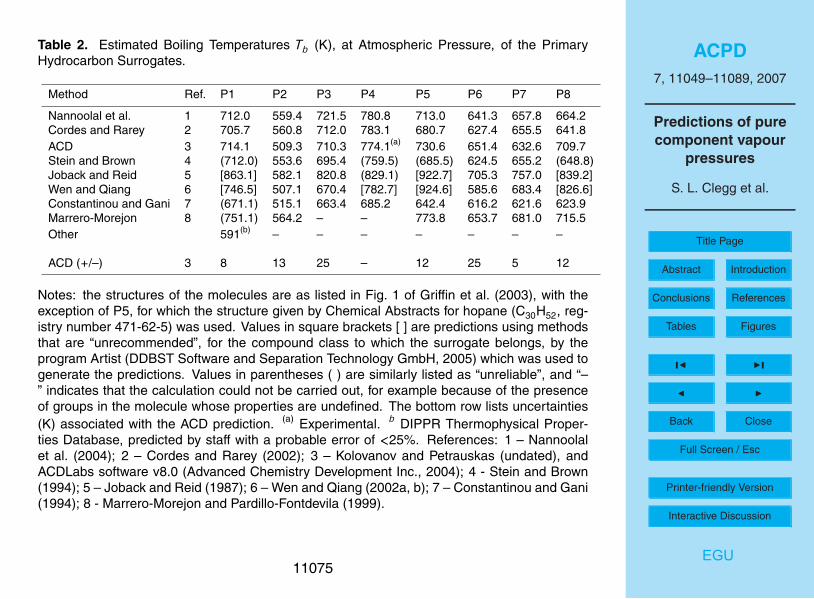
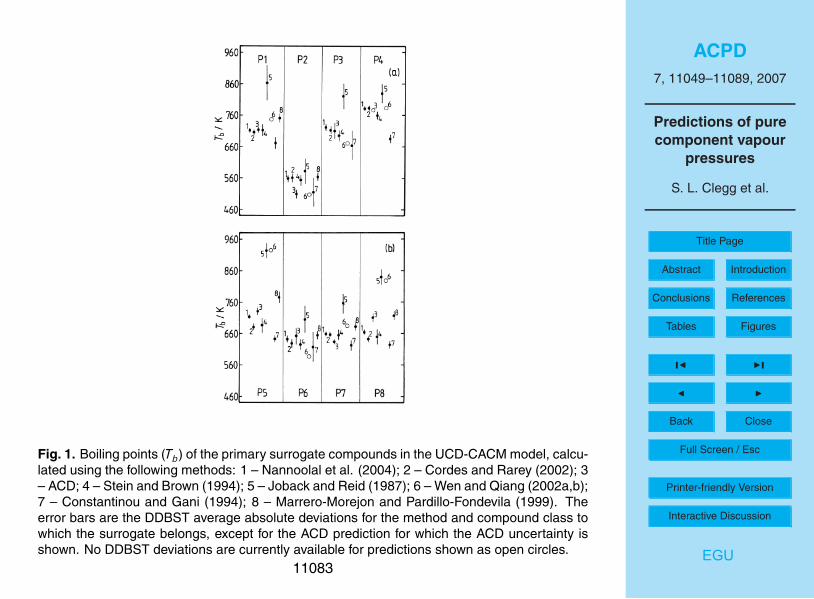
Estimated boiling points for the primary hydrocarbons are listed in Table 2, andshown in Fig. 1. Many of the estimates of Tb disagree by more than would be ex-pected from the average absolute deviations (provided by the DDBST software, asnoted above) which are also shown.
The ACD predictions, and those of the methods of Cordes and Rarey (2002) and10
of Nannoolal et al. (2004), agree within the quoted uncertainties of the methods forsurrogates P1, P3, P4 and P6. The earliest method, that of Joback and Reid (1987),yields much higher Tb than the other methods in almost all cases. Values from themethod of Wen and Qiang (2002a, b) are also very high for P5 and P8. Excluding thepredictions from these two methods, quite large differences are also found for succinic15
acid (P2) and for poly-substituted decalin (P8). For succinic acid this is not surprising,as these and other prediction methods are generally least satisfactory for multifunc-tional compounds, particularly those which are small – for which the functional groupsare likely to have the greatest influence on physical properties – or for molecules inwhich the groups are close enough to interact with one another. The vapour pressure20
p◦ of P2 (which is representative of dicarboxylic acids in the aerosol) can be estimatedindependently of the boiling points (see below), and the result suggests that the trueboiling point probably lies about midway between the two predictions. In the UCD-CACM model P8 represents a range mostly involatile hydrocarbon material found inaerosols, the composition of which is not well understood. The fact that this compound25
has a boiling point, and an estimated vapour pressure, similar to a number of the othercompounds here suggests that the structure chosen for P8 may need to be reconsid-ered.
If the predictions of the Joback and Reid (1987) method, all values for P8, and a few
11056
ACPD7, 11049–11089, 2007
Predictions of purecomponent vapour
pressures
S. L. Clegg et al.
Title Page
Abstract Introduction
Conclusions References
Tables Figures
J I
J I
Back Close
Full Screen / Esc
Printer-friendly Version
Interactive Discussion
EGU
individual estimates (P5 – Marrero-Morejon and Pardillo-Fontdevila; P4 – Constantinouand Gani) are ignored then most values of Tb in Table 2 fall within a range of about75 K or less. The methods that agree most closely are those of Nannoolal et al. (2004),ACD, and Stein and Brown (1994). (The method of Nannoolal et al. (2004) is a furtherdevelopment of that of Cordes and Rarey (2002), and the two give similar predictions.)5
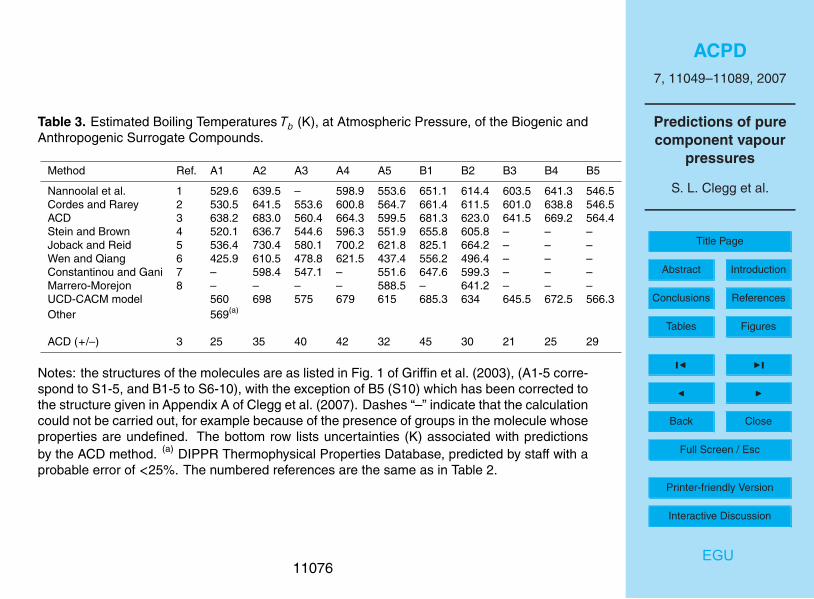
Estimated boiling points for the A and B surrogate compounds, including the valuesused in the UCD-CACM model code, are shown in Table 3 and in Fig. 2. It is notpossible to calculate Tb for some compounds using some of the methods, notably B3-5which contain the group –O–NO2. Nor are DDBST error estimates available for all com-pounds. The uncertainties associated with the ACD predictive method are significantly10
greater for these compounds than for the primary surrogates. However, except for A1,A4 and B3 the ACD predictions for the semi-volatile compounds are still consistent withthose using the Nannoolal et al. and Stein and Brown methods. For surrogates A1, A2,A4, A5 and B3 the values of Tb obtained using the ACD method, and that of Nannoolalet al., differ by amounts ranging from 9 K to over 100 K with the ACD predictions always15
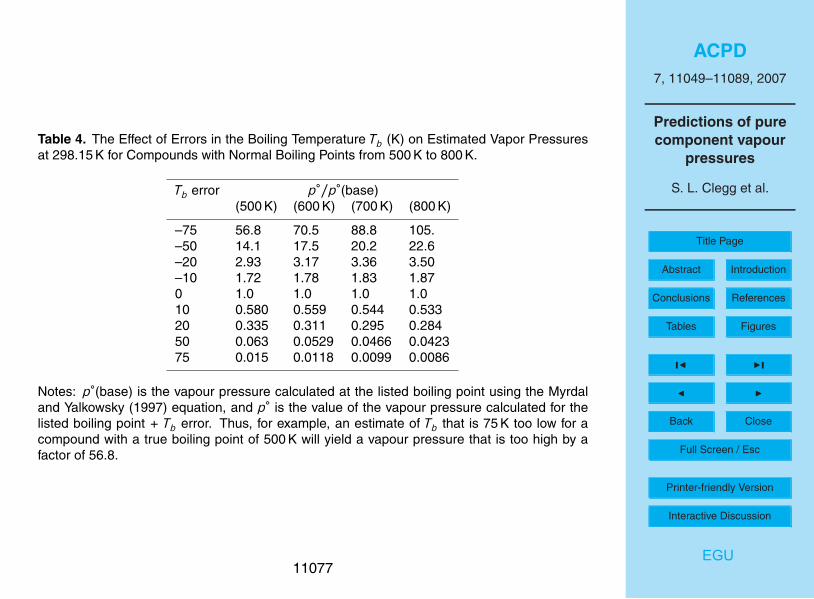
higher.The general influence of errors in the predicted Tb on calculations of p◦ at 298.15 K
using the Myrdal and Yalkowsky (1987) equation is illustrated in Table 4. This lists theratio of the predicted p◦ to the base p◦ (i.e., the value calculated using the Myrdal andYalkowsky equation for the Tb above each column) for assumed errors in Tb ranging20
from –75 K to +75 K. It can be seen that there is a dependence of the ratio on Tb forlarge errors. Variations in predicted Tb over ranges of 20 K to 50 K are typical for bothprimary and semi-volatile surrogate compounds, even ignoring the predicted Tb thatdeviate most. The error estimates for the ACD predictions range from ±5 K to ±45 K,see Tables 2 and 3, and while they are the most conservative they also appear to be the25
most realistic. The results in Table 4 show that these uncertainties are likely to resultin calculated p◦ which are incorrect by factors of about ×1.4 to ×20, without takinginto account additional errors associated with the use of the Myrdal and Yalkowskyequation. It will be seen in the following section that values of p◦ based on Tb estimated
11057
ACPD7, 11049–11089, 2007
Predictions of purecomponent vapour
pressures
S. L. Clegg et al.
Title Page
Abstract Introduction
Conclusions References
Tables Figures
J I
J I
Back Close
Full Screen / Esc
Printer-friendly Version
Interactive Discussion
EGU
by the methods considered here do indeed differ by similar or larger factors.
3.2 Predicted vapour pressures
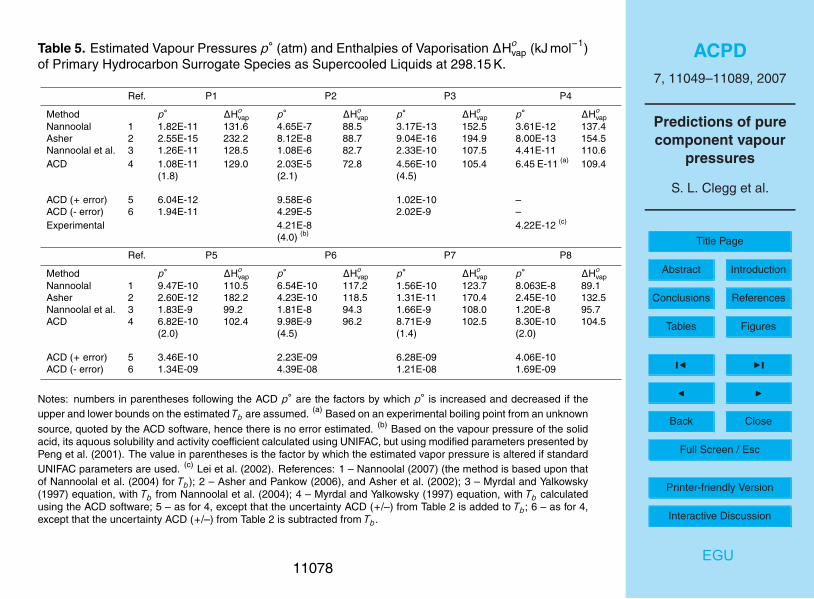
Estimated pure compound vapour pressures at 298.15 K for surrogate primary com-pounds P1 to P8 are shown in Table 5. The methods used are the Myrdal andYalkowsky model with boiling points from Nannoolal et al. (2004), ACD including val-5
ues based upon the upper and lower uncertainty limits of the predicted Tb, the UNIFACbased method of Asher and co-workers, and a recently completed extension of the boil-ing point method of Nannoolal et al. (2004) to predict p◦. All compounds have vapourpressures below the lower limit of validity of the ACD vapour pressure prediction model(0.001 mm Hg) in the ACDLabs software, and therefore that method is not used.10
We have included in Table 5 a value of p◦ for succinic acid (P2) derived from thevapour pressure of the solid (Ribeiro da Silva et al., 2001), its activity product in water(see Clegg and Seinfeld, 2006) and estimates of its activity coefficient from UNIFAC.For P4 an experimental value based upon gas chromatographic retention time wasobtained (Lei et al., 2002). Upper and lower limits for p◦, based upon the uncertainty15
in the ACD estimate of Tb, are listed in the table and are also expressed in terms ofan error factor in parentheses. Thus the Myrdal and Yalkowsky equation, using theACD Tb = 714.1 K for P1, yields a p◦ of 1.08×10⁻¹¹ atm for the supercooled liquid at298.15 K. Adding the uncertainty limit of ±8 K (Table 2), to obtain Tb = 722.1 K and Tb= 706.1 K, yields p◦ values that differ by a factor of 1.8 from the base prediction.20
The Nannoolal (2007) vapour pressure model, and the Myrdal and Yalkowskymethod with the ACD and Nannoolal et al. (2004) estimates of Tb, agree best for hydro-carbons P1, P5 and P8. In most cases the predictions of the UNIFAC-based approachare lower, in some instances by orders of magnitude. For P4 the experimentally de-termined vapour pressure agrees fairly closely with the result from Nannoolal vapour25
pressure model, and to within an order of magnitude with the Myrdal and Yalkowskyprediction based upon the experimental boiling point.
The value of p◦ estimated for succinic acid (P2) from the solubility of the solid in11058
ACPD7, 11049–11089, 2007
Predictions of purecomponent vapour
pressures
S. L. Clegg et al.
Title Page
Abstract Introduction
Conclusions References
Tables Figures
J I
J I
Back Close
Full Screen / Esc
Printer-friendly Version
Interactive Discussion
EGU
water and its vapour pressure (see Table 5) is lower than all the other values exceptthat from the model of Asher (Asher and Pankow, 2006). This acid was included in thedata set they used for fitting their model. We also note that the Myrdal and Yalkowskymethod, using an estimated Tb of 591 K from the DIPPR Thermophysical PropertiesDatabase, yields p◦ equal to 1.61×10⁻⁷ atm at 298.15 K. This agrees reasonably well5
with the value based upon the vapour pressure of the solid. It is unclear which of themany estimates of p◦ is more nearly correct.
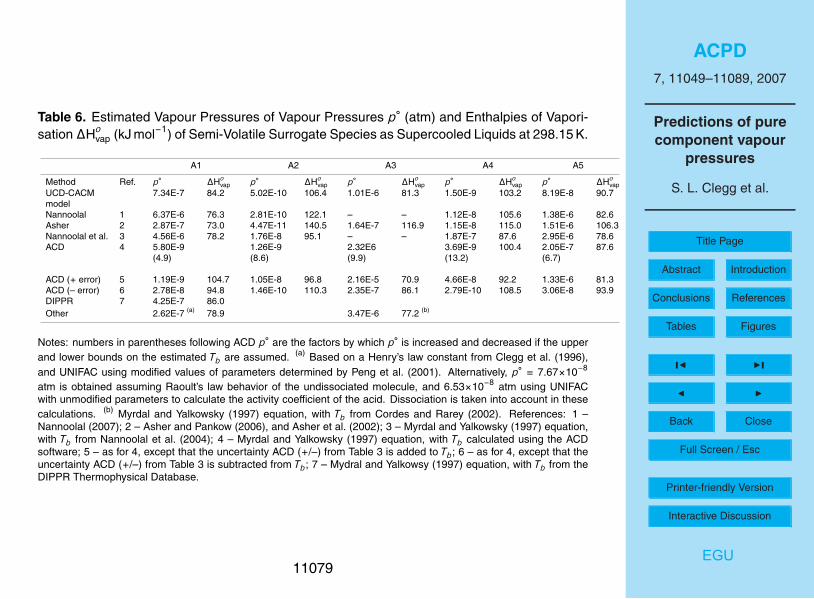
Estimated p◦ and values of ∆Hovap for the surrogate compounds treated as semi-
volatile in the UCD-CACM model are shown in Tables 6 and 7. For oxalic acid (A1) thereis also an estimate based upon the Henry’s law constant (Clegg et al., 1996), and a10
further value based on a predicted Tb taken from the DIPPR Thermophysical PropertiesDatabase. The vapour pressures, with the exception of the prediction based upon theACD boiling point, range between about 2×10⁻⁷ to 5×10⁻⁶ atm and agree reasonablywell. Previous work has suggested that oxalic acid will partition in the atmosphere suchthat significant amounts can occur in both the aerosol and gas phases, dependent15
upon atmospheric conditions (Clegg et al., 1996). The UNIFAC-based method is notapplicable to most of surrogates B1-5 because not all of the required structural groupsare defined. It also yields enthalpies of vaporization that are consistently greater thanthe other approaches.
Camredon and Aumont (2006) have assessed four structure-activity relationships for20
estimating p◦ against a database of experimental values. The methods assessed in-clude both the UNIFAC-based approach of Asher and co-workers, and also the Myrdaland Yalkowsky (1997) equation combined with the boiling point equation of Jobackand Reid (1987) which we have found yields significantly higher Tb than other methods(Figs. 1 and 2). Camredon and Aumont conclude that these two methods of estimat-25
ing p◦ were the most reliable for compounds with low vapour pressures, although theyalso found that values of p◦ predicted using the different methods could vary by factorsof greater than 100. These findings are broadly consistent with our results, althoughour calculations and the work of Stein and Brown (1994) suggests that the equation
11059
ACPD7, 11049–11089, 2007
Predictions of purecomponent vapour
pressures
S. L. Clegg et al.
Title Page
Abstract Introduction
Conclusions References
Tables Figures
J I
J I
Back Close
Full Screen / Esc
Printer-friendly Version
Interactive Discussion
EGU
of Joback and Reid does not yield the most accurate predictions of Tb. This is alsonoted by Camredon and Aumont, who did not use the work of Stein and Brown as itwas based upon many of the same data used in their assessment.
The range of vapour pressures obtained by the different methods, and shown inTables 5 to 7, exceed by a significant margin what would be expected from the uncer-5
tainties associated with each boiling point estimation and vapour pressure predictionmethod. This must be due partly to the fact that the models are fitted to data forgenerally much simpler molecules than those of interest here, which also have highervapour pressures (lower boiling points). The ranges of the calculated vapour pressuresin the tables, as factors p◦(highest)/p◦(lowest), are: 7.1×10³ [1.7] (P1), 482 [44] (P2),10
5.0×10⁵ [1.4× 10³] (P3), 80 [18] (P4), 704 [2.7] (P5), 43 [43] (P6), 665 [56] (P7), 329[329] (P8), 1098 [1098] (A1), 393 [63] (A2), 21 [2.3] (A3), 125 [125] (A4), 36 [36] (A5),130 [–] (B1), 16 [16] (B2), 19 [–] (B3), 20 [–] (B4) and 5.0 [–] (B5). The values in squarebrackets are factors which omit predictions of the UNIFAC-based method of Asher, andare in many cases smaller. However, it is unclear whether the greater consistency of15
the predictions of the other methods is because of higher accuracy or because of theirsimilarity (being based upon boiling points). The ranges are largest for the primaryhydrocarbons, which are assumed to be non-volatile in the UCD-CACM model.
The use of surrogate compounds allows gas/aerosol partitioning of the potentiallylarge number of semi-volatile products of gas phase reactions to be handled efficiently20
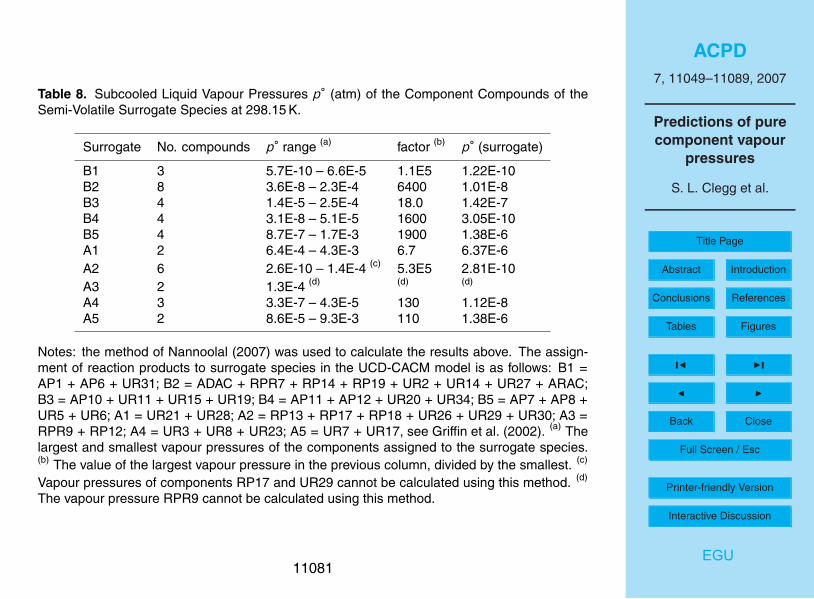
in atmospheric calculations. However, key properties – including vapour pressure - ofthe individual compounds making up each surrogate can also be evaluated, and shouldprobably be used in their assignment. Table 8 summarises the results of vapour pres-sure predictions for the 38 semi-volatile reaction products that make up surrogate com-pounds A1-5 and B1-5 in the UCD-CACM model, expressed as the range of calculated25
partial pressures of the component compounds assigned to each surrogate, and theestimated vapour pressures of the surrogates themselves. The ranges vary from abouta factor of 10 (i.e., the highest component vapour pressure divided by the smallest) toas much as 105. For some of the surrogate compounds the estimated vapour pres-
11060
ACPD7, 11049–11089, 2007
Predictions of purecomponent vapour
pressures
S. L. Clegg et al.
Title Page
Abstract Introduction
Conclusions References
Tables Figures
J I
J I
Back Close
Full Screen / Esc
Printer-friendly Version
Interactive Discussion
EGU
sures lie outside the ranges of p◦ of the component compounds, for the method usedin the calculations. This is clearly an important problem, and the assignment of surro-gate species and their properties needs to be considered carefully in the developmentof atmospheric models. It may be best to assign the p◦ of the surrogate species basedsimply upon averages of the estimates for the component compounds, giving weight to5
those that are atmospherically most important.Based on above comparisons, the vapour pressures of the semi-volatile surrogate
compounds are uncertain by an order of magnitude or greater in most cases. Vapourpressures are very sensitive to the types, numbers, and positions of the functionalgroups present. Consequently, the estimated vapour pressures of the compounds10
making up the surrogates cover very wide ranges, as shown in Table 8. In the UCD-CACM model the vapour pressures of several surrogate compounds have been ad-justed, based upon chamber measurements of SOA formation as described by Griffinet al. (2005). This is likely to be necessary for other atmospheric models of the sametype, given that predictive methods for vapour pressures of polar multifunctional com-15
pounds yield values that are subject to very large uncertainties, made greater by theneed to group compounds into surrogates.
3.3 Effects on partitioning
The impact of uncertainties in the vapour pressures on gas/aerosol partitioning de-pends on a number of factors: the activity coefficients of the organic species in the20
aerosol liquid phase (since pi=xi fipoi ), the total amounts of the organic compounds
per m3 of atmosphere, and the amounts of water (for the water-soluble organics) orprimary organic material into which the semi-volatile compounds may partition. Theprincipal water soluble surrogate compounds in the UCD-CACM model are A1-5 andB1-2 (see Paper I), which we attribute to the presence of polar groups –COOH and25
–OH. We have investigated the effects of uncertainties in p◦ for these compounds bycalculating their equilibrium partitioning, at 25◦C, into aerosol and cloud droplets with
11061
ACPD7, 11049–11089, 2007
Predictions of purecomponent vapour
pressures
S. L. Clegg et al.
Title Page
Abstract Introduction
Conclusions References
Tables Figures
J I
J I
Back Close
Full Screen / Esc
Printer-friendly Version
Interactive Discussion
EGU
liquid water contents ranging from 1×10⁻⁶ to 1.0 grams of liquid water per m3 of atmo-sphere. Starting from the equilibrium relationship above, we can write:
ng = xi fip◦i (273.15/T )(1/0.022414) (1a)
= [na/(gw/Mw + na)]fip◦i (273.15/T )(1/0.022414) (1b)
where ng is the number of moles of gas i in the vapour phase at equilibrium, na is the5
number of moles of i in the aerosol phase, gw (g m−3) is the amount of liquid waterin the aerosol phase, Mw (18.0152 g mol−1) is the molar mass of water, T (K) is theambient temperature and 0.022414 m3 mol−1 is the molar volume of an ideal gas atstandard temperature and pressure (273.15 K). Equation (1b) was solved to obtain naand ng for fixed total amounts of organic solute (nT , equal to na+ng). For the case10
where the amount of organic solute in the aerosol, na, is much less than gw /Mw , thenthe following equation for the partitioning can be written:
na/nT = 1/[1 + (Mw/gw )fip◦i (273.15/T )(1/0.022414)] (2a)
= 1/[1 + 803.75fi (p◦i/gw )(273.15/T )] (2b)
where na/nT is the fraction of the total amount of organic material per m3 that is present15
in the aerosol or cloud droplet liquid phase at equilibrium. In these calculations wehave used the total amounts (nT ) of each compound listed in Table 1 of Griffin etal. (2003). Values range from 0.1µg m−3 (4.6×10⁻¹⁰ mol m−3) for B5, to 5.5µg m−3
(1.8×10⁻⁸ mol m−3) for B4, and in most cases the approximate Eqs. (2a, b) apply evenat low RH (the smallest values of gw /Mw ).20
The results of the partitioning calculations are shown in Fig. 3 for the water solublesurrogate compounds, based upon the adjusted vapour pressures used in the UCD-CACM model. Below the x-axis of plot (b) the amounts of liquid water that are typi-cal of aerosols, clouds, and fogs are indicated. In the aerosol region, (gw<1×10⁻⁴ g
11062

ACPD7, 11049–11089, 2007
Predictions of purecomponent vapour
pressures
S. L. Clegg et al.
Title Page
Abstract Introduction
Conclusions References
Tables Figures
J I
J I
Back Close
Full Screen / Esc
Printer-friendly Version
Interactive Discussion
EGU
H2O m−3), the equivalent RH above an acid ammonium sulphate aerosol is marked,based upon a rough 1×10⁻⁴ g m−3 of liquid water for an urban environment at 90% RH.The partitioning calculations were carried out assuming fi=1.0 (Raoult’s law). How-ever, the results of other calculations of fi using UNIFAC which are discussed in PaperI suggest that actual values are much greater than this, in some cases by orders of5
magnitude. (Recall that these activity coefficients are for a reference state of the puresubcooled organic compound. Consequently values for dilute solutions in water aregenerally very different from unity.) The contours on each graph represent the calcu-lated na/nT for values of fip
◦i at logarithmic intervals of ×10. The effect of fi different
from unity can be estimated for any plotted partitioning curve from these contours. For10
example, the calculated value of the activity coefficient (fi ) of A2 in aqueous solutionis typically about 13 (Table 2 of Paper I), which would reduce the fraction of A2 in theaerosol phase from about 0.8 to less than 0.2 for an atmospheric liquid water contentof 10−6 g m−3 (Fig. 3b).
The results of the partitioning calculations for the water soluble surrogates, for differ-15
ent estimates of p◦, are shown in Figs. 4 and 5. For liquid water contents of >10−3 g m−3
all surrogates A, except perhaps A5, can be expected to be in the condensed phase.Above 0.01 g m−3 of water the partitioning is essentially complete for all water-solublecompounds. However, for aerosol liquid water contents of 10−4 g m−3 and below, thedifferences in partitioning associated with the uncertainties for each estimated p◦ are20
large. For example, even at 90% RH the differences between p◦ for A3 obtained withthe upper and lower limits of the boiling point estimated using the ACD method leadto na/nT ranging from 0.006 to almost 0.4. No compounds except A2 and perhaps B1are predicted to be mostly in the aerosol phase at moderate to low RH. As is shownin the atmospheric trajectory calculations in Paper I, most of the secondary organic25
material is A2, in large part because its value of p◦ implies that most A2 will be in theaerosol phase even at low RH (Fig. 5b). However, the figure also suggests that there isa large uncertainty associated with this p◦ estimate and a higher value – still within thepossible range – could result in significantly lower partitioning into the aerosol phase.
11063
ACPD7, 11049–11089, 2007
Predictions of purecomponent vapour
pressures
S. L. Clegg et al.
Title Page
Abstract Introduction
Conclusions References
Tables Figures
J I
J I
Back Close
Full Screen / Esc
Printer-friendly Version
Interactive Discussion
EGU
Based upon the summary of activity coefficients in Table 2 of Paper I for a trajectorycalculation using the UCD-CACM model, the effects of non-ideality are greatest forB2, B1 and A5, for which activity coefficients range from about 2485 (B2) to 131 (B1).Taking these values as typical, assuming an RH of 80%, and taking into account ad-justment factors of 1.4 (B2) and 1.5 (B1) (Griffin et al., 2005), the calculated partitioning5
of these compounds would change from na/nT≈50% to na/nT<0.1% for B2 and fromna/nT≈90% to na/nT≈20% for B1 in Figs. 4a, b. These rough calculations are basedupon the plotted lines for the values of the vapour pressures used in the UCD-CACMmodel (marked “1” on the figure) and the contours which indicate the effects of factorof 10 variations in fi p
◦i . In the trajectory calculation in Paper I the total aerosol liquid10
water at 80% RH and between 04:00 a.m. and 08:00 a.m. is about 13×10−6 g m−3, andna/nT for B1 and B2 are 0.24 and 5×10⁻⁴, respectively. These values are broadly con-sistent with those obtained from Fig. 4 as long as the activity coefficients are taken intoaccount. For A2, the dominant organic surrogate and for which the activity coefficient fiin the trajectory calculations is only about 13 (Table 2 of Paper I), na/nT is about 0.88 in15
the calculation, for the same water content, which is also consistent with the calculatedpartitioning shown in Fig. 5b.
A further feature of the plots in Figs. 4 and 5 worth noting is that log10(na/nT ) de-creases monotonically as log10(gw ) decreases. However, at zero RH, na/nT will havea small positive value if the total amount of organic compound present (nT ) exceeds20
(p◦/0.022414)(273.15/T ), otherwise na/nT will be zero. In the atmosphere it is foundthat even at very low RH, for which aerosols contain negligible amounts of water, con-siderable amounts of SOA tend to remain. Probable reasons for this include chemicalreactions in the aerosol that create compounds and oligomers that are essentially in-volatile. In the UCD-CACM model the effects of such reactions, still little known, are25
approximated by decreasing the subcooled liquid vapour pressures of some surrogatecompounds, as noted earlier. The effect of this is to shift the curves in Figs. 4 and 5upwards.
11064
ACPD7, 11049–11089, 2007
Predictions of purecomponent vapour
pressures
S. L. Clegg et al.
Title Page
Abstract Introduction
Conclusions References
Tables Figures
J I
J I
Back Close
Full Screen / Esc
Printer-friendly Version
Interactive Discussion
EGU
The conclusion to be drawn from these calculations is that the uncertainties in theestimated p◦ of the organic surrogates are large, and their effects on partitioning aresignificant for RH below 80–90%. Furthermore, given that most of the SOA compoundsare polar and multifunctional, and because of the limitations of current predictive meth-ods, these uncertainties seem likely to remain even as SOA composition becomes5
better known.We have not carried out calculations for the partitioning of the non-water-soluble
SOA species B3 to B5. These are expected to behave differently from the water solublecompounds in one important respect: there should be no variation of na/nT with RH,but rather with the total amount of organic material in the aerosol – which is largely P810
in the simulations carried out in Paper I.
4 Summary
The physical properties of polar multifunctional organic compounds, such as those thatmake up SOA, are among the most difficult to predict. The variations between thepredicted boiling points and vapour pressures of the eighteen compounds considered15
here are significantly greater than would be expected from the uncertainty analysespresented in the papers describing the different methods used. This appears to bebecause the comparisons are mainly based upon data for monofunctional compounds.
The boiling point methods that yield predictions that agree most closely are thoseof Nannoolal et al. (2004) which is a refinement of the approach of Cordes and Rarey20
(2002), the ACD method, and that of Stein and Brown (1994). The ACD approach tendsto yield higher values of Tb for the oxygenated SOA-forming surrogate compounds thanthe other methods, but not for the primary surrogate compounds P1-8.
The ACD predictor provides estimates of the errors associated with each calculatedvalue of Tb. These are larger than the average absolute deviations provided by the25
DDBST software, and also greater than the uncertainties associated with each methodas assessed by the authors. However, the comparisons shown in Figs. 1 and 2
11065
ACPD7, 11049–11089, 2007
Predictions of purecomponent vapour
pressures
S. L. Clegg et al.
Title Page
Abstract Introduction
Conclusions References
Tables Figures
J I
J I
Back Close
Full Screen / Esc
Printer-friendly Version
Interactive Discussion
EGU
suggest that the ACD error estimates are the most realistic. If they are assumed toapply to each of the preferred boiling point methods referred to above, the predictionsof these methods can be said to be consistent. The average absolute deviations inTb given by the DDBST software, for each compound class to the molecule of interestbelongs, are likely to be more reliable estimates of uncertainty than the values given5
in the papers describing the methods (and summarised in the Appendix), becausethey are based upon comparisons against all the boiling point data in the DortmundData Bank and are therefore much more broadly based. However, the results shownin Figs. 1 and 2 suggest that these estimates are still too low for the multi-functionalcompounds studied here.10
Vapour pressures at 298.15 K, calculated using predicted Tb and the Myrdal andYalkowsky (1997) equation, the UNIFAC-based approach of Asher (Asher and Pankow,2006; Asher et al., 2002), and the method of Nannoolal (2007), cover orders of mag-nitude for some of the compounds studied here (see Tables 5 to 7). The UNIFACbased approach yields the lowest p◦ for the primary surrogate compounds, and also15
the largest ∆Hovap. Although enthalpies of vaporisation have not been discussed in this
work, we note that values obtained using the UNIFAC-based method appear to be toohigh when compared with data for organic compounds of similar molar mass (from theDIPPR Thermophysical Database).
Experimentally based values of p◦ are available for surrogate compounds P2 (suc-20
cinic acid), P4 (benzo[ghi]perylene), and A1 (oxalic acid). In each case the vapourpressures calculated using the Myrdal and Yalkowsky equation (and Tb from the Nan-noolal et al. (2002) and ACD methods), and the Nannoolal (2007) model, agree towithin about a factor of ten. However, these three compounds are not representative ofthe range of potential semi-volatile organic compounds in the atmosphere, and further25
studies focusing on experimental data for multifunctional compounds are necessary.The differences between the values of p◦ obtained using the methods studied here
establish only an approximate uncertainty for the predictions. It is encouraging that thegroup of boiling point methods that have the lowest uncertainties (as assessed by the
11066
ACPD7, 11049–11089, 2007
Predictions of purecomponent vapour
pressures
S. L. Clegg et al.
Title Page
Abstract Introduction
Conclusions References
Tables Figures
J I
J I
Back Close
Full Screen / Esc
Printer-friendly Version
Interactive Discussion
EGU
DDBST software, and shown as error bars in Figs. 1 and 2) yield predictions that agreemost closely. However, the analogous agreement in p◦ may be misleading becauseall of the predictive methods for vapour pressure except that of Asher are based uponboiling points. The Myrdal and Yalkowsky equation should be assessed independentlyusing multi-functional compounds for which both boiling point and vapour pressure data5
are available.Calculations of gas/aerosol partitioning of those semi-volatile surrogate compounds
predicted to be water soluble (Paper I) are shown in Figs. 4 and 5 as a function of atmo-spheric liquid water content. The results indicate that both the uncertainty associatedwith each p◦ prediction, and the range of p◦ obtained with the different methods, imply10
large effects on partitioning at moderate to low RH – particularly for B1, A1, A2, A4 andA5. It seems likely that this will be true of other atmospheric organic compounds ofsimilar functionality. Calculations presented in Paper I suggest that the activity coeffi-cients fi of many of the water-soluble surrogate compounds have large values (rangingfrom about 1.0 for A1 to 2000 for B2 in water) and that these must taken into account15
when calculating equilibrium partitioning. (Values of fi greater than unity reduce theequilibrium partitioning of the compound into the aerosol.)
Experimental values of p◦ for butane and C4 alcohols and carboxylic acids shownin Table 1 demonstrate that p◦ is very sensitive to the type and number of functionalgroups present, and their position(s) on the molecule. For this reason the use of sur-20
rogate compounds to represent large numbers of semi-volatile reaction products inatmospheric models is a considerable approximation, because each surrogate mayrepresent a set of compounds with vapour pressures varying over orders of magni-tude (Table 8). This and other problems related to the vapour pressures and activitycoefficients of organic compounds, and their inclusion in the UCD-CACM model, are25
discussed in Paper I.
11067
ACPD7, 11049–11089, 2007
Predictions of purecomponent vapour
pressures
S. L. Clegg et al.
Title Page
Abstract Introduction
Conclusions References
Tables Figures
J I
J I
Back Close
Full Screen / Esc
Printer-friendly Version
Interactive Discussion
EGU
Appendix A
The vapour pressures of the surrogate compounds estimated using the Myrdal andYalkowsky (1997) equation, and listed in Tables 5–7, require boiling points at atmo-spheric pressure, a structural parameter τ, and a hydrogen bonding number HBN. Inearlier versions of the UCD-CACM model there were some errors in these parame-5
ters. The correct values are listed in Table 9. The characteristics of the boiling pointestimation methods used in this work are summarised below.
Joback and Reid (1987) correlated the normal boiling point, Tb, of organic com-pounds containing the elements C, H, O, N, S and the halogens according to: Tb =198.2 + Σinigi where gi (equal to ∆Tb(i )) is the increment value of group i and ni is the10
number of times the group occurs in the compound. Joback and Reid employed a setof 41 groups, and a database of 438 compounds, and their equation fitted the data withan average absolute error of 12.9 K and a 3.6% average error. Stein and Brown (1994)adopted the same approach, but used a much larger dataset of 4426 experimentalboiling points and increased the number of structural groups to 81. Predictions of Tb15
of 6584 compounds not used to develop the model yielded an average absolute errorof 20.4 K and a 4.3% average error, compared to a 15.5 K absolute error and 3.2%average error for the points that were fitted.
We note that Devotta and Rao (1992) have also modified the Joback and Reidmethod, mainly to improve the representation of boiling points of halogenated com-20
pounds. For the C, H, O, N compounds of interest here the method yields essentiallythe same values as that of Joback and Reid, and is not considered further.
The model of Constantinou and Gani (1994) is a group contribution approach usingsets of both first order and second order functional groups. The latter provide morestructural information about portions of the molecules which contain interacting groups,25
for which the first order group definitions alone were found to be insufficient. Theaccuracy of boiling predictions is given by the authors as an average absolute deviationof 5.35 K, compared to 12.9 K for the Joback and Reid method. This result is not broken
11068
ACPD7, 11049–11089, 2007
Predictions of purecomponent vapour
pressures
S. L. Clegg et al.
Title Page
Abstract Introduction
Conclusions References
Tables Figures
J I
J I
Back Close
Full Screen / Esc
Printer-friendly Version
Interactive Discussion
EGU
down by organic compound class.Marrero-Morejon and Pardillo-Fontdevila (1999) have implemented a group interac-
tion approach to predicting Tb and critical properties. The authors selected a set of39 structural groups – essentially the same set as Joback and Reid (1997), and thendetermined interaction values for pairs of groups by fitting to compiled property values5
for 507 pure compounds. Average absolute errors in Tb, for a test set of 98 compounds,was 5.22 K for the group interaction method, compared to 11.01 K for a simple groupcontribution approach analogous to that of Joback and Reid (1987). The authors note,however, that the method is relatively poor for alcohols, phenols and large heterocycliccompounds and for polyhydroxy alcohols (in common with most other models).10
Wen and Qiang (2002a) have developed a group vector space (GVS) method to pre-dict the melting and boiling points of compounds. This method, in which the structure ofthe hydrocarbon molecule is expressed in terms of the groups defined by Joback andReid (1987) and three topological graphs, is able to take into account functional groupposition without greatly increasing the number of model parameters or sub-groups. For15
a set of eight randomly selected test compounds the average percentage deviationin the predicted Tb was 0.74% compared to 2.4% for the Joback and Reid method.The method was later extended to include O, N, and S compounds (Wen and Qiang,2002b), again based upon group definitions of Joback and Reid. Average absolutedeviations in Tb range from about 10.6 K for aromatic hydrocarbons to 5.7 K for oxy-20
genated compounds and 3.36 K for aliphatic hydrocarbons. Comparisons in their Ta-ble 3 suggest that average absolute errors are about 1/2 of those obtained using theJoback and Reid method, and comparable with the methods of Constantinou and Gani(1994) and Marrero-Morejon and Pardillo-Fontdevila (1999).
The group contribution method of Cordes and Rarey (2002), which includes second25
order effects based upon the chemical neighborhood of each structural group, was fit-ted to data for 2500 compounds. In their Table 5, Cordes and Rarey compare meanabsolute deviations between measured and predicted Tb for 126 hydrocarbon com-pounds not included in the database. Values are generally comparable to, or lower
11069
ACPD7, 11049–11089, 2007
Predictions of purecomponent vapour
pressures
S. L. Clegg et al.
Title Page
Abstract Introduction
Conclusions References
Tables Figures
J I
J I
Back Close
Full Screen / Esc
Printer-friendly Version
Interactive Discussion
EGU
than, other methods and the approach appears to be successful over a wider range ofcompounds. Results are similar for comparisons involving alkanols, oxygenated hydro-carbons, and halogenated hydrocarbons (their Tables 6 to 8, respectively). The work ofNannoolal et al. (2004) is a refinement of the Cordes and Rarey (2002) model, involvingsome further structural groups, a steric parameter, and the removal of some erroneous5
values from the database. Nannoolal et al. compare the results of their model with sixothers in their Tables 6, 7, and 11–14. This method, together with the ACD predictionsoftware, is the primary one used here.
The ACD method is based upon the use of a function of boiling point which is linear,and additive with respect to other molar properties (Kolovanov and Petrauskas, un-10
dated). In comparisons with over 6000 boiling points (not broken down by compoundclass) it was found that predictions were usually within 5 K of the true values, thoughthe largest deviations (only for a very few compounds) were as much as 45 K. The ACDmethod also yields an expected error as a part of the prediction. It is used by the Chem-ical Abstracts service of the American Chemical Society to provide estimated boiling15
points when no experimental values are available. The errors in ACD predictions aretypically about one third of those obtained using the method of Joback and Reid (1987),suggesting an accuracy comparable to the model of Nannoolal et al. (2004).
Acknowledgements. This research was supported by U.S. Environmental Protection Agencygrant RD-831082 and Cooperative Agreement CR-831194001, by the Natural Environment20
Research Council of the U.K. (as a part of the Tropospheric Organic Chemistry Experiment,TORCH) and by the European Commission as part of EUCAARI (European Integrated Projecton Aerosol Cloud, Climate and Air Quality Interactions). The work has not been subject to theU.S. EPA’s peer and policy review, and does not necessarily reflect the views of the Agency andno official endorsement should be inferred. The authors would like to thank the Atmospheric25
Sciences Modelling Division (ASMD) of U.S. EPA for hosting S. L. Clegg while carrying out thisstudy, and P. Bhave and other ASMD members for helpful discussions.
11070
ACPD7, 11049–11089, 2007
Predictions of purecomponent vapour
pressures
S. L. Clegg et al.
Title Page
Abstract Introduction
Conclusions References
Tables Figures
J I
J I
Back Close
Full Screen / Esc
Printer-friendly Version
Interactive Discussion
EGU
References
Asher, W. E. and Pankow, J. F.: Vapour pressure prediction for alkenoic and aromatic organiccompounds by a UNIFAC-based group contribution method, Atmos. Environ., 40, 3588–3600, 2006.
Asher, W. E., Pankow, J. F., Erdakos, G. B., and Seinfeld, J. H.: Estimating the vapour pressures5
of multi-functional oxygen-containing organic compounds using group contribution methods,Atmos. Environ., 36, 1483–1498, 2002.
Camredon, M. and Aumont, B.: Assessment of vapour pressure estimation methods for sec-ondary organic aerosol modeling, Atmos. Environ., 40, 2105–2116, 2006.
Clegg, S. L., Brimblecombe, P., and Khan, I.: The Henry’s law constant of oxalic acid and its10
partitioning into the atmospheric aerosol, Idojaras, 100, 51–68, 1996.Clegg, S. L., Kleeman, M. J., Griffin, R. J., and Seinfeld, J. H.: Effects of uncertainties in the
thermodynamic properties of aerosol components in an air quality model. I. Treatment ofinorganic electrolytes and and organic compounds in the condensed phase, Atmos. Chem.Phys. Discuss., 7, 10 971–11 047, 2007.15
Clegg, S. L. and Seinfeld, J. H.: Thermodynamic models of aqueous solutions containing in-organic electrolytes and dicarboxylic acids at 298.15 K. II. Systems including dissociationequilibria, J. Phys. Chem. A, 110, 5718–5734, 2006.
Constantinou, L. and Gani, R.: New group contribution method for estimating properties of purecompounds, AIChE J., 40, 1697–1710, 1994.20
Cordes, W. and Rarey, J.: A new method for the estimation of the normal boiling point ofnonelectrolyte organic compounds, Fluid Phase Equilibria, 201, 409–433, 2002.
Devotta, S. and Rao, P. V.: Modified Joback group contribution method for normal boiling pointof aliphatic halogenated compounds, Ind. Eng. Chem. Res., 31, 2042–2046, 1992.
Fraser, M. P., Cass, G. R., Simoneit, B. R. T., and Rasmussen, R. A.: Air quality model evalu-25
ation data for organics. 4. C2 – C36 non-aromatic hydrocarbons, Environ. Sci. Technol., 31,2356–2367, 1997.
Fraser, M. P., Cass, G. R., Simoneit, B. R. T., and Rasmussen, R. A.: Air quality model evalu-ation data for organics. 5. C6 – C22 non-polar and semipolar aromatic compounds, Environ.Sci. Technol., 32, 1760–1770, 1998.30
Griffin, R. J., Dabdub, D., and Seinfeld, J. H.: Secondary organic aerosol – 1. Atmosphericchemical mechanism for production of molecular constituents, J. Geophys. Res., 107(D17),
11071
ACPD7, 11049–11089, 2007
Predictions of purecomponent vapour
pressures
S. L. Clegg et al.
Title Page
Abstract Introduction
Conclusions References
Tables Figures
J I
J I
Back Close
Full Screen / Esc
Printer-friendly Version
Interactive Discussion
EGU
4332, doi:10.1029/2001JD000541, 2002.Griffin, R. J., Dabdub, D., and Seinfeld, J. H.: Development and initial evaluation of a dynamic
species-resolved model for gas phase chemistry and size-resolved gas/particle partitioningassociated with secondary organic aerosol formation, J. Geophys. Res., 110(D5), 05304,doi:10.1029/2004JD005219, 2005.5
Griffin, R. J., Nguyen, K., Dabdub, D., and Seinfeld, J. H.: A coupled hydrophobic-hydrophilicmodel for predicting secondary organic aerosol formation, J. Atmos. Chem., 44, 171–190,2003.
Jaoui, M., Kleindienst, T. E., Lewandowski, M., Offenburg, J. H., and Edney, E. O.: Identificationand quantification of aerosol polar oxygenated compounds bearing carboxylic or hydroxyl10
groups. 2. Organic tracer compounds from monoterpenes, Environ. Sci. Technol., 39, 5661–5673, 2005.
Joback, K. G. and Reid, R. C.: Estimation of pure component properties from group contribu-tions, Chem. Eng. Commun., 57, 233–243, 1987.
Kleeman, M. J., Hughes, L. S., Allen, J. O., and Cass, G. R.: Source contributions to the size15
and composition distribution of atmospheric particles: Southern California in September,1996, Environ. Sci. Technol., 33, 4331–4341, 1999.
Kolovanov, E. and Petrauskas, A.: Towards the maximum accuracy for boiling point prediction,Undated ms.
Lei, Y. D., Chankalal, R., Cahn, A., and Wania, F.: Supercooled liquid vapour pressures of the20
polycyclic aromatic hydrocarbons, J. Chem. Eng. Data, 47, 801–806, 2002.Marrero-Morejon, J. and Pardillo-Fontdevila, E.: Estimation of pure compound properties using
group-interaction contributions, AIChE J., 45, 615–621, 1999.Myrdal, P. B. and Yalkowsky, S. H.: Estimating pure component vapour pressures of complex
organic molecules, Ind. Eng. Chem. Res., 36, 2494–2499, 1997.25
Nannoolal, Y.: Development and critical evaluation of group contribution methods for the es-timation of critical properties, liquid vapour pressure and liquid viscosity of organic com-pounds. Ph.D Thesis, University of Kwazulu-Natal, 2007.
Nannoolal, Y., Rarey, J., Cordes, W., and Ramjugernath, D.: Estimation of pure componentproperties: Part 1. Estimation of the normal boiling point of non-electrolyte organic com-30
pounds via group contributions and group interactions, Fluid Phase Equilibria, 226, 45–63,2004.
Peng, C., Chan, M. N., and Chan, C. K.: The hydgroscopic properties of dicarboxylic and
11072
ACPD7, 11049–11089, 2007
Predictions of purecomponent vapour
pressures
S. L. Clegg et al.
Title Page
Abstract Introduction
Conclusions References
Tables Figures
J I
J I
Back Close
Full Screen / Esc
Printer-friendly Version
Interactive Discussion
EGU
multifunctional acids: measurements and UNIFAC predictions. Environ. Sci. Technol., 35,4495-4501, 2001.
Ribeiro da Silva, M. A. V., Monte, M. J. S., and Ribeiro, J. R.: Thermodynamic study on thesublimation of succinic acid and methyl- and dimethyl-substituted succinic and glutaric acids,J. Chem. Thermo., 33, 23–31, 2001.5
Sanghvi, R. and Yalkowsky, S. H.: Estimation of heat capacity of boiling of organic compounds,Ind. Eng. Chem. Res., 45, 451–453, 2006a.
Sanghvi, R. and Yalkowsky, S. H.: Estimation of normal boiling point of organic compounds,Ind. Eng. Chem. Res., 45, 2856–2861, 2006b.
Stein, S. E. and Brown, R. L.: Estimation of normal boiling points from group contributions, J.10
Chem. Inf. Comput. Sci., 34, 581–587, 1994.Wen, X. and Qiang, Y.: Group vector space (GVS) method for estimating boiling and melting
points of hydrocarbons, J. Chem. Eng. Data, 47, 286–288, 2002a.Wen, X. and Qiang, Y.: Group vector space method for estimating boiling and melting points of
organic compounds, Ind. Eng. Chem. Res., 41, 5534–5537, 2002b.15
Yu, J., Cocker III, D. R., Griffin, R. J., Flagan, R. C., and Seinfeld, J. H.: Gas-phase oxidation ofmonoterpenes: gaseous and particulate products, J. Atmos. Chem., 34, 207–258, 1999.
Zhao, L., Li, P., and Yalkowsky, S. H.: Predicting the entropy of boiling for organic compounds,J. Chem. Inf. Comput. Sci., 39, 1112–1116, 1999.
11073
ACPD7, 11049–11089, 2007
Predictions of purecomponent vapour
pressures
S. L. Clegg et al.
Title Page
Abstract Introduction
Conclusions References
Tables Figures
J I
J I
Back Close
Full Screen / Esc
Printer-friendly Version
Interactive Discussion
EGU
Table 1. Variation of Sub-cooled Liquid Vapour Pressure p◦ (atm) at 298.15 K with the Additionof Functional Groups.
Hydrocarbon p◦ Alcohol p◦ Carboxylic acid p◦
butane 2.4 1-butanol 8.8E-3 butanoic acid 7.74E-42-butanol 2.4E-2 succinic acid 4.21 E-8(a)
1, 2-butanediol 9.9E-51, 4- butanediol 7.5E-61, 3- butanediol 4.7E-52, 3- butanediol 2.4E-4
Notes: values of p◦ were taken from the DIPPR Thermophysical Properties Database.(a) Estimated for this compound which is primary organic surrogate P2, see Table 5.
11074
ACPD7, 11049–11089, 2007
Predictions of purecomponent vapour
pressures
S. L. Clegg et al.
Title Page
Abstract Introduction
Conclusions References
Tables Figures
J I
J I
Back Close
Full Screen / Esc
Printer-friendly Version
Interactive Discussion
EGU
Table 2. Estimated Boiling Temperatures Tb (K), at Atmospheric Pressure, of the PrimaryHydrocarbon Surrogates.
Method Ref. P1 P2 P3 P4 P5 P6 P7 P8
Nannoolal et al. 1 712.0 559.4 721.5 780.8 713.0 641.3 657.8 664.2Cordes and Rarey 2 705.7 560.8 712.0 783.1 680.7 627.4 655.5 641.8ACD 3 714.1 509.3 710.3 774.1(a) 730.6 651.4 632.6 709.7Stein and Brown 4 (712.0) 553.6 695.4 (759.5) (685.5) 624.5 655.2 (648.8)Joback and Reid 5 [863.1] 582.1 820.8 (829.1) [922.7] 705.3 757.0 [839.2]Wen and Qiang 6 [746.5] 507.1 670.4 [782.7] [924.6] 585.6 683.4 [826.6]Constantinou and Gani 7 (671.1) 515.1 663.4 685.2 642.4 616.2 621.6 623.9Marrero-Morejon 8 (751.1) 564.2 – – 773.8 653.7 681.0 715.5Other 591(b) – – – – – – –
ACD (+/–) 3 8 13 25 – 12 25 5 12
Notes: the structures of the molecules are as listed in Fig. 1 of Griffin et al. (2003), with theexception of P5, for which the structure given by Chemical Abstracts for hopane (C30H52, reg-istry number 471-62-5) was used. Values in square brackets [ ] are predictions using methodsthat are “unrecommended”, for the compound class to which the surrogate belongs, by theprogram Artist (DDBST Software and Separation Technology GmbH, 2005) which was used togenerate the predictions. Values in parentheses ( ) are similarly listed as “unreliable”, and “–” indicates that the calculation could not be carried out, for example because of the presenceof groups in the molecule whose properties are undefined. The bottom row lists uncertainties(K) associated with the ACD prediction. (a) Experimental. b DIPPR Thermophysical Proper-ties Database, predicted by staff with a probable error of <25%. References: 1 – Nannoolalet al. (2004); 2 – Cordes and Rarey (2002); 3 – Kolovanov and Petrauskas (undated), andACDLabs software v8.0 (Advanced Chemistry Development Inc., 2004); 4 - Stein and Brown(1994); 5 – Joback and Reid (1987); 6 – Wen and Qiang (2002a, b); 7 – Constantinou and Gani(1994); 8 - Marrero-Morejon and Pardillo-Fontdevila (1999).
11075
ACPD7, 11049–11089, 2007
Predictions of purecomponent vapour
pressures
S. L. Clegg et al.
Title Page
Abstract Introduction
Conclusions References
Tables Figures
J I
J I
Back Close
Full Screen / Esc
Printer-friendly Version
Interactive Discussion
EGU
Table 3. Estimated Boiling Temperatures Tb (K), at Atmospheric Pressure, of the Biogenic andAnthropogenic Surrogate Compounds.
Method Ref. A1 A2 A3 A4 A5 B1 B2 B3 B4 B5
Nannoolal et al. 1 529.6 639.5 – 598.9 553.6 651.1 614.4 603.5 641.3 546.5Cordes and Rarey 2 530.5 641.5 553.6 600.8 564.7 661.4 611.5 601.0 638.8 546.5ACD 3 638.2 683.0 560.4 664.3 599.5 681.3 623.0 641.5 669.2 564.4Stein and Brown 4 520.1 636.7 544.6 596.3 551.9 655.8 605.8 – – –Joback and Reid 5 536.4 730.4 580.1 700.2 621.8 825.1 664.2 – – –Wen and Qiang 6 425.9 610.5 478.8 621.5 437.4 556.2 496.4 – – –Constantinou and Gani 7 – 598.4 547.1 – 551.6 647.6 599.3 – – –Marrero-Morejon 8 – – – – 588.5 – 641.2 – – –UCD-CACM model 560 698 575 679 615 685.3 634 645.5 672.5 566.3Other 569(a)
ACD (+/–) 3 25 35 40 42 32 45 30 21 25 29
Notes: the structures of the molecules are as listed in Fig. 1 of Griffin et al. (2003), (A1-5 corre-spond to S1-5, and B1-5 to S6-10), with the exception of B5 (S10) which has been corrected tothe structure given in Appendix A of Clegg et al. (2007). Dashes “–” indicate that the calculationcould not be carried out, for example because of the presence of groups in the molecule whoseproperties are undefined. The bottom row lists uncertainties (K) associated with predictionsby the ACD method. (a) DIPPR Thermophysical Properties Database, predicted by staff with aprobable error of <25%. The numbered references are the same as in Table 2.
11076
ACPD7, 11049–11089, 2007
Predictions of purecomponent vapour
pressures
S. L. Clegg et al.
Title Page
Abstract Introduction
Conclusions References
Tables Figures
J I
J I
Back Close
Full Screen / Esc
Printer-friendly Version
Interactive Discussion
EGU
Table 4. The Effect of Errors in the Boiling Temperature Tb (K) on Estimated Vapor Pressuresat 298.15 K for Compounds with Normal Boiling Points from 500 K to 800 K.
Tb error p◦/p◦(base)(500 K) (600 K) (700 K) (800 K)
–75 56.8 70.5 88.8 105.–50 14.1 17.5 20.2 22.6–20 2.93 3.17 3.36 3.50–10 1.72 1.78 1.83 1.870 1.0 1.0 1.0 1.010 0.580 0.559 0.544 0.53320 0.335 0.311 0.295 0.28450 0.063 0.0529 0.0466 0.042375 0.015 0.0118 0.0099 0.0086
Notes: p◦(base) is the vapour pressure calculated at the listed boiling point using the Myrdaland Yalkowsky (1997) equation, and p◦ is the value of the vapour pressure calculated for thelisted boiling point + Tb error. Thus, for example, an estimate of Tb that is 75 K too low for acompound with a true boiling point of 500 K will yield a vapour pressure that is too high by afactor of 56.8.
11077
ACPD7, 11049–11089, 2007
Predictions of purecomponent vapour
pressures
S. L. Clegg et al.
Title Page
Abstract Introduction
Conclusions References
Tables Figures
J I
J I
Back Close
Full Screen / Esc
Printer-friendly Version
Interactive Discussion
EGU
Table 5. Estimated Vapour Pressures p◦ (atm) and Enthalpies of Vaporisation ∆Hovap (kJ mol−1)
of Primary Hydrocarbon Surrogate Species as Supercooled Liquids at 298.15 K.
Ref. P1 P2 P3 P4
Method p◦ ∆Hovap p◦ ∆Ho
vap p◦ ∆Hovap p◦ ∆Ho
vapNannoolal 1 1.82E-11 131.6 4.65E-7 88.5 3.17E-13 152.5 3.61E-12 137.4Asher 2 2.55E-15 232.2 8.12E-8 88.7 9.04E-16 194.9 8.00E-13 154.5Nannoolal et al. 3 1.26E-11 128.5 1.08E-6 82.7 2.33E-10 107.5 4.41E-11 110.6ACD 4 1.08E-11
(1.8)129.0 2.03E-5
(2.1)72.8 4.56E-10
(4.5)105.4 6.45 E-11 (a) 109.4
ACD (+ error) 5 6.04E-12 9.58E-6 1.02E-10 –ACD (- error) 6 1.94E-11 4.29E-5 2.02E-9 –Experimental 4.21E-8
(4.0) (b)4.22E-12 (c)
Ref. P5 P6 P7 P8
Method p◦ ∆Hovap p◦ ∆Ho
vap p◦ ∆Hovap p◦ ∆Ho
vapNannoolal 1 9.47E-10 110.5 6.54E-10 117.2 1.56E-10 123.7 8.063E-8 89.1Asher 2 2.60E-12 182.2 4.23E-10 118.5 1.31E-11 170.4 2.45E-10 132.5Nannoolal et al. 3 1.83E-9 99.2 1.81E-8 94.3 1.66E-9 108.0 1.20E-8 95.7ACD 4 6.82E-10
(2.0)102.4 9.98E-9
(4.5)96.2 8.71E-9
(1.4)102.5 8.30E-10
(2.0)104.5
ACD (+ error) 5 3.46E-10 2.23E-09 6.28E-09 4.06E-10ACD (- error) 6 1.34E-09 4.39E-08 1.21E-08 1.69E-09
Notes: numbers in parentheses following the ACD p◦ are the factors by which p◦ is increased and decreased if theupper and lower bounds on the estimated Tb are assumed. (a) Based on an experimental boiling point from an unknownsource, quoted by the ACD software, hence there is no error estimated. (b) Based on the vapour pressure of the solidacid, its aquous solubility and activity coefficient calculated using UNIFAC, but using modified parameters presented byPeng et al. (2001). The value in parentheses is the factor by which the estimated vapor pressure is altered if standardUNIFAC parameters are used. (c) Lei et al. (2002). References: 1 – Nannoolal (2007) (the method is based upon thatof Nannoolal et al. (2004) for Tb); 2 – Asher and Pankow (2006), and Asher et al. (2002); 3 – Myrdal and Yalkowsky(1997) equation, with Tb from Nannoolal et al. (2004); 4 – Myrdal and Yalkowsky (1997) equation, with Tb calculatedusing the ACD software; 5 – as for 4, except that the uncertainty ACD (+/–) from Table 2 is added to Tb; 6 – as for 4,except that the uncertainty ACD (+/–) from Table 2 is subtracted from Tb.
11078
ACPD7, 11049–11089, 2007
Predictions of purecomponent vapour
pressures
S. L. Clegg et al.
Title Page
Abstract Introduction
Conclusions References
Tables Figures
J I
J I
Back Close
Full Screen / Esc
Printer-friendly Version
Interactive Discussion
EGU
Table 6. Estimated Vapour Pressures of Vapour Pressures p◦ (atm) and Enthalpies of Vapori-sation ∆Ho
vap (kJ mol−1) of Semi-Volatile Surrogate Species as Supercooled Liquids at 298.15 K.
A1 A2 A3 A4 A5
Method Ref. p◦ ∆Hovap p◦ ∆Ho
vap p◦ ∆Hovap p◦ ∆Ho
vap p◦ ∆Hovap
UCD-CACMmodel
7.34E-7 84.2 5.02E-10 106.4 1.01E-6 81.3 1.50E-9 103.2 8.19E-8 90.7
Nannoolal 1 6.37E-6 76.3 2.81E-10 122.1 – – 1.12E-8 105.6 1.38E-6 82.6Asher 2 2.87E-7 73.0 4.47E-11 140.5 1.64E-7 116.9 1.15E-8 115.0 1.51E-6 106.3Nannoolal et al. 3 4.56E-6 78.2 1.76E-8 95.1 – – 1.87E-7 87.6 2.95E-6 78.6ACD 4 5.80E-9
(4.9)1.26E-9(8.6)
2.32E6(9.9)
3.69E-9(13.2)
100.4 2.05E-7(6.7)
87.6
ACD (+ error) 5 1.19E-9 104.7 1.05E-8 96.8 2.16E-5 70.9 4.66E-8 92.2 1.33E-6 81.3ACD (– error) 6 2.78E-8 94.8 1.46E-10 110.3 2.35E-7 86.1 2.79E-10 108.5 3.06E-8 93.9DIPPR 7 4.25E-7 86.0Other 2.62E-7 (a) 78.9 3.47E-6 77.2 (b)
Notes: numbers in parentheses following ACD p◦ are the factors by which p◦ is increased and decreased if the upperand lower bounds on the estimated Tb are assumed. (a) Based on a Henry’s law constant from Clegg et al. (1996),and UNIFAC using modified values of parameters determined by Peng et al. (2001). Alternatively, p◦ = 7.67×10⁻⁸
atm is obtained assuming Raoult’s law behavior of the undissociated molecule, and 6.53×10⁻⁸ atm using UNIFACwith unmodified parameters to calculate the activity coefficient of the acid. Dissociation is taken into account in thesecalculations. (b) Myrdal and Yalkowsky (1997) equation, with Tb from Cordes and Rarey (2002). References: 1 –Nannoolal (2007); 2 – Asher and Pankow (2006), and Asher et al. (2002); 3 – Myrdal and Yalkowsky (1997) equation,with Tb from Nannoolal et al. (2004); 4 – Myrdal and Yalkowsky (1997) equation, with Tb calculated using the ACDsoftware; 5 – as for 4, except that the uncertainty ACD (+/–) from Table 3 is added to Tb; 6 – as for 4, except that theuncertainty ACD (+/–) from Table 3 is subtracted from Tb; 7 – Mydral and Yalkowsy (1997) equation, with Tb from theDIPPR Thermophysical Database.
11079
ACPD7, 11049–11089, 2007
Predictions of purecomponent vapour
pressures
S. L. Clegg et al.
Title Page
Abstract Introduction
Conclusions References
Tables Figures
J I
J I
Back Close
Full Screen / Esc
Printer-friendly Version
Interactive Discussion
EGU
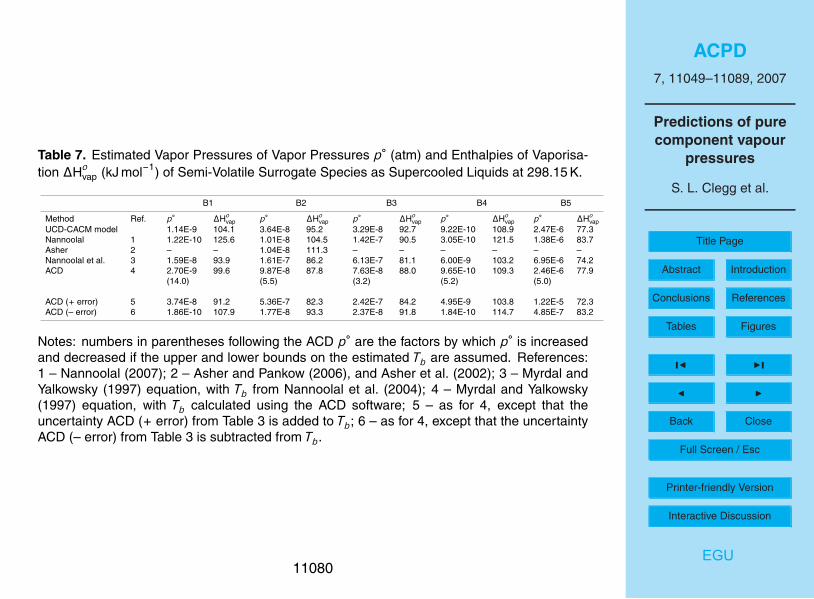
Table 7. Estimated Vapor Pressures of Vapor Pressures p◦ (atm) and Enthalpies of Vaporisa-tion ∆Ho
vap (kJ mol−1) of Semi-Volatile Surrogate Species as Supercooled Liquids at 298.15 K.
B1 B2 B3 B4 B5
Method Ref. p◦ ∆Hovap p◦ ∆Ho
vap p◦ ∆Hovap p◦ ∆Ho
vap p◦ ∆Hovap
UCD-CACM model 1.14E-9 104.1 3.64E-8 95.2 3.29E-8 92.7 9.22E-10 108.9 2.47E-6 77.3Nannoolal 1 1.22E-10 125.6 1.01E-8 104.5 1.42E-7 90.5 3.05E-10 121.5 1.38E-6 83.7Asher 2 – – 1.04E-8 111.3 – – – – – –Nannoolal et al. 3 1.59E-8 93.9 1.61E-7 86.2 6.13E-7 81.1 6.00E-9 103.2 6.95E-6 74.2ACD 4 2.70E-9
(14.0)99.6 9.87E-8
(5.5)87.8 7.63E-8
(3.2)88.0 9.65E-10
(5.2)109.3 2.46E-6
(5.0)77.9
ACD (+ error) 5 3.74E-8 91.2 5.36E-7 82.3 2.42E-7 84.2 4.95E-9 103.8 1.22E-5 72.3ACD (– error) 6 1.86E-10 107.9 1.77E-8 93.3 2.37E-8 91.8 1.84E-10 114.7 4.85E-7 83.2
Notes: numbers in parentheses following the ACD p◦ are the factors by which p◦ is increasedand decreased if the upper and lower bounds on the estimated Tb are assumed. References:1 – Nannoolal (2007); 2 – Asher and Pankow (2006), and Asher et al. (2002); 3 – Myrdal andYalkowsky (1997) equation, with Tb from Nannoolal et al. (2004); 4 – Myrdal and Yalkowsky(1997) equation, with Tb calculated using the ACD software; 5 – as for 4, except that theuncertainty ACD (+ error) from Table 3 is added to Tb; 6 – as for 4, except that the uncertaintyACD (– error) from Table 3 is subtracted from Tb.
11080
ACPD7, 11049–11089, 2007
Predictions of purecomponent vapour
pressures
S. L. Clegg et al.
Title Page
Abstract Introduction
Conclusions References
Tables Figures
J I
J I
Back Close
Full Screen / Esc
Printer-friendly Version
Interactive Discussion
EGU
Table 8. Subcooled Liquid Vapour Pressures p◦ (atm) of the Component Compounds of theSemi-Volatile Surrogate Species at 298.15 K.
Surrogate No. compounds p◦ range (a) factor (b) p◦ (surrogate)
B1 3 5.7E-10 – 6.6E-5 1.1E5 1.22E-10B2 8 3.6E-8 – 2.3E-4 6400 1.01E-8B3 4 1.4E-5 – 2.5E-4 18.0 1.42E-7B4 4 3.1E-8 – 5.1E-5 1600 3.05E-10B5 4 8.7E-7 – 1.7E-3 1900 1.38E-6A1 2 6.4E-4 – 4.3E-3 6.7 6.37E-6A2 6 2.6E-10 – 1.4E-4 (c) 5.3E5 2.81E-10A3 2 1.3E-4 (d) (d) (d)
A4 3 3.3E-7 – 4.3E-5 130 1.12E-8A5 2 8.6E-5 – 9.3E-3 110 1.38E-6
Notes: the method of Nannoolal (2007) was used to calculate the results above. The assign-ment of reaction products to surrogate species in the UCD-CACM model is as follows: B1 =AP1 + AP6 + UR31; B2 = ADAC + RPR7 + RP14 + RP19 + UR2 + UR14 + UR27 + ARAC;B3 = AP10 + UR11 + UR15 + UR19; B4 = AP11 + AP12 + UR20 + UR34; B5 = AP7 + AP8 +UR5 + UR6; A1 = UR21 + UR28; A2 = RP13 + RP17 + RP18 + UR26 + UR29 + UR30; A3 =RPR9 + RP12; A4 = UR3 + UR8 + UR23; A5 = UR7 + UR17, see Griffin et al. (2002). (a) Thelargest and smallest vapour pressures of the components assigned to the surrogate species.(b) The value of the largest vapour pressure in the previous column, divided by the smallest. (c)
Vapour pressures of components RP17 and UR29 cannot be calculated using this method. (d)
The vapour pressure RPR9 cannot be calculated using this method.
11081
ACPD7, 11049–11089, 2007
Predictions of purecomponent vapour
pressures
S. L. Clegg et al.
Title Page
Abstract Introduction
Conclusions References
Tables Figures
J I
J I
Back Close
Full Screen / Esc
Printer-friendly Version
Interactive Discussion
EGU
Table 9. Molecular Parameters of the Surrogate Compounds.
Surrogate τ HBN Surrogate τ HBN
B1 0. 0.00670 P1 26.0 0B2 0 0.00561 P2 2.0 0.012B3 2.0 0 P3 0.5 0.00654B4 14.5 0.00330 P4 0 0B5 1.5 0.00461 P5 0.5 0A1 0 0.0157 P6 0.5 0.00851A2 2.5 0.00768 P7 15.5 0.00351A3 2.0 0.00649 P8 5.5 0A4 3.0 0.00759A5 5.0 0.00537
Notes: see Myrdal and Yalkowsky (1997), and references therein, for a description of the pa-rameters and how to determine them from the structure of the molecule.
11082
ACPD7, 11049–11089, 2007
Predictions of purecomponent vapour
pressures
S. L. Clegg et al.
Title Page
Abstract Introduction
Conclusions References
Tables Figures
J I
J I
Back Close
Full Screen / Esc
Printer-friendly Version
Interactive Discussion
EGU
Fig. 1. Boiling points (Tb) of the primary surrogate compounds in the UCD-CACM model, calcu-lated using the following methods: 1 – Nannoolal et al. (2004); 2 – Cordes and Rarey (2002); 3– ACD; 4 – Stein and Brown (1994); 5 – Joback and Reid (1987); 6 – Wen and Qiang (2002a,b);7 – Constantinou and Gani (1994); 8 – Marrero-Morejon and Pardillo-Fondevila (1999). Theerror bars are the DDBST average absolute deviations for the method and compound class towhich the surrogate belongs, except for the ACD prediction for which the ACD uncertainty isshown. No DDBST deviations are currently available for predictions shown as open circles.
11083
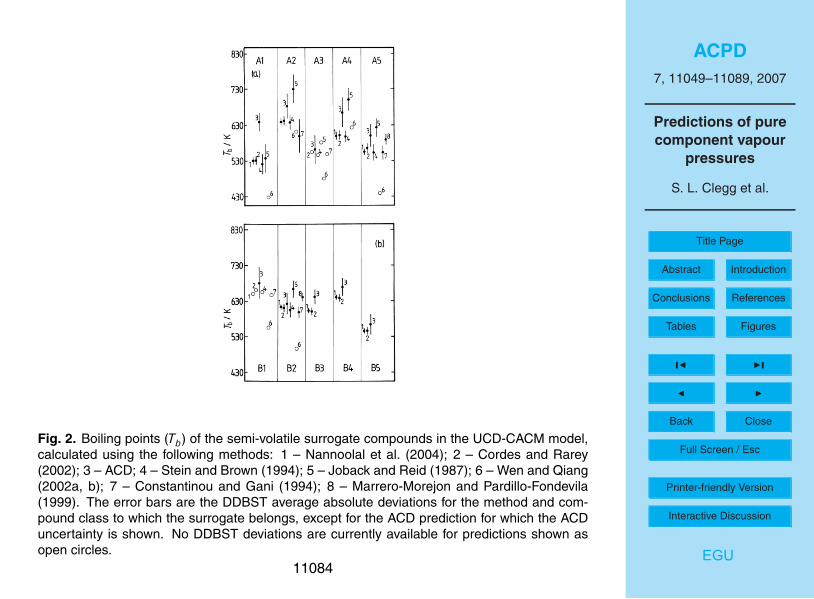
ACPD7, 11049–11089, 2007
Predictions of purecomponent vapour
pressures
S. L. Clegg et al.
Title Page
Abstract Introduction
Conclusions References
Tables Figures
J I
J I
Back Close
Full Screen / Esc
Printer-friendly Version
Interactive Discussion
EGU
Fig. 2. Boiling points (Tb) of the semi-volatile surrogate compounds in the UCD-CACM model,calculated using the following methods: 1 – Nannoolal et al. (2004); 2 – Cordes and Rarey(2002); 3 – ACD; 4 – Stein and Brown (1994); 5 – Joback and Reid (1987); 6 – Wen and Qiang(2002a, b); 7 – Constantinou and Gani (1994); 8 – Marrero-Morejon and Pardillo-Fondevila(1999). The error bars are the DDBST average absolute deviations for the method and com-pound class to which the surrogate belongs, except for the ACD prediction for which the ACDuncertainty is shown. No DDBST deviations are currently available for predictions shown asopen circles.
11084
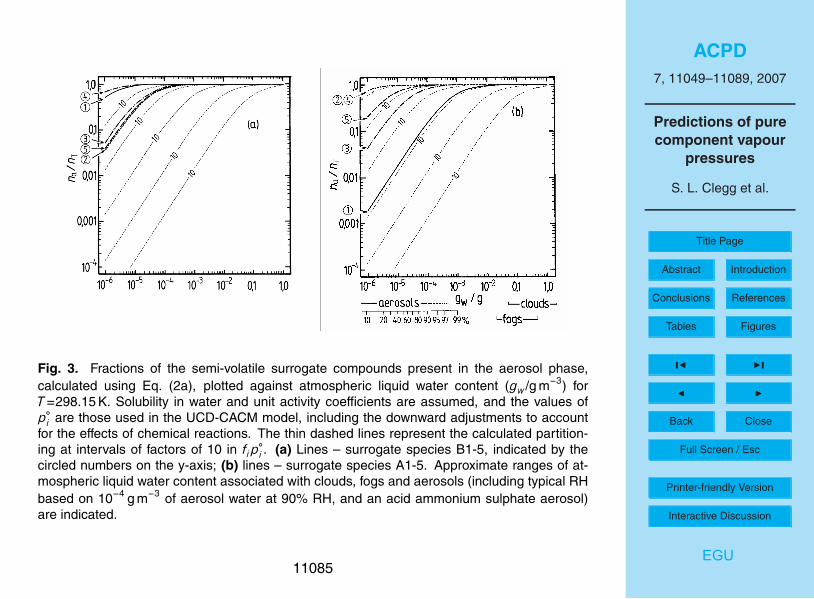
ACPD7, 11049–11089, 2007
Predictions of purecomponent vapour
pressures
S. L. Clegg et al.
Title Page
Abstract Introduction
Conclusions References
Tables Figures
J I
J I
Back Close
Full Screen / Esc
Printer-friendly Version
Interactive Discussion
EGU
Figure ctions of the semi-volatile surrogate compounds present in the aerosol phase, calculated using Eq. (2a), plotted against atmospheric liquid water content (gw / g m-3) for T = 298.15 K. Solubility in water and unit activity coefficients are assumed, and the values of po
i are thos used in the UCD-CACM model, including the downward adjustments to account for the effects of chemical reactions. The thin dashed lines represent the calculated partitioning at interval of factors of 10 in ƒi po
i. (a) Lines - surrogate species B1-5, indicated by the circled numbers on the y-axis; (b) lines – surrogate species A1-5. Approximate ranges of atmospheric liquid water content associated with clouds, fogs and aerosols (including typical RH based on 10-4 g m aerosol water at 90% RH, and a letovicite aerosol) are indicated.
3. Fra
e
s
-3 of
28
Fig. 3. Fractions of the semi-volatile surrogate compounds present in the aerosol phase,calculated using Eq. (2a), plotted against atmospheric liquid water content (gw /g m−3) forT=298.15 K. Solubility in water and unit activity coefficients are assumed, and the values ofp◦i are those used in the UCD-CACM model, including the downward adjustments to account
for the effects of chemical reactions. The thin dashed lines represent the calculated partition-ing at intervals of factors of 10 in fip
◦i . (a) Lines – surrogate species B1-5, indicated by the
circled numbers on the y-axis; (b) lines – surrogate species A1-5. Approximate ranges of at-mospheric liquid water content associated with clouds, fogs and aerosols (including typical RHbased on 10−4 g m−3 of aerosol water at 90% RH, and an acid ammonium sulphate aerosol)are indicated.
11085
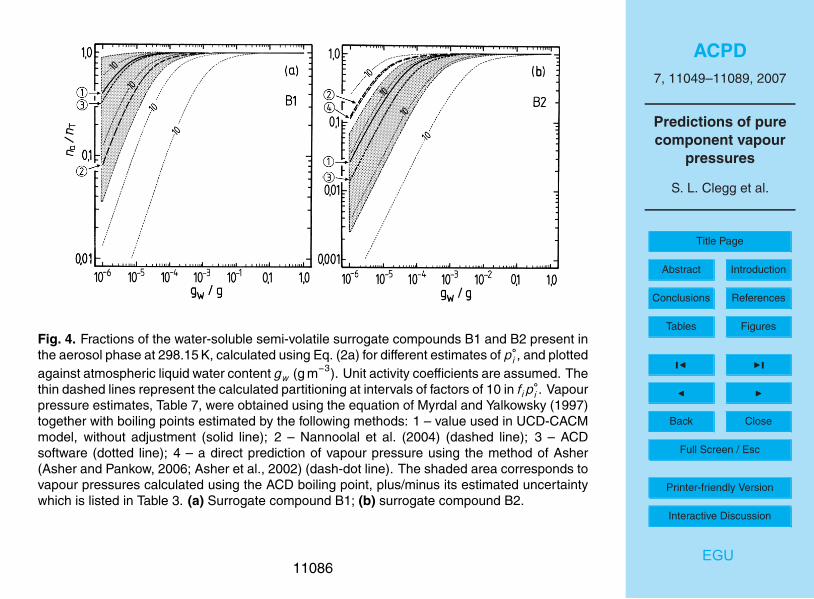
ACPD7, 11049–11089, 2007
Predictions of purecomponent vapour
pressures
S. L. Clegg et al.
Title Page
Abstract Introduction
Conclusions References
Tables Figures
J I
J I
Back Close
Full Screen / Esc
Printer-friendly Version
Interactive Discussion
EGU
Fig. 4. Fractions of the water-soluble semi-volatile surrogate compounds B1 and B2 present inthe aerosol phase at 298.15 K, calculated using Eq. (2a) for different estimates of p◦
i , and plottedagainst atmospheric liquid water content gw (g m−3). Unit activity coefficients are assumed. Thethin dashed lines represent the calculated partitioning at intervals of factors of 10 in fip
◦i . Vapour
pressure estimates, Table 7, were obtained using the equation of Myrdal and Yalkowsky (1997)together with boiling points estimated by the following methods: 1 – value used in UCD-CACMmodel, without adjustment (solid line); 2 – Nannoolal et al. (2004) (dashed line); 3 – ACDsoftware (dotted line); 4 – a direct prediction of vapour pressure using the method of Asher(Asher and Pankow, 2006; Asher et al., 2002) (dash-dot line). The shaded area corresponds tovapour pressures calculated using the ACD boiling point, plus/minus its estimated uncertaintywhich is listed in Table 3. (a) Surrogate compound B1; (b) surrogate compound B2.
11086
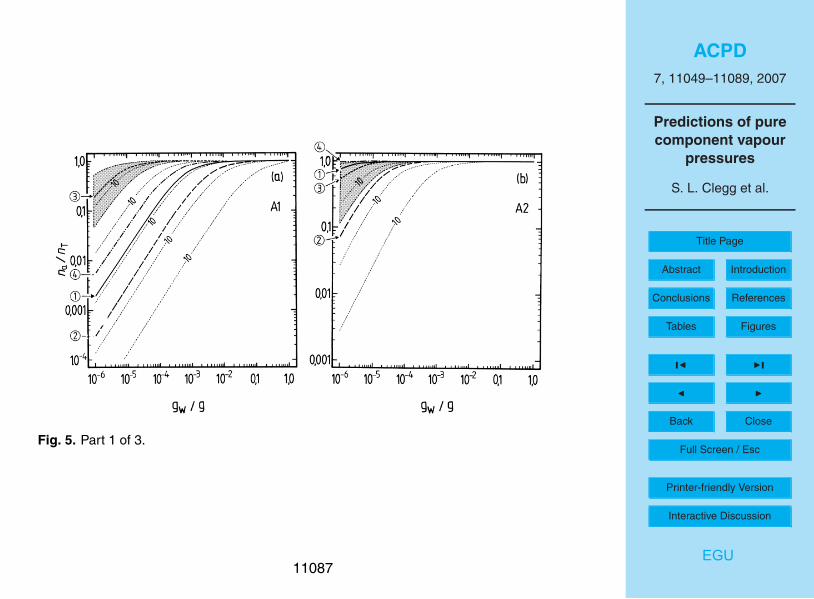
ACPD7, 11049–11089, 2007
Predictions of purecomponent vapour
pressures
S. L. Clegg et al.
Title Page
Abstract Introduction
Conclusions References
Tables Figures
J I
J I
Back Close
Full Screen / Esc
Printer-friendly Version
Interactive Discussion
EGU
Fig. 5. Part 1 of 3.
11087
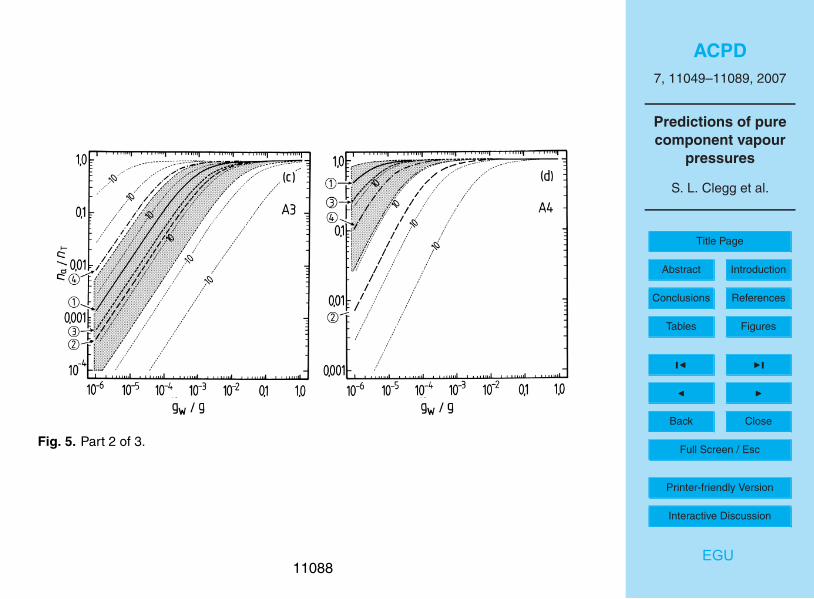
ACPD7, 11049–11089, 2007
Predictions of purecomponent vapour
pressures
S. L. Clegg et al.
Title Page
Abstract Introduction
Conclusions References
Tables Figures
J I
J I
Back Close
Full Screen / Esc
Printer-friendly Version
Interactive Discussion
EGU
Fig. 5. Part 2 of 3.
11088
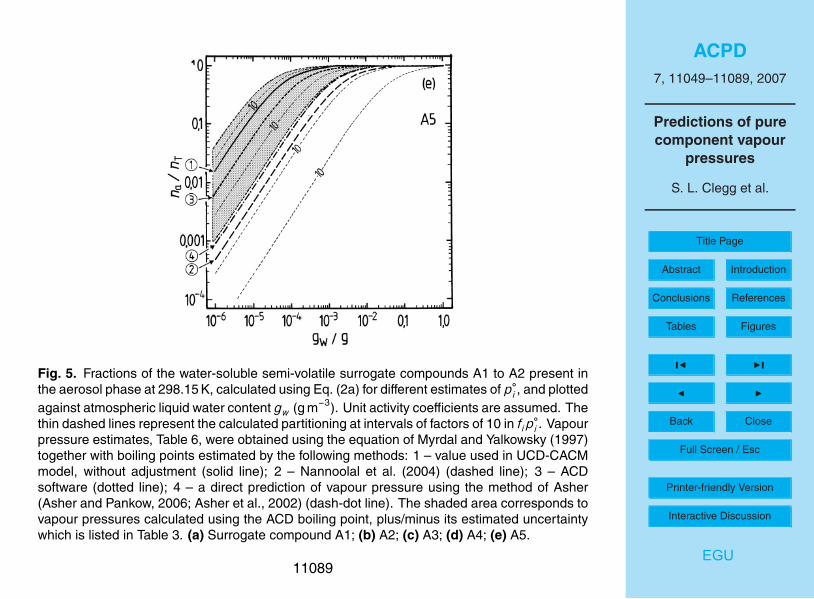
ACPD7, 11049–11089, 2007
Predictions of purecomponent vapour
pressures
S. L. Clegg et al.
Title Page
Abstract Introduction
Conclusions References
Tables Figures
J I
J I
Back Close
Full Screen / Esc
Printer-friendly Version
Interactive Discussion
EGU
Fig. 5. Fractions of the water-soluble semi-volatile surrogate compounds A1 to A2 present inthe aerosol phase at 298.15 K, calculated using Eq. (2a) for different estimates of p◦
i , and plottedagainst atmospheric liquid water content gw (g m−3). Unit activity coefficients are assumed. Thethin dashed lines represent the calculated partitioning at intervals of factors of 10 in fip
◦i . Vapour
pressure estimates, Table 6, were obtained using the equation of Myrdal and Yalkowsky (1997)together with boiling points estimated by the following methods: 1 – value used in UCD-CACMmodel, without adjustment (solid line); 2 – Nannoolal et al. (2004) (dashed line); 3 – ACDsoftware (dotted line); 4 – a direct prediction of vapour pressure using the method of Asher(Asher and Pankow, 2006; Asher et al., 2002) (dash-dot line). The shaded area corresponds tovapour pressures calculated using the ACD boiling point, plus/minus its estimated uncertaintywhich is listed in Table 3. (a) Surrogate compound A1; (b) A2; (c) A3; (d) A4; (e) A5.
11089