Embed Size (px)
Citation preview
264
http://journals.tubitak.gov.tr/earth/
Turkish Journal of Earth Sciences Turkish J Earth Sci(2013) 22: 264-276© TÜBİTAKdoi:10.3906/yer-1204-1
Prediction of weathering development in metarhyolites of the Ilgın (Konya) area, SW Turkey
Erkan BOZKURTOĞLU*, Şenel ÖZDAMAR, Hatice ÜNAL ERCANDepartment of Geological Engineering, Faculty of Mines, İstanbul Technical University, 34469 Maslak, İstanbul, Turkey
* Correspondence: [email protected]
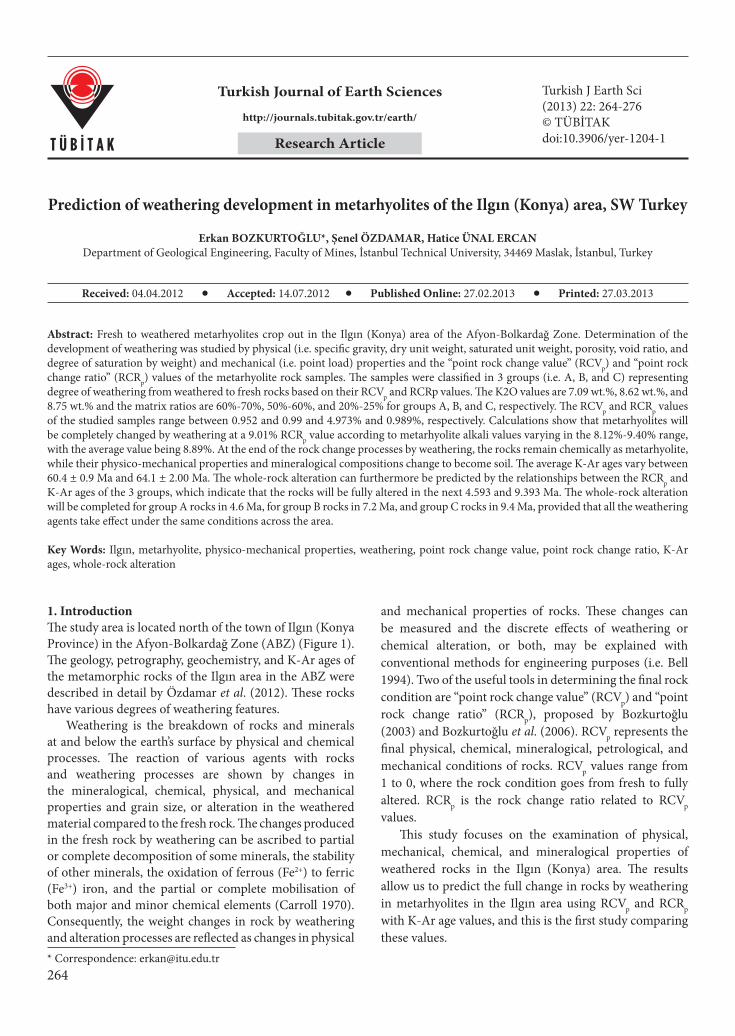
1. Introduction The study area is located north of the town of Ilgın (Konya Province) in the Afyon-Bolkardağ Zone (ABZ) (Figure 1). The geology, petrography, geochemistry, and K-Ar ages of the metamorphic rocks of the Ilgın area in the ABZ were described in detail by Özdamar et al. (2012). These rocks have various degrees of weathering features.
Weathering is the breakdown of rocks and minerals at and below the earth’s surface by physical and chemical processes. The reaction of various agents with rocks and weathering processes are shown by changes in the mineralogical, chemical, physical, and mechanical properties and grain size, or alteration in the weathered material compared to the fresh rock. The changes produced in the fresh rock by weathering can be ascribed to partial or complete decomposition of some minerals, the stability of other minerals, the oxidation of ferrous (Fe2+) to ferric (Fe3+) iron, and the partial or complete mobilisation of both major and minor chemical elements (Carroll 1970). Consequently, the weight changes in rock by weathering and alteration processes are reflected as changes in physical
and mechanical properties of rocks. These changes can be measured and the discrete effects of weathering or chemical alteration, or both, may be explained with conventional methods for engineering purposes (i.e. Bell 1994). Two of the useful tools in determining the final rock condition are “point rock change value” (RCVp) and “point rock change ratio” (RCRp), proposed by Bozkurtoğlu (2003) and Bozkurtoğlu et al. (2006). RCVp represents the final physical, chemical, mineralogical, petrological, and mechanical conditions of rocks. RCVp values range from 1 to 0, where the rock condition goes from fresh to fully altered. RCRp is the rock change ratio related to RCVp values.
This study focuses on the examination of physical, mechanical, chemical, and mineralogical properties of weathered rocks in the Ilgın (Konya) area. The results allow us to predict the full change in rocks by weathering in metarhyolites in the Ilgın area using RCVp and RCRp with K-Ar age values, and this is the first study comparing these values.
Abstract: Fresh to weathered metarhyolites crop out in the Ilgın (Konya) area of the Afyon-Bolkardağ Zone. Determination of the development of weathering was studied by physical (i.e. specific gravity, dry unit weight, saturated unit weight, porosity, void ratio, and degree of saturation by weight) and mechanical (i.e. point load) properties and the “point rock change value” (RCVp) and “point rock change ratio” (RCRp) values of the metarhyolite rock samples. The samples were classified in 3 groups (i.e. A, B, and C) representing degree of weathering from weathered to fresh rocks based on their RCVp and RCRp values. The K2O values are 7.09 wt.%, 8.62 wt.%, and 8.75 wt.% and the matrix ratios are 60%-70%, 50%-60%, and 20%-25% for groups A, B, and C, respectively. The RCVp and RCRp values of the studied samples range between 0.952 and 0.99 and 4.973% and 0.989%, respectively. Calculations show that metarhyolites will be completely changed by weathering at a 9.01% RCRp value according to metarhyolite alkali values varying in the 8.12%-9.40% range, with the average value being 8.89%. At the end of the rock change processes by weathering, the rocks remain chemically as metarhyolite, while their physico-mechanical properties and mineralogical compositions change to become soil. The average K-Ar ages vary between 60.4 ± 0.9 Ma and 64.1 ± 2.00 Ma. The whole-rock alteration can furthermore be predicted by the relationships between the RCRp and K-Ar ages of the 3 groups, which indicate that the rocks will be fully altered in the next 4.593 and 9.393 Ma. The whole-rock alteration will be completed for group A rocks in 4.6 Ma, for group B rocks in 7.2 Ma, and group C rocks in 9.4 Ma, provided that all the weathering agents take effect under the same conditions across the area.
Key Words: Ilgın, metarhyolite, physico-mechanical properties, weathering, point rock change value, point rock change ratio, K-Ar ages, whole-rock alteration
Received: 04.04.2012 Accepted: 14.07.2012 Published Online: 27.02.2013 Printed: 27.03.2013
Research Article
265
BOZKURTOĞLU et al. / Turkish J Earth Sci
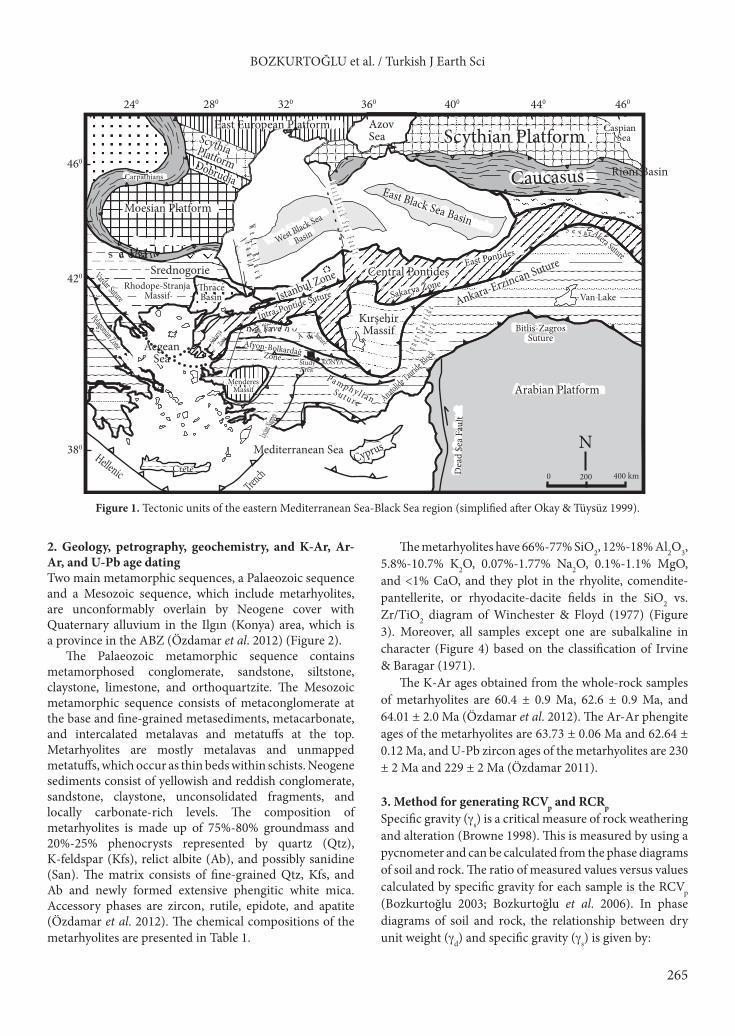
2. Geology, petrography, geochemistry, and K-Ar, Ar-Ar, and U-Pb age datingTwo main metamorphic sequences, a Palaeozoic sequence and a Mesozoic sequence, which include metarhyolites, are unconformably overlain by Neogene cover with Quaternary alluvium in the Ilgın (Konya) area, which is a province in the ABZ (Özdamar et al. 2012) (Figure 2).
The Palaeozoic metamorphic sequence contains metamorphosed conglomerate, sandstone, siltstone, claystone, limestone, and orthoquartzite. The Mesozoic metamorphic sequence consists of metaconglomerate at the base and fine-grained metasediments, metacarbonate, and intercalated metalavas and metatuffs at the top. Metarhyolites are mostly metalavas and unmapped metatuffs, which occur as thin beds within schists. Neogene sediments consist of yellowish and reddish conglomerate, sandstone, claystone, unconsolidated fragments, and locally carbonate-rich levels. The composition of metarhyolites is made up of 75%-80% groundmass and 20%-25% phenocrysts represented by quartz (Qtz), K-feldspar (Kfs), relict albite (Ab), and possibly sanidine (San). The matrix consists of fine-grained Qtz, Kfs, and Ab and newly formed extensive phengitic white mica. Accessory phases are zircon, rutile, epidote, and apatite (Özdamar et al. 2012). The chemical compositions of the metarhyolites are presented in Table 1.
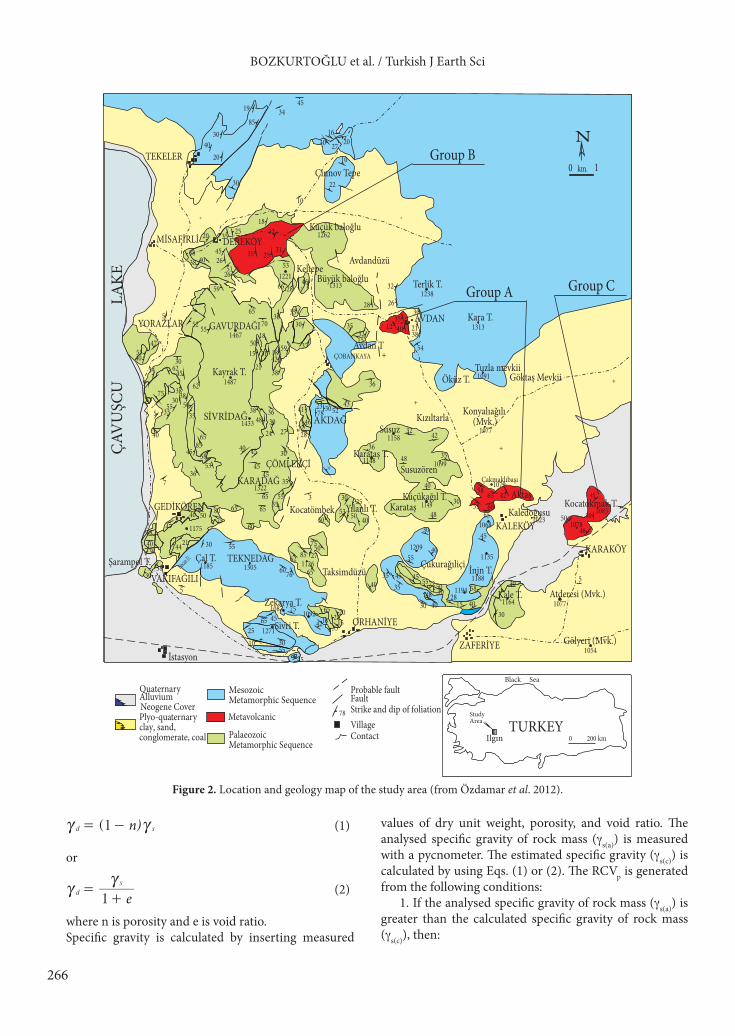
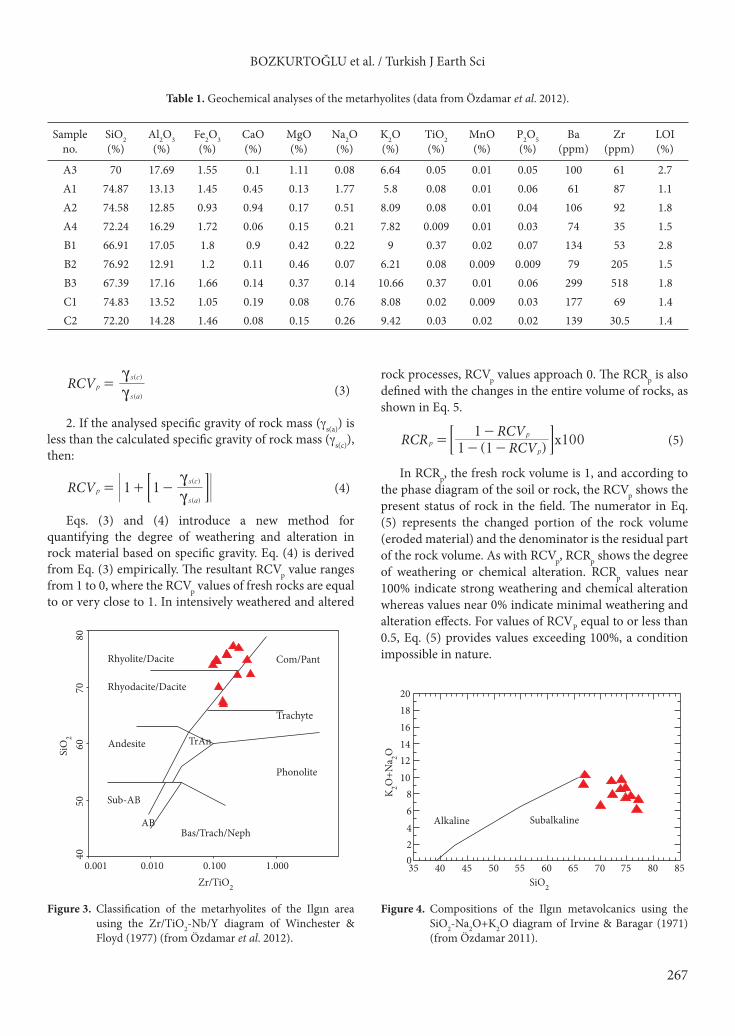
The metarhyolites have 66%-77% SiO2, 12%-18% Al2O3, 5.8%-10.7% K2O, 0.07%-1.77% Na2O, 0.1%-1.1% MgO, and <1% CaO, and they plot in the rhyolite, comendite-pantellerite, or rhyodacite-dacite fields in the SiO2 vs. Zr/TiO2 diagram of Winchester & Floyd (1977) (Figure 3). Moreover, all samples except one are subalkaline in character (Figure 4) based on the classification of Irvine & Baragar (1971).
The K-Ar ages obtained from the whole-rock samples of metarhyolites are 60.4 ± 0.9 Ma, 62.6 ± 0.9 Ma, and 64.01 ± 2.0 Ma (Özdamar et al. 2012). The Ar-Ar phengite ages of the metarhyolites are 63.73 ± 0.06 Ma and 62.64 ± 0.12 Ma, and U-Pb zircon ages of the metarhyolites are 230 ± 2 Ma and 229 ± 2 Ma (Özdamar 2011).
3. Method for generating RCVp and RCRpSpecific gravity (gs) is a critical measure of rock weathering and alteration (Browne 1998). This is measured by using a pycnometer and can be calculated from the phase diagrams of soil and rock. The ratio of measured values versus values calculated by specific gravity for each sample is the RCVp (Bozkurtoğlu 2003; Bozkurtoğlu et al. 2006). In phase diagrams of soil and rock, the relationship between dry unit weight (gd) and specific gravity (gs) is given by:
Carpathians
240 280 320 360 400 460
460
420
380
440
Caspian Sea
Rioni BasinCaucasus
I n n e r T a u r i de
S u t ur e
Arabian Platform
0 200 400 km Dea
d Se
a Fau
ltCyprus
East Black Sea BasinWest Black Sea
Basin
Central Pontides
Intra-Pontide Suture
Lycian Na
ppes
Afyon-Bolkardağ Zone
TrenchHellenic Crete
AegeanSea
Mediterranean Sea
�race Basin Sakarya Zone
Pelagonian Zone
Vardar Suture
Moesian Platform
B alka nides
Dobrudja
East European Platform AzovSea Scythian PlatformScythia Platform
Istanbul Zone
KırşehirMassif
East Pontides
SrednogorieRhodope-Stranja
Massif
İ z mirTavşan lı Z one
P a m p h y l i a nS u t u r e
Bitlis-ZagrosSutureA nka r aSuture
We s t B l a c k
F a u l t
W e s t B l a c k S e a F a u l t .
S e v a nAkera Suture
MenderesMassif
Anatolide Tauride Block
Ankara-Erzincan Suture
Sakarya
Zone
Van Lake
KONYA
N
StudyArea
Figure 1. Tectonic units of the eastern Mediterranean Sea-Black Sea region (simplified after Okay & Tüysüz 1999).
266
BOZKURTOĞLU et al. / Turkish J Earth Sci
( )n1d sc c= - (1)
or
e1d
sc
c=+
(2)
where n is porosity and e is void ratio.Specific gravity is calculated by inserting measured
values of dry unit weight, porosity, and void ratio. The analysed specific gravity of rock mass (gs(a)) is measured with a pycnometer. The estimated specific gravity (gs(c)) is calculated by using Eqs. (1) or (2). The RCVp is generated from the following conditions:
1. If the analysed specific gravity of rock mass (gs(a)) is greater than the calculated specific gravity of rock mass (gs(c)), then:
Küçük baloğlu
Büyük baloğlu
Avdandüzü
1313
Konyalıağılı (Mvk.)
1077
Gölyeri (Mvk.)1054
Atderesi (Mvk.)1077
GAVURDAĞI1467
Kayrak T.1487
65
2866
53
5
SİVRİDAĞ AKDAĞ1433
405845
40
3334
75
62
355030 3838
4530
344055
47
555
62
2138
59
3035
46
371842
3115
1850
7030
55
59
8565
45
1085
Kale T.1164
ZAFERİYE
1194
50
45
1078
5
3040
58
152848
4030
5030
72
45
1135
656065 42 Aktaş
55
58
ÇAV
UŞC
U
LAK
E
30
35
42
48
4836
32
40Küçükağıl T.
1149Karataş1068
1209
30
40
553545
55
ORHANİYE
ÇÖMLEKÇİ
Susuz1158
1099SusuzörenKarataş T. 1148
Çakmaklıbaşı1079
DEREKÖYMİSAFİRLİ 1262
Zekarya T.1087 1092
Taksimdüzü İnin T.1188
Çukurağıliçi
Yılanlı T.Kocatömbek50
7550
İstasyon
Şarampol T.
Karataş T.
TEKNEDAĞ1305
Çal T.1185
Fincan T.
1126
Tuzla mevkii1091Öküz T.
Kara T.1313
Terlik T.1238
AVDAN
40
Bolasanarkası
Göktaş Mevkii
Kızıltarla
KARADAĞ1322
65
35422025
1518
+
55
45 55
4050
2530
53
65
2762 85
6076
3044
40
304018
80
3653
7
4047
65 6565
4545
60
55
35
55
30
3848 30
24 27
36
2228
4641 78 52
43
15
30
38
23
36
35
28
35
32
32
12 40
54
38
3026
21
10
22
10
16
34 45
20 30
30
20
85
19
40 30
27
1221Keltepe_ +
Cinnov Tepe 0 1
N
km.Fincan D.
1175
TEKELER
+
VAKIFAĞILI
21
551025
30
65
+
Sivri T.1271
1175
4575
+ -
3038
5
5035
35
3
31
55
KaledoğusuKocatokmak T.
52
31
32
26
20
2638
18
2535
51
58 4540
2535
+
+
+
++
75 5046
45
Neogene Cover
Quaternary
Palaeozoic Metamorphic Sequence
Alluvium
Plyo-quaternaryclay, sand, conglomerate, coal
Mesozoic Metamorphic Sequence
MetavolcanicStrike and dip of foliationFault
78
VillageContact
Probable faultBlack Sea
Ilgın
Study Area
0 200 kmTURKEY
ÇOBANKAYA
Group CGroup A
Group B
YORAZLAR
Avdan T
1023KALEKÖY
30
KARAKÖY
30
GEDİKÖREN
Figure 2. Location and geology map of the study area (from Özdamar et al. 2012).
267
BOZKURTOĞLU et al. / Turkish J Earth Sci
RCV( )
( )
p
s a
s c
cc
= (3)
2. If the analysed specific gravity of rock mass (gs(a)) is less than the calculated specific gravity of rock mass (gs(c)), then:
RCV 1 1( )
( )
p
s a
s c
cc
= + -; E (4)
Eqs. (3) and (4) introduce a new method for quantifying the degree of weathering and alteration in rock material based on specific gravity. Eq. (4) is derived from Eq. (3) empirically. The resultant RCVp value ranges from 1 to 0, where the RCVp values of fresh rocks are equal to or very close to 1. In intensively weathered and altered
rock processes, RCVp values approach 0. The RCRp is also defined with the changes in the entire volume of rocks, as shown in Eq. 5.
( )xRC RCV
RCVR1 11
100pp
p=
- --; E (5)
In RCRp, the fresh rock volume is 1, and according to the phase diagram of the soil or rock, the RCVp shows the present status of rock in the field. The numerator in Eq. (5) represents the changed portion of the rock volume (eroded material) and the denominator is the residual part of the rock volume. As with RCVp, RCRp shows the degree of weathering or chemical alteration. RCRp values near 100% indicate strong weathering and chemical alteration whereas values near 0% indicate minimal weathering and alteration effects. For values of RCVP equal to or less than 0.5, Eq. (5) provides values exceeding 100%, a condition impossible in nature.
Table 1. Geochemical analyses of the metarhyolites (data from Özdamar et al. 2012).
Sample no.
SiO2(%)
Al2O3(%)
Fe2O3 (%)
CaO (%)
MgO (%)
Na2O (%)
K2O (%)
TiO2 (%)
MnO (%)
P2O5 (%)
Ba(ppm)
Zr(ppm)
LOI (%)
A3 70 17.69 1.55 0.1 1.11 0.08 6.64 0.05 0.01 0.05 100 61 2.7A1 74.87 13.13 1.45 0.45 0.13 1.77 5.8 0.08 0.01 0.06 61 87 1.1A2 74.58 12.85 0.93 0.94 0.17 0.51 8.09 0.08 0.01 0.04 106 92 1.8A4 72.24 16.29 1.72 0.06 0.15 0.21 7.82 0.009 0.01 0.03 74 35 1.5B1 66.91 17.05 1.8 0.9 0.42 0.22 9 0.37 0.02 0.07 134 53 2.8B2 76.92 12.91 1.2 0.11 0.46 0.07 6.21 0.08 0.009 0.009 79 205 1.5B3 67.39 17.16 1.66 0.14 0.37 0.14 10.66 0.37 0.01 0.06 299 518 1.8C1 74.83 13.52 1.05 0.19 0.08 0.76 8.08 0.02 0.009 0.03 177 69 1.4C2 72.20 14.28 1.46 0.08 0.15 0.26 9.42 0.03 0.02 0.02 139 30.5 1.4
0.001 0.010 0.100 1.000Zr/TiO2
SiO
240
5060
7080
Rhyolite/Dacite
Rhyodacite/Dacite
Andesite TrAn
Sub-AB
ABBas/Trach/Neph
Phonolite
Trachyte
Com/Pant
Figure 3. Classification of the metarhyolites of the Ilgın area using the Zr/TiO2-Nb/Y diagram of Winchester & Floyd (1977) (from Özdamar et al. 2012).
Alkaline Subalkaline
SiO2
35 40 45 50 55 60 65 70 75 80 85
201816141210
86420
K2O
+Na 2O
Figure 4. Compositions of the Ilgın metavolcanics using the SiO2-Na2O+K2O diagram of Irvine & Baragar (1971) (from Özdamar 2011).
268
BOZKURTOĞLU et al. / Turkish J Earth Sci
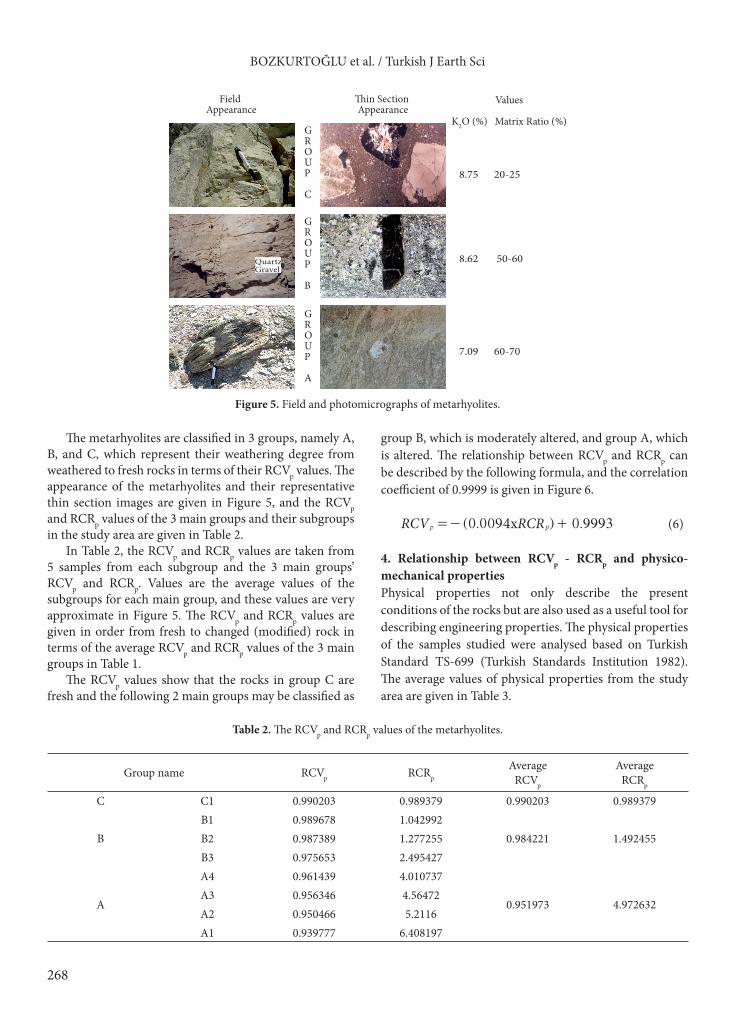
The metarhyolites are classified in 3 groups, namely A, B, and C, which represent their weathering degree from weathered to fresh rocks in terms of their RCVp values. The appearance of the metarhyolites and their representative thin section images are given in Figure 5, and the RCVp and RCRp values of the 3 main groups and their subgroups in the study area are given in Table 2.
In Table 2, the RCVp and RCRp values are taken from 5 samples from each subgroup and the 3 main groups’ RCVp and RCRp. Values are the average values of the subgroups for each main group, and these values are very approximate in Figure 5. The RCVp and RCRp values are given in order from fresh to changed (modified) rock in terms of the average RCVp and RCRp values of the 3 main groups in Table 1.
The RCVp values show that the rocks in group C are fresh and the following 2 main groups may be classified as
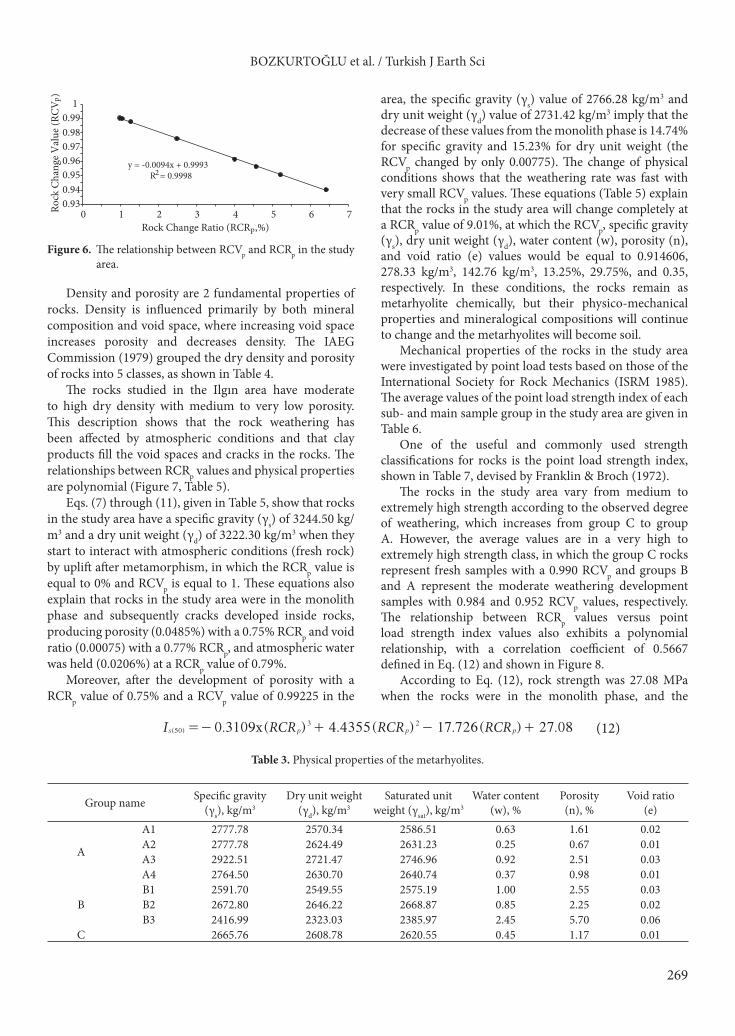
group B, which is moderately altered, and group A, which is altered. The relationship between RCVp and RCRp can be described by the following formula, and the correlation coefficient of 0.9999 is given in Figure 6.
( . ) .xRCV RCR0 0094 0 9993p p=- + (6)
4. Relationship between RCVp - RCRp and physico-mechanical properties Physical properties not only describe the present conditions of the rocks but are also used as a useful tool for describing engineering properties. The physical properties of the samples studied were analysed based on Turkish Standard TS-699 (Turkish Standards Institution 1982). The average values of physical properties from the study area are given in Table 3.
GROUP
C
Field Appearance
�in Section Appearance
QuartzGravel
GROUP
B
GROUP
A
Values
K2O (%) Matrix Ratio (%)
8.75 20-25
8.62 50-60
7.09 60-70
Figure 5. Field and photomicrographs of metarhyolites.
Table 2. The RCVp and RCRp values of the metarhyolites.
Group name RCVp RCRpAverage
RCVp
Average RCRp
C C1 0.990203 0.989379 0.990203 0.989379
BB1 0.989678 1.042992
0.984221 1.492455B2 0.987389 1.277255B3 0.975653 2.495427
A
A4 0.961439 4.010737
0.951973 4.972632A3 0.956346 4.56472A2 0.950466 5.2116A1 0.939777 6.408197
269
BOZKURTOĞLU et al. / Turkish J Earth Sci
Table 3. Physical properties of the metarhyolites.
Group name Specific gravity (γs), kg/m3
Dry unit weight (γd), kg/m3
Saturated unit weight (γsat), kg/m3
Water content(w), %
Porosity(n), %
Void ratio (e)
A
A1 2777.78 2570.34 2586.51 0.63 1.61 0.02A2 2777.78 2624.49 2631.23 0.25 0.67 0.01A3 2922.51 2721.47 2746.96 0.92 2.51 0.03A4 2764.50 2630.70 2640.74 0.37 0.98 0.01
BB1 2591.70 2549.55 2575.19 1.00 2.55 0.03B2 2672.80 2646.22 2668.87 0.85 2.25 0.02B3 2416.99 2323.03 2385.97 2.45 5.70 0.06
C 2665.76 2608.78 2620.55 0.45 1.17 0.01
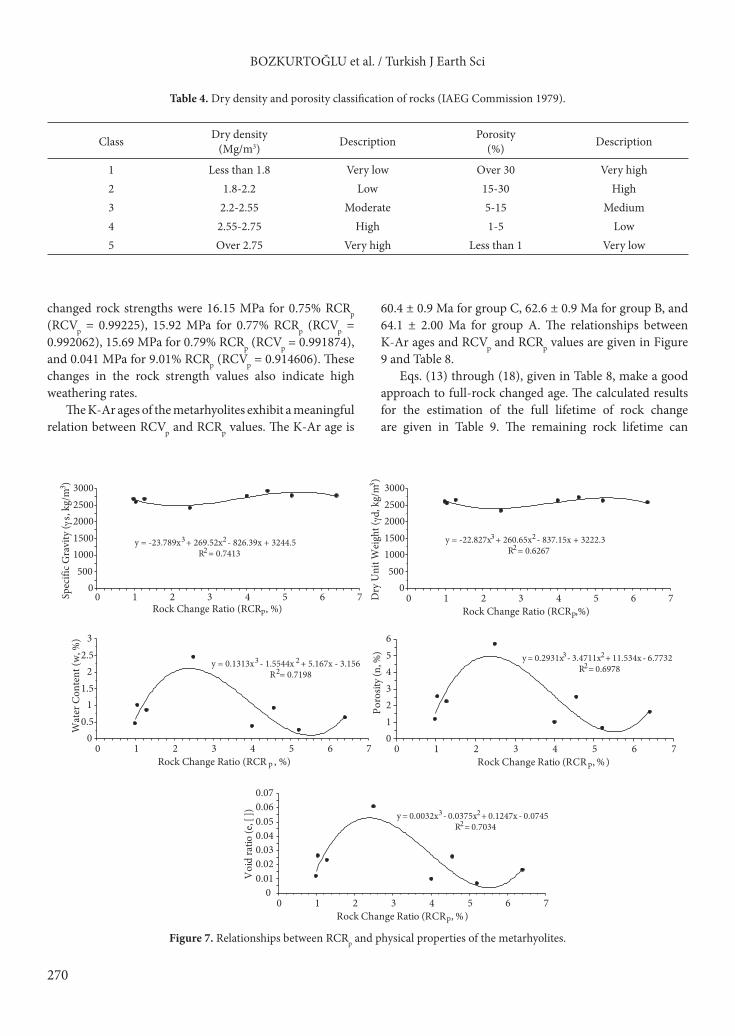
Density and porosity are 2 fundamental properties of rocks. Density is influenced primarily by both mineral composition and void space, where increasing void space increases porosity and decreases density. The IAEG Commission (1979) grouped the dry density and porosity of rocks into 5 classes, as shown in Table 4.
The rocks studied in the Ilgın area have moderate to high dry density with medium to very low porosity. This description shows that the rock weathering has been affected by atmospheric conditions and that clay products fill the void spaces and cracks in the rocks. The relationships between RCRp values and physical properties are polynomial (Figure 7, Table 5).
Eqs. (7) through (11), given in Table 5, show that rocks in the study area have a specific gravity (γs) of 3244.50 kg/m3 and a dry unit weight (γd) of 3222.30 kg/m3 when they start to interact with atmospheric conditions (fresh rock) by uplift after metamorphism, in which the RCRp value is equal to 0% and RCVp is equal to 1. These equations also explain that rocks in the study area were in the monolith phase and subsequently cracks developed inside rocks, producing porosity (0.0485%) with a 0.75% RCRp and void ratio (0.00075) with a 0.77% RCRp, and atmospheric water was held (0.0206%) at a RCRp value of 0.79%.
Moreover, after the development of porosity with a RCRp value of 0.75% and a RCVp value of 0.99225 in the
area, the specific gravity (γs) value of 2766.28 kg/m3 and dry unit weight (γd) value of 2731.42 kg/m3 imply that the decrease of these values from the monolith phase is 14.74% for specific gravity and 15.23% for dry unit weight (the RCVp changed by only 0.00775). The change of physical conditions shows that the weathering rate was fast with very small RCVp values. These equations (Table 5) explain that the rocks in the study area will change completely at a RCRp value of 9.01%, at which the RCVp, specific gravity (γs), dry unit weight (γd), water content (w), porosity (n), and void ratio (e) values would be equal to 0.914606, 278.33 kg/m3, 142.76 kg/m3, 13.25%, 29.75%, and 0.35, respectively. In these conditions, the rocks remain as metarhyolite chemically, but their physico-mechanical properties and mineralogical compositions will continue to change and the metarhyolites will become soil.
Mechanical properties of the rocks in the study area were investigated by point load tests based on those of the International Society for Rock Mechanics (ISRM 1985). The average values of the point load strength index of each sub- and main sample group in the study area are given in Table 6.
One of the useful and commonly used strength classifications for rocks is the point load strength index, shown in Table 7, devised by Franklin & Broch (1972).
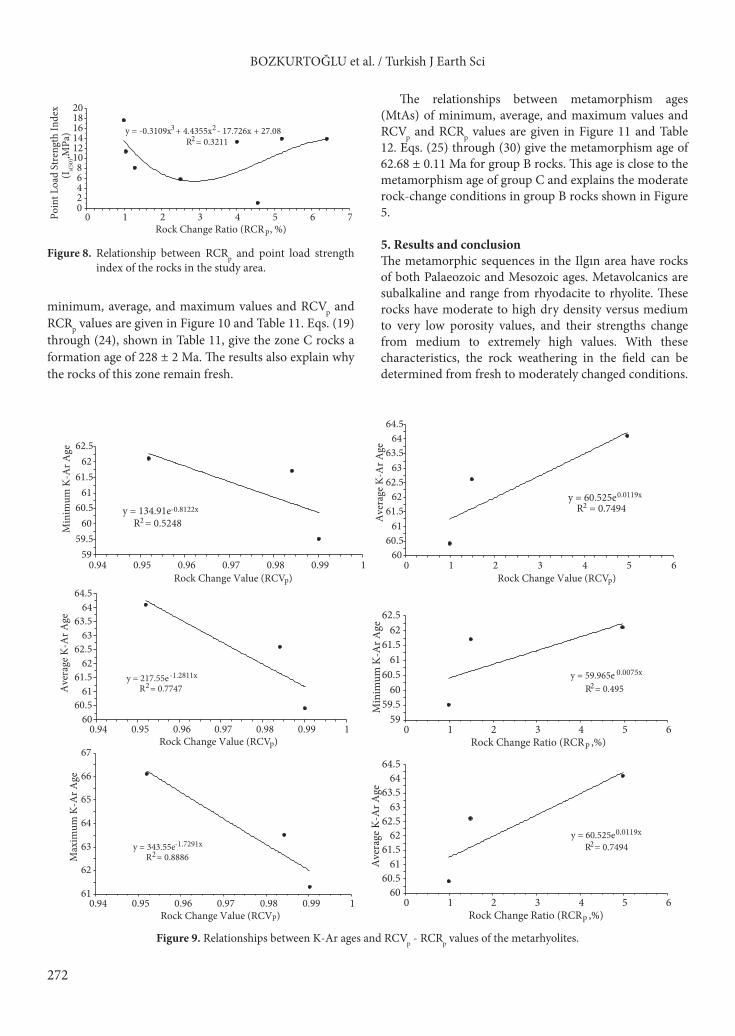
The rocks in the study area vary from medium to extremely high strength according to the observed degree of weathering, which increases from group C to group A. However, the average values are in a very high to extremely high strength class, in which the group C rocks represent fresh samples with a 0.990 RCVp and groups B and A represent the moderate weathering development samples with 0.984 and 0.952 RCVp values, respectively. The relationship between RCRp values versus point load strength index values also exhibits a polynomial relationship, with a correlation coefficient of 0.5667 defined in Eq. (12) and shown in Figure 8.
According to Eq. (12), rock strength was 27.08 MPa when the rocks were in the monolith phase, and the
y = -0.0094x + 0.9993R2 = 0.9998
0.930.940.950.960.970.980.99
1
0 1 2 3 4 5 6 7Rock Change Ratio (RCRp,%)
Rock
Cha
nge V
alue
(RCV
p)
Figure 6. The relationship between RCVp and RCRp in the study area.
. ( ) . ( ) . ( ) .xI RCR RCR RCR0 3109 4 4355 17 726 27 08(50)3 2
s p p p=- + - + (12)
270
BOZKURTOĞLU et al. / Turkish J Earth Sci
changed rock strengths were 16.15 MPa for 0.75% RCRp (RCVp = 0.99225), 15.92 MPa for 0.77% RCRp (RCVp = 0.992062), 15.69 MPa for 0.79% RCRp (RCVp = 0.991874), and 0.041 MPa for 9.01% RCRp (RCVp = 0.914606). These changes in the rock strength values also indicate high weathering rates.
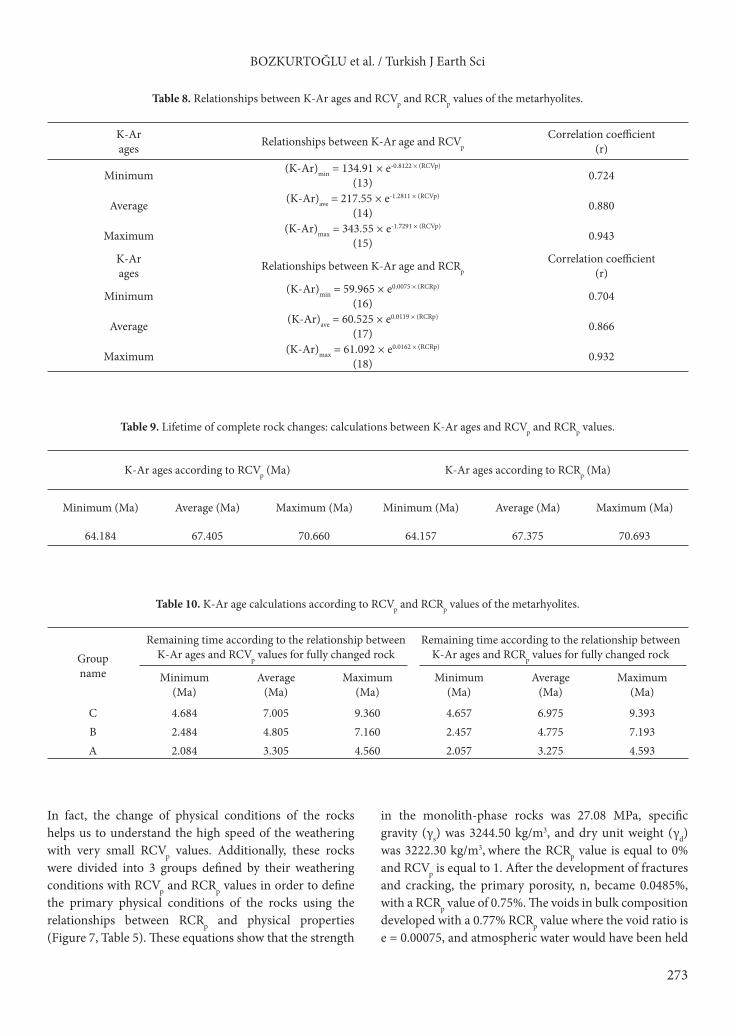
The K-Ar ages of the metarhyolites exhibit a meaningful relation between RCVp and RCRp values. The K-Ar age is
60.4 ± 0.9 Ma for group C, 62.6 ± 0.9 Ma for group B, and 64.1 ± 2.00 Ma for group A. The relationships between K-Ar ages and RCVp and RCRp values are given in Figure 9 and Table 8.
Eqs. (13) through (18), given in Table 8, make a good approach to full-rock changed age. The calculated results for the estimation of the full lifetime of rock change are given in Table 9. The remaining rock lifetime can
Table 4. Dry density and porosity classification of rocks (IAEG Commission 1979).
Class Dry density(Mg/m3) Description Porosity
(%) Description
1 Less than 1.8 Very low Over 30 Very high2 1.8-2.2 Low 15-30 High3 2.2-2.55 Moderate 5-15 Medium4 2.55-2.75 High 1-5 Low5 Over 2.75 Very high Less than 1 Very low
y = -23.789x3 + 269.52x2 - 826.39x + 3244.5R2 = 0.7413
0500
10001500200025003000
0 1 2 3 4 5 6 7Rock Change Ratio (RCRp, %)
Spec
ific G
ravi
ty ( γ
s, kg
/m3 )
y = -22.827x3 + 260.65x2 - 837.15x + 3222.3R2 = 0.6267
0500
10001500200025003000
0 1 2 3 4 5 6 7Rock Change Ratio (RCRp,%)
Dry
Uni
t Wei
ght (γd
, kg/
m3 )
y = 0.1313x3 - 1.5544x 2 + 5.167x - 3.156R2 = 0.7198
00.5
11.5
22.5
3
0 1 2 3 4 5 6 7Rock Change Ratio (RCR p , %)
Wat
er C
onte
nt (w
, %)
y = 0.2931x3 - 3.4711x2 + 11.534x - 6.7732R2 = 0.6978
0123456
0 1 2 3 4 5 6 7Rock Change Ratio (RCR p, %)
Poro
sity (
n, %
)
y = 0.0032x3 - 0.0375x2 + 0.1247x - 0.0745R2 = 0.7034
00.010.020.030.040.050.060.07
0 1 2 3 4 5 6 7Rock Change Ratio (RCRp, %)
Voi
d ra
tio (e
, [ ])
Figure 7. Relationships between RCRp and physical properties of the metarhyolites.
271
BOZKURTOĞLU et al. / Turkish J Earth Sci
be calculated simply by making a subtraction between current and calculated ages of rocks. These results are given in Table 10.
The highest correlation coefficient values were gathered for the maximum K-Ar age values versus RCVp and RCRp values (r = 0.94). The evaluations show that the whole-rock change time by weathering, disintegration, and maybe alteration will be complete after 4.58 Ma for highly weathered rocks (group A), 7.18 Ma for moderately
weathered rocks (group B), and 9.38 Ma for fresh or weakly weathered rocks (group C), respectively. These values are geometric means of the calculated minimum, average, and maximum age values of each group.
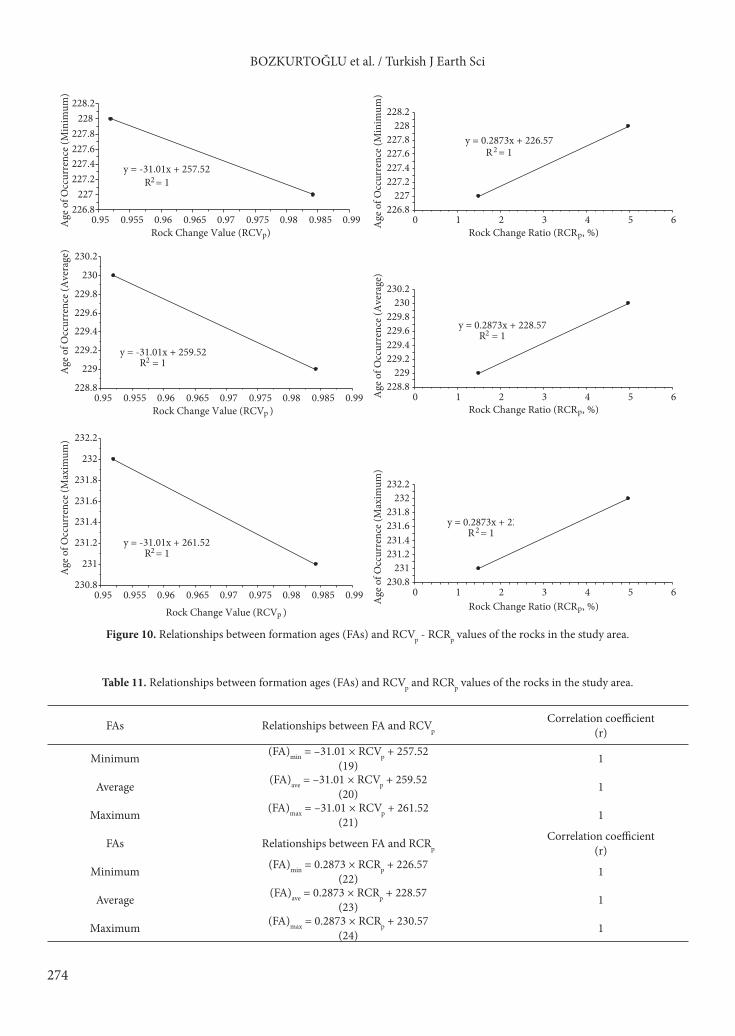
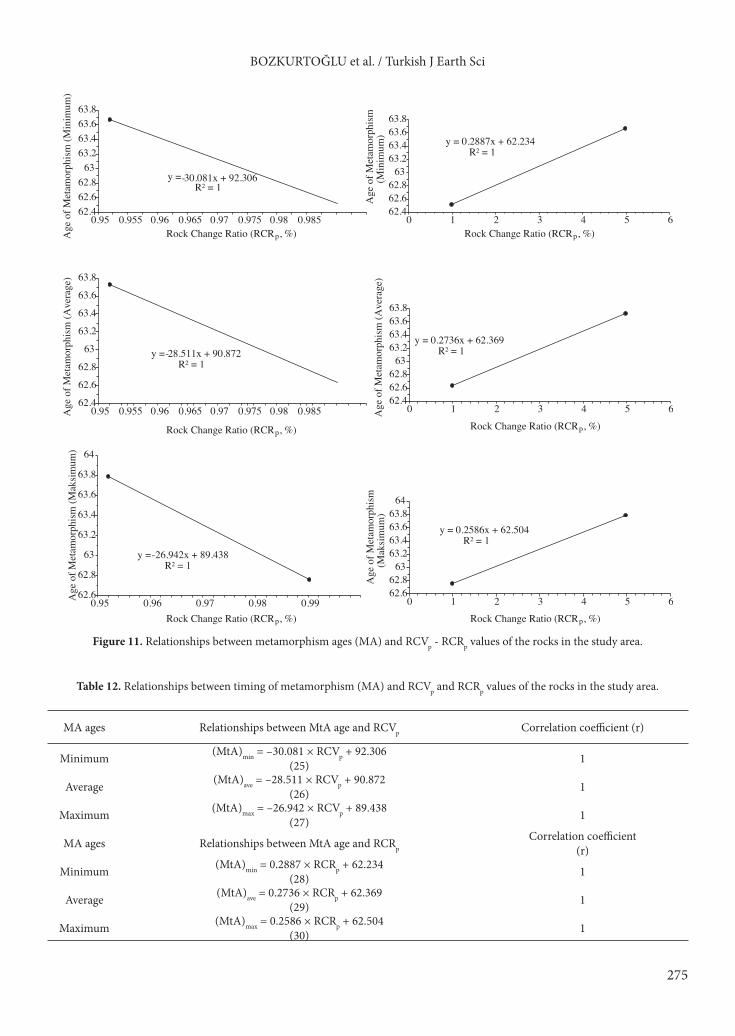
The group A rocks were formed 230 ± 2 Ma ago and group B rocks 229 ± 2 Ma ago (Özdamar 2011). Metamorphism occurred at 63.73 ± 0.06 Ma in group A rocks and 62.64 ± 0.12 Ma in group C rocks (Özdamar 2011). The relationships between formation ages (FAs) of
Table 5. Relationships between RCRp and physical properties of the metarhyolites.
Relationships between RCRp and physical properties Correlation coefficient (r)
γs = –23.789 × (RCRp)3 + 269.52 × (RCRp)
2 – 826.39 × (RCRp) + 3244.5 (7) 0.861w = 0.1313 × (RCRp)
3 – 1.5544 × (RCRp)2 + 5.167 × (RCRp) – 3.156 (8) 0.848
e = 0.0032 × (RCRp)3 – 0.0375 × (RCRp)
2 + 0.1247 × (RCRp) – 0.0745 (9) 0.839n = 0.2931 × (RCRp)
3 – 3.4711 × (RCRp)2 + 11.534 × (RCRp) – 6.7732 (10) 0.835
γd = –22.827 × (RCRp)3 + 260.65 × (RCRp)
2 – 837.15 × (RCRp) + 3222.3 (11) 0.792
Table 6. Point load strength index values of the metarhyolites.
Group name Point load strength index values, Is(50) (MPa)
Point load strength index average values, Is(50) (MPa)
A
A1 13.77
7.07A2 13.93A3 0.99A4 13.23
BB1 11.31
8.06B2 8.04B3 5.76
C 17.55 17.55
Table 7. Point load strength classification (Franklin & Broch 1972).
Description Point load strength index(MPa)
Equivalent uniaxial compressive strength (MPa)
Extremely high strength Over 10 Over 160Very high strength 3-10 50-160High strength 1-3 15-60Medium strength 0.3-1 5-16Low strength 0.1-0.3 1.6-5Very low strength 0.03-0.1 0.5-1.6Extremely low strength Less than 0.03 Less than 0.5
272
BOZKURTOĞLU et al. / Turkish J Earth Sci
minimum, average, and maximum values and RCVp and RCRp values are given in Figure 10 and Table 11. Eqs. (19) through (24), shown in Table 11, give the zone C rocks a formation age of 228 ± 2 Ma. The results also explain why the rocks of this zone remain fresh.
The relationships between metamorphism ages (MtAs) of minimum, average, and maximum values and RCVp and RCRp values are given in Figure 11 and Table 12. Eqs. (25) through (30) give the metamorphism age of 62.68 ± 0.11 Ma for group B rocks. This age is close to the metamorphism age of group C and explains the moderate rock-change conditions in group B rocks shown in Figure 5.
5. Results and conclusionThe metamorphic sequences in the Ilgın area have rocks of both Palaeozoic and Mesozoic ages. Metavolcanics are subalkaline and range from rhyodacite to rhyolite. These rocks have moderate to high dry density versus medium to very low porosity values, and their strengths change from medium to extremely high values. With these characteristics, the rock weathering in the field can be determined from fresh to moderately changed conditions.
y = -0.3109x3 + 4.4355x2 - 17.726x + 27.08R2 = 0.3211
02468
101214161820
0 1 2 3 4 5 6 7Rock Change Ratio (RCR p, %)
Poin
t Loa
d St
reng
th In
dex
(Is(
50),M
Pa)
Figure 8. Relationship between RCRp and point load strength index of the rocks in the study area.
y = 134.91e-0.8122x
R2 = 0.5248
5959.5
6060.5
6161.5
6262.5
0.94 0.95 0.96 0.97 0.98 0.99 1
Min
imum
K-A
r Age
y = 60.525e0.0119x
R2 = 0.7494
6060.5
6161.5
6262.5
6363.5
6464.5
0 1 2 3 4 5 6
Ave
rage
K-A
r Age
y = 217.55e-1.2811x
R2 = 0.7747
6060.5
6161.5
6262.5
6363.5
6464.5
0.94 0.95 0.96 0.97 0.98 0.99 1Rock Change Value (RCVp)
Rock Change Value (RCVp) Rock Change Value (RCVp)
Ave
rage
K-A
r Age
y = 343.55e-1.7291x
R2 = 0.8886
61
62
63
64
65
66
67
0.94 0.95 0.96 0.97 0.98 0.99 1Rock Change Value (RCVp)
Max
imum
K-A
r Age
y = 59.965e 0.0075x
R2 = 0.495
5959.5
6060.5
6161.5
6262.5
0 1 3 4 5 6Rock Change Ratio (RCRp ,%)
Min
imum
K-A
r Age
y = 60.525e0.0119x
R2 = 0.7494
6060.5
6161.5
6262.5
6363.5
6464.5
0 1 2
2
3 4 5 6Rock Change Ratio (RCRp ,%)
Ave
rage
K-A
r Age
Figure 9. Relationships between K-Ar ages and RCVp - RCRp values of the metarhyolites.
273
BOZKURTOĞLU et al. / Turkish J Earth Sci
In fact, the change of physical conditions of the rocks helps us to understand the high speed of the weathering with very small RCVp values. Additionally, these rocks were divided into 3 groups defined by their weathering conditions with RCVp and RCRp values in order to define the primary physical conditions of the rocks using the relationships between RCRp and physical properties (Figure 7, Table 5). These equations show that the strength
in the monolith-phase rocks was 27.08 MPa, specific gravity (γs) was 3244.50 kg/m3, and dry unit weight (γd) was 3222.30 kg/m3, where the RCRp value is equal to 0% and RCVp is equal to 1. After the development of fractures and cracking, the primary porosity, n, became 0.0485%, with a RCRp value of 0.75%. The voids in bulk composition developed with a 0.77% RCRp value where the void ratio is e = 0.00075, and atmospheric water would have been held
Table 8. Relationships between K-Ar ages and RCVp and RCRp values of the metarhyolites.
K-Ar ages Relationships between K-Ar age and RCVp
Correlation coefficient (r)
Minimum (K-Ar)min = 134.91 × e-0.8122 × (RCVp)
(13) 0.724
Average (K-Ar)ave = 217.55 × e-1.2811 × (RCVp)
(14) 0.880
Maximum (K-Ar)max = 343.55 × e-1.7291 × (RCVp)
(15) 0.943
K-Ar ages Relationships between K-Ar age and RCRp
Correlation coefficient (r)
Minimum (K-Ar)min = 59.965 × e0.0075 × (RCRp)
(16) 0.704
Average (K-Ar)ave = 60.525 × e0.0119 × (RCRp)
(17) 0.866
Maximum (K-Ar)max = 61.092 × e0.0162 × (RCRp)
(18) 0.932
Table 9. Lifetime of complete rock changes: calculations between K-Ar ages and RCVp and RCRp values.
K-Ar ages according to RCVp (Ma) K-Ar ages according to RCRp (Ma)
Minimum (Ma) Average (Ma) Maximum (Ma) Minimum (Ma) Average (Ma) Maximum (Ma)
64.184 67.405 70.660 64.157 67.375 70.693
Table 10. K-Ar age calculations according to RCVp and RCRp values of the metarhyolites.
Groupname
Remaining time according to the relationship between K-Ar ages and RCVp values for fully changed rock
Remaining time according to the relationship between K-Ar ages and RCRp values for fully changed rock
Minimum(Ma)
Average(Ma)
Maximum(Ma)
Minimum(Ma)
Average(Ma)
Maximum(Ma)
C 4.684 7.005 9.360 4.657 6.975 9.393B 2.484 4.805 7.160 2.457 4.775 7.193A 2.084 3.305 4.560 2.057 3.275 4.593
274
BOZKURTOĞLU et al. / Turkish J Earth Sci
y = -31.01x + 259.52R2 = 1
228.8
229
229.2
229.4
229.6
229.8
230
230.2
0.95 0.955 0.96 0.965 0.97 0.975 0.98 0.985 0.99Rock Change Value (RCVp )
Rock Change Value (RCVp )
Age
of O
ccur
renc
e (A
vera
ge)
y = -31.01x + 261.52R2 = 1
230.8
231
231.2
231.4
231.6
231.8
232
232.2
0.95 0.955 0.96 0.965 0.97 0.975 0.98 0.985 0.99
Age
of O
ccur
renc
e (M
axim
um)
y = -31.01x + 257.52R2 = 1
226.8227
227.2227.4227.6227.8
228228.2
0.95 0.955 0.96 0.965 0.97 0.975 0.98 0.985 0.99Rock Change Value (RCVp)
Age
of O
ccur
renc
e (M
inim
um)
y = 0.2873x + 226.57R2 = 1
226.8227
227.2227.4227.6227.8
228228.2
0 1 2 3 4 5 6Rock Change Ratio (RCRp, %)
Rock Change Ratio (RCRp, %)
Rock Change Ratio (RCRp, %)
Age
of O
ccur
renc
e (M
inim
um)
y = 0.2873x + 228.57R2 = 1
228.8229
229.2229.4229.6229.8
230230.2
0 1 2 3 4 5 6Age
of O
ccur
renc
e (A
vera
ge)
y = 0.2873x + 23R2 = 1
230.8231
231.2231.4231.6231.8
232232.2
0 1 2 3 4 5 6
Age
of O
ccur
renc
e (M
axim
um)
Table 11. Relationships between formation ages (FAs) and RCVp and RCRp values of the rocks in the study area.
FAs Relationships between FA and RCVpCorrelation coefficient
(r)
Minimum (FA)min = –31.01 × RCVp + 257.52 (19) 1
Average (FA)ave = –31.01 × RCVp + 259.52 (20) 1
Maximum (FA)max = –31.01 × RCVp + 261.52 (21) 1
FAs Relationships between FA and RCRpCorrelation coefficient
(r)
Minimum (FA)min = 0.2873 × RCRp + 226.57 (22) 1
Average (FA)ave = 0.2873 × RCRp + 228.57 (23) 1
Maximum (FA)max = 0.2873 × RCRp + 230.57 (24) 1
Figure 10. Relationships between formation ages (FAs) and RCVp - RCRp values of the rocks in the study area.
275
BOZKURTOĞLU et al. / Turkish J Earth Sci
Table 12. Relationships between timing of metamorphism (MA) and RCVp and RCRp values of the rocks in the study area.
MA ages Relationships between MtA age and RCVp Correlation coefficient (r)
Minimum (MtA)min = –30.081 × RCVp + 92.306 (25) 1
Average (MtA)ave = –28.511 × RCVp + 90.872 (26) 1
Maximum (MtA)max = –26.942 × RCVp + 89.438 (27) 1
MA ages Relationships between MtA age and RCRpCorrelation coefficient
(r)
Minimum (MtA)min = 0.2887 × RCRp + 62.234 (28) 1
Average (MtA)ave = 0.2736 × RCRp + 62.369 (29) 1
Maximum (MtA)max = 0.2586 × RCRp + 62.504 (30) 1
y = -30.081x + 92.306 R² = 1
62.462.662.8
6363.263.463.663.8
0.95 0.955 0.96 0.965 0.97 0.975 0.98 0.985
Age
of M
etam
orph
ism (M
inim
um)
y = -28.511x + 90.872 R² = 1
62.462.662.8
6363.263.463.663.8
0.95 0.955 0.96 0.965 0.97 0.975 0.98 0.985Age
of M
etam
orph
ism (A
vera
ge)
y = -26.942x + 89.438 R² = 1
62.6
62.8
63
63.2
63.4
63.6
63.8
64
0.95 0.96 0.97 0.98 0.99Age
of M
etam
orph
ism (M
aksim
um)
y = 0.2887x + 62.234 R² = 1
62.462.662.8
6363.263.463.663.8
0 1 2 3 4 5
Age
of M
etam
orph
ism
(Min
imum
)
Rock Change Ratio (RCRp, %) Rock Change Ratio (RCRp, %)
Rock Change Ratio (RCRp, %)
Rock Change Ratio (RCRp, %) Rock Change Ratio (RCRp, %)
Rock Change Ratio (RCRp, %)
y = 0.2736x + 62.369 R² = 1
62.462.662.8
6363.263.463.663.8
0 1 2 3 4 5Age
of M
etam
orph
ism (A
vera
ge)
y = 0.2586x + 62.504 R² = 1
62.662.8
6363.263.463.663.8
64
0 1 2 3 4 5
6
6
6
Age
of M
etam
orph
ism
(Mak
simum
)
Figure 11. Relationships between metamorphism ages (MA) and RCVp - RCRp values of the rocks in the study area.
276
BOZKURTOĞLU et al. / Turkish J Earth Sci
(w = 0.0206%), for the RCRp is equal to 0.79%. The RCVp and RCRp values also show that rocks in the study area change completely with the 9.01% RCRp value. Dry unit weight will also be smaller than 1.4 Mg/m3 when the RCRp is less than 8.11%. In this case, the Ilgın area rocks will also remain as rhyolite whereas the physical, mechanical, and mineralogical properties of the rocks will change for the 9.01% RCRp value and the soil structure will have formed. The RCVp value, strength, specific gravity (γs), dry unit weight (γd), water content (w), porosity (n), and void ratio (e) values will be equal to 0.914606, 0.041 MPa, 278.33 kg/m3, 142.76 kg/m3, 13.25%, 29.75%, and 0.35, respectively, for the 9.01% RCRp.
The rock change was compared with the K-Ar age values rather than the formation ages due to the new
formation of the rocks after metamorphism, where the weathering from fresh to weathered rock starts again. The full-rock change is related to the alkali ratio of the rocks. In the Ilgın area the alkali ratio of the rocks changes between 8.12% and 9.40% (the average is 8.89%), where the RCRp is 9.01% when the total alteration of all rocks will occur. The correspondence between these results explains that the RCVp and RCRp values are also very useful index values for determining both the initial and current situation of the rock easily. Furthermore, they also give an opportunity to predict the future condition of the rocks. In this study, the rock conditions in the Ilgın area were forecast with the aim of comparing the K-Ar age values versus RCVp and RCRp values. The interpretations show that the timing of full rock alteration in the Ilgın area is between 4.6 and 9.4 Ma.
References
Bell, F.G. 1994. Engineering in Rock Masses. Butterworth-Heinemann Ltd., Oxford.
Bozkurtoğlu, E. 2003. Çanakkale-Tuzla Yöresi Volkanik Kayaçlarında Süreksizliklerin Ayrışma-Alterasyon Olaylarına Etkisinin Araştırılması. PhD Thesis, İstanbul Technical University Faculty of Mines, İstanbul, Turkey (in Turkish; unpublished).
Bozkurtoğlu, E., Vardar, M., Suner, F. & Zambak C. 2006. A new numerical approach to weathering and alteration in rock using a pilot area in the Tuzla geothermal area, Turkey. Engineering Geology 87, 33-47.
Browne, P.R.L. 1998. Hydrothermal Alteration. Geothermal Institute, University of Auckland, Auckland, New Zealand.
Carroll, D. 1970. Rock Weathering. Plenum Press, New York.
Franklin, J.A. & Broch, E. 1972. The point load strength test. International Journal of Rock Mechanics and Mining Science 9, 669-697.
IAEG Commission of Engineering Geological Mapping. 1979. Classification of rocks and soils for engineering geological mapping. Part 1 – Rock and soil materials. Bulletin of the International Association of Engineering Geology 19, 71-364.
Irvine, T.N. & Baragar, W.R.A. 1971. A guide to chemical classification of the common volcanic rocks. Canadian Journal of Earth Sciences 8, 523-548.
ISRM. 1985. Suggested method for determining point load strength. International Journal of Rock Mechanics and Mining Science 22/2, 53-60.
Okay, A.I. & Tüysüz, O. 1999. Tethyan sutures of northern Turkey. In: Durand, B., Jolivet, L., Horvath, F. & Seranne, M. (eds), The Mediterranean Basins: Tertiary Extension within the Alpine Orogeny. Geological Society of London, Special Publication, 475-515.
Özdamar, Ş. 2011. Geochemistry and K-Ar ages of metasedimentary and metasomatized high-K metavolcanic rocks in the Afyon-Bolkardağ Zone (Ilgin-Konya), SW Turkey. İTU Scientific Research Project 33366 (unpublished data).
Özdamar, Ş., Roden, M.F., Esenli, F., Uz, B. & Wampler, J.M. 2012. Geochemical features and K-Ar age data from metadetrital rocks and high-K metasomatized metarhyolites in the Afyon-Bolkardağ Zone (Ilgin-Konya), SW Turkey. Neues Jahrbuch für Mineralogie-Abhandlungen 189/2, 155-176.
Winchester, J.A. & Floyd, P.A. 1977. Geochemical discrimination of different magma series and their differentiation products using immobile elements. Chemical Geology 20, 325-343.
Turkish Standards Institution. 1982. TS-699: Tabii Yapı Taşları Muayene ve Deney Metodları. Türk Standartları Enstitüsü, Ankara (in Turkish).


![Scanned PDF [8.89 MB]](https://img.pdfslide.us/doc/110x75/5892fab81a28abf42b8bc6a3/scanned-pdf-889-mb.jpg)