Embed Size (px)
Citation preview
International Journal of Science and Advanced Technology (ISSN 2221-8386) Volume 1 No 6 August 2011
http://www.ijsat.com
89
Prediction of Wax Deposition Risk of Malaysian Crude from Viscosity-Temperature
Correlation for Dead Crude
Ekeh Modesty Kelechukwu
Dept. of petroleum engineering, UCSI University
56000 Cheras, Kuala Lumpur
E-mail: [email protected]
Abstract- Malaysian oil production occurs offshore
and extreme environment, its cold temperature
could make wax deposition problems almost
inevitable as most of the oilfields approaching their
matured stage of production. Wax deposition had
demonstrated a critical concern in the quest to
increase oil recovery from producing reservoirs.
The unwanted effect of wax deposition could cause
reduced productivity, complete plugging of
pipeline, minimum profitability and other hazardous
risks; while its mitigation operations and production
losses are expensive and economically unjustified.
This study employed Standing correlation model for
the viscosity-temperature relationship of dead crude
to predict wax crystallization point. The predicted
wax appearance points were in good agreement
with the experimental values of the Malaysian dead
crude oils, with average absolute deviation (AAD
%) of 11.71%. However, the Standing model varied
significantly with the measured viscosity data. The
main goal of this work was to predict wax
deposition threat or related problems in Malaysian
fields.
Keywords- Prediction of wax; potential wax
problem; Malaysian crude.
I. I. Introduction
The presence of paraffin waxes in crude oils
presents a multitude of problems to the producers.
The problems associated with their presence range
from minor to severe, and depend on their quantity
and composition. Petroleum production can be
significantly affected by deposition of paraffin wax
during crude production, with devastating economic
consequences. Hence, predicting wax problems
within the production tubing and flowlines that
could decrease or halt production is essential in
optimizing production and operating efficiency. The
liquid hydrocarbons initially are in equilibrium in
the reservoir under super-saturated temperature-
pressure conditions. Paraffin generally consist of
straight and branched chain hydrocarbons and
precipitates out of waxy crude when there is a slight
change in equilibrium conditions, causing a loss of
solubility of the wax in the crude. A decrease in
temperature is the most common cause of paraffin
International Journal of Science and Advanced Technology (ISSN 2221-8386) Volume 1 No 6 August 2011
http://www.ijsat.com
90
wax precipitation, though many other factors could affect the process
However, the solubility of paraffin waxes is not
only sensitive to temperature variation, but also an
integration of physiochemical properties of the
crude and other operation factors in production
system. Thus, accurate knowledge of the nature of
any crude oil, as characterized by its
physiochemical properties or classification is vital
in the quest for solution to production risk or
intervention strategy for handling waxy crude. The
main goal of this work was to predict wax
deposition threat or related problems in Malaysian
fields, using experimental methodology to simulate
wax deposition in the laboratory.
II. Wax Deposition Mechanism
A problem of paraffin wax may be described as a
situation in which a predominantly organic deposit
hampers the production of crude oil; the loss crude
production from well depends on the severity and
location of the deposition. In a pioneering work,
Burger et al, (1981) investigated four wax
deposition mechanisms: the mechanism of paraffin
wax deposition are governed by molecular diffusion
of wax molecules; shear dispersion of wax
crystallites and Brownian diffusion of wax
crystallites. Gravity settling of paraffin crystals in
flow line conditions is negligible, because it’s
dominated by shear dispersion (Burger et al., 1981).
Molecular diffusion is the deposition mechanism
prevalent for tubing deposition in flowing well that
maintains oil temperature, well above the cloud
point until the oil is coming up the tubing (Bern et
al., 1980; Leiroz and Azevedo, 2005). Deposition is
enhanced as result of lateral transportation by the.
In wax deposition mechanism process, a
concentration gradient is produced in the oil as a
result of temperature gradient profile, due to
increasing solubility of waxes with increasing
temperature. The concentration caused waxes in
solution to diffuse from the warmer oil, which has a
greater concentration of dissolved waxes, to the
colder oil, which has a lower concentration,
resulting to molecular diffusion of the paraffin
crystals towards the surface wall.
III. Reference Crude Oils Characterization
Physiochemical properties (API gravity and
pour point), density, viscosity, Wax Appearance
Temperature as well as Wax content of the five
reference crude oils were measured. Table 1
presents results analysis of crude samples from
various oil fields in Malaysia, generated at the
unipem laboratory of the Universiti Teknologi
Malaysia. The crudes varied greatly in their
characteristics and composition. They varied in
color from black to light brown, and density
measured at 15 °C, varies from 0.80 to 0.98 kg/L,
viscosity at 40 °C varied between 3.83 to 37.50 cSt
and at 70 °C varies from 2.25 to 32.50 cSt. Water
content in all the sampled crude were very
minimum, (less than 1% vol.). The API Gravity
ranges from light oil to heavy crude oil, (12.6 to
International Journal of Science and Advanced Technology (ISSN 2221-8386) Volume 1 No 6 August 2011
http://www.ijsat.com
91
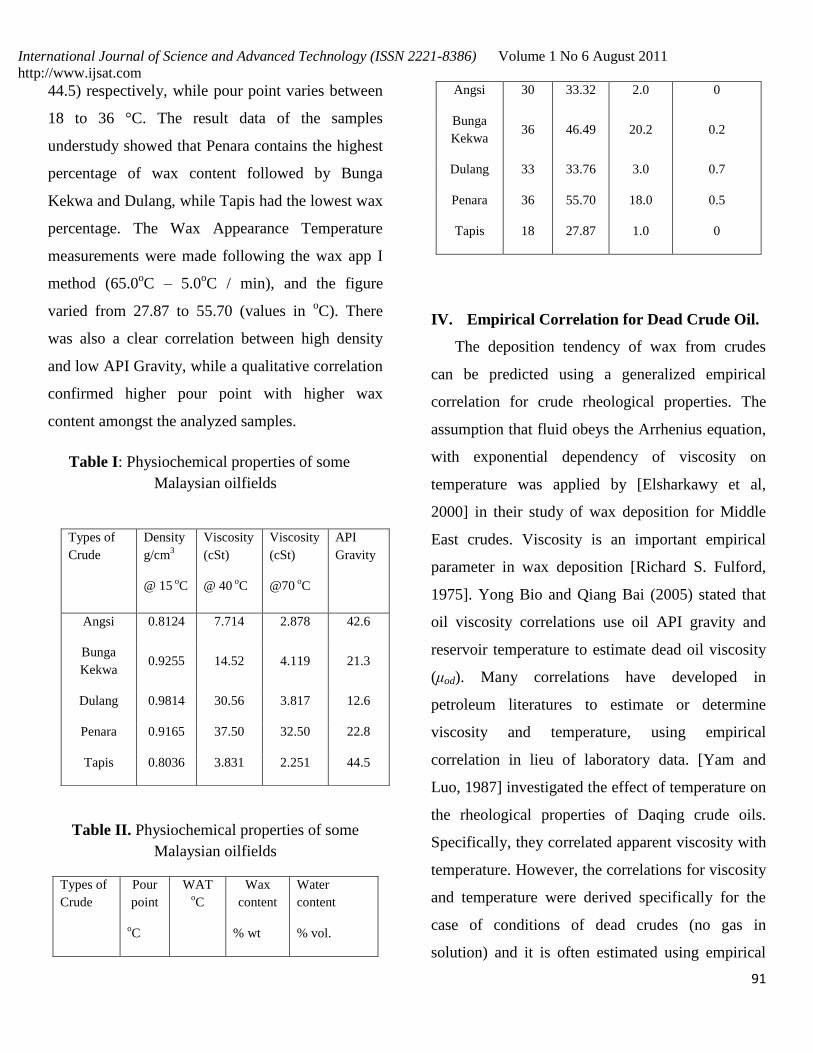
44.5) respectively, while pour point varies between
18 to 36 °C. The result data of the samples
understudy showed that Penara contains the highest
percentage of wax content followed by Bunga
Kekwa and Dulang, while Tapis had the lowest wax
percentage. The Wax Appearance Temperature
measurements were made following the wax app I
method (65.0oC – 5.0
oC / min), and the figure
varied from 27.87 to 55.70 (values in oC). There
was also a clear correlation between high density
and low API Gravity, while a qualitative correlation
confirmed higher pour point with higher wax
content amongst the analyzed samples.
Table I: Physiochemical properties of some
Malaysian oilfields
Table II. Physiochemical properties of some
Malaysian oilfields
Types of
Crude
Pour
point
oC
WAT
oC
Wax
content
% wt
Water
content
% vol.
Angsi 30 33.32 2.0 0
Bunga
Kekwa 36 46.49 20.2 0.2
Dulang 33 33.76 3.0 0.7
Penara 36 55.70 18.0 0.5
Tapis 18 27.87 1.0 0
IV. Empirical Correlation for Dead Crude Oil.
The deposition tendency of wax from crudes
can be predicted using a generalized empirical
correlation for crude rheological properties. The
assumption that fluid obeys the Arrhenius equation,
with exponential dependency of viscosity on
temperature was applied by [Elsharkawy et al,
2000] in their study of wax deposition for Middle
East crudes. Viscosity is an important empirical
parameter in wax deposition [Richard S. Fulford,
1975]. Yong Bio and Qiang Bai (2005) stated that
oil viscosity correlations use oil API gravity and
reservoir temperature to estimate dead oil viscosity
(μod). Many correlations have developed in
petroleum literatures to estimate or determine
viscosity and temperature, using empirical
correlation in lieu of laboratory data. [Yam and
Luo, 1987] investigated the effect of temperature on
the rheological properties of Daqing crude oils.
Specifically, they correlated apparent viscosity with
temperature. However, the correlations for viscosity
and temperature were derived specifically for the
case of conditions of dead crudes (no gas in
solution) and it is often estimated using empirical
Types of
Crude
Density
g/cm3
@ 15 oC
Viscosity
(cSt)
@ 40 oC
Viscosity
(cSt)
@70 oC
API
Gravity
Angsi 0.8124 7.714 2.878 42.6
Bunga
Kekwa 0.9255 14.52 4.119 21.3
Dulang 0.9814 30.56 3.817 12.6
Penara 0.9165 37.50 32.50 22.8
Tapis 0.8036 3.831 2.251 44.5
International Journal of Science and Advanced Technology (ISSN 2221-8386) Volume 1 No 6 August 2011
http://www.ijsat.com
92
corrections developed by a number of investigators
including Baal (1946), Beggs and Robinson (1975),
Standing (1981), Glaso (1985), Khan (1987) and
Ahmed (1989).
The temperature dependence of viscosity is the
phenomenon by which liquid viscosity tends to
decrease as its temperature increases, vice versa.
Realizing that the viscosity of waxy-crude oil at low
temperature is non-Newtonian, and its behavior is
governed by changes in temperature. As the
temperature decreases, the waxy-crude oil becomes
more viscous, hence its viscosity depends on
temperature decrease. Therefore, as viscosity
increases in cold areas the flow resistance increases
and if the temperature becomes low enough, the
wax in crude may precipitate and deposit.
Consequently, organic deposition from reservoir oil
occurring in a specific flow regime should be
identifiable from the characteristic oil viscosity-
temperature correlation. In (1981), Standing
published empirical correlations for estimating
viscosity-temperature curves, using values of
viscosity, temperature and the crude gravities. The
Standing correlation for dead oil is expressed as:
(
) (
)
1
Where A = (
)
and
μod = viscosity of dead crude oil (cP).
The above correlation equation was developed
for determining the viscosity of the dead crude oil
as a function of temperature and API gravity of the
crude. [Kunal et al. 2000] suggests when waxy
crude is allowed to cool below the WAT,
precipitation of waxes continues, resulting in an
increase in the number and size of crystals. These
crystals, if undisturbed, tend to cohere together to
form a netlike structure trapping oil within. As a
result, the oil attains gel-like characteristics and the
viscosity increases. At certain temperature,
depending on the amount of wax precipitated and
the strength of the network, the oil may cease to
flow. Flow assurance studies for waxy systems
often require measurements of at least three crude
oil properties such as wax appearance temperature
(WAT), pour points and viscosity [Kunal et al.
2000]. Using the WAT and pour point, the
rheological and problematic behavior of waxy crude
can be mapped into three regions on a temperature
scale:
A region defined by temperature below the pour
point, where the fluid exhibits highly non-
Newtonian behavior and oil may gel under
quiescent conditions.
A region of mildly non- Newtonian behavior
defined by the temperature between the WAT and
pour point.
Generally, the wax appearance temperature (WAT)
and pour point measurements are performed on
crude oil samples and used as conservative
International Journal of Science and Advanced Technology (ISSN 2221-8386) Volume 1 No 6 August 2011
http://www.ijsat.com
93
estimates for making flow-assurance-related
decisions.
V. V. Result and Discussion
VI. Wax Prediction in Malaysian Oilfields
Among the rheological properties of reservior
oil which affect the flow behaviour in the producing
well, the viscosity appears to be the most important.
This is due to the fact that other properties such as
ºAPI gravity and wax % wt are invariantly with
changing temperature of the well. Consequently,
organic deposition from reservoir oil occuring in a
specific flow regime could be identifiable from the
characteristic oil viscosity-temperature correlation.
The crude viscosities have been estimated using
Standing correlation model and then temperatures
were adjusted accordingly. Equation (1) was
employed to determine wax precipitation point
using viscosity-temperature relationship for dead
crude oil as a function of temperature and API
gravity of the crude. Precipitation of waxes results
in an increase in the number and size of crystals and
lead to higher viscosity. The rheological and
problematic behavior of waxy crude can be mapped
into regions on a temperature scale [Kunal et al,
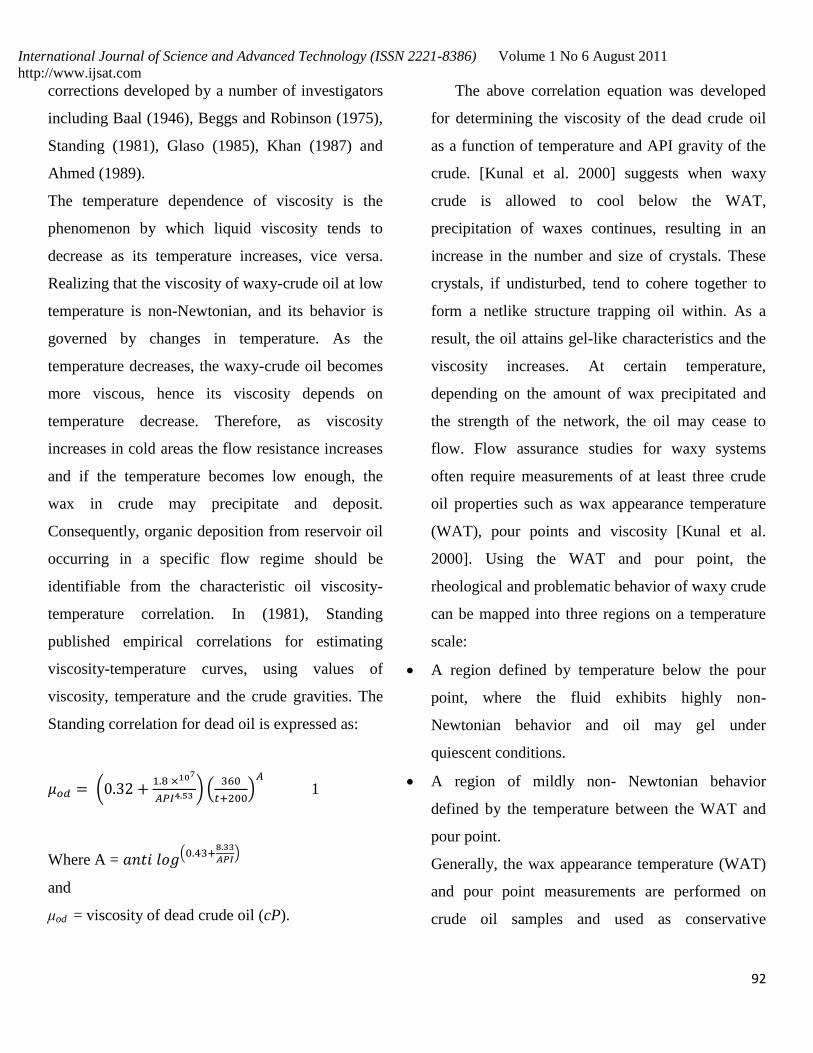
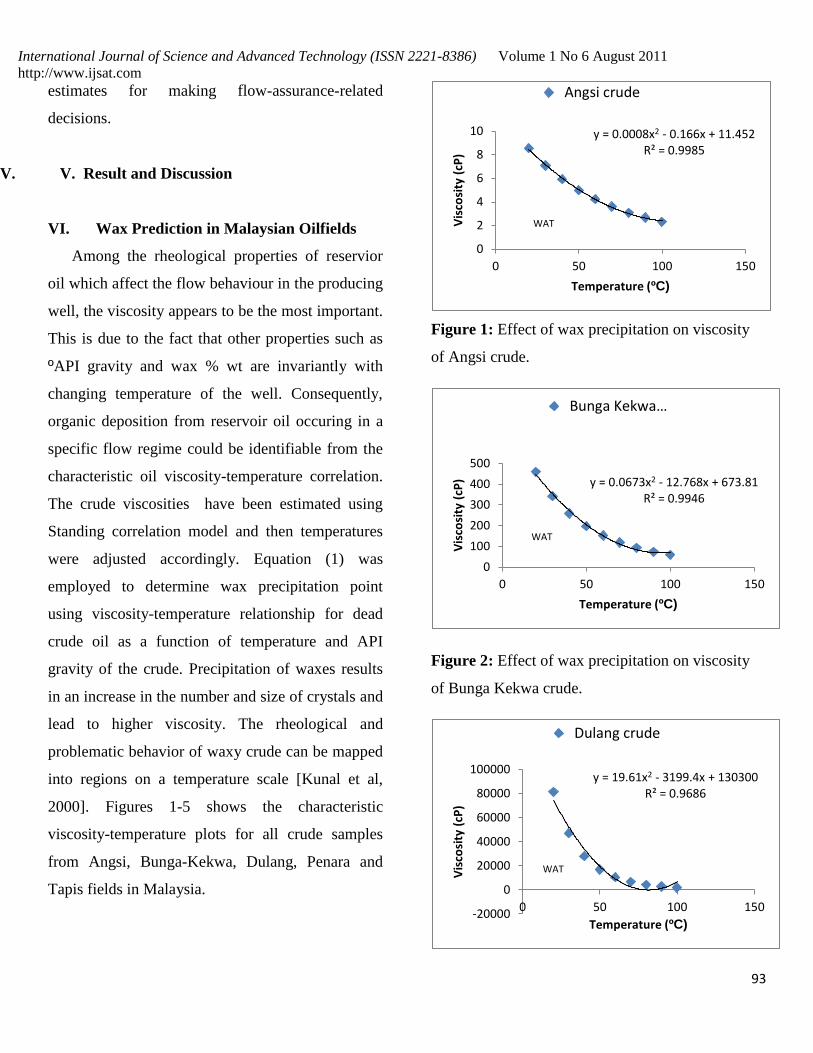
2000]. Figures 1-5 shows the characteristic
viscosity-temperature plots for all crude samples
from Angsi, Bunga-Kekwa, Dulang, Penara and
Tapis fields in Malaysia.
Figure 1: Effect of wax precipitation on viscosity
of Angsi crude.
Figure 2: Effect of wax precipitation on viscosity
of Bunga Kekwa crude.
y = 0.0008x2 - 0.166x + 11.452 R² = 0.9985
0
2
4
6
8
10
0 50 100 150
Vis
cosi
ty (
cP)
Temperature (ºC)
Angsi crude
WAT
y = 0.0673x2 - 12.768x + 673.81 R² = 0.9946
0
100
200
300
400
500
0 50 100 150
Vis
cosi
ty (
cP)
Temperature (ºC)
Bunga Kekwa…
WAT
y = 19.61x2 - 3199.4x + 130300 R² = 0.9686
-20000
0
20000
40000
60000
80000
100000
0 50 100 150
Vis
cosi
ty (
cP)
Temperature (ºC)
Dulang crude
WAT
International Journal of Science and Advanced Technology (ISSN 2221-8386) Volume 1 No 6 August 2011
http://www.ijsat.com
94
Figure 3: Effect of wax precipitation on viscosity
of Dulang crude
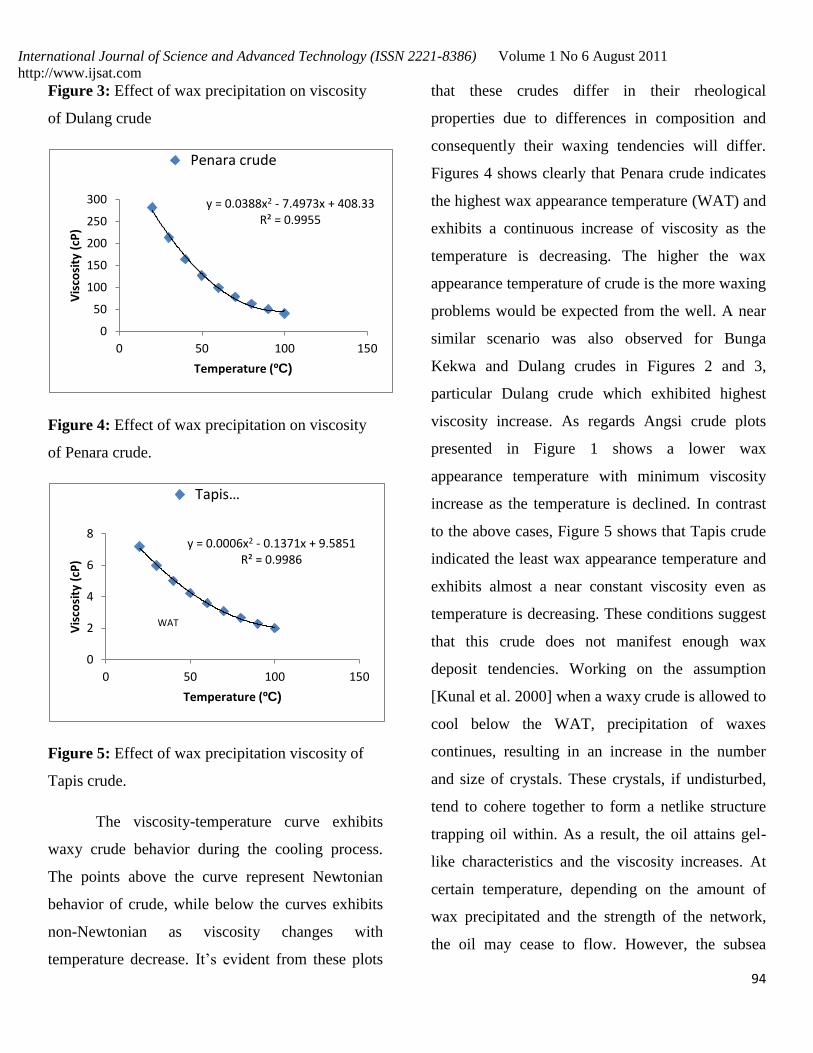
Figure 4: Effect of wax precipitation on viscosity
of Penara crude.
Figure 5: Effect of wax precipitation viscosity of
Tapis crude.
The viscosity-temperature curve exhibits
waxy crude behavior during the cooling process.
The points above the curve represent Newtonian
behavior of crude, while below the curves exhibits
non-Newtonian as viscosity changes with
temperature decrease. It’s evident from these plots
that these crudes differ in their rheological
properties due to differences in composition and
consequently their waxing tendencies will differ.
Figures 4 shows clearly that Penara crude indicates
the highest wax appearance temperature (WAT) and
exhibits a continuous increase of viscosity as the
temperature is decreasing. The higher the wax
appearance temperature of crude is the more waxing
problems would be expected from the well. A near
similar scenario was also observed for Bunga
Kekwa and Dulang crudes in Figures 2 and 3,
particular Dulang crude which exhibited highest
viscosity increase. As regards Angsi crude plots
presented in Figure 1 shows a lower wax
appearance temperature with minimum viscosity
increase as the temperature is declined. In contrast
to the above cases, Figure 5 shows that Tapis crude
indicated the least wax appearance temperature and
exhibits almost a near constant viscosity even as
temperature is decreasing. These conditions suggest
that this crude does not manifest enough wax
deposit tendencies. Working on the assumption
[Kunal et al. 2000] when a waxy crude is allowed to
cool below the WAT, precipitation of waxes
continues, resulting in an increase in the number
and size of crystals. These crystals, if undisturbed,
tend to cohere together to form a netlike structure
trapping oil within. As a result, the oil attains gel-
like characteristics and the viscosity increases. At
certain temperature, depending on the amount of
wax precipitated and the strength of the network,
the oil may cease to flow. However, the subsea
y = 0.0388x2 - 7.4973x + 408.33 R² = 0.9955
0
50
100
150
200
250
300
0 50 100 150
Vis
cosi
ty (
cP)
Temperature (ºC)
Penara crude
y = 0.0006x2 - 0.1371x + 9.5851 R² = 0.9986
0
2
4
6
8
0 50 100 150
Vis
cosi
ty (
cP)
Temperature (ºC)
Tapis…
WAT

International Journal of Science and Advanced Technology (ISSN 2221-8386) Volume 1 No 6 August 2011
http://www.ijsat.com
95
temperature of the oilfields is averagely 27ºC
whereas the surface temperature fluctuates between
28 to 34ºC, which is below most of the crude’s wax
appearance temperature. The viscosity behaviors of
most of the crudes were very sensitive to
temperature change. Hence, the formed wax crystals
in the oil leads to increase in viscosity as the
temperature decreased. Based on the evaluated
samples and their viscosity varying by several
orders of magnitude at declining temperature,
majority of the crudes has exhibited propensity for
potential waxing problems during crude
productions.
Figure 6: Measured and predicted wax appearance
temperature (WAT).
A simple and generalized correlation has
been presented for predicting wax precipitation
point based on viscosity-temperature correlation.
Figure 6 presents the plot of measured and predicted
wax appearance temperature (WAT) of the
reference crudes. From the result of Figure 6, it’s
clear that wax appearance temperature predicted
from the empirical correlation model compares well
with the measured WAT of all the crude samples
with absolute average deviation (%AAD) of
11.71%.
Figure 4.35:Effect of temperature decrease on
crude properties for Angsi crude.
Figure 4.36: Effect of temperature decrease on
crude properties for Bunga Kekwa crude
y = 1.2012x - 4.6019 R² = 0.9164
20
30
40
50
60
70
20 30 40 50 60
Pre
dic
ted
WA
T ºC
Measured WAT ºC
0
5
10
15
20
25
30
0
20
40
60
80
100
120
0 2 4 6 8 10
Po
ur
po
int
(ºC
)
Tem
pe
ratu
re (ºC
) Viscosity (cP)
Angsi crude Tempt - Viscosity
Pour point - Viscosity
0
5
10
15
20
25
30
35
40
0
20
40
60
80
100
120
0 100 200 300 400 500
Po
ur
po
int
(ºC
)
Tem
pe
ratu
re (ºC
)
Viscosity (cP)
Bunga Kekwa crude
Tempt - Viscosity
Pour point - Viscosity
International Journal of Science and Advanced Technology (ISSN 2221-8386) Volume 1 No 6 August 2011
http://www.ijsat.com
96
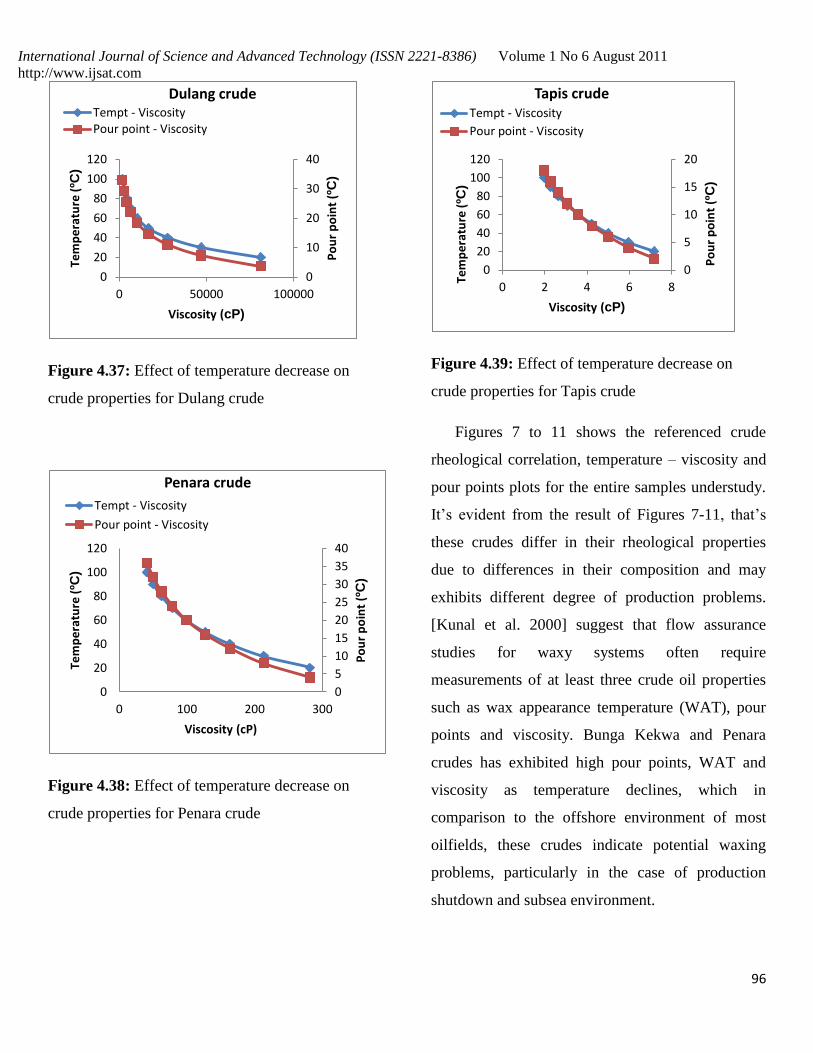
Figure 4.37: Effect of temperature decrease on
crude properties for Dulang crude
Figure 4.38: Effect of temperature decrease on
crude properties for Penara crude
Figure 4.39: Effect of temperature decrease on
crude properties for Tapis crude
Figures 7 to 11 shows the referenced crude
rheological correlation, temperature – viscosity and
pour points plots for the entire samples understudy.
It’s evident from the result of Figures 7-11, that’s
these crudes differ in their rheological properties
due to differences in their composition and may
exhibits different degree of production problems.
[Kunal et al. 2000] suggest that flow assurance
studies for waxy systems often require
measurements of at least three crude oil properties
such as wax appearance temperature (WAT), pour
points and viscosity. Bunga Kekwa and Penara
crudes has exhibited high pour points, WAT and
viscosity as temperature declines, which in
comparison to the offshore environment of most
oilfields, these crudes indicate potential waxing
problems, particularly in the case of production
shutdown and subsea environment.
0
10
20
30
40
0
20
40
60
80
100
120
0 50000 100000
Po
ur
po
int
(ºC
)
Tem
pe
ratu
re (ºC
)
Viscosity (cP)
Dulang crude Tempt - ViscosityPour point - Viscosity
0
5
10
15
20
25
30
35
40
0
20
40
60
80
100
120
0 100 200 300
Po
ur
po
int
(ºC
)
Tem
pe
ratu
re (ºC
)
Viscosity (cP)
Penara crude
Tempt - Viscosity
Pour point - Viscosity
0
5
10
15
20
0
20
40
60
80
100
120
0 2 4 6 8
Po
ur
po
int
(ºC
)
Tem
pe
ratu
re (ºC
)
Viscosity (cP)
Tapis crude Tempt - Viscosity
Pour point - Viscosity
International Journal of Science and Advanced Technology (ISSN 2221-8386) Volume 1 No 6 August 2011
http://www.ijsat.com
97
Angsi and Dulang crudes, their plots presented
in Figure 7 and 9 also showed an average possibility
of gelling and wax deposition in their respective
fields’ problems, given such scenario as described
above. Figure 11 shows that Tapis crude has the
least possibility of any paraffin wax deposition
potential, as the physical parameters studied
remained minimum even at low temperatures.
Therefore, the majority of oilfields crude samples
evaluated in this study clearly demonstrated the
possibility of wax becoming a problem, considering
their high pour point and viscosity varying by
several orders of magnitude at declining
temperature, which is an obvious indication for
potential wax problems during crude productions.
VII. Comparison of Standing’s Correlation
Model with Experimental Data
The application of dead oil viscosity correlation to
crude oils from different sources or fields is
necessary to evaluate a crude oil with respect to
viscosity changes with temperature. Since, for a
given crude oil, the slope changes with temperature
for different crude oil fractions from same natural
source. It is evident generally that as temperature
increases the viscosity of each oil decreases. The
comparative viscosity-temperature variation of the
experimental results and the simulated from
(Standing’s correlation model) of Malaysian crudes
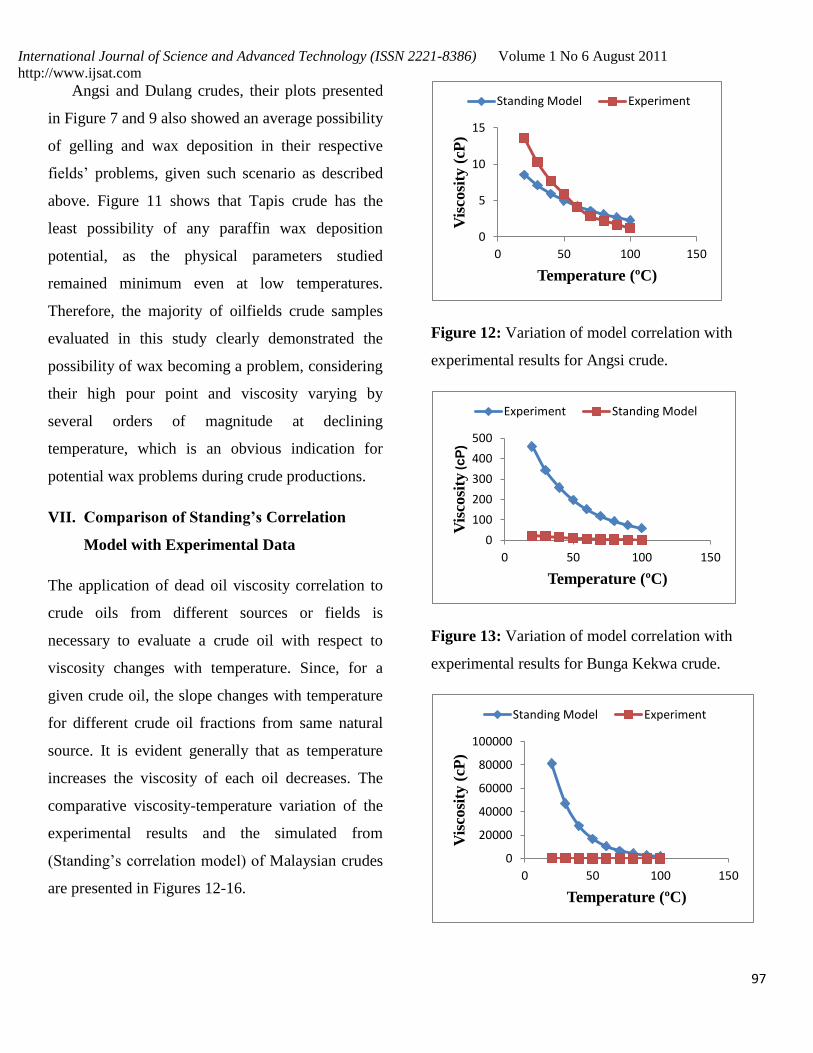
are presented in Figures 12-16.
Figure 12: Variation of model correlation with
experimental results for Angsi crude.
Figure 13: Variation of model correlation with
experimental results for Bunga Kekwa crude.
0
5
10
15
0 50 100 150
Vis
cosi
ty (
cP)
Temperature (ºC)
Standing Model Experiment
0
100
200
300
400
500
0 50 100 150
Vis
cosi
ty (cP
)
Temperature (ºC)
Experiment Standing Model
0
20000
40000
60000
80000
100000
0 50 100 150
Vis
cosi
ty (
cP)
Temperature (ºC)
Standing Model Experiment
International Journal of Science and Advanced Technology (ISSN 2221-8386) Volume 1 No 6 August 2011
http://www.ijsat.com
98
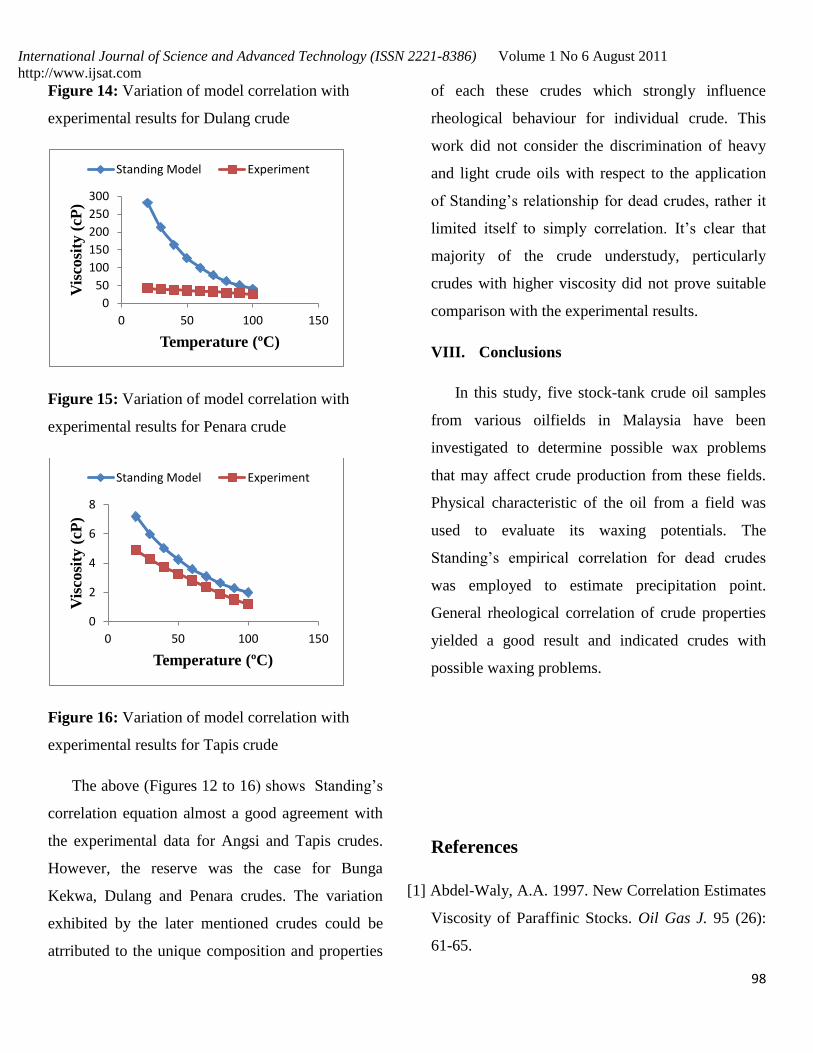
Figure 14: Variation of model correlation with
experimental results for Dulang crude
Figure 15: Variation of model correlation with
experimental results for Penara crude
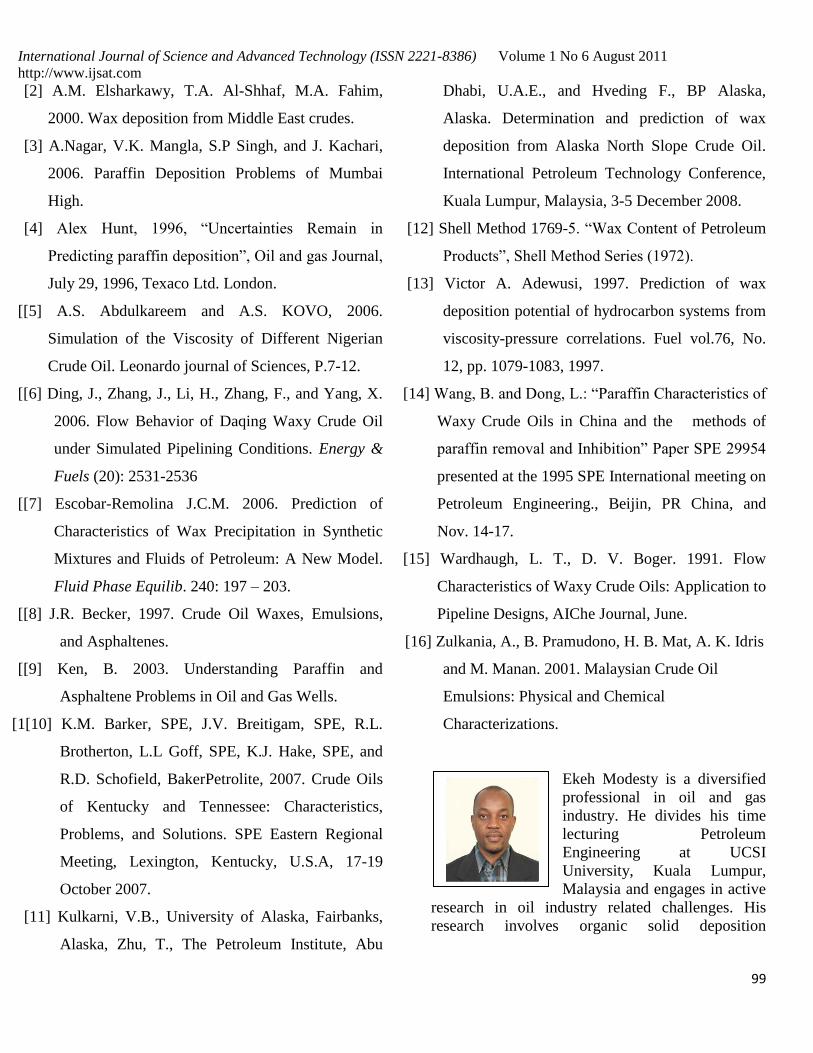
Figure 16: Variation of model correlation with
experimental results for Tapis crude
The above (Figures 12 to 16) shows Standing’s
correlation equation almost a good agreement with
the experimental data for Angsi and Tapis crudes.
However, the reserve was the case for Bunga
Kekwa, Dulang and Penara crudes. The variation
exhibited by the later mentioned crudes could be
atrributed to the unique composition and properties
of each these crudes which strongly influence
rheological behaviour for individual crude. This
work did not consider the discrimination of heavy
and light crude oils with respect to the application
of Standing’s relationship for dead crudes, rather it
limited itself to simply correlation. It’s clear that
majority of the crude understudy, perticularly
crudes with higher viscosity did not prove suitable
comparison with the experimental results.
VIII. Conclusions
In this study, five stock-tank crude oil samples
from various oilfields in Malaysia have been
investigated to determine possible wax problems
that may affect crude production from these fields.
Physical characteristic of the oil from a field was
used to evaluate its waxing potentials. The
Standing’s empirical correlation for dead crudes
was employed to estimate precipitation point.
General rheological correlation of crude properties
yielded a good result and indicated crudes with
possible waxing problems.
References
[1] Abdel-Waly, A.A. 1997. New Correlation Estimates
Viscosity of Paraffinic Stocks. Oil Gas J. 95 (26):
61-65.
0
50
100
150
200
250
300
0 50 100 150
Vis
cosi
ty (
cP)
Temperature (ºC)
Standing Model Experiment
0
2
4
6
8
0 50 100 150
Vis
cosi
ty (
cP)
Temperature (ºC)
Standing Model Experiment
International Journal of Science and Advanced Technology (ISSN 2221-8386) Volume 1 No 6 August 2011
http://www.ijsat.com
99
[2] A.M. Elsharkawy, T.A. Al-Shhaf, M.A. Fahim,
2000. Wax deposition from Middle East crudes.
[3] A.Nagar, V.K. Mangla, S.P Singh, and J. Kachari,
2006. Paraffin Deposition Problems of Mumbai
High.
[4] Alex Hunt, 1996, “Uncertainties Remain in
Predicting paraffin deposition”, Oil and gas Journal,
July 29, 1996, Texaco Ltd. London.
[[5] A.S. Abdulkareem and A.S. KOVO, 2006.
Simulation of the Viscosity of Different Nigerian
Crude Oil. Leonardo journal of Sciences, P.7-12.
[[6] Ding, J., Zhang, J., Li, H., Zhang, F., and Yang, X.
2006. Flow Behavior of Daqing Waxy Crude Oil
under Simulated Pipelining Conditions. Energy &
Fuels (20): 2531-2536
[[7] Escobar-Remolina J.C.M. 2006. Prediction of
Characteristics of Wax Precipitation in Synthetic
Mixtures and Fluids of Petroleum: A New Model.
Fluid Phase Equilib. 240: 197 – 203.
[[8] J.R. Becker, 1997. Crude Oil Waxes, Emulsions,
and Asphaltenes.
[[9] Ken, B. 2003. Understanding Paraffin and
Asphaltene Problems in Oil and Gas Wells.
[1[10] K.M. Barker, SPE, J.V. Breitigam, SPE, R.L.
Brotherton, L.L Goff, SPE, K.J. Hake, SPE, and
R.D. Schofield, BakerPetrolite, 2007. Crude Oils
of Kentucky and Tennessee: Characteristics,
Problems, and Solutions. SPE Eastern Regional
Meeting, Lexington, Kentucky, U.S.A, 17-19
October 2007.
[11] Kulkarni, V.B., University of Alaska, Fairbanks,
Alaska, Zhu, T., The Petroleum Institute, Abu
Dhabi, U.A.E., and Hveding F., BP Alaska,
Alaska. Determination and prediction of wax
deposition from Alaska North Slope Crude Oil.
International Petroleum Technology Conference,
Kuala Lumpur, Malaysia, 3-5 December 2008.
[12] Shell Method 1769-5. “Wax Content of Petroleum
Products”, Shell Method Series (1972).
[13] Victor A. Adewusi, 1997. Prediction of wax
deposition potential of hydrocarbon systems from
viscosity-pressure correlations. Fuel vol.76, No.
12, pp. 1079-1083, 1997.
[14] Wang, B. and Dong, L.: “Paraffin Characteristics of
Waxy Crude Oils in China and the methods of
paraffin removal and Inhibition” Paper SPE 29954
presented at the 1995 SPE International meeting on
Petroleum Engineering., Beijin, PR China, and
Nov. 14-17.
[15] Wardhaugh, L. T., D. V. Boger. 1991. Flow
Characteristics of Waxy Crude Oils: Application to
Pipeline Designs, AIChe Journal, June.
[16] Zulkania, A., B. Pramudono, H. B. Mat, A. K. Idris
and M. Manan. 2001. Malaysian Crude Oil
Emulsions: Physical and Chemical
Characterizations.
Ekeh Modesty is a diversified
professional in oil and gas
industry. He divides his time
lecturing Petroleum
Engineering at UCSI
University, Kuala Lumpur,
Malaysia and engages in active
research in oil industry related challenges. His
research involves organic solid deposition

International Journal of Science and Advanced Technology (ISSN 2221-8386) Volume 1 No 6 August 2011
http://www.ijsat.com
100
management in offshore environment, Enhanced Oil
Recovery and Future Energy Sustainability.
Engr. Ekeh is a professional member of Society of
Petroleum Engineers and has received certification
from Society of Petroleum Engineers. And also
been awarded UTM excellent research award in
2008; young professional award and Shell excellent
student award, in 2009 and 2010 respectively. He
has authored several journals.