Embed Size (px)
Citation preview
1
Prediction of the impact of climate change on coffee and
mango growing areas in Haiti
Full Technical Report
Authors: Anton Eitzinger, Peter Läderach, Stephania Carmona, Carlos Navarro, Laure Collet
International Center for Tropical Agriculture (CIAT)
Cali, Colombia, August 2013
Correct citation
Eitzinger A; Läderach P; Carmona S; Navarro C; Collet L. 2013. Prediction of the impact of climate change on coffee
and mango growing areas in Haiti. Full Technical Report. Centro Internacional de Agricultura Tropical
(CIAT), Cali, Colombia.
2
Contents
1. Executive summary and main findings ................................................................................................. 4
A. Methodology and carried out spatial analysis .................................................................................. 4
B. Key results for coffee and mango ..................................................................................................... 5
C. Diversification options ...................................................................................................................... 6
D. Recommendations and next steps .................................................................................................... 8
2. Background and context ....................................................................................................................... 9
3. Methodology ....................................................................................................................................... 10
3.1. Climate data generation ............................................................................................................. 10
3.2. Environmental factors ................................................................................................................. 12
3.3. Crop prediction models............................................................................................................... 13
Models selection ................................................................................................................................. 15
Model validation ................................................................................................................................. 15
Uncertainty of model prediction ........................................................................................................ 15
3.4. Diversification options ................................................................................................................ 15
4. Results ................................................................................................................................................. 17
4.1. Predicted climate change for Haiti ............................................................................................. 17
4.2. Specific regional future climate predictions ............................................................................... 19
4.3. Impact of climate change on Coffee ........................................................................................... 20
Coffee in Haiti ..................................................................................................................................... 20
Characteristics of producing zones (Amaya et al., 1999) .................................................................... 20
Impact of climate change .................................................................................................................... 21
4.4. Impact of climate change on Mango .......................................................................................... 23
4.5. Uncertainties, driving factors and cross validation ..................................................................... 24
Maxent model validation .................................................................................................................... 24
Environmental factors that drive suitability ....................................................................................... 25
Uncertainties of future suitability predictions .................................................................................... 26
4.6. Diversification options ................................................................................................................ 28
Cocoa ................................................................................................................................................... 29
Common beans ................................................................................................................................... 30
Maize and sorghum ............................................................................................................................ 30
Yam and malanga ................................................................................................................................ 31
Groundnut (peanut) ............................................................................................................................ 33
5. Conclusions ......................................................................................................................................... 34
References .................................................................................................................................................. 35
3
Table of Figures
Figure 1. Block diagram of the methods. .................................................................................................... 10
Figure 2. Meteorological stations on which WC is based in Haiti. .............................................................. 11
Figure 3. Climate change predictions for Haiti. .......................................................................................... 17
Figure 4. Climate change predictions for Southwestern departments....................................................... 18
Figure 5. Mean annual precipitation change by 2020 in the project target communities. ........................ 19
Figure 6. Mean annual precipitation change by 2030 in the project target communities. ........................ 19
Figure 7. Mean annual precipitation change by 2050 in the project target communities. ........................ 20
Figure 8. Haiti coffee sector map ................................................................................................................ 21
Figure 9. Coffee climate-suitability. ............................................................................................................ 22
Figure 10. Coffee suitability by altitude. ..................................................................................................... 22
Figure 11. Climate-suitability of mango. ..................................................................................................... 23
Figure 12. Mango suitability and altitude. .................................................................................................. 24
Figure 13. Performance of the Maxent model for coffee across the 25 replicates. ................................... 24
Figure 14. Performance of the Maxent model for mango across the 25 replicates ................................... 25
Figure 15. Driving factors coffee-model in North & Southeast .................................................................. 25
Figure 16. Driving factors coffee-model in Southwest. .............................................................................. 25
Figure 17. Driving factors mango-model in North & Southeast. ................................................................ 26
Figure 18. Driving factors mango-model in Southwest. ............................................................................. 26
Figure 19. Uncertainty of coffee-maxent-model outputs using 19 GCMs. ................................................. 27
Figure 20. Uncertainty of mango-maxent model. ...................................................................................... 27
Figure 21. Geographic datasets .................................................................................................................. 28
Figure 22. Current and future suitability (by 2050) of cocoa...................................................................... 29
Figure 23. Current and future suitability (by 2050) of common beans. ..................................................... 30
Figure 24. Current and future suitability (by 2050) of sorghum.)............................................................... 31
Figure 25. Current and future suitability (by 2050) of yam (Cushcush yam) .............................................. 32
Figure 26. Current and future suitability (by 2050) of yam (white and yellow yam)................................. 32
Figure 27. Current and future suitability (by 2050) of malanga (dasheen) ................................................ 33
Figure 28. Current and future suitability (by 2050) of groundnut (peanut). ............................................. 33
Table of Tables
Table 1. List of GCMs used in this study. .................................................................................................... 11
Table 2. List of derived bioclimatic variables used as environmental factors ............................................ 12
Table 3. Harvested areas of diversification crops in Haiti (areas in hectares). ........................................... 28
Table 4. Land availability for agricultural production intersected with soil capacity in Haiti. .................... 29
4
1. Executive summary and main findings
A. Methodology and carried out spatial analysis
The potential impact of climate change on agricultural crop production varies spatially and depends on crop specific biophysical constraints. For selecting the environmental factors we apply a climate-only approach because climatic variables are expected to change substantially over the modeled time period and generally accepted future projections are available.
Bioclimatic variables (BC) are often used in ecological niche modeling and they represent annual trends, seasonality and extreme or limiting environmental factors. For the current climate (baseline) we used monthly data from the WorldClim (WC) database sourced from global weather stations. For future climates, we used the Global circulation models (GCM) with short- mid- & long-term predictions. We acknowledge the uncertainty of climate predictions and the differences between the GCMs used for the modelling. We used 19 different GCMs in our study and produced final maps showing descriptive statistics of different predictions on a pixel basis.
We reviewed several crop suitability models before deciding upon the most appropriate model to use in the analysis. Maximum entropy (Maxent) is a niche modeling method that has been developed involving species distribution information based only on known presences. Maxent is the most adapted model to use for coffee and mango. To identify adequate diversification options for coffee farmers we analyzed crop-climate-suitability of selected crops from current agricultural portfolios of Haiti. We selected these crops based on their importance to food security and livelihood income as well as on crops recently adopted by development organizations. We compared climate-suitable area-outcomes with a land availability-index for agriculture production and extracted spatial statistics from the climate-suitability layers based
L’impact potentiel du changement climatique sur la production des cultures agricoles varie dans l’espace et dépend des contraintes biophysiques spécifiques à chaque culture. Pour sélectionner les facteurs environnementaux nous appliquons une approche centrée sur le climat car les variables climatiques devraient changer de manière substantielle sur la période de temps modélisée et des projections futures globalement acceptées sont disponibles.
Les variables bioclimatiques (BC en anglais) sont souvent utilisées dans la modélisation de niche écologique. Elles représentent les tendances annuelles, la saisonnalité, les facteurs limitant et les conditions extrêmes. Pour le climat actuel (ligne de base) nous avons utilisé des données mensuelles de la base de données WorldClim (WC) provenant de stations météorologiques globales. Pour les climats futurs, nous avons utilisé des modèles de circulation générale (GCM en anglais) avec des prévisions à court, moyen et long terme. Nous mentionnons l’incertitude des prévisions climatiques et des différences entre les GCM utilisés pour la modélisation. Nous avons utilisé 19 différents GCM dans notre étude et produit les cartes finales montrant les statistiques descriptives de différentes prévisions, sur la base du pixel.
Nous avons revu plusieurs modèles d’aptitude climatique pour les cultures avant de décider lequel était le plus approprié à utiliser dans cette étude. L’entropie maximum (Maxent) est une méthode de modélisation de niche écologique qui a été développée en associant l’information de distribution des espèces uniquement aux sites de présence connus. Maxent est le modèle le plus adapté pour le café et la mangue. Pour identifier les options de diversification les plus adéquates pour les producteurs de café nous avons analysé l’aptitude climatique pour les cultures sélectionnées à partir du portefeuille agricole actuel de Haïti. Nous avons sélectionné ces cultures en se basant sur leur importance pour la sécurité alimentaire et les revenus générés ainsi que sur les cultures récemment adoptées par les organisations de développement. Nous avons
5
on the 5 land-availability layers using a Geographical Information System (GIS).
comparé les résultats des zones climatiques aptes avec un index de disponibilité du sol pour la production agricole. En utilisant un système d’information géographique (GIS en anglais), nous avons extrait des statistiques spatiales à partir des couches d’aptitudes climatiques et des 5 couches de disponibilités du sol.
B. Key results for coffee and mango
According to the ensemble of the 19 Global Circulation Models (GCM) temperature in Haiti will increase an average of 0.9°C in 2020 and 1.8°C by 2050. The average temperature of the hottest month will increase from 30.9°C to 32.9°C by 2050 and the driest month is projected to get 10% less rainfall. Overall the climate is expected to become more seasonal in terms of variability through the year in temperature and more seasonal in precipitation. Although rainfall decrease is generally moderate in all future predictions, this combined with increasing minimum, mean and maximum temperatures can cause water deficits due to higher evapotranspiration rates of plants triggering soil water deficits and heat stresses. Increased temperature stresses and in particular high night time temperatures (> 18 °C) and drought conditions have substantial effects on biomass production and the reproductive stages of several plants and crops.
The altitude of coffee plantation in Haiti ranges between 400 meters in the North to 1,300 meters in the South. Changes in temperature and rainfall patterns will cause a general decrease of areas suitable for coffee and reduce areas which currently possess high suitability. Suitability will climb up altitudinal gradients to currently cooler climates. Models predict that coffee will lose suitability in lower altitudes (up to 1200 meters above sea level) and will gain suitability in higher areas with a maximum suitability between 1500m.a.s.l. and 1800m.a.s.l. in 2050. Changing climatic conditions in Haiti could lower the quality and yields of current coffee producing regions and this is likely to be most prevalent in lower-altitude zones. Furthermore, economic losses in the future
D’après l’ensemble des 19 modèles de circulation générale (GCM en anglais), la température en Haïti augmentera en moyenne de 0.9°C en 2020 et de 1.8°C d’ici 2050. La température moyenne du mois le plus chaud augmentera de 30.9°C à 32.9°C d’ici 2050 et on projette une chute de 10% des précipitations pour le mois le plus sec. En général le climat devrait devenir plus saisonnier, en termes de variabilité de la température et de répartition de la précipitation au long l’année. Même si les diminutions en termes de précipitations sont en général modérées dans toutes les prévisions futures, ceci combiné avec une augmentation des températures minimum, moyennes et maximum peut causer des déficits en eau. En effet, des taux d’évapotranspiration supérieurs des plantes déclencheraient des déficits en eau du sol et des stress thermiques. Une augmentation des stress thermiques, et en particulier des températures nocturnes élevées (>18°C), et des conditions de sécheresse ont des effets substantiels sur la production de biomasse et sur les étapes de reproduction de plusieurs plantes et cultures.
Les zones de plantation de café en Haïti se situent à des altitudes comprises entre 400 mètres dans le Nord et 1 300 mètres dans le Sud. Les changements des régimes de températures et de précipitations causeront une diminution générale des zones aptes à la culture du café et réduira les zones qui possèdent actuellement une forte aptitude climatique. L’aptitude climatique s’élèvera selon des gradients altitudinaux vers des climats actuellement plus froids. Les modèles prédisent que le café perdra en aptitude climatique dans les basses altitudes (en dessous de 1 200 mètres au-dessus du niveau de la mer) et gagnera en aptitude dans les zones plus hautes avec un maximum entre 1 500 et 1 800 mètres en 2050. Les changements des conditions climatiques
6
could ensue if adaptation efforts are not implemented.
Mango will remain a highly suitable crop in many regions of Haiti. Some areas will reduce from excellent to very suitable and shift geographically from concentrated areas close the coast to inland areas with higher altitude. Altitudes from 500 to 700m.a.s.l. will benefit from increasing climate suitability mostly because of increased temperatures.
en Haïti pourraient diminuer la qualité et les rendements des régions actuelles de productions de café et ceci serait d’autant plus vrai dans les zones de basses altitudes. Des pertes économiques dans le futur pourraient s’ensuivre si des efforts d’adaptation ne sont pas mis en œuvre.
La mangue restera une culture hautement apte
dans de nombreuses régions d’Haïti. Certaines
zones passeront d’excellentes à très aptes et se
déplaceront géographiquement depuis des zones
concentrées proches de la côte vers des zones plus
hautes à l’intérieur des terres. Les altitudes de 500
à 700 mètres au-dessus du niveau de la mer
bénéficieront d’une augmentation de l’aptitude
climatique principalement grâce à une
augmentation des températures.
C. Diversification options
The potential impact of climate change on agricultural crop production varies spatially and depends on crop specific biophysical constraints. In Haiti, land for agriculture use extends to more than 1.7 million hectares, occupying more than 60% of the country. Conditions for agricultural production are driven by different climate patterns among other constraints like soil erosion, highly varying soil capacity and land use prevalence’s. In this study selected 6 crops as diversification options for coffee farmers together make use of more than 0.7 million hectares (~60%) of agriculture land in Haiti. 400 thousand hectares (14%) of Haiti’s agricultural land are available and soil capacity is medium to excellent in these areas; 530 thousand hectares (19%) are available but farmers are producing on soil with limited capacity; other 300 thousand hectares have no soil limitations but needs land use change to produce annual crops (parts of it are currently used for agro-forestry systems or are in remaining forests).
L’impact potentiel du changement climatique sur les productions des cultures agricoles varie spatialement et dépend des contraintes biophysiques spécifiques à chaque culture. En Haïti, les terres destinées à l’agriculture s’étendent sur plus de 1,7 million d’hectares, soit 60% de la surface du pays. Les conditions de production agricole dépendent des différents régimes climatiques, ainsi que d’autres contraintes, telles que l'érosion des sols, la capacité du sol très variable et la prévalence de l'utilisation des terres. Les 6 cultures sélectionnées dans cette étude comme des options de diversification pour les producteurs de café rassemblent plus de 0,4 millions d'hectares (~60%) des terres agricoles en Haïti. 400 000 hectares (14%) des terres agricoles d'Haïti sont disponibles et la capacité du sol est moyenne à excellente dans ces zones; 530 000 hectares (19%) sont disponibles mais les agriculteurs produisent sur des sols avec une capacité limitée, d'autres 300 000 hectares n'ont pas limitations liées au sol mais nécessitent un changement d’utilisation du sol pour produire des cultures annuelles (une partie d’entre eux est actuellement utilisée pour les systèmes agro-forestiers ou sont des forêts restantes).
7
Haiti possesses excellent suitability for cocoa and is not predicted to be affected by changes from long-term climate patterns. There are still a lot of potential areas inside existing and potentially new agro-forestry systems that could be created in the future. Haiti’s cocoa producers have an opportunity to benefit from an increasing global demand for cocoa production.
Highly suitable environments for growing common beans in Central America and the Caribbean are most limited at present by maximum temperatures. Our analyses show that suitability of beans will decrease quite substantially in several areas of Haiti which are currently important producing areas. Loss will be up to 70% in areas without limitations in soil capacity and good availability for annual crop production if no adaptation measures are taken. There is a strong need for the introduction of improved varieties that are less susceptible to heat, and a need to equip farmers with tools and provide them with the knowledge to close yield gaps on existing production. Statistical studies of maize yields have clearly indicated a strong negative yield response to accumulated days above 30 °C and more seasonal rainfall during the growing season (increased water stress for plants). We emphasize that appropriate crop development and management strategies for dealing with extreme heat on maize varieties should be a priority for future work in Haiti. Suitability of sorghum will increase in Haiti between 4 and 8% in available land with no or low limited soil capacity by 2050. There are many species of yams and we selected the 3 main ones for the Caribbean. Results show that cushcush yam is losing suitability in important areas, white and yellow yam is gaining suitability and available areas remain more or less constant all over Haiti by 2050. Finally malanga is shifting its geographical areas of suitability but generally losing suitability and areas. Groundnut or peanut provides an opportunity for the future, with a two fold increase in the areas on available land with no limitations of soil by remaining suitability almost all over Haiti.
Haïti a une excellente aptitude climatique pour le cacao et ne semble pas être affecté par les changements de régimes climatiques à long terme. Il y a encore beaucoup de zones potentielles à l'intérieur des systèmes agro-forestiers existants et potentiels qui pourrait être créés à l'avenir. Les producteurs de cacao d’Haïti ont l’opportunité de profiter d’une augmentation globale de la demande pour la production de cacao.
Les environnements très aptes pour cultiver le
haricot commun en Amérique Centrale et dans les
Caraïbes sont actuellement limités principalement
par la température maximum. Nos analyses
montrent que l’aptitude climatique pour la culture
du haricot diminuera assez sensiblement dans
plusieurs zones d’Haïti qui sont actuellement
d’importantes zones de production. Si aucune
mesure d’adaptation n’est prise, les pertes iront
jusqu’à 70% dans les zones où la capacité du sol
et la disponibilité pour les cultures annuelles ne
sont pas limités. Il est nécessaire d’introduire des
variétés améliorées moins sensibles à la chaleur,
d’équiper les agriculteurs avec les outils et les
connaissances nécessaires pour combler les écarts
de rendements sur la production existante. Les
études statistiques sur les rendements du maïs ont
clairement indiqué une réponse négative des
rendements à une accumulation de jours au-
dessus de 30°C et des différences marquées dans
la distribution des pluies durant la saison de
croissance (augmentation du stress hydrique pour
les plantes). Nous soulignons que des stratégies
appropriées pour la gestion et le développement
des cultures afin de lutter contre les stress
thermique sur les variétés de maïs devraient être
une priorité des futurs travaux en Haïti. L’aptitude
climatique pour la culture du sorgo augmentera
en Haïti entre 4 et 8% dans les terres disponibles
avec une capacité du sol nulle ou limitée en 2050.
Il y a de nombreuses espèces d’ignames et nous
avons sélectionné les 3 principales pour les
Caraïbes. Les résultats montrent que l’igname
8
cushcush perd de en aptitude sur une surface
importante, les ignames blanc et jaune gagnent
en aptitude et les zones disponibles se
maintiennent plus ou moins constantes partout en
Haïti en 2050. Finalement, les zones
géographiques d’aptitude climatique pour le
malanga se déplacent mais globalement les
valeurs diminuent en aptitude et en surface. Les
arachides sont une belle opportunité pour le futur,
l’aptitude climatique se maintient presque partout
en Haïti et les surfaces de terres disponibles sans
limitation dues au sol sont multipliées par deux.
D. Recommendations and next steps
There are many opportunities to adapt to changes and for those coffee farms whose suitability will drop but not decrease drastically, proactive adaptation is a crucial strategy. Agroforestry systems such as coffee systems are not only important as a commodity and cash income generator for smallholder but also as a provider of ecosystem services. A decrease in coffee suitability is likely going to threaten the environmental services coffee systems provide, such as soil cover, carbon sequestration, biodiversity and water storage. Therefore a key strategy needs to focus on maintaining the environmental services with a different agroforestry system. In this context cocoa is a promising option. We distinguish 3 general strategies to adapt to the change of coffee suitability. The three strategies are interlinked and will replace each other over time. Areas that will increase in suitability need strategic investment. Areas that will lose some suitability are likely to be maintained through targeted strategies such as irrigation, shade management and change to more drought resident varieties. Areas that are likely to suffer from significant decrease in suitability need to start diversifying in order to switch to different crops, such as cocoa, once coffee is not suitable any more.
Il y a de nombreuses opportunités d’adaptation
aux changements et, pour les fermes de
production de café dont l’aptitude baissera mais
ne chutera pas radicalement, l’adaptation
proactive est une stratégie cruciale. Les systèmes
agroforestiers, tels que les systèmes caféiers, ne
sont pas seulement important en tant que source
de produit de consommation et générateurs de
revenus pour les petits propriétaires mais ils sont
aussi fournisseurs de services écosystémiques.
Une diminution de l’aptitude climatique pour le
café peut mettre en danger les services
ecosystémiques fournis par les systèmes caféiers
tels que la couverture du sol, la séquestration de
carbone, la biodiversité et le stockage d’eau. En
conséquence, une stratégie clé doit chercher à
maintenir les services environnementaux avec un
système agro-forestier différent. Dans ce contexte
le cacao est une option prometteuse. On distingue
3 stratégies générales d’adaptation au
changement d’aptitude climatique pour le café.
Les trois stratégies sont interconnectées se
succéderont au fil du temps. Les zones où
l’aptitude augmentera ont besoin
d’investissements stratégiques. Les zones qui
perdront en aptitude peuvent être maintenues
grâce à des stratégies ciblées telles que
l’irrigation, la gestion de l’ombrage et l’utilisation
9
de variétés résistantes à la sécheresse. Les zones
qui pourraient subir une chute significative de
l’aptitude doivent, une fois que le café n’est plus
apte, commencer à se diversifier afin de passer à
de nouvelles cultures, telles que le cacao.
2. Background and context
This work is built on the ongoing activities of the Catholic Relief Services (CRS) with the aim of improving
livelihoods for Haitian farmers through coffee and mango value chains in the southwestern departments
of the country. In 2010, after the earthquake, CRS in collaboration with the International Center for
Tropical Agriculture (CIAT) carried out an assessment of the current state of these value chains and
provided in its final reports several recommendations to improve current production quality and
quantity (Rodríguez et al. 2011, Castañeda et al. 2011). The ministry of agriculture, natural resources
and rural development developed a National Agricultural Investment Plan which highlighted the
agricultural sectors vital importance to not only domestic food security, but also to the economic
recovery and the social stability of Haiti after the earthquake. The present study aims to contribute to
the ongoing long-term strategic investments in these value-chains by predicting the impact of short-
mid- & long-term climate change on coffee and mango. Further potential impacts on crops proposed to
be diversification options for coffee farmers will be assessed by analyzing their climate-suitability to
ensure that strategic adaptation work will be done on current and future suitable crops in Haiti. The
potential impact of climate change on agricultural crop production varies spatially and depends on crop
specific biophysical constraints. In Haiti, land for agriculture use extends to more than 1.7 million
hectares, occupying more than 60% of the country. Conditions for agricultural production are driven by
different climate patterns among other constraints like soil erosion, highly varying soil capacity and land
use prevalence’s. In this study selected 6 crops as diversification options for coffee farmers together
make use of more than 1.4 million hectares (~80%) of agriculture land in Haiti in 2011.
The main objectives carried out during this project have been: (i) reviewing and comparing
methodologies for crop suitability modeling and compiling necessary information; (ii) identifying
environmental factors and generating a climate database for current and future conditions; and (iii)
predicting and validating current and future suitability of coffee, mango and diversifications crops in
Haiti.
10
3. Methodology
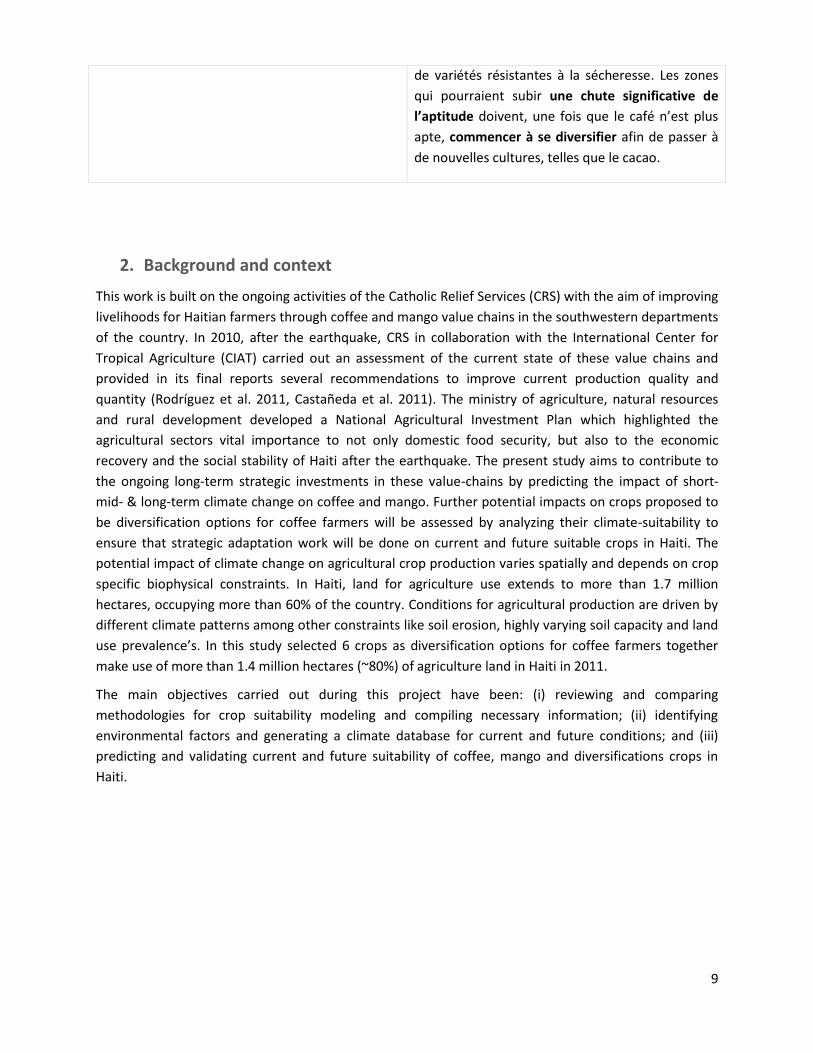
A block diagram of the methods used is shown in Figure 1. We used the elements described below
throughout the research project:
Figure 1. Block diagram of the methods.
3.1. Climate data generation
To predict anticipated changes of future climate we needed to establish a baseline which we can use to
compare outputs of global circulation models (GCM) with current climate conditions. These GCM’s
possesses a very coarse spatial resolution and it was therefore necessary to downscale them for climate
change predictions on a local scale.
For the current climate (baseline) we used monthly data from the WorldClim (WC) database (publicly
and freely available at http://www.worldclim.org). WC provides interpolated global climate surfaces
using latitude, longitude, and elevation as independent variables and represents long term (1950–2000)
monthly means of maximum, minimum, mean temperatures and total rainfall. Input data for the WC
database were sourced from global weather stations including ~47,000 weather stations with monthly
information on precipitation, ~23,000 stations with mean temperature data and ~13,000 locations.
Passing through a quality checking algorithm input data were finally interpolated to a 30 arc second
spatial resolution, commonly referred to as ‘1-km’ resolution (Hijmans et al. 2005).
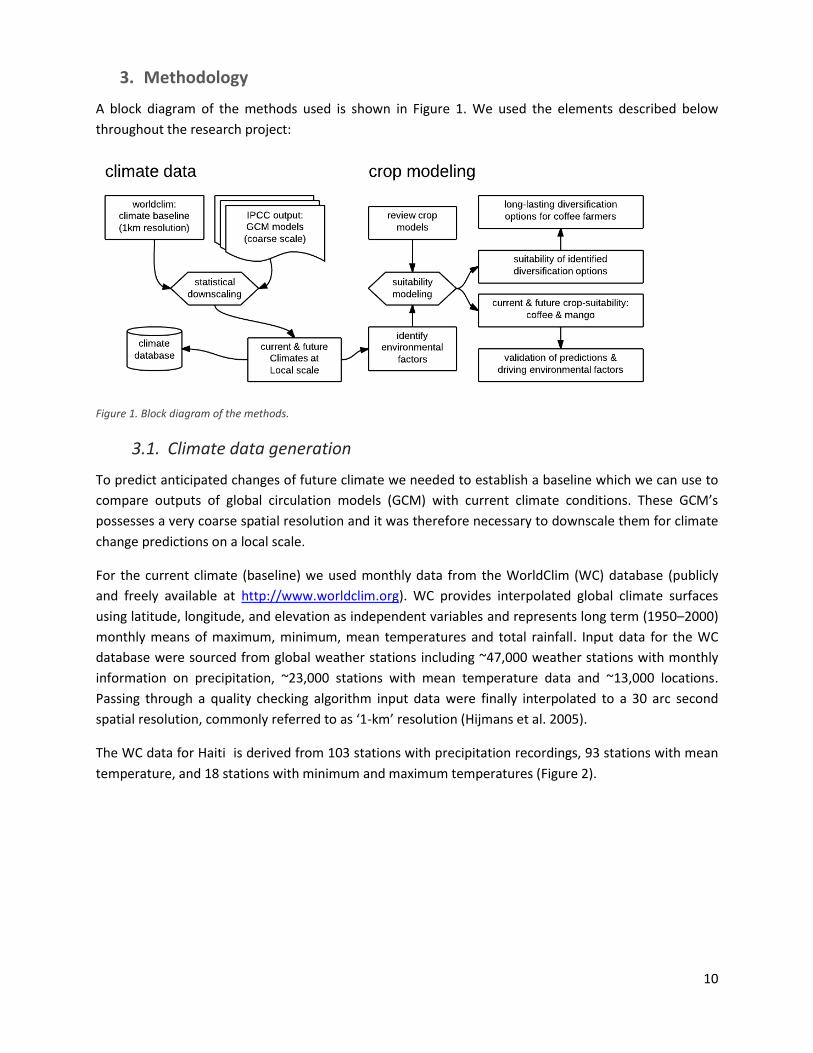
The WC data for Haiti is derived from 103 stations with precipitation recordings, 93 stations with mean
temperature, and 18 stations with minimum and maximum temperatures (Figure 2).
11
Figure 2. Meteorological stations on which WC is based in Haiti.
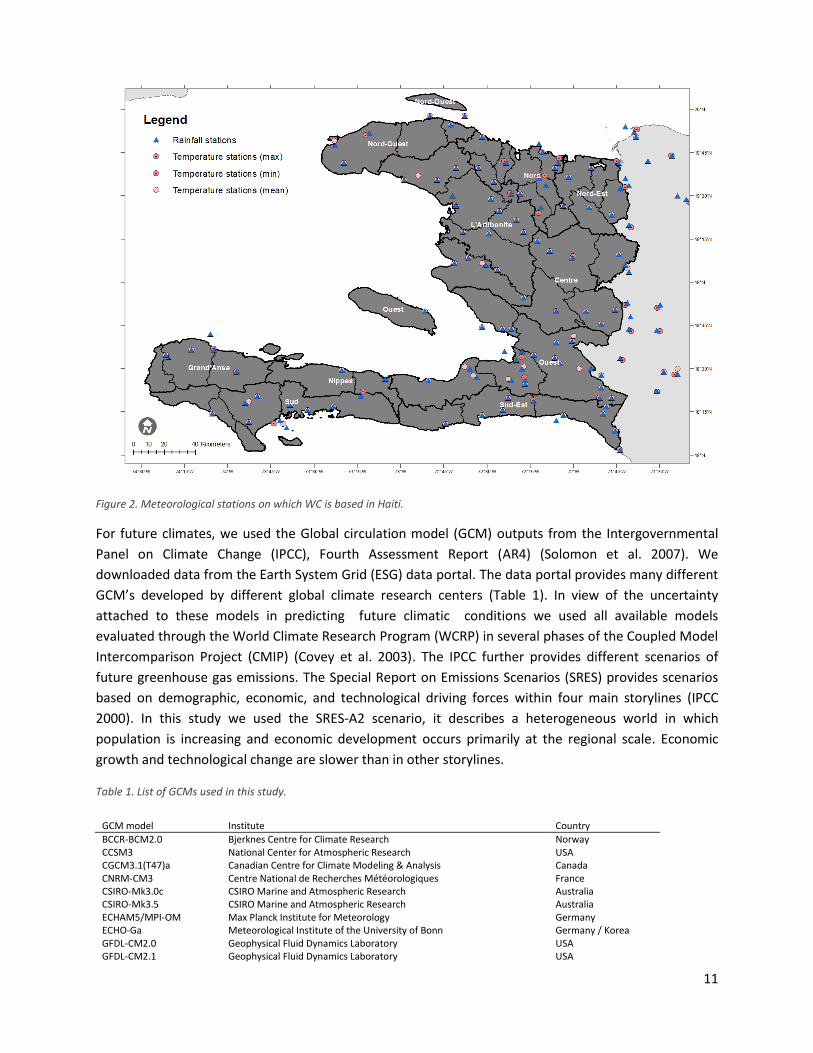
For future climates, we used the Global circulation model (GCM) outputs from the Intergovernmental
Panel on Climate Change (IPCC), Fourth Assessment Report (AR4) (Solomon et al. 2007). We
downloaded data from the Earth System Grid (ESG) data portal. The data portal provides many different
GCM’s developed by different global climate research centers (Table 1). In view of the uncertainty
attached to these models in predicting future climatic conditions we used all available models
evaluated through the World Climate Research Program (WCRP) in several phases of the Coupled Model
Intercomparison Project (CMIP) (Covey et al. 2003). The IPCC further provides different scenarios of
future greenhouse gas emissions. The Special Report on Emissions Scenarios (SRES) provides scenarios
based on demographic, economic, and technological driving forces within four main storylines (IPCC
2000). In this study we used the SRES-A2 scenario, it describes a heterogeneous world in which
population is increasing and economic development occurs primarily at the regional scale. Economic
growth and technological change are slower than in other storylines.
Table 1. List of GCMs used in this study.
GCM model Institute Country
BCCR-BCM2.0 Bjerknes Centre for Climate Research Norway CCSM3 National Center for Atmospheric Research USA CGCM3.1(T47)a Canadian Centre for Climate Modeling & Analysis Canada CNRM-CM3 Centre National de Recherches Météorologiques France CSIRO-Mk3.0c CSIRO Marine and Atmospheric Research Australia CSIRO-Mk3.5 CSIRO Marine and Atmospheric Research Australia ECHAM5/MPI-OM Max Planck Institute for Meteorology Germany ECHO-Ga Meteorological Institute of the University of Bonn Germany / Korea GFDL-CM2.0 Geophysical Fluid Dynamics Laboratory USA GFDL-CM2.1 Geophysical Fluid Dynamics Laboratory USA

12
GISS-ER Goddard Institute for Space Studies USA INGV-SXGc Instituto Nazionale di Geofisica e Vulcanologia Italy INM-CM3.0b Institute for Numerical Mathematics Russia IPSL-CM4 Institut Pierre Simon Laplace France MIROC3.2 (medres) Center for Climate System Research Japan MRI-CGCM2.3.2a Meteorological Research Institute Japan PCMc National Center for Atmospheric Research USA UKMO-HadCM3 Hadley Centre for Climate Prediction and Research UK UKMO-HadGEM1 Hadley Centre for Climate Prediction and Research UK
The downloaded GCM data are formatted at a yearly temporal scale and we calculated three 30-year
periods in order to represent a short-, mid- and long-term prediction of climate (2010-2039 representing
2020, 2020–2049 representing the 2030 time slice and 2040–2069 representing 2050). The spatial
resolution of GCMs is too coarse to analyze the direct impacts on farmers’ production (Jarvis et al.
2010). We therefore downscaled the outputs of each GCM based on the sum of interpolated anomalies
to the 30 arc-second resolution (approximately 1km) of the monthly climate surfaces of WC. This
method produced a smoothed, interpolated surface of changes in climates forecast derived from the
particular GCMs which was then applied to the baseline climate of WC (Ramirez-Villegas & Jarvis 2010).
Resulting climate surfaces for Haiti were finally compiled in a climate-database including the current
climate from WC and downscaled future climate predictions from GCM’s for the IPCC emission scenario
A2. Finally we generated summary graphs of current and future climate for specific municipalities.
3.2. Environmental factors
Plant species’ occurrence is not only defined however by climate variables, and exclusion of other
important variables (such as soil type) may reduce the ability to assess the required environmental
growing conditions (Stanton et al. 2011). Climatic variables are expected to change substantially over
the modeled time period and generally accepted future projections are available, even if those
projections are uncertain. We apply a climate-only approach in this research-project in order to address
the projects goal of estimating the impacts of climate change on crops suitability in the study area.
Bioclimatic variables (BC) are often used in ecological niche modeling and they represent annual trends,
seasonality and extreme or limiting environmental factors. BC were derived from monthly temperature
and rainfall values in order to generate more biologically meaningful variables (Busby 1991) following
the method of Ramirez & Bueno-Cabrera (2009). The set of resulting covariates includes 19 bioclimatic
variables (see Table 2) were used in several studies to empirically model the current and future
distribution of species (Davis et al. 2012, Jarvis et al. 2012, Laderach et al. 2009, Laderach et al. 2013).
Table 2. List of derived bioclimatic variables used as environmental factors
ID Variable name Units
P1 Annual mean temperature °C
P2 Mean diurnal temperature range °C
P3 Isothermality N/A
P4 Temperature seasonality (standard deviation) °C
P5 Maximum temperature of warmest month °C
P6 Minimum temperature of coldest month °C
P7 Temperature annual range °C
13
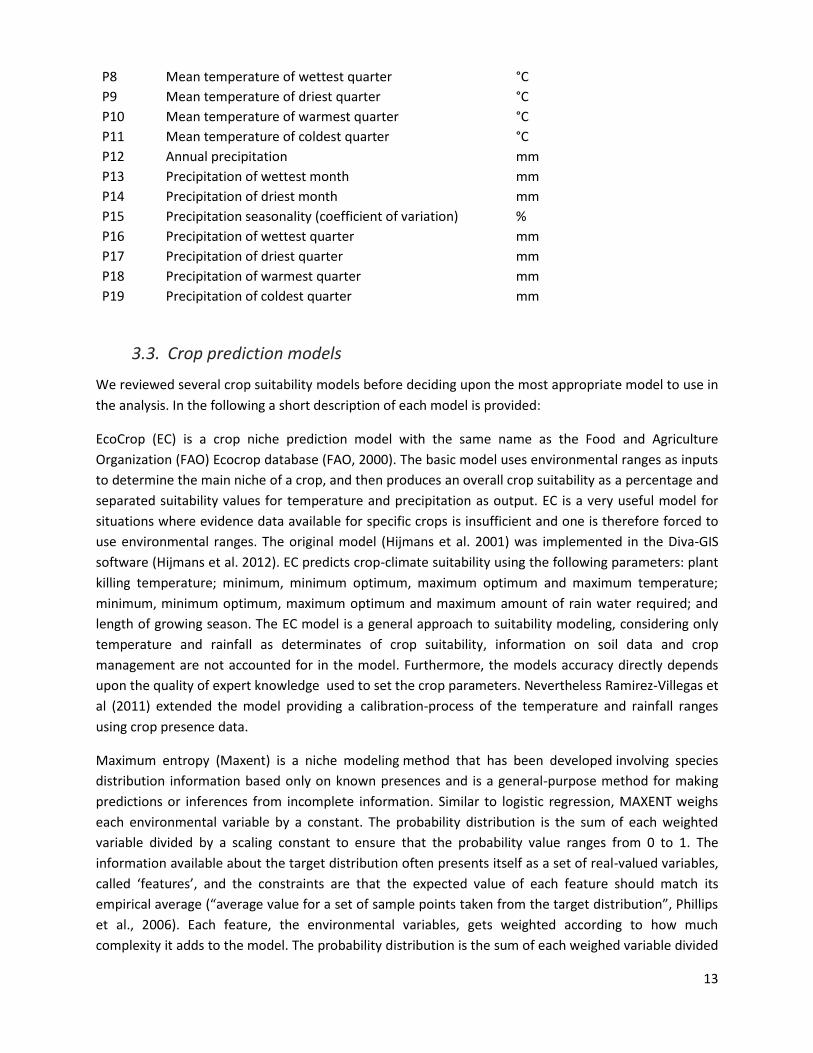
P8 Mean temperature of wettest quarter °C
P9 Mean temperature of driest quarter °C
P10 Mean temperature of warmest quarter °C
P11 Mean temperature of coldest quarter °C
P12 Annual precipitation mm
P13 Precipitation of wettest month mm
P14 Precipitation of driest month mm
P15 Precipitation seasonality (coefficient of variation) %
P16 Precipitation of wettest quarter mm
P17 Precipitation of driest quarter mm
P18 Precipitation of warmest quarter mm
P19 Precipitation of coldest quarter mm
3.3. Crop prediction models
We reviewed several crop suitability models before deciding upon the most appropriate model to use in
the analysis. In the following a short description of each model is provided:
EcoCrop (EC) is a crop niche prediction model with the same name as the Food and Agriculture
Organization (FAO) Ecocrop database (FAO, 2000). The basic model uses environmental ranges as inputs
to determine the main niche of a crop, and then produces an overall crop suitability as a percentage and
separated suitability values for temperature and precipitation as output. EC is a very useful model for
situations where evidence data available for specific crops is insufficient and one is therefore forced to
use environmental ranges. The original model (Hijmans et al. 2001) was implemented in the Diva-GIS
software (Hijmans et al. 2012). EC predicts crop-climate suitability using the following parameters: plant
killing temperature; minimum, minimum optimum, maximum optimum and maximum temperature;
minimum, minimum optimum, maximum optimum and maximum amount of rain water required; and
length of growing season. The EC model is a general approach to suitability modeling, considering only
temperature and rainfall as determinates of crop suitability, information on soil data and crop
management are not accounted for in the model. Furthermore, the models accuracy directly depends
upon the quality of expert knowledge used to set the crop parameters. Nevertheless Ramirez-Villegas et
al (2011) extended the model providing a calibration-process of the temperature and rainfall ranges
using crop presence data.
Maximum entropy (Maxent) is a niche modeling method that has been developed involving species
distribution information based only on known presences and is a general-purpose method for making
predictions or inferences from incomplete information. Similar to logistic regression, MAXENT weighs
each environmental variable by a constant. The probability distribution is the sum of each weighted
variable divided by a scaling constant to ensure that the probability value ranges from 0 to 1. The
information available about the target distribution often presents itself as a set of real-valued variables,
called ‘features’, and the constraints are that the expected value of each feature should match its
empirical average (“average value for a set of sample points taken from the target distribution”, Phillips
et al., 2006). Each feature, the environmental variables, gets weighted according to how much
complexity it adds to the model. The probability distribution is the sum of each weighed variable divided
14
by a scaling constant to ensure that the probability value ranges from 0 to 1. The program starts with a
uniform probability distribution and works in cycles adjusting the probabilities to maximum entropy. It
iteratively alters one weight at a time to maximize the likelihood of reaching the optimum probability
distribution. Maxent is considered as the most accurate model performing extremely well in predicting
occurrences in relation to other common approaches (Elith et al., 2006; Hijmans and Graham, 2006),
especially with incomplete information. It works well with little sample sites of occurrence data and with
both continuous and categorical environmental variables. Finally, sample selection bias is the biggest
problem for this presence-only method.
Crop Niche Selection in Tropical Agriculture CaNaSTA (O’Brien, 2004) is not a “traditional” niche
modeling method as it uses Bayesian statistics to not only predict presence or absence of a specific crop,
but also appraises its performance. Bayesian methods provide “formalism for reasoning under
conditions of uncertainty, with degrees of belief coded as numerical parameters, which are then
combined according to rules of probability theory” (Pearl, 1990). The CaNaSTA algorithm creates
conditional probability tables of all predictor variables against response variable categories (O’Brien,
2004). The primary model output is a discrete probability distribution at each location. A certainty value
is also associated with each location, derived from the number of occurrences in the trial data with a
particular combination of predictors and responses. CaNaSTA only works with its own data sets, and the
analyses require time-consuming preparation and some expertise of the user on Bayesian Statistic.
Sample selection is a key factor for avoiding bias in prior probabilities. Local and regional diversity is
taken into account by the Bayesian algorithm. The model is slower than the other models because of its
more complicated algorithm. However this algorithm makes it a powerful model to evaluate not only
presence but also crop performance. Furthermore, it provides a local certainty evaluation for the
probability values.
The Decision Support System for Agrotechnology Transfer (DSSAT) is a crop simulation model that
simulates growth, development and yield as a function of the soil-plant-atmosphere dynamics (Jones et
al. 2003). For the 28 available crops, simulations are conducted at a daily step and, in some cases, at an
hourly time step depending on the process and the crop model. The plant and soil water, nitrogen and
carbon balances are updated, as well as the crop’s vegetative and reproductive development stage.
DSSAT integrates the effects of soil, crop phenotype, weather and management options to simulate
multi-year outcomes of crop management strategies. The crop models require daily weather data, soil
surface and profile information, and detailed crop management as input for running the crop models
and evaluate crop model simulation and outputs. Weather data must include daily values of incoming
solar radiation, maximum and minimum daily air temperature and daily total rainfall for at least the
duration of the experiment and preferably should begin a few weeks before planting and continue a few
weeks after harvest. Desired soil data consist of soil classification (SCS), surface slope, color,
permeability, and drainage class and horizons profile data. Management data includes information on
planting date, dates when soil conditions were measured prior to planting, planting density, row
spacing, planting depth, crop variety, irrigation, and fertilizer practices. For model evaluation crop
growth data, soil water and fertility measurements are needed. Based on crop processes DSSAT gives
precise results for potential yields, plant phonologic stages, weight, harvest date, water soil and nitrogen
quantity integrating interactions between parameters from weather, soil, management and genetic
15
characteristics. However, the most limitative factor of this powerful model is that it is only available for
the best known crops and it needs a large amount of precise daily data.
Models selection
From the above described models (Ecocrop, Maxent, CaNaSTA and DSSAT), Maxent is the most adapted
model to use for coffee and mango when presence data is available As noted previously, Ecocrop is
recommended for studying overall trends however the three other models are more precise. DSSAT is
the most powerful model but calibration is available for neither coffee nor mango. For CaNaSTA, data
preparation may be highly time consuming as crop performance must be evaluated to calibrate prior
probabilities. Finally, Maxent appears as the best compromise between data and results precision and
time consumption. However, presence data samples must be well selected. Records should spread
across the whole area of interest and each one should bring new information to the model calibration.
Minimum data sample recommended is 30 well distributed points.
Model validation
Using all crop evidence points, 25 Maxent runs were performed, each using 75% of the points for the
training and the remaining 25% for testing of the model. Default settings were used in Maxent so that
the complexity of the model varied depending upon the number of data points used for model fitting.
Two measures of model skill were used: the area under the ROC (receiver operating characteristic) curve
(AUC) (Peterson et al., 2008) and the maximum possible Cohen’s kappa (Manel et al., 2001) (kmax),
applied a random selection of pseudo-absences equal to twice the number of presences (Serra-Diaz et al.
2013). These two measures were used due to the potential caveats that can arise from the use of AUC as
the only model evaluation measure (Lobo et al., 2008).
Uncertainty of model prediction
It is very important to address and acknowledge the uncertainty of climate predictions and the
differences between the GCMs used for the modelling. Jarvis et al. (2012) state that impact assessment
methods are sensitive to uncertainties and assessing the climate-inherent uncertainty in climate change
impact assessment projects explicitly entails the usage of different GCMs. To consider climate-inherent
uncertainty we used 19 different GCMs in our study and produced final maps showing descriptive
statistics of different predictions on a pixel basis: (i) the change of the ensemble mean, (ii) the percentile
rank using first quartile (25th percentile) and third quartile (75th percentile), and (III) the agreement
among (19) Maxent outputs calculated as percentage of models predicting changes in the same
direction as the average of all models at a given location or pixel.
3.4. Diversification options
For the evaluation of best diversification options for coffee farmers, analysis must focus on identifying
general tendencies for several crops and localizing their future potential areas on climate suitability.
Therefore, Ecocrop is the most appropriate model to fulfill these requirements.
To identify adequate diversification options for coffee farmers we analyzed crop-climate-suitability of
selected crops from current agricultural portfolios of Haiti. We selected these crops based on their
importance to food security and livelihood income as well as on crops recently adopted by development
organizations in order to improve future agricultural production of smallholder farmers in Haiti.
16
As described above, we selected Ecocrop as the most appropriate tool to model diversification options
and we compared climate-suitable area-outcomes with land suitable for agriculture production. We did
this by intersecting the climate-suitability with the land-use and soil-capacity layers taking account of
availability for agricultural use of potential suitable croplands (Jarvis et al. 2010).
To assess land availability for agricultural production we downloaded Haiti's land cover (1:300,000 scale)
and Haiti's soil use capacity for agriculture (1:250,000 scale) from http://haitidata.org. We combined
both layers and reclassified them into 5 main categories:
Land available for agriculture production (currently crop- & pasture-land) with medium to
excellent soil capacity (available and no limitations; AV-NL)
Land available for agriculture production with lower or medium limitations on soil capacity
(available but soil capacity is limited; AV-LL)
No limitations on soil capacity, but land use needs to be changed (currently forests, agro-
forestry’s, savannas)
Limited soil capacity and land use needs to be changed (LL-CH)
Land is not available (populated areas, water bodies or barren lands) and soil capacity is very
limited or excluded for agriculture production (NA-EX)
In the following we extracted spatial statistics from the climate-suitability layers based on the 5 land-
availability layers using a Geographical Information System (GIS). Final outputs are the mean suitability
value within each land-availability layer and the standard deviation of suitability and the number of
pixels used to calculate the areas possessing crop suitability.
17
4. Results
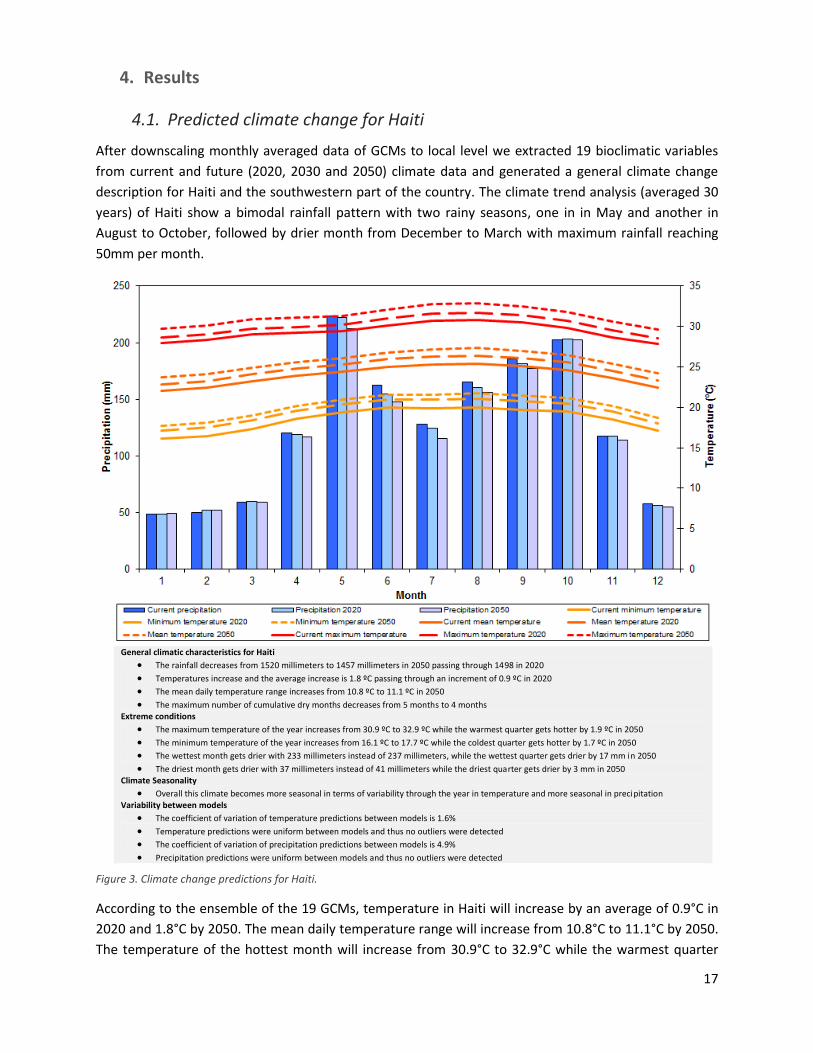
4.1. Predicted climate change for Haiti
After downscaling monthly averaged data of GCMs to local level we extracted 19 bioclimatic variables
from current and future (2020, 2030 and 2050) climate data and generated a general climate change
description for Haiti and the southwestern part of the country. The climate trend analysis (averaged 30
years) of Haiti show a bimodal rainfall pattern with two rainy seasons, one in in May and another in
August to October, followed by drier month from December to March with maximum rainfall reaching
50mm per month.
General climatic characteristics for Haiti
The rainfall decreases from 1520 millimeters to 1457 millimeters in 2050 passing through 1498 in 2020
Temperatures increase and the average increase is 1.8 ºC passing through an increment of 0.9 ºC in 2020
The mean daily temperature range increases from 10.8 ºC to 11.1 ºC in 2050
The maximum number of cumulative dry months decreases from 5 months to 4 months Extreme conditions
The maximum temperature of the year increases from 30.9 ºC to 32.9 ºC while the warmest quarter gets hotter by 1.9 ºC in 2050
The minimum temperature of the year increases from 16.1 ºC to 17.7 ºC while the coldest quarter gets hotter by 1.7 ºC in 2050
The wettest month gets drier with 233 millimeters instead of 237 millimeters, while the wettest quarter gets drier by 17 mm in 2050
The driest month gets drier with 37 millimeters instead of 41 millimeters while the driest quarter gets drier by 3 mm in 2050 Climate Seasonality
Overall this climate becomes more seasonal in terms of variability through the year in temperature and more seasonal in precipitation Variability between models
The coefficient of variation of temperature predictions between models is 1.6%
Temperature predictions were uniform between models and thus no outliers were detected
The coefficient of variation of precipitation predictions between models is 4.9%
Precipitation predictions were uniform between models and thus no outliers were detected
Figure 3. Climate change predictions for Haiti.
According to the ensemble of the 19 GCMs, temperature in Haiti will increase by an average of 0.9°C in
2020 and 1.8°C by 2050. The mean daily temperature range will increase from 10.8°C to 11.1°C by 2050.
The temperature of the hottest month will increase from 30.9°C to 32.9°C while the warmest quarter
18
will be 1.9°C hotter by 2050. The minimum temperature of the coldest month will increase from 16.1°C
to 17.7°C, while the coldest quarter will be 1.7°C hotter by 2050. Total annual rainfall will decrease
marginally (1%) by 2020 and will continue decreasing (4%) until 2050, while the maximum number of
cumulative dry months decreases from 5 months to 4 months. May will remain being the wettest month
getting 2% drier, while the wettest quarter will get drier 3% by 2050. The driest month is projected to
get 10% drier while the driest quarter gets marginally drier with 1% less rainfall by 2050. Overall the
climate is expected to become more seasonal in terms of variability through the year in temperature
and more seasonal in precipitation (Figure 3).
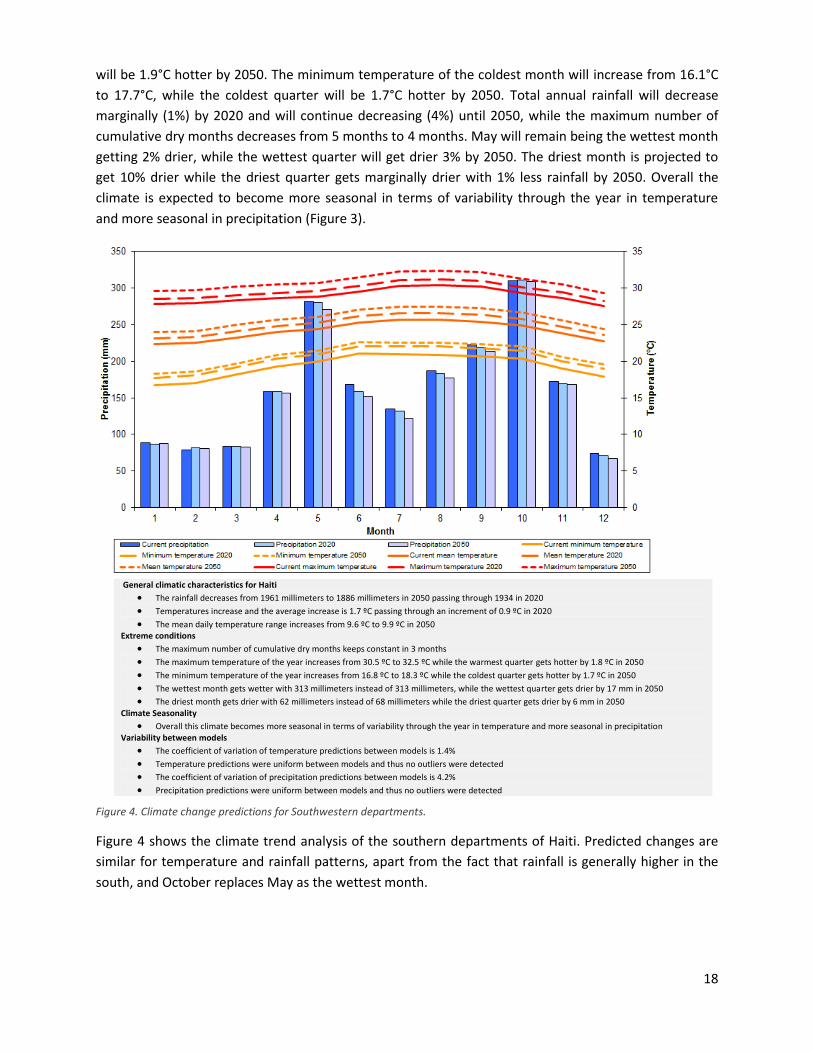
General climatic characteristics for Haiti
The rainfall decreases from 1961 millimeters to 1886 millimeters in 2050 passing through 1934 in 2020
Temperatures increase and the average increase is 1.7 ºC passing through an increment of 0.9 ºC in 2020
The mean daily temperature range increases from 9.6 ºC to 9.9 ºC in 2050 Extreme conditions
The maximum number of cumulative dry months keeps constant in 3 months
The maximum temperature of the year increases from 30.5 ºC to 32.5 ºC while the warmest quarter gets hotter by 1.8 ºC in 2050
The minimum temperature of the year increases from 16.8 ºC to 18.3 ºC while the coldest quarter gets hotter by 1.7 ºC in 2050
The wettest month gets wetter with 313 millimeters instead of 313 millimeters, while the wettest quarter gets drier by 17 mm in 2050
The driest month gets drier with 62 millimeters instead of 68 millimeters while the driest quarter gets drier by 6 mm in 2050 Climate Seasonality
Overall this climate becomes more seasonal in terms of variability through the year in temperature and more seasonal in precipitation Variability between models
The coefficient of variation of temperature predictions between models is 1.4%
Temperature predictions were uniform between models and thus no outliers were detected
The coefficient of variation of precipitation predictions between models is 4.2%
Precipitation predictions were uniform between models and thus no outliers were detected
Figure 4. Climate change predictions for Southwestern departments.
Figure 4 shows the climate trend analysis of the southern departments of Haiti. Predicted changes are
similar for temperature and rainfall patterns, apart from the fact that rainfall is generally higher in the
south, and October replaces May as the wettest month.
19
4.2. Specific regional future climate predictions
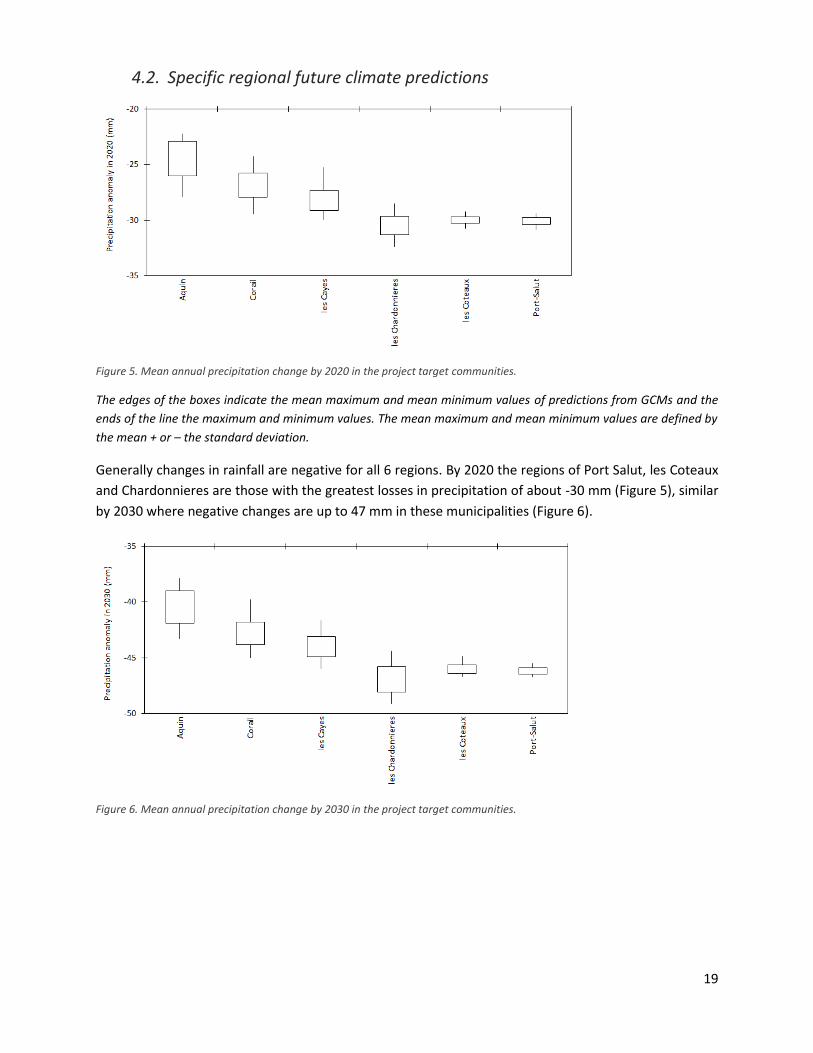
Figure 5. Mean annual precipitation change by 2020 in the project target communities.
The edges of the boxes indicate the mean maximum and mean minimum values of predictions from GCMs and the
ends of the line the maximum and minimum values. The mean maximum and mean minimum values are defined by
the mean + or – the standard deviation.
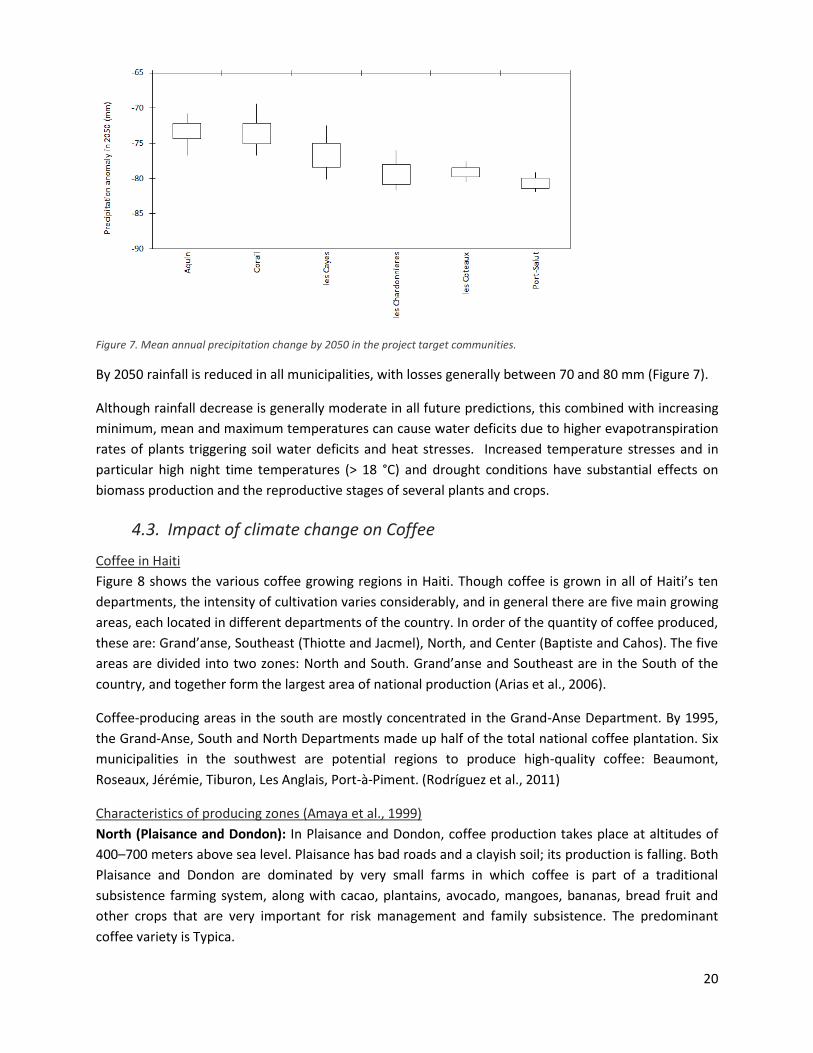
Generally changes in rainfall are negative for all 6 regions. By 2020 the regions of Port Salut, les Coteaux
and Chardonnieres are those with the greatest losses in precipitation of about -30 mm (Figure 5), similar
by 2030 where negative changes are up to 47 mm in these municipalities (Figure 6).
Figure 6. Mean annual precipitation change by 2030 in the project target communities.
20
Figure 7. Mean annual precipitation change by 2050 in the project target communities.
By 2050 rainfall is reduced in all municipalities, with losses generally between 70 and 80 mm (Figure 7).
Although rainfall decrease is generally moderate in all future predictions, this combined with increasing
minimum, mean and maximum temperatures can cause water deficits due to higher evapotranspiration
rates of plants triggering soil water deficits and heat stresses. Increased temperature stresses and in
particular high night time temperatures (> 18 °C) and drought conditions have substantial effects on
biomass production and the reproductive stages of several plants and crops.
4.3. Impact of climate change on Coffee
Coffee in Haiti
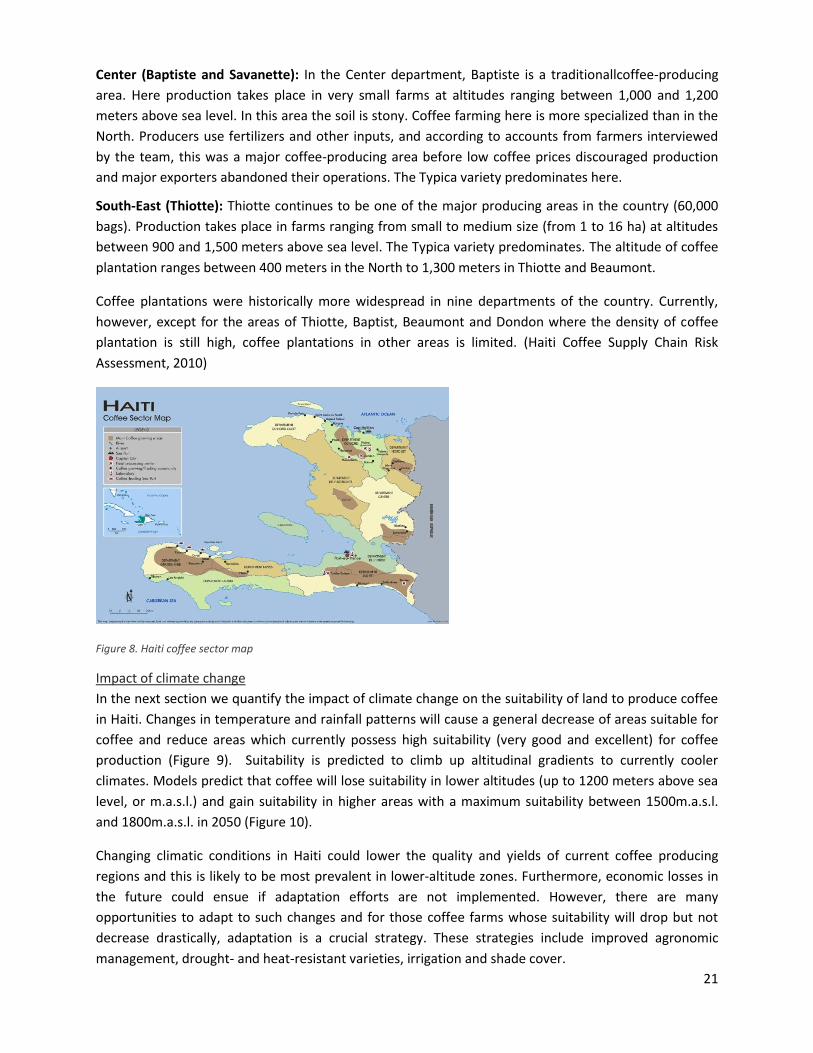
Figure 8 shows the various coffee growing regions in Haiti. Though coffee is grown in all of Haiti’s ten
departments, the intensity of cultivation varies considerably, and in general there are five main growing
areas, each located in different departments of the country. In order of the quantity of coffee produced,
these are: Grand’anse, Southeast (Thiotte and Jacmel), North, and Center (Baptiste and Cahos). The five
areas are divided into two zones: North and South. Grand’anse and Southeast are in the South of the
country, and together form the largest area of national production (Arias et al., 2006).
Coffee-producing areas in the south are mostly concentrated in the Grand-Anse Department. By 1995,
the Grand-Anse, South and North Departments made up half of the total national coffee plantation. Six
municipalities in the southwest are potential regions to produce high-quality coffee: Beaumont,
Roseaux, Jérémie, Tiburon, Les Anglais, Port-à-Piment. (Rodríguez et al., 2011)
Characteristics of producing zones (Amaya et al., 1999)
North (Plaisance and Dondon): In Plaisance and Dondon, coffee production takes place at altitudes of
400–700 meters above sea level. Plaisance has bad roads and a clayish soil; its production is falling. Both
Plaisance and Dondon are dominated by very small farms in which coffee is part of a traditional
subsistence farming system, along with cacao, plantains, avocado, mangoes, bananas, bread fruit and
other crops that are very important for risk management and family subsistence. The predominant
coffee variety is Typica.
21
Center (Baptiste and Savanette): In the Center department, Baptiste is a traditionallcoffee-producing
area. Here production takes place in very small farms at altitudes ranging between 1,000 and 1,200
meters above sea level. In this area the soil is stony. Coffee farming here is more specialized than in the
North. Producers use fertilizers and other inputs, and according to accounts from farmers interviewed
by the team, this was a major coffee-producing area before low coffee prices discouraged production
and major exporters abandoned their operations. The Typica variety predominates here.
South-East (Thiotte): Thiotte continues to be one of the major producing areas in the country (60,000
bags). Production takes place in farms ranging from small to medium size (from 1 to 16 ha) at altitudes
between 900 and 1,500 meters above sea level. The Typica variety predominates. The altitude of coffee
plantation ranges between 400 meters in the North to 1,300 meters in Thiotte and Beaumont.
Coffee plantations were historically more widespread in nine departments of the country. Currently,
however, except for the areas of Thiotte, Baptist, Beaumont and Dondon where the density of coffee
plantation is still high, coffee plantations in other areas is limited. (Haiti Coffee Supply Chain Risk
Assessment, 2010)
Figure 8. Haiti coffee sector map
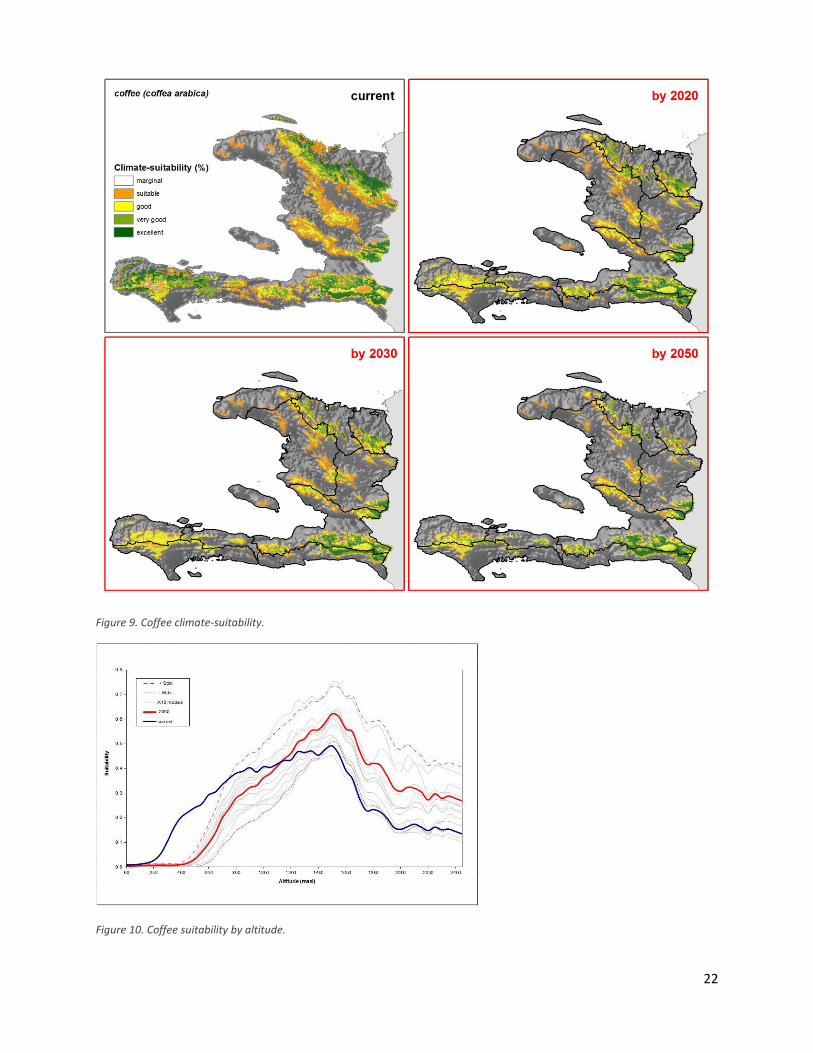
Impact of climate change
In the next section we quantify the impact of climate change on the suitability of land to produce coffee
in Haiti. Changes in temperature and rainfall patterns will cause a general decrease of areas suitable for
coffee and reduce areas which currently possess high suitability (very good and excellent) for coffee
production (Figure 9). Suitability is predicted to climb up altitudinal gradients to currently cooler
climates. Models predict that coffee will lose suitability in lower altitudes (up to 1200 meters above sea
level, or m.a.s.l.) and gain suitability in higher areas with a maximum suitability between 1500m.a.s.l.
and 1800m.a.s.l. in 2050 (Figure 10).
Changing climatic conditions in Haiti could lower the quality and yields of current coffee producing
regions and this is likely to be most prevalent in lower-altitude zones. Furthermore, economic losses in
the future could ensue if adaptation efforts are not implemented. However, there are many
opportunities to adapt to such changes and for those coffee farms whose suitability will drop but not
decrease drastically, adaptation is a crucial strategy. These strategies include improved agronomic
management, drought- and heat-resistant varieties, irrigation and shade cover.
22
Figure 9. Coffee climate-suitability.
Figure 10. Coffee suitability by altitude.
23
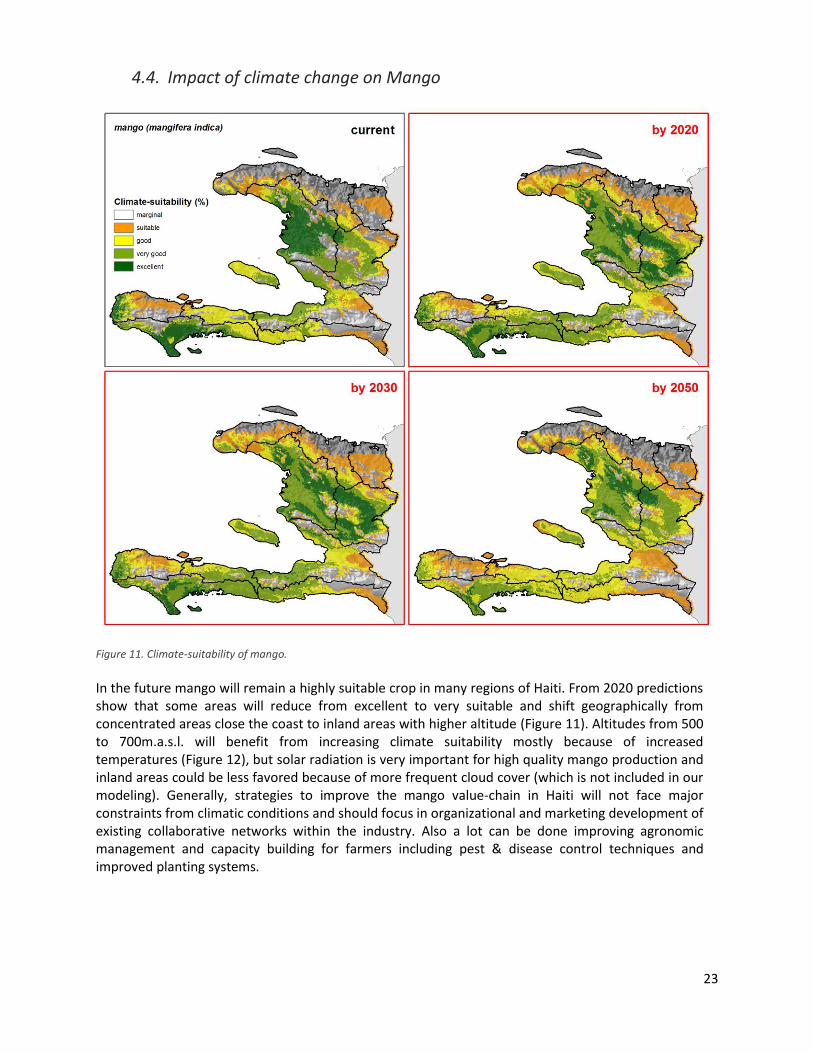
4.4. Impact of climate change on Mango
Figure 11. Climate-suitability of mango.
In the future mango will remain a highly suitable crop in many regions of Haiti. From 2020 predictions show that some areas will reduce from excellent to very suitable and shift geographically from concentrated areas close the coast to inland areas with higher altitude (Figure 11). Altitudes from 500 to 700m.a.s.l. will benefit from increasing climate suitability mostly because of increased temperatures (Figure 12), but solar radiation is very important for high quality mango production and inland areas could be less favored because of more frequent cloud cover (which is not included in our modeling). Generally, strategies to improve the mango value-chain in Haiti will not face major constraints from climatic conditions and should focus in organizational and marketing development of existing collaborative networks within the industry. Also a lot can be done improving agronomic management and capacity building for farmers including pest & disease control techniques and improved planting systems.
24
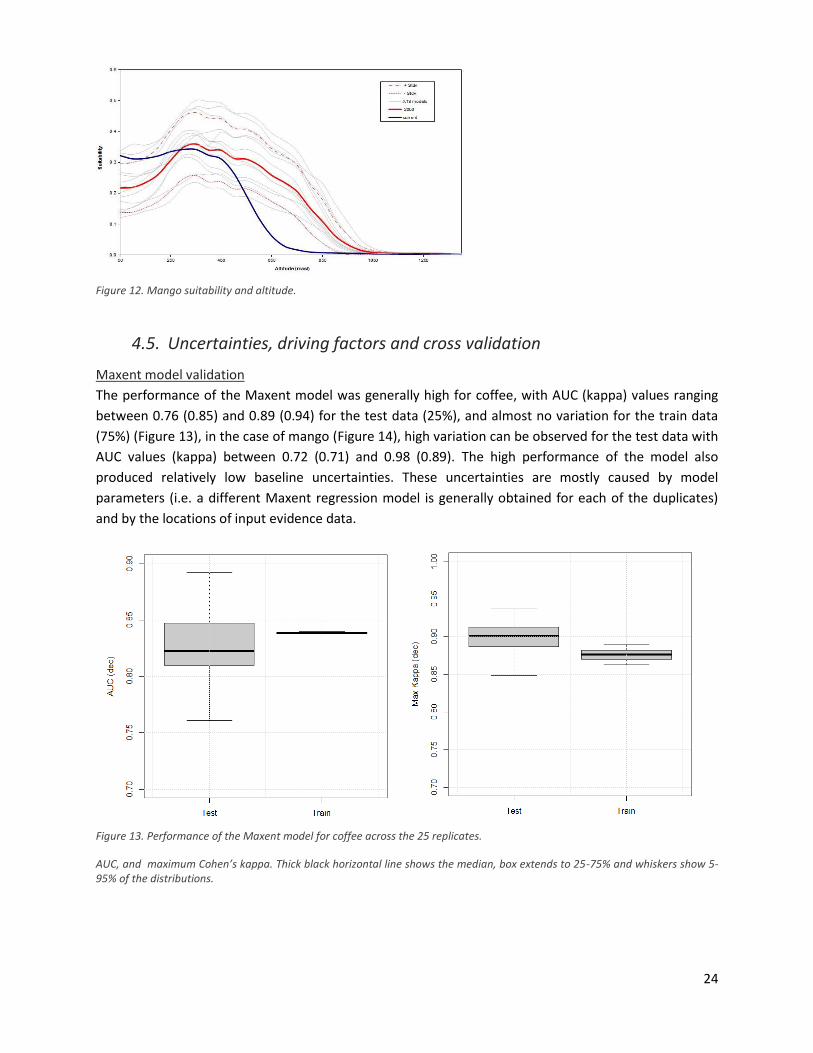
Figure 12. Mango suitability and altitude.
4.5. Uncertainties, driving factors and cross validation
Maxent model validation
The performance of the Maxent model was generally high for coffee, with AUC (kappa) values ranging
between 0.76 (0.85) and 0.89 (0.94) for the test data (25%), and almost no variation for the train data
(75%) (Figure 13), in the case of mango (Figure 14), high variation can be observed for the test data with
AUC values (kappa) between 0.72 (0.71) and 0.98 (0.89). The high performance of the model also
produced relatively low baseline uncertainties. These uncertainties are mostly caused by model
parameters (i.e. a different Maxent regression model is generally obtained for each of the duplicates)
and by the locations of input evidence data.
Figure 13. Performance of the Maxent model for coffee across the 25 replicates.
AUC, and maximum Cohen’s kappa. Thick black horizontal line shows the median, box extends to 25-75% and whiskers show 5-95% of the distributions.
25
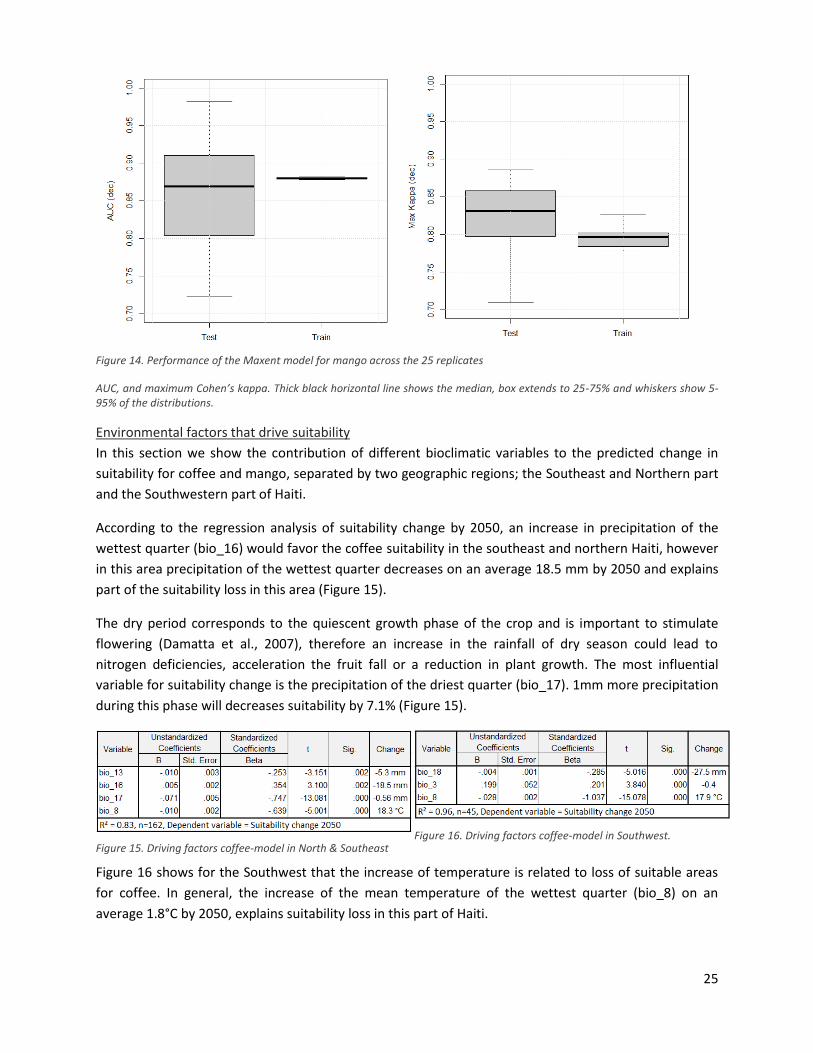
Figure 14. Performance of the Maxent model for mango across the 25 replicates
AUC, and maximum Cohen’s kappa. Thick black horizontal line shows the median, box extends to 25-75% and whiskers show 5-95% of the distributions.
Environmental factors that drive suitability
In this section we show the contribution of different bioclimatic variables to the predicted change in
suitability for coffee and mango, separated by two geographic regions; the Southeast and Northern part
and the Southwestern part of Haiti.
According to the regression analysis of suitability change by 2050, an increase in precipitation of the
wettest quarter (bio_16) would favor the coffee suitability in the southeast and northern Haiti, however
in this area precipitation of the wettest quarter decreases on an average 18.5 mm by 2050 and explains
part of the suitability loss in this area (Figure 15).
The dry period corresponds to the quiescent growth phase of the crop and is important to stimulate
flowering (Damatta et al., 2007), therefore an increase in the rainfall of dry season could lead to
nitrogen deficiencies, acceleration the fruit fall or a reduction in plant growth. The most influential
variable for suitability change is the precipitation of the driest quarter (bio_17). 1mm more precipitation
during this phase will decreases suitability by 7.1% (Figure 15).
Figure 15. Driving factors coffee-model in North & Southeast
Figure 16. Driving factors coffee-model in Southwest.
Figure 16 shows for the Southwest that the increase of temperature is related to loss of suitable areas
for coffee. In general, the increase of the mean temperature of the wettest quarter (bio_8) on an
average 1.8°C by 2050, explains suitability loss in this part of Haiti.
26
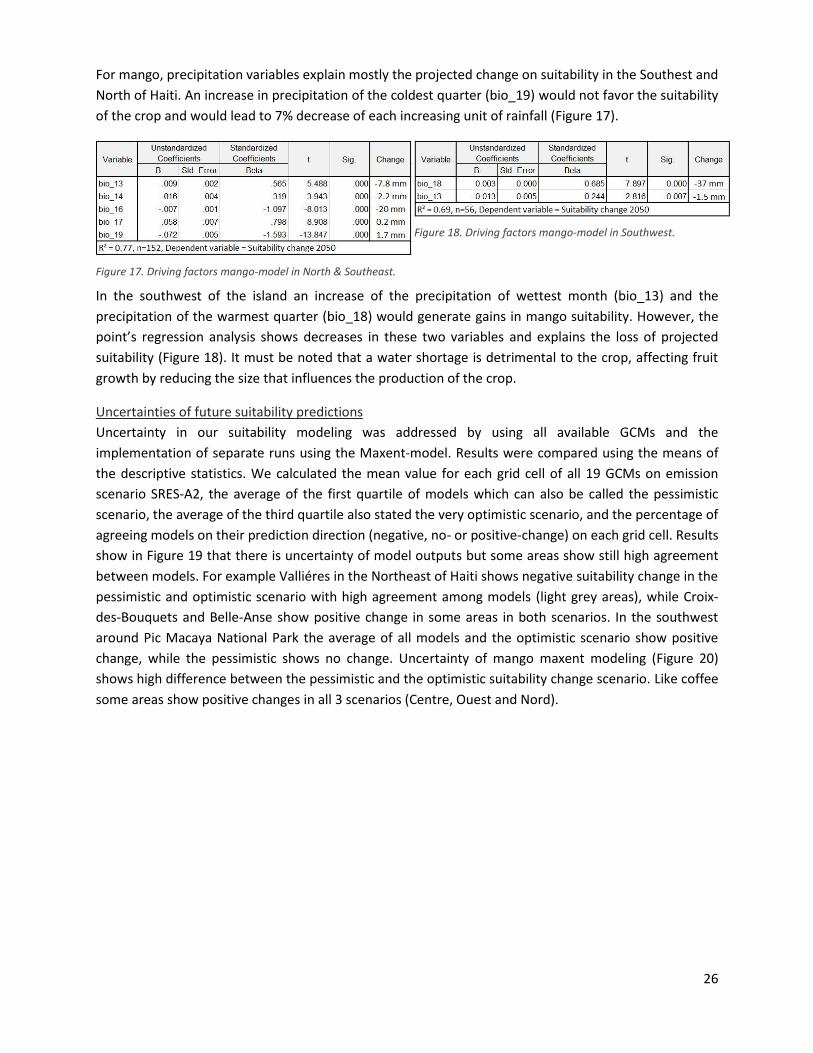
For mango, precipitation variables explain mostly the projected change on suitability in the Southest and
North of Haiti. An increase in precipitation of the coldest quarter (bio_19) would not favor the suitability
of the crop and would lead to 7% decrease of each increasing unit of rainfall (Figure 17).
Figure 17. Driving factors mango-model in North & Southeast.
Figure 18. Driving factors mango-model in Southwest.
In the southwest of the island an increase of the precipitation of wettest month (bio_13) and the
precipitation of the warmest quarter (bio_18) would generate gains in mango suitability. However, the
point’s regression analysis shows decreases in these two variables and explains the loss of projected
suitability (Figure 18). It must be noted that a water shortage is detrimental to the crop, affecting fruit
growth by reducing the size that influences the production of the crop.
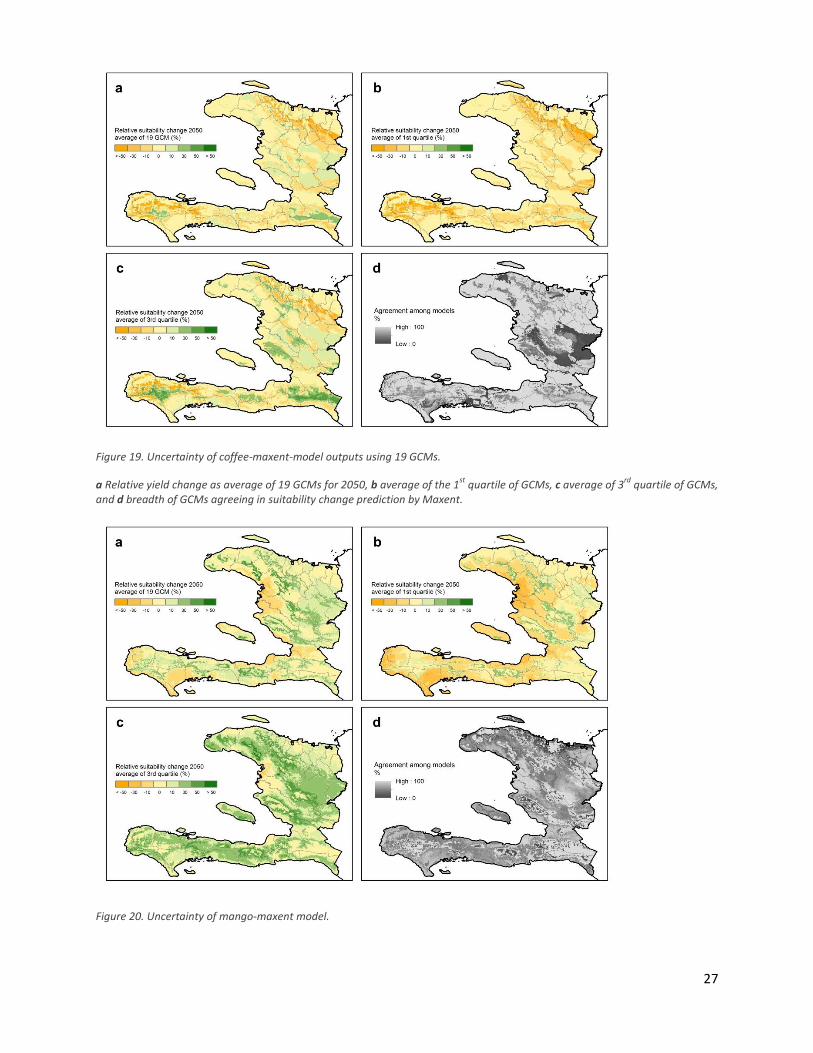
Uncertainties of future suitability predictions
Uncertainty in our suitability modeling was addressed by using all available GCMs and the
implementation of separate runs using the Maxent-model. Results were compared using the means of
the descriptive statistics. We calculated the mean value for each grid cell of all 19 GCMs on emission
scenario SRES-A2, the average of the first quartile of models which can also be called the pessimistic
scenario, the average of the third quartile also stated the very optimistic scenario, and the percentage of
agreeing models on their prediction direction (negative, no- or positive-change) on each grid cell. Results
show in Figure 19 that there is uncertainty of model outputs but some areas show still high agreement
between models. For example Valliéres in the Northeast of Haiti shows negative suitability change in the
pessimistic and optimistic scenario with high agreement among models (light grey areas), while Croix-
des-Bouquets and Belle-Anse show positive change in some areas in both scenarios. In the southwest
around Pic Macaya National Park the average of all models and the optimistic scenario show positive
change, while the pessimistic shows no change. Uncertainty of mango maxent modeling (Figure 20)
shows high difference between the pessimistic and the optimistic suitability change scenario. Like coffee
some areas show positive changes in all 3 scenarios (Centre, Ouest and Nord).
27
Figure 19. Uncertainty of coffee-maxent-model outputs using 19 GCMs.
a Relative yield change as average of 19 GCMs for 2050, b average of the 1st
quartile of GCMs, c average of 3rd
quartile of GCMs, and d breadth of GCMs agreeing in suitability change prediction by Maxent.
Figure 20. Uncertainty of mango-maxent model.
28
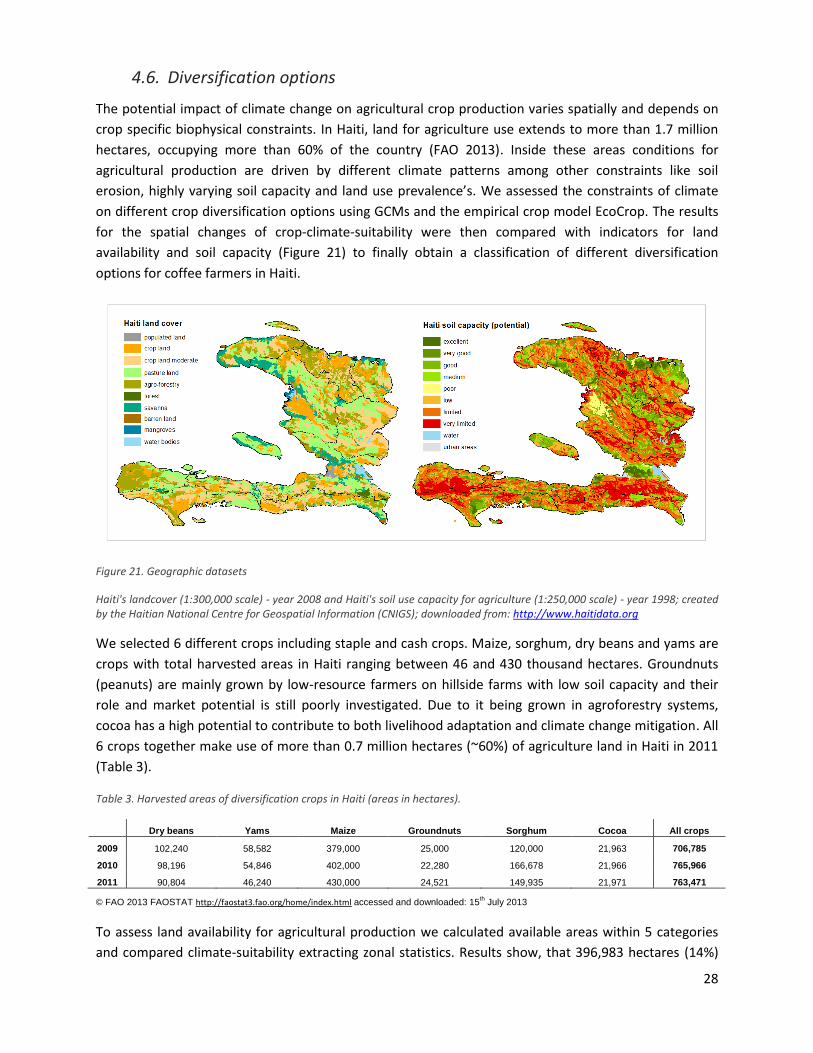
4.6. Diversification options
The potential impact of climate change on agricultural crop production varies spatially and depends on
crop specific biophysical constraints. In Haiti, land for agriculture use extends to more than 1.7 million
hectares, occupying more than 60% of the country (FAO 2013). Inside these areas conditions for
agricultural production are driven by different climate patterns among other constraints like soil
erosion, highly varying soil capacity and land use prevalence’s. We assessed the constraints of climate
on different crop diversification options using GCMs and the empirical crop model EcoCrop. The results
for the spatial changes of crop-climate-suitability were then compared with indicators for land
availability and soil capacity (Figure 21) to finally obtain a classification of different diversification
options for coffee farmers in Haiti.
Figure 21. Geographic datasets
Haiti's landcover (1:300,000 scale) - year 2008 and Haiti's soil use capacity for agriculture (1:250,000 scale) - year 1998; created by the Haitian National Centre for Geospatial Information (CNIGS); downloaded from: http://www.haitidata.org
We selected 6 different crops including staple and cash crops. Maize, sorghum, dry beans and yams are
crops with total harvested areas in Haiti ranging between 46 and 430 thousand hectares. Groundnuts
(peanuts) are mainly grown by low-resource farmers on hillside farms with low soil capacity and their
role and market potential is still poorly investigated. Due to it being grown in agroforestry systems,
cocoa has a high potential to contribute to both livelihood adaptation and climate change mitigation. All
6 crops together make use of more than 0.7 million hectares (~60%) of agriculture land in Haiti in 2011
(Table 3).
Table 3. Harvested areas of diversification crops in Haiti (areas in hectares).
Dry beans Yams Maize Groundnuts Sorghum Cocoa All crops
2009 102,240 58,582 379,000 25,000 120,000 21,963 706,785
2010 98,196 54,846 402,000 22,280 166,678 21,966 765,966
2011 90,804 46,240 430,000 24,521 149,935 21,971 763,471
© FAO 2013 FAOSTAT http://faostat3.fao.org/home/index.html accessed and downloaded: 15th July 2013
To assess land availability for agricultural production we calculated available areas within 5 categories
and compared climate-suitability extracting zonal statistics. Results show, that 396,983 hectares (14%)
29
of Haiti’s agricultural land are available and soil capacity is medium to excellent in these areas. Further
532,131 hectares (19%) are available but farmers are producing on soil with limited capacity. Almost the
same size as available areas we have areas were a land use change is necessary at least for some crops
like maize, sorghum or beans. Other crops like cocoa and coffee are already grown there, for example in
agro-forestry systems and could be expanded in these areas. Distribution of areas within the 5
categories is similar in the 3 southwestern departments (Table 4)
Table 4. Land availability for agricultural production intersected with soil capacity in Haiti.
Land use availability is categorized as AV (available land), CH (needs land use change) and NA (not available). Soil capacity is categorized as NL (No limitations), LL (lower limitations) and EX (excluded).
AV-NL AV-LL NL-CH LL-CH NA-EX Total (ha)
Country (Haiti) 396,983 532,131 294,688 646,124 880,082 2,750,008 Southwestern departments (Sud, Nippes, Grand Anse) 80,641 121,957 58,968 175,801 140,624 577,991
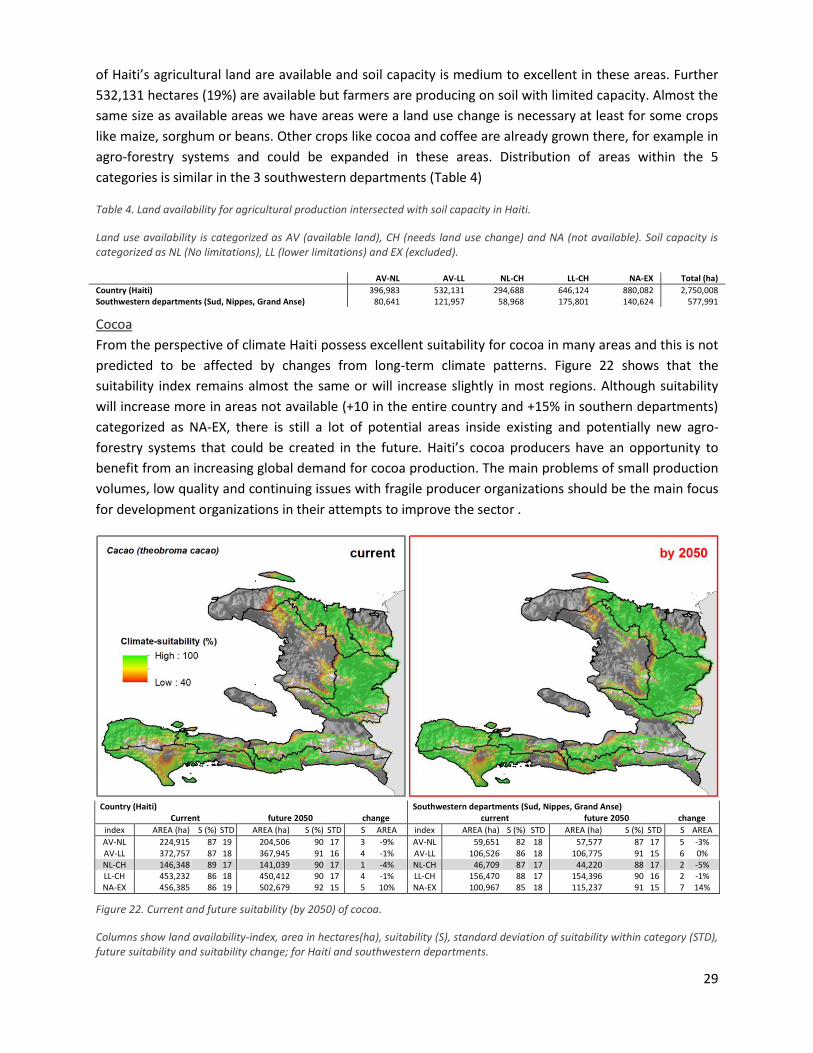
Cocoa
From the perspective of climate Haiti possess excellent suitability for cocoa in many areas and this is not
predicted to be affected by changes from long-term climate patterns. Figure 22 shows that the
suitability index remains almost the same or will increase slightly in most regions. Although suitability
will increase more in areas not available (+10 in the entire country and +15% in southern departments)
categorized as NA-EX, there is still a lot of potential areas inside existing and potentially new agro-
forestry systems that could be created in the future. Haiti’s cocoa producers have an opportunity to
benefit from an increasing global demand for cocoa production. The main problems of small production
volumes, low quality and continuing issues with fragile producer organizations should be the main focus
for development organizations in their attempts to improve the sector .
Country (Haiti) Southwestern departments (Sud, Nippes, Grand Anse)
Current future 2050 change
current future 2050 change
index AREA (ha) S (%) STD AREA (ha) S (%) STD S AREA index AREA (ha) S (%) STD AREA (ha) S (%) STD S AREA
AV-NL 224,915 87 19 204,506 90 17 3 -9% AV-NL 59,651 82 18 57,577 87 17 5 -3% AV-LL 372,757 87 18 367,945 91 16 4 -1% AV-LL 106,526 86 18 106,775 91 15 6 0% NL-CH 146,348 89 17 141,039 90 17 1 -4% NL-CH 46,709 87 17 44,220 88 17 2 -5% LL-CH 453,232 86 18 450,412 90 17 4 -1% LL-CH 156,470 88 17 154,396 90 16 2 -1% NA-EX 456,385 86 19 502,679 92 15 5 10% NA-EX 100,967 85 18 115,237 91 15 7 14%
Figure 22. Current and future suitability (by 2050) of cocoa.
Columns show land availability-index, area in hectares(ha), suitability (S), standard deviation of suitability within category (STD), future suitability and suitability change; for Haiti and southwestern departments.
30
Common beans
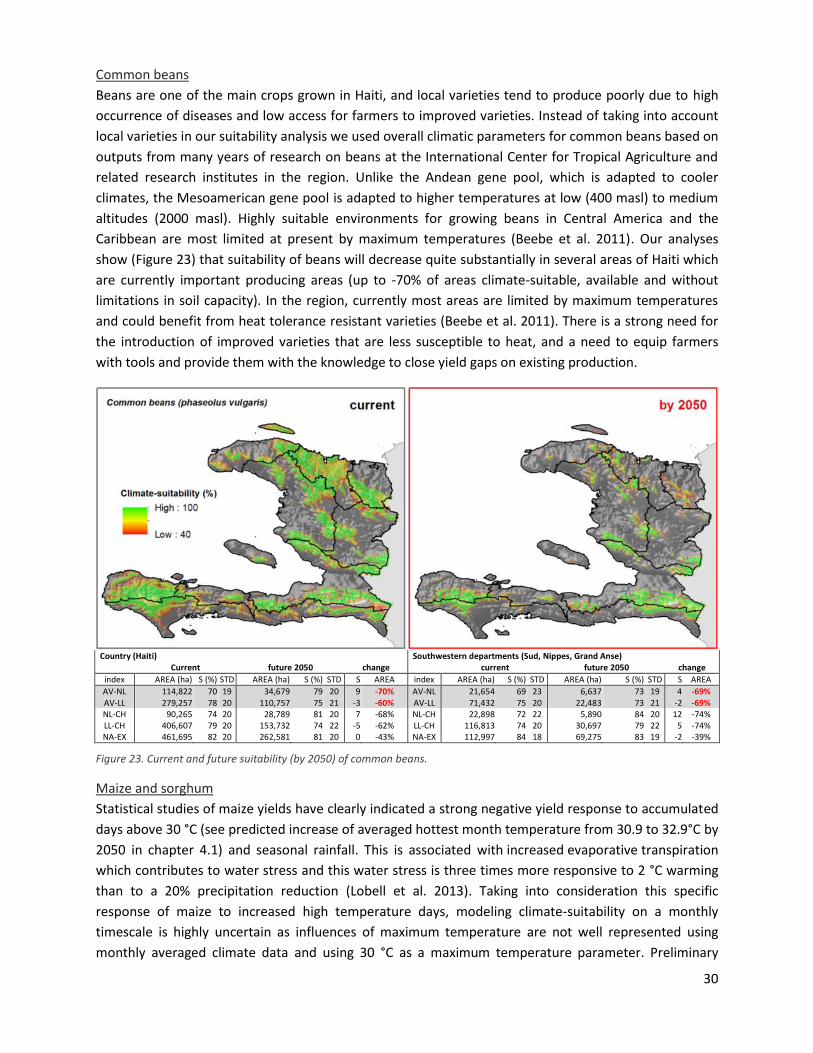
Beans are one of the main crops grown in Haiti, and local varieties tend to produce poorly due to high
occurrence of diseases and low access for farmers to improved varieties. Instead of taking into account
local varieties in our suitability analysis we used overall climatic parameters for common beans based on
outputs from many years of research on beans at the International Center for Tropical Agriculture and
related research institutes in the region. Unlike the Andean gene pool, which is adapted to cooler
climates, the Mesoamerican gene pool is adapted to higher temperatures at low (400 masl) to medium
altitudes (2000 masl). Highly suitable environments for growing beans in Central America and the
Caribbean are most limited at present by maximum temperatures (Beebe et al. 2011). Our analyses
show (Figure 23) that suitability of beans will decrease quite substantially in several areas of Haiti which
are currently important producing areas (up to -70% of areas climate-suitable, available and without
limitations in soil capacity). In the region, currently most areas are limited by maximum temperatures
and could benefit from heat tolerance resistant varieties (Beebe et al. 2011). There is a strong need for
the introduction of improved varieties that are less susceptible to heat, and a need to equip farmers
with tools and provide them with the knowledge to close yield gaps on existing production.
Country (Haiti) Southwestern departments (Sud, Nippes, Grand Anse)
Current future 2050 change
current future 2050 change
index AREA (ha) S (%) STD AREA (ha) S (%) STD S AREA index AREA (ha) S (%) STD AREA (ha) S (%) STD S AREA
AV-NL 114,822 70 19 34,679 79 20 9 -70% AV-NL 21,654 69 23 6,637 73 19 4 -69% AV-LL 279,257 78 20 110,757 75 21 -3 -60% AV-LL 71,432 75 20 22,483 73 21 -2 -69% NL-CH 90,265 74 20 28,789 81 20 7 -68% NL-CH 22,898 72 22 5,890 84 20 12 -74% LL-CH 406,607 79 20 153,732 74 22 -5 -62% LL-CH 116,813 74 20 30,697 79 22 5 -74% NA-EX 461,695 82 20 262,581 81 20 0 -43% NA-EX 112,997 84 18 69,275 83 19 -2 -39%
Figure 23. Current and future suitability (by 2050) of common beans.
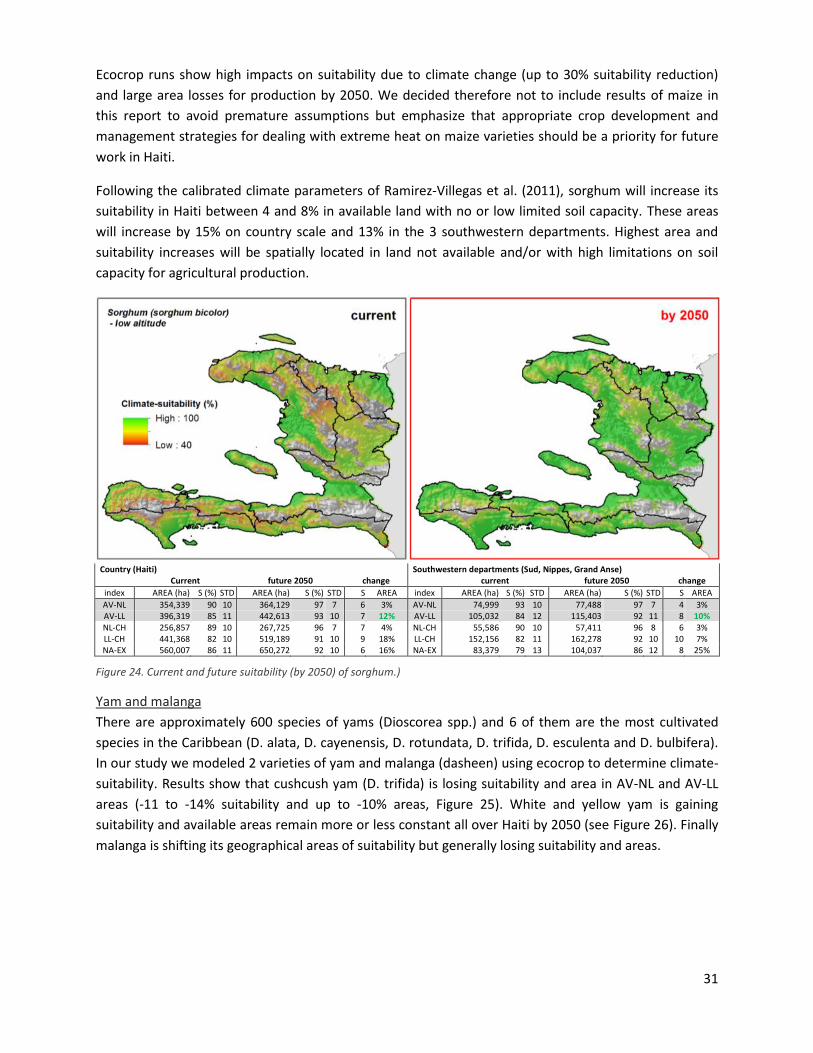
Maize and sorghum
Statistical studies of maize yields have clearly indicated a strong negative yield response to accumulated
days above 30 °C (see predicted increase of averaged hottest month temperature from 30.9 to 32.9°C by
2050 in chapter 4.1) and seasonal rainfall. This is associated with increased evaporative transpiration
which contributes to water stress and this water stress is three times more responsive to 2 °C warming
than to a 20% precipitation reduction (Lobell et al. 2013). Taking into consideration this specific
response of maize to increased high temperature days, modeling climate-suitability on a monthly
timescale is highly uncertain as influences of maximum temperature are not well represented using
monthly averaged climate data and using 30 °C as a maximum temperature parameter. Preliminary
31
Ecocrop runs show high impacts on suitability due to climate change (up to 30% suitability reduction)
and large area losses for production by 2050. We decided therefore not to include results of maize in
this report to avoid premature assumptions but emphasize that appropriate crop development and
management strategies for dealing with extreme heat on maize varieties should be a priority for future
work in Haiti.
Following the calibrated climate parameters of Ramirez-Villegas et al. (2011), sorghum will increase its
suitability in Haiti between 4 and 8% in available land with no or low limited soil capacity. These areas
will increase by 15% on country scale and 13% in the 3 southwestern departments. Highest area and
suitability increases will be spatially located in land not available and/or with high limitations on soil
capacity for agricultural production.
Country (Haiti) Southwestern departments (Sud, Nippes, Grand Anse)
Current future 2050 change
current future 2050 change
index AREA (ha) S (%) STD AREA (ha) S (%) STD S AREA index AREA (ha) S (%) STD AREA (ha) S (%) STD S AREA
AV-NL 354,339 90 10 364,129 97 7 6 3% AV-NL 74,999 93 10 77,488 97 7 4 3% AV-LL 396,319 85 11 442,613 93 10 7 12% AV-LL 105,032 84 12 115,403 92 11 8 10% NL-CH 256,857 89 10 267,725 96 7 7 4% NL-CH 55,586 90 10 57,411 96 8 6 3% LL-CH 441,368 82 10 519,189 91 10 9 18% LL-CH 152,156 82 11 162,278 92 10 10 7% NA-EX 560,007 86 11 650,272 92 10 6 16% NA-EX 83,379 79 13 104,037 86 12 8 25%
Figure 24. Current and future suitability (by 2050) of sorghum.)
Yam and malanga
There are approximately 600 species of yams (Dioscorea spp.) and 6 of them are the most cultivated
species in the Caribbean (D. alata, D. cayenensis, D. rotundata, D. trifida, D. esculenta and D. bulbifera).
In our study we modeled 2 varieties of yam and malanga (dasheen) using ecocrop to determine climate-
suitability. Results show that cushcush yam (D. trifida) is losing suitability and area in AV-NL and AV-LL
areas (-11 to -14% suitability and up to -10% areas, Figure 25). White and yellow yam is gaining
suitability and available areas remain more or less constant all over Haiti by 2050 (see Figure 26). Finally
malanga is shifting its geographical areas of suitability but generally losing suitability and areas.
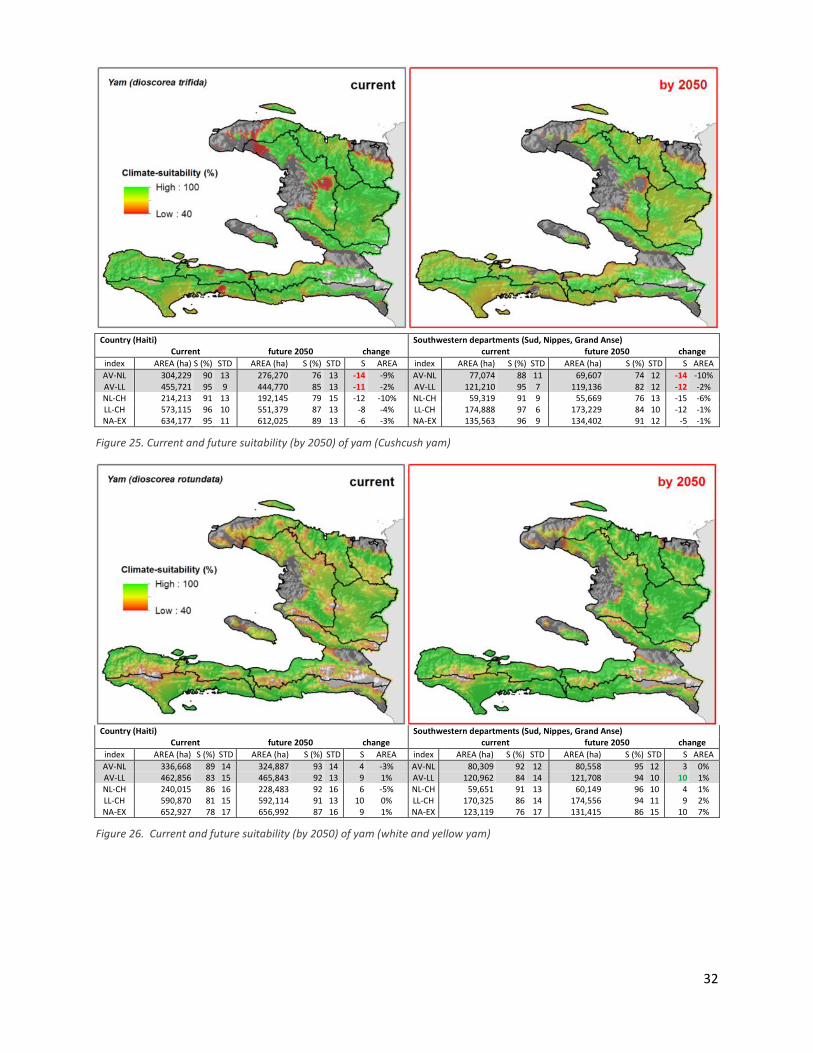
32
Country (Haiti) Southwestern departments (Sud, Nippes, Grand Anse)
Current future 2050 change
current future 2050 change
index AREA (ha) S (%) STD AREA (ha) S (%) STD S AREA index AREA (ha) S (%) STD AREA (ha) S (%) STD S AREA
AV-NL 304,229 90 13 276,270 76 13 -14 -9% AV-NL 77,074 88 11 69,607 74 12 -14 -10% AV-LL 455,721 95 9 444,770 85 13 -11 -2% AV-LL 121,210 95 7 119,136 82 12 -12 -2% NL-CH 214,213 91 13 192,145 79 15 -12 -10% NL-CH 59,319 91 9 55,669 76 13 -15 -6% LL-CH 573,115 96 10 551,379 87 13 -8 -4% LL-CH 174,888 97 6 173,229 84 10 -12 -1% NA-EX 634,177 95 11 612,025 89 13 -6 -3% NA-EX 135,563 96 9 134,402 91 12 -5 -1%
Figure 25. Current and future suitability (by 2050) of yam (Cushcush yam)
Country (Haiti) Southwestern departments (Sud, Nippes, Grand Anse)
Current future 2050 change
current future 2050 change
index AREA (ha) S (%) STD AREA (ha) S (%) STD S AREA index AREA (ha) S (%) STD AREA (ha) S (%) STD S AREA
AV-NL 336,668 89 14 324,887 93 14 4 -3% AV-NL 80,309 92 12 80,558 95 12 3 0% AV-LL 462,856 83 15 465,843 92 13 9 1% AV-LL 120,962 84 14 121,708 94 10 10 1% NL-CH 240,015 86 16 228,483 92 16 6 -5% NL-CH 59,651 91 13 60,149 96 10 4 1% LL-CH 590,870 81 15 592,114 91 13 10 0% LL-CH 170,325 86 14 174,556 94 11 9 2% NA-EX 652,927 78 17 656,992 87 16 9 1% NA-EX 123,119 76 17 131,415 86 15 10 7%
Figure 26. Current and future suitability (by 2050) of yam (white and yellow yam)
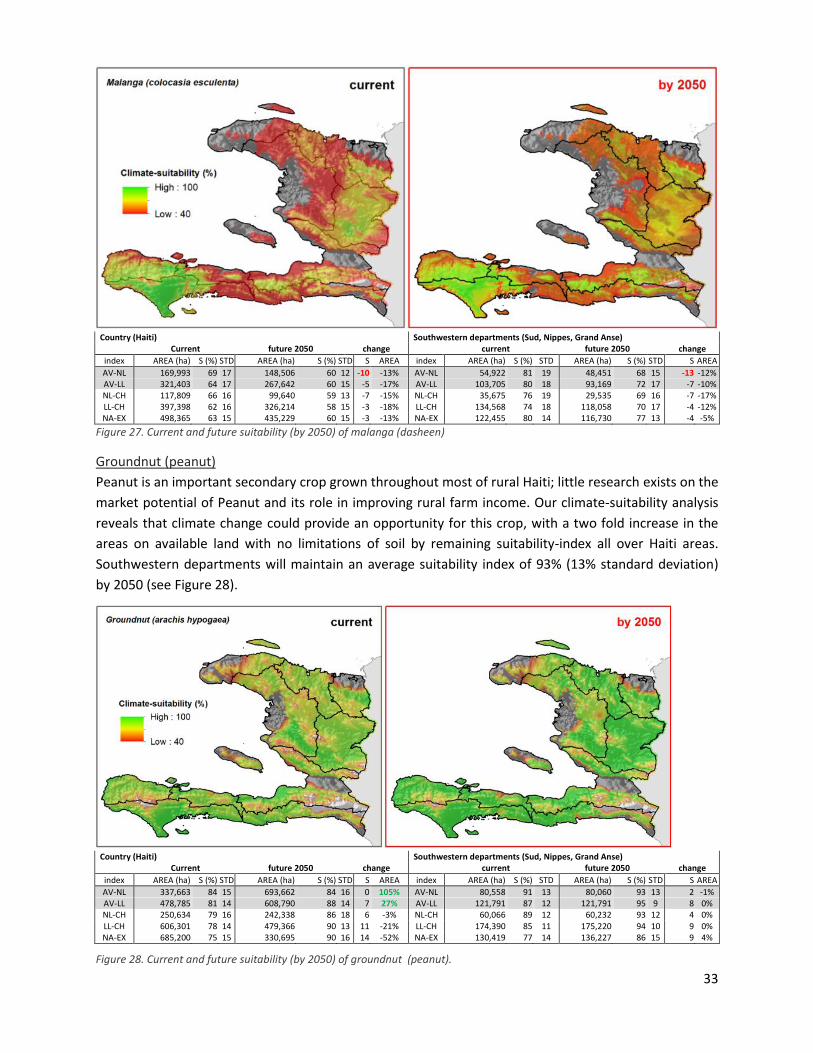
33
Country (Haiti) Southwestern departments (Sud, Nippes, Grand Anse)
Current future 2050 change
current future 2050 change
index AREA (ha) S (%) STD AREA (ha) S (%) STD S AREA index AREA (ha) S (%) STD AREA (ha) S (%) STD S AREA
AV-NL 169,993 69 17 148,506 60 12 -10 -13% AV-NL 54,922 81 19 48,451 68 15 -13 -12% AV-LL 321,403 64 17 267,642 60 15 -5 -17% AV-LL 103,705 80 18 93,169 72 17 -7 -10% NL-CH 117,809 66 16 99,640 59 13 -7 -15% NL-CH 35,675 76 19 29,535 69 16 -7 -17% LL-CH 397,398 62 16 326,214 58 15 -3 -18% LL-CH 134,568 74 18 118,058 70 17 -4 -12% NA-EX 498,365 63 15 435,229 60 15 -3 -13% NA-EX 122,455 80 14 116,730 77 13 -4 -5%
Figure 27. Current and future suitability (by 2050) of malanga (dasheen)
Groundnut (peanut)
Peanut is an important secondary crop grown throughout most of rural Haiti; little research exists on the
market potential of Peanut and its role in improving rural farm income. Our climate-suitability analysis
reveals that climate change could provide an opportunity for this crop, with a two fold increase in the
areas on available land with no limitations of soil by remaining suitability-index all over Haiti areas.
Southwestern departments will maintain an average suitability index of 93% (13% standard deviation)
by 2050 (see Figure 28).
Country (Haiti) Southwestern departments (Sud, Nippes, Grand Anse)
Current future 2050 change
current future 2050 change
index AREA (ha) S (%) STD AREA (ha) S (%) STD S AREA index AREA (ha) S (%) STD AREA (ha) S (%) STD S AREA
AV-NL 337,663 84 15 693,662 84 16 0 105% AV-NL 80,558 91 13 80,060 93 13 2 -1% AV-LL 478,785 81 14 608,790 88 14 7 27% AV-LL 121,791 87 12 121,791 95 9 8 0% NL-CH 250,634 79 16 242,338 86 18 6 -3% NL-CH 60,066 89 12 60,232 93 12 4 0% LL-CH 606,301 78 14 479,366 90 13 11 -21% LL-CH 174,390 85 11 175,220 94 10 9 0% NA-EX 685,200 75 15 330,695 90 16 14 -52% NA-EX 130,419 77 14 136,227 86 15 9 4%
Figure 28. Current and future suitability (by 2050) of groundnut (peanut).
34
5. Conclusions
We assessed the impact of short- mid- & long-term climate change on coffee and mango production
systems in Haiti. Further potential impacts on crops proposed to be diversification options for coffee
farmers were assessed by analyzing their climate-suitability to ensure that strategic adaptation work
will be done on current and future suitable crops. We reviewed several crop suitability models
before deciding upon the most appropriate model to use in the analysis. Maximum entropy
(Maxent) is a niche modeling method and was selected to model potential current and future
distribution of coffee and mango. Ecocrop, a crop niche prediction model using climatic ranges as
input to determine a suitability index, was used for assessing diversification options. We then
compared climate-suitable area-outcomes with a land availability-index for agriculture production
and extracted spatial statistics from the climate-suitability layers based on the 5 land-availability
layers using a Geographical Information System (GIS).
Results show that changes in temperature and rainfall patterns will cause a general decrease of
areas suitable for coffee and reduce areas which currently possess high suitability and coffee will
lose suitability in lower altitudes. Mango will remain a highly suitable crop in many regions of Haiti.
The assessment of diversification options for coffee farmers shows that suitability for cocoa and is
not predicted to be affected by changes from long-term climate patterns and Haiti’s cocoa
producers could be part to meet the global demand for high quality cocoa production. For existing
maize productions we emphasize that appropriate crop development and management strategies
for dealing with extreme heat on maize varieties should be a priority for future work in Haiti.
Different yams are losing and gaining depending on specific variety and need to be selected in order
to develop their production. Sorghum and Groundnut are promising due to predicted increased
suitability in the future.
Changes in temperature and rainfall will also change prevalence of pest and disease. Although we
didn’t quantify the impact of climate change on major pest and diseases for Haiti in this study, it is
important to focus in future work on how coffee species, mangoes and other crops in Haiti are
influenced by pests and diseases under accelerated climate change.
There are many opportunities to adapt to changes and for those coffee farms whose suitability will
drop but not decrease drastically, proactive adaptation is a crucial strategy. Agroforestry systems
such as coffee systems are not only important as a commodity and cash income generator for
smallholder but also as a provider of ecosystems services. A decrease in coffee suitability is likely
going to threaten the environmental services coffee systems provide, such as soil cover, carbon
sequestration, biodiversity and water storage. Therefore a key strategy needs to focus on
maintaining the environmental services with a different agroforestry system. In this context cocoa is
a promising option. We distinguish 3 general strategies to adapt to the change of coffee suitability.
The three strategies are interlinked and will replace each other over time. Areas that will increase in
suitability need strategic investment. Areas that will lose some suitability are likely to be maintained
through targeted strategies such as irrigation, shade management and change to more drought
resident varieties. Areas that are likely to suffer from significant decrease in suitability need to start
diversifying in order to switch to different crops, such as cocoa, once coffee is not suitable any more.
35
References
Amaya, G., Mencía, V. E., Gautier, P., & Gemeil, J. A. (1999, May). Haiti Small-Scale Coffee Producers
Production, Processing, Quality Control and Marketing. USAID/Haiti Agriculture and Economic Growth
Office, Washington, D.C.
Arias, D., Brearlet, E., & Damais, G. (2006). Restoring the competitiveness of the coffee sector in Haiti. Inter-
American Development Bank.
Beebe, S., Ramirez, J., Jarvis, A., Rao, I. M., Mosquera, G., Bueno, J. M., & Blair, M. W. (2011). Chapter 16
Genetic Improvement of Common Beans and the Challenges of Climate Change. Challenges.
Busby, J.R. (1991), “BIOCLIM: A bioclimatic analysis and prediction system”, Plant Protection Quarterly, Vol. 6,
pp. 8-9.
Castañeda, N. P., Rodríguez, F., & Lundy, M. (2011). Assessment of Haitian Mango Value Chain (p. 34).
Baltimore, USA. Retrieved from www.crsprogramquality.org
Covey, C., AchutaRao, K. M., Cubasch, U., Jones, P., Lambert, S. J., Mann, M. E., … Taylor, K. E. 2003. An
overview of results from the Coupled Model Intercomparison Project. Global and Planetary Change, 37(1-2),
103–133. doi:10.1016/S0921-8181(02)00193-5
Damatta, F., Ronchi, C., Claudio, P., Maestri, M. And Barros, R. 2007. Ecophidiology of coffee growth and production. Braz J. Plant Physiol., vol19, n4 (cited 2012-02-23) pp 485-510.
Davis, A. P., Gole, T. W., Baena, S., & Moat, J. (2012). The Impact of Climate Change on Indigenous Arabica
Coffee (Coffea arabica): Predicting Future Trends and Identifying Priorities. (B. Fenton, Ed.)PLoS ONE,
7(11), e47981. doi:10.1371/journal.pone.0047981
Elith, J., Graham, C.H., Anderson, R.P., Dudík, M., Ferrier, S., Guisan, A., Hijmans, R.J., Huettmann, F.,
Leathwick, R., Lehmann, A., Li, J., Lohmann, L.G., Loiselle, B.A., Manion, G., Moritz, C., Nakamura, M.,
Nakazawa,Y., Overton, J.McC., Peterson, A.T., Phillips, J., Richardson, K., Scachetti-Pereira, R., Schapire, E.,
Soberon, J., Williams, S., Wisz, M., Zimmermann, E. 2006. Novel methods improve prediction of species'
distributions from occurrence data. Ecography 29:129-151.
FAO 2000. The Ecocrop database. Rome. Available at: http://goo.gl/52X7t [Accessed July 3rd, 2013].
FAO. (2013). FAOSTAT. Retrieved from faostat.fao.org
Haiti Coffee Supply Chain Risk Assessment. (2010). (p. 35 pags.). The Agricultural Risk Management Team, The
World Bank.
Hijmans R.J., Guarino L., Cruz M., Rojas E. 2001. Computer tools for spatial analysis of plant genetic resources
data. 1. DIVA-GIS. Plant Genet Resour Newsl 127:15–19
Hijmans R. J., Cameron S. E., Parra J. L., Jones P. G., & Jarvis A. 2005. Very high resolution interpolated climate
surfaces for global land areas. International Journal of Climatology, 25(15), 1965–1978.
Hijmans R.J., Guarino L., and Mathur P. 2012. DIVA-GIS Version 7.5, Manual. Available at: http://goo.gl/Y3RXg
[Accessed July 3rd, 2013].
Hijmans R.J. and Graham C. (2006) The ability of climate envelope models to predict the effect of climate change
on species distributions. Global Change Biology 12: 2272-2281.
Intergovernmental Panel on Climate Change (IPCC). 2000. Emission Scenarios. A Special Report of IPCC Working
Group III. Intergavernmental Panel on Climate Change. Available at: http://goo.gl/vhvuP [Accessed July 3rd,
2013].
Intergovernmental Panel on Climate Change (IPCC). 2007. IPCC Fourth Assessment Report: Climate Change 2007.
IPCC, Geneva. Available at: http://goo.gl/SeOZ4 [Accessed July 3rd, 2013].
Jarvis A., Touval J. L., Schmitz M. C., Sotomayor L., and Hyman G. G. 2010. Assessment of threats to ecosystems
in South America. Journal for Nature Conservation 18, no. 3: 180-188.
Jarvis, A., Ramirez-Villegas, J., Herrera Campo, B. V., & Navarro-Racines, C. (2012). Is Cassava the Answer to
African Climate Change Adaptation? Tropical Plant Biology. doi:10.1007/s12042-012-9096-7
Jones, J. W., Hoogenboom, G., Porter, C. H., Boote, K. J., Batchelor, W. D., Hunt, L. A., … Ritchie, J. T. (2003).
The DSSAT cropping system model. Crop Science (Vol. 18).
36
Laderach, P., Lundy, M., Jarvis, A., Ramirez, J., Perez, E., Schepp, K., & Eitzinger, A. (2009). Predicted impact of
climate change on coffee-supply chains. Tropical Agriculture.
Läderach, P., Martinez-Valle, a., Schroth, G., & Castro, N. (2013). Predicting the future climatic suitability for
cocoa farming of the world’s leading producer countries, Ghana and Côte d’Ivoire. Climatic Change.
doi:10.1007/s10584-013-0774-8
Lobell, D. B., Hammer, G. L., McLean, G., Messina, C., Roberts, M. J., & Schlenker, W. (2013). The critical role of
extreme heat for maize production in the United States. Nature Climate Change, 3(4), 1–5.
doi:10.1038/nclimate1832.
Lobo, J.M., Jiménez-Valverde, A. and Real, R., 2008. AUC: a misleading measure of the performance of predictive
distribution models. Global Ecology and Biogeography, 17(2): 145-151
Manel, S., Williams, H.C. and Ormerod, S.J., 2001. Evaluating presence–absence models in ecology: the need to
account for prevalence. Journal of Applied Ecology, 38(5): 921-931.
Mitchell, S. a, Asemota, H. N., & Ahmad, M. H. (1995). Effects of explant source, culture medium: Strength and
growth regulators on the in-vitro propagation of three Jamaican yams: (Dioscorea cayenensis,D trifida and d
rotundata). Journal of the Science of Food and Agriculture, 67(2), 173–180. doi:10.1002/jsfa.2740670206
O’BRIEN, R. 2004. Spatial Decision Support for Selecting Tropical Crops and Forages in Uncertain Environments.
PhD thesis, Department of Spatial Sciences, Curtin University of Technology, Perth, 278pp.
PEARL J. 1990. Bayesian Decision Methods, in: Readings in Uncertainty Reasoning, SHAFER, G. and J. PEARL
(eds.), Morgan Kaufmann, San Mateo, CA, pp. 345-352.
Peterson, A.T., Papes, M. and Soberón, J., 2008. Rethinking receiver operating characteristic analysis applications in
ecological niche modeling. Ecological Modelling, 213(1): 63-72
Phillips, S.J., R.P. Anderson, and R.E. Schapire. 2006. Maximum entropy modeling of species geographic
distributions. Ecological Modelling 190:231-259.
Ramírez, J., & Bueno-Cabrera, A. (2009). Working with climate data and niche modeling I . Creation of bioclimatic
variables. Tropical Agriculture, 4(July). Retrieved from
http://gisweb.ciat.cgiar.org/GCMPage/docs/tutorial_bcvars_creation.pdf
Ramirez-Villegas J., & Jarvis A. 2010. Downscaling Global Circulation Model Outputs: The Delta Method.
Decision and Policy Analysis Working Paper No. 1, Cali, Colombia. Available at: http://goo.gl/WvFXJ
[Accessed July 3rd, 2013].
Ramirez-Villegas, J., Jarvis, A., & Läderach, P. (2011). Empirical approaches for assessing impacts of climate
change on agriculture: The EcoCrop model and a case study with grain sorghum. Agricultural and Forest
Meteorology. doi:10.1016/j.agrformet.2011.09.005
Ramírez-Villegas J, Lau C, Köhler A-K, Signer J, Jarvis A, Arnell N, Osborne T, Hooker J. 2011b. Climate
analogues: finding tomorrow’s agriculture today. Working Paper no. 12. Cali, Colombia: CGIAR Research
Program on Climate Change, Agriculture and Food Security (CCAFS). Available online at:
www.ccafs.cgiar.org
Rodríguez, F., Castañeda, N. P., & Lundy, M. (2011). Assessment of Haitian Coffee Value Chain (p. 40). Baltimore,
USA. Retrieved from crsprogramquality.org
Serra-Diaz, J. M., Keenan, T. F., Ninyerola, M., Sabaté, S., Gracia, C., Lloret, F. (2013), Geographical patterns of
congruence and incongruence between correlative species distribution models and a process-based
ecophysiological growth model. Journal of Biogeography. doi: 10.1111/jbi.12142
Solomon S., Qin D., Manning M., Chen Z., Marquis M., Averyt K.B., Tignor M., and Miller H.L. 2007. IPCC
2007: Summary for Policymakers. Climate change 2007: The physical science basis. Contribution of working
group I to the fourth assessment report of the intergovernmental panel on climate change. Available at:
http://goo.gl/N4RMw [Accessed July 3rd, 2013].
Stanton, J. C., Pearson, R. G., Horning, N., Ersts, P., & Reşit Akçakaya, H. (2011). Combining static and dynamic
variables in species distribution models under climate change. Methods in Ecology and Evolution, (i), no–no.
doi:10.1111/j.2041-210X.2011.00157.x