Embed Size (px)
Citation preview
Prediction of sulfotransferase specificity
for risk assessment in drug design
Inaugural-Dissertation
to obtain the academic degree
Doctor rerum naturalium (Dr. rer. nat.)
submitted to the Department of Biology, Chemistry and Pharmacy
of Freie Universität Berlin
by
Christin Rakers
from Lahr, Germany
2016
Research of the present study was conducted from April 2012 till October 2015 under supervision
of Prof. Dr. Gerhard Wolber at the Institute of Pharmacy of the Freie Universität Berlin, Germany.
1. Gutachter: Prof. Dr. Gerhard Wolber
2. Gutachter: Prof. Dr. Dr. Klaus Liedl
Disputation am: 28.04.2016
Acknowledgements
First of all, I would like to sincerely thank my supervisor Prof. Gerhard Wolber for giving me the
opportunity to join his lab and most importantly for providing the guidance and support to conduct this
PhD study. I am very grateful for the scientifically creative environment and all the opportunities during
my studies.
Further, I would like to thank all group members of the computer-aided drug design lab of Prof. Wolber for
their company and help. I want to thank Dr. Jérémie Mortier, Dr. Marcel Bermudez, and Dominique Sydow
for helpful and inspiring discussions and great collaborations.
I would also like to express my gratitude towards our collaboration partners from the University of
Potsdam, Prof. Burkhard Kleuser and Dr. Fabian Schumacher, and from the German Institute of Human
Nutrition (DIfE) Potsdam-Rehbrücke, Prof. Hansruedi Glatt and Dr. Walter Meinl. I am very thankful for
the opportunity of working together, conducting the experiments, and having interesting discussions on the
results.
Special thanks goes to former CADD group member Dr. Susanne Dupré and technical assistant Martina
Scholtyssek (DIfE, Potsdam-Rehbrücke) for their technical support, and to the members of the ZEDAT at
the FU Berlin for their help during computation on the Soroban computer cluster.
Furthermore, I thank Prof. Gerhard Ecker (University of Vienna, Austria) for creating and curating the PhD
program EUROPIN and for allowing me to be part of this endeavor. I also thank all the professors and
members of the scientific advisory board for their constructive feedback and creative discussions.
Gratefully acknowledged is the financial support by the Ernst Schering Foundation and the Elsa-Neumann
Scholarship of the state Berlin.
I would like to thank everyone out there I’ve crossed paths and specifically thank Lena Lampe, Lena Robra,
and Mia Sandbothe for accompanying me on this journey.
Ich möchte meinen Eltern, Luise und Werner Rakers, für ihre immerwährende und bedingungslose
Unterstützung danken. Vielen Dank für all die Möglichkeiten, die mir eröffnet, und all die Freiheiten, die
mir ermöglicht wurden!
I
Summary
Sulfotransferases (SULTs) are among the predominant enzyme families of phase II metabolism.
They transform endogenous molecules and environmental substances, such as drugs, into more
hydrophilic entities serving detoxification. This transformation has also been associated with the
formation of chemically reactive metabolites interacting with DNA. SULT subtype 1E1
(SULT1E1) shows high affinity towards estrogenic compounds and is involved in the regulation
of endogenous estrogens such as estradiol. On the other hand, this enzyme can be strongly
inhibited by environmental estrogens and endocrine disrupting compounds which deregulates
metabolism reactions in the human body. The aim of the present study was to develop an in silico
model for the prediction of SULT1E1 ligands, which allows identification of substrates and
inhibitors to facilitate drug design and support risk assessment.
All available crystal structures of SULT1E1 were analysed and compared to other major SULT
subtypes to elucidate structural descriptors that influence ligand binding and substrate
specificity. Findings from this structural investigation provided essential clues for subsequent
prediction model development. In order to create a computer-based model for SULT1E1 ligand
prediction, a specific workflow was designed using a combination of different in silico techniques.
MD simulations were performed to investigate enzyme flexibility contributing to the broad
substrate spectra of metabolic enzymes and to sample the conformational space. Diversity
clustering of the trajectories produced an ensemble of protein conformations whose ligand
binding sites differed from the original SULT1E1 crystal structure. In an ensemble docking
approach, these protein conformations were combined with a ligand database of active SULT1E1
ligands, consisting of substrates, inhibitors, and concentration-dependent ligands (CDLs), to
generate ligand-target complexes and to investigate their interaction patterns. The ensemble
docking results were statistically and visually analysed based on 3D pharmacophore feature
formation. Guided by statistical analysis of docking experiments, a selection of ligand-target
complexes was chosen as a basis for 3D pharmacophore development. Eight specific 3D
pharmacophores were developed that allow identification of diverse ligand classes (different
activities and scaffolds) and types (substrates, inhibitors) of SULT1E1. The validated 3D
pharmacophore ensemble showed a sensitivity of 60 % and a specificity of 98 %. For further
refinement of the pharmacophore-based prediction of hit molecules, a substrate-filter and two
classification models based on support vector machines (SVM) were created. The validated SVM
models for inhibitor and substrate classification showed accuracies of 85 % and 91 %, respectively.
II
In order to estimate the impact of SULT1E1 metabolism on current drugs, the final prediction
model was applied to the DrugBank (a database comprising about 6,500 experimental and
approved drugs) for virtual screening. From the 68 hit molecules, 28 % were identified as active
SULT1E1 ligands through literature search. A selection of nine compounds was chosen for
experimental validation including enzyme assays for inhibition and sulfonation. The
experimental results confirmed the computer-based hypotheses and revealed previously
unknown involvement of compounds listed in the DrugBank in biotransformation or inhibition
of SULT1E1.
The resulting prediction model of SULT1E1 could serve as an efficient in silico tool in early drug
development for improved virtual screening of large databases and to provide structural alerts
correlated with phase II metabolism during lead optimization. Furthermore, it potentially
supports risk assessment of developed compounds in the pharmaceutical, nutritional, and
cosmetic industry that bear the risk of being transformed into chemically reactive compounds
damaging cellular DNA.
III
Zusammenfassung
Sulfotransferasen (SULTs) gehören zu den wichtigsten Enzymfamilien des Phase II
Metabolismus. Mit ihrer Hilfe werden Xenobiotika in wasserlöslichere Zwischenprodukte
umgewandelt, um schneller ausgeschieden werden zu können. SULT-katalysierte Reaktionen
können jedoch auch zur Entstehung cancerogener Metaboliten führen. SULT Subtyp 1E1
(SULT1E1) weist Substratspezifität gegenüber Estrogenen auf und spielt daher eine wichtige
Rolle in der Hormonregulation. Zudem kann das Enzym durch Estrogene und Endokrine
Disruptoren stark inhibiert werden. Das Ziel dieser Studie war daher die Entwicklung eines
computergestützten Modells zur Vorhersage von SULT1E1-Liganden welches die Identifizierung
von Substraten und Inhibitoren erlaubt.
Verfügbare Kristallstrukturen der SULT1E1 wurden analysiert und mit anderen SULT-Subtypen
verglichen. Dies diente der Identifizierung von Merkmalen, welche die Substratspezifität
beeinflussen und welche zur Entwicklung eines Vorhersagemodells eingesetzt werden können.
Zur Erstellung des Modells wurde eine Sequenz von Methoden entwickelt und implementiert,
die das breite Substratspektrum metabolischer Enzyme berücksichtigt. Im ersten Schritt wurden
Moleküldynamiken des Enzyms in An- und Abwesenheit des Kofaktors simuliert. Auf Basis der
Molekültrajektorien wurden Proteinkonformationen extrahiert, welche eine besonders diverse
Ligandenbindestelle aufwiesen. Im nächsten Schritt wurden aktive Liganden der SULT1E1
(Inhibitoren, Substrate und Konzentrations-abhängige Liganden (CDLs)) in das Ensemble von
Proteinen gedockt. Die daraus resultierenden Protein-Ligand Komplexe wurde statistisch und
visuell unter Berücksichtigung von 3D Pharmakophordeskriptoren ausgewertet. Auf Grundlage
dieser Analyse wurden acht spezifische 3D Pharmakophore erstellt, welche in der Lage sind
SULT1E1-Liganden zu identifizieren. Die validierten 3D Pharmakophore weisen eine Sensitivität
von 60 % und eine Spezifität von 98 % auf. Zur Optimierung der Pharmakophor-basierten
Vorhersage wurden ein Substratfilter und zwei Klassifizierungsmodelle basierend auf Support
Vector Machines (SVM) entwickelt. Die validierten SVM Modelle zur Inhibitor- und Substrat-
Identifizierung weisen eine Genauigkeit von 85 % und 91 % auf.
Das finale Vorhersagemodell für SULT1E1-Liganden wurde durch virtuelles Screening der
DrugBank-Datenbank getestet, um das Ausmaß an SULT-Metabolismus an derzeitig erhältlichen
oder in der Entwicklung stehenden Medikamenten zu untersuchen. Von etwa 6.500 gelisteten
Molekülen in der Datenbank wurde 68 als aktive SULT1E1-Liganden identifiziert. Davon waren
IV
28 % bereits in der Literatur bekannt. Neun der restlichen Substanzen wurden zur
experimentellen Testung ausgewählt in der sowohl die Bestimmung von Inhibitoren als auch
Substraten berücksichtigt wurde. Die experimentellen Ergebnisse standen im Einklang mit der
computer-basierten Vorhersage und führten zur Identifizierung von Substanzen welche zuvor
nicht mit SULT1E1-Aktivität in Verbindung gebracht wurden.
Das hier entwickelte computerbasierte Vorhersagemodell des Enzyms SULT1E1 kann in frühen
Phasen der Arzneistoffentwicklung eingesetzt werden, um potenziell metabolisch toxische
Substanzen zu identifizieren. Desweiteren unterstützt das Modell die Risikobewertung bereits
vermarkteter Substanzen der Pharma-, Ernährungs- und Kosmetikindustrie.
V
Table of contents
Summary .................................................................................................................................................... I
Zusammenfassung ................................................................................................................................ III
Table of contents ..................................................................................................................................... V
1. INTRODUCTION ......................................................................................................................... 1
1.1. Human metabolism ............................................................................................................... 1
1.2. Metabolism prediction in drug discovery .......................................................................... 5
1.3. Sulfotransferases .................................................................................................................. 11
1.3.1. Sulfotransferase enzyme family ................................................................................. 11 1.3.2. Sulfotransferase subtype 1E1 ..................................................................................... 16 1.3.3. Molecular modelling studies on sulfotransferases .................................................. 19
2. AIM AND OBJECTIVES ........................................................................................................... 23
3. METHODS ................................................................................................................................... 25
3.1. Computational methods ..................................................................................................... 25
3.1.1. Molecular dynamics simulations ............................................................................... 25 3.1.2. Molecular docking ....................................................................................................... 28 3.1.3. 3D Pharmacophores .................................................................................................... 29 3.1.4. Virtual screening and assessment of model performance ..................................... 30 3.1.5. Machine learning ......................................................................................................... 31
3.2. Experimental methods ........................................................................................................ 34
3.2.1. In vitro activity assay of SULT1E1 ............................................................................. 34
4. RESULTS ...................................................................................................................................... 36
4.1. Structural investigation on SULT1E1 ................................................................................ 36
4.2. Development of a prediction model for SULT1E1 .......................................................... 41
4.2.1. Workflow ...................................................................................................................... 41 4.2.2. Exploration of structural flexibility of SULT1E1 ..................................................... 42 4.2.3. Compilation of a ligand database of SULT1E1 ........................................................ 47 4.2.4. Generation of ligand-target complexes and interaction analysis .......................... 49 4.2.5. Development and validation of 3D pharmacophores of SULT1E1 ...................... 55 4.2.6. Comparison of static and dynamic 3D pharmacophores ....................................... 59 4.2.7. Prediction refinement via machine learning and post-screening filters .............. 61 4.2.8. Final prediction model for SULT1E1 ligands ........................................................... 66
4.3. Virtual screening and prediction of SULT1E1 ligands ................................................... 67
4.3.1. Screening of the DrugBank ......................................................................................... 67 4.3.2. Screening of chemical and natural product databases ........................................... 70
4.4. Experimental validation of predicted hits ........................................................................ 72
4.4.1. Inhibition assay of SULT1E1 ...................................................................................... 72
VI
4.4.2. Sulfonation assay of SULT1E1 ................................................................................... 74 4.4.3. In silico evaluation of binding modes ........................................................................ 76
5. DISCUSSION .............................................................................................................................. 80
5.1. Structural investigation on SULT1E1 ................................................................................ 80
5.2. Development of a prediction model for SULT1E1 .......................................................... 81
5.3. Virtual screening and prediction of SULT1E1 ligands ................................................... 85
5.4. Experimental validation of predicted hits ........................................................................ 85
6. CONCLUSIONS AND OUTLOOK ......................................................................................... 87
7. EXPERIMENTAL SECTION ..................................................................................................... 90
7.1. Computational methods ..................................................................................................... 90
7.2. Experimental methods ........................................................................................................ 94
8. BIBLIOGRAPHY ......................................................................................................................... 97
APPENDIX ............................................................................................................................................. 123
List of active molecules of SULT1E1 ............................................................................................. 124
Plots from MD simulations of SULT1E1 ....................................................................................... 127
ROC Curves of the 3D pharmacophore validation ..................................................................... 130
Decision trees for inhibitor and substrate classification ............................................................. 131
Pharmacophore hits from DrugBank screening that were excluded in subsequent steps .... 133
Table of DrugBank screening hits .................................................................................................. 134
Dynophore data ............................................................................................................................... 136
List of Abbreviations ........................................................................................................................... 143
List of Figures ........................................................................................................................................ 145
List of Tables ......................................................................................................................................... 149
INTRODUCTION
1
1. INTRODUCTION
1.1. Human metabolism
Metabolism (from Greek: μεταβολή metabolē, “change”) is defined as “the entire physical and
chemical processes involved in the maintenance and reproduction of life in which nutrients are broken down
to generate energy (...). In medicinal chemistry the term metabolism refers to the biotransformation of
xenobiotics and particularly drugs.”, according to the International Union of Pure and Applied
Chemistry (IUPAC) 1. Historically, along with the birth of organic chemistry marked by the work
of German chemist Friedrich Wöhler (1800 - 1882), the occurrence of biotransformation in the
human body has already been discovered during the early 19th century2. Almost two hundred
years ago, discoveries on metabolic transformations were mostly made through rudimentary in
vivo experimentation. Often, chemicals were administered to volunteers (frequently the
experimentalists themselves) or animals such as cats and dogs, and the excreted fluids were
assessed regarding potential chemical alterations of the administered substances. Fuelled by
advances in charcoal and oil industries, progress in analytical methods and organic chemistry
slowly improved the studies on human metabolism3.
At the dawn of metabolism studies, the work of Alexander Ure (1810 - 1866) laid the foundation
for researchers such as physician Otto Schultzen (1837 - 1875) and pathologist Bernhard Naunyn
(1839 - 1925) who discovered oxidation4. In their studies on stomach fermentation, the researchers
found benzene to be oxidized to phenol after administering the substance to patients5. Working
in the same clinical laboratories in Berlin, Wilhelm Marceli Nencki (1847 – 1901) following the
work of O. Schultzen and B. Naunyn wrote his dissertation on oxidation reactions in animals and
laid the basis for metabolism research, stating “By studying the metabolic fate of chemical substances,
one will on the one hand be able to establish laws allowing predictions on the fate of new compounds, and
on the other hand gain increasing insight into the organism as a “chemical agent.”5. Quickly after the
discovery of oxidation, the metabolic reaction of sulfate conjugation was discovered by Eugen
Baumann (1846 – 1896) who was able to show that many administered substances, such as phenol,
aniline or indole, are transformed into sulfated metabolites, which can be detected in the urine6.
The period of 1840 to 1900 brought forth a great number of individual studies on metabolic
reactions occurring in humans and animals7, leading to the discovery of glucuronidation,
methylation, acetylation, and reduction of endo- or exogenous compounds by European
scientists. Advancements in organic syntheses and research on chemical substances, specifically
drugs, and their physiological interactions with the human body further stimulated research on
INTRODUCTION
2
drug metabolism. A famous example for early discoveries in drug metabolism is the story of
Prontosil – a drug for treatment of bacterial infections – which was discovered by researchers
from Bayer Laboratories of IG Farben in Germany in 1932. Three years later, scientists at the
Pasteur Institute in France showed that Prontosil itself was inactive, but identified
sulphanilamide to be the active metabolite of Prontosil (through azo reduction by bacterial
enzymes in intestines)8. German scientist Gerhard Domagk (1895 - 1964), who was among these
researchers, was awarded the Nobel Prize in Medicine in 1939 for “the discovery of the antibacterial
effects of prontosil”9. This new awareness of the importance of metabolic reactions for substances
such as drugs inspired researchers to further investigate metabolic reactions. During the late
1930s, Welsh biochemist Richard T. Williams (1909 - 1979) wrote a book on the “detoxication” of
foreign substances (published in 1947 due to the occurrence of World War II), which laid the basis
for his major publication in 1959 titled “Detoxication Mechanisms”10. In this work, Williams
proposed the idea of dividing metabolism into two distinct phases, phase I, including oxidations,
reductions, and hydrolyses, and phase II, including subsequent conjugation reactions.
Originating from this work, the denotations of phase I and phase II metabolism found their way
into our current terminology.
Although many metabolic reactions were already identified during the 19th century, the origin of
these metabolic reactions was still unclear. While during that time, blood was considered the
main place of metabolism, new techniques for tissue preparation developed in the early 20th
century suggested the liver as a key player in metabolism. It was not until French chemist Louis
Pasteur (1822 - 1895) discovered the process of fermentation being caused by the action of living
organisms, that German physiologist Wilhelm F. Kühne (1837 – 1900) (also known for the
discovery of the protein trypsin) used the term „enzyme“ to describe the process of fermentation
in 187711. In 1897, German chemist Eduard Buechner (1860 - 1917) identified the enzyme
“zymase” extracted from yeast solutions as initiator of metabolic reactions12. Nowadays, many
enzymes are named following his example of using the suffix “-ase”. The discovery that purified
proteins can be enzymes themselves (in contrast to the at the time existing hypothesis of proteins
being carriers of enzymes) was later awarded with the Novel Prize in Chemistry in 194613,14. Due
to World Wars I and II, the centre of metabolism research spread out throughout Europe and
North America7. A great overview on the history of drug metabolism research in the US is given
in by Patrick J. Murphy in his centennial trilogy covering the range of 1909 to 200815-17, while a
general, comprehensive history of drug metabolism for the 19th and the first half of the 20th
century is reviewed by Marcel H. Bickel5,18. Since the 1950s, novel bioanalytical and chemical
methods, such as chromatography, isotope-tracer methods or spectrophotometry allowed
INTRODUCTION
3
metabolite detection and fuelled enzymatic studies. In the late 1950s, the cytochrome P450 (CYP)
enzyme family was characterized as a major player in phase I metabolism7,19. From the 1980s on,
new techniques allowed enzyme cloning, purification, and protein crystallisation via x-ray
crystallography, and metabolite detection was further facilitated by mass spectrometry and
nuclear magnetic resonance (NMR) methodologies7. Today, metabolism is studied using modern
biotechnology and advanced analytical instrumentation in high-throughput modes often coupled
with in silico studies that allow guidance of experimentation on multiple levels ranging from
whole organisms, over organs and tissues, down to the enzymatic or even molecular level.
In general, metabolism itself is considered to be part of pharmacokinetics, i.e. the study of time-
dependent changes of drug concentrations in different regions of the body during and after drug
administration, and is a crucial factor during drug development. Pharmacokinetics is commonly
divided into the phases of administration, distribution, metabolism, and excretion (ADME). The
administration (the passage of a drug into the plasma) most commonly takes place orally due to
convenience and (patient) compliance. Orally ingested drugs are taken up through the
gastrointestinal epithelium/mucosa. This uptake depends on drug ionization and lipophilicity
(physicochemical properties), gastrointestinal motility, splanchnic blood flow, as well as particle
size and formulation. The bioavailability of a drug indicates the intact drug fraction of the
administered dosage that reaches the plasma after absorption and local metabolic degradation by
enzymes. Another factor that influences the pharmacokinetics of a drug is its binding to plasma
proteins, such as albumin, which reduces concentrations of free drug. Often, orally absorbed
drugs or other xenobiotics taken up through food or the environment are already extensively
metabolised in the liver and/or gut wall while leaving the amount of drug reaching the systemic
circulation relatively small. This is known as the first-pass effect or pre-systemic metabolism.
Although the liver is the main organ serving biotransformation or detoxification, metabolism also
takes place in other tissues of the human body, though often to a lesser extent. In general,
biotransformation or metabolism of endo- or exogenous molecules is catalysed by metabolic
enzymes and is commonly divided into phase I and phase II metabolism. The former process
involves functionalization reactions of molecules in order to introduce a hydrophilic group, such
as oxidations catalysed by CYPs and other enzyme reactions. Phase II reactions are conjugation
reactions in which functional groups such as sulfates, acetyl, glutathione or glucuronic acid are
transferred to a substrate molecule. These reactions often, but not exclusively, occur after
functionalization reactions during phase I metabolism. Being introduced in 1959 by R.T.
Williams10, the terms “phase I” and “phase II” (implying an ordered mechanism for drug
INTRODUCTION
4
metabolism) are commonly used today, although this strict categorization of metabolism
reactions has its limitations since phase II reactions might also occur without prior
functionalization by phase I-enzymes20. Furthermore, conjugation reactions are often not the end
of a molecule’s fate, but conjugated metabolites are required to be exported from cells (termed
“phase III metabolism”) and could even be subject to further metabolism reactions21. Frederick P.
Guengerich - a pioneer in the field of toxicology and CYP metabolism - and his co-workers
describe the phase I and II classification as “clearly outmoded. Not only is it inaccurate and misleading,
but it is chemically incoherent, grouping mechanistically unrelated reactions together and dividing related
ones, and ignores our understanding of drug metabolizing enzymes.”21. Proposing an alternative
approach to classify biotransformation reactions, F. P. Guengerich suggests the four categories of
oxidations, reductions, conjugations, and nucleophilic trapping processes21.
Historically, CYP-catalysed reactions (phase I) have gained the most attention due to their strong
impact on many drugs (about 80 % of drugs are assumed to be substrates of CYPs22) and their
involvement in drug-drug interactions caused by enzymatic inhibition or induction22. However,
over the last years, the importance of phase II reactions has been stressed. Bernard Testa
(Emeritus Professor of Medicinal Chemistry and Pharmacochemistry in Switzerland) points out
that the relative significance of metabolism pathways should ideally be based on all metabolic
reactions types, since about 75 % of marketed drugs are also substrates of enzymes that are not
part of the CYP enzyme family22. In a meta-analysis, Testa et al. affirm the importance of CYP
reactions in drug metabolism but also annotate that other reactions, such as conjugations,
significantly contribute to drug metabolism23. Another misleading assumption is that conjugation
reactions always serve detoxification by transforming molecules into readily excretable
metabolites. In fact, conjugation reactions have been shown to potentially transform molecules
into chemically reactive metabolites – a process called toxification or bioactivation24,25. In general,
toxic metabolites are reactive intermediates (radicals, electrophiles) which may cause inhibition
of a specific molecular target (enzyme, transporter, etc.), an alkylating attack or oxidative stress24.
Thus, all chemical transformations that occur during metabolism serving detoxification are also
capable of bioactivation and causing the formation of reactive intermediates.
Given the fact that the majority of drugs is metabolised by metabolic enzymes causing reduced
drug efficacy and that these biotransformation reactions can generate toxic metabolites provoking
adverse events, metabolism prediction has gained increasing importance in the process of drug
development.
INTRODUCTION
5
1.2. Metabolism prediction in drug discovery
The human body is permanently exposed to a myriad of exogenous compounds through
pharmaceutical, nutritional, or environmental sources. Once taken up, metabolism reactions are
catalysed by specific enzymes, which transform these molecules into metabolites with altered
physicochemical properties. This transformation can result in molecule activation, inactivation,
toxification, or detoxification. The subsequent biological effects range from loss or reduction in
drug efficacy (failure of therapy), to the occurrence of drug-drug interactions via enzyme
inhibition or induction, to toxicity and adverse drug reactions caused by reactive metabolites.
Due to this broad spectrum of physiological effects, metabolism is an important aspect and
should be considered during drug development to warrant appropriate pharmacokinetic profiles
and drug safety.
Although a multitude of different experimental assays has been developed until now, in silico
models that allow metabolism prediction gained increasing popularity over the last decades.
Computer-based models bear the advantage of being high-throughput processes at low costs and
minimum time expenditure. In silico models can be useful at the early stage of drug development
programs to retrieve, assess, and prioritize screening hits and guide lead optimization based on
predicted structural alerts26. Further, the early indication of inappropriate metabolic profiles of
drug candidates might generate a reduced need for in vivo (or animal) testing. Bearing the
potential to reduce unnecessary animal testing by reducing the number of compounds that would
fail in later stages of drug discovery campaigns, the development and application of computer-
based models is in accordance with the guiding principles of the Three Rs (3Rs) to replace, reduce,
and refine animal testing aiming at a more ethical compound testing as proposed by Russell and
Birch (1959)27. In 2007, the EU introduced a regulation (Registration, Evaluation, Authorisation
and Restriction of Chemicals (REACH)), which manages production, use, and safety of chemicals
and which explicitly encourages industry to apply in silico methods for toxicity or safety
prediction of chemicals28. To achieve validation of a computer-based tool and approval by
regulatory agencies, the Organisation for Economic Cooperation and Development (OECD) set
up principles that should be followed. The general principles are “(i) the existence of a defined
endpoint, (ii) an unambiguous algorithm, (iii) a defined domain of applicability, (iv) appropriate measures
of goodness-of-fit, robustness and predictivity, and (v), if possible, a mechanistic interpretation”29.
Historically, the first computational approaches of ADME prediction were reported in the 1960s
to 1970s, starting with the work of Prof. Hansch who investigated the quantitative relationship
between biological activity and physicochemical properties of molecules, thus laying the ground
INTRODUCTION
6
for the concept of quantitative structure-activity relationship (QSAR) models30. In the 1980s and
1990s, the parallel advancements in computational sciences and biotechnology led to an increase
in experimental data and consequently, more sophisticated and interpretable in silico models
were developed for ADME prediction31. The improvements in computational hard- and software
allowing faster computation and the progress in enzyme crystallisation which supported
structure-based molecular modelling collectively lead to increased general acceptance of
computer-based ADME models32. During that time, Christopher A. Lipinski and co-workers
observed a correlation between certain molecular properties and the pharmacokinetic profiles of
chemical compounds. In 1997, they introduced Lipinski’s rule of five33, which later was
commonly used as a guideline for estimating oral bioavailability of a chemical compound.
According to these rules, an orally active molecule should meet the following criteria: Hydrogen
bond donors (HBD) ≤ 5, hydrogen bond acceptors (HBA) ≤ 10, molecular weight (MW) < 500 Da,
and an octanol-water partition coefficient (LogP) ≤ 5. Although being a rather simplistic rule,
Lipinski’s rule of five triggered interest in fast filters for the evaluation of ADME profiles of drug
candidates. During that period, combined efforts from high-throughput screenings,
combinatorial chemistry, and in silico approaches accelerated the development in ADME
prediction and stimulated interest in efficient computational models.
Among all ADME parameters, metabolism has gained much attention during the 1990s when
many drug candidates failed due to poor pharmacokinetic profiles, which was associated with
CYP interaction/activity34. To date, numerous drugs have been withdrawn from the market due
to CYP-related drug-drug interactions and metabolism-dependent formation of reactive
metabolites34,35. Aiming at reducing the drop-out rate of drug candidates in the late stages of drug
development, the pharmaceutical industry largely invested in ADME prediction and drug safety
during the late 1990s. These endeavours payed off: while in 1991 about 40 % of clinical failures
were associated with inappropriate pharmacokinetics and toxicity, ten years later, this percentage
dropped to about 11 %36. It should be noted that toxicology, which can also be caused by
metabolic reactions37, increased from 11 % in 1991 to about 22 % in 2000 as reason for clinical drug
failure36.
Up to now, numerous approaches on in silico metabolism prediction have been reported of which
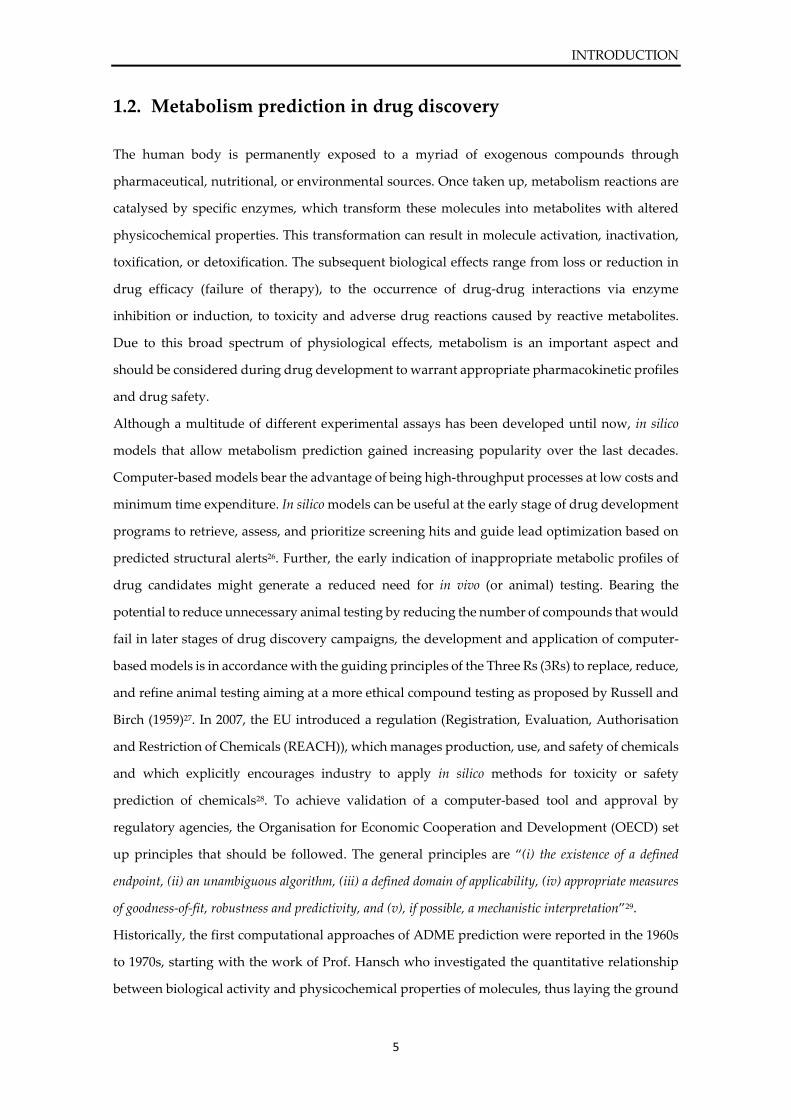
some are provided as online platforms or (free or commercial) software38,39. These tools focus on
one or more specific prediction endpoints such as the determination of metabolic stability, the
identification of (reactive/toxic) metabolites, sites of metabolism (SOM), regioselectivity, target
(e.g. enzyme) interaction, and type of target interaction (inhibition, induction, antagonism)
(Figure 1).
INTRODUCTION
7
Figure 1. Overview on different prediction endpoints and the three pillars of science supporting metabolism
studies. Abbreviations: LC-MS = liquid chromatography-mass spectrometry, MD = molecular dynamics, MIFs =
molecular interaction fields, NMR = nuclear magnetic resonance, QM/MM = quantum mechanics/ molecular
mechanics, QSAR = quantitative structure-activity relationship, SOM = site of metabolism.
Although metabolism is often investigated separately either from the experimental or the
computational stand-point, combining these efforts may be beneficial to gain comprehensive
understanding of metabolism38. Ideally, the development of a prediction model is a combined
approach of theory (information from literature or curated databases), experimental data, and
computation (Figure 1). Apart from being cost-effective, high-throughput tools that can be
applied early in the process of drug development, computational studies bear the advantage of
providing mechanistic understanding of ligand-target interactions and might deliver
explanations for compound activity or inactivity. In silico investigations can also support drug
design by pointing out structural alerts (e.g. functional groups that are associated with toxicity)
and guide chemical synthesis.
Computational approaches heavily rely on experimental data as a basis for investigation. Data
are derived from in vitro assays (e.g. mutation assays, cell or microsomal assays, recombinant
enzyme assays) or from in vivo studies that provide data on carcinogenicity, metabolism, or
toxicity. It is important to note that the quality of a computational model highly depends on the
quality of the experimental data it was built on. Thus, careful assessment of information sources
and evaluation of experimental data (e.g. assay conditions and experimental setup) is pivotal to
enable reliable in silico modelling. Efforts have been undertaken to collect and combine
experimental data on metabolites and a number of publicly available databases have been
released, such as the DrugBank40 or the Human Metabolome Database (HMDB)41.
INTRODUCTION
8
In general, computational approaches to investigate and predict metabolism can be divided into
ligand- and structure-based models, although combining different computational methods can
be beneficial for the development of prediction models. Ligand-based approaches use active and
inactive molecules and associated biological activities to derive structure-activity relationships
for prediction. These models rely on the presumption that chemical structures and their
properties correlate with metabolic activity of a molecule. Computational methods allowing
ligand-based modelling include quantum-mechanical (QM) methods, descriptor-based methods
such as QSAR or machine learning techniques, and ligand-based 3D pharmacophores. Structure-
based approaches focus on the drug target and the reaction mechanism itself in order to derive
essential information that is subsequently abstracted into a predictive model. Information on the
target is usually derived from experimental data (x-ray crystallography, NMR) or homology
models of a protein. Methods that enable structure-based modelling include molecular docking
simulations, molecular dynamics (MD) simulations, quantum mechanics/ molecular mechanics
(QM/MM) methods, and structure-based 3D pharmacophores. Sophisticated prediction tools
often use a combination of computational methods in order to comprehensively describe the
metabolic reaction that is under investigation.
In the following, individual or combined computational approaches for metabolism prediction
will be shortly discussed to provide a quick overview on the current state of research in the field
of computer-based metabolism prediction. For the prediction of metabolites, SOMs,
regioselectivity, or enzyme interactions, numerous desktop or web-based applications have been
published using reactivity- or rule-based approaches, fingerprint-based data mining approaches,
shape-focused approaches, molecular interaction fields (MIFs), docking, or combined
methods38,39. Two excellent, comprehensive reviews on computational approaches towards
metabolism prediction were published by Kirchmair et al. in 2012 and 201538,39.
Data mining approaches based on molecular fingerprints can be used to identify SOMs and
software has been developed, such as Metaprint2D42,43, which searches for fingerprint features in
a given dataset of molecules that are related to metabolic reactions.
Shape-focused methods rely on the assumption that compounds that share a similar shape might
trigger the same biological response. These methods calculate the probability of metabolism by
comparing a given molecule to an active ligand (e.g. inhibitor) while taking into consideration
their molecular properties38. This approach has been successfully used to predict the SOM of CYP
ligands by utilizing the Rapid Overlay of Chemical Structures (ROCS)44-46.
Molecular interaction fields (MIFs)47 are three-dimensional representations of electrostatic fields
on the surface of a target structure that describe variations in interaction energies between the
INTRODUCTION
9
target and a chemical probe48 and can be derived by programs such as GRIN/GRID47 or CoMFA49.
MIFs can be applied in ligand- and structure-based approaches to identify ligands that are similar
to the template molecule or to predict ligand-target interactions. The software MetaSite50
originated from advanced MIF-based algorithms and evolved into a program utilizing MIFs,
quantum-chemical and expert (knowledge-based) modules. It allows prediction of SOMs in
regard to CYP metabolism, guides rational drug design by indicating critical structural regions,
gives warnings on CYP inhibition, and provides phase I and II metabolite structures.
Molecular docking approaches in which generated ligand conformations are placed into the
active site of a target (docking) and results subsequently ranked based on binding affinities
(scoring) allow prediction of SOMs based on ligand conformations and distances to the catalytic
centre51,52. Molecular docking is considered fast and efficient, but is relying on many
approximations concerning solvation effects and entropy.
3D pharmacophores which are abstractions of molecular interaction patterns between a molecule
and its target (e.g. protein) can be used as efficient virtual screening tools for metabolism
prediction53,54 to identify molecules that match the three-dimensional interaction pattern and
conform spatial configuration towards the target55. 3D pharmacophores have been developed to
predict CYP substrates56 or inhibitors of CYPs57.
Metabolic enzymes such as CYPs are highly flexible and modulation of the active site might
influence substrate selectivity. A method to explore conformational flexibility is molecular
dynamics (MD) simulation in which molecular movement of the target structure is simulated
under a given molecular force field. MD simulations can be used to generate conformations for
subsequent modelling studies (e.g. docking into conformations derived from MD simulations58)
or can be utilized to refine docking conformations59. Furthermore, MD simulations were
performed to calculate binding affinities of ligands (binding free energy ΔG) which allows
assessment of substrate or inhibitor binding38.
Although MD simulations and flexible docking take into account the flexibility of the protein,
these methods are insufficient for assessing formation or breaking of chemical bonds. QM/MM
approaches are computationally more demanding although allowing more accurate calculations
of electronic effects in molecular systems. For the prediction of SOMs, reactivity-based methods
utilize quantum chemical methods to derive parameters from the electronic structure of a given
molecule that allow estimation of metabolic reactivity60. On various levels of theory, QM methods
can be used to calculate descriptors based on the electronic structure of ligands to assess their
metabolic susceptibility38. Software approaches consider for example hydrogen abstraction
energies or calculations of spin densities on all hydrogen atoms of a molecule60. Structure-based
INTRODUCTION
10
QM/MM studies were reported aiming at investigating the reaction mechanism and dynamics of
CYPs55. In these approaches, the active site of CYPs where the reaction occurs is characterized
quantum mechanically to ensure high accuracy while treating the molecular environment under
molecular mechanic principles61.
Although manifold computational methods exist, the prediction of metabolites is an application
that is mainly represented by knowledge-based (or expert) systems and only few alternative
approaches have been published (e.g. fingerprint-based data mining)38. Expert systems are based
on the input of knowledge by human experts. This formalized knowledge provides guidance in
regard to metabolite prediction by examining a query structure for fragments that are associated
with metabolic liability and calculating the associated metabolite structure. Numerous software
applications for metabolite prediction based on expert systems have been released38,39.
The scope of identifying enzyme interaction, e.g. CYP inhibition or induction which is related to
drug-drug interactions, has been commonly approached via QSAR or machine learning
methods62. In QSAR, a relationship between molecular descriptors of a given set of active ligands
and their biological activity is derived and its function can be used for prediction. As mentioned
before, the OECD has recognized these in silico approaches and has published a guide for QSAR
model validation which cover the definition of an end point, an algorithm, the applicability
domain, the calculation of certain statistics, and (if possible) an interpretation of the model29,63.
Due to its long history and successful application, a multitude of studies has been published, and
QSAR and machine learning models for metabolism prediction have been derived that are based
on classification, quantification, or regression38. An overview on QSAR and learning algorithms
that can be used for activity prediction is also given by Nantasenamat et al.64.
In 2015, Kirchmair et al. presented a collection of seven “components” that are essential for the
successful development of an in silico prediction model39. The first component is the quantity and
quality of experimental data on which the computational model relies. It was stated that – even
though experimental investments in metabolism screenings have increased over the last decades
– publicly available data on metabolic endpoints are still insufficient39. Furthermore, different
assay protocols and experimental setups often hamper the creation of a coherent data set that
allows creation of a valid in silico model. The second component is expert knowledge which
implies the virtual storage of sets of rules for metabolic endpoints (e.g. metabolite prediction) that
were formalized and supplied by human experts. Rule-based approaches that allow toxicity
prediction have even been recognised by regulatory agencies, such as the United States Food and
Drug Administration (FDA)65. The third component comprises physicochemical descriptors of
molecules which can be used to screen and rank molecules in regard to metabolism. The fourth
INTRODUCTION
11
and fifth components consider structural information on the metabolic proteins and their
structural flexibility, which provide details on protein-ligand interactions, substrate specificities,
and protein function. The sixth component deals with the reactivity of a small-molecule ligand
which ultimately determines metabolism reactions. Although being computationally expensive,
investigations on protein flexibility and molecular reactivity using QM or QM/MM methods can
be beneficial for drug design. They provide information on the electronic nature of the structural
environment during ligand binding and also enable determination of reaction intermediates
which provides a rationale for drug design. The seventh and last component is the idea of
metabolic systems or networks which implies that metabolism is a highly complex network of
physiological conditions, fluctuations in molecular concentrations of cellular components, the
existence of enzymatic cascades, molecular interactions, and signalling dependencies. These
highly-interdependent factors influence metabolic reactions and rates, and are still challenging to
combine into a comprehensive virtual model39.
Over the last years, numerous in silico prediction tools have been developed focusing on CYPs
(phase I metabolism) due to their impact on drug metabolism and association with drug-drug
interactions in vivo. However, enzyme families of phase II metabolism such as sulfotransferases
(SULTs) also play an important role in drug inactivation and the transformation of xenobiotics
into chemically reactive metabolites22,66.
1.3. Sulfotransferases
1.3.1. Sulfotransferase enzyme family
Sulfotransferases (EC 2.8.2., SULT) are among the most prominent enzyme families of phase II
metabolism67 and are classified into soluble enzymes located in the cytosol and membrane-
associated enzymes at the Golgi apparatus. The latter group of enzymes transforms
macromolecules such as carbohydrates, lipids, proteins, and peptides and regulates their
physiological function, while the soluble SULTs sulfonate small molecules such as drugs,
steroids, bile acids, and neurotransmitters. Since the reformation of the nomenclature system for
SULT in 200468, the members of the cytosolic SULT superfamily are classified into families,
indicated by Arabic numerals (e.g. SULT1, SULT2), and subfamilies, indicated by alphabetical
characters (e.g. SULT1E, SULT2A). Members of one family or subfamily share 45 % or 60 %
sequence identity, respectively. Isoforms are indicated by an Arabic numerical after the
alphabetical character (e.g. SULT1E1, SULT2A1). The SULT1 and SULT2 families are comprised
of 4 and 2 subfamilies with multiple isoforms, respectively. Although SULT4A1 has been found
INTRODUCTION
12
in the human brain and SULT6B1 was found in the testis of primates, no activity has been
detected for any of these enzymes and thus, the majority of studies to date focuses on SULT1
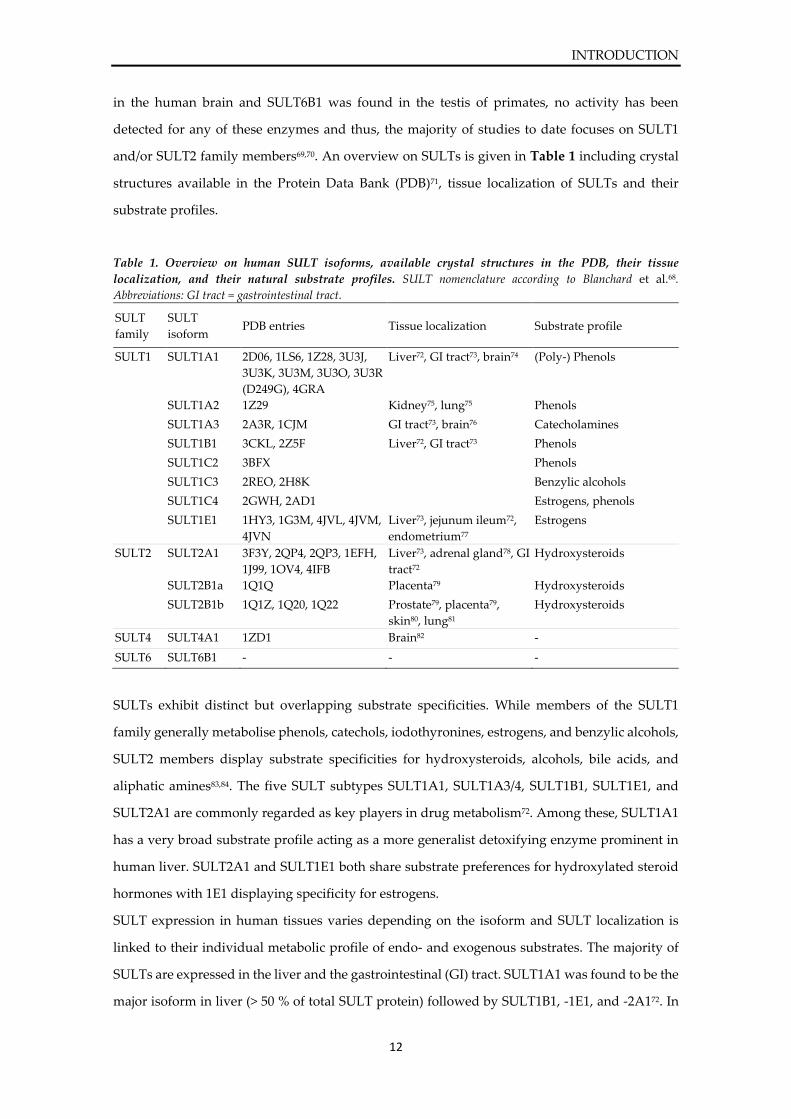
and/or SULT2 family members69,70. An overview on SULTs is given in Table 1 including crystal
structures available in the Protein Data Bank (PDB)71, tissue localization of SULTs and their
substrate profiles.
Table 1. Overview on human SULT isoforms, available crystal structures in the PDB, their tissue
localization, and their natural substrate profiles. SULT nomenclature according to Blanchard et al.68.
Abbreviations: GI tract = gastrointestinal tract.
SULT
family
SULT
isoform PDB entries Tissue localization Substrate profile
SULT1 SULT1A1 2D06, 1LS6, 1Z28, 3U3J,
3U3K, 3U3M, 3U3O, 3U3R
(D249G), 4GRA
Liver72, GI tract73, brain74 (Poly-) Phenols
SULT1A2 1Z29 Kidney75, lung75 Phenols
SULT1A3 2A3R, 1CJM GI tract73, brain76 Catecholamines
SULT1B1 3CKL, 2Z5F Liver72, GI tract73 Phenols
SULT1C2 3BFX Phenols
SULT1C3 2REO, 2H8K Benzylic alcohols
SULT1C4 2GWH, 2AD1 Estrogens, phenols
SULT1E1 1HY3, 1G3M, 4JVL, 4JVM,
4JVN
Liver73, jejunum ileum72,
endometrium77
Estrogens
SULT2 SULT2A1 3F3Y, 2QP4, 2QP3, 1EFH,
1J99, 1OV4, 4IFB
Liver73, adrenal gland78, GI
tract72
Hydroxysteroids
SULT2B1a 1Q1Q Placenta79 Hydroxysteroids
SULT2B1b 1Q1Z, 1Q20, 1Q22 Prostate79, placenta79,
skin80, lung81
Hydroxysteroids
SULT4 SULT4A1 1ZD1 Brain82 -
SULT6 SULT6B1 - - -
SULTs exhibit distinct but overlapping substrate specificities. While members of the SULT1
family generally metabolise phenols, catechols, iodothyronines, estrogens, and benzylic alcohols,
SULT2 members display substrate specificities for hydroxysteroids, alcohols, bile acids, and
aliphatic amines83,84. The five SULT subtypes SULT1A1, SULT1A3/4, SULT1B1, SULT1E1, and
SULT2A1 are commonly regarded as key players in drug metabolism72. Among these, SULT1A1
has a very broad substrate profile acting as a more generalist detoxifying enzyme prominent in
human liver. SULT2A1 and SULT1E1 both share substrate preferences for hydroxylated steroid
hormones with 1E1 displaying specificity for estrogens.
SULT expression in human tissues varies depending on the isoform and SULT localization is
linked to their individual metabolic profile of endo- and exogenous substrates. The majority of
SULTs are expressed in the liver and the gastrointestinal (GI) tract. SULT1A1 was found to be the
major isoform in liver (> 50 % of total SULT protein) followed by SULT1B1, -1E1, and -2A172. In
INTRODUCTION
13
the GI tract, SULT1B1 was the predominant subfamily (> 36 %), followed by SULT1A3, SULT1A1,
SULT1E1, and SULT2A172. Although highest SULT concentrations have been found in liver and
GI tract72, SULT isoforms are also present in other tissues, such as lung, brain, kidney, and skin,
and their individual localization pattern is correlated with their specific metabolic role74,75,80.
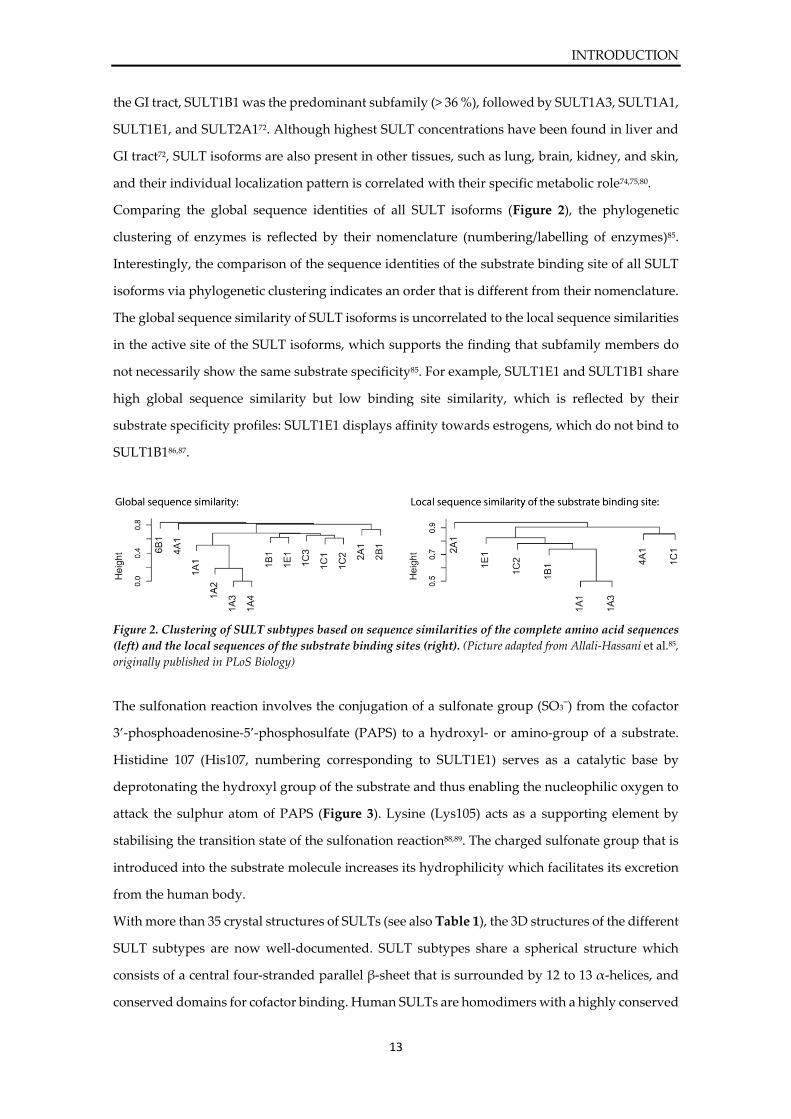
Comparing the global sequence identities of all SULT isoforms (Figure 2), the phylogenetic
clustering of enzymes is reflected by their nomenclature (numbering/labelling of enzymes)85.
Interestingly, the comparison of the sequence identities of the substrate binding site of all SULT
isoforms via phylogenetic clustering indicates an order that is different from their nomenclature.
The global sequence similarity of SULT isoforms is uncorrelated to the local sequence similarities
in the active site of the SULT isoforms, which supports the finding that subfamily members do
not necessarily show the same substrate specificity85. For example, SULT1E1 and SULT1B1 share
high global sequence similarity but low binding site similarity, which is reflected by their
substrate specificity profiles: SULT1E1 displays affinity towards estrogens, which do not bind to
SULT1B186,87.
Figure 2. Clustering of SULT subtypes based on sequence similarities of the complete amino acid sequences
(left) and the local sequences of the substrate binding sites (right). (Picture adapted from Allali-Hassani et al.85,
originally published in PLoS Biology)
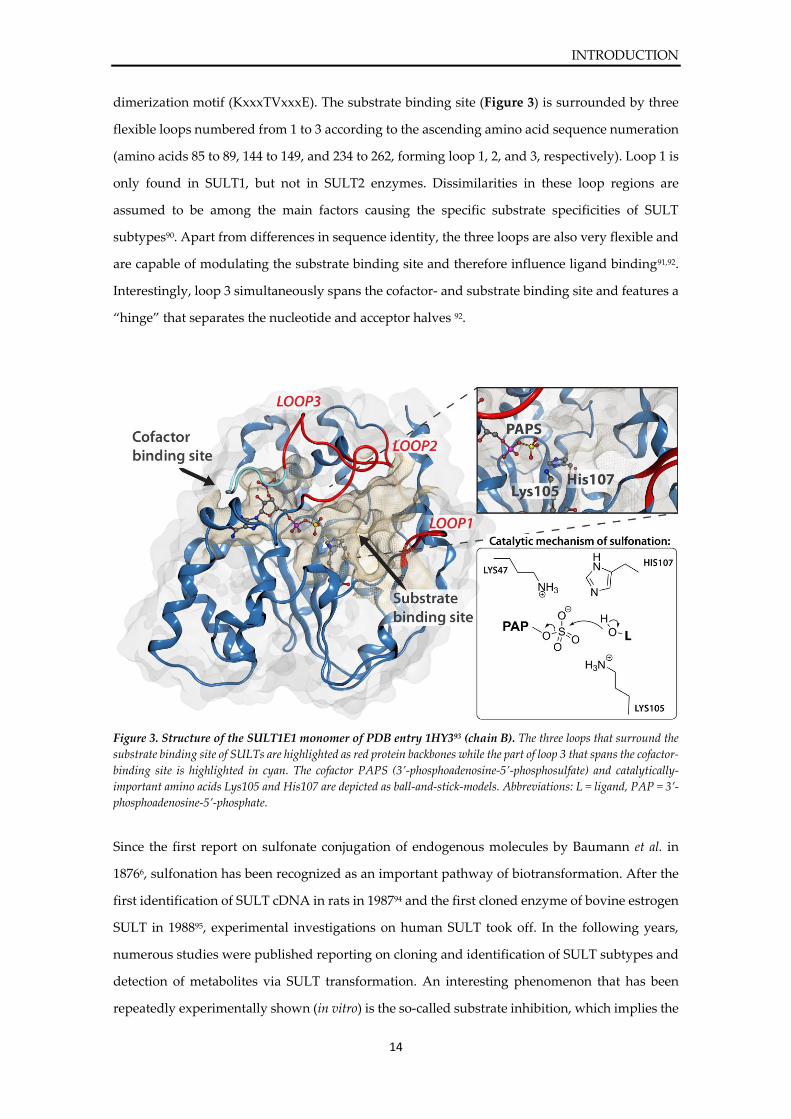
The sulfonation reaction involves the conjugation of a sulfonate group (SO3¯) from the cofactor
3’-phosphoadenosine-5’-phosphosulfate (PAPS) to a hydroxyl- or amino-group of a substrate.
Histidine 107 (His107, numbering corresponding to SULT1E1) serves as a catalytic base by
deprotonating the hydroxyl group of the substrate and thus enabling the nucleophilic oxygen to
attack the sulphur atom of PAPS (Figure 3). Lysine (Lys105) acts as a supporting element by
stabilising the transition state of the sulfonation reaction88,89. The charged sulfonate group that is
introduced into the substrate molecule increases its hydrophilicity which facilitates its excretion
from the human body.
With more than 35 crystal structures of SULTs (see also Table 1), the 3D structures of the different
SULT subtypes are now well-documented. SULT subtypes share a spherical structure which
consists of a central four-stranded parallel β-sheet that is surrounded by 12 to 13 α-helices, and
conserved domains for cofactor binding. Human SULTs are homodimers with a highly conserved
INTRODUCTION
14
dimerization motif (KxxxTVxxxE). The substrate binding site (Figure 3) is surrounded by three
flexible loops numbered from 1 to 3 according to the ascending amino acid sequence numeration
(amino acids 85 to 89, 144 to 149, and 234 to 262, forming loop 1, 2, and 3, respectively). Loop 1 is
only found in SULT1, but not in SULT2 enzymes. Dissimilarities in these loop regions are
assumed to be among the main factors causing the specific substrate specificities of SULT
subtypes90. Apart from differences in sequence identity, the three loops are also very flexible and
are capable of modulating the substrate binding site and therefore influence ligand binding91,92.
Interestingly, loop 3 simultaneously spans the cofactor- and substrate binding site and features a
“hinge” that separates the nucleotide and acceptor halves 92.
Figure 3. Structure of the SULT1E1 monomer of PDB entry 1HY393 (chain B). The three loops that surround the
substrate binding site of SULTs are highlighted as red protein backbones while the part of loop 3 that spans the cofactor-
binding site is highlighted in cyan. The cofactor PAPS (3’-phosphoadenosine-5’-phosphosulfate) and catalytically-
important amino acids Lys105 and His107 are depicted as ball-and-stick-models. Abbreviations: L = ligand, PAP = 3’-
phosphoadenosine-5’-phosphate.
Since the first report on sulfonate conjugation of endogenous molecules by Baumann et al. in
18766, sulfonation has been recognized as an important pathway of biotransformation. After the
first identification of SULT cDNA in rats in 198794 and the first cloned enzyme of bovine estrogen
SULT in 198895, experimental investigations on human SULT took off. In the following years,
numerous studies were published reporting on cloning and identification of SULT subtypes and
detection of metabolites via SULT transformation. An interesting phenomenon that has been
repeatedly experimentally shown (in vitro) is the so-called substrate inhibition, which implies the
INTRODUCTION
15
ability of a substrate molecule to inhibit the enzyme at different molecule concentrations. Many
metabolic enzymes, such as SULTs, have been reported to be subject to this phenomenon96,97. To
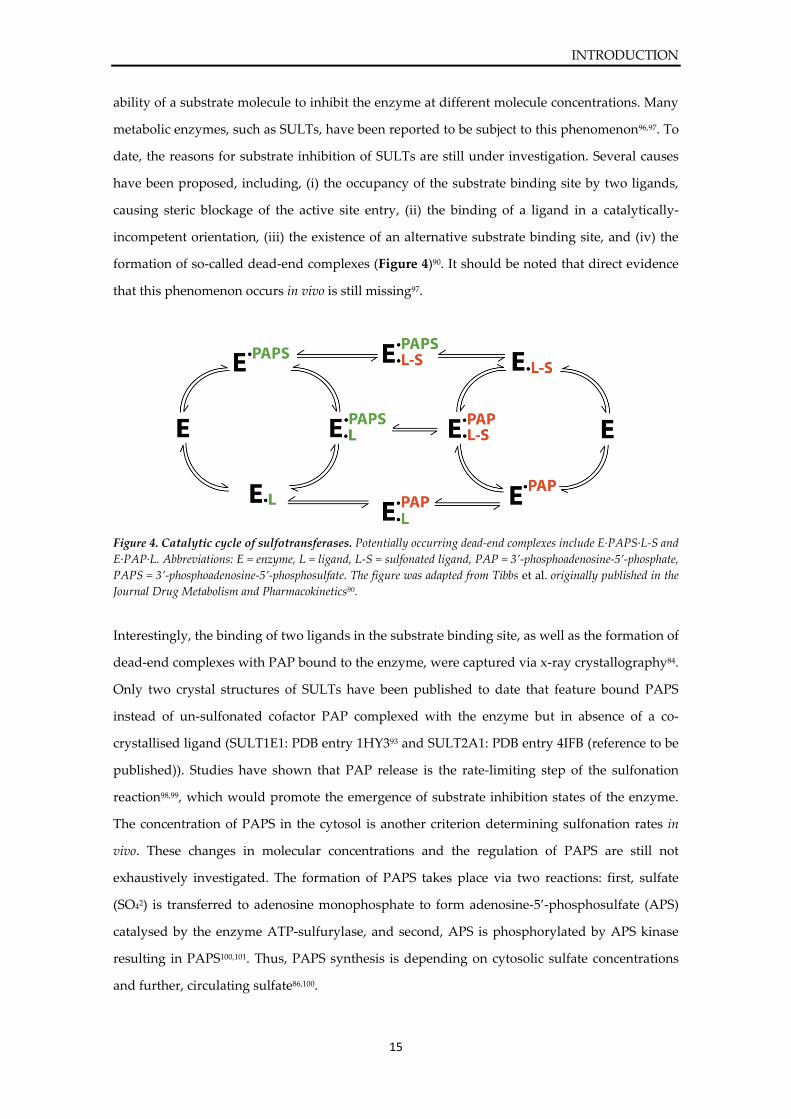
date, the reasons for substrate inhibition of SULTs are still under investigation. Several causes
have been proposed, including, (i) the occupancy of the substrate binding site by two ligands,
causing steric blockage of the active site entry, (ii) the binding of a ligand in a catalytically-
incompetent orientation, (iii) the existence of an alternative substrate binding site, and (iv) the
formation of so-called dead-end complexes (Figure 4)90. It should be noted that direct evidence
that this phenomenon occurs in vivo is still missing97.
Figure 4. Catalytic cycle of sulfotransferases. Potentially occurring dead-end complexes include E·PAPS·L-S and
E·PAP·L. Abbreviations: E = enzyme, L = ligand, L-S = sulfonated ligand, PAP = 3’-phosphoadenosine-5’-phosphate,
PAPS = 3’-phosphoadenosine-5’-phosphosulfate. The figure was adapted from Tibbs et al. originally published in the
Journal Drug Metabolism and Pharmacokinetics90.
Interestingly, the binding of two ligands in the substrate binding site, as well as the formation of
dead-end complexes with PAP bound to the enzyme, were captured via x-ray crystallography84.
Only two crystal structures of SULTs have been published to date that feature bound PAPS
instead of un-sulfonated cofactor PAP complexed with the enzyme but in absence of a co-
crystallised ligand (SULT1E1: PDB entry 1HY393 and SULT2A1: PDB entry 4IFB (reference to be
published)). Studies have shown that PAP release is the rate-limiting step of the sulfonation
reaction98,99, which would promote the emergence of substrate inhibition states of the enzyme.
The concentration of PAPS in the cytosol is another criterion determining sulfonation rates in
vivo. These changes in molecular concentrations and the regulation of PAPS are still not
exhaustively investigated. The formation of PAPS takes place via two reactions: first, sulfate
(SO42) is transferred to adenosine monophosphate to form adenosine-5’-phosphosulfate (APS)
catalysed by the enzyme ATP-sulfurylase, and second, APS is phosphorylated by APS kinase
resulting in PAPS100,101. Thus, PAPS synthesis is depending on cytosolic sulfate concentrations
and further, circulating sulfate86,100.
INTRODUCTION
16
In general, sulfonation serves detoxification by increasing the hydrophilicity of a substrate
molecule which in turn is more easily excreted. Sulfonated metabolites of various exogenous
sources have been reported102, such as feruloylquinic acids from coffee103, ethanol104, plant
constituents105-112, food additives113, and drugs such as opioids114, antibiotics115,116, anaesthetics117,
and others118,119. In the case of Minoxidil, a (pro-) drug for the treatment of androgenic alopecia,
sulfonation transforms the drug into its physiologically active form120. Nevertheless, sulfonation
of drugs has also been shown to lead to the formation of toxic or mutagenic metabolites25,121-123,
which has been repeatedly shown for various xenobiotic and natural compounds25,66,124-129.
Binding of a molecule to the active site of SULTs usually leads to its sulfonation and subsequent
bioactivation or inactivation. On the other hand, molecules that are capable of binding the
enzyme potentially inhibit SULTs and decrease their activity, which in turn suppresses
metabolism. The inhibition of SULTs has been extensively studied along with investigations on
sulfonation reactions. Numerous reports have been published reporting on SULT inhibition by
drugs130-136, dietary components133,137-144, such as herbal extracts145, red wine146, and green tea147, or
other exogenous sources148-150. Among the compound classes that have received the most
attention are endocrine disrupting chemicals (EDCs) as they have been shown to act as high-
potential inhibitors of SULTs151,152. Molecules with endocrine disrupting effects can be industrial
chemicals, pesticides, phthalates, metals, or phytoestrogens, and exposure to environmental
EDCs is considered as risk factor for oncogenesis153. EDCs act through mimicking or inhibiting
natural hormones, and/or deregulation of hormones or hormone receptors25. This class of
molecules has been shown to strongly inhibit SULTs148,151,152,154,155 and is on the other hand also
bioactivated by SULT activity causing the formation of potentially toxic metabolites25.
Among the different SULT subtypes, SULT1E1 shows selectivity for estrogens and estrogen-
related compounds. As a consequence, it is involved in the regulation of physiological estrogen
levels and its inactivity has been associated in the progression of hormone-dependent cancer156.
Furthermore, SULT1E1 has been shown to be strongly inhibited by environmentally-omnipresent
EDCs and to be involved in the formation of chemically reactive metabolites causing adverse
events25,151,152. For these reasons, the here presented study focuses on SULT1E1 which will be
further discussed in the next chapter.
1.3.2. Sulfotransferase subtype 1E1
Among different SULT isoforms, SULT1E1 shows high affinity towards estrogens and plays a
crucial role in regulating estrogenic hormone levels in humans. It is not only involved in the
regulation of endogenous estrogens, but also in mediating the inactivation of exogenous
INTRODUCTION
17
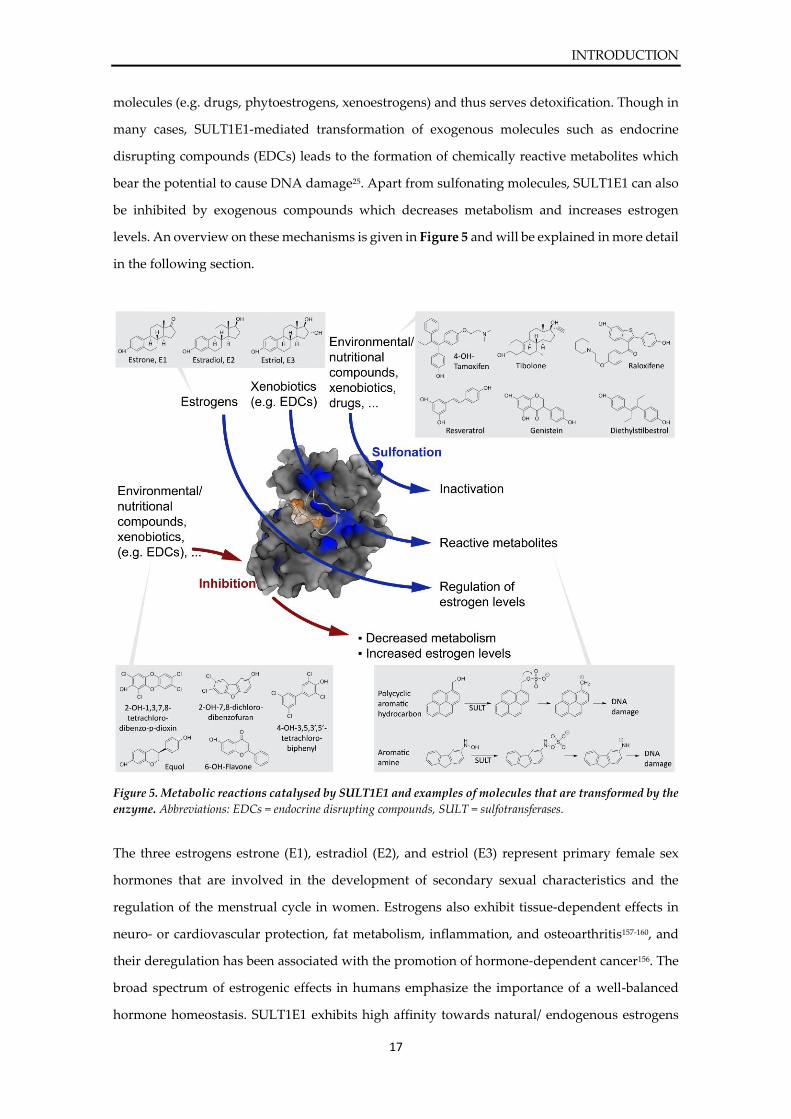
molecules (e.g. drugs, phytoestrogens, xenoestrogens) and thus serves detoxification. Though in
many cases, SULT1E1-mediated transformation of exogenous molecules such as endocrine
disrupting compounds (EDCs) leads to the formation of chemically reactive metabolites which
bear the potential to cause DNA damage25. Apart from sulfonating molecules, SULT1E1 can also
be inhibited by exogenous compounds which decreases metabolism and increases estrogen
levels. An overview on these mechanisms is given in Figure 5 and will be explained in more detail
in the following section.
Figure 5. Metabolic reactions catalysed by SULT1E1 and examples of molecules that are transformed by the
enzyme. Abbreviations: EDCs = endocrine disrupting compounds, SULT = sulfotransferases.
The three estrogens estrone (E1), estradiol (E2), and estriol (E3) represent primary female sex
hormones that are involved in the development of secondary sexual characteristics and the
regulation of the menstrual cycle in women. Estrogens also exhibit tissue-dependent effects in
neuro- or cardiovascular protection, fat metabolism, inflammation, and osteoarthritis157-160, and
their deregulation has been associated with the promotion of hormone-dependent cancer156. The
broad spectrum of estrogenic effects in humans emphasize the importance of a well-balanced
hormone homeostasis. SULT1E1 exhibits high affinity towards natural/ endogenous estrogens
INTRODUCTION
18
(Km = 5 nM for its natural substrate E2161). Sulfonation of estrogens via SULT1E1 is an important
regulatory mechanism, since sulfonated estrogens are prevented from exerting their biological
function and can be “stored” as estrogen-sulfates. Estrogen-sulfates show a prolonged half-life
compared to free estrogens and can be reactivated by the enzyme estrogen sulfatase162.
Apart from the naturally occurring, steroidal estrogens E1, E2, and E3, some nonsteroidal
estrogens or environmental estrogens (such as synthetic xeno- or phytoestrogens) also exhibit
estrogenic activity and have been related to SULT1E1 activity143,148. While phytoestrogens are
naturally occurring plant-derived molecules, synthetic xenoestrogens are mostly of industrial
origin and many have become environmental contaminants163. Both types of environmental
estrogens exert estrogenic effects in humans and are able to interfere with the physiological
endocrine system. Another class of molecules with estrogenic activity are the selective estrogen-
receptor modulators, or SERMs, which are drugs that are able to bind to estrogen receptors and
that are often prescribed for treatment of estrogen-related diseases, such as breast cancer,
postmenopausal osteoporosis or ovulatory dysfunction. SERMs exhibit tissue-specific activity
acting as pure or mixed agonists and/or antagonists.
In many cases, members of the above-mentioned estrogenic compound classes (synthetic
xenoestrogens, natural phytoestrogens, and SERMs) are able to bind the enzyme as a result of its
estrogenic substrate preference. As shown in Figure 5, synthetic steroidal drugs (such as
diethylstilbestrol and tibolone), SERMs (e.g. raloxifene, 4-OH-tamoxifen), and phytoestrogens
(e.g. genistein, resveratrol), are readily sulfonated and inactivated by SULT1E1107,164-167.
Primarily, sulfonation serves detoxification as sulfonated molecules are more hydrophilic and
more easily excreted from the human body. Nevertheless, some xenoestrogens and EDCs have
been shown to be bioactivated by SULT1E1, resulting in chemically reactive metabolites126,168. For
certain chemicals, such as polycyclic aromatic hydrocarbons or aromatic amines, the conjugated
sulfonate group is electron-withdrawing and therefore a good leaving group. Cleavage of the
sulfonate group gives rise to chemically reactive electrophiles that are able to cause DNA
damage25. In case the resulting electrophile is resonance-stabilised, the process is even further
facilitated.
Certain phytoestrogens and EDCs have been shown to be good substrates of SULT1E1 but on the
other hand also bear the potential to inhibit the enzyme. Especially the EDCs of poly-halogenated
aromatic hydrocarbons, such as polychlorinated dibenzo-p-dioxins (PCDDs), polychlorinated
dibenzofurans (PCDFs), and polychlorinated biphenyls (PCBs) have been shown to inhibit
SULT1E1 in the low nanomolar concentration range151,152. Inhibition of SULT1E1 not only
decreases human metabolism reactions in general, but also leads to locally increased levels of
INTRODUCTION
19
endogenous estrogens. In hormone-sensitive tissue, such as endometrium and breast, E2 has been
shown to promote cell proliferation and increased E2 levels are linked to increased risk of
endometrial carcinoma169. Studies also show that SULT1E1 expression is decreased in
endometrial carcinoma tissue compared to normal tissue169-172 which might be one of the factors
for elevated E2 concentrations and consequent cancer promotion173. It is assumed that SULT1E1
activity in normal breast cells decreases estrogen levels and therefore contributes to the
prevention of abnormal cell proliferation162. Due to the wide, environmental distribution of EDCs
and their potential to evoke health risks in animals and humans, risk-assessment of compounds
that might have endocrine disrupting effects is an ongoing aim.
In summary, SULT1E1 plays a crucial role in regulating endogenous estrogen levels in humans
and its inhibition might promote cell proliferation due to increased estrogen levels. Synthetic
chemicals and phytoestrogens have been shown to strongly inhibit SULT1E1 and influence
hormone homeostasis. On the other hand, SULT1E1 is able to inactivate drugs such as SERMs
which reduces their efficacy. Furthermore, sulfonation of certain classes of EDCs has been related
to the formation of chemically reactive metabolites that are able to cause DNA damage.
In contrast to the large number of experimental studies on SULTs, computational approaches
have remained scarce174. In the next section, molecular modelling studies on SULTs will be shortly
reviewed.
1.3.3. Molecular modelling studies on sulfotransferases
With the steadily increasing number of experimental data on SULTs and advancements in in silico
drug discovery, reports on computer-based approaches to investigate SULT increased
congruently. In general, molecular modelling studies on SULTs that were reported over the past
decades can be divided into studies exploring structure-activity relationships or prediction of
SULT activity often using ligand-based approaches, and studies investigating structure, function,
and/or substrate specificity of SULTs (structural investigations). These two areas will be
addressed in the following section and references are summarised in Table 2 and Table 3.
Historically, the first QSAR studies on rat and human phenol SULT (reported as liver TS PST
which equals SULT1A168) were reported in 1987175, followed by a study on human SULT1A3 in
1999176 (Table 2). Both studies aimed at identifying structural descriptors correlated with high Km
values and influencing substrate specificity. Addressing the same goal, Taskinen et al. studied the
ability of six different SULT subtypes to conjugate a diverse set of catecholic compounds and
developed QSAR models to predict the metabolic fate of catechols177. A similar study was
published the same year in which 3D-QSAR (Comparative Molecular Field Analysis (CoMFA))
INTRODUCTION
20
was utilized to determine Km values of phenolic compounds metabolised by SULT1A3178. QSAR
was also used to determine the probability of SULT inhibition and the subsequent influence on
metabolism. The experimental data on SULT1E1 inhibition by EDCs, e.g. polychlorinated
biphenyls (PCBs) and brominated flame retardants (BFRs), laid the foundation for numerous
QSAR studies179-185. Taking a different approach in predicting potential toxicity of small
molecules, Chen et al. developed a ligand-protein inverse docking approach (INVDOCK) to
identify potential off-targets that might cause side effects, including SULT1E1186.
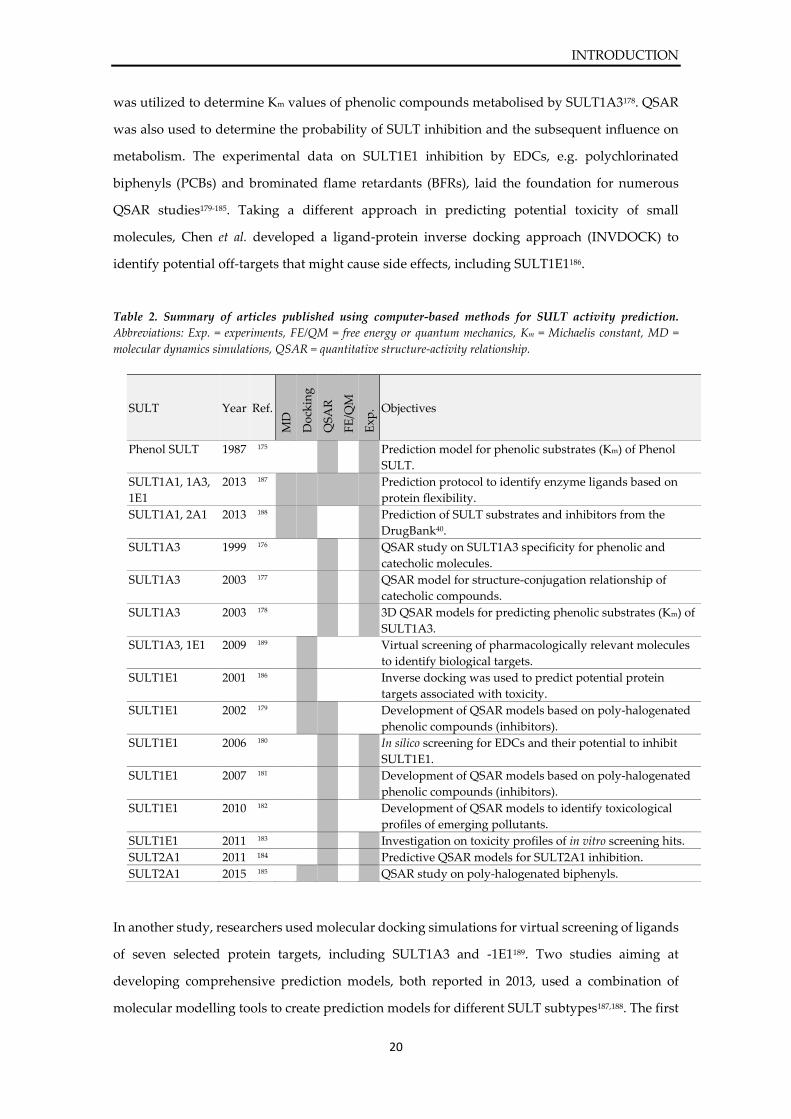
Table 2. Summary of articles published using computer-based methods for SULT activity prediction.
Abbreviations: Exp. = experiments, FE/QM = free energy or quantum mechanics, Km = Michaelis constant, MD =
molecular dynamics simulations, QSAR = quantitative structure-activity relationship.
In another study, researchers used molecular docking simulations for virtual screening of ligands
of seven selected protein targets, including SULT1A3 and -1E1189. Two studies aiming at
developing comprehensive prediction models, both reported in 2013, used a combination of
molecular modelling tools to create prediction models for different SULT subtypes187,188. The first
SULT Year Ref.
MD
Do
ckin
g
QS
AR
FE
/QM
Ex
p. Objectives
Phenol SULT 1987 175 Prediction model for phenolic substrates (Km) of Phenol
SULT.
SULT1A1, 1A3,
1E1
2013 187 Prediction protocol to identify enzyme ligands based on
protein flexibility.
SULT1A1, 2A1 2013 188 Prediction of SULT substrates and inhibitors from the
DrugBank40.
SULT1A3 1999 176 QSAR study on SULT1A3 specificity for phenolic and
catecholic molecules.
SULT1A3 2003 177 QSAR model for structure-conjugation relationship of
catecholic compounds.
SULT1A3 2003 178 3D QSAR models for predicting phenolic substrates (Km) of
SULT1A3.
SULT1A3, 1E1 2009 189 Virtual screening of pharmacologically relevant molecules
to identify biological targets.
SULT1E1 2001 186 Inverse docking was used to predict potential protein
targets associated with toxicity.
SULT1E1 2002 179 Development of QSAR models based on poly-halogenated
phenolic compounds (inhibitors).
SULT1E1 2006 180 In silico screening for EDCs and their potential to inhibit
SULT1E1.
SULT1E1 2007 181 Development of QSAR models based on poly-halogenated
phenolic compounds (inhibitors).
SULT1E1 2010 182 Development of QSAR models to identify toxicological
profiles of emerging pollutants.
SULT1E1 2011 183 Investigation on toxicity profiles of in vitro screening hits.
SULT2A1 2011 184 Predictive QSAR models for SULT2A1 inhibition.
SULT2A1 2015 185 QSAR study on poly-halogenated biphenyls.
INTRODUCTION
21
study utilized MD simulations in order to investigate protein flexibility and sample the
conformational space for a subsequent docking approach187. QSAR models were developed for
SULT1A1, -1A3, and -1E1, that enabled identification of SULT-ligands and showed accuracies of
67 %, 78 %, and 76 %, respectively. The authors did not report any experimental confirmation of
their results. The second study by Cook et al. also used MD simulations of SULT1A1 and -2A1 to
extract enzyme conformations that were used as templates for subsequent docking of molecules
of the DrugBank40,188. Based on certain binding cut-offs, molecules were identified as substrates
or inhibitors of the SULT subtypes that were under investigation. The authors report prediction
accuracies of 100 %.
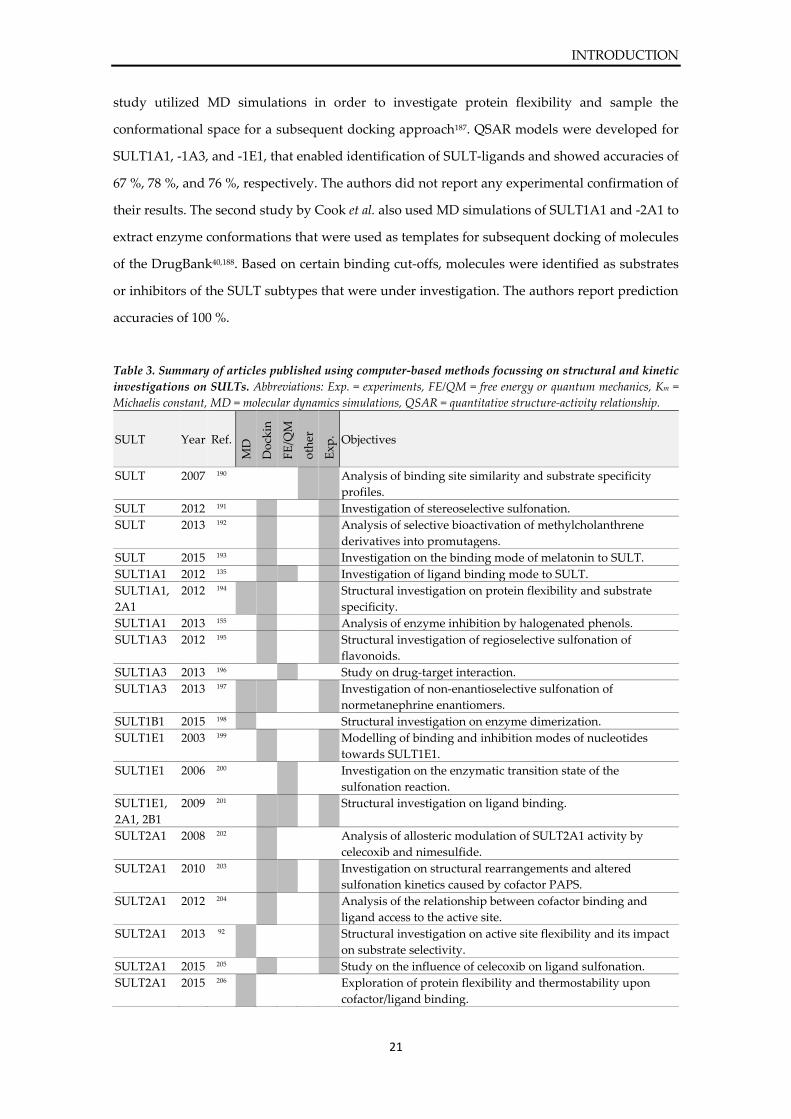
Table 3. Summary of articles published using computer-based methods focussing on structural and kinetic
investigations on SULTs. Abbreviations: Exp. = experiments, FE/QM = free energy or quantum mechanics, Km =
Michaelis constant, MD = molecular dynamics simulations, QSAR = quantitative structure-activity relationship.
SULT Year Ref.
MD
Do
ckin
g
FE
/QM
oth
er
Ex
p. Objectives
SULT 2007 190 Analysis of binding site similarity and substrate specificity
profiles.
SULT 2012 191 Investigation of stereoselective sulfonation.
SULT 2013 192 Analysis of selective bioactivation of methylcholanthrene
derivatives into promutagens.
SULT 2015 193 Investigation on the binding mode of melatonin to SULT.
SULT1A1 2012 135 Investigation of ligand binding mode to SULT.
SULT1A1,
2A1
2012 194 Structural investigation on protein flexibility and substrate
specificity.
SULT1A1 2013 155 Analysis of enzyme inhibition by halogenated phenols.
SULT1A3 2012 195 Structural investigation of regioselective sulfonation of
flavonoids.
SULT1A3 2013 196 Study on drug-target interaction.
SULT1A3 2013 197 Investigation of non-enantioselective sulfonation of
normetanephrine enantiomers.
SULT1B1 2015 198 Structural investigation on enzyme dimerization.
SULT1E1 2003 199 Modelling of binding and inhibition modes of nucleotides
towards SULT1E1.
SULT1E1 2006 200 Investigation on the enzymatic transition state of the
sulfonation reaction.
SULT1E1,
2A1, 2B1
2009 201 Structural investigation on ligand binding.
SULT2A1 2008 202 Analysis of allosteric modulation of SULT2A1 activity by
celecoxib and nimesulfide.
SULT2A1 2010 203 Investigation on structural rearrangements and altered
sulfonation kinetics caused by cofactor PAPS.
SULT2A1 2012 204 Analysis of the relationship between cofactor binding and
ligand access to the active site.
SULT2A1 2013 92 Structural investigation on active site flexibility and its impact
on substrate selectivity.
SULT2A1 2015 205 Study on the influence of celecoxib on ligand sulfonation.
SULT2A1 2015 206 Exploration of protein flexibility and thermostability upon
cofactor/ligand binding.
INTRODUCTION
22
With the rising number of available x-ray crystal structures of SULT enzymes, structure-based
modelling studies became more and more important for investigating structural and mechanistic
characteristics and identifying potential correlations to substrate specificities (Table 3).
One group in particular that originated from the environment of Charles Falany in Birmingham,
USA, have been at the frontline of combing experiments and in silico approaches to investigate
enzyme kinetics and underlying structural mechanisms. They particularly studied the influence
of the cofactor PAPS on substrate specificity of SULT2A1 and rearrangements of the substrate
binding site and its effect on ligand binding using MD simulations, docking, and in vitro
assays92,194,203,204. Furthermore, under the influence of C. Falany, studies have been published in
which docking and experiments have been combined in order to investigate ligand-binding
mechanisms and also to elucidate the importance of enzyme dimerization135,192,198,201. Over more
than a decade, numerous studies have been published that address ligand binding mechanisms
or explore profiles in different SULT subtypes155,190,193,199, investigate the influence of chemicals on
ligand binding to SULTs202,205, or assess the impact of ligands on the thermostability of SULTs
using MD simulations206. Also, studies on stereo- or regioselectivity of SULTs have been
reported191,195,197 and investigations on ligand-enzyme interactions have been published using
interaction energy calculations196. In 2006, Lin et al. were able to elucidate the enzymatic reaction
of sulfonation and determine the transition state of the reaction catalysed by SULT1E1 using a
quantum mechanical/ molecular mechanical (QM/MM) approach200.
Due to its significant role in regulating physiological estrogen levels and its association with EDC-
dependent inhibition, the here presented study focuses on SULT1E1. To date, only one structure-
based prediction model for SULT1E1 has been reported in which molecular dynamics
simulations were employed to address protein flexibility187. Further, only five ligand-based
studies have been published that report on the development of prediction models for EDCs
whose primary purpose was to provide risk assessment tools for substances affecting the
endocrine system as oppose to serving as prediction tools for SULT1E1 inhibition179-183. Only one
of these five studies further explored the structure-activity relationship through molecular
docking experiments using a homology model of SULT1E1 based on the crystal structure of
mouse estrogen sulfotransferase179. Thus, ligand-based approaches mainly focused on the
prediction of EDCs and the assessment of endocrine effects. Although these prediction tools
could potentially be used to evaluate SULT1E1 inhibition, their applicability domain is restricted
to compounds similar to EDCs and the aspect of substrate prediction has not been addressed in
these approaches.
AIM AND OBJECTIVES
23
2. AIM AND OBJECTIVES
In drug discovery, appropriate pharmacokinetic drug profiles are crucial for successful
development of novel drug candidates. To date, the majority of metabolism studies focussed on
CYP-related metabolism prediction, even though it was estimated that about 75 % of all drugs
are also substrates of non-CYP-related metabolic enzymes22. SULTs have been shown to be one
of the most predominant enzyme families in phase II metabolism67,102. SULT1E1 shows high
affinity towards estrogenic compounds and its activity has been associated with the regulation of
estrogen levels. Its strong inhibition by environmental substances influences metabolism rates
and could promote hormone-dependent abnormal cell proliferation (cancer).
Given the broad influence of metabolic enzymes ranging from drug activation and inactivation,
over enzyme inhibition to the formation of bioactive, chemically reactive metabolites, the
development of phase II metabolism prediction tools remains an important goal to optimize drug
development and facilitate risk-assessment.
In the present study, the aim was to develop, validate, and apply a novel and accurate in silico
prediction model for SULT1E1 activity to enable efficient classification of molecules into SULT-
active and -inactive compounds and further differentiation into substrates and inhibitors.
The individual steps towards a SULT1E1 prediction model include
(i) structural investigation of SULT1E1 and exploration of substrate specificity,
(ii) development of a computer-based prediction model,
(iii) application of the prediction model in a virtual screening approach, and
(iv) experimental validation of the predicted screening hits.
In part (i) of this study (chapter 4.1), structural investigations on the available crystal structures
of SULT1E1 are carried out to explore the structure of SULT1E1 and to identify characteristics
that influence substrate specificity of the enzyme. Additionally, SULT1E1 is structurally
compared to two other SULT subtypes – SULT1A1, which is a more generalist enzyme showing
a broad substrate spectrum and SULT2A1, which shares a substrate profile for steroids with
SULT1E1 - to determine structural features that allow differentiation between enzyme subtypes.
The findings of this first part will lay the foundation for the subsequent molecular modelling
steps.
In part (ii) (chapter 4.2), a specific computer-based workflow is developed combining different
molecular modelling techniques in order to create an in silico prediction model for SULT1E1.
AIM AND OBJECTIVES
24
Integral techniques that are used for mechanistic and qualitative investigations include molecular
dynamics simulations, protein-ligand docking, and 3D pharmacophore modelling. For further
statistic and qualitative enrichment of the model, machine learning is applied. Based on this
workflow, an accurate model is to be developed that allows prediction of active SULT1E1 ligands
and further differentiation between substrates and inhibitors.
In the third part (iii) (chapter 4.3), the elaborated prediction model is applied to publicly available
compound databases in a virtual screening approach and the predicted hits are analysed based
on literature search.
In the last part (iv) of the study (chapter 4.4), a selection of predicted molecules is experimentally
tested in order to validate the prediction hypotheses. The experimental validation is carried out
in collaboration with the German Institute of Human Nutrition (DIfE) Potsdam-Rehbrücke,
Germany, and the University of Potsdam, Germany. During experimental validation, the two
aspects of enzyme kinetics, inhibition of SULT1E1 and sulfonation catalysed by SULT1E1, will
both be addressed.
The aim of this study is to advance the understanding of the structural basis of SULT1E1 activity
and to mechanistically determine the basis for its substrate specificity. The development of an in
silico model to predict substrates and inhibitors of SULT1E1 will help to facilitate drug design
and guide novel drug synthesis. Furthermore, this model potentially is of high value for time-
and cost-efficient pre-experimental virtual screenings as well as a risk assessment tool for already
developed compounds.
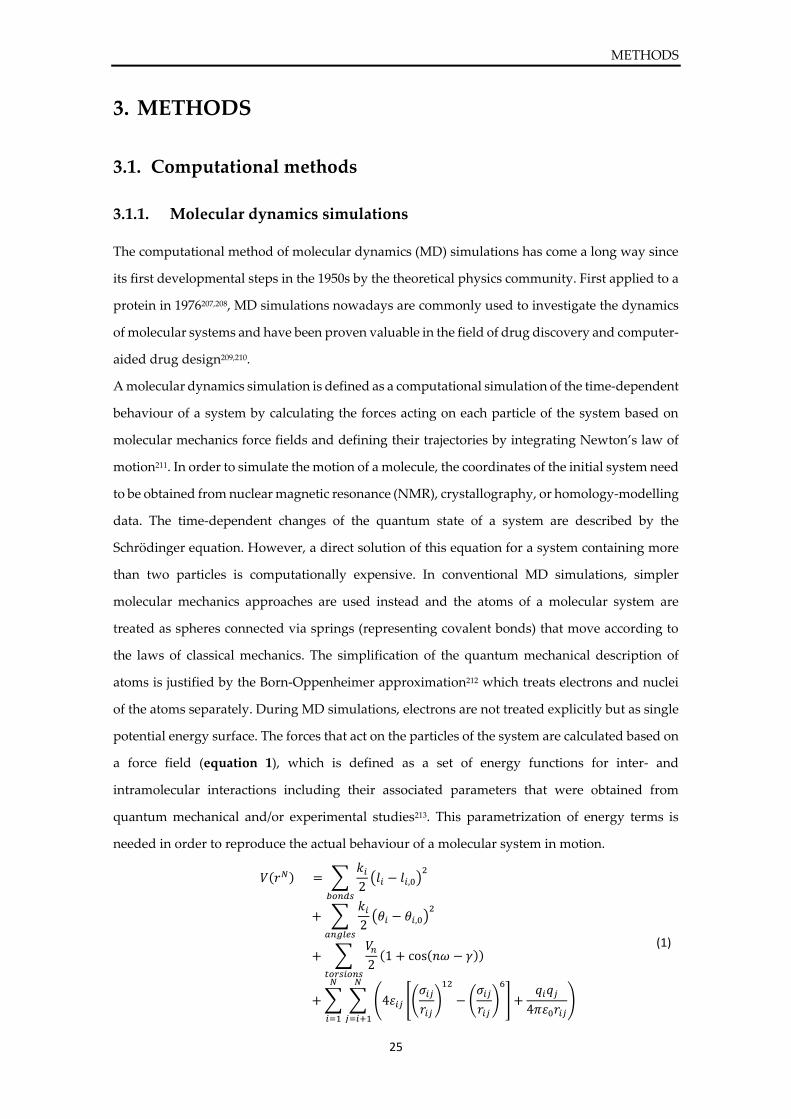
METHODS
25
3. METHODS
3.1. Computational methods
3.1.1. Molecular dynamics simulations
The computational method of molecular dynamics (MD) simulations has come a long way since
its first developmental steps in the 1950s by the theoretical physics community. First applied to a
protein in 1976207,208, MD simulations nowadays are commonly used to investigate the dynamics
of molecular systems and have been proven valuable in the field of drug discovery and computer-
aided drug design209,210.
A molecular dynamics simulation is defined as a computational simulation of the time-dependent
behaviour of a system by calculating the forces acting on each particle of the system based on
molecular mechanics force fields and defining their trajectories by integrating Newton’s law of
motion211. In order to simulate the motion of a molecule, the coordinates of the initial system need
to be obtained from nuclear magnetic resonance (NMR), crystallography, or homology-modelling
data. The time-dependent changes of the quantum state of a system are described by the
Schrödinger equation. However, a direct solution of this equation for a system containing more
than two particles is computationally expensive. In conventional MD simulations, simpler
molecular mechanics approaches are used instead and the atoms of a molecular system are
treated as spheres connected via springs (representing covalent bonds) that move according to
the laws of classical mechanics. The simplification of the quantum mechanical description of
atoms is justified by the Born-Oppenheimer approximation212 which treats electrons and nuclei
of the atoms separately. During MD simulations, electrons are not treated explicitly but as single
potential energy surface. The forces that act on the particles of the system are calculated based on
a force field (equation 1), which is defined as a set of energy functions for inter- and
intramolecular interactions including their associated parameters that were obtained from
quantum mechanical and/or experimental studies213. This parametrization of energy terms is
needed in order to reproduce the actual behaviour of a molecular system in motion.
𝑉(𝑟𝑁) = ∑𝑘𝑖
2(𝑙𝑖 − 𝑙𝑖,0)
2
𝑏𝑜𝑛𝑑𝑠
+ ∑𝑘𝑖
2(𝜃𝑖 − 𝜃𝑖,0)
2
𝑎𝑛𝑔𝑙𝑒𝑠
+ ∑𝑉𝑛
2(1 + cos(𝑛𝜔 − 𝛾))
𝑡𝑜𝑟𝑠𝑖𝑜𝑛𝑠
+ ∑ ∑ (4휀𝑖𝑗 [(𝜎𝑖𝑗
𝑟𝑖𝑗)
12
− (𝜎𝑖𝑗
𝑟𝑖𝑗)
6
] +𝑞𝑖𝑞𝑗
4𝜋휀0𝑟𝑖𝑗)
𝑁
𝑗=𝑖+1
𝑁
𝑖=1
(1)
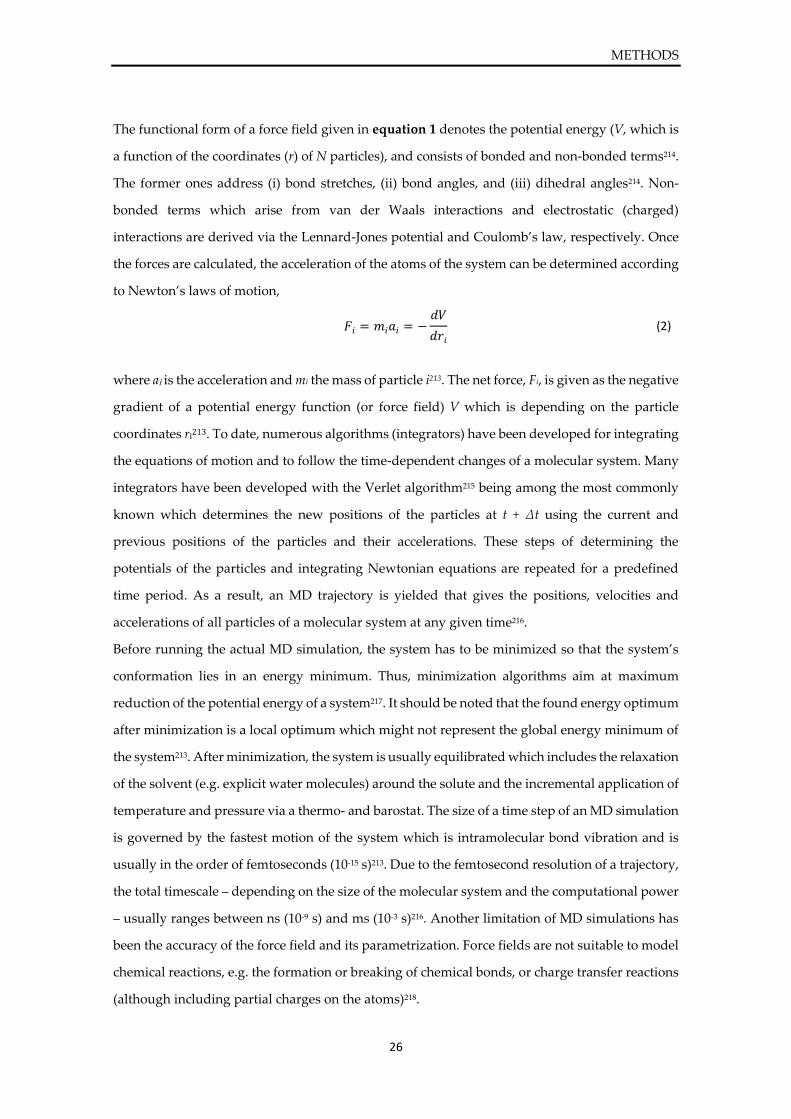
METHODS
26
The functional form of a force field given in equation 1 denotes the potential energy (V, which is
a function of the coordinates (r) of N particles), and consists of bonded and non-bonded terms214.
The former ones address (i) bond stretches, (ii) bond angles, and (iii) dihedral angles214. Non-
bonded terms which arise from van der Waals interactions and electrostatic (charged)
interactions are derived via the Lennard-Jones potential and Coulomb’s law, respectively. Once
the forces are calculated, the acceleration of the atoms of the system can be determined according
to Newton’s laws of motion,
𝐹𝑖 = 𝑚𝑖𝑎𝑖 = −𝑑𝑉
𝑑𝑟𝑖
(2)
where ai is the acceleration and mi the mass of particle i213. The net force, Fi, is given as the negative
gradient of a potential energy function (or force field) V which is depending on the particle
coordinates ri213. To date, numerous algorithms (integrators) have been developed for integrating
the equations of motion and to follow the time-dependent changes of a molecular system. Many
integrators have been developed with the Verlet algorithm215 being among the most commonly
known which determines the new positions of the particles at t + Δt using the current and
previous positions of the particles and their accelerations. These steps of determining the
potentials of the particles and integrating Newtonian equations are repeated for a predefined
time period. As a result, an MD trajectory is yielded that gives the positions, velocities and
accelerations of all particles of a molecular system at any given time216.
Before running the actual MD simulation, the system has to be minimized so that the system’s
conformation lies in an energy minimum. Thus, minimization algorithms aim at maximum
reduction of the potential energy of a system217. It should be noted that the found energy optimum
after minimization is a local optimum which might not represent the global energy minimum of
the system213. After minimization, the system is usually equilibrated which includes the relaxation
of the solvent (e.g. explicit water molecules) around the solute and the incremental application of
temperature and pressure via a thermo- and barostat. The size of a time step of an MD simulation
is governed by the fastest motion of the system which is intramolecular bond vibration and is
usually in the order of femtoseconds (10-15 s)213. Due to the femtosecond resolution of a trajectory,
the total timescale – depending on the size of the molecular system and the computational power
– usually ranges between ns (10-9 s) and ms (10-3 s)216. Another limitation of MD simulations has
been the accuracy of the force field and its parametrization. Force fields are not suitable to model
chemical reactions, e.g. the formation or breaking of chemical bonds, or charge transfer reactions
(although including partial charges on the atoms)218.
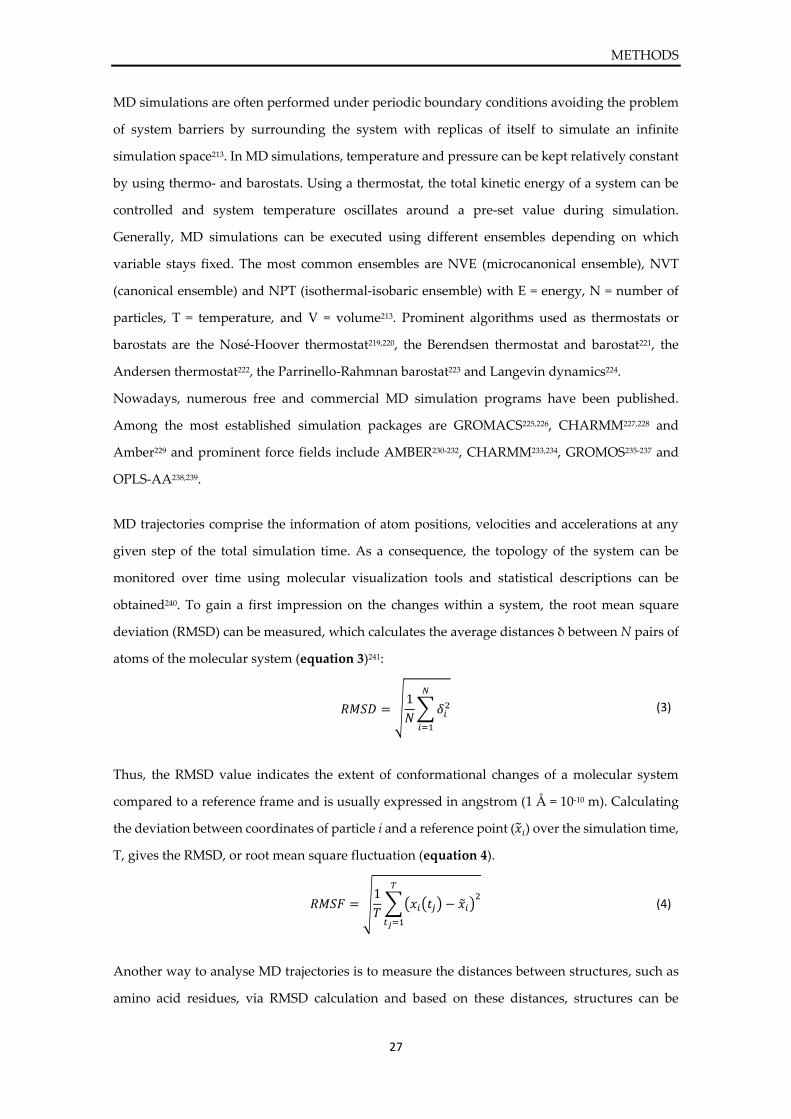
METHODS
27
MD simulations are often performed under periodic boundary conditions avoiding the problem
of system barriers by surrounding the system with replicas of itself to simulate an infinite
simulation space213. In MD simulations, temperature and pressure can be kept relatively constant
by using thermo- and barostats. Using a thermostat, the total kinetic energy of a system can be
controlled and system temperature oscillates around a pre-set value during simulation.
Generally, MD simulations can be executed using different ensembles depending on which
variable stays fixed. The most common ensembles are NVE (microcanonical ensemble), NVT
(canonical ensemble) and NPT (isothermal-isobaric ensemble) with E = energy, N = number of
particles, T = temperature, and V = volume213. Prominent algorithms used as thermostats or
barostats are the Nosé-Hoover thermostat219,220, the Berendsen thermostat and barostat221, the
Andersen thermostat222, the Parrinello-Rahmnan barostat223 and Langevin dynamics224.
Nowadays, numerous free and commercial MD simulation programs have been published.
Among the most established simulation packages are GROMACS225,226, CHARMM227,228 and
Amber229 and prominent force fields include AMBER230-232, CHARMM233,234, GROMOS235-237 and
OPLS-AA238,239.
MD trajectories comprise the information of atom positions, velocities and accelerations at any
given step of the total simulation time. As a consequence, the topology of the system can be
monitored over time using molecular visualization tools and statistical descriptions can be
obtained240. To gain a first impression on the changes within a system, the root mean square
deviation (RMSD) can be measured, which calculates the average distances δ between N pairs of
atoms of the molecular system (equation 3)241:
𝑅𝑀𝑆𝐷 = √1
𝑁∑ 𝛿𝑖
2
𝑁
𝑖=1
(3)
Thus, the RMSD value indicates the extent of conformational changes of a molecular system
compared to a reference frame and is usually expressed in angstrom (1 Å = 10-10 m). Calculating
the deviation between coordinates of particle i and a reference point (�̃�𝑖) over the simulation time,
T, gives the RMSD, or root mean square fluctuation (equation 4).
𝑅𝑀𝑆𝐹 = √1
𝑇∑(𝑥𝑖(𝑡𝑗) − �̃�𝑖)
2𝑇
𝑡𝑗=1
(4)
Another way to analyse MD trajectories is to measure the distances between structures, such as
amino acid residues, via RMSD calculation and based on these distances, structures can be
METHODS
28
clustered to group similar conformations. The cluster centre can be extracted from the resulting
clustering data and the ensemble of centre conformations represent the most diverse structures
based on their RMS deviations.
3.1.2. Molecular docking
In drug discovery, one of the main questions is how a ligand binds to its target. An efficient way
to predict ligand conformations at a binding site of a known target is the computer-based
technique of molecular docking and numerous docking programs have been developed, such as
AutoDock242, GOLD243, DOCK244, FlexX245, or Glide246,247. In molecular docking, usually a template
structure (e.g. from x-ray crystallography, NMR, or homology modelling) and one or several
ligands serve as input to the program. Docking can be utilized to screen large databases of
compounds for hit identification or support refinement of previously identified hit molecules
during the process of lead optimization. Generally, molecular docking consists of a searching
algorithm and a scoring function, which enable identification of favourable ligand binding
conformations and ranking based on the scoring function248. The searching algorithm generally
enables exploration of the conformational space of protein and ligand(s) while being limited by
computational power. Ligand conformations are sampled by changing the degrees of freedom
while energetically favourable conformations are cached. In some docking approaches, the
protein flexibility is considered additionally. Conformational search strategies are diverse but can
be divided into the three categories of random/stochastic, systematic, and simulation methods249.
Stochastic search algorithms randomly change the ligand(s) while evaluating the resulting
conformation based on a probability function249. Common approaches include genetic algorithms
and Monte Carlo implementations (e.g. GOLD, AutoDock)242,243. Systemic approaches are based
on the concept of stepwise or incrementally growing a ligand into protein binding sites and are
used in DOCK244, Glide246 and FlexX245. After a defined number of docking iterations or runs, the
conformational search stops and retrieved poses are ranked according to a score. Scoring
functions can be divided into three types. Firstly, force field-based functions, which are used in
GOLD250, DOCK244 and AutoDock242, employ classical force fields to calculate non-covalent
interactions between ligand and target. Secondly, empirical function functions251,252 calculate the
sum of individual energetic terms like hydrogen bonds or hydrophobic contacts to estimate the
overall binding free energy. These functions are parameterized by coefficients obtained from
linear regression analysis of experimental data from known structures and their binding
affinities. The third type of scoring functions are knowledge-based scoring functions253,254 which
METHODS
29
rely on statistical observations of ligand-target interactions (frequencies and/or distances) in
crystal structure databases such as the Protein Data Bank (PDB).
All three types of scoring functions exhibit a different balance between speed and accuracy, and
their performances have been frequently investigated in comparative studies255-257. It was
concluded that current scoring functions enable identification of correct ligand-target
conformations, though the calculation of binding affinities should be interpreted with
caution258,259. Due to unreliability of scoring functions260, it was suggested that the evaluation of
individual docking conformations should be complemented by visual inspection or statistical
analysis, and not rely on rankings only259.
3.1.3. 3D Pharmacophores
Three-dimensional (3D) pharmacophores have become an established method in the field of drug
discovery representing a computationally efficient tool for high-throughput screening. In the
IUPAC recommendations from 1998, a pharmacophore is defined as “the ensemble of steric and
electronic features that is necessary to ensure the optimal supramolecular interactions with a specific
biological target structure and to trigger (or to block) its biological response”261. Depending on the nature
of ligand-target interaction, a pharmacophore allows abstraction of biological states, such as
inhibition, activation, or neutral antagonism. Common pharmacophore features represent
hydrogen bond acceptor and donor atoms, hydrophobic areas, aromatic and ionic interactions,
and exclusion volumes which set constraints on the geometric fit of a molecule towards the
binding site during pharmacophore-based virtual screening. The creation of a pharmacophore is
accomplished either via ligand- or structure-based approaches262. Ligand-based approaches,
which are often chosen due to lack of structural information about the target, use ligands that are
known to be active towards the target and extract common features to derive a ligand-based 3D
pharmacophore. Depending on the availability of structural information of the target and its
interaction with a ligand, structure-based 3D pharmacophores take into account the protein
environment and are direct abstractions of ligand-target interactions. A typical structure-based
approach starts with the retrieval of the ligand-target complex, usually from experimental data,
molecular docking, or crystallographic databases, such as the Protein Data Bank (PDB)263 or the
Cambridge Structural Database (CSD)264. After careful structural inspection and/or preparation
of the complex, a 3D pharmacophore can be created automatically by abstraction of ligand-
protein interactions into 3-dimensionally arranged chemical features. Usually, this 3D
pharmacophore functions as a prototype for further refinement of the model aiming at creating a
pharmacophore model that efficiently discriminates between active and inactive molecules while
METHODS
30
yielding a sufficiently high hit rate. The performance of a pharmacophore is evaluated during
virtual screening (VS) by screening large databases or compound libraries.
The dataset that is used to train the model (training set) commonly consists of a number of known
active compounds (e.g. inhibitors) and a larger number of inactive molecules. Due to the frequent
lack of publicly available data on inactive compounds, a common approach is to generate
‘decoys’, i.e. putatively inactive molecules, that show similar physicochemical properties to active
compounds265. One established public database for decoy generation is the Directory of Useful
Decoys, Enhanced (DUD-E)266 providing an online platform to automatically generate a decoy
database based on input molecules with a predefined ratio of active to decoy molecules of 1:50266.
To date, an array of programs for pharmacophore modelling has been reported including
packages such as LigandScout267-269, Phase270,271, Catalyst272, or the pharmacophore module
implemented in MOE273.
3.1.4. Virtual screening and assessment of model performance
In drug discovery, (experimental) high-throughput screening (HTS) of chemical libraries is an
essential step in identifying new drug candidates. Virtual screening (VS) utilizes computer-based
methods to search for compounds that potentially bind to known biological targets (e.g.
enzymes). It is thus an efficient way to obtain a preselection of putative ligands, and is nowadays
widely used to complement HTS274,275.
In theory, the chemical space of molecules is vast and thus inaccessible for screening276. A
common approach is therefore the retrieval of focussed libraries, which are either self-created or
obtained from public or commercial sources. Depending on the scope of the study, library design
might be focussed on target-specific molecules with certain scaffolds or recognition elements, or
focussed on structural diversity or certain physicochemical properties. As an example, drug-like
molecules can be filtered by applying Lipinski’s ‘Rule of Five’33, or fragment-based libraries can
be designed based on the ‘Astex Rule of Three’277. Recently, special filters have been developed
to remove compounds from screening libraries that have been shown to be active in many
different assays, called Pan Assay Interference Compounds (PAINS)278.
Depending on the available information beforehand, VS can be divided into two basic approaches
of ligand-based and structure-based VS. Ligand-based approaches focus on the identification of
compounds by utilizing structure-activity data from known active molecules (e.g. ligand-based
pharmacophore, descriptor-based methods), while structure-based approaches (e.g. molecular
docking, structure-based pharmacophores) employ molecular recognition information between
high-affinity ligands and the known target.
METHODS
31
Screening performance is often assessed in terms of a so-called confusion matrix that indicates
prediction instances of true positive (TP), true negative (TN), false positive (FP), and false
negative hits (FN). Based on these indications, the sensitivity and specificity of a prediction model
can be calculated. The sensitivity of the model (equation 5) is defined as the ratio of the number
of active molecules (TP) identified by the model to the number of all active molecules (P) in the
data set, and indicates the ‘true positive rate’265. In turn, the specificity (equation 6) is defined as
the number of inactive molecules (TN) identified by the model divided by the number of all
inactive molecules (N) in the data set, and represents the ‘false positive rate’.
𝑆𝑒 =𝑇𝑃
𝑃=
𝑇𝑃
(𝑇𝑃 + 𝐹𝑁) (5)
𝑆𝑝 =𝑇𝑁
𝑁=
𝑇𝑁
(𝑇𝑃 + 𝐹𝑁) (6)
Furthermore, for binary classification models, the accuracy (ACC), which reflects the degree of
prediction correctness in regard to the optimum prediction, and Matthew’s correlation coefficient
(MCC), which is an indicator of binary classification quality, can be calculated (equations 7 and
8). The MCC ranges between -1 and 1, with 0 and 1 equalling random and perfect prediction,
respectively.
𝐴𝐶𝐶 =(𝑇𝑃 + 𝑇𝑁)
(𝑇𝑃 + 𝑇𝑃 + 𝐹𝑁 + 𝑇𝑁) (7)
𝑀𝐶𝐶 =𝑇𝑃 × 𝑇𝑁 − 𝐹𝑃 × 𝐹𝑁
√(𝑇𝑃 + 𝐹𝑃)(𝑇𝑃 + 𝐹𝑁)(𝑇𝑁 + 𝐹𝑃)(𝑇𝑁 + 𝐹𝑁) (8)
The performance of a virtual screening protocol that allows binary classification (active or
inactive) is also often assessed by the use of a receiver operating characteristic (ROC) curve, which
is a graphical indicator of the discriminative power of a model. The ROC curve is obtained by
plotting the rate of true positives, or the sensitivity, against the rate of false positives, calculated
as (1 – specificity), and allows instant visual interpretation of the performance of a model.
3.1.5. Machine learning
Structure-activity relationships can be derived by relating descriptors of a given set of chemical
structures to their biological activity in order to make qualitative or quantitative predictions on
unknown compounds. In the field of drug discovery, numerous predictive quantitative structure-
activity relationship (QSAR) models have been developed over the years to predict biological
activity, chemical properties, and pharmacokinetic profiles of potential drug candidates.
METHODS
32
First described by C. Hansch in 196930, a QSAR model is based on the simplified form, Activity =
f(molecular descriptors), and requires three prerequisites: (i) a data set of molecules and their
experimentally determined activity, (ii) linearly independent (structure-related) descriptors for
all molecules, and (iii) a function that establishes a relation between the former two. The
descriptors used to feed the model are based on 2D or 3D molecular properties including
fragment, topological, or physicochemical descriptors279. Generally, statistical methods can be
divided into linear methods, such as linear regression or partial least squares (PLS) regression280,
or nonlinear methods, such as machine learning techniques like support vector machines (SVM)
or artificial neural networks (ANN). Depending on the nature of prediction, these statistical
methods can also be divided into regression functions (in case of predicting continuous values,
such as Ki) and classification methods (binary decision predictions)281.
Data mining and machine learning approaches have been shown valuable for predicting ADME
properties via models that are based on nonlinear and multidimensional data282-285. Machine
learning techniques such as SVMs have been repeatedly applied to biological data in the field of
drug discovery and represent solid tools for classification problems286. The supervised learning
method SVM is based on the transformation of variables into a high-dimensional space and
subsequent separation of the two classes by a hyperplane. The aim is to identify a hyperplane
through the descriptor space that allows optimum discrimination between the two classes, while
maximizing the margin between the closest vectors. The transformation of variables into support
vectors of a new space is commonly performed by using mathematical kernels (kernel trick),
which enable efficient computational analysis of nonlinear relationships287. A critical point in
SVM modelling is the tuning of parameters to achieve high predictive power. Advantages are the
low probability of overfitting and the ability to deal with small numbers of variables281.
Another nonlinear classification method are artificial neural networks (ANN) which have been
developed inspired by the nature of the human central nervous system: the model is comprised
of connected layers (input, hidden, and output layer) of nodes, i.e. neurons, while weights are
assigned to each node connection which are trained during model building. A specific ANN is
the multilayer perceptron (MLP) that uses so-called perceptron algorithms for classification
model training. Perceptrons representing the nodes of the ANN are able to make binary
predictions that are based on linear predictor functions using independent descriptors and
adaptive weights. During model training, the weight of each node is optimised to reduce the error
via backpropagation288,289.
Naïve Bayes classification models are based on the Bayes’ theorem which describes conditional
probabilities of an outcome. This approach is based on two assumptions: firstly, the equal
METHODS
33
importance of input variables and secondly, their independence290. The probability of an outcome
is estimated by taking into consideration the prior probability of an event and its likelihood.
Decision trees (DT) can be constructed to predict an outcome based on a tree-like mapping of
linked nodes with each node representing an attribute test. A prediction is made by taking an
unknown instance and, starting at the root of the tree, attributes are examined at each node. Based
on these decisions, the instance is forwarded along the tree branches to the next node until a leaf
(a node without successor nodes) is reached. DTs are usually built using recursive partitioning,
which splits the training data into subsets in response to a statistical analysis of variables. Based
on an ensemble of decision trees, random forests (RT) can also be built and used for classification
predictions. Random forests are based on bagging algorithms which take bootstrap samples
(randomly chosen and replaced) and also randomly-drawn feature subsets from the training set
to train the prediction model291.
The quality of a QSAR model is highly dependent on the quality of input data and the choice of
descriptors and statistical methods. One should note that a good fit of a model to its training set
does not guarantee solid predictability for external molecules and that increasing the number of
used parameters for the model only increases fit to the training data292. Thus, during model
development, it is important to avoid under- or over-fitting of the model. One approach to assess
if a model is solidly parameterized is external validation in which the data set is split into a
training set that is used for model development and a test set which is used for validation and
that should be representative of the complete data set. An alternative approach is internal cross-
validation, which bears the advantage that no molecules have to be excluded from model
development.
In order to assess the performance of a QSAR model, several statistical terms can be consulted.
For regression models, statistics that give an assessment on model performance are correlation
charts or plots that show the experimental vs. the predicted properties, the root mean squared
error (RMSE), the coefficient of determination (r2), and the leave-one-out cross-validated r2
(q2)292,293. The assessment of binary classification models is usually accomplished via confusion
matrices which indicate the concurrence of measured and predicted class. Further statistical
metrics that are commonly used to evaluate classification model performance are the accuracy
(ACC) or Matthew’s correlation coefficient (MCC). Definitions of these metrics are given in
chapter 3.1.4 and equations 5 to 8.
METHODS
34
3.2. Experimental methods
3.2.1. In vitro activity assay of SULT1E1
To date, a variety of in vitro assays have been developed in order to efficiently determine enzyme
activity of SULTs. Enzyme activity can be defined in enzyme units (U) which is the amount of
converted substrate per unit time (1 U = 1 µmol min-1), or as specific activity which takes into
account the quantity of enzyme and is usually expressed in µmol min-1 mg-1. The development of
an assay often depends on specific needs, such as assay sensitivity, throughput, and availability
of resources.
Most in vitro assays for SULT activity use established protocols based on radio-labelled substrate
E2 (E2[3H]) or radio-labelled cofactor (PAP[35S])294. After a specific incubation time of enzyme,
substrate, and cofactor, the formed product (e.g. E2[3H]-sulfate or [35S]sulfated-substrate) is
separated via chromatography methods, immobilization techniques, or membranes, and its
quantity determined using a scintillation counter295. Although showing high sensitivity and
universality (because any substrate can be used), radiometric assays can be laborious and
expensive.
As an alternative to radiometric assays, several SULT assays have been reported using
photometric or fluorometric methods, or utilizing mass spectrometry295. In photometric SULT
assays, kinetic data can be determined by using reactants with chromophores or reactants that
undergo a detectable shift in absorption. Also, coupled assays for SULT have been developed
using a specific enzyme that re-sulfonates PAP originating from the SULT reaction via p-
nitrophenyl sulfate296. The product, p-nitrophenol can then be detected photometrically.
Assays based on fluorometric methods are more sensitive, but require a fluorogenic substrate. In
2006, a fluorescence-based HPLC assay was reported for investigating SULT1E1 inhibition which
uses 1-hydroxypyrene as a substrate294.
An alternative approach using fluorescence detection was reported by the groups of C.N. Falany
and T.S. Leyh, which took advantage of the observation that SULT enzymes exhibit a shift in
intrinsic fluorescence after ligand binding204,297. Similar to this method, Allali-Hassani et al.
performed ligand binding assays based on changes in thermostability of the enzyme in presence
or absence of ligands. In heating cycles up to 80 °C, protein aggregation is monitored by taking
images of scattered light every 30 seconds and pixel intensities are then correlated to changes in
temperature to measure changes in enzyme thermostability85.
In cases of unavailable fluorogenic or chromophoric molecules, or inaccessible radiometric
assays, mass spectrometry (MS) can be a useful alternative since it is highly sensitive and
METHODS
35
accurate. Current ionisation techniques allow detection of sulfonated products without
separating the sulfonate group from the product, thus enabling differentiation between substrate
and product. Furthermore, multi-sulfonated products can be detected. Quantification of products
via MS requires suitable internal standards, e.g. stable isotopes or structural analogues of the
analytes.
In this study, two different approaches were used to assess enzyme inhibition of SULT1E1 and
determine sulfonated metabolites transformed by the enzyme. To evaluate the inhibitory
potential of compounds towards SULT1E1, the enzyme, which was expressed in bacteria, was
incubated with a given compound and HPLC-based separation allowed determination of
sulfonated substrate via fluorescence detection. For sulfonation assays, the enzyme was
incubated with selected compounds in absence of the natural substrate and incubation mixtures
were analysed for presence of sulfonated metabolites using liquid chromatography-tandem mass
spectrometry (LC-MS/MS). More details on the experimental and computational procedures are
given in the experimental section (chapter 7).
RESULTS
36
4. RESULTS
The aim of this study was to develop an in silico tool that allows prediction of SULT1E1 substrates
and inhibitors. To reach this goal, four consecutive steps were conducted including firstly, the
structural investigation of SULT1E1 (chapter 4.1), secondly, the development of a prediction
model for SULT1E1 ligands (chapter 4.2), thirdly, the application of the model to databases
during virtual screening (chapter 4.3), and lastly, the experimental validation of predicted hits
which was performed in collaboration with the University of Potsdam, Germany, and the
German Institute of Human Nutrition (DIfE), Germany (chapter 4.4).
4.1. Structural investigation on SULT1E1
The aim of this part of the study was to investigate the structure of SULT1E1 based on publicly
available crystal structures and determine structural features that are important for catalytic
competency of the enzyme and that influence substrate specificities. The structure of SULT1E1
was also compared to two other major SULT subtypes, SULT1A1 and SULT2A1, in order to find
descriptors for subtype discrimination.
In the beginning of this study, two crystal structures of SULT1E1 were available, PDB entries
1G3M298 and 1HY393 (Table 4). The former structure, 1G3M, includes the un-sulfonated cofactor
(PAP) in the cofactor-binding site and the co-crystallised ligand, 3,5,3’,5’-tetrachlorobiphenyl-
4,4’-diol (TCB), in the active site. TCB was reported as pico-molar inhibitor of SULT1E1 (IC50 ≈
0.15 nM151). Interestingly, it was reported that this inhibitor mimics the position of 17-β-estradiol
(E2), which is a strong-binding substrate of SULT1E1 (Km = 5 nM161). This was discovered by
comparing the ligand conformation of TCB in crystal structure 1G3M to co-crystallised E2 in an
unpublished crystal structure of SULT1E193,298. As in the case of E2, the hydroxyl group of TCB
was located in close proximity to the nitrogen atom of the catalytically important amino acid
residue His107. The second crystal structure, 1HY3, solely features the co-crystallised cofactor
PAPS in the sulfonated state, which is very rarely observed among SULT crystal structures as
soaking conditions during the crystallisation process are mostly carried out using PAP in milli-
molar concentration ranges. The presence of PAPS bound to the enzyme leaves it catalytically
competent, which is a prerequisite for the sulfonation reaction and thus represents an important
criterion for a model that predicts enzyme activity. For that reason, the crystal structure of PDB
entry 1HY3 was chosen as template for subsequent modelling studies.
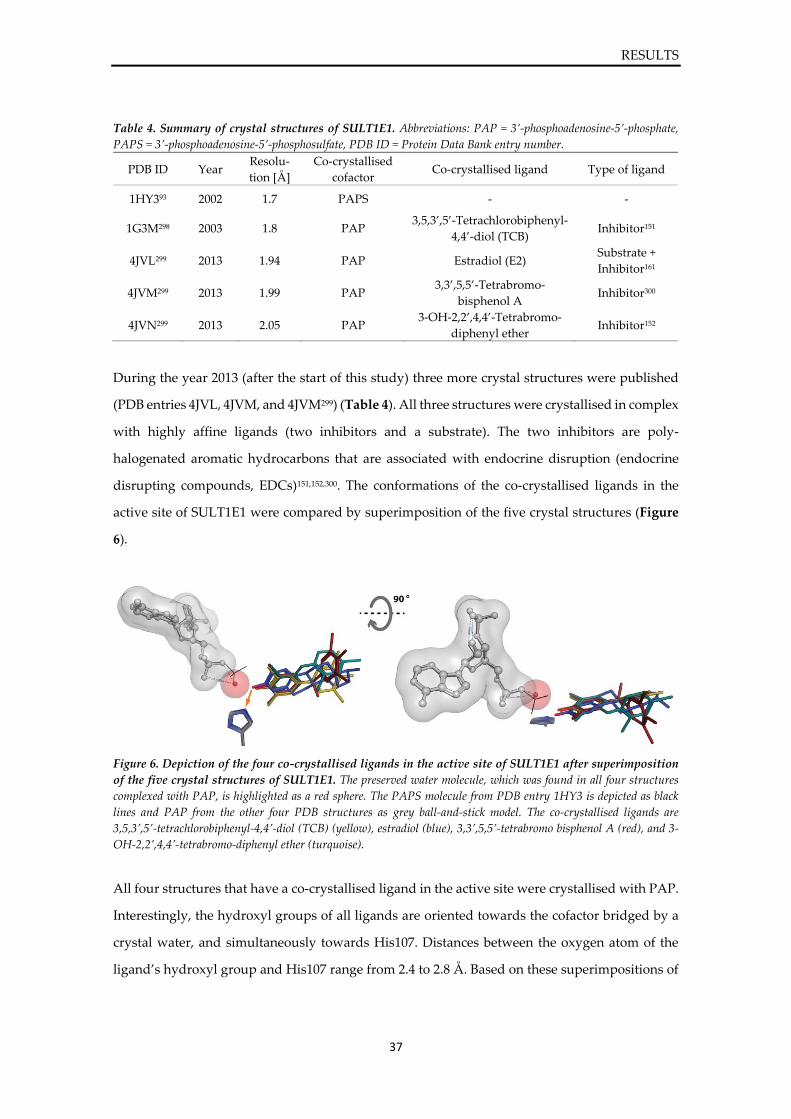
RESULTS
37
Table 4. Summary of crystal structures of SULT1E1. Abbreviations: PAP = 3’-phosphoadenosine-5’-phosphate,
PAPS = 3’-phosphoadenosine-5’-phosphosulfate, PDB ID = Protein Data Bank entry number.
During the year 2013 (after the start of this study) three more crystal structures were published
(PDB entries 4JVL, 4JVM, and 4JVM299) (Table 4). All three structures were crystallised in complex
with highly affine ligands (two inhibitors and a substrate). The two inhibitors are poly-
halogenated aromatic hydrocarbons that are associated with endocrine disruption (endocrine
disrupting compounds, EDCs)151,152,300. The conformations of the co-crystallised ligands in the
active site of SULT1E1 were compared by superimposition of the five crystal structures (Figure
6).
Figure 6. Depiction of the four co-crystallised ligands in the active site of SULT1E1 after superimposition
of the five crystal structures of SULT1E1. The preserved water molecule, which was found in all four structures
complexed with PAP, is highlighted as a red sphere. The PAPS molecule from PDB entry 1HY3 is depicted as black
lines and PAP from the other four PDB structures as grey ball-and-stick model. The co-crystallised ligands are
3,5,3’,5’-tetrachlorobiphenyl-4,4’-diol (TCB) (yellow), estradiol (blue), 3,3’,5,5’-tetrabromo bisphenol A (red), and 3-
OH-2,2’,4,4’-tetrabromo-diphenyl ether (turquoise).
All four structures that have a co-crystallised ligand in the active site were crystallised with PAP.
Interestingly, the hydroxyl groups of all ligands are oriented towards the cofactor bridged by a
crystal water, and simultaneously towards His107. Distances between the oxygen atom of the
ligand’s hydroxyl group and His107 range from 2.4 to 2.8 Å. Based on these superimpositions of
PDB ID Year Resolu-
tion [Å]
Co-crystallised
cofactor Co-crystallised ligand Type of ligand
1HY393 2002 1.7 PAPS - -
1G3M298 2003 1.8 PAP 3,5,3’,5’-Tetrachlorobiphenyl-
4,4’-diol (TCB) Inhibitor151
4JVL299 2013 1.94 PAP Estradiol (E2) Substrate +
Inhibitor161
4JVM299 2013 1.99 PAP 3,3’,5,5’-Tetrabromo-
bisphenol A Inhibitor300
4JVN299 2013 2.05 PAP 3-OH-2,2’,4,4’-Tetrabromo-
diphenyl ether Inhibitor152
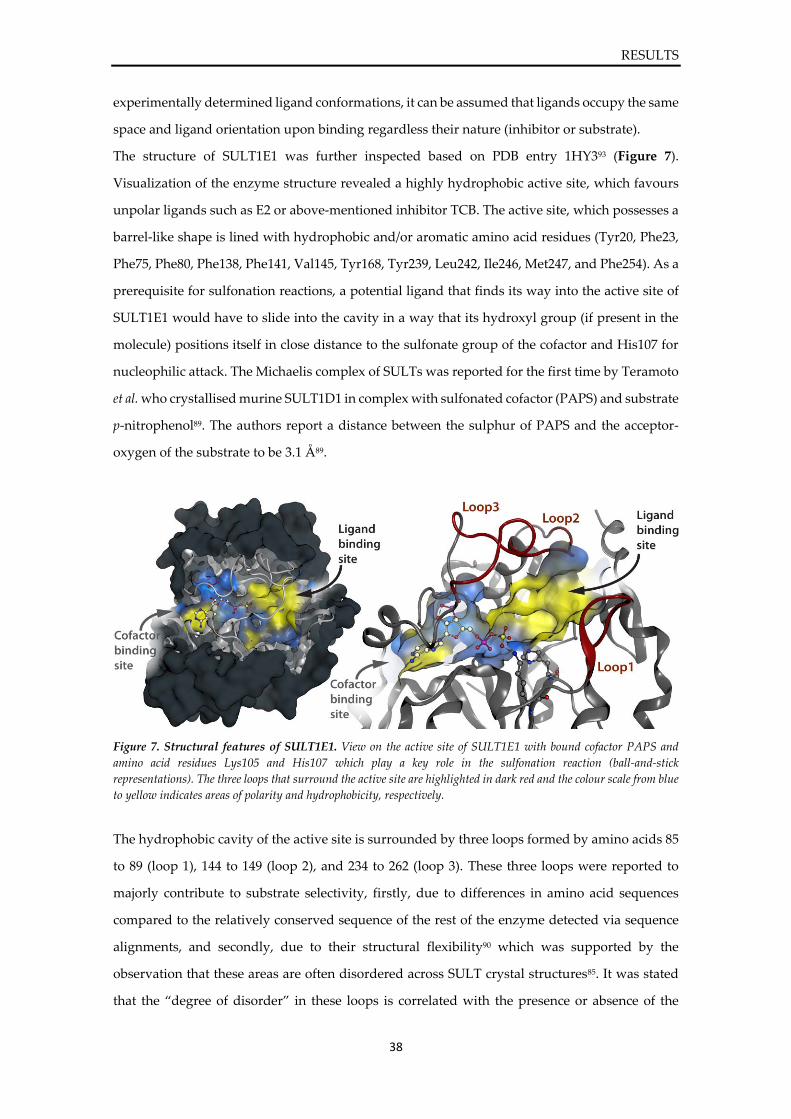
RESULTS
38
experimentally determined ligand conformations, it can be assumed that ligands occupy the same
space and ligand orientation upon binding regardless their nature (inhibitor or substrate).
The structure of SULT1E1 was further inspected based on PDB entry 1HY393 (Figure 7).
Visualization of the enzyme structure revealed a highly hydrophobic active site, which favours
unpolar ligands such as E2 or above-mentioned inhibitor TCB. The active site, which possesses a
barrel-like shape is lined with hydrophobic and/or aromatic amino acid residues (Tyr20, Phe23,
Phe75, Phe80, Phe138, Phe141, Val145, Tyr168, Tyr239, Leu242, Ile246, Met247, and Phe254). As a
prerequisite for sulfonation reactions, a potential ligand that finds its way into the active site of
SULT1E1 would have to slide into the cavity in a way that its hydroxyl group (if present in the
molecule) positions itself in close distance to the sulfonate group of the cofactor and His107 for
nucleophilic attack. The Michaelis complex of SULTs was reported for the first time by Teramoto
et al. who crystallised murine SULT1D1 in complex with sulfonated cofactor (PAPS) and substrate
p-nitrophenol89. The authors report a distance between the sulphur of PAPS and the acceptor-
oxygen of the substrate to be 3.1 Å89.
Figure 7. Structural features of SULT1E1. View on the active site of SULT1E1 with bound cofactor PAPS and
amino acid residues Lys105 and His107 which play a key role in the sulfonation reaction (ball-and-stick
representations). The three loops that surround the active site are highlighted in dark red and the colour scale from blue
to yellow indicates areas of polarity and hydrophobicity, respectively.
The hydrophobic cavity of the active site is surrounded by three loops formed by amino acids 85
to 89 (loop 1), 144 to 149 (loop 2), and 234 to 262 (loop 3). These three loops were reported to
majorly contribute to substrate selectivity, firstly, due to differences in amino acid sequences
compared to the relatively conserved sequence of the rest of the enzyme detected via sequence
alignments, and secondly, due to their structural flexibility90 which was supported by the
observation that these areas are often disordered across SULT crystal structures85. It was stated
that the “degree of disorder” in these loops is correlated with the presence or absence of the
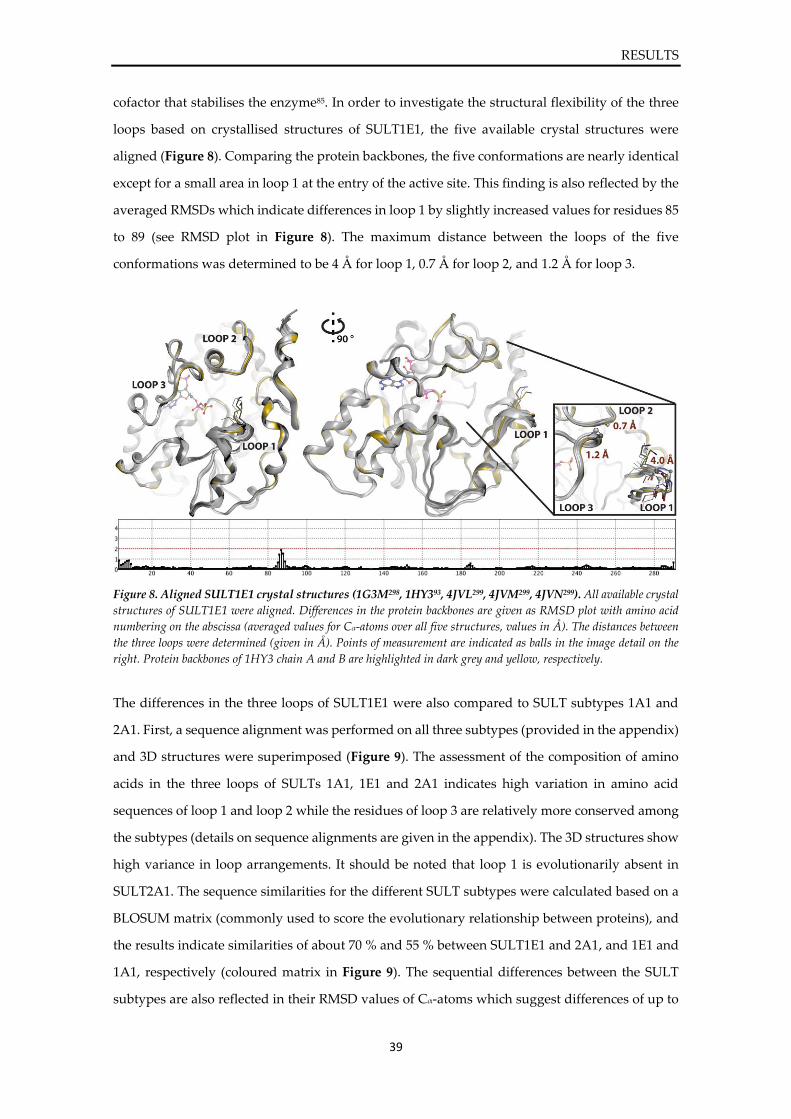
RESULTS
39
cofactor that stabilises the enzyme85. In order to investigate the structural flexibility of the three
loops based on crystallised structures of SULT1E1, the five available crystal structures were
aligned (Figure 8). Comparing the protein backbones, the five conformations are nearly identical
except for a small area in loop 1 at the entry of the active site. This finding is also reflected by the
averaged RMSDs which indicate differences in loop 1 by slightly increased values for residues 85
to 89 (see RMSD plot in Figure 8). The maximum distance between the loops of the five
conformations was determined to be 4 Å for loop 1, 0.7 Å for loop 2, and 1.2 Å for loop 3.
Figure 8. Aligned SULT1E1 crystal structures (1G3M298, 1HY393, 4JVL299, 4JVM299, 4JVN299). All available crystal
structures of SULT1E1 were aligned. Differences in the protein backbones are given as RMSD plot with amino acid
numbering on the abscissa (averaged values for Cα-atoms over all five structures, values in Å). The distances between
the three loops were determined (given in Å). Points of measurement are indicated as balls in the image detail on the
right. Protein backbones of 1HY3 chain A and B are highlighted in dark grey and yellow, respectively.
The differences in the three loops of SULT1E1 were also compared to SULT subtypes 1A1 and
2A1. First, a sequence alignment was performed on all three subtypes (provided in the appendix)
and 3D structures were superimposed (Figure 9). The assessment of the composition of amino
acids in the three loops of SULTs 1A1, 1E1 and 2A1 indicates high variation in amino acid
sequences of loop 1 and loop 2 while the residues of loop 3 are relatively more conserved among
the subtypes (details on sequence alignments are given in the appendix). The 3D structures show
high variance in loop arrangements. It should be noted that loop 1 is evolutionarily absent in
SULT2A1. The sequence similarities for the different SULT subtypes were calculated based on a
BLOSUM matrix (commonly used to score the evolutionary relationship between proteins), and
the results indicate similarities of about 70 % and 55 % between SULT1E1 and 2A1, and 1E1 and
1A1, respectively (coloured matrix in Figure 9). The sequential differences between the SULT
subtypes are also reflected in their RMSD values of Cα-atoms which suggest differences of up to
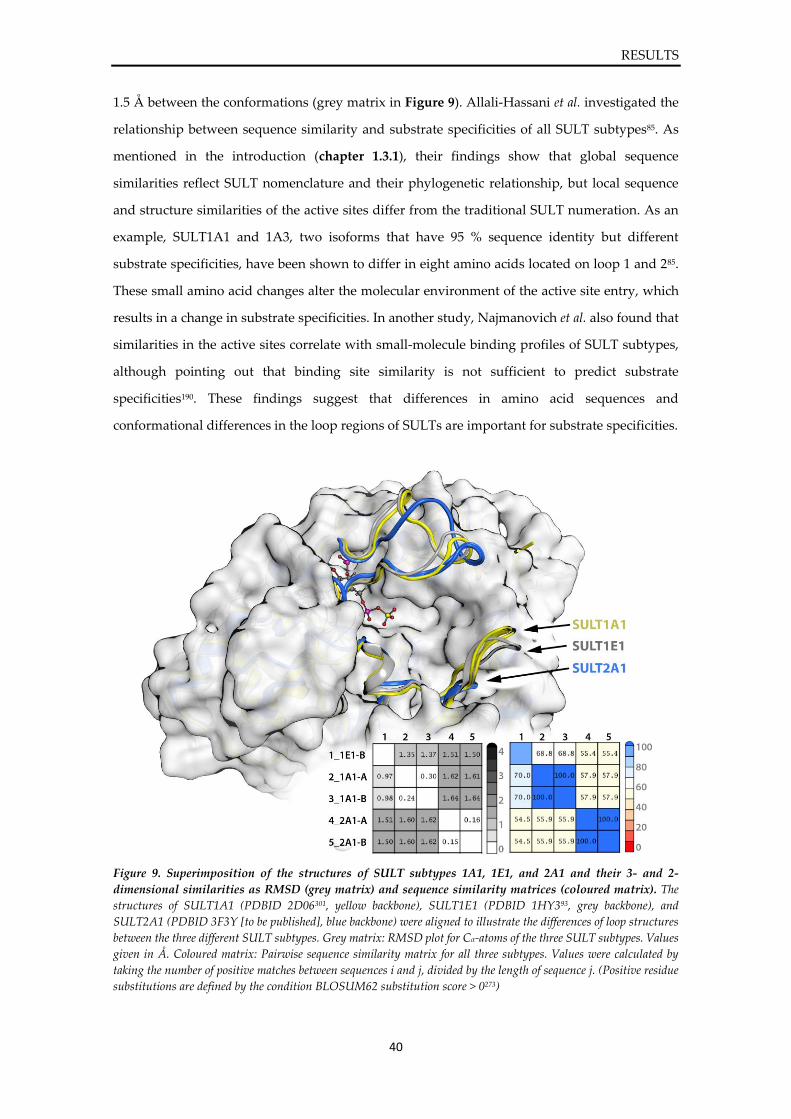
RESULTS
40
1.5 Å between the conformations (grey matrix in Figure 9). Allali-Hassani et al. investigated the
relationship between sequence similarity and substrate specificities of all SULT subtypes85. As
mentioned in the introduction (chapter 1.3.1), their findings show that global sequence
similarities reflect SULT nomenclature and their phylogenetic relationship, but local sequence
and structure similarities of the active sites differ from the traditional SULT numeration. As an
example, SULT1A1 and 1A3, two isoforms that have 95 % sequence identity but different
substrate specificities, have been shown to differ in eight amino acids located on loop 1 and 285.
These small amino acid changes alter the molecular environment of the active site entry, which
results in a change in substrate specificities. In another study, Najmanovich et al. also found that
similarities in the active sites correlate with small-molecule binding profiles of SULT subtypes,
although pointing out that binding site similarity is not sufficient to predict substrate
specificities190. These findings suggest that differences in amino acid sequences and
conformational differences in the loop regions of SULTs are important for substrate specificities.
Figure 9. Superimposition of the structures of SULT subtypes 1A1, 1E1, and 2A1 and their 3- and 2-
dimensional similarities as RMSD (grey matrix) and sequence similarity matrices (coloured matrix). The
structures of SULT1A1 (PDBID 2D06301, yellow backbone), SULT1E1 (PDBID 1HY393, grey backbone), and
SULT2A1 (PDBID 3F3Y [to be published], blue backbone) were aligned to illustrate the differences of loop structures
between the three different SULT subtypes. Grey matrix: RMSD plot for Cα-atoms of the three SULT subtypes. Values
given in Å. Coloured matrix: Pairwise sequence similarity matrix for all three subtypes. Values were calculated by
taking the number of positive matches between sequences i and j, divided by the length of sequence j. (Positive residue
substitutions are defined by the condition BLOSUM62 substitution score > 0273)
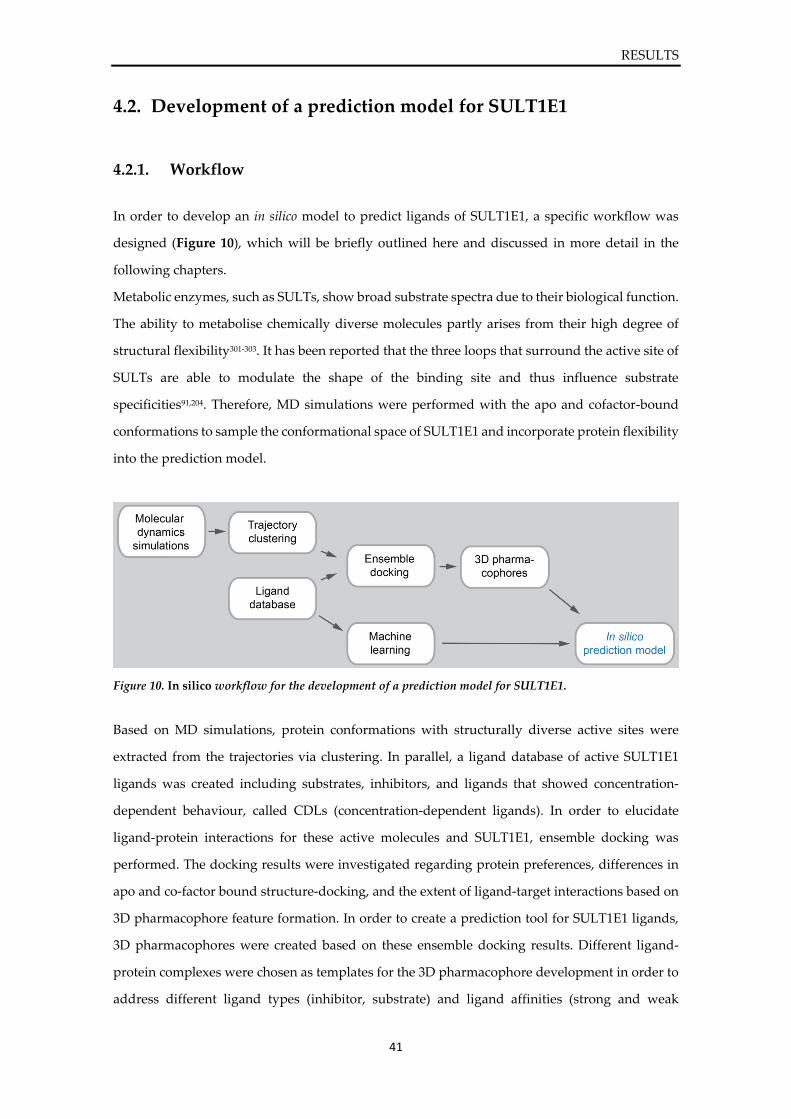
RESULTS
41
4.2. Development of a prediction model for SULT1E1
4.2.1. Workflow
In order to develop an in silico model to predict ligands of SULT1E1, a specific workflow was
designed (Figure 10), which will be briefly outlined here and discussed in more detail in the
following chapters.
Metabolic enzymes, such as SULTs, show broad substrate spectra due to their biological function.
The ability to metabolise chemically diverse molecules partly arises from their high degree of
structural flexibility301-303. It has been reported that the three loops that surround the active site of
SULTs are able to modulate the shape of the binding site and thus influence substrate
specificities91,204. Therefore, MD simulations were performed with the apo and cofactor-bound
conformations to sample the conformational space of SULT1E1 and incorporate protein flexibility
into the prediction model.
Figure 10. In silico workflow for the development of a prediction model for SULT1E1.
Based on MD simulations, protein conformations with structurally diverse active sites were
extracted from the trajectories via clustering. In parallel, a ligand database of active SULT1E1
ligands was created including substrates, inhibitors, and ligands that showed concentration-
dependent behaviour, called CDLs (concentration-dependent ligands). In order to elucidate
ligand-protein interactions for these active molecules and SULT1E1, ensemble docking was
performed. The docking results were investigated regarding protein preferences, differences in
apo and co-factor bound structure-docking, and the extent of ligand-target interactions based on
3D pharmacophore feature formation. In order to create a prediction tool for SULT1E1 ligands,
3D pharmacophores were created based on these ensemble docking results. Different ligand-
protein complexes were chosen as templates for the 3D pharmacophore development in order to
address different ligand types (inhibitor, substrate) and ligand affinities (strong and weak
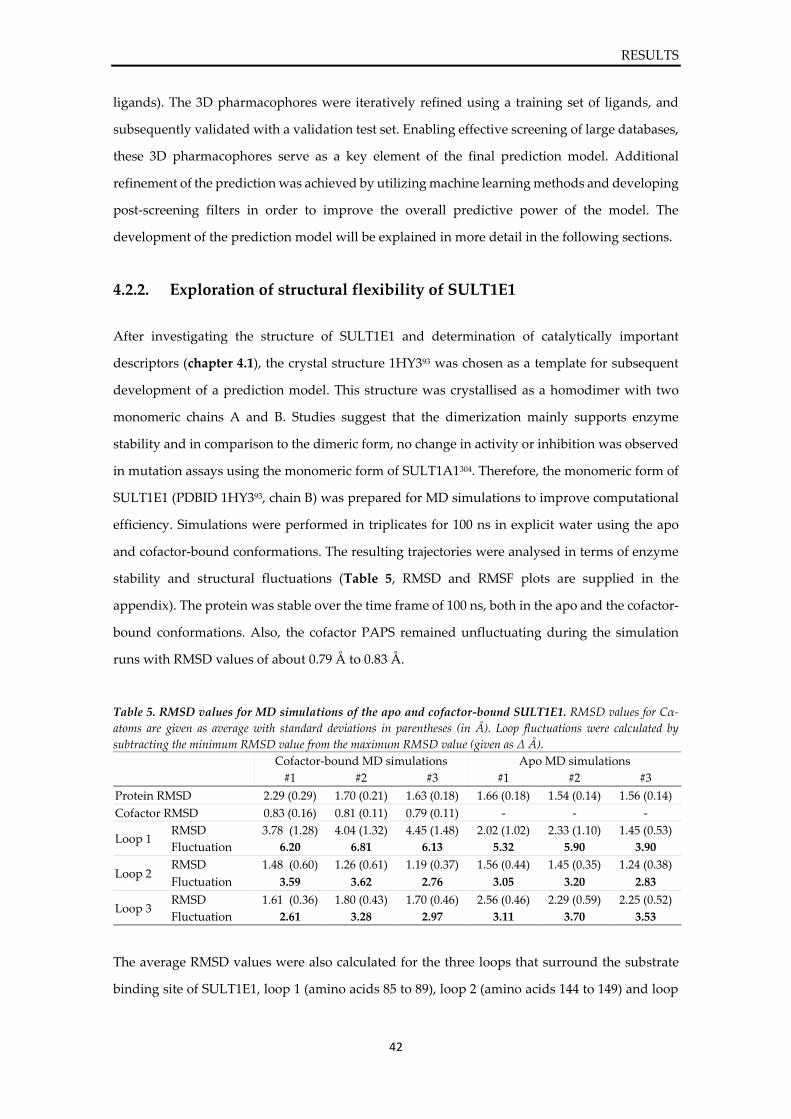
RESULTS
42
ligands). The 3D pharmacophores were iteratively refined using a training set of ligands, and
subsequently validated with a validation test set. Enabling effective screening of large databases,
these 3D pharmacophores serve as a key element of the final prediction model. Additional
refinement of the prediction was achieved by utilizing machine learning methods and developing
post-screening filters in order to improve the overall predictive power of the model. The
development of the prediction model will be explained in more detail in the following sections.
4.2.2. Exploration of structural flexibility of SULT1E1
After investigating the structure of SULT1E1 and determination of catalytically important
descriptors (chapter 4.1), the crystal structure 1HY393 was chosen as a template for subsequent
development of a prediction model. This structure was crystallised as a homodimer with two
monomeric chains A and B. Studies suggest that the dimerization mainly supports enzyme
stability and in comparison to the dimeric form, no change in activity or inhibition was observed
in mutation assays using the monomeric form of SULT1A1304. Therefore, the monomeric form of
SULT1E1 (PDBID 1HY393, chain B) was prepared for MD simulations to improve computational
efficiency. Simulations were performed in triplicates for 100 ns in explicit water using the apo
and cofactor-bound conformations. The resulting trajectories were analysed in terms of enzyme
stability and structural fluctuations (Table 5, RMSD and RMSF plots are supplied in the
appendix). The protein was stable over the time frame of 100 ns, both in the apo and the cofactor-
bound conformations. Also, the cofactor PAPS remained unfluctuating during the simulation
runs with RMSD values of about 0.79 Å to 0.83 Å.
Table 5. RMSD values for MD simulations of the apo and cofactor-bound SULT1E1. RMSD values for Cα-
atoms are given as average with standard deviations in parentheses (in Å). Loop fluctuations were calculated by
subtracting the minimum RMSD value from the maximum RMSD value (given as Δ Å).
The average RMSD values were also calculated for the three loops that surround the substrate
binding site of SULT1E1, loop 1 (amino acids 85 to 89), loop 2 (amino acids 144 to 149) and loop
Cofactor-bound MD simulations Apo MD simulations
#1 #2 #3 #1 #2 #3
Protein RMSD 2.29 (0.29) 1.70 (0.21) 1.63 (0.18) 1.66 (0.18) 1.54 (0.14) 1.56 (0.14)
Cofactor RMSD 0.83 (0.16) 0.81 (0.11) 0.79 (0.11) - - -
Loop 1 RMSD 3.78 (1.28) 4.04 (1.32) 4.45 (1.48) 2.02 (1.02) 2.33 (1.10) 1.45 (0.53)
Fluctuation 6.20 6.81 6.13 5.32 5.90 3.90
Loop 2 RMSD 1.48 (0.60) 1.26 (0.61) 1.19 (0.37) 1.56 (0.44) 1.45 (0.35) 1.24 (0.38)
Fluctuation 3.59 3.62 2.76 3.05 3.20 2.83
Loop 3 RMSD 1.61 (0.36) 1.80 (0.43) 1.70 (0.46) 2.56 (0.46) 2.29 (0.59) 2.25 (0.52)
Fluctuation 2.61 3.28 2.97 3.11 3.70 3.53
RESULTS
43
3 (amino acids 239 to 254). During the three cofactor-bound MD simulations, loop 1 showed
significantly higher RMSD values for the Cα-atoms, ranging between 3.78 Å and 4.45 Å,
compared to loop 2 and loop 3 (RMSDs of 1.19 – 1.48 Å and 1.61 – 1.80 Å, respectively). In contrast,
during the apo simulations, loops 1, 2, and 3 showed comparable RMSDs of 1.45 – 2.33 Å, 1.24 –
1.56 Å, and 2.25 – 2.56 Å, respectively. In addition to RMSD values of the three loops, the
fluctuation of a loop, which was defined as the maximum span of movement given by the
difference of maximum and minimum RMSD, were determined. Loop 2 and 3 showed medium
fluctuations between 2.6 Å and 3.7 Å, while loop 1 showed significantly larger movement with
fluctuations of about 6.1 Å to 6.8 Å for the cofactor-bound and 3.9 Å to 5.9 Å for the apo
simulations. The observed flexibility of the three loops is also depicted in Figure 11, upper part.
Loop 1 appeared to have significantly higher ranges of fluctuation compared to loop 2 and 3
which applies for both, apo and cofactor-bound, conformations. In a series of studies, the groups
of C.N. Falany and T.S. Leyh thoroughly investigated the relationship between cofactor binding
and loop 3 flexibility of SULT2A1. Their findings suggest that the active site flexibility and the
alternations between an open and a closed state are mainly caused by rearrangement of loop 3203.
Here, the MD simulations using SULT1E1 indicated major contributions to active site flexibility
by loop 1. Interestingly, loop 3 which spans over both the active and cofactor-binding sites
showed decoupled motion regarding the two parts of loop 3 (a segment spanning the cofactor-
binding site and a segment spanning the active site (see also Figure 3 for clarification)): During
apo simulations, the part of loop 3 that covers the cofactor-binding site detached from the protein
base and oscillated between an open and closed state (Figure 11, bottom left). Compared to apo
simulations, this part of loop 3 was highly stable and stayed in its closed conformation when
PAPS was bound (Figure 11, bottom right). The division of loop 3 into two segments, which was
also reported in studies by Cook et al.91,92, and its regulating character regarding cofactor binding
might influence the emergence of dead-end complexes, i.e. the enzyme bound to PAP, which
turns the enzyme into a catalytically incompetent state.
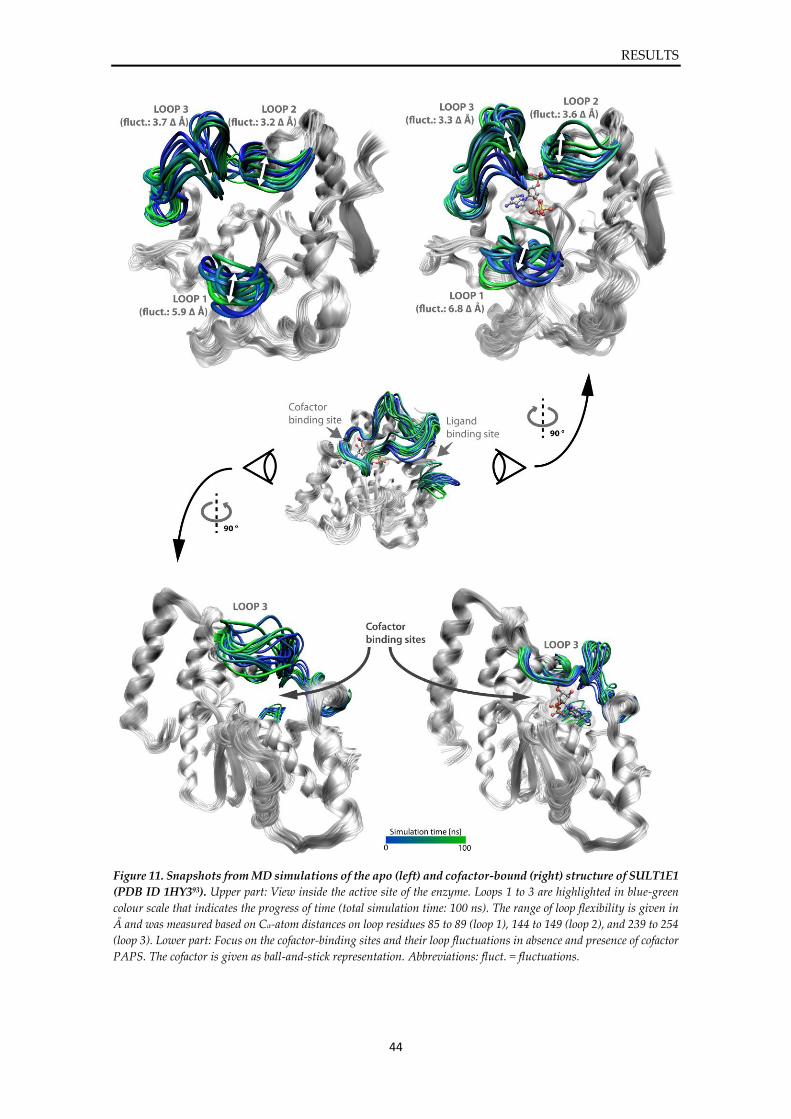
RESULTS
44
Figure 11. Snapshots from MD simulations of the apo (left) and cofactor-bound (right) structure of SULT1E1
(PDB ID 1HY393). Upper part: View inside the active site of the enzyme. Loops 1 to 3 are highlighted in blue-green
colour scale that indicates the progress of time (total simulation time: 100 ns). The range of loop flexibility is given in
Å and was measured based on Cα-atom distances on loop residues 85 to 89 (loop 1), 144 to 149 (loop 2), and 239 to 254
(loop 3). Lower part: Focus on the cofactor-binding sites and their loop fluctuations in absence and presence of cofactor
PAPS. The cofactor is given as ball-and-stick representation. Abbreviations: fluct. = fluctuations.
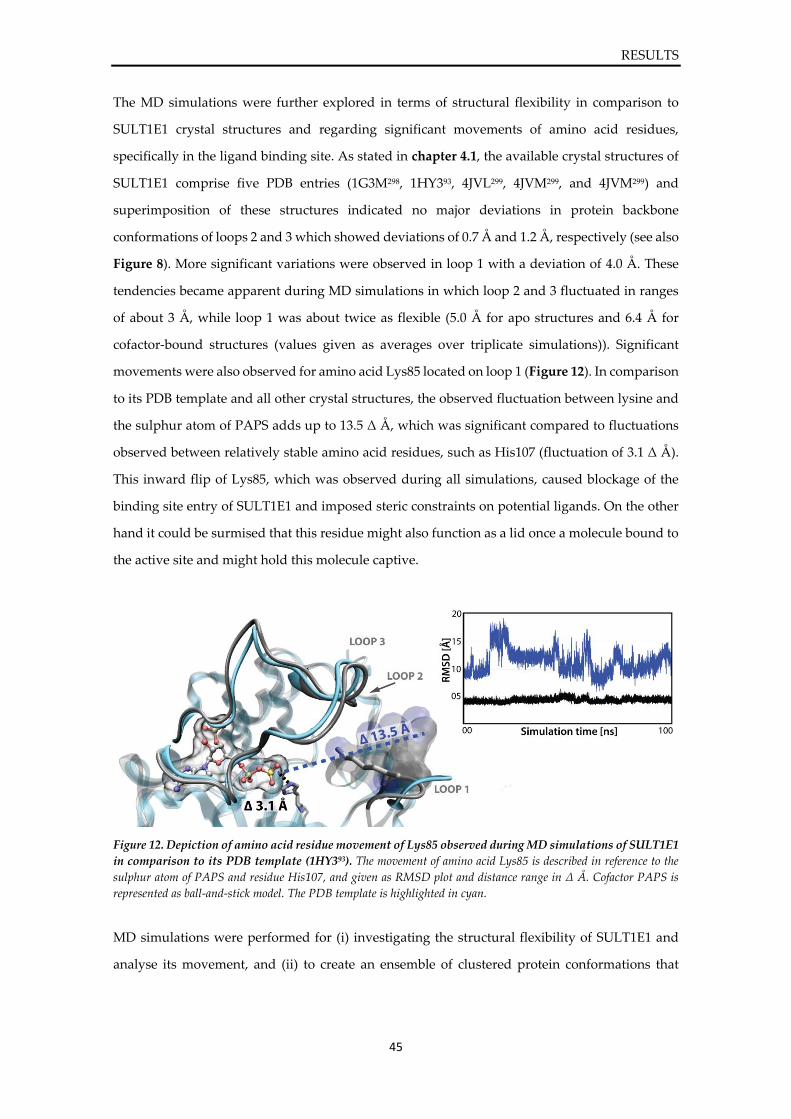
RESULTS
45
The MD simulations were further explored in terms of structural flexibility in comparison to
SULT1E1 crystal structures and regarding significant movements of amino acid residues,
specifically in the ligand binding site. As stated in chapter 4.1, the available crystal structures of
SULT1E1 comprise five PDB entries (1G3M298, 1HY393, 4JVL299, 4JVM299, and 4JVM299) and
superimposition of these structures indicated no major deviations in protein backbone
conformations of loops 2 and 3 which showed deviations of 0.7 Å and 1.2 Å, respectively (see also
Figure 8). More significant variations were observed in loop 1 with a deviation of 4.0 Å. These
tendencies became apparent during MD simulations in which loop 2 and 3 fluctuated in ranges
of about 3 Å, while loop 1 was about twice as flexible (5.0 Å for apo structures and 6.4 Å for
cofactor-bound structures (values given as averages over triplicate simulations)). Significant
movements were also observed for amino acid Lys85 located on loop 1 (Figure 12). In comparison
to its PDB template and all other crystal structures, the observed fluctuation between lysine and
the sulphur atom of PAPS adds up to 13.5 Δ Å, which was significant compared to fluctuations
observed between relatively stable amino acid residues, such as His107 (fluctuation of 3.1 Δ Å).
This inward flip of Lys85, which was observed during all simulations, caused blockage of the
binding site entry of SULT1E1 and imposed steric constraints on potential ligands. On the other
hand it could be surmised that this residue might also function as a lid once a molecule bound to
the active site and might hold this molecule captive.
Figure 12. Depiction of amino acid residue movement of Lys85 observed during MD simulations of SULT1E1
in comparison to its PDB template (1HY393). The movement of amino acid Lys85 is described in reference to the
sulphur atom of PAPS and residue His107, and given as RMSD plot and distance range in Δ Å. Cofactor PAPS is
represented as ball-and-stick model. The PDB template is highlighted in cyan.
MD simulations were performed for (i) investigating the structural flexibility of SULT1E1 and
analyse its movement, and (ii) to create an ensemble of clustered protein conformations that
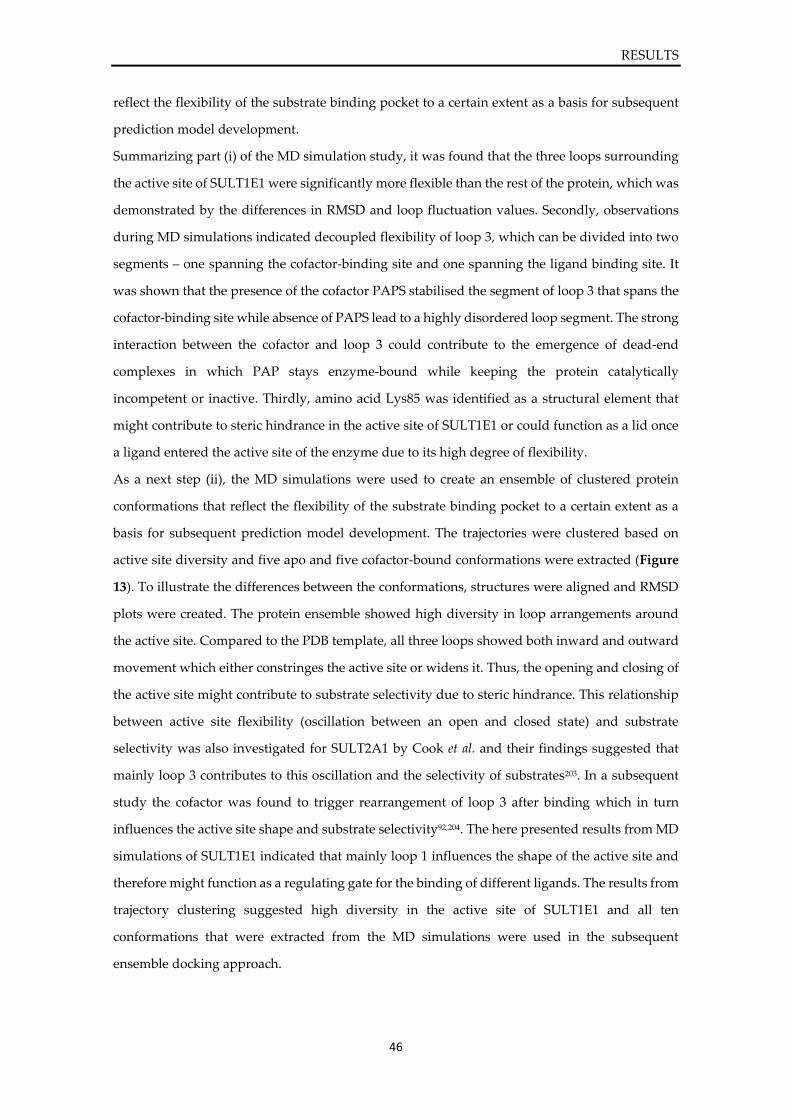
RESULTS
46
reflect the flexibility of the substrate binding pocket to a certain extent as a basis for subsequent
prediction model development.
Summarizing part (i) of the MD simulation study, it was found that the three loops surrounding
the active site of SULT1E1 were significantly more flexible than the rest of the protein, which was
demonstrated by the differences in RMSD and loop fluctuation values. Secondly, observations
during MD simulations indicated decoupled flexibility of loop 3, which can be divided into two
segments – one spanning the cofactor-binding site and one spanning the ligand binding site. It
was shown that the presence of the cofactor PAPS stabilised the segment of loop 3 that spans the
cofactor-binding site while absence of PAPS lead to a highly disordered loop segment. The strong
interaction between the cofactor and loop 3 could contribute to the emergence of dead-end
complexes in which PAP stays enzyme-bound while keeping the protein catalytically
incompetent or inactive. Thirdly, amino acid Lys85 was identified as a structural element that
might contribute to steric hindrance in the active site of SULT1E1 or could function as a lid once
a ligand entered the active site of the enzyme due to its high degree of flexibility.
As a next step (ii), the MD simulations were used to create an ensemble of clustered protein
conformations that reflect the flexibility of the substrate binding pocket to a certain extent as a
basis for subsequent prediction model development. The trajectories were clustered based on
active site diversity and five apo and five cofactor-bound conformations were extracted (Figure
13). To illustrate the differences between the conformations, structures were aligned and RMSD
plots were created. The protein ensemble showed high diversity in loop arrangements around
the active site. Compared to the PDB template, all three loops showed both inward and outward
movement which either constringes the active site or widens it. Thus, the opening and closing of
the active site might contribute to substrate selectivity due to steric hindrance. This relationship
between active site flexibility (oscillation between an open and closed state) and substrate
selectivity was also investigated for SULT2A1 by Cook et al. and their findings suggested that
mainly loop 3 contributes to this oscillation and the selectivity of substrates203. In a subsequent
study the cofactor was found to trigger rearrangement of loop 3 after binding which in turn
influences the active site shape and substrate selectivity92,204. The here presented results from MD
simulations of SULT1E1 indicated that mainly loop 1 influences the shape of the active site and
therefore might function as a regulating gate for the binding of different ligands. The results from
trajectory clustering suggested high diversity in the active site of SULT1E1 and all ten
conformations that were extracted from the MD simulations were used in the subsequent
ensemble docking approach.
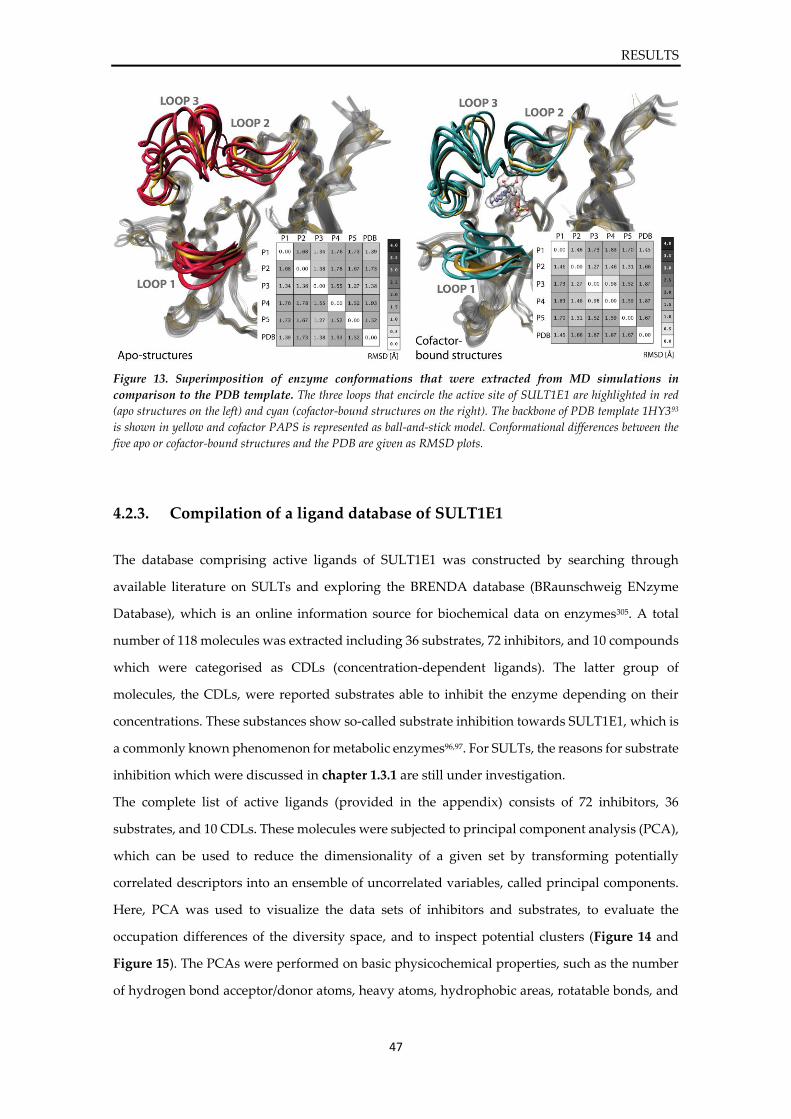
RESULTS
47
Figure 13. Superimposition of enzyme conformations that were extracted from MD simulations in
comparison to the PDB template. The three loops that encircle the active site of SULT1E1 are highlighted in red
(apo structures on the left) and cyan (cofactor-bound structures on the right). The backbone of PDB template 1HY393
is shown in yellow and cofactor PAPS is represented as ball-and-stick model. Conformational differences between the
five apo or cofactor-bound structures and the PDB are given as RMSD plots.
4.2.3. Compilation of a ligand database of SULT1E1
The database comprising active ligands of SULT1E1 was constructed by searching through
available literature on SULTs and exploring the BRENDA database (BRaunschweig ENzyme
Database), which is an online information source for biochemical data on enzymes305. A total
number of 118 molecules was extracted including 36 substrates, 72 inhibitors, and 10 compounds
which were categorised as CDLs (concentration-dependent ligands). The latter group of
molecules, the CDLs, were reported substrates able to inhibit the enzyme depending on their
concentrations. These substances show so-called substrate inhibition towards SULT1E1, which is
a commonly known phenomenon for metabolic enzymes96,97. For SULTs, the reasons for substrate
inhibition which were discussed in chapter 1.3.1 are still under investigation.
The complete list of active ligands (provided in the appendix) consists of 72 inhibitors, 36
substrates, and 10 CDLs. These molecules were subjected to principal component analysis (PCA),
which can be used to reduce the dimensionality of a given set by transforming potentially
correlated descriptors into an ensemble of uncorrelated variables, called principal components.
Here, PCA was used to visualize the data sets of inhibitors and substrates, to evaluate the
occupation differences of the diversity space, and to inspect potential clusters (Figure 14 and
Figure 15). The PCAs were performed on basic physicochemical properties, such as the number
of hydrogen bond acceptor/donor atoms, heavy atoms, hydrophobic areas, rotatable bonds, and
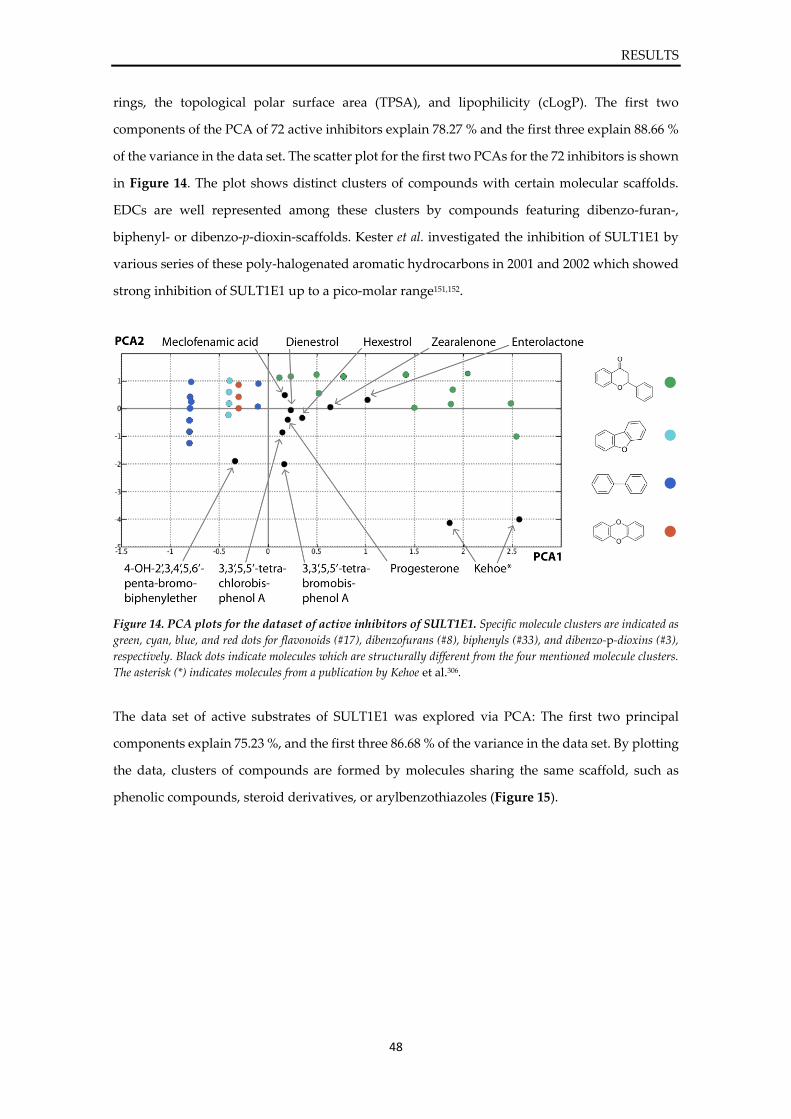
RESULTS
48
rings, the topological polar surface area (TPSA), and lipophilicity (cLogP). The first two
components of the PCA of 72 active inhibitors explain 78.27 % and the first three explain 88.66 %
of the variance in the data set. The scatter plot for the first two PCAs for the 72 inhibitors is shown
in Figure 14. The plot shows distinct clusters of compounds with certain molecular scaffolds.
EDCs are well represented among these clusters by compounds featuring dibenzo-furan-,
biphenyl- or dibenzo-p-dioxin-scaffolds. Kester et al. investigated the inhibition of SULT1E1 by
various series of these poly-halogenated aromatic hydrocarbons in 2001 and 2002 which showed
strong inhibition of SULT1E1 up to a pico-molar range151,152.
Figure 14. PCA plots for the dataset of active inhibitors of SULT1E1. Specific molecule clusters are indicated as
green, cyan, blue, and red dots for flavonoids (#17), dibenzofurans (#8), biphenyls (#33), and dibenzo-p-dioxins (#3),
respectively. Black dots indicate molecules which are structurally different from the four mentioned molecule clusters.
The asterisk (*) indicates molecules from a publication by Kehoe et al.306.
The data set of active substrates of SULT1E1 was explored via PCA: The first two principal
components explain 75.23 %, and the first three 86.68 % of the variance in the data set. By plotting
the data, clusters of compounds are formed by molecules sharing the same scaffold, such as
phenolic compounds, steroid derivatives, or arylbenzothiazoles (Figure 15).
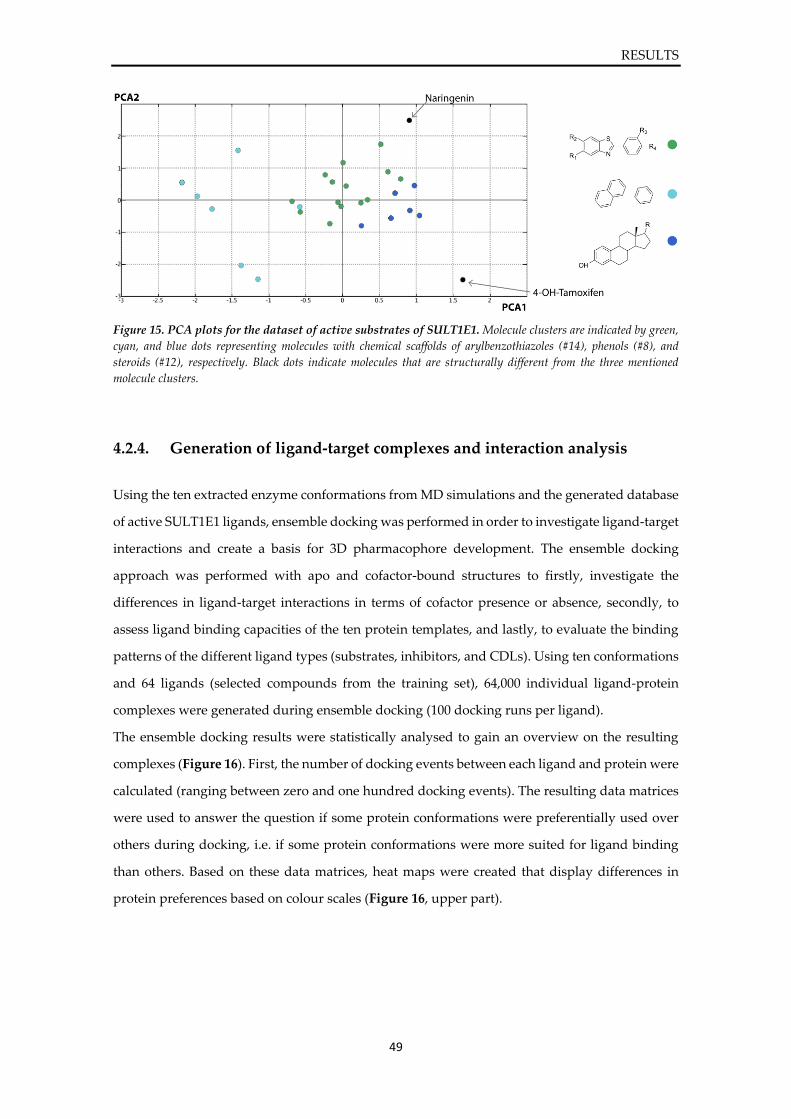
RESULTS
49
Figure 15. PCA plots for the dataset of active substrates of SULT1E1. Molecule clusters are indicated by green,
cyan, and blue dots representing molecules with chemical scaffolds of arylbenzothiazoles (#14), phenols (#8), and
steroids (#12), respectively. Black dots indicate molecules that are structurally different from the three mentioned
molecule clusters.
4.2.4. Generation of ligand-target complexes and interaction analysis
Using the ten extracted enzyme conformations from MD simulations and the generated database
of active SULT1E1 ligands, ensemble docking was performed in order to investigate ligand-target
interactions and create a basis for 3D pharmacophore development. The ensemble docking
approach was performed with apo and cofactor-bound structures to firstly, investigate the
differences in ligand-target interactions in terms of cofactor presence or absence, secondly, to
assess ligand binding capacities of the ten protein templates, and lastly, to evaluate the binding
patterns of the different ligand types (substrates, inhibitors, and CDLs). Using ten conformations
and 64 ligands (selected compounds from the training set), 64,000 individual ligand-protein
complexes were generated during ensemble docking (100 docking runs per ligand).
The ensemble docking results were statistically analysed to gain an overview on the resulting
complexes (Figure 16). First, the number of docking events between each ligand and protein were
calculated (ranging between zero and one hundred docking events). The resulting data matrices
were used to answer the question if some protein conformations were preferentially used over
others during docking, i.e. if some protein conformations were more suited for ligand binding
than others. Based on these data matrices, heat maps were created that display differences in
protein preferences based on colour scales (Figure 16, upper part).
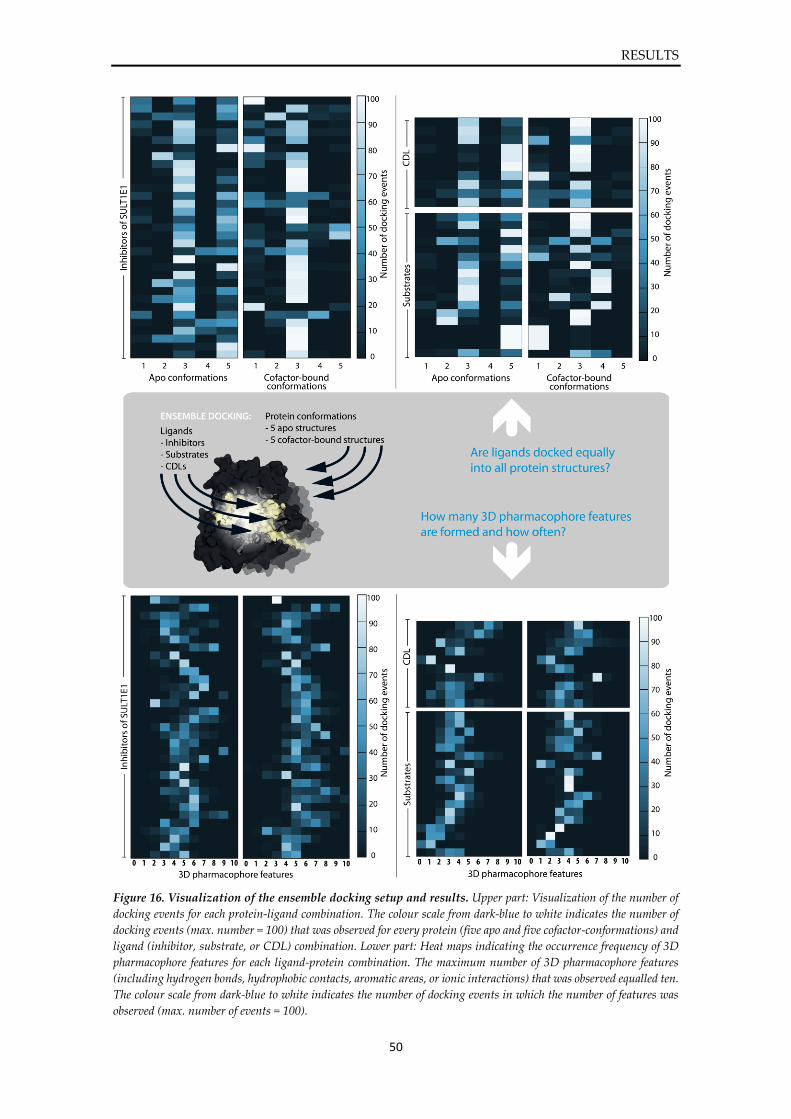
RESULTS
50
Figure 16. Visualization of the ensemble docking setup and results. Upper part: Visualization of the number of
docking events for each protein-ligand combination. The colour scale from dark-blue to white indicates the number of
docking events (max. number = 100) that was observed for every protein (five apo and five cofactor-conformations) and
ligand (inhibitor, substrate, or CDL) combination. Lower part: Heat maps indicating the occurrence frequency of 3D
pharmacophore features for each ligand-protein combination. The maximum number of 3D pharmacophore features
(including hydrogen bonds, hydrophobic contacts, aromatic areas, or ionic interactions) that was observed equalled ten.
The colour scale from dark-blue to white indicates the number of docking events in which the number of features was
observed (max. number of events = 100).
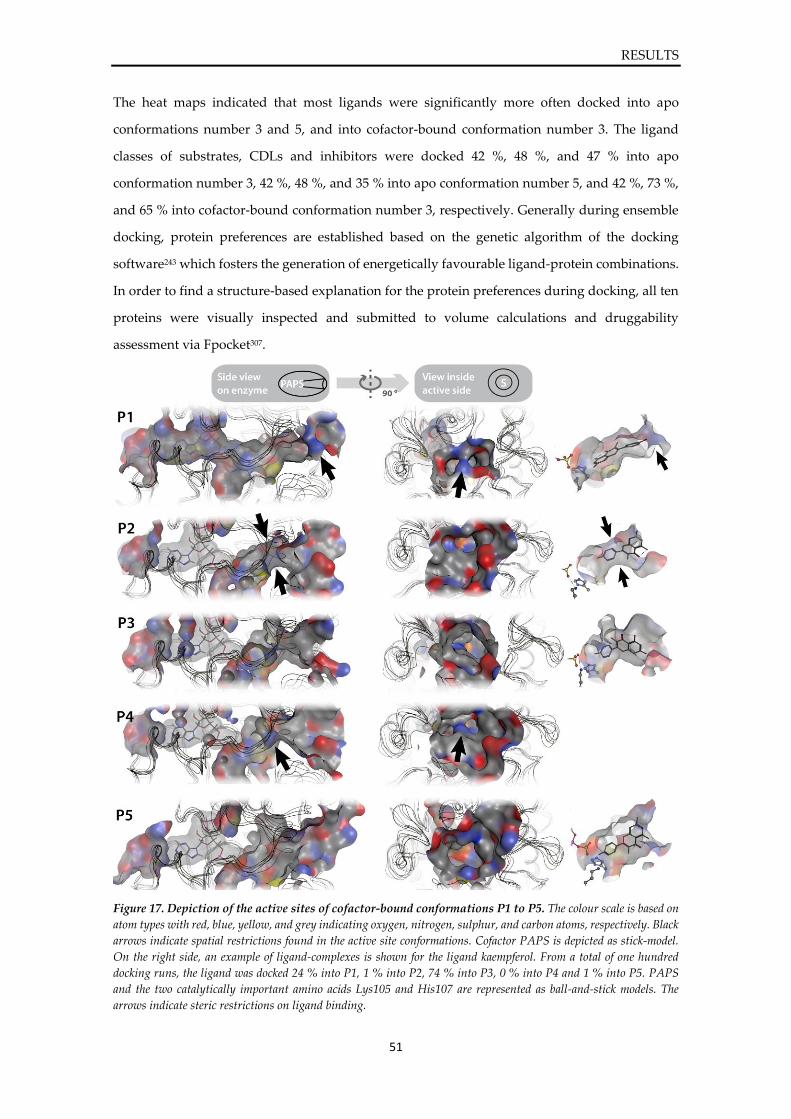
RESULTS
51
The heat maps indicated that most ligands were significantly more often docked into apo
conformations number 3 and 5, and into cofactor-bound conformation number 3. The ligand
classes of substrates, CDLs and inhibitors were docked 42 %, 48 %, and 47 % into apo
conformation number 3, 42 %, 48 %, and 35 % into apo conformation number 5, and 42 %, 73 %,
and 65 % into cofactor-bound conformation number 3, respectively. Generally during ensemble
docking, protein preferences are established based on the genetic algorithm of the docking
software243 which fosters the generation of energetically favourable ligand-protein combinations.
In order to find a structure-based explanation for the protein preferences during docking, all ten
proteins were visually inspected and submitted to volume calculations and druggability
assessment via Fpocket307.
Figure 17. Depiction of the active sites of cofactor-bound conformations P1 to P5. The colour scale is based on
atom types with red, blue, yellow, and grey indicating oxygen, nitrogen, sulphur, and carbon atoms, respectively. Black
arrows indicate spatial restrictions found in the active site conformations. Cofactor PAPS is depicted as stick-model.
On the right side, an example of ligand-complexes is shown for the ligand kaempferol. From a total of one hundred
docking runs, the ligand was docked 24 % into P1, 1 % into P2, 74 % into P3, 0 % into P4 and 1 % into P5. PAPS
and the two catalytically important amino acids Lys105 and His107 are represented as ball-and-stick models. The
arrows indicate steric restrictions on ligand binding.
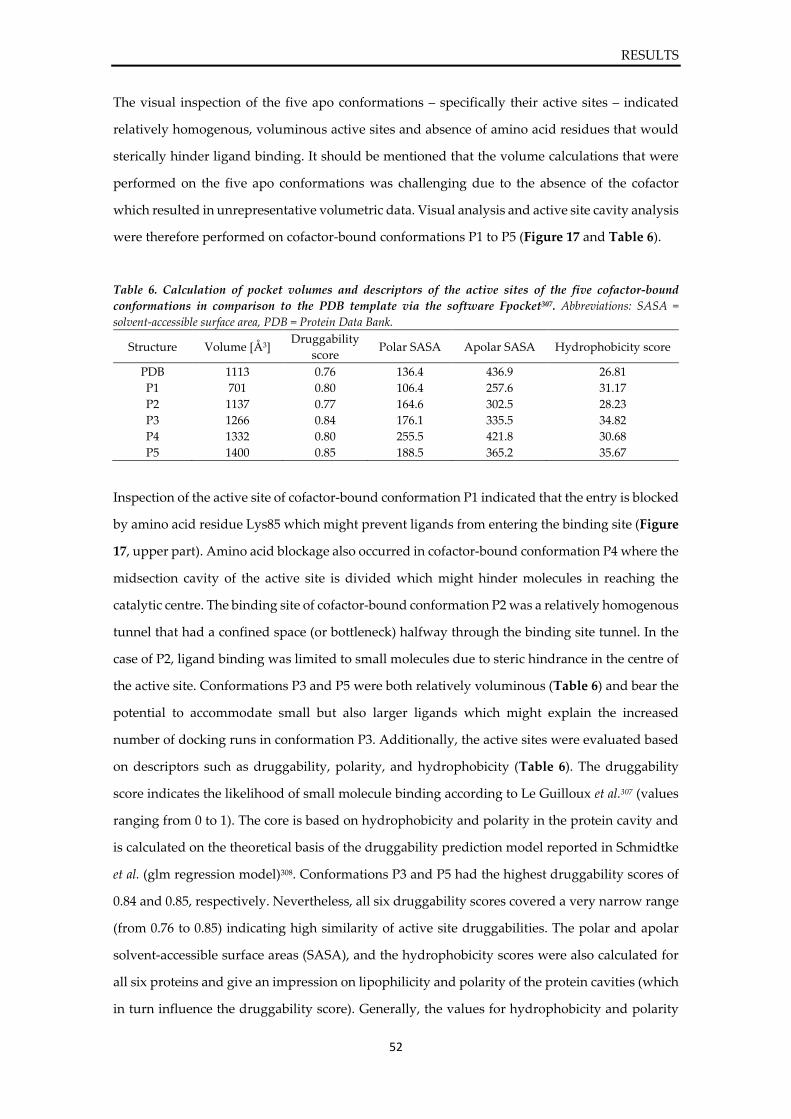
RESULTS
52
The visual inspection of the five apo conformations – specifically their active sites – indicated
relatively homogenous, voluminous active sites and absence of amino acid residues that would
sterically hinder ligand binding. It should be mentioned that the volume calculations that were
performed on the five apo conformations was challenging due to the absence of the cofactor
which resulted in unrepresentative volumetric data. Visual analysis and active site cavity analysis
were therefore performed on cofactor-bound conformations P1 to P5 (Figure 17 and Table 6).
Table 6. Calculation of pocket volumes and descriptors of the active sites of the five cofactor-bound
conformations in comparison to the PDB template via the software Fpocket307. Abbreviations: SASA =
solvent-accessible surface area, PDB = Protein Data Bank.
Inspection of the active site of cofactor-bound conformation P1 indicated that the entry is blocked
by amino acid residue Lys85 which might prevent ligands from entering the binding site (Figure
17, upper part). Amino acid blockage also occurred in cofactor-bound conformation P4 where the
midsection cavity of the active site is divided which might hinder molecules in reaching the
catalytic centre. The binding site of cofactor-bound conformation P2 was a relatively homogenous
tunnel that had a confined space (or bottleneck) halfway through the binding site tunnel. In the
case of P2, ligand binding was limited to small molecules due to steric hindrance in the centre of
the active site. Conformations P3 and P5 were both relatively voluminous (Table 6) and bear the
potential to accommodate small but also larger ligands which might explain the increased
number of docking runs in conformation P3. Additionally, the active sites were evaluated based
on descriptors such as druggability, polarity, and hydrophobicity (Table 6). The druggability
score indicates the likelihood of small molecule binding according to Le Guilloux et al.307 (values
ranging from 0 to 1). The core is based on hydrophobicity and polarity in the protein cavity and
is calculated on the theoretical basis of the druggability prediction model reported in Schmidtke
et al. (glm regression model)308. Conformations P3 and P5 had the highest druggability scores of
0.84 and 0.85, respectively. Nevertheless, all six druggability scores covered a very narrow range
(from 0.76 to 0.85) indicating high similarity of active site druggabilities. The polar and apolar
solvent-accessible surface areas (SASA), and the hydrophobicity scores were also calculated for
all six proteins and give an impression on lipophilicity and polarity of the protein cavities (which
in turn influence the druggability score). Generally, the values for hydrophobicity and polarity
Structure Volume [Å3] Druggability
score Polar SASA Apolar SASA Hydrophobicity score
PDB 1113 0.76 136.4 436.9 26.81
P1 701 0.80 106.4 257.6 31.17
P2 1137 0.77 164.6 302.5 28.23
P3 1266 0.84 176.1 335.5 34.82
P4 1332 0.80 255.5 421.8 30.68
P5 1400 0.85 188.5 365.2 35.67
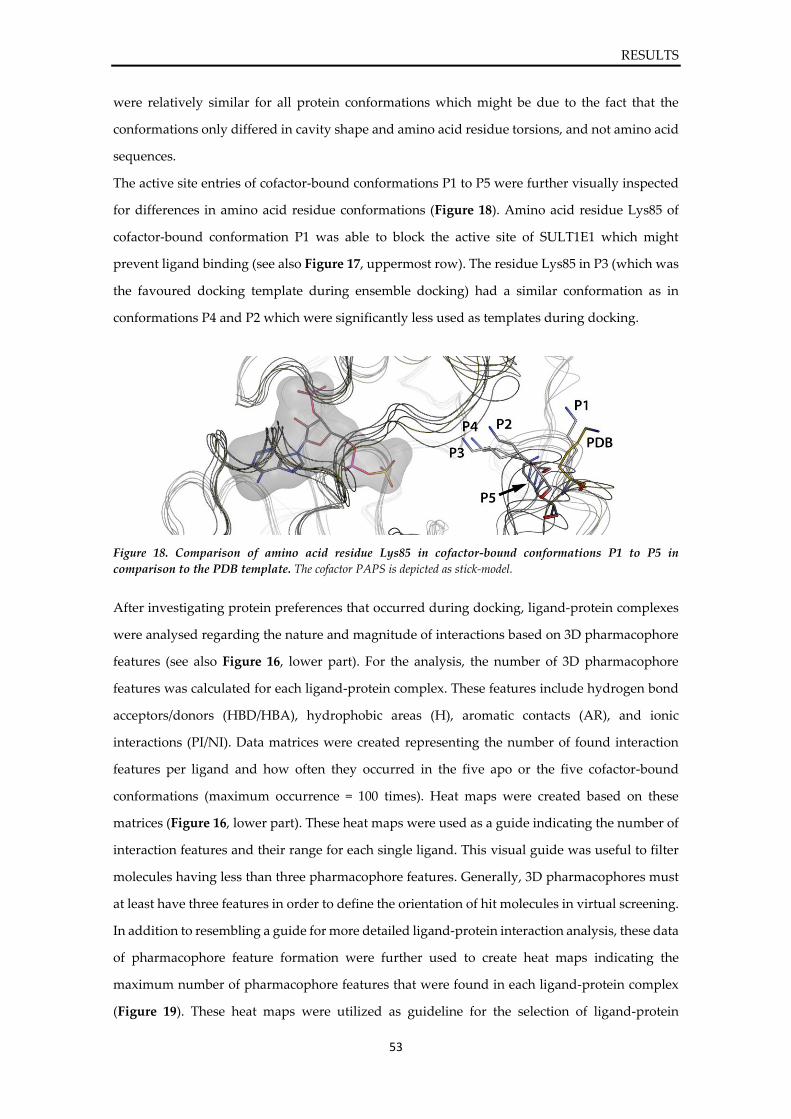
RESULTS
53
were relatively similar for all protein conformations which might be due to the fact that the
conformations only differed in cavity shape and amino acid residue torsions, and not amino acid
sequences.
The active site entries of cofactor-bound conformations P1 to P5 were further visually inspected
for differences in amino acid residue conformations (Figure 18). Amino acid residue Lys85 of
cofactor-bound conformation P1 was able to block the active site of SULT1E1 which might
prevent ligand binding (see also Figure 17, uppermost row). The residue Lys85 in P3 (which was
the favoured docking template during ensemble docking) had a similar conformation as in
conformations P4 and P2 which were significantly less used as templates during docking.
Figure 18. Comparison of amino acid residue Lys85 in cofactor-bound conformations P1 to P5 in
comparison to the PDB template. The cofactor PAPS is depicted as stick-model.
After investigating protein preferences that occurred during docking, ligand-protein complexes
were analysed regarding the nature and magnitude of interactions based on 3D pharmacophore
features (see also Figure 16, lower part). For the analysis, the number of 3D pharmacophore
features was calculated for each ligand-protein complex. These features include hydrogen bond
acceptors/donors (HBD/HBA), hydrophobic areas (H), aromatic contacts (AR), and ionic
interactions (PI/NI). Data matrices were created representing the number of found interaction
features per ligand and how often they occurred in the five apo or the five cofactor-bound
conformations (maximum occurrence = 100 times). Heat maps were created based on these
matrices (Figure 16, lower part). These heat maps were used as a guide indicating the number of
interaction features and their range for each single ligand. This visual guide was useful to filter
molecules having less than three pharmacophore features. Generally, 3D pharmacophores must
at least have three features in order to define the orientation of hit molecules in virtual screening.
In addition to resembling a guide for more detailed ligand-protein interaction analysis, these data
of pharmacophore feature formation were further used to create heat maps indicating the
maximum number of pharmacophore features that were found in each ligand-protein complex
(Figure 19). These heat maps were utilized as guideline for the selection of ligand-protein
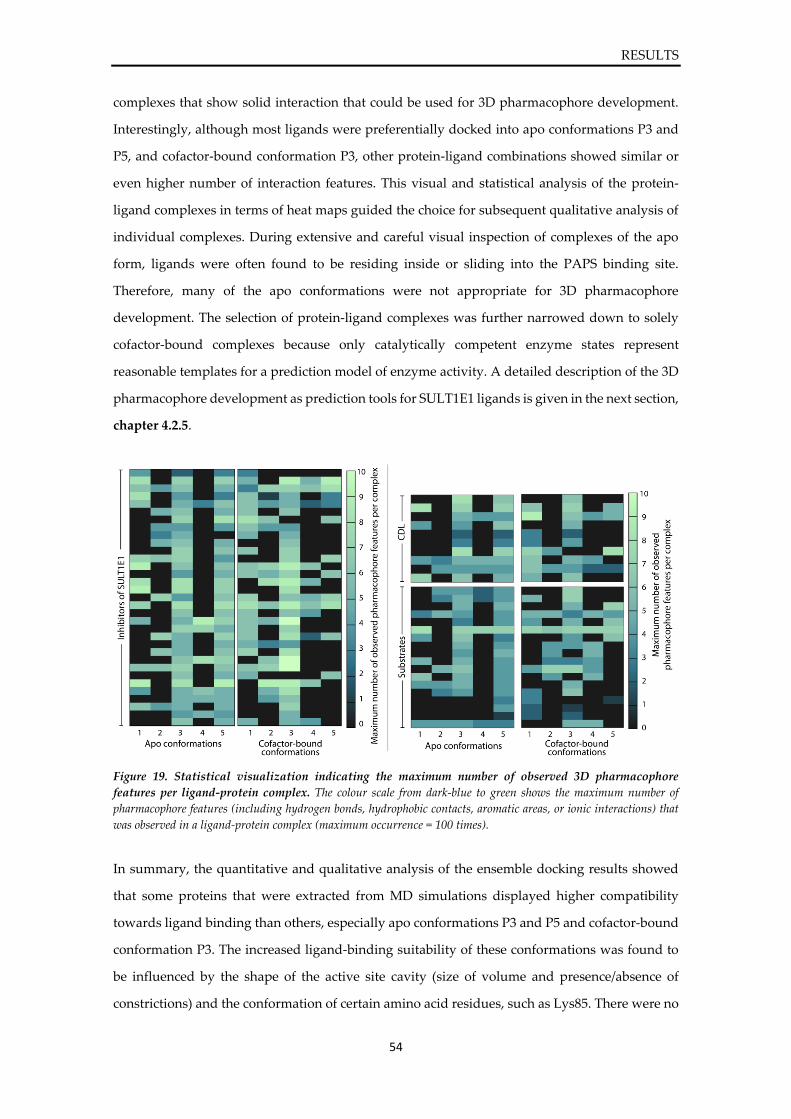
RESULTS
54
complexes that show solid interaction that could be used for 3D pharmacophore development.
Interestingly, although most ligands were preferentially docked into apo conformations P3 and
P5, and cofactor-bound conformation P3, other protein-ligand combinations showed similar or
even higher number of interaction features. This visual and statistical analysis of the protein-
ligand complexes in terms of heat maps guided the choice for subsequent qualitative analysis of
individual complexes. During extensive and careful visual inspection of complexes of the apo
form, ligands were often found to be residing inside or sliding into the PAPS binding site.
Therefore, many of the apo conformations were not appropriate for 3D pharmacophore
development. The selection of protein-ligand complexes was further narrowed down to solely
cofactor-bound complexes because only catalytically competent enzyme states represent
reasonable templates for a prediction model of enzyme activity. A detailed description of the 3D
pharmacophore development as prediction tools for SULT1E1 ligands is given in the next section,
chapter 4.2.5.
Figure 19. Statistical visualization indicating the maximum number of observed 3D pharmacophore
features per ligand-protein complex. The colour scale from dark-blue to green shows the maximum number of
pharmacophore features (including hydrogen bonds, hydrophobic contacts, aromatic areas, or ionic interactions) that
was observed in a ligand-protein complex (maximum occurrence = 100 times).
In summary, the quantitative and qualitative analysis of the ensemble docking results showed
that some proteins that were extracted from MD simulations displayed higher compatibility
towards ligand binding than others, especially apo conformations P3 and P5 and cofactor-bound
conformation P3. The increased ligand-binding suitability of these conformations was found to
be influenced by the shape of the active site cavity (size of volume and presence/absence of
constrictions) and the conformation of certain amino acid residues, such as Lys85. There were no
RESULTS
55
major differences in ensemble docking results regarding the presence or absence of the cofactor,
except that in some instances, ligands were docked (partially) into the cofactor-binding site. In
general, the results did not indicate general differences in protein preferences regarding the
nature of the ligand (substrate, inhibitor, or CDL) since most molecules had similar protein
preferences. Further, the number of interaction features formed between docked ligands and the
protein templates did not vary significantly comparing apo and cofactor-bound templates. All in
all, the statistical visualization of the ensemble docking results (heat maps) provided useful
guidance for subsequent 3D pharmacophore development.
4.2.5. Development and validation of 3D pharmacophores of SULT1E1
The statistical analysis (heat maps) of the ligand-protein complexes created during ensemble
docking guided the choice of appropriate docking complexes for 3D pharmacophore
development serving as prediction tools for SULT1E1 ligands. Because docking scoring functions
have commonly known issues of unreliability260, the pharmacophore fit of a ligand
complemented careful visual inspection of the protein-ligand complexes and provided guidance
in choosing plausible ligand conformations for 3D pharmacophore development. As mentioned
before, only cofactor-bound conformations were considered for 3D pharmacophore development
since catalytic competency of the enzyme was considered as prerequisite for a predictive model.
An important criterion for plausible ligand conformations in the active site of SULT1E1 was the
physical distance between the hydroxyl group of the ligands and the catalytically active amino
acid His107 and the sulphur atom of cofactor PAPS. During sulfonation, the deprotonation of the
substrate hydroxyl group by His107 triggers the nucleophilic attack of the substrate oxygen
towards the sulphur atom of PAPS. This reaction is facilitated by residues Lys105 and Lys47. The
selection criterion of having a close distance between the hydroxyl group of the ligand and the
catalytic centre was applied not only to substrates of SULT1E1 but to all ligands (substrates,
CDLs, and inhibitors). This stands in contrast with the study of Cook et al. who developed a
prediction model for SULT1A1 and 2A1 that was based on a distance cut-off of < 4 Å for substrates
and > 4 Å for inhibitors of the enzymes188. The here stated hypothesis that substrates and
inhibitors do not differ in binding conformation is supported by inspection of available crystal
structures of SULT1E1 (Figure 20). The three crystal structures 1G3M298, 4JVM299, and 4JVN299
were crystallised in complex with strong inhibitors of SULT1E1, and crystal structure 4JVL299 in
complex with high-affinity substrate E2 (see also Table 4). The 3D pharmacophore analysis of all
four crystallised conformations revealed similar binding patterns and distances of the substrates
and inhibitors regardless of their molecular nature (inducing enzyme inhibition or sulfonation).
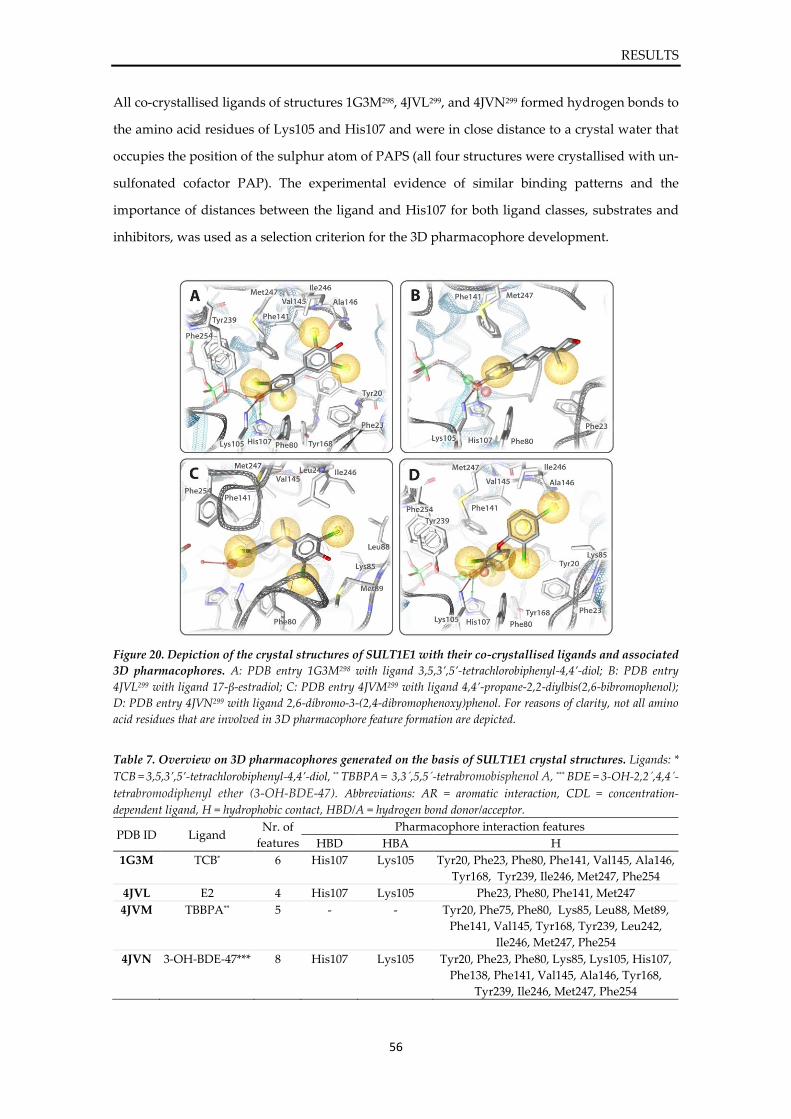
RESULTS
56
All co-crystallised ligands of structures 1G3M298, 4JVL299, and 4JVN299 formed hydrogen bonds to
the amino acid residues of Lys105 and His107 and were in close distance to a crystal water that
occupies the position of the sulphur atom of PAPS (all four structures were crystallised with un-
sulfonated cofactor PAP). The experimental evidence of similar binding patterns and the
importance of distances between the ligand and His107 for both ligand classes, substrates and
inhibitors, was used as a selection criterion for the 3D pharmacophore development.
Figure 20. Depiction of the crystal structures of SULT1E1 with their co-crystallised ligands and associated
3D pharmacophores. A: PDB entry 1G3M298 with ligand 3,5,3’,5’-tetrachlorobiphenyl-4,4’-diol; B: PDB entry
4JVL299 with ligand 17-β-estradiol; C: PDB entry 4JVM299 with ligand 4,4’-propane-2,2-diylbis(2,6-bibromophenol);
D: PDB entry 4JVN299 with ligand 2,6-dibromo-3-(2,4-dibromophenoxy)phenol. For reasons of clarity, not all amino
acid residues that are involved in 3D pharmacophore feature formation are depicted.
Table 7. Overview on 3D pharmacophores generated on the basis of SULT1E1 crystal structures. Ligands: *
TCB = 3,5,3’,5’-tetrachlorobiphenyl-4,4’-diol, ** TBBPA = 3,3´,5,5´-tetrabromobisphenol A, *** BDE = 3-OH-2,2´,4,4´-
tetrabromodiphenyl ether (3-OH-BDE-47). Abbreviations: AR = aromatic interaction, CDL = concentration-
dependent ligand, H = hydrophobic contact, HBD/A = hydrogen bond donor/acceptor.
PDB ID Ligand Nr. of
features
Pharmacophore interaction features
HBD HBA H
1G3M TCB* 6 His107 Lys105 Tyr20, Phe23, Phe80, Phe141, Val145, Ala146,
Tyr168, Tyr239, Ile246, Met247, Phe254
4JVL E2 4 His107 Lys105 Phe23, Phe80, Phe141, Met247
4JVM TBBPA** 5 - - Tyr20, Phe75, Phe80, Lys85, Leu88, Met89,
Phe141, Val145, Tyr168, Tyr239, Leu242,
Ile246, Met247, Phe254
4JVN 3-OH-BDE-47*** 8 His107 Lys105 Tyr20, Phe23, Phe80, Lys85, Lys105, His107,
Phe138, Phe141, Val145, Ala146, Tyr168,
Tyr239, Ile246, Met247, Phe254
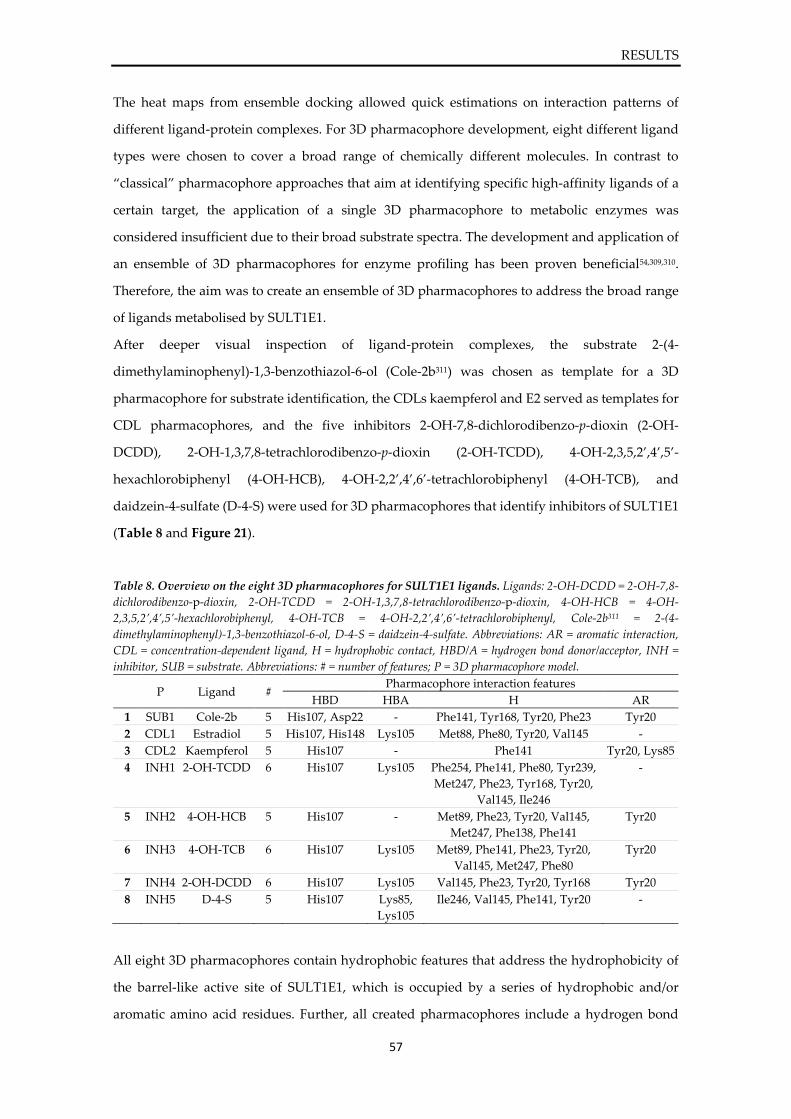
RESULTS
57
The heat maps from ensemble docking allowed quick estimations on interaction patterns of
different ligand-protein complexes. For 3D pharmacophore development, eight different ligand
types were chosen to cover a broad range of chemically different molecules. In contrast to
“classical” pharmacophore approaches that aim at identifying specific high-affinity ligands of a
certain target, the application of a single 3D pharmacophore to metabolic enzymes was
considered insufficient due to their broad substrate spectra. The development and application of
an ensemble of 3D pharmacophores for enzyme profiling has been proven beneficial54,309,310.
Therefore, the aim was to create an ensemble of 3D pharmacophores to address the broad range
of ligands metabolised by SULT1E1.
After deeper visual inspection of ligand-protein complexes, the substrate 2-(4-
dimethylaminophenyl)-1,3-benzothiazol-6-ol (Cole-2b311) was chosen as template for a 3D
pharmacophore for substrate identification, the CDLs kaempferol and E2 served as templates for
CDL pharmacophores, and the five inhibitors 2-OH-7,8-dichlorodibenzo-p-dioxin (2-OH-
DCDD), 2-OH-1,3,7,8-tetrachlorodibenzo-p-dioxin (2-OH-TCDD), 4-OH-2,3,5,2’,4’,5’-
hexachlorobiphenyl (4-OH-HCB), 4-OH-2,2’,4’,6’-tetrachlorobiphenyl (4-OH-TCB), and
daidzein-4-sulfate (D-4-S) were used for 3D pharmacophores that identify inhibitors of SULT1E1
(Table 8 and Figure 21).
Table 8. Overview on the eight 3D pharmacophores for SULT1E1 ligands. Ligands: 2-OH-DCDD = 2-OH-7,8-
dichlorodibenzo-p-dioxin, 2-OH-TCDD = 2-OH-1,3,7,8-tetrachlorodibenzo-p-dioxin, 4-OH-HCB = 4-OH-
2,3,5,2’,4’,5’-hexachlorobiphenyl, 4-OH-TCB = 4-OH-2,2’,4’,6’-tetrachlorobiphenyl, Cole-2b311 = 2-(4-
dimethylaminophenyl)-1,3-benzothiazol-6-ol, D-4-S = daidzein-4-sulfate. Abbreviations: AR = aromatic interaction,
CDL = concentration-dependent ligand, H = hydrophobic contact, HBD/A = hydrogen bond donor/acceptor, INH =
inhibitor, SUB = substrate. Abbreviations: # = number of features; P = 3D pharmacophore model.
All eight 3D pharmacophores contain hydrophobic features that address the hydrophobicity of
the barrel-like active site of SULT1E1, which is occupied by a series of hydrophobic and/or
aromatic amino acid residues. Further, all created pharmacophores include a hydrogen bond
P Ligand # Pharmacophore interaction features
HBD HBA H AR
1 SUB1 Cole-2b 5 His107, Asp22 - Phe141, Tyr168, Tyr20, Phe23 Tyr20
2 CDL1 Estradiol 5 His107, His148 Lys105 Met88, Phe80, Tyr20, Val145 -
3 CDL2 Kaempferol 5 His107 - Phe141 Tyr20, Lys85
4 INH1 2-OH-TCDD 6 His107 Lys105 Phe254, Phe141, Phe80, Tyr239,
Met247, Phe23, Tyr168, Tyr20,
Val145, Ile246
-
5 INH2 4-OH-HCB 5 His107 - Met89, Phe23, Tyr20, Val145,
Met247, Phe138, Phe141
Tyr20
6 INH3 4-OH-TCB 6 His107 Lys105 Met89, Phe141, Phe23, Tyr20,
Val145, Met247, Phe80
Tyr20
7 INH4 2-OH-DCDD 6 His107 Lys105 Val145, Phe23, Tyr20, Tyr168 Tyr20
8 INH5 D-4-S 5 His107 Lys85,
Lys105
Ile246, Val145, Phe141, Tyr20 -
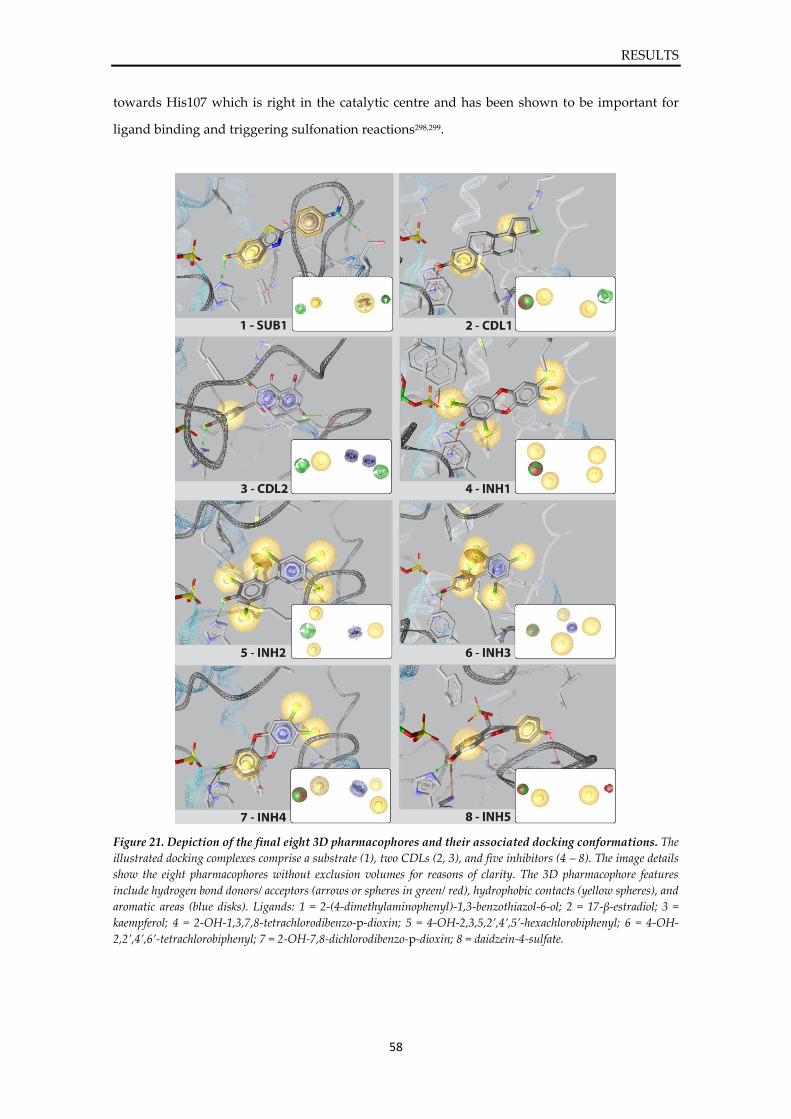
RESULTS
58
towards His107 which is right in the catalytic centre and has been shown to be important for
ligand binding and triggering sulfonation reactions298,299.
Figure 21. Depiction of the final eight 3D pharmacophores and their associated docking conformations. The
illustrated docking complexes comprise a substrate (1), two CDLs (2, 3), and five inhibitors (4 – 8). The image details
show the eight pharmacophores without exclusion volumes for reasons of clarity. The 3D pharmacophore features
include hydrogen bond donors/ acceptors (arrows or spheres in green/ red), hydrophobic contacts (yellow spheres), and
aromatic areas (blue disks). Ligands: 1 = 2-(4-dimethylaminophenyl)-1,3-benzothiazol-6-ol; 2 = 17-β-estradiol; 3 =
kaempferol; 4 = 2-OH-1,3,7,8-tetrachlorodibenzo-p-dioxin; 5 = 4-OH-2,3,5,2’,4’,5’-hexachlorobiphenyl; 6 = 4-OH-
2,2’,4’,6’-tetrachlorobiphenyl; 7 = 2-OH-7,8-dichlorodibenzo-p-dioxin; 8 = daidzein-4-sulfate.
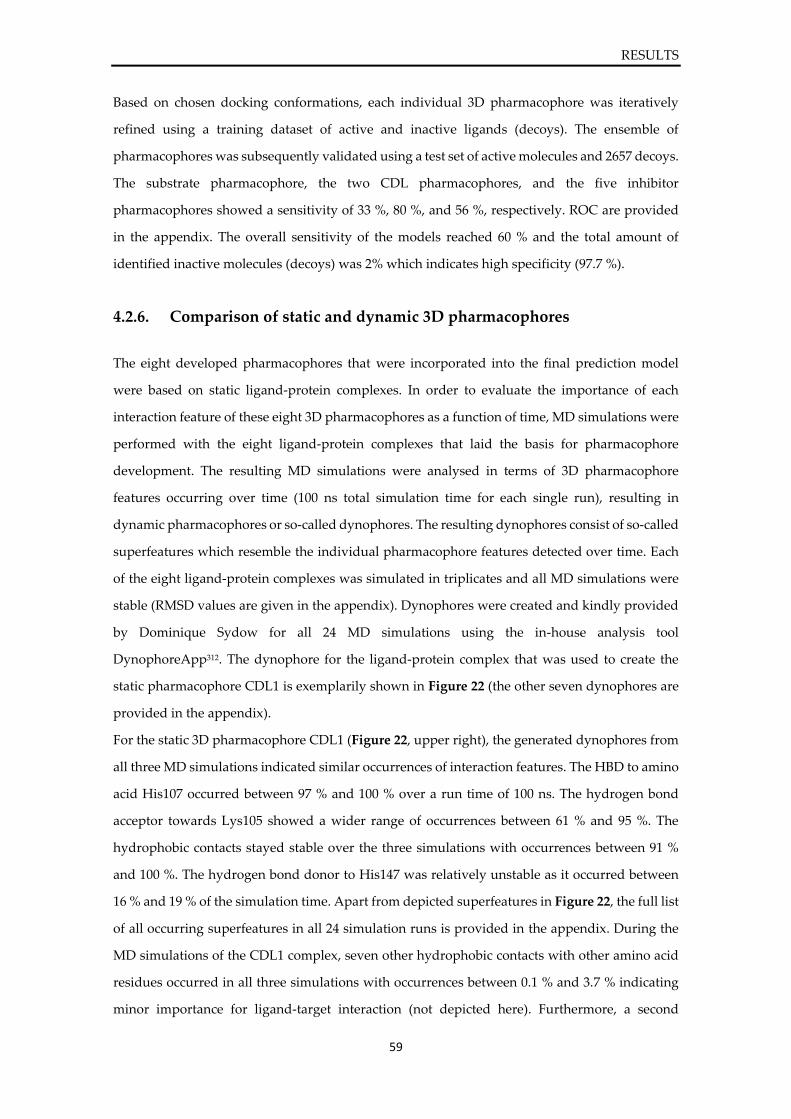
RESULTS
59
Based on chosen docking conformations, each individual 3D pharmacophore was iteratively
refined using a training dataset of active and inactive ligands (decoys). The ensemble of
pharmacophores was subsequently validated using a test set of active molecules and 2657 decoys.
The substrate pharmacophore, the two CDL pharmacophores, and the five inhibitor
pharmacophores showed a sensitivity of 33 %, 80 %, and 56 %, respectively. ROC are provided
in the appendix. The overall sensitivity of the models reached 60 % and the total amount of
identified inactive molecules (decoys) was 2% which indicates high specificity (97.7 %).
4.2.6. Comparison of static and dynamic 3D pharmacophores
The eight developed pharmacophores that were incorporated into the final prediction model
were based on static ligand-protein complexes. In order to evaluate the importance of each
interaction feature of these eight 3D pharmacophores as a function of time, MD simulations were
performed with the eight ligand-protein complexes that laid the basis for pharmacophore
development. The resulting MD simulations were analysed in terms of 3D pharmacophore
features occurring over time (100 ns total simulation time for each single run), resulting in
dynamic pharmacophores or so-called dynophores. The resulting dynophores consist of so-called
superfeatures which resemble the individual pharmacophore features detected over time. Each
of the eight ligand-protein complexes was simulated in triplicates and all MD simulations were
stable (RMSD values are given in the appendix). Dynophores were created and kindly provided
by Dominique Sydow for all 24 MD simulations using the in-house analysis tool
DynophoreApp312. The dynophore for the ligand-protein complex that was used to create the
static pharmacophore CDL1 is exemplarily shown in Figure 22 (the other seven dynophores are
provided in the appendix).
For the static 3D pharmacophore CDL1 (Figure 22, upper right), the generated dynophores from
all three MD simulations indicated similar occurrences of interaction features. The HBD to amino
acid His107 occurred between 97 % and 100 % over a run time of 100 ns. The hydrogen bond
acceptor towards Lys105 showed a wider range of occurrences between 61 % and 95 %. The
hydrophobic contacts stayed stable over the three simulations with occurrences between 91 %
and 100 %. The hydrogen bond donor to His147 was relatively unstable as it occurred between
16 % and 19 % of the simulation time. Apart from depicted superfeatures in Figure 22, the full list
of all occurring superfeatures in all 24 simulation runs is provided in the appendix. During the
MD simulations of the CDL1 complex, seven other hydrophobic contacts with other amino acid
residues occurred in all three simulations with occurrences between 0.1 % and 3.7 % indicating
minor importance for ligand-target interaction (not depicted here). Furthermore, a second
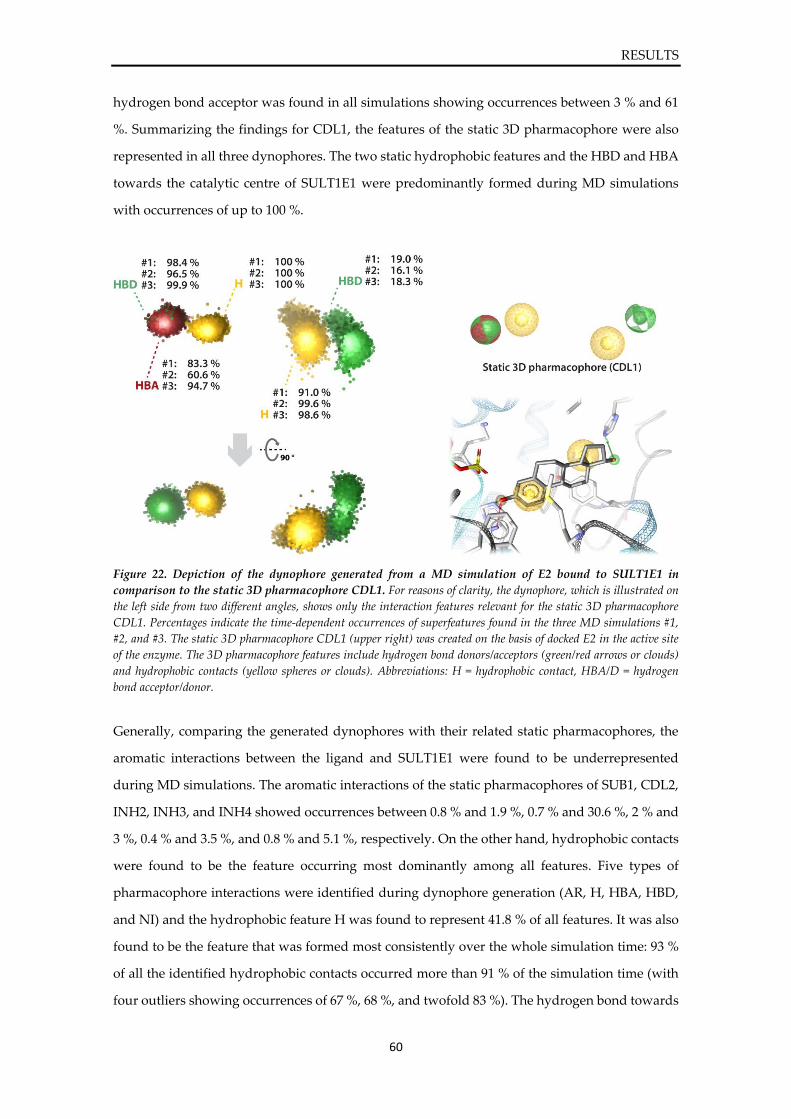
RESULTS
60
hydrogen bond acceptor was found in all simulations showing occurrences between 3 % and 61
%. Summarizing the findings for CDL1, the features of the static 3D pharmacophore were also
represented in all three dynophores. The two static hydrophobic features and the HBD and HBA
towards the catalytic centre of SULT1E1 were predominantly formed during MD simulations
with occurrences of up to 100 %.
Figure 22. Depiction of the dynophore generated from a MD simulation of E2 bound to SULT1E1 in
comparison to the static 3D pharmacophore CDL1. For reasons of clarity, the dynophore, which is illustrated on
the left side from two different angles, shows only the interaction features relevant for the static 3D pharmacophore
CDL1. Percentages indicate the time-dependent occurrences of superfeatures found in the three MD simulations #1,
#2, and #3. The static 3D pharmacophore CDL1 (upper right) was created on the basis of docked E2 in the active site
of the enzyme. The 3D pharmacophore features include hydrogen bond donors/acceptors (green/red arrows or clouds)
and hydrophobic contacts (yellow spheres or clouds). Abbreviations: H = hydrophobic contact, HBA/D = hydrogen
bond acceptor/donor.
Generally, comparing the generated dynophores with their related static pharmacophores, the
aromatic interactions between the ligand and SULT1E1 were found to be underrepresented
during MD simulations. The aromatic interactions of the static pharmacophores of SUB1, CDL2,
INH2, INH3, and INH4 showed occurrences between 0.8 % and 1.9 %, 0.7 % and 30.6 %, 2 % and
3 %, 0.4 % and 3.5 %, and 0.8 % and 5.1 %, respectively. On the other hand, hydrophobic contacts
were found to be the feature occurring most dominantly among all features. Five types of
pharmacophore interactions were identified during dynophore generation (AR, H, HBA, HBD,
and NI) and the hydrophobic feature H was found to represent 41.8 % of all features. It was also
found to be the feature that was formed most consistently over the whole simulation time: 93 %
of all the identified hydrophobic contacts occurred more than 91 % of the simulation time (with
four outliers showing occurrences of 67 %, 68 %, and twofold 83 %). The hydrogen bond towards
RESULTS
61
His107 was considered essential in all eight static pharmacophores. This feature was formed
during all 24 MD simulations, though the occurrence percentages widely fluctuated with values
ranging between 32 % and 70 % for SUB1, 97 % and 100 % for CDL1, 56 % and 90 % for CDL2, 40
% and 75 % for INH1, 0.1 % and 95 % for INH2, 93 % and 100 % for INH3, 52 % and 67 % for
INH4, and 8 % and 95 % for INH5.
In general, the features occurring in the 24 dynophores, which were generated on the basis of MD
simulations of the ligand-protein complexes that were used as templates for the creation of the
eight, static 3D pharmacophores, were comparable with the features of the static
pharmacophores. Hydrophobic contacts occurred most dominantly among all features and were
also formed more consistently over the whole simulation time. The catalytically important
hydrogen bond donor towards His107 was represented in all dynophores, although showing
large fluctuations in occurrence percentages.
It should be noted that MD simulations were executed in triplicates and not all trajectories
showed stability of the ligand in the binding site of SULT1E1. In some cases, the ligand changed
its position or even slipped out of the active site, resulting in blurry dynophores. Due to the fact
that MD simulations of the same system may have different outcomes and a single simulation
might not be representative of the natural dynamics of a ligand-protein complex, MD simulations
should be performed in – at least – triplicates to allow statistical assessment of the results.
4.2.7. Prediction refinement via machine learning and post-screening filters
In a prediction trial using the eight 3D pharmacophores (chapter 4.2.5) for virtual screening, the
resulting hits were analysed and it became apparent that for some instances the hit identification
was ambiguous, i.e. some hits were identified simultaneously by different pharmacophores
leaving open the question if the hit molecule was a substrate, CDL, or inhibitor. For further
refinement of the pharmacophore-based prediction, firstly, a post-filtering step was included in
the prediction process. This post-filtering step was needed due to the fact that some of the hit
molecules that were identified as substrates of SULT1E1 did not feature a hydroxyl group, which
is a prerequisite for the sulfonation reaction. In this post-filtering step, all molecules that were
identified as substrates via pharmacophore screening underwent filtering based on absence or
presence of a hydroxyl group to ensure catalytic compatibility with the sulfonation reaction of
the enzyme.
Secondly, predictive classification models were created in order to refine the pharmacophore-
based hit identification using machine learning techniques. Due to numerous reports of
successful application of SVM classification models282,313, also in the field of metabolism
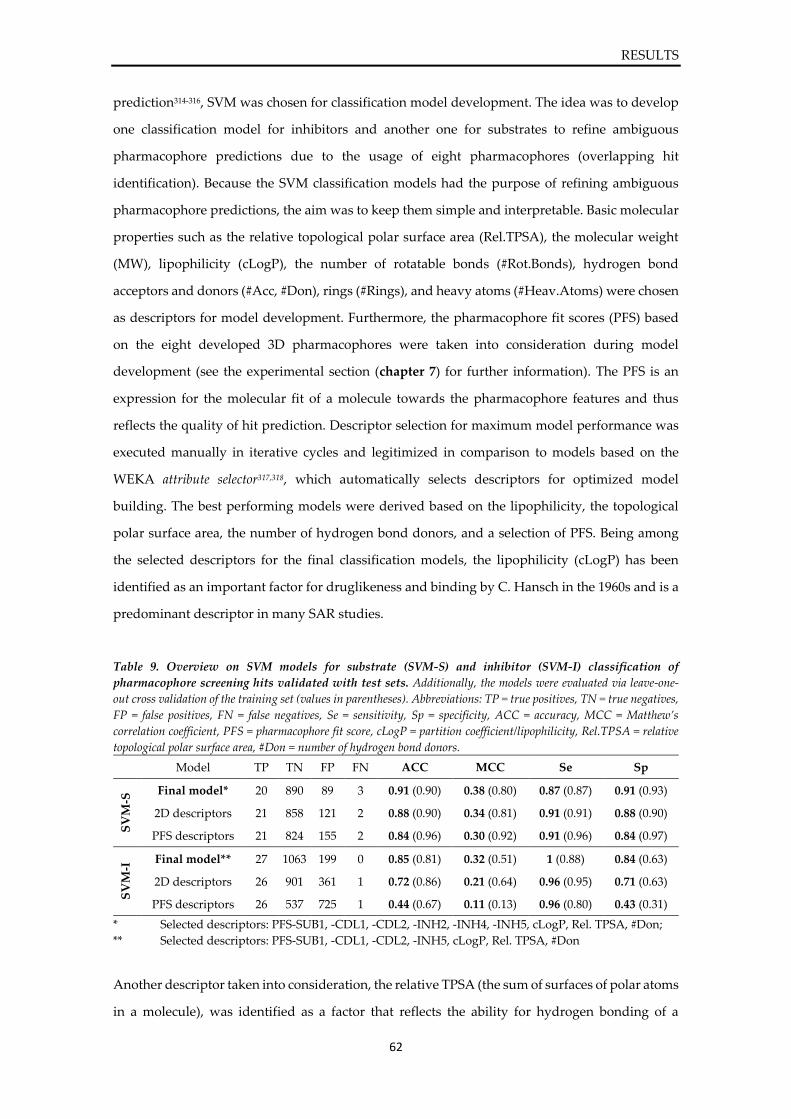
RESULTS
62
prediction314-316, SVM was chosen for classification model development. The idea was to develop
one classification model for inhibitors and another one for substrates to refine ambiguous
pharmacophore predictions due to the usage of eight pharmacophores (overlapping hit
identification). Because the SVM classification models had the purpose of refining ambiguous
pharmacophore predictions, the aim was to keep them simple and interpretable. Basic molecular
properties such as the relative topological polar surface area (Rel.TPSA), the molecular weight
(MW), lipophilicity (cLogP), the number of rotatable bonds (#Rot.Bonds), hydrogen bond
acceptors and donors (#Acc, #Don), rings (#Rings), and heavy atoms (#Heav.Atoms) were chosen
as descriptors for model development. Furthermore, the pharmacophore fit scores (PFS) based
on the eight developed 3D pharmacophores were taken into consideration during model
development (see the experimental section (chapter 7) for further information). The PFS is an
expression for the molecular fit of a molecule towards the pharmacophore features and thus
reflects the quality of hit prediction. Descriptor selection for maximum model performance was
executed manually in iterative cycles and legitimized in comparison to models based on the
WEKA attribute selector317,318, which automatically selects descriptors for optimized model
building. The best performing models were derived based on the lipophilicity, the topological
polar surface area, the number of hydrogen bond donors, and a selection of PFS. Being among
the selected descriptors for the final classification models, the lipophilicity (cLogP) has been
identified as an important factor for druglikeness and binding by C. Hansch in the 1960s and is a
predominant descriptor in many SAR studies.
Table 9. Overview on SVM models for substrate (SVM-S) and inhibitor (SVM-I) classification of
pharmacophore screening hits validated with test sets. Additionally, the models were evaluated via leave-one-
out cross validation of the training set (values in parentheses). Abbreviations: TP = true positives, TN = true negatives,
FP = false positives, FN = false negatives, Se = sensitivity, Sp = specificity, ACC = accuracy, MCC = Matthew’s
correlation coefficient, PFS = pharmacophore fit score, cLogP = partition coefficient/lipophilicity, Rel.TPSA = relative
topological polar surface area, #Don = number of hydrogen bond donors.
Model TP TN FP FN ACC MCC Se Sp
SV
M-S
Final model* 20 890 89 3 0.91 (0.90) 0.38 (0.80) 0.87 (0.87) 0.91 (0.93)
2D descriptors 21 858 121 2 0.88 (0.90) 0.34 (0.81) 0.91 (0.91) 0.88 (0.90)
PFS descriptors 21 824 155 2 0.84 (0.96) 0.30 (0.92) 0.91 (0.96) 0.84 (0.97)
SV
M-I
Final model** 27 1063 199 0 0.85 (0.81) 0.32 (0.51) 1 (0.88) 0.84 (0.63)
2D descriptors 26 901 361 1 0.72 (0.86) 0.21 (0.64) 0.96 (0.95) 0.71 (0.63)
PFS descriptors 26 537 725 1 0.44 (0.67) 0.11 (0.13) 0.96 (0.80) 0.43 (0.31)
* Selected descriptors: PFS-SUB1, -CDL1, -CDL2, -INH2, -INH4, -INH5, cLogP, Rel. TPSA, #Don;
** Selected descriptors: PFS-SUB1, -CDL1, -CDL2, -INH5, cLogP, Rel. TPSA, #Don
Another descriptor taken into consideration, the relative TPSA (the sum of surfaces of polar atoms
in a molecule), was identified as a factor that reflects the ability for hydrogen bonding of a
RESULTS
63
substance and indicates quality of molecule absorption319. Further, the number of hydrogen bond
donors was considered important for inhibitor and substrate classification. The inhibitor
classification model additionally includes six, and the substrate classification model four PFS
descriptors. An overview on the developed SVM classification models for substrates (SVM-S) and
inhibitors (SVM-I) is given in Table 9. The quality of the models was assessed in terms of
sensitivity (Se), specificity (Sp), accuracy (ACC), and Matthew’s correlation coefficient (MCC)
(equations 5 to 8 in chapter 3.1.4). The final SVM-S model showed a sensitivity of 0.87 and a
specificity of 0.91 which indicates solid identification of true active and inactive substrates of
SULT1E1. Overall, the model allowed correct prediction of 91 % of the test set molecules. The
MCC is a measure for the quality of binary classifications ranging from -1 to 1 with 0 indicating
random and 1 indicating perfect classification. The SVM-S model showed an MCC of 0.38 which
reflects a fairly robust classification performance. For comparison, two classification models were
created that were based solely on 2D or PFS descriptors. Although these two models had higher
sensitivity, the accuracy and the MCC indicated inferior performance in comparison to the final
SVM-S. The classification model for inhibitors (SVM-I) showed perfect sensitivity correctly
identifying all true inhibitors of SULT1E1, and showed sound specificity with a value of 0.84.
Overall, the SVM-I correctly predicted 85 % of the whole test set of molecules and showed an
MCC value of 0.32 indicating above-average quality of classification performance. The final SVM-
I outperformed the two models that were solely based on 2D or PFS descriptors regarding
performance statistics. Furthermore, the applicability domain of the model was assessed on the
data sets for substrate and inhibitor classification based on Euclidian distances. The results
suggest suitability of descriptor selection for the used data sets.
The final SVM classification models listed in Table 9 were included into the final prediction
model for SULT1E1. Retrospectively, other machine learning techniques were tested to compare
their performance with the SVM models. An overview on the machine learning models and
techniques is given in Table 10 for substrates and Table 11 for inhibitors. The validation of the
models was based on the internal test sets and the performance of the predictive models were
additionally assessed using leave-one-out (LOO) cross validation of the training set as reported
by Klepsch et al.320. The machine learning methods included Naïve Bayes (NB) classification,
artificial neural networks (ANN) (multi-layer perceptron), decision trees (DT), and random forest
classification (RT).
The classification models for substrates based on different machine learning techniques using
WEKA descriptor selections showed similar accuracies compared to the final SVM-S model
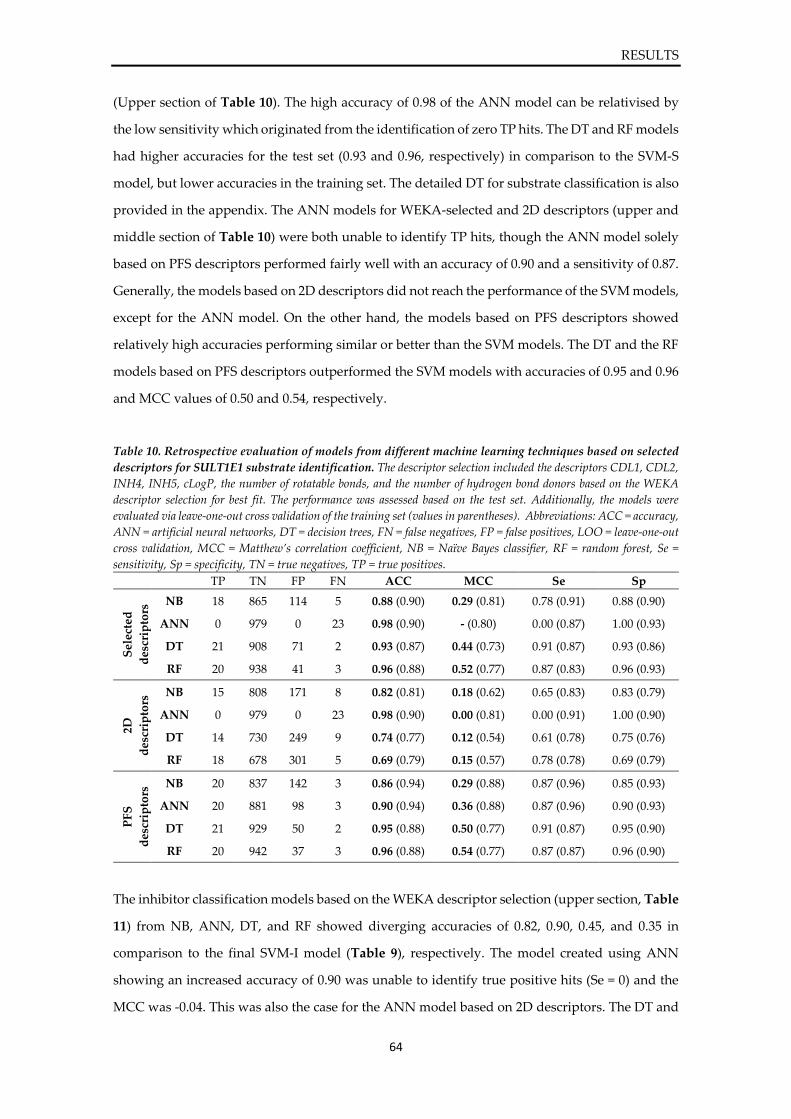
RESULTS
64
(Upper section of Table 10). The high accuracy of 0.98 of the ANN model can be relativised by
the low sensitivity which originated from the identification of zero TP hits. The DT and RF models
had higher accuracies for the test set (0.93 and 0.96, respectively) in comparison to the SVM-S
model, but lower accuracies in the training set. The detailed DT for substrate classification is also
provided in the appendix. The ANN models for WEKA-selected and 2D descriptors (upper and
middle section of Table 10) were both unable to identify TP hits, though the ANN model solely
based on PFS descriptors performed fairly well with an accuracy of 0.90 and a sensitivity of 0.87.
Generally, the models based on 2D descriptors did not reach the performance of the SVM models,
except for the ANN model. On the other hand, the models based on PFS descriptors showed
relatively high accuracies performing similar or better than the SVM models. The DT and the RF
models based on PFS descriptors outperformed the SVM models with accuracies of 0.95 and 0.96
and MCC values of 0.50 and 0.54, respectively.
Table 10. Retrospective evaluation of models from different machine learning techniques based on selected
descriptors for SULT1E1 substrate identification. The descriptor selection included the descriptors CDL1, CDL2,
INH4, INH5, cLogP, the number of rotatable bonds, and the number of hydrogen bond donors based on the WEKA
descriptor selection for best fit. The performance was assessed based on the test set. Additionally, the models were
evaluated via leave-one-out cross validation of the training set (values in parentheses). Abbreviations: ACC = accuracy,
ANN = artificial neural networks, DT = decision trees, FN = false negatives, FP = false positives, LOO = leave-one-out
cross validation, MCC = Matthew’s correlation coefficient, NB = Naïve Bayes classifier, RF = random forest, Se =
sensitivity, Sp = specificity, TN = true negatives, TP = true positives.
The inhibitor classification models based on the WEKA descriptor selection (upper section, Table
11) from NB, ANN, DT, and RF showed diverging accuracies of 0.82, 0.90, 0.45, and 0.35 in
comparison to the final SVM-I model (Table 9), respectively. The model created using ANN
showing an increased accuracy of 0.90 was unable to identify true positive hits (Se = 0) and the
MCC was -0.04. This was also the case for the ANN model based on 2D descriptors. The DT and
TP TN FP FN ACC MCC Se Sp
Sel
ecte
d
des
crip
tors
NB 18 865 114 5 0.88 (0.90) 0.29 (0.81) 0.78 (0.91) 0.88 (0.90)
ANN 0 979 0 23 0.98 (0.90) - (0.80) 0.00 (0.87) 1.00 (0.93)
DT 21 908 71 2 0.93 (0.87) 0.44 (0.73) 0.91 (0.87) 0.93 (0.86)
RF 20 938 41 3 0.96 (0.88) 0.52 (0.77) 0.87 (0.83) 0.96 (0.93)
2D
des
crip
tors
NB 15 808 171 8 0.82 (0.81) 0.18 (0.62) 0.65 (0.83) 0.83 (0.79)
ANN 0 979 0 23 0.98 (0.90) 0.00 (0.81) 0.00 (0.91) 1.00 (0.90)
DT 14 730 249 9 0.74 (0.77) 0.12 (0.54) 0.61 (0.78) 0.75 (0.76)
RF 18 678 301 5 0.69 (0.79) 0.15 (0.57) 0.78 (0.78) 0.69 (0.79)
PF
S
des
crip
tors
NB 20 837 142 3 0.86 (0.94) 0.29 (0.88) 0.87 (0.96) 0.85 (0.93)
ANN 20 881 98 3 0.90 (0.94) 0.36 (0.88) 0.87 (0.96) 0.90 (0.93)
DT 21 929 50 2 0.95 (0.88) 0.50 (0.77) 0.91 (0.87) 0.95 (0.90)
RF 20 942 37 3 0.96 (0.88) 0.54 (0.77) 0.87 (0.87) 0.96 (0.90)
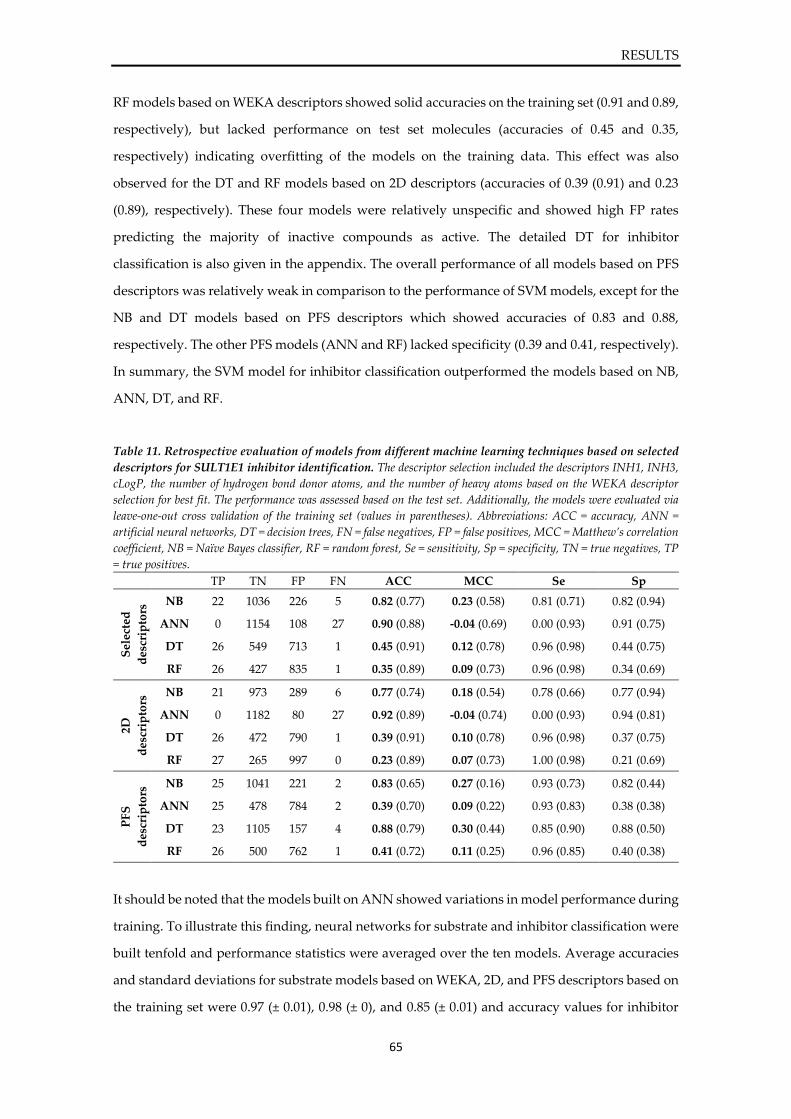
RESULTS
65
RF models based on WEKA descriptors showed solid accuracies on the training set (0.91 and 0.89,
respectively), but lacked performance on test set molecules (accuracies of 0.45 and 0.35,
respectively) indicating overfitting of the models on the training data. This effect was also
observed for the DT and RF models based on 2D descriptors (accuracies of 0.39 (0.91) and 0.23
(0.89), respectively). These four models were relatively unspecific and showed high FP rates
predicting the majority of inactive compounds as active. The detailed DT for inhibitor
classification is also given in the appendix. The overall performance of all models based on PFS
descriptors was relatively weak in comparison to the performance of SVM models, except for the
NB and DT models based on PFS descriptors which showed accuracies of 0.83 and 0.88,
respectively. The other PFS models (ANN and RF) lacked specificity (0.39 and 0.41, respectively).
In summary, the SVM model for inhibitor classification outperformed the models based on NB,
ANN, DT, and RF.
Table 11. Retrospective evaluation of models from different machine learning techniques based on selected
descriptors for SULT1E1 inhibitor identification. The descriptor selection included the descriptors INH1, INH3,
cLogP, the number of hydrogen bond donor atoms, and the number of heavy atoms based on the WEKA descriptor
selection for best fit. The performance was assessed based on the test set. Additionally, the models were evaluated via
leave-one-out cross validation of the training set (values in parentheses). Abbreviations: ACC = accuracy, ANN =
artificial neural networks, DT = decision trees, FN = false negatives, FP = false positives, MCC = Matthew’s correlation
coefficient, NB = Naïve Bayes classifier, RF = random forest, Se = sensitivity, Sp = specificity, TN = true negatives, TP
= true positives.
It should be noted that the models built on ANN showed variations in model performance during
training. To illustrate this finding, neural networks for substrate and inhibitor classification were
built tenfold and performance statistics were averaged over the ten models. Average accuracies
and standard deviations for substrate models based on WEKA, 2D, and PFS descriptors based on
the training set were 0.97 (± 0.01), 0.98 (± 0), and 0.85 (± 0.01) and accuracy values for inhibitor
TP TN FP FN ACC MCC Se Sp
Sel
ecte
d
des
crip
tors
NB 22 1036 226 5 0.82 (0.77) 0.23 (0.58) 0.81 (0.71) 0.82 (0.94)
ANN 0 1154 108 27 0.90 (0.88) -0.04 (0.69) 0.00 (0.93) 0.91 (0.75)
DT 26 549 713 1 0.45 (0.91) 0.12 (0.78) 0.96 (0.98) 0.44 (0.75)
RF 26 427 835 1 0.35 (0.89) 0.09 (0.73) 0.96 (0.98) 0.34 (0.69)
2D
des
crip
tors
NB 21 973 289 6 0.77 (0.74) 0.18 (0.54) 0.78 (0.66) 0.77 (0.94)
ANN 0 1182 80 27 0.92 (0.89) -0.04 (0.74) 0.00 (0.93) 0.94 (0.81)
DT 26 472 790 1 0.39 (0.91) 0.10 (0.78) 0.96 (0.98) 0.37 (0.75)
RF 27 265 997 0 0.23 (0.89) 0.07 (0.73) 1.00 (0.98) 0.21 (0.69)
PF
S
des
crip
tors
NB 25 1041 221 2 0.83 (0.65) 0.27 (0.16) 0.93 (0.73) 0.82 (0.44)
ANN 25 478 784 2 0.39 (0.70) 0.09 (0.22) 0.93 (0.83) 0.38 (0.38)
DT 23 1105 157 4 0.88 (0.79) 0.30 (0.44) 0.85 (0.90) 0.88 (0.50)
RF 26 500 762 1 0.41 (0.72) 0.11 (0.25) 0.96 (0.85) 0.40 (0.38)
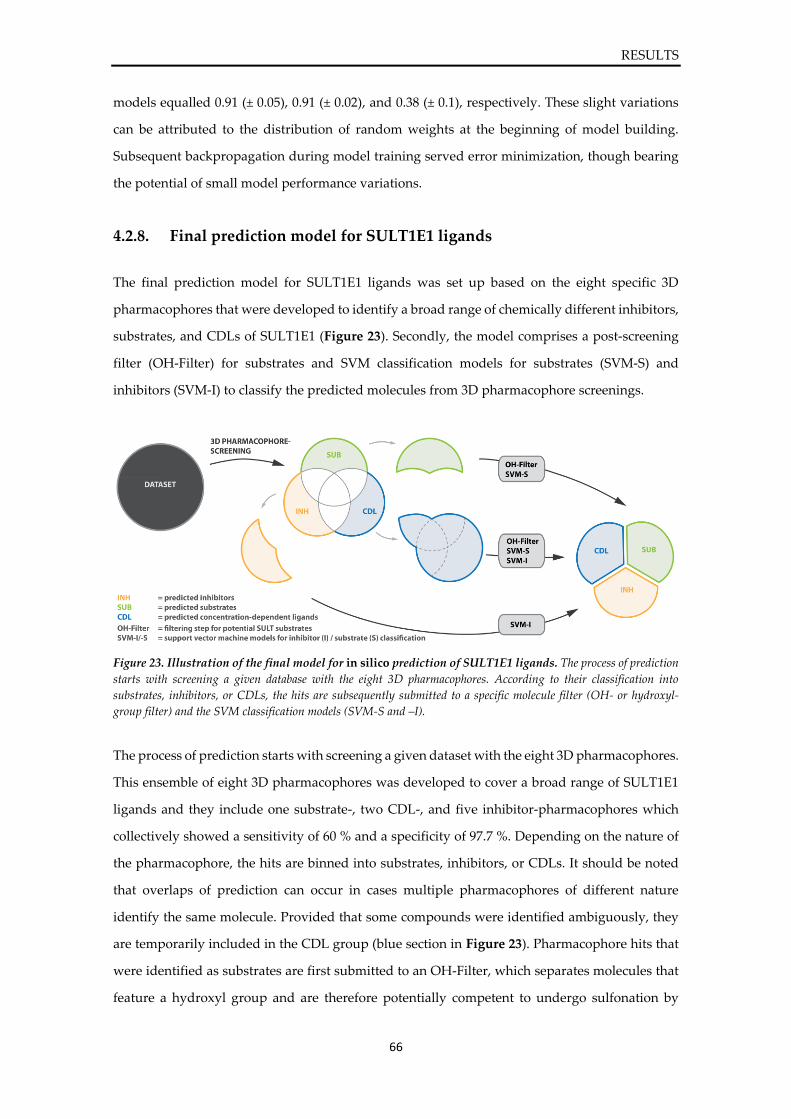
RESULTS
66
models equalled 0.91 (± 0.05), 0.91 (± 0.02), and 0.38 (± 0.1), respectively. These slight variations
can be attributed to the distribution of random weights at the beginning of model building.
Subsequent backpropagation during model training served error minimization, though bearing
the potential of small model performance variations.
4.2.8. Final prediction model for SULT1E1 ligands
The final prediction model for SULT1E1 ligands was set up based on the eight specific 3D
pharmacophores that were developed to identify a broad range of chemically different inhibitors,
substrates, and CDLs of SULT1E1 (Figure 23). Secondly, the model comprises a post-screening
filter (OH-Filter) for substrates and SVM classification models for substrates (SVM-S) and
inhibitors (SVM-I) to classify the predicted molecules from 3D pharmacophore screenings.
Figure 23. Illustration of the final model for in silico prediction of SULT1E1 ligands. The process of prediction
starts with screening a given database with the eight 3D pharmacophores. According to their classification into
substrates, inhibitors, or CDLs, the hits are subsequently submitted to a specific molecule filter (OH- or hydroxyl-
group filter) and the SVM classification models (SVM-S and –I).
The process of prediction starts with screening a given dataset with the eight 3D pharmacophores.
This ensemble of eight 3D pharmacophores was developed to cover a broad range of SULT1E1
ligands and they include one substrate-, two CDL-, and five inhibitor-pharmacophores which
collectively showed a sensitivity of 60 % and a specificity of 97.7 %. Depending on the nature of
the pharmacophore, the hits are binned into substrates, inhibitors, or CDLs. It should be noted
that overlaps of prediction can occur in cases multiple pharmacophores of different nature
identify the same molecule. Provided that some compounds were identified ambiguously, they
are temporarily included in the CDL group (blue section in Figure 23). Pharmacophore hits that
were identified as substrates are first submitted to an OH-Filter, which separates molecules that
feature a hydroxyl group and are therefore potentially competent to undergo sulfonation by
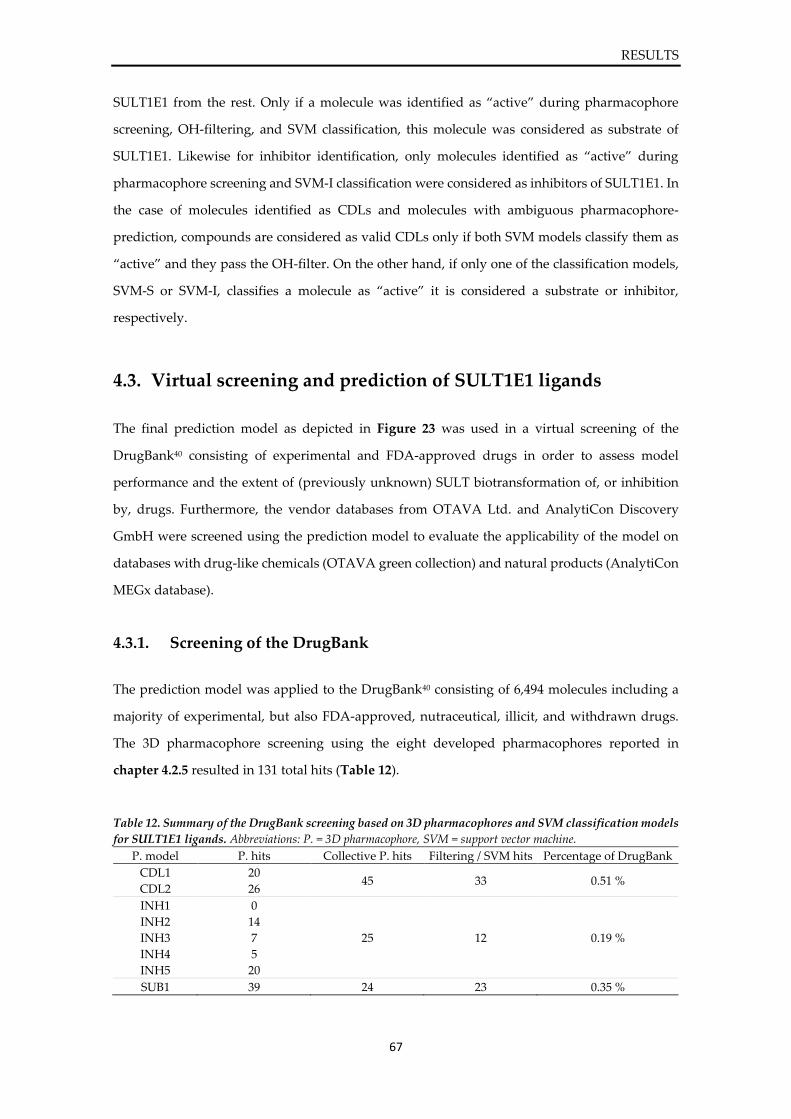
RESULTS
67
SULT1E1 from the rest. Only if a molecule was identified as “active” during pharmacophore
screening, OH-filtering, and SVM classification, this molecule was considered as substrate of
SULT1E1. Likewise for inhibitor identification, only molecules identified as “active” during
pharmacophore screening and SVM-I classification were considered as inhibitors of SULT1E1. In
the case of molecules identified as CDLs and molecules with ambiguous pharmacophore-
prediction, compounds are considered as valid CDLs only if both SVM models classify them as
“active” and they pass the OH-filter. On the other hand, if only one of the classification models,
SVM-S or SVM-I, classifies a molecule as “active” it is considered a substrate or inhibitor,
respectively.
4.3. Virtual screening and prediction of SULT1E1 ligands
The final prediction model as depicted in Figure 23 was used in a virtual screening of the
DrugBank40 consisting of experimental and FDA-approved drugs in order to assess model
performance and the extent of (previously unknown) SULT biotransformation of, or inhibition
by, drugs. Furthermore, the vendor databases from OTAVA Ltd. and AnalytiCon Discovery
GmbH were screened using the prediction model to evaluate the applicability of the model on
databases with drug-like chemicals (OTAVA green collection) and natural products (AnalytiCon
MEGx database).
4.3.1. Screening of the DrugBank
The prediction model was applied to the DrugBank40 consisting of 6,494 molecules including a
majority of experimental, but also FDA-approved, nutraceutical, illicit, and withdrawn drugs.
The 3D pharmacophore screening using the eight developed pharmacophores reported in
chapter 4.2.5 resulted in 131 total hits (Table 12).
Table 12. Summary of the DrugBank screening based on 3D pharmacophores and SVM classification models
for SULT1E1 ligands. Abbreviations: P. = 3D pharmacophore, SVM = support vector machine.
P. model P. hits Collective P. hits Filtering / SVM hits Percentage of DrugBank
CDL1 20 45 33 0.51 %
CDL2 26
INH1 0
25 12 0.19 %
INH2 14
INH3 7
INH4 5
INH5 20
SUB1 39 24 23 0.35 %
RESULTS
68
Comparing the numbers of hits identified by 3D pharmacophores individually and collectively,
overlaps and ambiguity of hit identification were found: Although the individually predicted
CDLs, inhibitors, and substrates resulted in 46, 46, and 39 hits, respectively, the collective
pharmacophore hits without compounds occurring multiple times were 45 CDLs, 25 inhibitors,
and 24 substrates, respectively. The application of OH-filtering and SVM classification narrowed
down the final hit collection to a total of 68 compounds including 33 CDLs, 12 inhibitors, and 23
substrates. The chemical structures of the 26 hits that were predicted via pharmacophore-
screening but excluded from the collection of final compounds after filtering and SVM
classification can be found in the appendix, along with the full list of the 68 final DrugBank hits.
Among the 68 predicted hits from the DrugBank screening were 8 FDA-approved drugs (retinol
(DB00162), balsalazide (DB01014), olsalazine (DB01250), diethylstilbestrol (manufacturing stop
in 1997) (DB00255), raloxifene (DB00481), estradiol (DB00783), dienestrol (DB00890), ethinyl
estradiol, EE2 (DB00977)), and one approved drug, estriol (DB04573), which is available in the US
by prescription and approved in Europe and Asia, but not approved by the FDA. The other 59
compounds were found to be classified as drugs in experimental stages according to the
DrugBank. Interestingly, among the nine approved drugs six compounds reportedly show strong
estrogenic effects and some are therapeutically used as contraceptives (E2 and EE2), selective
estrogen receptor modulators (SERM) (raloxifene), or as drugs for treatment of certain
physiological disorders such as multiple sclerosis (estriol) or vulvar atrophy (dienestrol). Due to
the fact that estrogens, such as E2, show high affinity towards SULT1E1, the identification of other
estrogenic compounds during virtual screening indicates reliability of the prediction model.
Further investigation on the 68 hit molecules revealed commercial unavailability of 43 % of the
substrate-hits (10 out of 23), 75 % of the inhibitor-hits (9 out of 12) and 30 % of the CDL-hits (10
out of 33). The total amount of unavailable compounds was 42.7 % (29 out of 68). Based on
literature, 24 molecules were found to be ligands of SULTs (33 %) from which 19 were identified
to interact with SULT1E1 (28 %). These 19 ligands covered 22 % (5 out of 23) of the substrate hits
and 42 % (14 out of 33) of the CDL hits. Omitting the hits that were commercially unavailable
and/or reported ligands of SULTs, the predicted hits were narrowed down to fifteen molecules.
Two of these molecules were FDA-approved drugs (balsalazide (DB01014), olsalazide (DB01250))
used to treat inflammatory bowel disease that are reported to be degraded in human colon. Two
other molecules (retinol (DB00162), 4-oxo-retinol (DB02699)) were found to be unstable under
standard conditions. The resulting eleven compounds were assessed and nine of them were
purchased from chemical vendors for further experimental validation. The nine compounds
include four CDLs (1 to 4), two inhibitors (5, 6), and three substrates (7 to 9) (Figure 24).
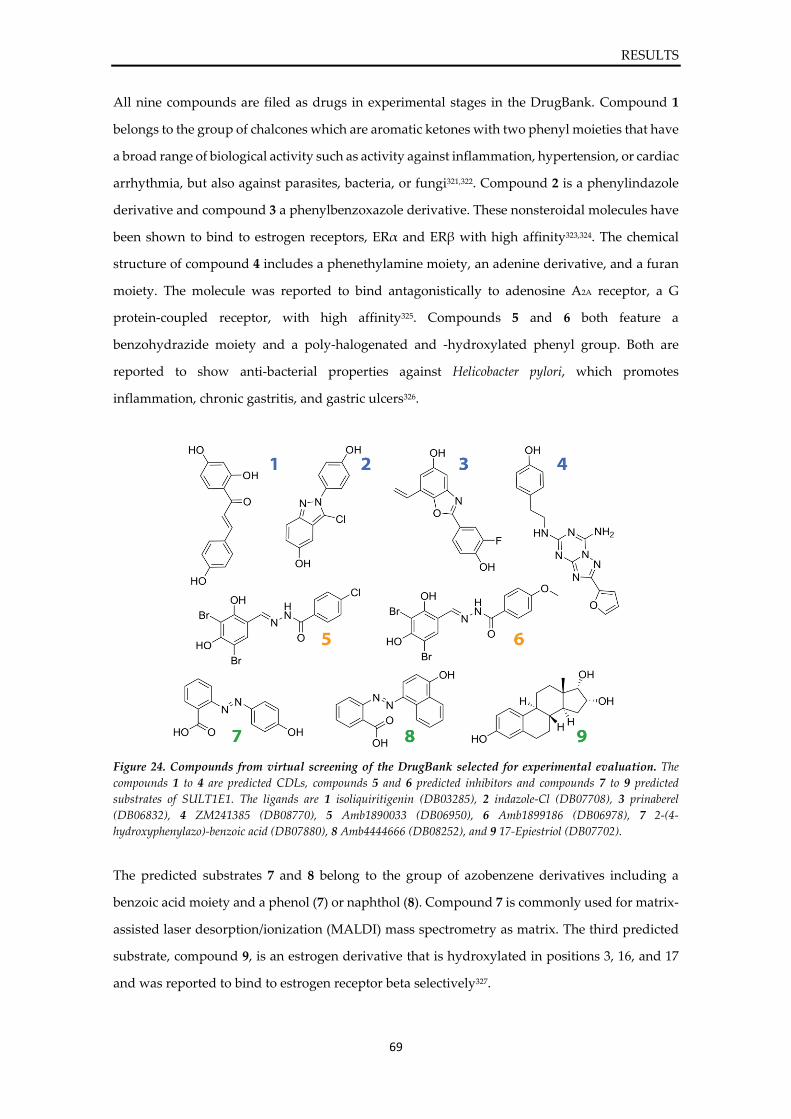
RESULTS
69
All nine compounds are filed as drugs in experimental stages in the DrugBank. Compound 1
belongs to the group of chalcones which are aromatic ketones with two phenyl moieties that have
a broad range of biological activity such as activity against inflammation, hypertension, or cardiac
arrhythmia, but also against parasites, bacteria, or fungi321,322. Compound 2 is a phenylindazole
derivative and compound 3 a phenylbenzoxazole derivative. These nonsteroidal molecules have
been shown to bind to estrogen receptors, ERα and ERβ with high affinity323,324. The chemical
structure of compound 4 includes a phenethylamine moiety, an adenine derivative, and a furan
moiety. The molecule was reported to bind antagonistically to adenosine A2A receptor, a G
protein-coupled receptor, with high affinity325. Compounds 5 and 6 both feature a
benzohydrazide moiety and a poly-halogenated and -hydroxylated phenyl group. Both are
reported to show anti-bacterial properties against Helicobacter pylori, which promotes
inflammation, chronic gastritis, and gastric ulcers326.
Figure 24. Compounds from virtual screening of the DrugBank selected for experimental evaluation. The
compounds 1 to 4 are predicted CDLs, compounds 5 and 6 predicted inhibitors and compounds 7 to 9 predicted
substrates of SULT1E1. The ligands are 1 isoliquiritigenin (DB03285), 2 indazole-Cl (DB07708), 3 prinaberel
(DB06832), 4 ZM241385 (DB08770), 5 Amb1890033 (DB06950), 6 Amb1899186 (DB06978), 7 2-(4-
hydroxyphenylazo)-benzoic acid (DB07880), 8 Amb4444666 (DB08252), and 9 17-Epiestriol (DB07702).
The predicted substrates 7 and 8 belong to the group of azobenzene derivatives including a
benzoic acid moiety and a phenol (7) or naphthol (8). Compound 7 is commonly used for matrix-
assisted laser desorption/ionization (MALDI) mass spectrometry as matrix. The third predicted
substrate, compound 9, is an estrogen derivative that is hydroxylated in positions 3, 16, and 17
and was reported to bind to estrogen receptor beta selectively327.
RESULTS
70
4.3.2. Screening of chemical and natural product databases
In addition to the DrugBank screening, the databases of OTAVA Ltd. (OTAVA green collection)
and AnalytiCon Discovery GmbH (AnalytiCon MEGx database) were screened with the final
prediction model of SULT1E1 in order to assess the applicability of the model and the impact of
SULT1E1 biotransformation or inhibition on chemicals (OTAVA green collection) and natural
compounds (AnalytiCon MEGx).
The vendor library AnalytiCon MEGx containing 4,558 ready-to-screen natural products from
plants or microorganisms was submitted to 3D pharmacophore screening and subsequent
filtering and SVM classification (Table 13).
Table 13. Summary of the AnalytiCon MEGx screening based on 3D pharmacophores and SVM
classification models of SULT1E1 ligands. Abbreviations: P. = 3D pharmacophore, SVM = support vector machine.
The eight individual 3D pharmacophores identified 185 hits in total. The total number of
predicted hits without overlaps or multiple appearances of molecules added up to a total number
of 138 molecules. It should be noted that the collective CDL hits of 109 include hits that were
identified by CDL-pharmacophores, or combinations of pharmacophores. For example, if a
compound was identified by an inhibitor-pharmacophore and simultaneously by a CDL-
pharmacophore, it was grouped into the CDL collection of predicted hits. After filtering and SVM
classification, the CDLs comprised 63, the inhibitors 7 and the substrates 34 molecules (total
number of hits equalled 104).
Further investigation of the predicted molecules revealed that 86 % (6 out of 7) of the inhibitors,
71.4 % (45 out of 63) of the CDLs, and 67.6 % (23 out of 34) of the substrates were unreported in
the literature (total percentage of unreported molecules = 71.2 %). The one remaining molecule
predicted to inhibit SULT1E1 was reported as inhibitor of the enzyme in the literature.
Sulfonation of predicted CDLs and substrates was reported in the literature for 28.6 % (18 out of
63) of the CDLs and for 23.5 % (8 out of 34) for the substrates. Interestingly, 2 out of 34 of the
substrates were reported inhibitors of SULT1E1 and 1 out of 34 was reported in the literature to
P. model P. hits Collective P. hits Filtering / SVM hits Percentage of database
CDL1 18 109 63 1.38 %
CDL2 102
INH1 2
18 7 0.15 %
INH2 4
INH3 1
INH4 0
INH5 33
SUB1 25 11 34 0.75 %
RESULTS
71
be incapable of forming sulfonate metabolites, which results in an error of 8.8 % regarding
SULT1E1 substrates.
In summary, although most compounds were unreported in literature, about 14 % of the
inhibitors, 29 % of the CDLs, and 24 % of the substrates could be validated based on reports found
in the literature. About 9 % of the substrates was identified incorrectly due to reported inhibition
or observed lack of metabolites in analytical studies.
Additionally, the compound library OTAVA green collection which comprised 137,912 molecule
entries was screened with the final prediction model of SULT1E1 (Table 14). This collection
comprises chemicals that match the filters of Lipinski’s Rule of Five (logP < 5, HBD < 5, HBA < 10,
MW < 500 Da) to ensure druglikeness33. The eight individual 3D pharmacophores identified 26
CDLs, 307 inhibitors, and 332 substrates. After grouping the molecules into collections of CDLs,
inhibitors, and substrates to remove overlaps in prediction, the pharmacophore-based prediction
comprised 51 CDLs, 268 inhibitors, and 298 substrates which were reduced to 32, 85, and 162,
respectively, after filtering and SVM classification. The resulting, final 279 hits were investigated
for reported SULT metabolism based on literature. Only one compound of each of the three
ligand classes (CDLs, inhibitors, substrates) was reported in the literature to be active on
SULT1E1. These molecules were daidzein, 16-α-estriol, and formononetin reported as CDL,
substrate, and inhibitor, respectively. The remaining 276 molecules were not identified in the
literature which could be attributed to the chemical novelty of the OTAVA green entries.
Table 14. Summary of the OTAVA green collection screening based on 3D pharmacophores and SVM
classification models of SULT1E1 ligands. Abbreviations: P. = 3D pharmacophore, SVM = support vector machine.
To sum up, the final prediction model shows suitable applicability towards drugs, natural
products, and chemicals. The percentage of identified hits based on the total number of database
entries showed relatively similar coverage for the DrugBank and AnalytiCon (which have similar
database sizes of about 6,500 and 4,500, respectively) and slightly lower percentages of hit
identification for the OTAVA green collection (about 140,000 molecule entries) which are
relativised by the size of the databases.
P. model P. hits Collective P. hits Filtering / SVM hits Percentage of database
CDL1 19 51 32 0.02 %
CDL2 7
INH1 16
268 85 0.06 %
INH2 81
INH3 51
INH4 30
INH5 129
SUB1 332 298 162 0.12 %
RESULTS
72
4.4. Experimental validation of predicted hits
Based on the results of the virtual screening of the DrugBank, nine compounds were chosen for
further experimental validation and purchased from chemical vendors. The experiments were
performed in collaboration with Prof. Hansruedi Glatt and Dr. Walter Meinl from the German
Institute of Human Nutrition (DIfE) Potsdam-Rehbrücke, Germany, and Prof. Burkhard Kleuser
and Dr. Fabian Schumacher from the Institute of Nutritional Science, University of Potsdam,
Germany. For experimental evaluation, two different types of assays were developed and
conducted to investigate SULT1E1 inhibition and the sulfonation of the compounds by SULT1E1.
The results from the inhibition assay will be described in chapter 4.4.1 and the sulfonation assay,
which included LC-MS/MS-based detection of metabolites performed by Dr. Fabian Schumacher
(University of Potsdam, Germany), will be discussed in chapter 4.4.2. Additionally, an in silico
evaluation of the nine compounds regarding ligand binding and interaction patterns towards
SULT1E1 was performed using molecular docking simulations (chapter 4.4.3).
4.4.1. Inhibition assay of SULT1E1
All nine compounds (Figure 24) were investigated for their ability to bind and inhibit SULT1E1.
A more detailed description of these molecules can be found in chapter 4.3.1. It was assumed that
all compounds bind to the active site of SULT1E1 due to the nature of the pharmacophores which
were abstracted from ligand-protein interactions in close distance to the catalytic centre of
SULT1E1. Thus, inhibition of SULT1E1 by these compounds was surmised to occur in
competitive manner.
The inhibition assay was based on HPLC-based measurements of product (α-naphthylsulfate)
formation after incubation of SULT1E1 with α-naphthol and PAPS. Incubation of the reaction
mixture with different concentrations of compounds led to changes in product concentration.
Based on these measurements, enzyme activity was calculated in relation to concentration-
dependent inhibition by used compounds and dose-response curves were calculated to
determine IC50 values (Figure 25).
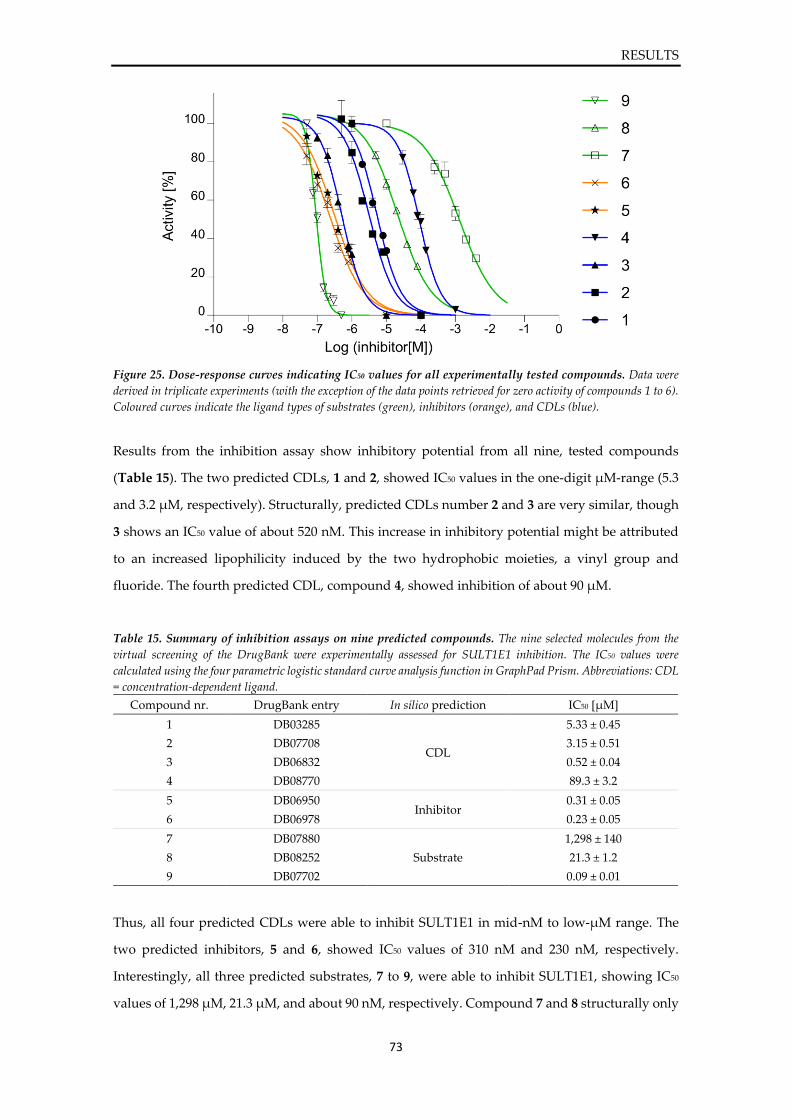
RESULTS
73
Figure 25. Dose-response curves indicating IC50 values for all experimentally tested compounds. Data were
derived in triplicate experiments (with the exception of the data points retrieved for zero activity of compounds 1 to 6).
Coloured curves indicate the ligand types of substrates (green), inhibitors (orange), and CDLs (blue).
Results from the inhibition assay show inhibitory potential from all nine, tested compounds
(Table 15). The two predicted CDLs, 1 and 2, showed IC50 values in the one-digit µM-range (5.3
and 3.2 µM, respectively). Structurally, predicted CDLs number 2 and 3 are very similar, though
3 shows an IC50 value of about 520 nM. This increase in inhibitory potential might be attributed
to an increased lipophilicity induced by the two hydrophobic moieties, a vinyl group and
fluoride. The fourth predicted CDL, compound 4, showed inhibition of about 90 µM.
Table 15. Summary of inhibition assays on nine predicted compounds. The nine selected molecules from the
virtual screening of the DrugBank were experimentally assessed for SULT1E1 inhibition. The IC50 values were
calculated using the four parametric logistic standard curve analysis function in GraphPad Prism. Abbreviations: CDL
= concentration-dependent ligand.
Thus, all four predicted CDLs were able to inhibit SULT1E1 in mid-nM to low-µM range. The
two predicted inhibitors, 5 and 6, showed IC50 values of 310 nM and 230 nM, respectively.
Interestingly, all three predicted substrates, 7 to 9, were able to inhibit SULT1E1, showing IC50
values of 1,298 µM, 21.3 µM, and about 90 nM, respectively. Compound 7 and 8 structurally only
Compound nr. DrugBank entry In silico prediction IC50 [µM]
1 DB03285
CDL
5.33 ± 0.45
2 DB07708 3.15 ± 0.51
3 DB06832 0.52 ± 0.04
4 DB08770 89.3 ± 3.2
5 DB06950 Inhibitor
0.31 ± 0.05
6 DB06978 0.23 ± 0.05
7 DB07880
Substrate
1,298 ± 140
8 DB08252 21.3 ± 1.2
9 DB07702 0.09 ± 0.01
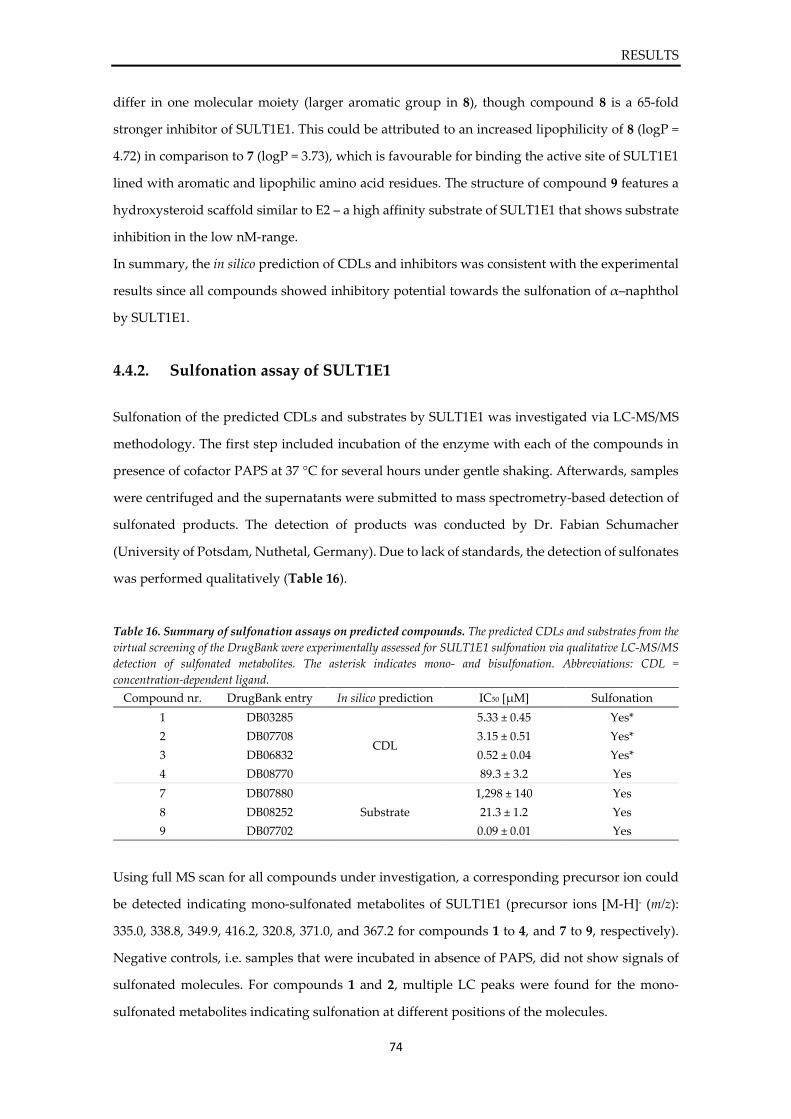
RESULTS
74
differ in one molecular moiety (larger aromatic group in 8), though compound 8 is a 65-fold
stronger inhibitor of SULT1E1. This could be attributed to an increased lipophilicity of 8 (logP =
4.72) in comparison to 7 (logP = 3.73), which is favourable for binding the active site of SULT1E1
lined with aromatic and lipophilic amino acid residues. The structure of compound 9 features a
hydroxysteroid scaffold similar to E2 – a high affinity substrate of SULT1E1 that shows substrate
inhibition in the low nM-range.
In summary, the in silico prediction of CDLs and inhibitors was consistent with the experimental
results since all compounds showed inhibitory potential towards the sulfonation of α–naphthol
by SULT1E1.
4.4.2. Sulfonation assay of SULT1E1
Sulfonation of the predicted CDLs and substrates by SULT1E1 was investigated via LC-MS/MS
methodology. The first step included incubation of the enzyme with each of the compounds in
presence of cofactor PAPS at 37 °C for several hours under gentle shaking. Afterwards, samples
were centrifuged and the supernatants were submitted to mass spectrometry-based detection of
sulfonated products. The detection of products was conducted by Dr. Fabian Schumacher
(University of Potsdam, Nuthetal, Germany). Due to lack of standards, the detection of sulfonates
was performed qualitatively (Table 16).
Table 16. Summary of sulfonation assays on predicted compounds. The predicted CDLs and substrates from the
virtual screening of the DrugBank were experimentally assessed for SULT1E1 sulfonation via qualitative LC-MS/MS
detection of sulfonated metabolites. The asterisk indicates mono- and bisulfonation. Abbreviations: CDL =
concentration-dependent ligand.
Using full MS scan for all compounds under investigation, a corresponding precursor ion could
be detected indicating mono-sulfonated metabolites of SULT1E1 (precursor ions [M-H]- (m/z):
335.0, 338.8, 349.9, 416.2, 320.8, 371.0, and 367.2 for compounds 1 to 4, and 7 to 9, respectively).
Negative controls, i.e. samples that were incubated in absence of PAPS, did not show signals of
sulfonated molecules. For compounds 1 and 2, multiple LC peaks were found for the mono-
sulfonated metabolites indicating sulfonation at different positions of the molecules.
Compound nr. DrugBank entry In silico prediction IC50 [µM] Sulfonation
1 DB03285
CDL
5.33 ± 0.45 Yes*
2 DB07708 3.15 ± 0.51 Yes*
3 DB06832 0.52 ± 0.04 Yes*
4 DB08770 89.3 ± 3.2 Yes
7 DB07880
Substrate
1,298 ± 140 Yes
8 DB08252 21.3 ± 1.2 Yes
9 DB07702 0.09 ± 0.01 Yes
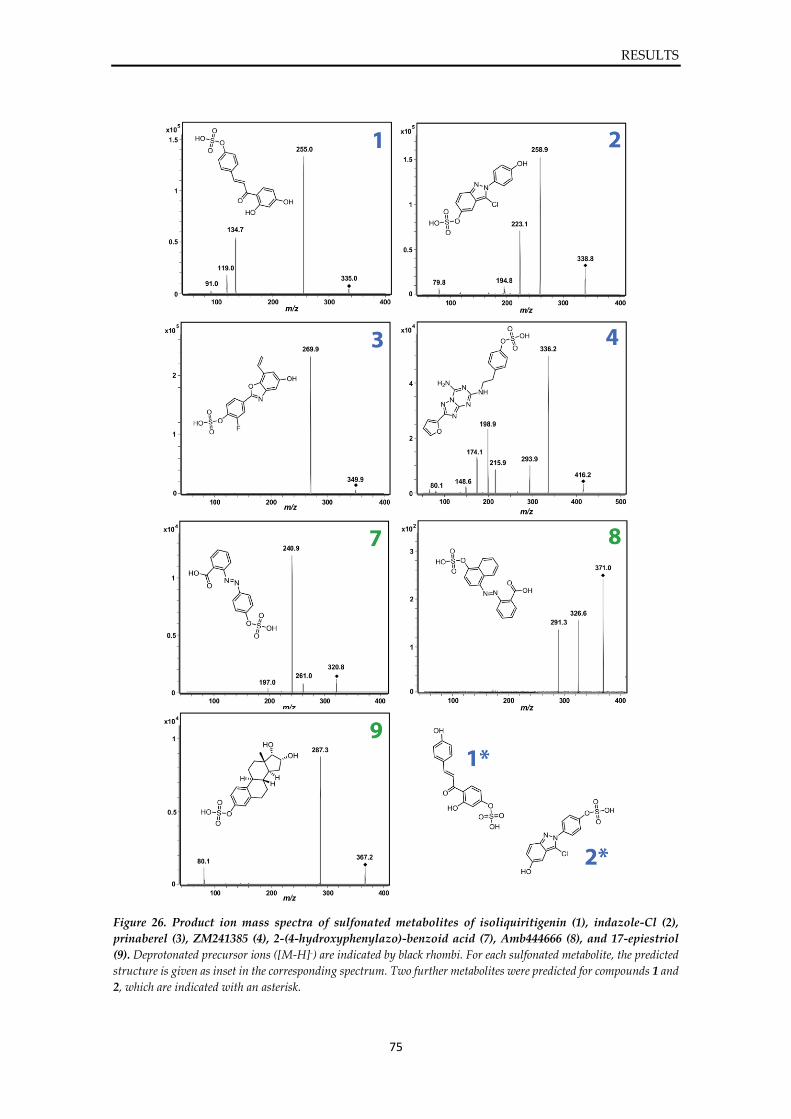
RESULTS
75
Figure 26. Product ion mass spectra of sulfonated metabolites of isoliquiritigenin (1), indazole-Cl (2),
prinaberel (3), ZM241385 (4), 2-(4-hydroxyphenylazo)-benzoid acid (7), Amb444666 (8), and 17-epiestriol
(9). Deprotonated precursor ions ([M-H]-) are indicated by black rhombi. For each sulfonated metabolite, the predicted
structure is given as inset in the corresponding spectrum. Two further metabolites were predicted for compounds 1 and
2, which are indicated with an asterisk.
RESULTS
76
The retrospective visual analysis of the in silico prediction of those compounds confirmed this
experimental finding which suggests that the prediction model not only identifies potential
ligands of SULT1E1 but is also able to predict the site of metabolism. Furthermore, for compounds
1, 2, and 3 but not compound 9 signals of precursor ions were found which designate bi-
sulfonation of molecules (precursor ions [M-2H]2- (m/z): 207.0, 209.0, and 214.5 for compounds 1,
2, and 3,respectively).
For further analysis of the mono-sulfonated metabolites, product ion scans were performed
(Figure 26). All mass spectra of product ions of the sulfonated metabolites showed characteristic
fragment ions that indicate cleavage of the sulfonate group (product ions [M-H-SO3]- (m/z): 255.0,
258.0, 269.9, 336.2, 240.9, 291.3, and 287.3 for compounds 1 to 4 and 7 to 9, respectively). The
spectra of compounds 2, 4, and 9 showed signals for the SO3- moiety (m/z 80) that was cleaved
during fragmentation in the collision cell of the mass spectrometer.
In summary, for predicted CDLs and substrates (compounds 1 to 4 and 7 to 9) the mass
spectrometry-based detection of sulfonated molecules proved the occurrence of SULT1E1-
mediated sulfonation and subsequently the computer-based prediction.
4.4.3. In silico evaluation of binding modes
The experimental evaluation of the nine selected molecules that were predicted via the computer-
based prediction model for SULT1E1 activity showed inhibitory potential for the predicted CDLs
and inhibitors, and sulfonation of the predicted CDLs and substrates. The experimental
validation led to the question how the molecular mechanism of binding between the ligands and
the protein would take place.
To address this question, in silico docking simulations were performed using the nine molecules
and the protein structure of SULT1E1. Being interested in the question which protein template
(the PDB template 1HY393 or one of the five protein conformations that were extracted from the
MD simulations and that differed from the template, specifically in active site shapes) would be
most suitable for ligand binding, docking was performed following two different approaches, (i),
ensemble docking of the nine molecules with the five protein structures extracted from MD
simulations (P1 to P5) plus the PDB template 1HY393, and (ii), ensemble docking of the nine
molecules with only the five MD protein structures P1 to P5. During docking, one hundred ligand
conformations were generated for each compound, though the protein templates for these
conformations may vary, i.e. some protein templates might be used more often as template than
others. The docking results were statistically analysed regarding protein preferences that
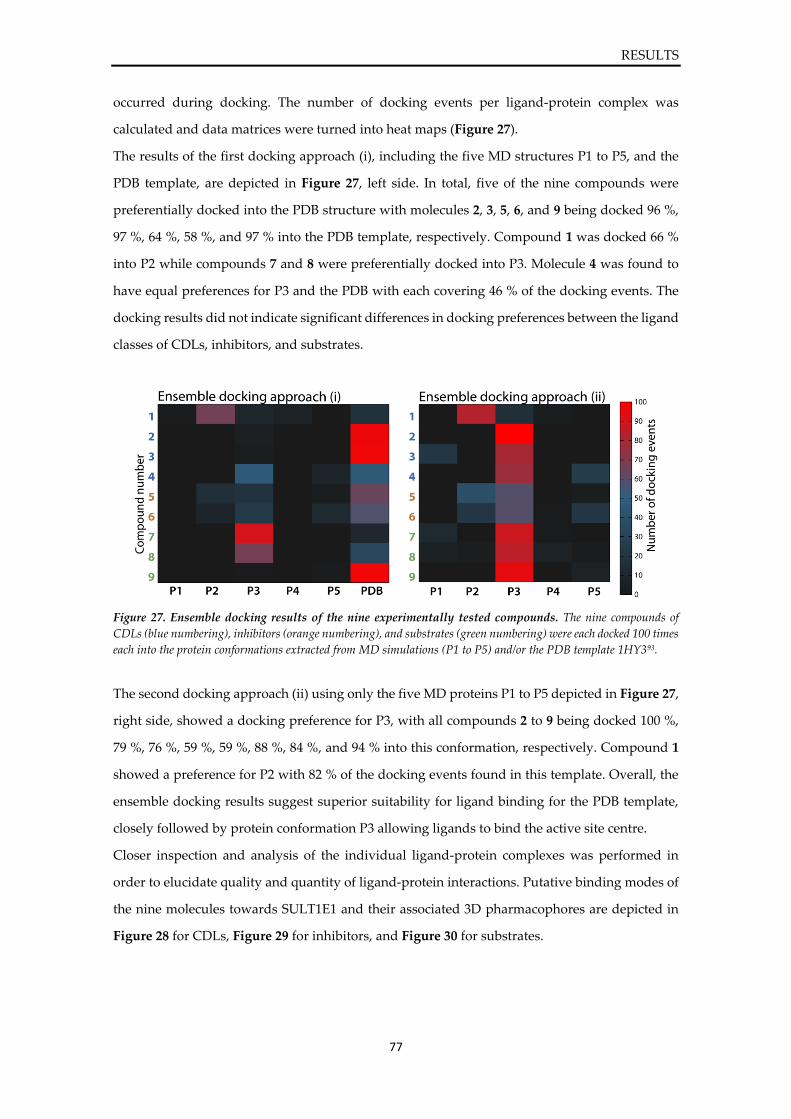
RESULTS
77
occurred during docking. The number of docking events per ligand-protein complex was
calculated and data matrices were turned into heat maps (Figure 27).
The results of the first docking approach (i), including the five MD structures P1 to P5, and the
PDB template, are depicted in Figure 27, left side. In total, five of the nine compounds were
preferentially docked into the PDB structure with molecules 2, 3, 5, 6, and 9 being docked 96 %,
97 %, 64 %, 58 %, and 97 % into the PDB template, respectively. Compound 1 was docked 66 %
into P2 while compounds 7 and 8 were preferentially docked into P3. Molecule 4 was found to
have equal preferences for P3 and the PDB with each covering 46 % of the docking events. The
docking results did not indicate significant differences in docking preferences between the ligand
classes of CDLs, inhibitors, and substrates.
Figure 27. Ensemble docking results of the nine experimentally tested compounds. The nine compounds of
CDLs (blue numbering), inhibitors (orange numbering), and substrates (green numbering) were each docked 100 times
each into the protein conformations extracted from MD simulations (P1 to P5) and/or the PDB template 1HY393.
The second docking approach (ii) using only the five MD proteins P1 to P5 depicted in Figure 27,
right side, showed a docking preference for P3, with all compounds 2 to 9 being docked 100 %,
79 %, 76 %, 59 %, 59 %, 88 %, 84 %, and 94 % into this conformation, respectively. Compound 1
showed a preference for P2 with 82 % of the docking events found in this template. Overall, the
ensemble docking results suggest superior suitability for ligand binding for the PDB template,
closely followed by protein conformation P3 allowing ligands to bind the active site centre.
Closer inspection and analysis of the individual ligand-protein complexes was performed in
order to elucidate quality and quantity of ligand-protein interactions. Putative binding modes of
the nine molecules towards SULT1E1 and their associated 3D pharmacophores are depicted in
Figure 28 for CDLs, Figure 29 for inhibitors, and Figure 30 for substrates.
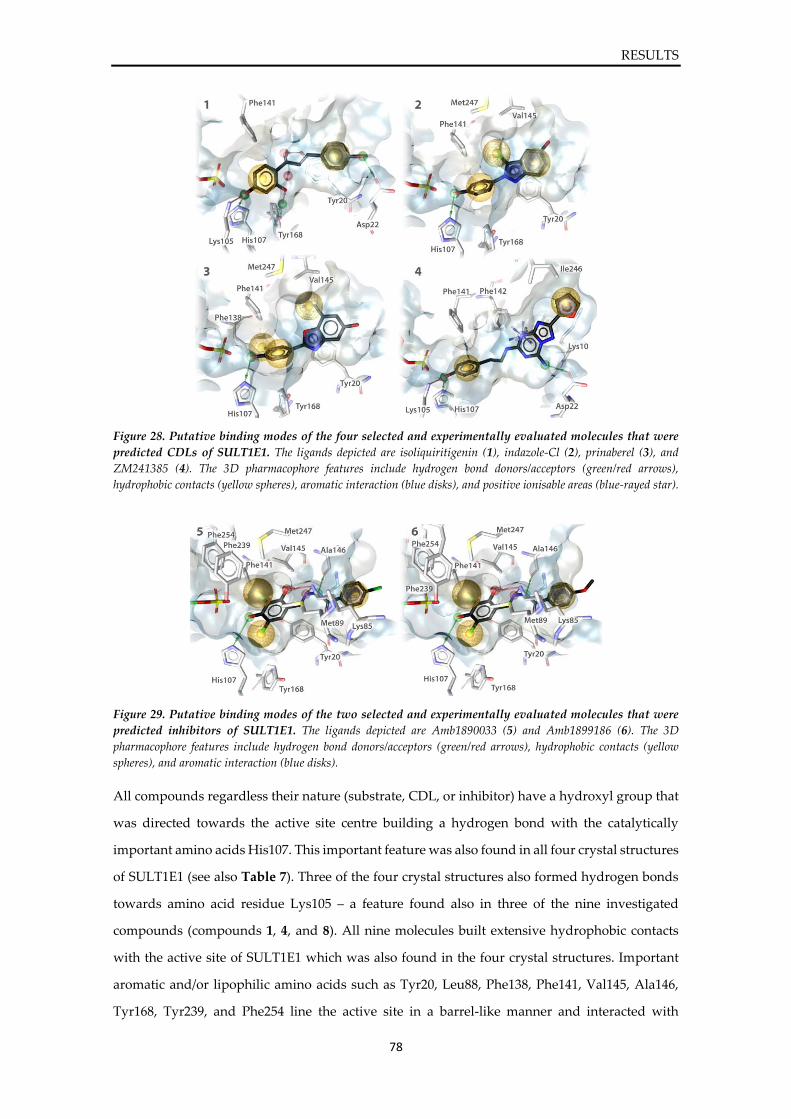
RESULTS
78
Figure 28. Putative binding modes of the four selected and experimentally evaluated molecules that were
predicted CDLs of SULT1E1. The ligands depicted are isoliquiritigenin (1), indazole-Cl (2), prinaberel (3), and
ZM241385 (4). The 3D pharmacophore features include hydrogen bond donors/acceptors (green/red arrows),
hydrophobic contacts (yellow spheres), aromatic interaction (blue disks), and positive ionisable areas (blue-rayed star).
Figure 29. Putative binding modes of the two selected and experimentally evaluated molecules that were
predicted inhibitors of SULT1E1. The ligands depicted are Amb1890033 (5) and Amb1899186 (6). The 3D
pharmacophore features include hydrogen bond donors/acceptors (green/red arrows), hydrophobic contacts (yellow
spheres), and aromatic interaction (blue disks).
All compounds regardless their nature (substrate, CDL, or inhibitor) have a hydroxyl group that
was directed towards the active site centre building a hydrogen bond with the catalytically
important amino acids His107. This important feature was also found in all four crystal structures
of SULT1E1 (see also Table 7). Three of the four crystal structures also formed hydrogen bonds
towards amino acid residue Lys105 – a feature found also in three of the nine investigated
compounds (compounds 1, 4, and 8). All nine molecules built extensive hydrophobic contacts
with the active site of SULT1E1 which was also found in the four crystal structures. Important
aromatic and/or lipophilic amino acids such as Tyr20, Leu88, Phe138, Phe141, Val145, Ala146,
Tyr168, Tyr239, and Phe254 line the active site in a barrel-like manner and interacted with
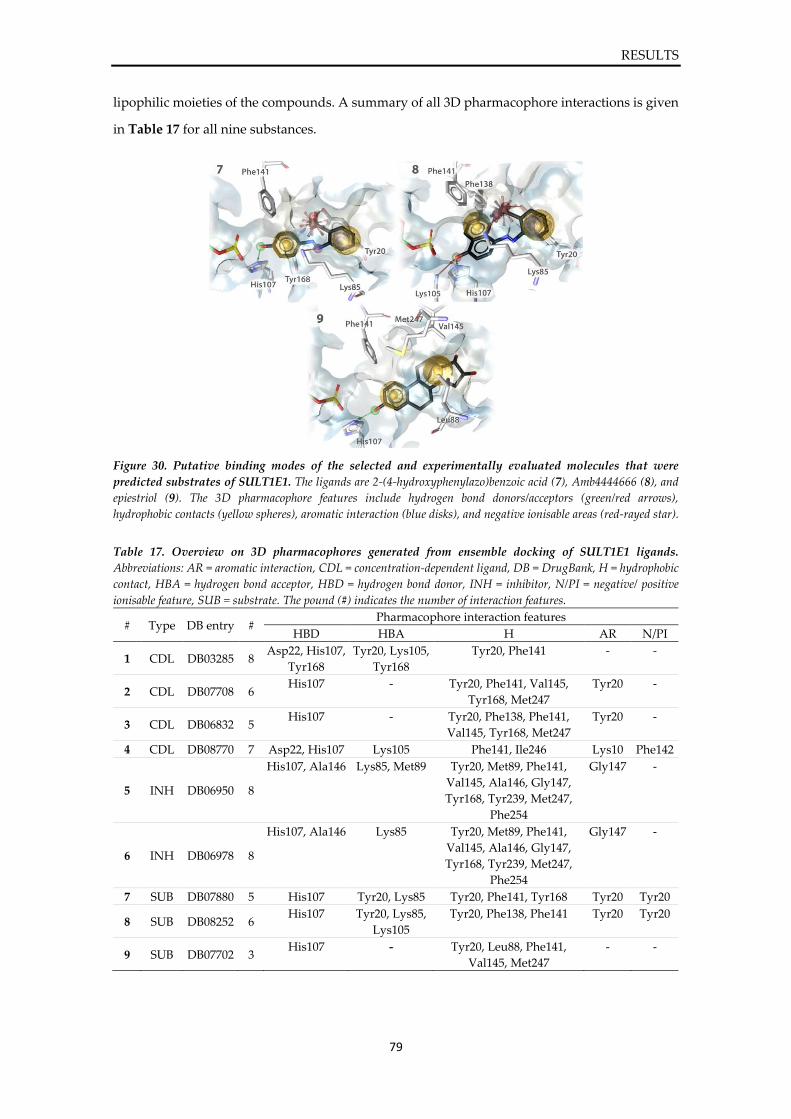
RESULTS
79
lipophilic moieties of the compounds. A summary of all 3D pharmacophore interactions is given
in Table 17 for all nine substances.
Figure 30. Putative binding modes of the selected and experimentally evaluated molecules that were
predicted substrates of SULT1E1. The ligands are 2-(4-hydroxyphenylazo)benzoic acid (7), Amb4444666 (8), and
epiestriol (9). The 3D pharmacophore features include hydrogen bond donors/acceptors (green/red arrows),
hydrophobic contacts (yellow spheres), aromatic interaction (blue disks), and negative ionisable areas (red-rayed star).
Table 17. Overview on 3D pharmacophores generated from ensemble docking of SULT1E1 ligands.
Abbreviations: AR = aromatic interaction, CDL = concentration-dependent ligand, DB = DrugBank, H = hydrophobic
contact, HBA = hydrogen bond acceptor, HBD = hydrogen bond donor, INH = inhibitor, N/PI = negative/ positive
ionisable feature, SUB = substrate. The pound (#) indicates the number of interaction features.
# Type DB entry # Pharmacophore interaction features
HBD HBA H AR N/PI
1 CDL DB03285 8 Asp22, His107,
Tyr168
Tyr20, Lys105,
Tyr168
Tyr20, Phe141 - -
2 CDL DB07708 6 His107 - Tyr20, Phe141, Val145,
Tyr168, Met247
Tyr20 -
3 CDL DB06832 5 His107 - Tyr20, Phe138, Phe141,
Val145, Tyr168, Met247
Tyr20 -
4 CDL DB08770 7 Asp22, His107 Lys105 Phe141, Ile246 Lys10 Phe142
5 INH DB06950 8
His107, Ala146 Lys85, Met89 Tyr20, Met89, Phe141,
Val145, Ala146, Gly147,
Tyr168, Tyr239, Met247,
Phe254
Gly147 -
6 INH DB06978 8
His107, Ala146 Lys85 Tyr20, Met89, Phe141,
Val145, Ala146, Gly147,
Tyr168, Tyr239, Met247,
Phe254
Gly147 -
7 SUB DB07880 5 His107 Tyr20, Lys85 Tyr20, Phe141, Tyr168 Tyr20 Tyr20
8 SUB DB08252 6 His107 Tyr20, Lys85,
Lys105
Tyr20, Phe138, Phe141 Tyr20 Tyr20
9 SUB DB07702 3 His107 - Tyr20, Leu88, Phe141,
Val145, Met247
- -
DISCUSSION
80
5. DISCUSSION
The aim of this study was to develop and validate an in silico prediction model for ligands of
SULT subtype 1E1 which plays a role during phase II metabolism and shows high affinity
towards estrogenic molecules. To this end, four consecutive steps were conducted starting with
the analysis of SULT1E1 crystal structures to understand the structural basis of enzyme activity
and substrate specificity (chapter 4.1). Based on the structural investigation, a computer-based
model for SULT1E1 ligands was developed and validated that allows differentiation between
substrates and inhibitors (chapter 4.2). The final prediction model was applied in a virtual
screening of several publicly available databases to assess the extent of SULT metabolism on
current drugs, natural products and chemicals (chapter 4.3). Lastly, a selection of compounds
was chosen and experimentally tested for validation of the computer-based prediction model of
SULT1E1 activity (chapter 4.4).
5.1. Structural investigation on SULT1E1
The first step of this study was to structurally investigate the enzyme to identify catalytically
important features and descriptors influencing the substrate specificity of SULT1E1. The
inspection of all available crystal structures of SULT1E1 revealed basic enzymatic features that
were taken into account later on during model development. These features include the barrel-
like conformation of the active site which is lined with lipophilic and/or aromatic amino acid
residues creating an environment that favours ligands with high LogP values and the catalytic
centre at the inner end of the ligand-binding site consisting of catalytically important amino acids
Lys105 and His107. The co-crystallised ligands from four of the PDB structures, which include
highly potent inhibitors and the natural substrate E2 show similar binding conformations in
which the hydroxyl groups of the ligands point towards the active site centre, i.e. His107 and
cofactor PAPS, while occupying distances of 2.4 Å to 2.8 Å. The distance between the hydroxyl
group of a substrate and His107 is of critical importance for the sulfonation reaction since this
residue is responsible for deprotonating the substrate which triggers the nucleophilic attack of
the substrate oxygen towards the sulphur of the cofactor. Interestingly, not only substrates
occupy this position but also highly affine inhibitors as seen after crystal structure
superimposition. The finding that inhibitors also occupy space in close proximity to His107
indicates that this distance is important for sulfonation reactions but also enzyme inhibition.
Another criterion that was reported to influence the substrate specificity of SULTs are the three
DISCUSSION
81
protein loops that surround the active site of SULTs. These loops have been reported to be flexible
and are able to modulate the shape of the active site90. This loop flexibility could not be observed
across the five crystal structures of SULT1E1 which showed nearly identical protein backbones.
Only slight variations in protein backbone conformation were found in loop 1. The comparison
of SULT1E1 to -1A1 and -2A1 revealed differences in loop conformations and also amino acid
residue composition, especially in loop 1 and loop 2. This finding supports the theory that these
loops shaping the active sites of SULTs contribute to specific substrate selectivities and that ligand
binding also depends on the size and physicochemical properties of a molecule.
5.2. Development of a prediction model for SULT1E1
Based on observations obtained during structural investigations, a workflow for the development
of a prediction model was developed (chapter 4.2.1). Molecular dynamics simulation was the
method of choice to explore structural flexibility of the active of SULT1E1. Based on these
simulations, protein conformations were extracted that had diverse loop conformations, i.e.
diverse active site shapes. These conformations in combination with a ligand database of active
SULT1E1 ligands were used in an ensemble docking approach to investigate protein-ligand
interactions. After statistical and visual inspection of the docking results, 3D pharmacophores
were created that were based on different ligand types (different molecular scaffolds) and classes
(substrates, inhibitors, and CDLs) to address the broad ligand spectrum of SULT1E1 and to
broaden the applicability of the model. For prediction refinement, machine learning models were
created based on SVMs that allow substrate and inhibitor classification. The novelty of these
models lies in the usage of the PFS as descriptors which, on the present state of our knowledge,
has not been reported before.
To this day, only two other structure-based prediction models have been published that
incorporated protein flexibility by applying MD simulations to the enzyme to sample the
conformational space187,188. The first study utilized docking in a virtual screening of the
DrugBank40 and a distance cut-off was set to predict ligands of SULT subtypes 1A1 and 2A1
reporting accuracies of 100 % (based on experimental evaluation of predicted substrates)187. In the
second study applied to SULT1A1, -1A3, and -1E1 MD simulations and docking were performed.
The resulting energy calculations were used to create QSAR models to predict ligands of the
enzymes188. Though lacking experimental validation, their models achieved (retrospective)
prediction accuracies of 67 %, 78 %, and 76 %188. In comparison, the here presented study showed
a pharmacophore specificity of 60 % with a decoy rate of 2 % and a SVM classification accuracy
DISCUSSION
82
of 91 % and 85 % for substrates and inhibitors of SULT1E1, respectively. Furthermore, the results
from the experimental evaluation of nine chosen compounds confirmed the in silico prediction.
Unfortunately, the selection of tested molecules was restricted to a number of nine. Nevertheless,
almost one third of the molecules that were predicted ligands of SULT1E1 were confirmed
through literature search which indicates solid reliability of the prediction model.
Evidence of active site flexibility caused by the protein loops of SULTs203, led to the decision of
performing MD simulations on SULT1E1 as a first step of the model development, even though
the five available crystal structures of SULT1E1 showed only minor indications of such flexibility
(chapter 4.2.2). The simulations of SULT1E1 in presence and absence of cofactor PAPS displayed
increased flexibility of the protein backbone, especially in loop 1 with fluctuations of up to 6.8 Å.
In general, substrate specificities of different SULT subtypes are very distinct. SULT1A1, -1E1,
and -2A1 have substrate preferences for small phenolic molecules, estrogens, and
hydroxysteroids, respectively. Interestingly, SULT2 enzymes evolutionarily lack loop 1 leaving
the active site entry more open to bigger ligands. It could be surmised that the increased flexibility
of loop 1 observed in SULT1E1 enables larger ligands to bind, such as molecules with steroidal
scaffold similar to SULT2 enzymes. Further it was stated by Cook et al. that loop 3 is divided by
a hinge region and that the active site oscillates between a closed and an open state194,204. This
finding was supported by the MD simulations of SULT1E1 in which the division of loop 3 into a
part covering the active site and another part covering the cofactor binding site resulted in a
disjunction of loop 3 movements. In absence of cofactor PAPS, the part of loop 3 that covers this
molecule, was highly flexible while staying closely attached to the protein in presence of the
cofactor. Surmising that loop 3 plays a crucial role in the formation of dead-end complexes, the
energy barrier for PAP release after sulfonation might force the enzyme to prolong its inactive
state with catalytically-incompetent PAP bound. PAP release was also found to be the rate-
limiting step98,99 supporting this theory of the origin of dead-end complexes.
An advantage of performing MD simulations is the possibility to simulate protein conformations
that differ from the template structure. Although, it should be noted that according to the Ergodic
hypothesis which states that the time average equals the ensemble average, full conformational
sampling is restricted by simulation time. If a simulation is ergodic and indefinitely evolves in
time, eventually the system will adopt all possible conformations. Due to the fact that MD
simulations are restricted to time scales ranging from nano- to miliseconds, sampling of the
conformational space of the molecular system is limited. Here, MD simulation trajectories were
clustered based on active site conformations and extracted for further docking experiments
(chapter 4.2.4). Studies have been published reporting benefits from using ensemble docking with
DISCUSSION
83
multiple protein structures328,329. It should be mentioned, that the protein template, PDB crystal
structure 1HY3, which was used for MD simulations, was excluded from the ensemble docking
approach and only ten protein conformations were used that were extracted from MD
trajectories. It would have been interesting to investigate protein preferences for ligand-binding
during ensemble docking between the PDB template and the ten MD conformations. This
approach was used later in this study. In two ensemble docking experiments, the nine
experimentally tested compounds were docked into cofactor-bound MD conformations P1 to P5
in absence and presence of the PDB template. Comparing the results of these two approaches via
heat mapping, the PDB template showed increased suitability for ligand binding since the
majority of the nine compounds was docked preferentially into the PDB template. In absence of
the PDB, docking preferences evolved towards cofactor-bound conformation P3.
Based on MD simulations and ensemble docking, eight specific 3D pharmacophores were created
(chapter 4.2.5). Cofactor-bound protein conformations were chosen as structural templates to
model the 3D pharmacophores based on catalytically competent enzyme states (in contrast to the
apo conformations). The phenomenon of substrate inhibition and thus the differentiation
between substrates and inhibitors was addressed on the assumption that these molecules –
although occupying the same space in the active site of SULT1E1 - have different interaction
patterns with the enzyme in terms of pharmacophore features. Thus, specific 3D pharmacophores
were created that enable efficient virtual screening of molecule databases and identification of
substrates, inhibitors, and CDLs regarding specific ligand-protein interactions. These eight 3D
pharmacophores were developed based on different ligands featuring various chemical scaffolds
to cover a broad range of potential active ligands of SULT1E1. Additionally, these 3D
pharmacophores take into consideration the steric environment of the active site of SULT1E1 and
thereby also reflect the structural flexibility and active site volume (restrictions) of the enzyme.
Nevertheless, the phenomenon of substrate inhibition of SULTs has not been fully elucidated yet
and still, many hypotheses exist regarding its causes. One of the proposed reasons for substrate
inhibition in SULTs is the formation of so-called dead-end complexes, i.e. un-sulfonated cofactor
PAP bound to the enzyme, which renders it catalytically incapacitated. These dead-end
complexes could not be considered during prediction model development due to infeasibility of
incorporating this factor into a computer-based prediction model. Another hypothesised reason
for substrate inhibition in SULTs is the presence of multiple binding sites, though a remotely-
placed binding site in SULTs has not been reported (presumably also due to the small size of the
enzyme of 35 kDa). Nevertheless, an allosteric binding site within the active site was proposed in
several studies on SULT subtype 1A1 and evidence for double-ligand binding to the enzyme was
DISCUSSION
84
supported by x-ray crystallography330,331. The available crystal structures of SULT1E1 do not
indicate the existence of such an allosteric binding site for this SULT subtype and allosteric
binding was not considered in the presented final prediction model of SULT1E1. The
phenomenon of substrate inhibition turns the endeavour of developing a prediction tool for SULT
activity into a difficult process. Another factor that influences enzyme kinetics, which is highly
challenging to abstract into an in silico prediction model is the change of cofactor concentrations
in the cytosol of a cell. It has been shown that PAPS concentrations highly vary in vivo depending
on the tissue and also depending on the sulfonation rates and the activity of PAPS-forming
reactions332. Furthermore, PAPS concentrations depend on the presence or concentration of
cytosolic and systemic sulfate which might vary depending on the physiological state of the
human body. Thus, fluctuations in cytosol composition, concentrations in sulfate, PAPS, and
enzymes, and other cytosolic interactions all together influence enzyme activity, such as
SULT1E1, and complicate in vivo prediction accuracies. The developed prediction model reported
here addresses the two physiologically relevant reactions of enzyme inhibition and sulfonation
which are predicted based on the 3D pharmacophore fit of a molecule, its physicochemical
properties, and its steric conformity towards the active site of SULT1E1. Due to the fact that an
ensemble of 3D pharmacophores was developed based on different ligand types (molecular
scaffolds) and classes (substrates, inhibitors, and CDLs), a broad range of potential substrates can
be covered during virtual screening. Nevertheless, the overall specificity of 60 % (based on the
test set of active molecules) indicates incomplete coverage of the full range of active ligands.
Fortunately, the usage of 3D pharmacophores as prediction model provides the opportunity to
easily expand the model by creating more pharmacophores to increase the specificity of the
prediction model and to increase the applicability of the model.
Two SVM models were trained to refine the prediction and classify hit molecules that were
identified via pharmacophore screening into substrates and inhibitors (chapter 4.2.7). The
accuracy of these two models showed solid classification performance (91 % for substrate
classification and 85 % for inhibitor classification). In consideration of the fact that these machine
learning models were used for prediction refinement and not as stand-alone prediction models,
the choice of molecular descriptors that were used as classification criteria were kept relatively
simple and manageable (pharmacophore fit scores and basic physicochemical descriptors). The
final models were based on the best-performing combination of descriptors, leaving the models
interpretable. This approach is also supported by the principle of 'Occam's razor' which is
associated with the theoretical work of William of Ockham (1287 – 1347) and which suggests to
select the hypothesis with the fewest assumptions in case of competing hypotheses (i.e.
DISCUSSION
85
supporting simplicity of hypotheses). Historically, this principle was adduced as a heuristic
method for the development of theoretical models during scientific research333,334. Still, it would
have been interesting to further explore whether the usage of other, more sophisticated
descriptors, such as fingerprints, would have influenced model performance. Nevertheless, the
chosen approach to keep the models simple and interpretable served our purpose of refining the
prediction of hit molecules and evaluation of the final model indicated solid performance.
5.3. Virtual screening and prediction of SULT1E1 ligands
The prediction model was used in virtual screening approaches of the DrugBank40 and the vendor
libraries from OTAVA Ltd. (database of drug-like chemicals) and AnalytiCon Discovery GmbH
(database of natural products). The DrugBank screening resulted in 68 hits from which about
28 % were identified as active ligands through literature search. Among the DrugBank hits were
FDA-approved drugs with estrogenic properties, such as contraceptives or SERMs which reflects
the substrate specificity for SULT1E1 for estrogenic compounds. The screening of the OTAVA
and AnalytiCon databases resulted in 104 and 279 total hits, respectively. For AnalytiCon, 14 %
of the inhibitors, about 30 % of the CDLs, and 24 % of the substrates could be validated through
literature, indicating robust applicability of the prediction model on natural product libraries.
From the 279 total hits of the AnalytiCon screening, three were confirmed through literature. The
low number of identified hits might be caused by the chemical nature of the compounds and the
fact that these compounds were not experimentally assessed as frequently as natural products or
drugs.
5.4. Experimental validation of predicted hits
From the predicted DrugBank hits, nine compounds were selected for experimental evaluation
which was conducted in collaboration with the German Institute of Human Nutrition (DIfE)
Potsdam-Rehbrücke, Germany, and the University of Potsdam, Nuthetal, Germany. Two
experimental approaches were established to address both reactions, enzyme inhibition and
molecule sulfonation, and the experimental results confirmed our in silico hypotheses.
Interestingly, two of the molecules that were classified as substrates also showed relatively strong
enzyme inhibition (IC50 values of about 90 nM for compound 9 and about 21 µM for compound
8). This finding triggers the question why these compounds were not predicted to be CDLs. To
shed light on this matter, it should be noted that the here presented prediction model was based
DISCUSSION
86
on a database of active ligands that were reported in current literature. Though very often, these
experimental studies that report inhibition of SULT or sulfonation of molecules catalysed by
SULT do not test (or report) both reactions but rather focus on either enzyme inhibition or the
detection of metabolites. Generally, the computer-based prediction can only be as accurate as the
experimental data it was built on, meaning in this case, that the prediction of a molecule being a
substrate does not rule out the possibility of potential enzyme inhibition by the same molecule.
Thus, every prediction should be taken with care and should only be used for guidance or alert
during drug discovery campaigns.
CONCLUSIONS AND OUTLOOK
87
6. CONCLUSIONS AND OUTLOOK
Acting in phase II metabolism, the enzyme family of SULTs is responsible for the
biotransformation of molecules serving detoxification. Due to their involvement in drug
inactivation and the transformation of substances into chemically reactive metabolites, SULT
metabolism is a criterion that should be considered during development and risk assessment of
novel active substances. The aim of the present study was to develop, validate and apply a
computer-based prediction model for SULT1E1 ligands that allows efficient virtual screening of
large databases, identification of active molecules, and further differentiation into SULT1E1
substrates and inhibitors.
Investigations of SULT crystal structures and sequence alignments revealed structural elements
that are important for ligand binding and allow distinction between the SULT subtypes 1E1, 1A1,
and 2A1. For the development of an in silico prediction model of SULT1E1 ligands, a specific
workflow was designed based on MD simulations to investigate structural flexibility of the
enzyme, which was linked to their broad substrate spectra and sample the conformational space
to generate conformations that differ from the conformation found in SULT1E1 crystal structures.
An ensemble of structurally diverse protein conformations was extracted and used in an
ensemble docking approach to generate ligand-target complexes of active SULT1E1 ligands
including substrates, inhibitors, and CDLs. Statistical analysis of the docking performance
resulted in heat maps that provided useful guidance for the selection of ligand-protein complexes
for further 3D pharmacophore development. Based on a selection of complexes, eight specific 3D
pharmacophores were created, addressing different ligand types (substrates, inhibitors, and
CDLs) and classes (different binding affinities or IC50 values). These eight 3D pharmacophores
were validated based on a test set and overall sensitivity and specificity were 60 % and 98 %,
respectively. In order to refine the pharmacophore-based prediction, which was ambiguous in
some instances, a specific substrate filter was established that was used to filter out molecules
without hydroxyl group (which is a prerequisite for sulfonation reactions). Furthermore, two
classification models based on SVMs were developed to efficiently classify predicted hits into
substrates or inhibitors of SULT1E1. These classification models were based on basic molecular
descriptors and the pharmacophore fit score to keep the model simple and interpretable. The
prediction accuracies of the substrate and the inhibitor SVM models equalled 91 % and 85 %,
respectively.
CONCLUSIONS AND OUTLOOK
88
The final prediction model was used in a virtual screening of the DrugBank consisting of about
6,500 experimental and FDA-approved drugs to investigate the impact of SULT1E1 sulfonation
and inhibition on current drugs. From the predicted 68 hit molecules, 28 % were found to be
active SULT1E1 ligands through literature. A selection of nine compounds was experimentally
tested in collaboration with the German Institute of Human Nutrition (DIfE) Potsdam-
Rehbrücke, Germany, and the University of Potsdam, Germany. The experimental evaluation
was based on two approaches, firstly, to analyse inhibition of SULT1E1, and secondly, to
determine sulfonation of selected compounds by the enzyme. The experimental results confirmed
our computer-based hypotheses and led to the identification of compounds listed in the
DrugBank that were not identified to be active on SULT before. Furthermore, the in silico
prediction model allowed correct prediction of the site of metabolism of the tested substrates and
could therefore not only be used for substrate identification but also SOM prediction. To date, the
here presented prediction model is the first experimentally validated prediction model for
SULT1E1 ligands that was based on a structure-based approach using MD simulations.
Although this study reports on a successful development, validation, and application of an in
silico prediction model for SULT1E1 ligands based on 3D pharmacophores and machine learning
classification, there are certain points that could be addressed to further improve the reported
model and, thus, the screening performance in the future as an extension of the presented work.
As mentioned before, the eight developed 3D pharmacophores showed an overall specificity of
60 % indicating insufficient coverage of the range of known active SULT1E1 ligands. The usage
of 3D pharmacophores as a prediction tool provides the opportunity to extend the
pharmacophore ensemble by new pharmacophore models to increase prediction specificity and
to cover a broader range of potential SULT1E1 ligands. Another result confirming the lack of the
model to cover all active ligands was the prediction of 68 hits after virtual screening of the
DrugBank, i.e. a hit rate of about 1.1 % of the complete database. It was reported that about 75 %
of all marketed drugs are also substrates of enzymes that belong to the phase II metabolism22.
This indicates that the here presented prediction model of SULT1E1 might be too restrictive and
should be extended to cover a broader range of active molecules.
Another factor that could be improved is the practicability of the current model. Although the
first step during in silico prediction, the 3D pharmacophore screening, is very feasible and
efficient, the second part, i.e. the application of SVM models, is relatively inconvenient. Thus,
streamlining the second part of the prediction by developing intuitive and user-friendly
command line tools would improve practicability of the prediction model. In addition to that, the
CONCLUSIONS AND OUTLOOK
89
development of an online application or implementation of the prediction model into a webserver
would improve usability and speed even further.
Also, the universality of the model could be improved regarding general metabolism prediction
by including more prediction models for other SULT subtypes or even other metabolic enzymes,
such as UDP-glucuronosyltransferases, into a more comprehensive prediction model.
It could be hypothesized that the accuracy of the SULT1E1 prediction could be improved by
incorporating high-quality kinetic data into the prediction model, such as kon and koff values. As
mentioned before, the binding conformations of active substrates and inhibitors of SULT1E1 are
relatively similar for these molecules regardless of their nature (inhibition or sulfonation). This
raises the question what the defining factor is that differentiates substrates from inhibitors. As
often reported for SULTs, dead-end complexes are among the main reasons for the phenomenon
of substrate inhibition, caused by the presence of catalytically inactive PAP which renders the
enzyme incapable of sulfonation. Surmising that ligand binding and un-binding rates will also
play a role during substrate inhibition, it would be very interesting to conduct experiments
measuring kon and koff rates of SULT1E1 substrates, inhibitors, and CDLs and investigate enzyme
kinetics. The generation of such data and their incorporation into the prediction model might
improve prediction accuracy.
Moreover, only nine compounds were tested experimentally. In the future it would be interesting
to investigate all predicted molecules for example in high-throughput assays and assess model
accuracy based on experiments of the entire prediction.
EXPERIMENTAL SECTION
90
7. EXPERIMENTAL SECTION
7.1. Computational methods
Molecular dynamics simulations
As template for structure-based studies on human SULT1E1, Protein Data Bank (PDB) entry
1HY393 (resolution of 1.8 Å) was selected. This enzyme was crystallised as a homodimer in
complex with cofactor PAPS in its active form (instead of un-sulfonated PAP). Chain B of the
crystallised enzyme was analysed and fixed (e.g. insertion missing atoms) using the software
Molecular Operating Environment (MOE) 2010.12273. The prepared monomer was submitted to
MAESTRO (SCHRÖDINGER release 2014-2, version 9.8) for protein preparation and set up of
the system. Molecular dynamics (MD) simulations were performed using the Desmond MD
package version 3.1.51335 and the OPLS-AA 2005 force field239. For pKa calculations, PROPKA336
was applied and crystal water was removed beyond 5 from the protein. Using an orthorhombic
box with a distance of 10 Å from the protein, the box was filled with simple point charge (SPC)
water with a salt concentration of 0.15 M NaCl for overall neutral charge. Minimization
conditions were set to 2000 iterations with a convergence threshold of 1.0 kcal/mol/Å and
relaxation was achieved using the Desmond relaxation protocol for NPT conditions using the
following time changes: 360 ps and 720 ps instead of 12 ps and 24 ps, respectively. All simulations
were performed in triplicates with a total runtime of 100 ns each on the Soroban computer cluster
at the Freie Universität Berlin. Trajectory frames were recorded every 4.8 ps. MD simulations
were analysed based on root-mean-square deviations (RMSDs) and root-mean-square
fluctuations (RMSFs). RMSD-based clustering using the g_cluster tool of GROMACS225 was
performed to extract diverse enzyme conformations with a focus on the active site (Cα atoms of
residues 84 to 87, 237 to 259, and 142 to 150). The first 3000 frames were excluded from the
clustering process (equals 14.4 ns). Gromos method was chosen as clustering method with cutoffs
of 0.28 for PAPS-bound conformations and 0.25 for apo conformations. Cluster centres were
extracted as pdb files for subsequent molecular modelling steps.
Further, MD simulations were run in order to create dynophores of the ligand-protein complexes
that were originally used to develop the eight 3D pharmacophores that were incorporated into
the final prediction model of SULT1E1 ligands. These ligand-protein complexes were prepared
and systems were built as described above. All eight systems were simulated for 100 ns in
triplicates in presence of cofactor PAPS. The eight ligand-protein complexes were simulated as
follows: SUB1 = P3 and Cole-2b [REF]; CDL1 = P5 and E2; CDL2 = P3 and kaempferol; INH1 = P5
EXPERIMENTAL SECTION
91
and 2-OH-1,3,7,8-tetrachlorodibenzo-p-dioxin; INH2 = P3 and 4-OH-2,3,5,2’,4’,5’-
hexachlorobiphenyl; INH3 = P5 and 4-OH-2,2’,4’,6’-tetrachlorobiphenyl; INH4 = P3 and 2-OH-
7,8-dichlorodibenzo-p-dioxin; INH5 = P5 and daidzein-4-sulfate. Dynophores were kindly
provided by Dominique Sydow using the DynophoreApp312.
Dataset preparation
In order to collect active ligands of human SULT1E1, literature search and investigation of the
database BRENDA305 was performed. Reported substrates and inhibitors were collected and their
3D structures were processed using the software Corina 3.0.0337. Minimization of the molecules
was achieved based on the force field MMFF94338. Due to the fact that some active molecules
showed substrate inhibition, i.e. they were simultaneously reported as substrates that are able to
inhibit SULT1E1 in a concentration-dependent manner, these molecules were categorized as
'concentration-dependent ligands', or CDLs. The full list of active molecules comprised 36
substrates, 72 inhibitors, and 10 CDLs. For visualization of the datasets and identification of
potential clusters or outliers, principal components analysis (PCA) was performed based on
standard molecular descriptors calculated via MOE273.
For developing and validating 3D pharmacophores, the subsets of inhibitors and substrates from
the full list of collected molecules that are active on SULT1E1 were further partitioned into a
training and a test set. Partitioning was manually performed based on structural similarity. The
creation of decoys, i.e. presumably inactive molecules regarding SULT1E1, was performed using
an in-house KNIME317 workflow implemented by Dr. Susanne Dupré that is based on the ZINC
database339 and the online webserver Directory of Useful Decoys, Enhanced (DUD-E)266.
Ensemble docking and 3D pharmacophores
Based on active site clustering of the trajectories of MD simulations of the apo and cofactor-bound
enzyme SULT1E1, ten conformations (5 apo and 5 PAPS-bound structures) were extracted for
usage in an ensemble docking approach. Two ensemble docking runs were performed each with
the training set of active molecules. One approach was based on the five apo and the second,
based on the cofactor-bound structures. The input files were submitted to the GOLD suite v5.1243
using default parameters and the Piecewise Linear Potential (ChemPLP) scoring function340. Each
molecule was docking 100 times into the five apo or cofactor-bound conformations. The docking
protocol was legitimized by reproduction of the conformation of ligand 3,5,3’,5’-
tetrachlorobiphenyl-4,4’-diol co-crystallised in PDBID 1G3M298.
EXPERIMENTAL SECTION
92
The software LigandScout 3.1267-269 was used to analyse the ensemble docking results statistically
in terms of 3D pharmacophore features. These features include hydrogen bond donors and
acceptors, hydrophobic contacts, aromatic and ionic interactions. Data matrices were submitted
to Gnuplot 4.6 for heat map generation. LigandScout was used to create 3D pharmacophores of
selected protein-ligand complexes. Validation of the 3D pharmacophores was performed based
on virtual screening of test set molecules. Sensitivity and specificity were calculated to guide 3D
pharmacophore refinement based on the training set and to validate the final pharmacophores
based on test set screening.
Further, ensemble docking was performed using the nine selected compounds that were
predicted from the virtual screening of the drug bank. Two ensemble docking approaches were
pursued using either all five MD protein conformations extracted via clustering, P1 to P5, plus
the PDB template 1HY3 [REF], or using only the five MD protein conformations, P1 and P5, in
absence of the PDB template. Docking runs were performed as described above with 100 docking
runs per ligand. The results were analysed based on 3D pharmacophore features using
LigandScout267-269 and matrices with statistic data were transformed into heat maps using Gnuplot
4.6. The docking conformations were carefully, visually analysed in LigandScout and 3D
pharmacophores were created in order to characterize and investigate ligand-protein
interactions.
Virtual screening
Databases were obtained from providers (DrugBank, OTAVA Ltd. and AnalytiCon Discovery
GmbH) and molecules were prepared using the software MOE273. Screening libraries were
created using the LigandScout tool idbgen with default parameters. Libraries to screen comprised
the DrugBank 3.040, which consisted of 6,494 experimental and FDA-approved drugs, the OTAVA
Ltd. database OTAVA green, that contained 137,912 molecules with properties matching
Lipinski's Rule of Five, and the AnalytiCon MEGx database provided by AnalytiCon Discovery
GmbH, which comprised 4,558 natural products from plant or microorganisms (size of databases
equals number of molecules in the libraries after library generation via idbgen). All three libraries
were screened with the eight developed 3D pharmacophores. Literature search using SciFinder341
was performed on all hit molecules.
Machine learning
Classification models were developed based on selected active molecules from the previously
created database of SULT1E1 ligands and decoys. In order to develop a classification model for
EXPERIMENTAL SECTION
93
inhibitors and a separate classification model for substrates, two different approaches were
pursued. The inhibitor training set comprised 57 molecules with 41 active and 16 inactive
substances, and the test set included 1289 molecules with 27 active, 18 inactive, and 1244 decoy
molecules. The threshold for inhibitor discrimination was defined as 10 µM (IC50). The training
set for substrate classification contained 23 actives and 29 decoys, and the test set comprised 23
actives and 979 decoys. Descriptor calculation which included standard molecular properties
(relative topological surface area (Rel. TPSA), number of rotatable bonds, acceptors, donors,
rings, cLogP, MW, and heavy atoms ) and the pharmacophore fit score (PFS)268 of the eight 3D
pharmacophores was performed using LigandScout 3.1267-269. Definition of the PFS was is as
follows: PFS = (10 x n) + (9 – 3 x min(r,3)) with n being the number of geometrically matched
feature pairs, and r being the RMSD of the matched feature pair distance268. The software MOE273
was used to handle molecule databases of training and test sets and KNIME317 was used for
subsequent development of classification models for substrates and inhibitors of SULT1E1.
Applied methods included support vector machines (SVM)342,343, decision trees (DT)344,345, neural
networks (NN) (multi-layer perceptron)346, random forest (RF) and Naive Bayes classification
(NB).
Descriptor selection was performed manually for the SVM model and was legitimized in
comparison to the WEKA KNIME node attribute selector which was used as an automated
descriptor selector (Best fit method)317,318. The SVM models were built using a polynomial kernel
with power, bias and gamma set to 1 and the final models for inhibitor and substrate classification
were incorporated into the final prediction model. For reasons of comparison, other machine
learning models were built in comparison to SVM models based on WEKA descriptor selections.
The models based on ANN had the following settings: maximum number of iterations = 50,
number of hidden layers = 1, number of hidden neurons per layer = 10. Decision tree settings
included a pruning method to avoid overfitting. Applicability domains of input molecules were
evaluated based on Euclidian distances. Model performance was assessed by creating confusion
matrices including true positive (TP), false positive (FP), true negative (TN), and false negative
(FN) hits. Classification quality was evaluated in terms of sensitivity (Se) (equation 5), specificity
(Sp) (equation 6), accuracy (ACC) (equation 7), and Matthew’s correlation coefficient (MCC)
(equation 8).
EXPERIMENTAL SECTION
94
7.2. Experimental methods
The experimental part of this study was conducted in the facilities of the German Institute of
Human Nutrition (DIfE), Nuthetal, Germany, and the University of Potsdam, Nuthetal,
Germany. The enzymatic assay was set up and conducted by Christin Rakers under supervision
of Dr. Walter Meinl and Prof. Hansruedi Glatt (DIfE). The metabolite detection using mass
spectrometry was performed by Dr. Fabian Schumacher under coordination of Prof. Burkhard
Kleuser (University of Potsdam).
Chemicals
Carbosynth Limited (Berkshire, UK) supplied isoliquiritigenin (1) (CAS 961-29-5) and 17-
epiestriol (9) (CAS 1228-72-4) with purities of > 98 %. Indazole-Cl (2) (CAS 848142-62-1),
prinaberel (3) (CAS 524684-52-4), ZM241385 (4) (CAS 139180-30-6) and 2-(4-
hydroxyphenylazo)benzoic acid (7) (CAS 1634-82-8) with compound purities of ≥ 98 % as well as
α-naphthol (CAS 90-15-3) with a purity of > 99 % and α-naphthylsulfate, potassium salt (CAS
6295-74-5) were purchased from Sigma-Aldrich (Taufkirchen, Germany). Ambinter (Orléans,
France) supplied Amb1890033 (5) (CAS 341977-89-7), Amb1899186 (6) (CAS 769166-22-5) and
Amb4444666 (8) (CAS 158860-23-2) with purities of 99 %, 99 %, and 93 %, respectively.
Due to lack of vendor specifications, purities of compounds 5, 6, and 8 were assessed using an in-
house HPLC protocol. Compounds were dissolved in Acetonitrile and 0.1 % DMSO and 5 µl of
each sample were injected into the HPLC. Runs were performed under isocratic conditions using
80 %/ 20 % Acetonitrile/H2O with a total run time of 15 min. Calculated peak areas and absence
of other peaks were used as indicators for compound purity.
Using the recombinant enzyme PAPS synthetase 1 which is expressed in Escherichia coli, PAPS
(3'-phosphoadenosine-5'-phosphosulfate) was produced and purified using preparative anion
exchange HPLC. The purity of PAPS was determined as ≥ 99 % (HPLC with UV detection).
Bacterial strains and cytosolic preparations
The human enzyme SULT1E1 was expressed in S. typhimurium TA1538 using the pKK233-2
expression vector as described previously347,348. After overnight growth of modified bacteria in
presence of ampicillin (100 µg/ml) in Luria Broth medium (Roth, Karlsruhe, Germany) under
shaking at 37 °C for 8 h, preparation of cytosolic, bacterial fractions was performed as described
previously348,349. Using the bicinchoninic assay (Thermo Fisher Scientific, Bonn, Germany)
EXPERIMENTAL SECTION
95
according to manufacturer’s recommendations, the final protein concentration was determined
as 4.6 mg/ml. Aliquots were stored at -80 °C.
Enzymatic assay of SULT1E1
Based on preliminary assays to optimize experimental conditions, the incubation time of the
enzyme SULT1E1 with substrate α-naphthol was set to 15 min and the protein concentration with
linear formation of α-naphthylsulfate was determined to be 2.3 µg per incubation sample. Each
sample contained a standard mixture of 50 mM potassium phosphate buffer (pH 7.4), 5 mM
MgCl2, 50 µM PAPS, and 2.3 µg protein in a total volume of 100 µl. Pre-incubation of samples for
2 min at 37 °C under gentle shaking was followed by substrate addition which initiates the
enzymatic reaction. For determining Michaelis-Menten kinetics of α-naphthol sulfonation by
human SULT1E1, ten different substrate concentrations were added to the incubation samples,
ranging from 0.1 to 30 µM. After incubating the samples for 15 min at 37 °C under shaking, the
enzymatic reaction was terminated by heat inactivation for 2 min at 95 °C. After another 10 min
of incubation on ice, denatured, samples were centrifuged at 15,000 rpm at 4 °C for 10 min and
supernatant was stored at –20 °C.
Inhibition assays for the purchased compounds were conducted by pre-incubating standard
sample mixtures with different concentrations of those compounds at 37 °C for 2 min under
gentle shaking. The enzymatic reaction was initiated by adding 10 µM α-naphthol to the samples
and subsequent steps were conducted as described above. The concentrations for the nine
compounds were as follows: 1 to 10 µM for 1, 0.5 to 8 µM for 2, 0.1 to 1 µM for 3, 30 to 140 µM
for 4, 50 to 800 nM for 5 and 6, 0.25 to 4 mM for 7, 5 to 80 µM for 8, and 75 to 300 nM for 9.
To determine potential sulfonation of the purchased compounds, samples were incubated with
compounds 1 to 4 and 7 to 9 using concentrations close to their IC50 values (8 µM of 1, 4 µM of 2,
1 µM of 3, 200 µM of 4, 1 mM of 7, 30 µM of 8, and 200 nM of 9). In absence of previously used
substrate α-naphthol, sample mixtures were incubated at 37 °C for 3 h under gentle shaking
before terminating the reaction by heat inactivation (95 °C, 2 min) and subsequent cooling on ice
for 10 min. Supernatants were stored at -20 °C after centrifugation at 15,000 rpm at 4 °C for 10
min for liquid chromatography-tandem mass spectrometry (LC-MS/MS) measurements.
All enzymatic assays were conducted in triplicates except for the preliminary tests that were
performed to refine inhibitor concentrations. Analysis of data was executed using GraphPad
Prism 5 from GraphPad Software (La Jolla, CA, USA). Based on the Michaelis-Menten model
supported by Prism, Km and Vmax for α-naphthol sulfonation were determined to be 2.82 ± 0.49
EXPERIMENTAL SECTION
96
µM and 1432 ± 78 pmol min-1 mg-1, respectively. IC50 values were determined by nonlinear
regression (four parametric logistic standard curve analysis function).
HPLC analysis
α-Nahpthol and α–naphthylsulfate were determined in all enzyme assay samples using HPLC
(Dionex, Idstein, Germany) with a NovaPak C18 column (4 µm, 150 x 3.9 mm) from Waters
(Eschborn, Germany) at 30 °C isocratically with 0.1 M KH2PO4 containing (v/v) 0.1 % acetic acid,
0.75 % isopropanol and 4 % methanol at a flow rate of 0.7 ml/min. Both analytes were detected at
280 nm under ultraviolet detection and α-naphthylsulfate was determined under fluorescence
detection (λex = 280 nm, λem = 340 nm). Using standards ranging from 1 to 1,000 nM, calibration
curves of α-naphthylsulfate were prepared for quantification.
LC-MS/MS analysis
Due to lack of standards (i.e. sulfonated compounds 1 to 4 and 7 to 9), LC-MS/MS parameters
could not be optimized for each individual compound. Chromatographic parameters and
instrumental settings of the mass spectrometer based on a method previously described [REF]
were kept identical for determination of sulfo-conjugated compounds. Metabolite analysis was
performed using an Agilent 1260 Infinity LC system coupled to an Agilent 6490 triple
quadrupole-mass spectrometer (both from Waldbronn, Germany) interfaced with an electrospray
ion source operating in the negative ion mode (ESI-). Chromatographic separation was carried
out using an Agilent Poroshell 120 EC-C18 column (2.7 µm, 3 x 50 mm) tempered at 30 °C with
eluents A (10 mM ammonium acetate/methanol (90:10, v/v)) and B (acetonitrile/methanol (95:5,
v/v)). Before injecting 20 µl of each sample into a mobile phase of 90 % eluent A, all samples from
the enzyme assay described above were centrifuged at 15,000 rpm at 4 °C for 10 min. Using a 3-
min linear gradient to 30 % eluent A (flow rate 0.4 ml/min), analytes were eluted from the column.
Including re-equilibration of the column, total run time was 7 min. The following settings of the
ESI source were used: drying gas temperature = 120 °C, drying gas flow = 11 l/min of nitrogen,
sheath gas temperature = 400 °C, sheath gas flow = 12 l/min of nitrogen, nebulizer pressure = 40
psi, capillary voltage = 3000 V, nozzle voltage = 1500 V. For identification of the seven sulfonated
compounds, all samples were first screened for precursor ions by full scan MS mode (m/z 100 to
500). Identified precursor ions were then fragmented in the collision cell and characteristic
product ions were determined via product ion scans (low mass cutoff: m/z 50). In order to obtain
optimal product ion mass spectra, different collision energies ranging from 0 to 70 V were used.
BIBLIOGRAPHY
97
8. BIBLIOGRAPHY
[1] McNaught AD, Wilkinson A. IUPAC compendium of chemical terminology. 2nd ed,
Blackwell Science Oxford; 1997.
[2] Zanger UM. Introduction to drug metabolism. In: Anzenbacher P, Zanger UM, eds.
Metabolism of drugs and other xenobiotics, John Wiley & Sons; 2012, 287-296.
[3] Chast F. Chapter 1 - A history of drug discovery: From first steps of chemistry to achievements
in molecular pharmacology. In: Wermuth CG, ed. The practice of medicinal chemistry (third
edition). New York, Academic Press; 2008, 1-62.
[4] Smith RL, Williams RT. History of the discovery of the conjugation mechanisms. In: Fishman
WH, ed. Metabolic conjugation and metabolic hydrolysis. Vol. 1, Academic Press; 2014, 10-16.
[5] Conti A, Bickel M. History of drug metabolism: discoveries of the major pathways in the 19th
century. Drug Metabolism Reviews, 1977, 6:1-50.
[6] Baumann E. Ueber gepaarte Schwefelsäuren im Harn. Pflügers Archiv European Journal of
Physiology, 1876, 12:69-70.
[7] King RS. Historical perspective. In: Nassar AF, ed. Drug metabolism handbook: Concepts and
applications, Wiley; 2009, 3-10.
[8] Tréfouël JU, Tréfouël J, Nitti F, Bovet D. Activité du p-aminophénylsulfamide sur les infections
streptococciques expérimentales de la souris et du lapin. Comptes Rendus des Séances de la
Société de Biologie et de Ses Filiales, 1935, 120:756.
[9] The Nobel Prize in Physiology or Medicine 1939. Nobel Media AB 2014. Web., Available at:
http://www.nobelprize.org/nobel_prizes/medicine/laureates/1939/. (Accessed 04 Jan
2016),
[10] Williams RT. Detoxification mechanisms. 2nd ed, Chapman and Hall, London, UK; 1959.
[11] Kühne W. Ueber das Verhalten verschiedener organisirter und sog. ungeformter Fermente. FEBS
Letters, 1976, 62:E4-E7.
[12] Buchner E. Cell-free fermentation. Nobel Lecture, 1907:103-120.
[13] Stanley WM. The isolation and properties of crystalline tobacco mosaic virus. Nobel Lecture,
1946, 12:1942-1962.
[14] The Nobel Prize in Chemistry 1946. Nobel Media AB 2014. Web., Available at:
http://www.nobelprize.org/nobel_prizes/chemistry/laureates/1946/. (Accessed 04 Jan
2016),
[15] Murphy PJ. The development of drug metabolism research as expressed in the publications of
ASPET: Part 1, 1909–1958. Drug Metabolism and Disposition, 2008, 36:1-5.
[16] Murphy PJ. The development of drug metabolism research as expressed in the publications of
ASPET: Part 2, 1959–1983. Drug Metabolism and Disposition, 2008, 36:981-985.
BIBLIOGRAPHY
98
[17] Murphy PJ. The development of drug metabolism research as expressed in the publications of
ASPET: Part 3, 1984–2008. Drug Metabolism and Disposition, 2008, 36:1977-1982.
[18] Bachmann C, Bickel M. History of drug metabolism: The first half of the 20th century. Drug
Metabolism Reviews, 1985, 16:185-253.
[19] Estabrook RW. A passion for P450s (rememberances of the early history of research on
cytochrome P450). Drug Metabolism Disposition, 2003, 31:1461-1473.
[20] Parkinson A. Biotransformation of xenobiotics. In: Klaassen CD, ed. Cassarett and Doull’s
toxicology: The basic science of poisons. 5th ed, McGraw Hill, New York; 1996, 113-186.
[21] Josephy PD, Guengerich FP, Miners JO. "Phase I and phase II" drug metabolism: Terminology
that we should phase out? Drug Metabolism Reviews, 2005, 37:575-580.
[22] Testa B. Drug metabolism for the perplexed medicinal chemist. Chemistry & Biodiversity,
2009, 6:2055-2070.
[23] Testa B, Pedretti A, Vistoli G. Reactions and enzymes in the metabolism of drugs and other
xenobiotics. Drug Discovery Today, 2012, 17:549-560.
[24] Macherey A-C, Dansette PM. Chapter 33 - Biotransformations leading to toxic metabolites:
Chemical aspect. In: Wermuth CG, ed. The practice of medicinal chemistry (third edition). New
York, Academic Press; 2008, 674-696.
[25] Reinen J, Vermeulen NP. Biotransformation of endocrine disrupting compounds by selected
phase I and phase II enzymes--formation of estrogenic and chemically reactive metabolites by
cytochromes P450 and sulfotransferases. Current Medicinal Chemistry, 2015, 22:500-527.
[26] Modi S, Hughes M, Garrow A, White A. The value of in silico chemistry in the safety
assessment of chemicals in the consumer goods and pharmaceutical industries. Drug Discovery
Today, 2012, 17:135-142.
[27] Russell WMS, Burch RL, Hume CW. The principles of humane experimental technique.
London: Methuen, 1959.
[28] Benfenati E, Diaza RG, Cassano A, Pardoe S, Gini G, Mays C, Knauf R, Benighaus L. The
acceptance of in silico models for REACH: Requirements, barriers, and perspectives. Chemistry
Central Journal, 2011, 5:58.
[29] OECD principles for the Varidation, for Regulatory Purpose, of (Q)SAR Models OECD.org,
Available at: http://www.oecd.org/chemicalsafety/risk-assessment/validationofqsar
models.htm. (Accessed 04 Jan 2016),
[30] Hansch C, Fujita T. p-σ-π Analysis. A method for the correlation of biological activity and
chemical structure. Journal of the American Chemical Society, 1964, 86:1616-1626.
[31] Ekins S, Waller CL, Swaan PW, Cruciani G, Wrighton SA, Wikel JH. Progress in predicting
human ADME parameters in silico. Journal of Pharmacological and Toxicological Methods,
2000, 44:251-272.
[32] Gola J, Obrezanova O, Champness E, Segall M. ADMET property prediction: The state of the
art and current challenges. QSAR & Combinatorial Science, 2006, 25:1172-1180.
BIBLIOGRAPHY
99
[33] Lipinski CA, Lombardo F, Dominy BW, Feeney PJ. Experimental and computational
approaches to estimate solubility and permeability in drug discovery and development settings.
Advanced Drug Delivery Reviews, 1997, 23:3-25.
[34] Huang SM, Strong JM, Zhang L, Reynolds KS, Nallani S, Temple R, Abraham S, Habet
SA, Baweja RK, Burckart GJ. New era in drug interaction evaluation: US Food and Drug
Administration update on CYP enzymes, transporters, and the guidance process. The Journal of
Clinical Pharmacology, 2008, 48:662-670.
[35] Stjernschantz E, Vermeulen NP, Oostenbrink C. Computational prediction of drug binding
and rationalisation of selectivity towards cytochromes P450. Expert Opinion on Drug
Metabolism & Toxicology, 2008, 4:513-527.
[36] Khanna I. Drug discovery in pharmaceutical industry: Productivity challenges and trends. Drug
Discovery Today, 2012, 17:1088-1102.
[37] Guengerich FP. Cytochrome P450 and chemical toxicology. Chemical Research in
Toxicology, 2008, 21:70-83.
[38] Kirchmair J, Williamson MJ, Tyzack JD, Tan L, Bond PJ, Bender A, Glen RC.
Computational prediction of metabolism: Sites, products, SAR, P450 enzyme dynamics, and
mechanisms. Journal of Chemical Information and Modeling, 2012, 52:617-648.
[39] Kirchmair J, Goller AH, Lang D, Kunze J, Testa B, Wilson ID, Glen RC, Schneider G.
Predicting drug metabolism: Experiment and/or computation? Nature Reviews: Drug
Discovery, 2015, 14:387-404.
[40] Knox C, Law V, Jewison T, Liu P, Ly S, Frolkis A, Pon A, Banco K, Mak C, Neveu V,
Djoumbou Y, Eisner R, Guo AC, Wishart DS. DrugBank 3.0: A comprehensive resource for
'omics' research on drugs. Nucleic Acids Research, 2011, 39:D1035-1041.
[41] Wishart DS, Tzur D, Knox C, Eisner R, Guo AC, Young N, Cheng D, Jewell K, Arndt D,
Sawhney S. HMDB: The human metabolome database. Nucleic Acids Research, 2007,
35:D521-D526.
[42] Carlsson L, Spjuth O, Adams S, Glen RC, Boyer S. Use of historic metabolic biotransformation
data as a means of anticipating metabolic sites using MetaPrint2D and Bioclipse. BMC
Bioinformatics, 2010, 11:362.
[43] Boyer S, Arnby CH, Carlsson L, Smith J, Stein V, Glen RC. Reaction site mapping of
xenobiotic biotransformations. Journal of Chemical Information and Modeling, 2007, 47:583-
590.
[44] Grant JA, Gallardo M, Pickup BT. A fast method of molecular shape comparison: A simple
application of a Gaussian description of molecular shape. Journal of Computational Chemistry,
1996, 17:1653-1666.
[45] Sykes MJ, McKinnon RA, Miners JO. Prediction of metabolism by cytochrome P450 2C9:
Alignment and docking studies of a validated database of substrates. Journal of Medicinal
Chemistry, 2008, 51:780-791.
BIBLIOGRAPHY
100
[46] Freitas RF, Bauab RL, Montanari CA. Novel application of 2D and 3D-similarity searches to
identify substrates among cytochrome P450 2C9, 2D6, and 3A4. Journal of Chemical
Information and Modeling, 2010, 50:97-109.
[47] Goodford PJ. A computational procedure for determining energetically favorable binding sites
on biologically important macromolecules. Journal of Medicinal Chemistry, 1985, 28:849-857.
[48] Langer T, Bryant SD. Chapter 29 - 3D quantitative structure–property relationships. In:
Wermuth CG, ed. The practice of medicinal chemistry (third edition). New York, Academic
Press; 2008, 587-604.
[49] Cramer RD, Patterson DE, Bunce JD. Comparative molecular field analysis (CoMFA). 1. Effect
of shape on binding of steroids to carrier proteins. Journal of the American Chemical Society,
1988, 110:5959-5967.
[50] Cruciani G, Carosati E, De Boeck B, Ethirajulu K, Mackie C, Howe T, Vianello R. MetaSite:
understanding metabolism in human cytochromes from the perspective of the chemist. Journal of
Medicinal Chemistry, 2005, 48:6970-6979.
[51] de Graaf C, Oostenbrink C, Keizers PH, van der Wijst T, Jongejan A, Vermeulen NP.
Catalytic site prediction and virtual screening of cytochrome P450 2D6 substrates by
consideration of water and rescoring in automated docking. Journal of Medicinal Chemistry,
2006, 49:2417-2430.
[52] de Graaf C, Pospisil P, Pos W, Folkers G, Vermeulen NPE. Binding mode prediction of
cytochrome P450 and thymidine kinase protein−ligand complexes by consideration of water and
rescoring in automated docking. Journal of Medicinal Chemistry, 2005, 48:2308-2318.
[53] Ekins S, de Groot MJ, Jones JP. Pharmacophore and three-dimensional quantitative structure
activity relationship methods for modeling cytochrome P450 active sites. Drug Metabolism and
Disposition, 2001, 29:936-944.
[54] Schuster D, Laggner C, Steindl TM, Langer T. Development and validation of an in silico P450
profiler based on pharmacophore models. Current Drug Discovery Technologies, 2006, 3:1-48.
[55] Czodrowski P, Kriegl JM, Scheuerer S, Fox T. Computational approaches to predict drug
metabolism. Expert Opinion on Drug Metabolism & Toxicology, 2009, 5:15-27.
[56] de Groot MJ, Ackland MJ, Horne VA, Alex AA, Jones BC. Novel approach to predicting
P450-mediated drug metabolism: Development of a combined protein and pharmacophore model
for CYP2D6. Journal of Medicinal Chemistry, 1999, 42:1515-1524.
[57] Strobl GR, von Kruedener S, Stoeckigt J, Guengerich FP, Wolff T. Development of a
pharmacophore for inhibition of human liver cytochrome P-450 2D6: molecular modeling and
inhibition studies. Journal of Medicinal Chemistry, 1993, 36:1136-1145.
[58] Hritz J, de Ruiter A, Oostenbrink C. Impact of plasticity and flexibility on docking results for
cytochrome P450 2D6: A combined approach of molecular dynamics and ligand docking. Journal
of Medicinal Chemistry, 2008, 51:7469-7477.
[59] Park J-Y, Harris D. Construction and assessment of models of CYP2E1: Predictions of
metabolism from docking, molecular dynamics, and density functional theoretical calculations.
Journal of Medicinal Chemistry, 2003, 46:1645-1660.
BIBLIOGRAPHY
101
[60] Afzelius L, Hasselgren Arnby C, Broo A, Carlsson L, Isaksson C, Jurva U, Kjellander B,
Kolmodin K, Nilsson K, Raubacher F, Lars W. State-of-the-art tools for computational site of
metabolism predictions: Comparative analysis, mechanistical insights, and future applications.
Drug Metabolism Reviews, 2007, 39:61-86.
[61] Shaik S, Cohen S, Wang Y, Chen H, Kumar D, Thiel W. P450 enzymes: Their structure,
reactivity, and selectivity - Modeled by QM/MM calculations. Chemical Reviews, 2009,
110:949-1017.
[62] Li H, Sun J, Fan X, Sui X, Zhang L, Wang Y, He Z. Considerations and recent advances in
QSAR models for cytochrome P450-mediated drug metabolism prediction. Journal of
Computer-Aided Molecular Design, 2008, 22:843-855.
[63] Tropsha A. Best practices for QSAR model development, validation, and exploitation. Molecular
Informatics, 2010, 29:476-488.
[64] Nantasenamat C, Isarankura-Na-Ayudhya C, Prachayasittikul V. Advances in
computational methods to predict the biological activity of compounds. Expert opinion on drug
discovery, 2010, 5:633-654.
[65] U.S.FDA. Guidance for industry: Genotoxic and carcinogenic impurities in drug substances and
products: Recommended approaches, Draft guidance. Available at:
www.fda.gov/ohrms/dockets/98fr/fda-2008-d-0629-gdl.pdf. (Accessed 26 Jan 2016),
[66] Glatt H. Sulfotransferases in the bioactivation of xenobiotics. Chemico-Biological Interactions,
2000, 129:141-170.
[67] Jancova P, Anzenbacher P, Anzenbacherova E. Phase II drug metabolizing enzymes.
Biomedical Papers of the Medical Faculty of the University Palacky, Olomouc,
Czechoslovakia, 2010, 154:103-116.
[68] Blanchard RL, Freimuth RR, Buck J, Weinshilboum RM, Coughtrie MW. A proposed
nomenclature system for the cytosolic sulfotransferase (SULT) superfamily. Pharmacogenetics
and Genomics, 2004, 14:199-211.
[69] Falany C, Xie X, Wang J, Ferrer J, Falany J. Molecular cloning and expression of novel
sulphotransferase-like cDNAs from human and rat brain. Biochemical Journal, 2000, 346:857-
864.
[70] Freimuth R, Wiepert M, Chute C, Wieben E, Weinshilboum R. Human cytosolic
sulfotransferase database mining: Identification of seven novel genes and pseudogenes. The
pharmacogenomics journal, 2004, 4:54-65.
[71] Berman HM, Westbrook J, Feng Z, Gilliland G, Bhat TN, Weissig H, Shindyalov IN,
Bourne PE. The Protein Data Bank. Nucleic Acids Research, 2000, 28:235-242.
[72] Riches Z, Stanley EL, Bloomer JC, Coughtrie MW. Quantitative evaluation of the expression
and activity of five major sulfotransferases (SULTs) in human tissues: The SULT “pie”. Drug
Metabolism and Disposition, 2009, 37:2255-2261.
[73] Teubner W, Meinl W, Florian S, Kretzschmar M, Glatt H. Identification and localization of
soluble sulfotransferases in the human gastrointestinal tract. Biochemical Journal, 2007,
404:207-215.
BIBLIOGRAPHY
102
[74] Salman ED, Kadlubar SA, Falany CN. Expression and localization of cytosolic sulfotransferase
(SULT) 1A1 and SULT1A3 in normal human brain. Drug Metabolism and Disposition, 2009,
37:706-709.
[75] Dooley TP, Haldeman-Cahill R, Joiner J, Wilborn TW. Expression profiling of human
sulfotransferase and sulfatase gene superfamilies in epithelial tissues and cultured cells.
Biochemical and Biophysical Research Communications, 2000, 277:236-245.
[76] Whittemore RM, Pearce LB, Roth JA. Purification and kinetic characterization of a dopamine-
sulfating form of phenol sulfotransferase from human brain. Biochemistry, 1985, 24:2477-2482.
[77] Falany JL, Azziz R, Falany CN. Identification and characterization of cytosolic sulfotransferases
in normal human endometrium. Chemico-Biological Interactions, 1998, 109:329-339.
[78] Comer KA, Falany CN. Immunological characterization of dehydroepiandrosterone
sulfotransferase from human liver and adrenal. Molecular Pharmacology, 1992, 41:645-651.
[79] Geese WJ, Raftogianis RB. Biochemical characterization and tissue distribution of human
SULT2B1. Biochemical and Biophysical Research Communications, 2001, 288:280-289.
[80] Higashi Y, Fuda H, Yanai H, Lee Y, Fukushige T, Kanzaki T, Strott CA. Expression of
cholesterol sulfotransferase (SULT2B1b) in human skin and primary cultures of human epidermal
keratinocytes. Journal of Investigative Dermatology, 2004, 122:1207-1213.
[81] He D, Frost AR, Falany CN. Identification and immunohistochemical localization of
sulfotransferase 2B1b (SULT2B1b) in human lung. Biochimica et Biophysica Acta (BBA) -
General Subjects, 2005, 1724:119-126.
[82] Liyou NE, Buller KM, Tresillian MJ, Elvin CM, Scott HL, Dodd PR, Tannenberg AEG,
McManus ME. Localization of a brain sulfotransferase, SULT4A1, in the human and rat brain:
An immunohistochemical study. Journal of Histochemistry and Cytochemistry, 2003,
51:1655-1664.
[83] Glatt H, Boeing H, Engelke CE, Ma L, Kuhlow A, Pabel U, Pomplun D, Teubner W, Meinl
W. Human cytosolic sulphotransferases: Genetics, characteristics, toxicological aspects.
Mutation Research/Fundamental and Molecular Mechanisms of Mutagenesis, 2001,
482:27-40.
[84] Dong D, Ako R, Wu B. Crystal structures of human sulfotransferases: Insights into the
mechanisms of action and substrate selectivity. Expert Opinion on Drug Metabolism &
Toxicology, 2012, 8:635-646.
[85] Allali-Hassani A, Pan PW, Dombrovski L, Najmanovich R, Tempel W, Dong A, Loppnau
P, Martin F, Thornton J, Edwards AM, Bochkarev A, Plotnikov AN, Vedadi M,
Arrowsmith CH. Structural and chemical profiling of the human cytosolic sulfotransferases.
PLoS Biology, 2007, 5:e97.
[86] Wang J, Falany JL, Falany CN. Expression and characterization of a novel thyroid hormone-
sulfating form of cytosolic sulfotransferase from human liver. Molecular Pharmacology, 1998,
53:274-282.
BIBLIOGRAPHY
103
[87] Falany CN, Krasnykh V, Falany JL. Bacterial expression and characterization of a cDNA for
human liver estrogen sulfotransferase. Journal of Steroid Biochemistry and Molecular
Biology, 1995, 52:529-539.
[88] Kakuta Y, Petrotchenko EV, Pedersen LC, Negishi M. The sulfuryl transfer mechanism:
Crystal structure of a vanadate complex of estrogen sulfotransferase and mutational analysis.
Journal of Biological Chemistry, 1998, 273:27325-27330.
[89] Teramoto T, Sakakibara Y, Liu M-C, Suiko M, Kimura M, Kakuta Y. Snapshot of a Michaelis
complex in a sulfuryl transfer reaction: Crystal structure of a mouse sulfotransferase,
mSULT1D1, complexed with donor substrate and accepter substrate. Biochemical and
Biophysical Research Communications, 2009, 383:83-87.
[90] Tibbs ZE, Rohn-Glowacki KJ, Crittenden F, Guidry AL, Falany CN. Structural plasticity in
the human cytosolic sulfotransferase dimer and its role in substrate selectivity and catalysis. Drug
Metabolism and Pharmacokinetics, 2015, 30:3-20.
[91] Cook IT, Wang T, Almo SC, Kim J, Falany CN, Leyh TS. The gate that governs
sulfotransferase selectivity. Biochemistry, 2013, 52:415-424.
[92] Cook IT, Wang T, Almo SC, Kim J, Falany CN, Leyh TS. Testing the sulfotransferase
molecular pore hypothesis. Journal of Biological Chemistry, 2013, 288:8619-8626.
[93] Pedersen LC, Petrotchenko E, Shevtsov S, Negishi M. Crystal structure of the human
estrogen sulfotransferase-PAPS complex: Evidence for catalytic role of Ser137 in the sulfuryl
transfer reaction. Journal of Biological Chemistry, 2002, 277:17928-17932.
[94] Chatterjee B, Majumdar D, Ozbilen O, Murty C, Roy A. Molecular cloning and
characterization of cDNA for androgen-repressible rat liver protein, SMP-2. Journal of
Biological Chemistry, 1987, 262:822-825.
[95] Nash AR, Glenn WK, Moore SS, Kerr J, Thompson AR, Thompson E. Oestrogen
sulfotransferase: Molecular cloning and sequencing of cDNA for the bovine placental enzyme.
Australian Journal of Biological Sciences, 1988, 41:507-516.
[96] Reed MC, Lieb A, Nijhout HF. The biological significance of substrate inhibition: A mechanism
with diverse functions. Bioessays, 2010, 32:422-429.
[97] Wu B. Substrate inhibition kinetics in drug metabolism reactions. Drug Metabolism Reviews,
2011, 43:440-456.
[98] Yang Y-S, Tsai S-W, Lin E-S. Effects of 3′-phosphoadenosine 5′-phosphate on the activity and
folding of phenol sulfotransferase. Chemico-Biological Interactions, 1998, 109:129-135.
[99] Wang T, Cook I, Falany CN, Leyh TS. Paradigms of sulfotransferase catalysis: The mechanism
of SULT2A1. Journal of Biological Chemistry, 2014, 289:26474-26480.
[100] Klaassen CD, Boles JW. Sulfation and sulfotransferases 5: The importance of 3'-
phosphoadenosine 5'-phosphosulfate (PAPS) in the regulation of sulfation. The FASEB Journal,
1997, 11:404-418.
[101] Strott CA. Sulfonation and molecular action. Endocrine Reviews, 2002, 23:703-732.
BIBLIOGRAPHY
104
[102] Taskinen J, Ethell BT, Pihlavisto P, Hood AM, Burchell B, Coughtrie MW. Conjugation of
catechols by recombinant human sulfotransferases, UDP-glucuronosyltransferases, and soluble
catechol O-methyltransferase: Structure-conjugation relationships and predictive models. Drug
Metabolism and Disposition: The Biological Fate of Chemicals, 2003, 31:1187-1197.
[103] Menozzi-Smarrito C, Wong CC, Meinl W, Glatt H, Fumeaux R, Munari C, Robert F,
Williamson G, Barron D. First chemical synthesis and in vitro characterization of the potential
human metabolites 5-O-feruloylquinic acid 4′-sulfate and 4′-O-glucuronide. Journal of
Agricultural and Food Chemistry, 2011, 59:5671-5676.
[104] Kurogi K, Davidson G, Mohammed YI, Williams FE, Liu M-Y, Sakakibara Y, Suiko M,
Liu M-C. Ethanol sulfation by the human cytosolic sulfotransferases: A systematic analysis.
Biological and Pharmaceutical Bulletin, 2012, 35:2180-2185.
[105] Wong CC, Meinl W, Glatt H-R, Barron D, Stalmach A, Steiling H, Crozier A, Williamson
G. In vitro and in vivo conjugation of dietary hydroxycinnamic acids by UDP-
glucuronosyltransferases and sulfotransferases in humans. The Journal of nutritional
biochemistry, 2010, 21:1060-1068.
[106] Huang C, Chen Y, Zhou T, Chen G. Sulfation of dietary flavonoids by human sulfotransferases.
Xenobiotica, 2009, 39:312-322.
[107] Nakano H, Ogura K, Takahashi E, Harada T, Nishiyama T, Muro K, Hiratsuka A, Kadota
S, Watabe T. Regioselective monosulfation and disulfation of the phytoestrogens daidzein and
genistein by human liver sulfotransferases. Drug Metabolism and Pharmacokinetics, 2004,
19:216-226.
[108] Cermak R. Effect of dietary flavonoids on pathways involved in drug metabolism. Expert
Opinion on Drug Metabolism & Toxicology, 2008, 4:17-35.
[109] Yang CH, Tang L, Lv C, Ye L, Xia BJ, Hu M, Liu ZQ. Sulfation of selected mono‐
hydroxyflavones by sulfotransferases in vitro: A species and gender comparison. Journal of
Pharmacy and Pharmacology, 2011, 63:967-970.
[110] Brand W, Boersma MG, Bik H, Hoek-van den Hil EF, Vervoort J, Barron D, Meinl W,
Glatt H, Williamson G, van Bladeren PJ. Phase II metabolism of hesperetin by individual UDP-
glucuronosyltransferases and sulfotransferases and rat and human tissue samples. Drug
Metabolism and Disposition, 2010, 38:617-625.
[111] Vaidyanathan JB, Walle T. Glucuronidation and sulfation of the tea flavonoid (−)-epicatechin
by the human and rat enzymes. Drug Metabolism and Disposition, 2002, 30:897-903.
[112] Ruefer CE, Gerhäuser C, Frank N, Becker H, Kulling SE. In vitro phase II metabolism of
xanthohumol by human UDP‐glucuronosyltransferases and sulfotransferases. Molecular
Nutrition & Food Research, 2005, 49:851-856.
[113] Coughtrie MWH, Bamforth KJ, Sharp S, Jones AL, Borthwick EB, Barker EV, Roberts RC,
Hume R, Burchell A. Sulfation of endogenous compounds and xenobiotics — interactions and
function in health and disease. Chemico-Biological Interactions, 1994, 92:247-256.
[114] Kurogi K, Chen M, Lee Y, Shi B, Yan T, Liu MY, Sakakibara Y, Suiko M, Liu MC. Sulfation
of buprenorphine, pentazocine, and naloxone by human cytosolic sulfotransferases. Drug
metabolism letters, 2012, 6:109-115.
BIBLIOGRAPHY
105
[115] Kim D-H, Yoon H, Koizumi M, Kobashi K. Sulfation of phenolic antibiotics by sulfotransferase
obtained from a human intestinal bacterium. Chemical & Pharmaceutical Bulletin, 1992,
40:1056-1057.
[116] Wang LQ, Falany CN, James MO. Triclosan as a substrate and inhibitor of 3'-
phosphoadenosine 5'-phosphosulfate-sulfotransferase and UDP-glucuronosyl transferase in
human liver fractions. Drug Metabolism and Disposition: The Biological Fate of Chemicals,
2004, 32:1162-1169.
[117] Falany CN, Falany JL, Wang J, Hedstrom J, von Euler Chelpin H, Swedmark S. Studies on
sulfation of synthesized metabolites from the local anesthetics ropivacaine and lidocaine using
human cloned sulfotransferases. Drug Metabolism and Disposition: The Biological Fate of
Chemicals, 1999, 27:1057-1063.
[118] Pacifici GM, Giulianetti B, Quilici MC, Spisni R, Nervi M, Giuliani L, Gomeni R. (-)-
Salbutamol sulphation in the human liver and duodenal mucosa: Interindividual variability.
Xenobiotica, 1997, 27:279-286.
[119] Pacifici GM, Back DJ. Sulphation and glucuronidation of ethinyloestradiol in human liver in
vitro. Journal of Steroid Biochemistry, 1988, 31:345-349.
[120] Johnson GA, Barsuhn KJ, McCall JM. Sulfation of minoxidil by liver sulfotransferase.
Biochemical Pharmacology, 1982, 31:2949-2954.
[121] Sharma AM, Novalen M, Tanino T, Uetrecht JP. 12-OH-Nevirapine sulfate, formed in the
skin, is responsible for nevirapine-induced skin rash. Chemical Research in Toxicology, 2013,
26:817-827.
[122] Saha S, New LS, Ho HK, Chui WK, Chan ECY. Direct toxicity effects of sulfo-conjugated
troglitazone on human hepatocytes. Toxicology Letters, 2010, 195:135-141.
[123] Glatt H, Meinl W. Use of genetically manipulated Salmonella typhimurium strains to evaluate
the role of sulfotransferases and acetyltransferases in nitrofen mutagenicity. Carcinogenesis,
2004, 25:779-786.
[124] Glatt H, Seidel A, Harvey RG, Coughtrie MW. Activation of benzylic alcohols to mutagens
by human hepatic sulphotransferases. Mutagenesis, 1994, 9:553-557.
[125] Surh YJ. Bioactivation of benzylic and allylic alcohols via sulfo-conjugation. Chemico-
Biological Interactions, 1998, 109:221-235.
[126] Lewis AJ, Walle UK, King RS, Kadlubar FF, Falany CN, Walle T. Bioactivation of the cooked
food mutagen N-hydroxy-2-amino-1-methyl-6-phenylimidazo [4, 5-b] pyridine by estrogen
sulfotransferase in cultured human mammary epithelial cells. Carcinogenesis, 1998, 19:2049-
2053.
[127] Adjei AA, Weinshilboum RM. Catecholestrogen sulfation: Possible role in carcinogenesis.
Biochemical and Biophysical Research Communications, 2002, 292:402-408.
[128] Monien BH, Engst W, Barknowitz G, Seidel A, Glatt H. Mutagenicity of 5-
hydroxymethylfurfural in V79 cells expressing human SULT1A1: Identification and mass
spectrometric quantification of DNA adducts formed. Chemical Research in Toxicology, 2012,
25:1484-1492.
BIBLIOGRAPHY
106
[129] Rendic S, Guengerich FP. Contributions of human enzymes in carcinogen metabolism.
Chemical Research in Toxicology, 2012, 25:1316-1383.
[130] Bamforth KJ, Dalgliesh K, Coughtrie MW. Inhibition of human liver steroid sulfotransferase
activities by drugs: A novel mechanism of drug toxicity? European Journal of Pharmacology,
1992, 228:15-21.
[131] King RS, Ghosh AA, Wu J. Inhibition of human phenol and estrogen sulfotransferase by certain
non-steroidal anti-inflammatory agents. Current Drug Metabolism, 2006, 7:745-753.
[132] Vietri M, De Santi C, Pietrabissa A, Mosca F, Pacifici GM. Fenamates and the potent
inhibition of human liver phenol sulphotransferase. Xenobiotica, 2000, 30:111-116.
[133] Marchetti F, De Santi C, Vietri M, Pietrabissa A, Spisni R, Mosca F, Pacifici GM.
Differential inhibition of human liver and duodenum sulphotransferase activities by quercetin, a
flavonoid present in vegetables, fruit and wine. Xenobiotica, 2001, 31:841-847.
[134] Harris RM, Hawker RJ, Langman MJ, Singh S, Waring RH. Inhibition of
phenolsulphotransferase by salicylic acid: A possible mechanism by which aspirin may reduce
carcinogenesis. Gut, 1998, 42:272-275.
[135] Rohn KJ, Cook IT, Leyh TS, Kadlubar SA, Falany CN. Potent inhibition of human
sulfotransferase 1A1 by 17alpha-ethinylestradiol: Role of 3'-phosphoadenosine 5'-phosphosulfate
binding and structural rearrangements in regulating inhibition and activity. Drug Metabolism
and Disposition: The Biological Fate of Chemicals, 2012, 40:1588-1595.
[136] Ohkimoto K, Sakakibara Y, Suiko M, Yoshikawa H, Liu M-C, Tamura H. Biocides,
tributyltin and triphenyltin, as possible inhibitors of the human sulfotransferase involved in the
estrogen homeostasis. Pesticide Biochemistry and Physiology, 2005, 81:32-38.
[137] Gibb C, Glover V, Sandler M. In vitro inhibition of phenolsulphotransferase by food and drink
constituents. Biochemical Pharmacology, 1987, 36:2325-2330.
[138] Nishimuta H, Ohtani H, Tsujimoto M, Ogura K, Hiratsuka A, Sawada Y. Inhibitory effects
of various beverages on human recombinant sulfotransferase isoforms SULT1A1 and SULT1A3.
Biopharmaceutics and Drug Disposition, 2007, 28:491-500.
[139] Volak LP, Ghirmai S, Cashman JR, Court MH. Curcuminoids inhibit multiple human
cytochromes P450, UDP-glucuronosyltransferase, and sulfotransferase enzymes, whereas
piperine is a relatively selective CYP3A4 inhibitor. Drug Metabolism and Disposition: The
Biological Fate of Chemicals, 2008, 36:1594-1605.
[140] Vietri M, Pietrabissa A, Mosca F, Spisni R, Pacifici GM. Curcumin is a potent inhibitor of
phenol sulfotransferase (SULT1A1) in human liver and extrahepatic tissues. Xenobiotica, 2003,
33:357-363.
[141] Bamforth KJ, Jones AL, Roberts RC, Coughtrie MW. Common food additives are potent
inhibitors of human liver 17 alpha-ethinyloestradiol and dopamine sulphotransferases.
Biochemical Pharmacology, 1993, 46:1713-1720.
[142] Coughtrie MW, Johnston LE. Interactions between dietary chemicals and human
sulfotransferases-molecular mechanisms and clinical significance. Drug Metabolism and
Disposition: The Biological Fate of Chemicals, 2001, 29:522-528.
BIBLIOGRAPHY
107
[143] Harris RM, Wood DM, Bottomley L, Blagg S, Owen K, Hughes PJ, Waring RH, Kirk CJ.
Phytoestrogens are potent inhibitors of estrogen sulfation: Implications for breast cancer risk and
treatment. Journal of Clinical Endocrinology and Metabolism, 2004, 89:1779-1787.
[144] De Santi C, Pietrabissa A, Mosca F, Rane A, Pacifici GM. Inhibition of phenol sulfotransferase
(SULT1A1) by quercetin in human adult and foetal livers. Xenobiotica, 2002, 32:363-368.
[145] Nagai M, Fukamachi T, Tsujimoto M, Ogura K, Hiratsuka A, Ohtani H, Hori S, Sawada
Y. Inhibitory effects of herbal extracts on the activity of human sulfotransferase isoform
sulfotransferase 1A3 (SULT1A3). Biological & Pharmaceutical Bulletin, 2009, 32:105-109.
[146] Littlewood JT, Glover V, Sandler M. Red wine contains a potent inhibitor of
phenolsulphotransferase. British Journal of Clinical Pharmacology, 1985, 19:275-278.
[147] Nishimuta H, Tsujimoto M, Ogura K, Hiratsuka A, Ohtani H, Sawada Y. Inhibitory effects
of various beverages on ritodrine sulfation by recombinant human sulfotransferase isoforms
SULT1A1 and SULT1A3. Pharmaceutical Research, 2005, 22:1406-1410.
[148] Waring RH, Ayers S, Gescher AJ, Glatt HR, Meinl W, Jarratt P, Kirk CJ, Pettitt T, Rea D,
Harris RM. Phytoestrogens and xenoestrogens: The contribution of diet and environment to
endocrine disruption. Journal of Steroid Biochemistry and Molecular Biology, 2008,
108:213-220.
[149] Eagle K. Toxicological effects of red wine, orange juice, and other dietary SULT1A inhibitors via
excess catecholamines. Food and Chemical Toxicology, 2012, 50:2243-2249.
[150] Eagle K. ADHD impacted by sulfotransferase (SULT1A) inhibition from artificial food colors
and plant-based foods. Physiology & Behavior, 2014, 135:174-179.
[151] Kester MH, Bulduk S, Tibboel D, Meinl W, Glatt H, Falany CN, Coughtrie MW, Bergman
A, Safe SH, Kuiper GG, Schuur AG, Brouwer A, Visser TJ. Potent inhibition of estrogen
sulfotransferase by hydroxylated PCB metabolites: A novel pathway explaining the estrogenic
activity of PCBs. Endocrinology, 2000, 141:1897-1900.
[152] Kester MH, Bulduk S, van Toor H, Tibboel D, Meinl W, Glatt H, Falany CN, Coughtrie
MW, Schuur AG, Brouwer A, Visser TJ. Potent inhibition of estrogen sulfotransferase by
hydroxylated metabolites of polyhalogenated aromatic hydrocarbons reveals alternative
mechanism for estrogenic activity of endocrine disrupters. Journal of Clinical Endocrinology
and Metabolism, 2002, 87:1142-1150.
[153] Diamanti-Kandarakis E, Bourguignon J-P, Giudice LC, Hauser R, Prins GS, Soto AM,
Zoeller RT, Gore AC. Endocrine-disrupting chemicals: An endocrine society scientific
statement. Endocrine Reviews, 2009, 30:293-342.
[154] Schuur AG, Brouwer A, Bergman Å, Coughtrie MW, Visser TJ. Inhibition of thyroid
hormone sulfation by hydroxylated metabolites of polychlorinated biphenyls. Chemico-
Biological Interactions, 1998, 109:293-297.
[155] Butt CM, Stapleton HM. Inhibition of thyroid hormone sulfotransferase activity by brominated
flame retardants and halogenated phenolics. Chemical Research in Toxicology, 2013, 26:1692-
1702.
BIBLIOGRAPHY
108
[156] Pasqualini J, Cortes‐Prieto J, Chetrite G, Talbi M, Ruiz A. Concentrations of estrone, estradiol
and their sulfates, and evaluation of sulfatase and aromatase activities in patients with breast
fibroadenoma. International Journal of Cancer, 1997, 70:639-643.
[157] Straub RH. The complex role of estrogens in inflammation. Endocrine Reviews, 2007, 28:521-
574.
[158] Hu Q, Yin L, Hartmann RW. Selective dual inhibitors of CYP19 and CYP11B2: Targeting
cardiovascular diseases hiding in the shadow of breast cancer. Journal of Medicinal Chemistry,
2012, 55:7080-7089.
[159] van der Spuy WJ, Pretorius E. Interrelation between inflammation, thrombosis, and
neuroprotection in cerebral ischemia. Reviews in the Neurosciences, 2012, 23:269-278.
[160] Oosthuyse T, Bosch AN. Oestrogen's regulation of fat metabolism during exercise and gender
specific effects. Current Opinion in Pharmacology, 2012, 12:363-371.
[161] Zhang H, Varlamova O, Vargas FM, Falany CN, Leyh TS. Sulfuryl transfer: The catalytic
mechanism of human estrogen sulfotransferase. Journal of Biological Chemistry, 1998,
273:10888-10892.
[162] Pasqualini JR. Estrogen sulfotransferases in breast and endometrial cancers. Annals of the New
York Academy of Sciences, 2009, 1155:88-98.
[163] Lorand T, Vigh E, Garai J. Hormonal action of plant derived and anthropogenic non-steroidal
estrogenic compounds: Phytoestrogens and xenoestrogens. Current Medicinal Chemistry,
2010, 17:3542-3574.
[164] Ganguly TC, Krasnykh V, Falany CN. Bacterial expression and kinetic characterization of the
human monoamine-sulfating form of phenol sulfotransferase. Drug Metabolism and
Disposition: The Biological Fate of Chemicals, 1995, 23:945-950.
[165] Falany JL, Macrina N, Falany CN. Sulfation of tibolone and tibolone metabolites by expressed
human cytosolic sulfotransferases. Journal of Steroid Biochemistry and Molecular Biology,
2004, 88:383-391.
[166] Falany JL, Pilloff DE, Leyh TS, Falany CN. Sulfation of raloxifene and 4-hydroxytamoxifen by
human cytosolic sulfotransferases. Drug Metabolism and Disposition: The Biological Fate of
Chemicals, 2006, 34:361-368.
[167] Miksits M, Maier-Salamon A, Aust S, Thalhammer T, Reznicek G, Kunert O, Haslinger
E, Szekeres T, Jaeger W. Sulfation of resveratrol in human liver: Evidence of a major role for the
sulfotransferases SULT1A1 and SULT1E1. Xenobiotica, 2005, 35:1101-1119.
[168] Banoglu E. Current status of the cytosolic sulfotransferases in the metabolic activation of
promutagens and procarcinogens. Current Drug Metabolism, 2000, 1:1-30.
[169] Pasqualini JR, Chetrite GS. Recent advances on the action of estrogens and progestogens in
normal and pathological human endometrium. Hormone Molecular Biology and Clinical
Investigation, 2010, 2:155-175.
BIBLIOGRAPHY
109
[170] Suzuki T, Miki Y, Nakata T, Shiotsu Y, Akinaga S, Inoue K, Ishida T, Kimura M, Moriya
T, Sasano H. Steroid sulfatase and estrogen sulfotransferase in normal human tissue and breast
carcinoma. The Journal of steroid biochemistry and molecular biology, 2003, 86:449-454.
[171] Suzuki T, Miki Y, Nakamura Y, Ito K, Sasano H. Steroid sulfatase and estrogen
sulfotransferase in human carcinomas. Molecular and Cellular Endocrinology, 2011, 340:148-
153.
[172] Pasqualini JR, Chetrite GS. Recent insight on the control of enzymes involved in estrogen
formation and transformation in human breast cancer. The Journal of steroid biochemistry
and molecular biology, 2005, 93:221-236.
[173] Falany JL, Macrina N, Falany CN. Regulation of MCF-7 breast cancer cell growth by beta-
estradiol sulfation. Breast Cancer Research and Treatment, 2002, 74:167-176.
[174] Moroy G, Martiny VY, Vayer P, Villoutreix BO, Miteva MA. Toward in silico structure-
based ADMET prediction in drug discovery. Drug Discovery Today, 2012, 17:44-55.
[175] Campbell N, Van Loon J, Sundaram RS, Ames MM, Hansch C, Weinshilboum R. Human
and rat liver phenol sulfotransferase: Structure-activity relationships for phenolic substrates.
Molecular Pharmacology, 1987, 32:813-819.
[176] Dajani R, Cleasby A, Neu M, Wonacott AJ, Jhoti H, Hood AM, Modi S, Hersey A,
Taskinen J, Cooke RM, Manchee GR, Coughtrie MW. X-ray crystal structure of human
dopamine sulfotransferase, SULT1A3 molecular modeling and quantitative structure-activity
relationship analysis demonstrate a molecular basis for sulfotransferase substrate specificity.
Journal of Biological Chemistry, 1999, 274:37862-37868.
[177] Taskinen J, Ethell BT, Pihlavisto P, Hood AM, Burchell B, Coughtrie MW. Conjugation of
catechols by recombinant human sulfotransferases, UDP-glucuronosyltransferases, and soluble
catechol O-methyltransferase: Structure-conjugation relationships and predictive models. Drug
Metabolism and Disposition, 2003, 31:1187-1197.
[178] Sipilä J, Hood AM, Coughtrie MW, Taskinen J. CoMFA modeling of enzyme kinetics: Km
values for sulfation of diverse phenolic substrates by human catecholamine sulfotransferase
SULT1A3. Journal of Chemical Information and Computer Sciences, 2003, 43:1563-1569.
[179] Heimstad ES, Andersson PL. Docking and QSAR studies of an indirect estrogenic effect of
hydroxylated PCBs. Quantitative Structure‐Activity Relationships, 2002, 21:257-266.
[180] Hamers T, Kamstra JH, Sonneveld E, Murk AJ, Kester MH, Andersson PL, Legler J,
Brouwer A. In vitro profiling of the endocrine-disrupting potency of brominated flame
retardants. Toxicological Sciences, 2006, 92:157-173.
[181] Harju M, Hamers T, Kamstra JH, Sonneveld E, Boon JP, Tysklind M, Andersson PL.
Quantitative structure‐activity relationship modeling on in vitro endocrine effects and metabolic
stability involving 26 selected brominated flame retardants. Environmental Toxicology and
Chemistry, 2007, 26:816-826.
[182] Papa E, Kovarich S, Gramatica P. QSAR modeling and prediction of the endocrine-disrupting
potencies of brominated flame retardants. Chemical Research in Toxicology, 2010, 23:946-954.
BIBLIOGRAPHY
110
[183] Stenberg M, Hamers T, Machala M, Fonnum F, Stenius U, Lauy A-A, van Duursen MB,
Westerink RH, Fernandes ECA, Andersson PL. Multivariate toxicity profiles and QSAR
modeling of non-dioxin-like PCBs–an investigation of in vitro screening data from ultra-pure
congeners. Chemosphere, 2011, 85:1423-1429.
[184] Ekuase EJ, Liu Y, Lehmler H-J, Robertson LW, Duffel MW. Structure–activity relationships
for hydroxylated polychlorinated biphenyls as inhibitors of the sulfation of
dehydroepiandrosterone catalyzed by human hydroxysteroid sulfotransferase SULT2A1.
Chemical Research in Toxicology, 2011, 24:1720-1728.
[185] Ekuase E, van‘t Erve T, Rahaman A, Robertson L, Duffel M, Luthe G. Mechanistic insights
into the specificity of human cytosolic sulfotransferase 2A1 (hSULT2A1) for hydroxylated
polychlorinated biphenyls through the use of fluoro-tagged probes. Environmental Science and
Pollution Research, 2015:1-9.
[186] Chen Y, Ung C. Prediction of potential toxicity and side effect protein targets of a small molecule
by a ligand–protein inverse docking approach. Journal of Molecular Graphics and Modelling,
2001, 20:199-218.
[187] Martiny VY, Carbonell P, Lagorce D, Villoutreix BO, Moroy G, Miteva MA. In silico
mechanistic profiling to probe small molecule binding to sulfotransferases. PloS One, 2013,
8:e73587.
[188] Cook IT, Wang T, Falany CN, Leyh TS. High accuracy in silico sulfotransferase models.
Journal of Biological Chemistry, 2013, 288:34494-34501.
[189] Campagna-Slater V, Schapira M. Evaluation of virtual screening as a tool for chemical genetic
applications. Journal of Chemical Information and Modeling, 2009, 49:2082-2091.
[190] Najmanovich RJ, Allali-Hassani A, Morris RJ, Dombrovsky L, Pan PW, Vedadi M,
Plotnikov AN, Edwards A, Arrowsmith C, Thornton JM. Analysis of binding site similarity,
small-molecule similarity and experimental binding profiles in the human cytosolic
sulfotransferase family. Bioinformatics, 2007, 23:e104-109.
[191] Iyer LV, Ramamoorthy A, Rutkowska E, Furimsky AM, Tang L, Catz P, Green CE,
Jozwiak K, Wainer IW. The stereoselective sulfate conjugation of 4'-methoxyfenoterol
stereoisomers by sulfotransferase enzymes. Chirality, 2012, 24:796-803.
[192] Meinl W, Tsoi C, Swedmark S, Tibbs ZE, Falany CN, Glatt H. Highly selective bioactivation
of 1-and 2-hydroxy-3-methylcholanthrene to mutagens by individual human and other
mammalian sulphotransferases expressed in Salmonella typhimurium. Mutagenesis, 2013,
28:609-619.
[193] Tian X, Huo X, Dong P, Wu B, Wang X, Wang C, Liu K, Ma X. Sulfation of melatonin:
Enzymatic characterization, differences of organs, species and genders, and bioactivity variation.
Biochemical Pharmacology, 2015, 94:282-296.
[194] Cook IT, Wang T, Almo SC, Kim J, Falany CN, Leyh TS. The gate that governs
sulfotransferase selectivity. Biochemistry, 2012, 52:415-424.
[195] Meng S, Wu B, Singh R, Yin T, Morrow JK, Zhang S, Hu M. SULT1A3-mediated regiospecific
7-O-sulfation of flavonoids in Caco-2 cells can be explained by the relevant molecular docking
studies. Molecular Pharmaceutics, 2012, 9:862-873.
BIBLIOGRAPHY
111
[196] DiGiovanni KM, Hatstat AK, Rote J, Cafiero M. MP2//DFT calculations of interaction
energies between acetaminophen and acetaminophen analogues and the aryl sulfotransferase
active site. Computational and Theoretical Chemistry, 2013, 1007:41-47.
[197] Grouzmann E, Gualtierotti J-B, Gerber-Lemaire S, Abid K, Brakch N, Pedretti A, Testa B,
Vistoli G. Lack of enantioselectivity in the SULT1A3-catalyzed sulfoconjugation of
normetanephrine enantiomers: An in vitro and computational study. Chirality, 2013, 25:28-34.
[198] Tibbs ZE, Falany CN. Dimeric human sulfotransferase 1B1 displays cofactor‐dependent subunit
communication. Pharmacology Research & Perspectives, 2015, 3.
[199] Lin ES, Yang YS, Yang JM. Modeling the binding and inhibition mechanism of nucleotides and
sulfotransferase using molecular docking. Journal of the Chinese Chemical Society, 2003,
50:655-663.
[200] Lin P, Yang W, Pedersen LC, Negishi M, Pedersen LG. Searching for the minimum energy
path in the sulfuryl transfer reaction catalyzed by human estrogen sulfotransferase: Role of
enzyme dynamics. International Journal of Quantum Chemistry, 2006, 106:2981-2998.
[201] Cook IT, Duniec-Dmuchowski Z, Kocarek TA, Runge-Morris M, Falany CN. 24-
hydroxycholesterol sulfation by human cytosolic sulfotransferases: formation of monosulfates and
disulfates, molecular modeling, sulfatase sensitivity, and inhibition of liver x receptor activation.
Drug Metabolism and Disposition: The Biological Fate of Chemicals, 2009, 37:2069-2078.
[202] Yalcin EB, Struzik SM, King RS. Allosteric modulation of SULT2A1 by celecoxib and
nimesulide: Computational analyses. Drug metabolism letters, 2008, 2:198.
[203] Cook IT, Leyh TS, Kadlubar SA, Falany CN. Structural rearrangement of SULT2A1: Effects
on dehydroepiandrosterone and raloxifene sulfation. Hormone Molecular Biology and Clinical
Investigation, 2010, 1:81-87.
[204] Cook IT, Wang T, Falany CN, Leyh TS. A nucleotide-gated molecular pore selects
sulfotransferase substrates. Biochemistry, 2012, 51:5674-5683.
[205] Ambadapadi S, Wang PL, Palii SP, James MO. Celecoxib influences steroid sulfonation
catalyzed by human recombinant sulfotransferase 2A1. The Journal of steroid biochemistry
and molecular biology, 2015, 152:101-113.
[206] Zhang P-p, Zhao L, Long S-y, Tian P. The effect of ligands on the thermal stability of
sulfotransferases: A molecular dynamics simulation study. Journal of Molecular Modeling,
2015, 21:1-7.
[207] McCammon J. Molecular Dynamics study of the bovine pancreatic trypsin inhibitor. Models
for Protein Dynamics, 1976:137.
[208] McCammon JA, Gelin BR, Karplus M. Dynamics of folded proteins. Nature, 1977, 267:585-
590.
[209] Mortier J, Rakers C, Bermudez M, Murgueitio MS, Riniker S, Wolber G. The impact of
molecular dynamics on drug design: Applications for the characterization of ligand-
macromolecule complexes. Drug Discovery Today, 2015, 20:686-702.
BIBLIOGRAPHY
112
[210] Rakers C, Bermudez M, Keller BG, Mortier J, Wolber G. Computational close up on protein–
protein interactions: How to unravel the invisible using molecular dynamics simulations? Wiley
Interdisciplinary Reviews: Computational Molecular Science, 2015, 5:345-359.
[211] Frenkel D, Smit B. Molecular dynamics simulations. In: Understanding molecular simulation -
from algorithms to applications, Academic Press; 2002, 63-64.
[212] Born M, Oppenheimer R. Zur Quantentheorie der Molekeln. Annalen der Physik, 1927,
389:457-484.
[213] Adcock SA, McCammon JA. Molecular dynamics: Survey of methods for simulating the
activity of proteins. Chemical Reviews, 2006, 106:1589-1615.
[214] Leach AR. Empirical force field models: Molecular mechanics. In: Molecular modelling:
Principles and applications, Pearson Education; 2001, 165-169.
[215] Verlet L. Computer "experiments" on classical fluids. I. Thermodynamical properties of Lennard-
Jones molecules. Physical Review, 1967, 159:98-103.
[216] Dror RO, Dirks RM, Grossman J, Xu H, Shaw DE. Biomolecular simulation: A computational
microscope for molecular biology. Annual review of biophysics, 2012, 41:429-452.
[217] Werner T, Morris MB, Dastmalchi S, Church WB. Structural modelling and dynamics of
proteins for insights into drug interactions. Advanced Drug Delivery Reviews, 2012, 64:323-
343.
[218] Durrant JD, McCammon JA. Molecular dynamics simulations and drug discovery. BMC
Biology, 2011, 9:71.
[219] Nosé S. A unified formulation of the constant temperature molecular dynamics methods. The
Journal of Chemical Physics, 1984, 81:511-519.
[220] Hoover WG. Canonical dynamics: Equilibrium phase-space distributions. Physical Review A,
1985, 31:1695-1697.
[221] Berendsen HJC, Postma JPM, van Gunsteren WF, DiNola A, Haak JR. Molecular dynamics
with coupling to an external bath. The Journal of Chemical Physics, 1984, 81:3684-3690.
[222] Andersen HC. Molecular dynamics simulations at constant pressure and/or temperature. The
Journal of Chemical Physics, 1980, 72:2384-2393.
[223] Parrinello M, Rahman A. Polymorphic transitions in single crystals: A new molecular dynamics
method. Journal of Applied Physics, 1981, 52:7182-7190.
[224] Leach AR. Molecular dynamics simulation methods. In: Molecular modelling: Principles and
applications, Pearson Education; 2001, 351-408.
[225] Berendsen HJ, van der Spoel D, van Drunen R. GROMACS: A message-passing parallel
molecular dynamics implementation. Computer Physics Communications, 1995, 91:43-56.
[226] Pronk S, Páll S, Schulz R, Larsson P, Bjelkmar P, Apostolov R, Shirts MR, Smith JC,
Kasson PM, van der Spoel D. GROMACS 4.5: A high-throughput and highly parallel open
source molecular simulation toolkit. Bioinformatics, 2013:btt055.
BIBLIOGRAPHY
113
[227] Karplus M. CHARMM: A program for macromolecular energy, minimization, and dynamics
calculations. Journal of Computational Chemistry, 1983, 4:187217.
[228] Brooks BR, Brooks CL, MacKerell AD, Nilsson L, Petrella RJ, Roux B, Won Y, Archontis
G, Bartels C, Boresch S. CHARMM: The biomolecular simulation program. Journal of
Computational Chemistry, 2009, 30:1545-1614.
[229] Pearlman DA, Case DA, Caldwell JW, Ross WS, Cheatham TE, DeBolt S, Ferguson D,
Seibel G, Kollman P. AMBER, a package of computer programs for applying molecular
mechanics, normal mode analysis, molecular dynamics and free energy calculations to simulate
the structural and energetic properties of molecules. Computer Physics Communications,
1995, 91:1-41.
[230] Weiner SJ, Kollman PA, Case DA, Singh UC, Ghio C, Alagona G, Profeta S, Weiner P. A
new force field for molecular mechanical simulation of nucleic acids and proteins. Journal of the
American Chemical Society, 1984, 106:765-784.
[231] Cornell WD, Cieplak P, Bayly CI, Gould IR, Merz KM, Ferguson DM, Spellmeyer DC,
Fox T, Caldwell JW, Kollman PA. A second generation force field for the simulation of proteins,
nucleic acids, and organic molecules. Journal of the American Chemical Society, 1995,
117:5179-5197.
[232] Duan Y, Wu C, Chowdhury S, Lee MC, Xiong G, Zhang W, Yang R, Cieplak P, Luo R,
Lee T. A point‐charge force field for molecular mechanics simulations of proteins based on
condensed‐phase quantum mechanical calculations. Journal of Computational Chemistry,
2003, 24:1999-2012.
[233] MacKerell AD, Bashford D, Bellott M, Dunbrack R, Evanseck J, Field MJ, Fischer S, Gao
J, Guo H, Ha Sa. All-atom empirical potential for molecular modeling and dynamics studies of
proteins. The journal of physical chemistry B, 1998, 102:3586-3616.
[234] MacKerell AD, Feig M, Brooks CL. Extending the treatment of backbone energetics in protein
force fields: Limitations of gas‐phase quantum mechanics in reproducing protein conformational
distributions in molecular dynamics simulations. Journal of Computational Chemistry, 2004,
25:1400-1415.
[235] van Gunsteren WF, Billeter S, Eising A, Hünenberger PH, Krüger P, Mark AE, Scott W,
Tironi IG. Biomolecular simulation: The {GROMOS96} manual and user guide. 1996.
[236] Scott WR, Hünenberger PH, Tironi IG, Mark AE, Billeter SR, Fennen J, Torda AE, Huber
T, Krüger P, van Gunsteren WF. The GROMOS biomolecular simulation program package.
The Journal of Physical Chemistry A, 1999, 103:3596-3607.
[237] Oostenbrink C, Villa A, Mark AE, Van Gunsteren WF. A biomolecular force field based on
the free enthalpy of hydration and solvation: The GROMOS force‐field parameter sets 53A5 and
53A6. Journal of Computational Chemistry, 2004, 25:1656-1676.
[238] Jorgensen WL, Tirado-Rives J. The OPLS [optimized potentials for liquid simulations] potential
functions for proteins, energy minimizations for crystals of cyclic peptides and crambin. Journal
of the American Chemical Society, 1988, 110:1657-1666.
BIBLIOGRAPHY
114
[239] Jorgensen WL, Maxwell DS, Tirado-Rives J. Development and testing of the OPLS all-atom
force field on conformational energetics and properties of organic liquids. Journal of the
American Chemical Society, 1996, 118:11225-11236.
[240] Likić VA, Gooley PR, Speed TP, Strehler EE. A statistical approach to the interpretation of
molecular dynamics simulations of calmodulin equilibrium dynamics. Protein Science, 2005,
14:2955-2963.
[241] Leach AR. Conformational Analysis. In: Molecular modelling: Principles and applications,
Pearson Education; 2001, 457-508.
[242] Morris GM, Goodsell DS, Halliday RS, Huey R, Hart WE, Belew RK, Olson AJ. Automated
docking using a Lamarckian genetic algorithm and an empirical binding free energy function.
Journal of Computational Chemistry, 1998, 19:1639-1662.
[243] Jones G, Willett P, Glen RC, Leach AR, Taylor R. Development and validation of a genetic
algorithm for flexible docking. Journal of Molecular Biology, 1997, 267:727-748.
[244] Ewing TJ, Makino S, Skillman AG, Kuntz ID. DOCK 4.0: Search strategies for automated
molecular docking of flexible molecule databases. Journal of Computer-Aided Molecular
Design, 2001, 15:411-428.
[245] Rarey M, Kramer B, Lengauer T, Klebe G. A fast flexible docking method using an incremental
construction algorithm. Journal of Molecular Biology, 1996, 261:470-489.
[246] Friesner RA, Banks JL, Murphy RB, Halgren TA, Klicic JJ, Mainz DT, Repasky MP, Knoll
EH, Shelley M, Perry JK. Glide: A new approach for rapid, accurate docking and scoring. 1.
Method and assessment of docking accuracy. Journal of Medicinal Chemistry, 2004, 47:1739-
1749.
[247] Halgren TA, Murphy RB, Friesner RA, Beard HS, Frye LL, Pollard WT, Banks JL. Glide:
A new approach for rapid, accurate docking and scoring. 2. Enrichment factors in database
screening. Journal of Medicinal Chemistry, 2004, 47:1750-1759.
[248] Young DC. Chapter 12 - Docking. In: Computational drug design: A guide for computational
and medicinal chemists, John Wiley & Sons; 2009, 133-158.
[249] Kitchen DB, Decornez H, Furr JR, Bajorath J. Docking and scoring in virtual screening for
drug discovery: Methods and applications. Nature Reviews: Drug Discovery, 2004, 3:935-949.
[250] Verdonk ML, Cole JC, Hartshorn MJ, Murray CW, Taylor RD. Improved protein–ligand
docking using GOLD. Proteins: Structure, Function, and Bioinformatics, 2003, 52:609-623.
[251] Eldridge MD, Murray CW, Auton TR, Paolini GV, Mee RP. Empirical scoring functions: I.
The development of a fast empirical scoring function to estimate the binding affinity of ligands in
receptor complexes. Journal of Computer-Aided Molecular Design, 1997, 11:425-445.
[252] Böhm H-J. The development of a simple empirical scoring function to estimate the binding
constant for a protein-ligand complex of known three-dimensional structure. Journal of
Computer-Aided Molecular Design, 1994, 8:243-256.
BIBLIOGRAPHY
115
[253] DeWitte RS, Shakhnovich EI. SMoG: De novo design method based on simple, fast, and accurate
free energy estimates. 1. Methodology and supporting evidence. Journal of the American
Chemical Society, 1996, 118:11733-11744.
[254] Gohlke H, Hendlich M, Klebe G. Knowledge-based scoring function to predict protein-ligand
interactions. Journal of Molecular Biology, 2000, 295:337-356.
[255] Perola E, Walters WP, Charifson PS. A detailed comparison of current docking and scoring
methods on systems of pharmaceutical relevance. Proteins: Structure, Function, and
Bioinformatics, 2004, 56:235-249.
[256] Cummings MD, DesJarlais RL, Gibbs AC, Mohan V, Jaeger EP. Comparison of automated
docking programs as virtual screening tools. Journal of Medicinal Chemistry, 2005, 48:962-
976.
[257] Cross JB, Thompson DC, Rai BK, Baber JC, Fan KY, Hu Y, Humblet C. Comparison of
several molecular docking programs: Pose prediction and virtual screening accuracy. Journal of
Chemical Information and Modeling, 2009, 49:1455-1474.
[258] Cheng T, Li X, Li Y, Liu Z, Wang R. Comparative assessment of scoring functions on a diverse
test set. Journal of Chemical Information and Modeling, 2009, 49:1079-1093.
[259] Cheng T, Li Q, Zhou Z, Wang Y, Bryant SH. Structure-based virtual screening for drug
discovery: A problem-centric review. The AAPS journal, 2012, 14:133-141.
[260] Warren GL, Andrews CW, Capelli A-M, Clarke B, LaLonde J, Lambert MH, Lindvall M,
Nevins N, Semus SF, Senger S. A critical assessment of docking programs and scoring
functions. Journal of Medicinal Chemistry, 2006, 49:5912-5931.
[261] Wermuth CG, Ganellin CR, Lindberg P, Mitscher LA. Glossary of terms used in medicinal
chemistry (IUPAC Recommendations 1998). Pure and Applied Chemistry 1998. Vol. 70,
Page 1129.
[262] Seidel T, Ibis G, Bendix F, Wolber G. Strategies for 3D pharmacophore-based virtual screening.
Drug Discovery Today: Technologies, 2011, 7:e221-e228.
[263] Bernstein FC, Koetzle TF, Williams GJ, Meyer EF, Brice MD, Rodgers JR, Kennard O,
Shimanouchi T, Tasumi M. The Protein Data Bank: A computer-based archival file for
macromolecular structures. Archives of Biochemistry and Biophysics, 1978, 185:584-591.
[264] Allen FH. The Cambridge Structural Database: A quarter of a million crystal structures and
rising. Acta Crystallographica Section B: Structural Science, 2002, 58:380-388.
[265] Kirchmair J, Markt P, Distinto S, Wolber G, Langer T. Evaluation of the performance of 3D
virtual screening protocols: RMSD comparisons, enrichment assessments, and decoy selection—
What can we learn from earlier mistakes? Journal of Computer-Aided Molecular Design,
2008, 22:213-228.
[266] Mysinger MM, Carchia M, Irwin JJ, Shoichet BK. Directory of useful decoys, enhanced (DUD-
E): Better ligands and decoys for better benchmarking. Journal of Medicinal Chemistry, 2012,
55:6582-6594.
BIBLIOGRAPHY
116
[267] Wolber G, Langer T. LigandScout: 3-D pharmacophores derived from protein-bound ligands and
their use as virtual screening filters. Journal of Chemical Information and Modeling, 2005,
45:160-169.
[268] Wolber G, Dornhofer AA, Langer T. Efficient overlay of small organic molecules using 3D
pharmacophores. Journal of Computer-Aided Molecular Design, 2006, 20:773-788.
[269] Wolber G, Seidel T, Bendix F, Langer T. Molecule-pharmacophore superpositioning and
pattern matching in computational drug design. Drug Discovery Today, 2008, 13:23-29.
[270] Dixon SL, Smondyrev AM, Rao SN. PHASE: A novel approach to pharmacophore modeling
and 3D database searching. Chemical Biology & Drug Design, 2006, 67:370-372.
[271] Dixon SL, Smondyrev AM, Knoll EH, Rao SN, Shaw DE, Friesner RA. PHASE: A new
engine for pharmacophore perception, 3D QSAR model development, and 3D database screening:
1. Methodology and preliminary results. Journal of Computer-Aided Molecular Design,
2006, 20:647-671.
[272] Kurogi Y, Guner OF. Pharmacophore modeling and three-dimensional database searching for
drug design using catalyst. Current Medicinal Chemistry, 2001, 8:1035-1055.
[273] Molecular Operating Environment, MOE. Chemical Computing Group Inc., Montreal,
Canada; 2010.
[274] McInnes C. Virtual screening strategies in drug discovery. Current Opinion in Chemical
Biology, 2007, 11:494-502.
[275] Schneider G. Virtual screening: An endless staircase? Nature Reviews Drug Discovery, 2010,
9:273-276.
[276] Drew KL, Baiman H, Khwaounjoo P, Yu B, Reynisson J. Size estimation of chemical space:
How big is it? Journal of Pharmacy and Pharmacology, 2012, 64:490-495.
[277] Congreve M, Carr R, Murray C, Jhoti H. A ‘rule of three’for fragment-based lead discovery?
Drug Discovery Today, 2003, 8:876-877.
[278] Baell JB, Holloway GA. New substructure filters for removal of pan assay interference
compounds (PAINS) from screening libraries and for their exclusion in bioassays. Journal of
Medicinal Chemistry, 2010, 53:2719-2740.
[279] Yamashita F, Hashida M. In silico approaches for predicting ADME properties of drugs. Drug
Metabolism and Pharmacokinetics, 2004, 19:327-338.
[280] Wold S, Sjöström M, Eriksson L. PLS-regression: A basic tool of chemometrics. Chemometrics
and Intelligent Laboratory Systems, 2001, 58:109-130.
[281] Dudek AZ, Arodz T, Galvez J. Computational methods in developing quantitative structure-
activity relationships (QSAR): A review. Combinatorial Chemistry & High Throughput
Screening, 2006, 9:213-228.
[282] Barrett S, Langdon W. Advances in the application of machine learning techniques in drug
discovery, design and development. In: Applications of soft computing, Springer; 2006, 99-110.
BIBLIOGRAPHY
117
[283] Fox T, Kriegl JM. Machine learning techniques for in silico modeling of drug metabolism.
Current Topics in Medicinal Chemistry, 2006, 6:1579-1591.
[284] Li H, Yap C, Ung C, Xue Y, Li Z, Han L, Lin H, Chen YZ. Machine learning approaches for
predicting compounds that interact with therapeutic and ADMET related proteins. Journal of
Pharmaceutical Sciences, 2007, 96:2838-2860.
[285] Sakiyama Y. The use of machine learning and nonlinear statistical tools for ADME prediction.
Expert Opinion on Drug Metabolism & Toxicology, 2009, 5:149-169.
[286] Karthikeyan M, Vyas R. Machine learning methods in chemoinformatics for drug discovery. In:
Practical Chemoinformatics, Springer; 2014, 133-194.
[287] Mitchell JB. Machine learning methods in chemoinformatics. Wiley Interdisciplinary
Reviews: Computational Molecular Science, 2014, 4:468-481.
[288] Schneider G, Wrede P. Artificial neural networks for computer-based molecular design.
Progress in Biophysics and Molecular biology, 1998, 70:175-222.
[289] Ghaffari A, Abdollahi H, Khoshayand M, Bozchalooi IS, Dadgar A, Rafiee-Tehrani M.
Performance comparison of neural network training algorithms in modeling of bimodal drug
delivery. International Journal of Pharmaceutics, 2006, 327:126-138.
[290] Plewczynski D, Spieser SA, Koch U. Assessing different classification methods for virtual
screening. Journal of Chemical Information and Modeling, 2006, 46:1098-1106.
[291] Breiman L. Bagging predictors. Machine learning, 1996, 24:123-140.
[292] Lewis RA, Wood D. Modern 2D QSAR for drug discovery. Wiley Interdisciplinary Reviews:
Computational Molecular Science, 2014, 4:505-522.
[293] Golbraikh A, Tropsha A. Beware of q 2! Journal of Molecular Graphics and Modelling,
2002, 20:269-276.
[294] Reinen J, Vriese E, Glatt H, Vermeulen NP. Development and validation of a fluorescence
HPLC-based screening assay for inhibition of human estrogen sulfotransferase. Analytical
Biochemistry, 2006, 357:85-92.
[295] Paul P, Suwan J, Liu J, Dordick JS, Linhardt RJ. Recent advances in sulfotransferase enzyme
activity assays. Analytical and Bioanalytical Chemistry, 2012, 403:1491-1500.
[296] Burkart MD, Wong C-H. A continuous assay for the spectrophotometric analysis of
sulfotransferases using aryl sulfotransferase IV. Analytical Biochemistry, 1999, 274:131-137.
[297] Cook IT, Wang T, Leyh TS. Sulfotransferase 1A1 substrate selectivity: A molecular clamp
mechanism. Biochemistry, 2015, 54:6114-6122.
[298] Shevtsov S, Petrotchenko EV, Pedersen LC, Negishi M. Crystallographic analysis of a
hydroxylated polychlorinated biphenyl (OH-PCB) bound to the catalytic estrogen binding site of
human estrogen sulfotransferase. Environmental Health Perspectives, 2003, 111:884.
BIBLIOGRAPHY
118
[299] Gosavi RA, Knudsen GA, Birnbaum LS, Pedersen LC. Mimicking of estradiol binding by
flame retardants and their metabolites: A crystallographic analysis. Environmental Health
Perspectives, 2013, 121:1194-1199.
[300] Hamers T, Kamstra JH, Sonneveld E, Murk AJ, Visser TJ, Van Velzen MJ, Brouwer A,
Bergman Å. Biotransformation of brominated flame retardants into potentially endocrine‐
disrupting metabolites, with special attention to 2, 2′, 4, 4′‐tetrabromodiphenyl ether (BDE‐47).
Molecular Nutrition & Food Research, 2008, 52:284-298.
[301] Gamage NU, Tsvetanov S, Duggleby RG, McManus ME, Martin JL. The structure of human
SULT1A1 crystallized with estradiol. An insight into active site plasticity and substrate
inhibition with multi-ring substrates. Journal of Biological Chemistry, 2005, 280:41482-
41486.
[302] Ekroos M, Sjögren T. Structural basis for ligand promiscuity in cytochrome P450 3A4.
Proceedings of the National Academy of Sciences, 2006, 103:13682-13687.
[303] Cojocaru V, Winn PJ, Wade RC. The ins and outs of cytochrome P450s. Biochimica et
Biophysica Acta (BBA) - General Subjects, 2007, 1770:390-401.
[304] Lu L-Y, Chiang H-P, Chen W-T, Yang Y-S. Dimerization is responsible for the structural
stability of human sulfotransferase 1A1. Drug Metabolism and Disposition, 2009, 37:1083-
1088.
[305] Schomburg I, Chang A, Schomburg D. BRENDA, enzyme data and metabolic information.
Nucleic Acids Research, 2002, 30:47-49.
[306] Kehoe JW, Maly DJ, Verdugo DE, Armstrong JI, Cook BN, Ouyang Y-B, Moore KL,
Ellman JA, Bertozzi CR. Tyrosylprotein sulfotransferase inhibitors generated by combinatorial
target-guided ligand assembly. Bioorganic & Medicinal Chemistry Letters, 2002, 12:329-332.
[307] Le Guilloux V, Schmidtke P, Tuffery P. Fpocket: An open source platform for ligand pocket
detection. BMC Bioinformatics, 2009, 10:168.
[308] Schmidtke P, Barril X. Understanding and predicting druggability. A high-throughput method
for detection of drug binding sites. Journal of Medicinal Chemistry, 2010, 53:5858-5867.
[309] Steindl TM, Schuster D, Laggner C, Chuang K, Hoffmann RD, Langer T. Parallel screening
and activity profiling with HIV protease inhibitor pharmacophore models. Journal of Chemical
Information and Modeling, 2007, 47:563-571.
[310] Schuster D. 3D pharmacophores as tools for activity profiling. Drug Discovery Today:
Technologies, 2010, 7:e205-e211.
[311] Cole GB, Keum G, Liu J, Small GW, Satyamurthy N, Kepe V, Barrio JR. Specific estrogen
sulfotransferase (SULT1E1) substrates and molecular imaging probe candidates. Proceedings of
the National Academy of Sciences, 2010, 107:6222-6227.
[312] Sydow D. Dynophores: Novel dynamic pharmacophores - Implementation of pharmacophore
generation based on molecular dynamics trajectories and their graphical representation. (Master's
thesis), Faculty of Life Sciences, Department of Biology, Humboldt-Universität zu Berlin
BIBLIOGRAPHY
119
[313] Burbidge R, Trotter M, Buxton B, Holden S. Drug design by machine learning: Support vector
machines for pharmaceutical data analysis. Computers and Chemistry, 2001, 26:5-14.
[314] Sakiyama Y, Yuki H, Moriya T, Hattori K, Suzuki M, Shimada K, Honma T. Predicting
human liver microsomal stability with machine learning techniques. Journal of Molecular
Graphics and Modelling, 2008, 26:907-915.
[315] Yap CW, Chen YZ. Prediction of cytochrome P450 3A4, 2D6, and 2C9 inhibitors and substrates
by using support vector machines. Journal of Chemical Information and Modeling, 2005,
45:982-992.
[316] Kriegl JM, Arnhold T, Beck B, Fox T. Prediction of human cytochrome P450 inhibition using
support vector machines. QSAR & Combinatorial Science, 2005, 24:491-502.
[317] Berthold MR, Cebron N, Dill F, Gabriel TR, Kötter T, Meinl T, Ohl P, Sieb C, Thiel K,
Wiswedel B. KNIME: The Konstanz information miner. In: Data analysis, machine learning
and applications, Springer; 2008, 319-326.
[318] Hall M, Frank E, Holmes G, Pfahringer B, Reutemann P, Witten IH. The WEKA data mining
software: An update. ACM SIGKDD explorations newsletter, 2009, 11:10-18.
[319] van de Waterbeemd H, Rose S. Chapter 23 - Quantitative approaches to structure–activity
relationships. In: Wermuth CG, ed. The practice of medicinal chemistry (third edition). New
York, Academic Press; 2008, 491-513.
[320] Klepsch F, Vasanthanathan P, Ecker GF. Ligand and structure-based classification models for
prediction of P-glycoprotein inhibitors. Journal of Chemical Information and Modeling, 2014,
54:218-229.
[321] Dimmock JR, Elias DW, Beazely MA, Kandepu NM. Bioactivities of chalcones. Current
Medicinal Chemistry, 1999, 6:1125-1149.
[322] Go ML, Wu X, Liu XL. Chalcones: An update on cytotoxic and chemoprotective properties.
Current Medicinal Chemistry, 2005, 12:483-499.
[323] De Angelis M, Stossi F, Carlson KA, Katzenellenbogen BS, Katzenellenbogen JA. Indazole
estrogens: Highly selective ligands for the estrogen receptor beta. Journal of Medicinal
Chemistry, 2005, 48:1132-1144.
[324] Malamas MS, Manas ES, McDevitt RE, Gunawan I, Xu ZB, Collini MD, Miller CP, Dinh
T, Henderson RA, Keith JC, Jr., Harris HA. Design and synthesis of aryl diphenolic azoles as
potent and selective estrogen receptor-beta ligands. Journal of Medicinal Chemistry, 2004,
47:5021-5040.
[325] Palmer TM, Poucher SM, Jacobson KA, Stiles GL. 125I-4-(2-[7-amino-2-[2-furyl][1, 2, 4]
triazolo [2, 3-a][1, 3, 5] triazin-5-yl-amino] ethyl) phenol, a high affinity antagonist radioligand
selective for the A2a adenosine receptor. Molecular Pharmacology, 1995, 48:970-974.
[326] He L, Zhang L, Liu X, Li X, Zheng M, Li H, Yu K, Chen K, Shen X, Jiang H, Liu H.
Discovering potent inhibitors against the beta-hydroxyacyl-acyl carrier protein dehydratase
(FabZ) of Helicobacter pylori: Structure-based design, synthesis, bioassay, and crystal structure
determination. Journal of Medicinal Chemistry, 2009, 52:2465-2481.
BIBLIOGRAPHY
120
[327] Barkhem T, Carlsson B, Nilsson Y, Enmark E, Gustafsson J, Nilsson S. Differential response
of estrogen receptor alpha and estrogen receptor beta to partial estrogen agonists/antagonists.
Molecular Pharmacology, 1998, 54:105-112.
[328] Cheng LS, Amaro RE, Xu D, Li WW, Arzberger PW, McCammon JA. Ensemble-based
virtual screening reveals potential novel antiviral compounds for avian influenza neuraminidase.
Journal of Medicinal Chemistry, 2008, 51:3878-3894.
[329] Slynko I, Scharfe M, Rumpf T, Eib J, Metzger E, Schule R, Jung M, Sippl W. Virtual
screening of PRK1 inhibitors: Ensemble docking, rescoring using binding free energy calculation
and QSAR model development. Journal of Chemical Information and Modeling, 2014,
54:138-150.
[330] Gamage NU, Duggleby RG, Barnett AC, Tresillian M, Latham CF, Liyou NE, McManus
ME, Martin JL. Structure of a human carcinogen-converting enzyme, SULT1A1: Structural and
kinetic implications of substrate inhibition. Journal of Biological Chemistry, 2003, 278:7655-
7662.
[331] Berger I, Guttman C, Amar D, Zarivach R, Aharoni A. The molecular basis for the broad
substrate specificity of human sulfotransferase 1A1. PloS One, 2011, 6.
[332] Engst W, Pabel U, Glatt H. Conjugation of 4-nitrophenol and 4-hydroxylonazolac in V79-
derived cells expressing individual forms of human sulphotransferases. Environmental
Toxicology and Pharmacology, 2002, 11:243-250.
[333] Gauch HG. Scientific Method in Practice, Cambridge University Press; 2003.
[334] Hoffmann R, Minkin VI, Carpenter BK. Ockham's razor and chemistry. Bulletin de la Societe
Chimique de France, 1996, 133:117-130.
[335] Bowers KJ, Chow E, Xu H, Dror RO, Eastwood MP, Gregersen B, Klepeis JL, Kolossvary
I, Moraes M, Sacerdoti FD. Scalable algorithms for molecular dynamics simulations on
commodity clusters. In: SC 2006 Conference, Proceedings of the ACM/IEEE: IEEE; 2006.
[336] Li H, Robertson AD, Jensen JH. Very fast empirical prediction and rationalization of protein
pKa values. Proteins: Structure, Function, and Bioinformatics, 2005, 61:704-721.
[337] Sadowski J, Gasteiger J, Klebe G. Comparison of automatic three-dimensional model builders
using 639 X-ray structures. Journal of Chemical Information and Computer Sciences, 1994,
34:1000-1008.
[338] Halgren TA. Merck molecular force field. I. Basis, form, scope, parameterization, and
performance of MMFF94. Journal of Computational Chemistry, 1996, 17:490-519.
[339] Irwin JJ, Shoichet BK. ZINC-a free database of commercially available compounds for virtual
screening. Journal of Chemical Information and Modeling, 2005, 45:177-182.
[340] Korb O, Stutzle T, Exner TE. Empirical scoring functions for advanced protein− ligand docking
with PLANTS. Journal of Chemical Information and Modeling, 2009, 49:84-96.
[341] SciFinder Scholar. Chemical Abstracts Service, Available at: https://scifinder.cas.org/.
(Accessed 14 Dec 2015),
BIBLIOGRAPHY
121
[342] Platt J. Fast training of support vector machines using sequential minimal optimization.
Advances in kernel methods—support vector learning, 1999, 3.
[343] Keerthi SS, Shevade SK, Bhattacharyya C, Murthy KRK. Improvements to Platt's SMO
algorithm for SVM classifier design. Neural Computation, 2001, 13:637-649.
[344] Quinlan JR. C4. 5: programs for machine learning, Elsevier; 2014.
[345] Shafer J, Agrawal R, Mehta M. SPRINT: A scalable parallel classi er for data mining. In: Proc.
1996 Int. Conf. Very Large Data Bases: Citeseer; 1996.
[346] Riedmiller M, Braun H. A direct adaptive method for faster backpropagation learning: The
RPROP algorithm. In: Neural Networks, 1993., IEEE International Conference on: IEEE; 1993.
[347] Hagen M, Pabel U, Landsiedel R, Bartsch I, Falany CN, Glatt H. Expression of human
estrogen sulfotransferase in Salmonella typhimurium: Differences between hHST and hEST in
the enantioselective activation of 1-hydroxyethylpyrene to a mutagen. Chemico-Biological
Interactions, 1998, 109:249-253.
[348] Meinl W, Meerman JH, Glatt H. Differential activation of promutagens by alloenzymes of
human sulfotransferase 1A2 expressed in Salmonella typhimurium. Pharmacogenetics, 2002,
12:677-689.
[349] Meinl W, Pabel U, Osterloh-Quiroz M, Hengstler JG, Glatt H. Human sulphotransferases
are involved in the activation of aristolochic acids and are expressed in renal target tissue.
International Journal of Cancer, 2006, 118:1090-1097.
[350] Falany CN. Enzymology of human cytosolic sulfotransferases. FASEB Journal, 1997, 11:206-
216.
[351] Falany CN, Strom P, Swedmark S. Sulphation of o-desmethylnaproxen and related compounds
by human cytosolic sulfotransferases. British Journal of Clinical Pharmacology, 2005, 60:632-
640.
[352] Hempel N, Barnett AC, Bolton-Grob RM, Liyou NE, McManus ME. Site-directed
mutagenesis of the substrate-binding cleft of human estrogen sulfotransferase. Biochemical and
Biophysical Research Communications, 2000, 276:224-230.
[353] Hui Y, Yasuda S, Liu M-Y, Wu Y-y, Liu M-C. On the sulfation and methylation of
catecholestrogens in human mammary epithelial cells and breast cancer cells. Biological and
Pharmaceutical Bulletin, 2008, 31:769-773.
[354] Nishiyama T, Ogura K, Nakano H, Kaku T, Takahashi E, Ohkubo Y, Sekine K, Hiratsuka
A, Kadota S, Watabe T. Sulfation of environmental estrogens by cytosolic human
sulfotransferases. Drug Metabolism and Pharmacokinetics, 2002, 17:221-228.
[355] Wang M, Ebmeier CC, Olin JR, Anderson RJ. Sulfation of tibolone metabolites by human
postmenopausal liver and small intestinal sulfotransferases (SULTs). Steroids, 2006, 71:343-
351.
[356] van Lipzig MM, Commandeur JN, de Kanter FJ, Damsten MC, Vermeulen NP, Maat E,
Groot EJ, Brouwer A, Kester MH, Visser TJ. Bioactivation of dibrominated biphenyls by
BIBLIOGRAPHY
122
cytochrome P450 activity to metabolites with estrogenic activity and estrogen sulfotransferase
inhibition capacity. Chemical Research in Toxicology, 2005, 18:1691-1700.
[357] Stjernschantz E, Reinen J, Meinl W, George BJ, Glatt H, Vermeulen NP, Oostenbrink C.
Comparison of murine and human estrogen sulfotransferase inhibition in vitro and in silico-
implications for differences in activity, subunit dimerization and substrate inhibition. Molecular
and Cellular Endocrinology, 2010, 317:127-140.
[358] Ung D, Nagar S. Variable sulfation of dietary polyphenols by recombinant human
sulfotransferase (SULT) 1A1 genetic variants and SULT1E1. Drug Metabolism and
Disposition: The Biological Fate of Chemicals, 2007, 35:740-746.
[359] Pai TG, Suiko M, Sakakibara Y, Liu MC. Sulfation of flavonoids and other phenolic dietary
compounds by the human cytosolic sulfotransferases. Biochemical and Biophysical Research
Communications, 2001, 285:1175-1179.
[360] Otake Y, Nolan AL, Walle UK, Walle T. Quercetin and resveratrol potently reduce estrogen
sulfotransferase activity in normal human mammary epithelial cells. Journal of Steroid
Biochemistry and Molecular Biology, 2000, 73:265-270.
[361] Kobayashi S, Shinohara M, Nagai T, Konishi Y. Transport mechanisms for soy isoflavones
and microbial metabolites dihydrogenistein and dihydrodaidzein across monolayers and
membranes. Bioscience, Biotechnology, and Biochemistry, 2013, 77:2210-2217.
[362] Ahnfelt NO, Agback H. Olsalazine-O-sulphate: An acid labile metabolite of olsalazine.
Scandinavian Journal of Gastroenterology. Supplement, 1988, 148:13-16.
[363] Raju UMA, Noumoff J, Levitz M, Bradlow HL, Breed CN. On the occurrence and transport
of estriol-3-sulfate in human breast cyst fluid: The metabolic disposition of blood estriol-3-sulfate
in normal women. The Journal of Clinical Endocrinology & Metabolism, 1981, 53:847-851.
[364] Dietrich CG, Ottenhoff R, Rudi de Waart D, Oude Elferink RPJ. Lack of UGT1 isoforms in
gunn rats changes metabolic ratio and facilitates excretion of the food-derived carcinogen 2-amino-
1-methyl-6-phenylimidazo[4,5-b]pyridine. Toxicology and Applied Pharmacology, 2001,
170:137-143.
[365] Furimsky AM, Green CE, Sharp LE, Catz P, Adjei AA, Parman T, Kapetanovic IM,
Weinshilboum RM, Iyer LV. Effect of resveratrol on 17beta-estradiol sulfation by human
hepatic and jejunal S9 and recombinant sulfotransferase 1E1. Drug Metabolism and
Disposition: The Biological Fate of Chemicals, 2008, 36:129-136.
[366] Shimamura H, Suzuki H, Hanano M, Suzuki A, Sugiyama Y. Identification of tissues
responsible for the conjugative metabolism of liquiritigenin in rats: An analysis based on
metabolite kinetics. Biological & Pharmaceutical Bulletin, 1993, 16:899-907.
[367] Juan ME, Alfaras I, Planas JM. Determination of dihydroresveratrol in rat plasma by HPLC.
Journal of Agricultural and Food Chemistry, 2010, 58:7472-7475.
[368] Honma W, Kamiyama Y, Yoshinari K, Sasano H, Shimada M, Nagata K, Yamazoe Y.
Enzymatic characterization and interspecies difference of phenol sulfotransferases, ST1A forms.
Drug Metabolism and Disposition: The Biological Fate of Chemicals, 2001, 29:274-281.
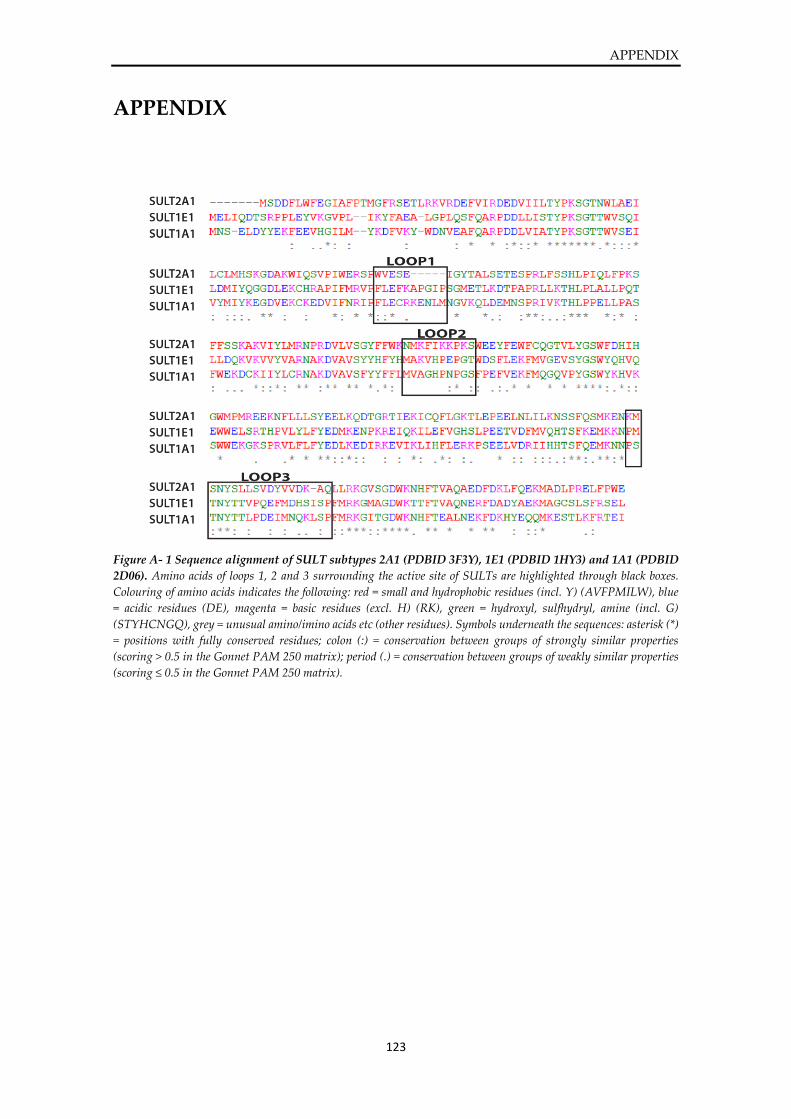
APPENDIX
123
APPENDIX
Figure A- 1 Sequence alignment of SULT subtypes 2A1 (PDBID 3F3Y), 1E1 (PDBID 1HY3) and 1A1 (PDBID
2D06). Amino acids of loops 1, 2 and 3 surrounding the active site of SULTs are highlighted through black boxes.
Colouring of amino acids indicates the following: red = small and hydrophobic residues (incl. Y) (AVFPMILW), blue
= acidic residues (DE), magenta = basic residues (excl. H) (RK), green = hydroxyl, sulfhydryl, amine (incl. G)
(STYHCNGQ), grey = unusual amino/imino acids etc (other residues). Symbols underneath the sequences: asterisk (*)
= positions with fully conserved residues; colon (:) = conservation between groups of strongly similar properties
(scoring > 0.5 in the Gonnet PAM 250 matrix); period (.) = conservation between groups of weakly similar properties
(scoring ≤ 0.5 in the Gonnet PAM 250 matrix).
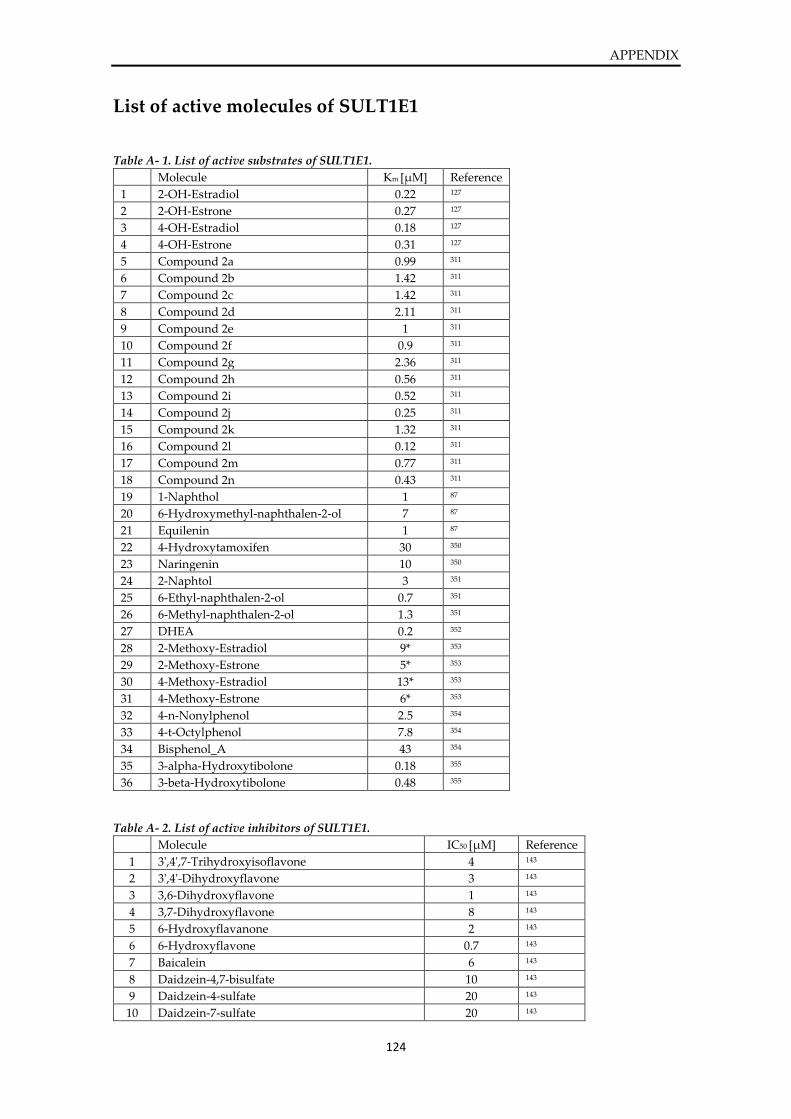
APPENDIX
124
List of active molecules of SULT1E1
Table A- 1. List of active substrates of SULT1E1.
Table A- 2. List of active inhibitors of SULT1E1.
Molecule IC50 [µM] Reference
1 3',4',7-Trihydroxyisoflavone 4 143
2 3',4'-Dihydroxyflavone 3 143
3 3,6-Dihydroxyflavone 1 143
4 3,7-Dihydroxyflavone 8 143
5 6-Hydroxyflavanone 2 143
6 6-Hydroxyflavone 0.7 143
7 Baicalein 6 143
8 Daidzein-4,7-bisulfate 10 143
9 Daidzein-4-sulfate 20 143
10 Daidzein-7-sulfate 20 143
Molecule Km [µM] Reference
1 2-OH-Estradiol 0.22 127
2 2-OH-Estrone 0.27 127
3 4-OH-Estradiol 0.18 127
4 4-OH-Estrone 0.31 127
5 Compound 2a 0.99 311
6 Compound 2b 1.42 311
7 Compound 2c 1.42 311
8 Compound 2d 2.11 311
9 Compound 2e 1 311
10 Compound 2f 0.9 311
11 Compound 2g 2.36 311
12 Compound 2h 0.56 311
13 Compound 2i 0.52 311
14 Compound 2j 0.25 311
15 Compound 2k 1.32 311
16 Compound 2l 0.12 311
17 Compound 2m 0.77 311
18 Compound 2n 0.43 311
19 1-Naphthol 1 87
20 6-Hydroxymethyl-naphthalen-2-ol 7 87
21 Equilenin 1 87
22 4-Hydroxytamoxifen 30 350
23 Naringenin 10 350
24 2-Naphtol 3 351
25 6-Ethyl-naphthalen-2-ol 0.7 351
26 6-Methyl-naphthalen-2-ol 1.3 351
27 DHEA 0.2 352
28 2-Methoxy-Estradiol 9* 353
29 2-Methoxy-Estrone 5* 353
30 4-Methoxy-Estradiol 13* 353
31 4-Methoxy-Estrone 6* 353
32 4-n-Nonylphenol 2.5 354
33 4-t-Octylphenol 7.8 354
34 Bisphenol_A 43 354
35 3-alpha-Hydroxytibolone 0.18 355
36 3-beta-Hydroxytibolone 0.48 355
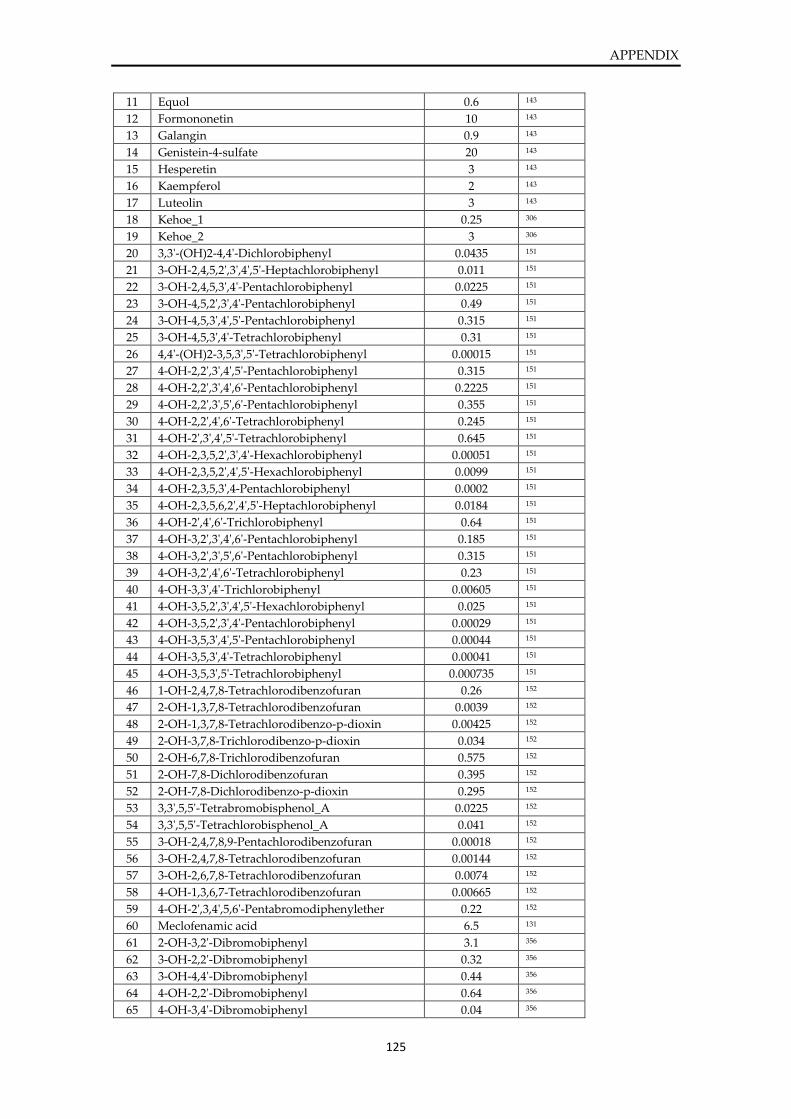
APPENDIX
125
11 Equol 0.6 143
12 Formononetin 10 143
13 Galangin 0.9 143
14 Genistein-4-sulfate 20 143
15 Hesperetin 3 143
16 Kaempferol 2 143
17 Luteolin 3 143
18 Kehoe_1 0.25 306
19 Kehoe_2 3 306
20 3,3'-(OH)2-4,4'-Dichlorobiphenyl 0.0435 151
21 3-OH-2,4,5,2',3',4',5'-Heptachlorobiphenyl 0.011 151
22 3-OH-2,4,5,3',4'-Pentachlorobiphenyl 0.0225 151
23 3-OH-4,5,2',3',4'-Pentachlorobiphenyl 0.49 151
24 3-OH-4,5,3',4',5'-Pentachlorobiphenyl 0.315 151
25 3-OH-4,5,3',4'-Tetrachlorobiphenyl 0.31 151
26 4,4'-(OH)2-3,5,3',5'-Tetrachlorobiphenyl 0.00015 151
27 4-OH-2,2',3',4',5'-Pentachlorobiphenyl 0.315 151
28 4-OH-2,2',3',4',6'-Pentachlorobiphenyl 0.2225 151
29 4-OH-2,2',3',5',6'-Pentachlorobiphenyl 0.355 151
30 4-OH-2,2',4',6'-Tetrachlorobiphenyl 0.245 151
31 4-OH-2',3',4',5'-Tetrachlorobiphenyl 0.645 151
32 4-OH-2,3,5,2',3',4'-Hexachlorobiphenyl 0.00051 151
33 4-OH-2,3,5,2',4',5'-Hexachlorobiphenyl 0.0099 151
34 4-OH-2,3,5,3',4-Pentachlorobiphenyl 0.0002 151
35 4-OH-2,3,5,6,2',4',5'-Heptachlorobiphenyl 0.0184 151
36 4-OH-2',4',6'-Trichlorobiphenyl 0.64 151
37 4-OH-3,2',3',4',6'-Pentachlorobiphenyl 0.185 151
38 4-OH-3,2',3',5',6'-Pentachlorobiphenyl 0.315 151
39 4-OH-3,2',4',6'-Tetrachlorobiphenyl 0.23 151
40 4-OH-3,3',4'-Trichlorobiphenyl 0.00605 151
41 4-OH-3,5,2',3',4',5'-Hexachlorobiphenyl 0.025 151
42 4-OH-3,5,2',3',4'-Pentachlorobiphenyl 0.00029 151
43 4-OH-3,5,3',4',5'-Pentachlorobiphenyl 0.00044 151
44 4-OH-3,5,3',4'-Tetrachlorobiphenyl 0.00041 151
45 4-OH-3,5,3',5'-Tetrachlorobiphenyl 0.000735 151
46 1-OH-2,4,7,8-Tetrachlorodibenzofuran 0.26 152
47 2-OH-1,3,7,8-Tetrachlorodibenzofuran 0.0039 152
48 2-OH-1,3,7,8-Tetrachlorodibenzo-p-dioxin 0.00425 152
49 2-OH-3,7,8-Trichlorodibenzo-p-dioxin 0.034 152
50 2-OH-6,7,8-Trichlorodibenzofuran 0.575 152
51 2-OH-7,8-Dichlorodibenzofuran 0.395 152
52 2-OH-7,8-Dichlorodibenzo-p-dioxin 0.295 152
53 3,3',5,5'-Tetrabromobisphenol_A 0.0225 152
54 3,3',5,5'-Tetrachlorobisphenol_A 0.041 152
55 3-OH-2,4,7,8,9-Pentachlorodibenzofuran 0.00018 152
56 3-OH-2,4,7,8-Tetrachlorodibenzofuran 0.00144 152
57 3-OH-2,6,7,8-Tetrachlorodibenzofuran 0.0074 152
58 4-OH-1,3,6,7-Tetrachlorodibenzofuran 0.00665 152
59 4-OH-2',3,4',5,6'-Pentabromodiphenylether 0.22 152
60 Meclofenamic acid 6.5 131
61 2-OH-3,2'-Dibromobiphenyl 3.1 356
62 3-OH-2,2'-Dibromobiphenyl 0.32 356
63 3-OH-4,4'-Dibromobiphenyl 0.44 356
64 4-OH-2,2'-Dibromobiphenyl 0.64 356
65 4-OH-3,4'-Dibromobiphenyl 0.04 356
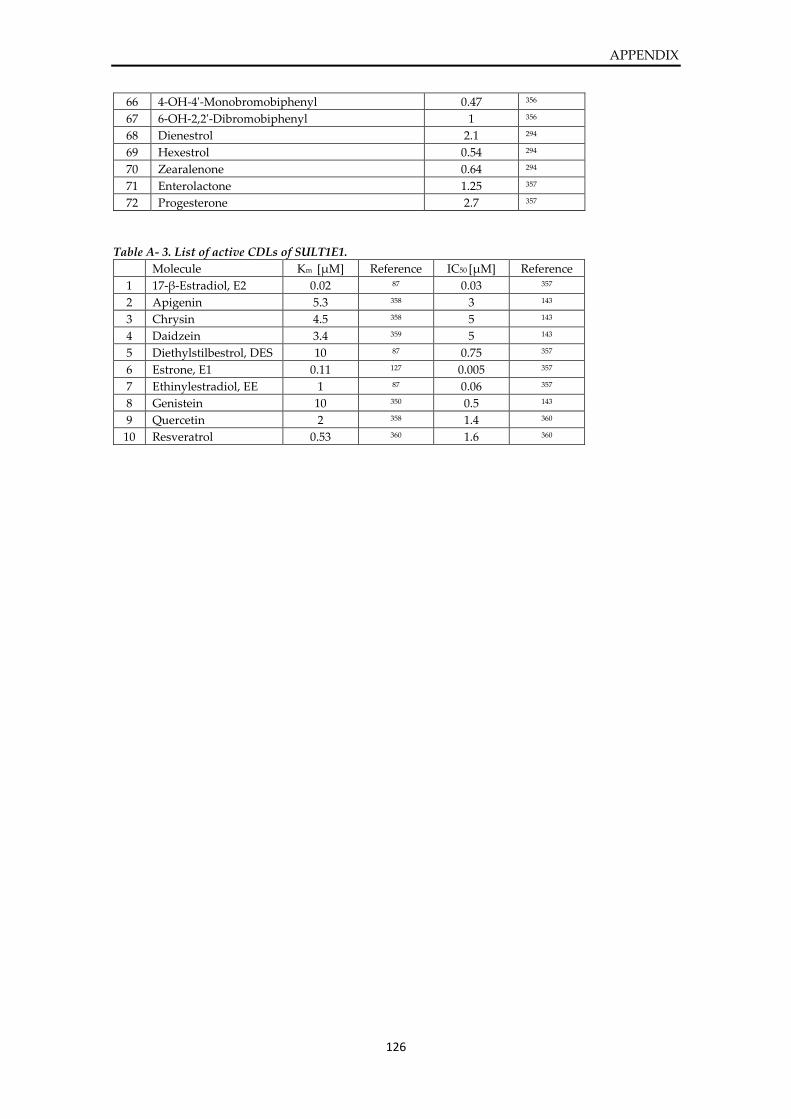
APPENDIX
126
66 4-OH-4'-Monobromobiphenyl 0.47 356
67 6-OH-2,2'-Dibromobiphenyl 1 356
68 Dienestrol 2.1 294
69 Hexestrol 0.54 294
70 Zearalenone 0.64 294
71 Enterolactone 1.25 357
72 Progesterone 2.7 357
Table A- 3. List of active CDLs of SULT1E1.
Molecule Km [µM] Reference IC50 [µM] Reference
1 17-β-Estradiol, E2 0.02 87 0.03 357
2 Apigenin 5.3 358 3 143
3 Chrysin 4.5 358 5 143
4 Daidzein 3.4 359 5 143
5 Diethylstilbestrol, DES 10 87 0.75 357
6 Estrone, E1 0.11 127 0.005 357
7 Ethinylestradiol, EE 1 87 0.06 357
8 Genistein 10 350 0.5 143
9 Quercetin 2 358 1.4 360
10 Resveratrol 0.53 360 1.6 360
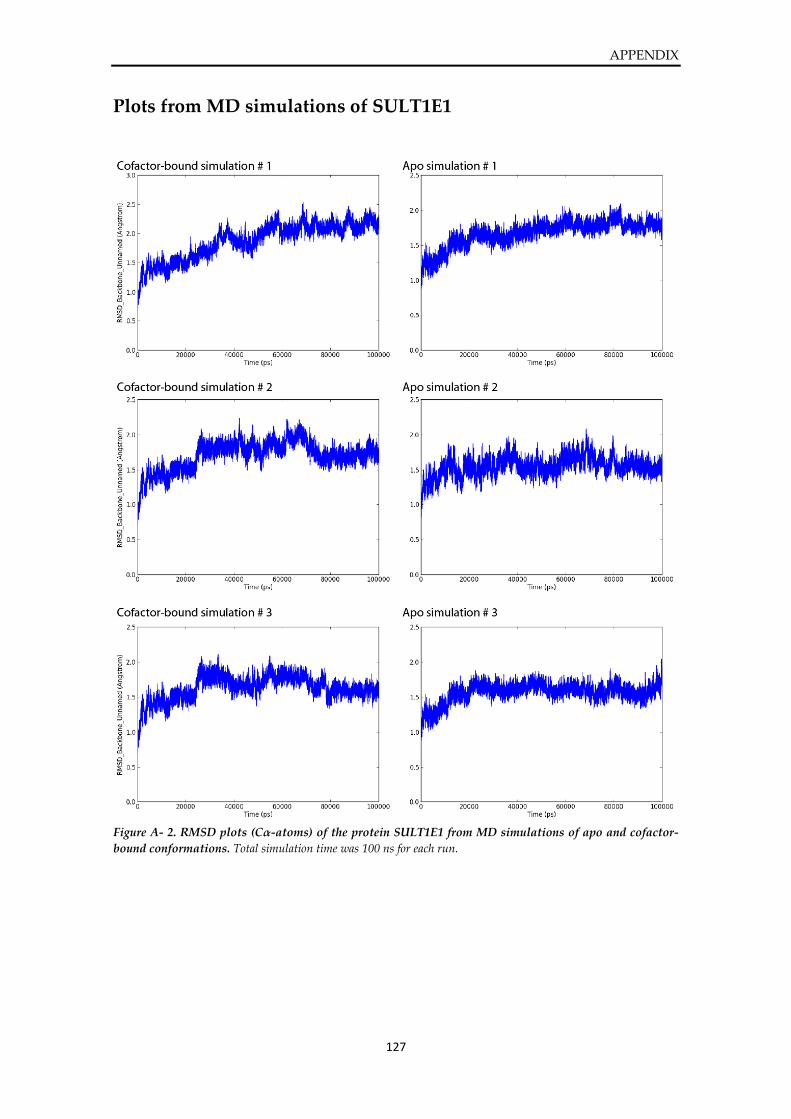
APPENDIX
127
Plots from MD simulations of SULT1E1
Figure A- 2. RMSD plots (Cα-atoms) of the protein SULT1E1 from MD simulations of apo and cofactor-
bound conformations. Total simulation time was 100 ns for each run.
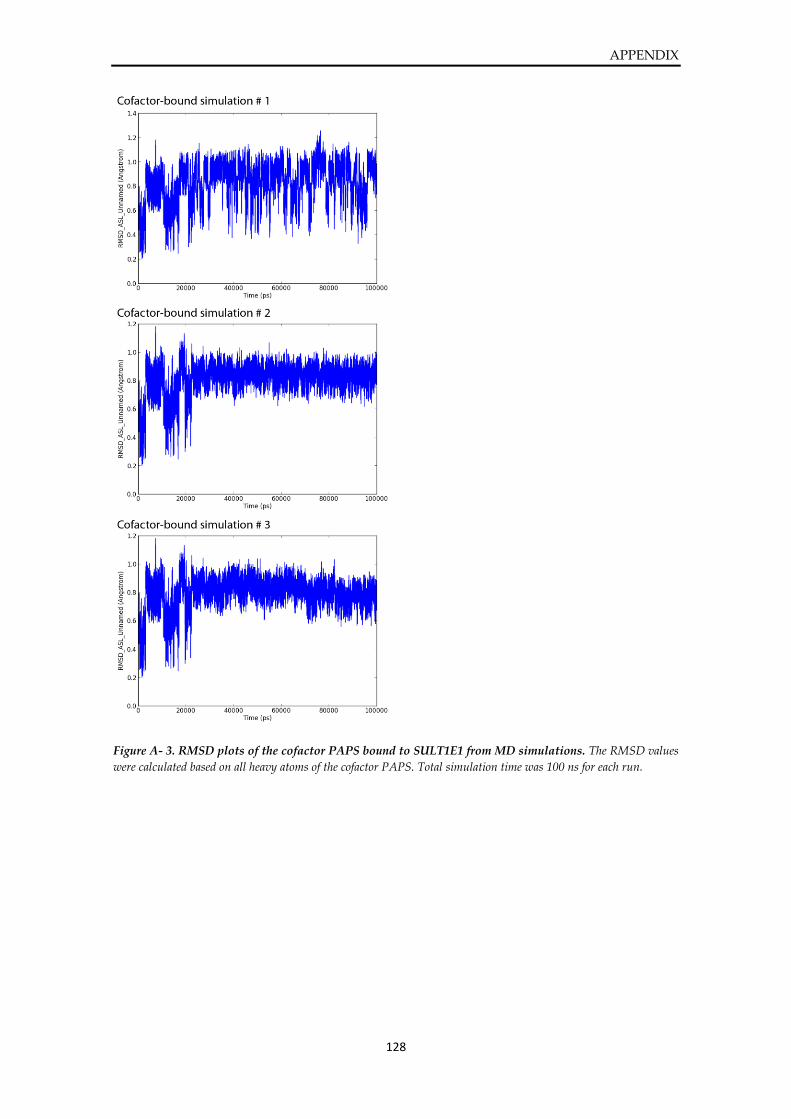
APPENDIX
128
Figure A- 3. RMSD plots of the cofactor PAPS bound to SULT1E1 from MD simulations. The RMSD values
were calculated based on all heavy atoms of the cofactor PAPS. Total simulation time was 100 ns for each run.
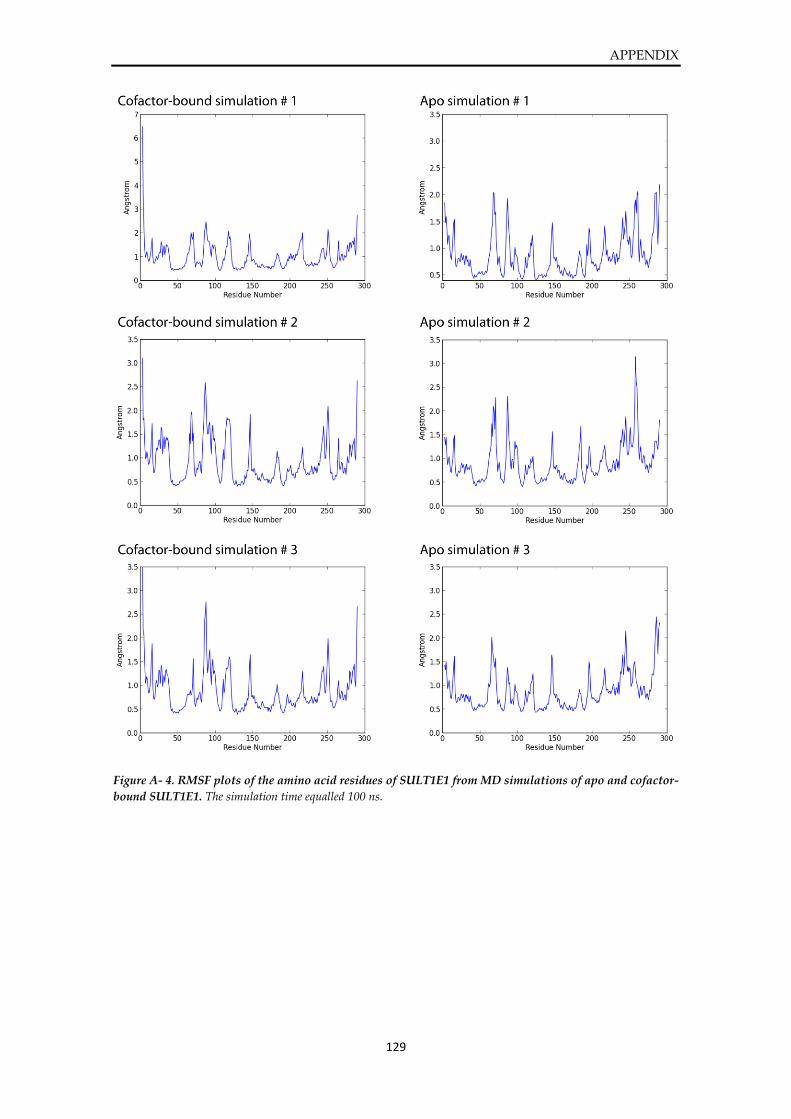
APPENDIX
129
Figure A- 4. RMSF plots of the amino acid residues of SULT1E1 from MD simulations of apo and cofactor-
bound SULT1E1. The simulation time equalled 100 ns.
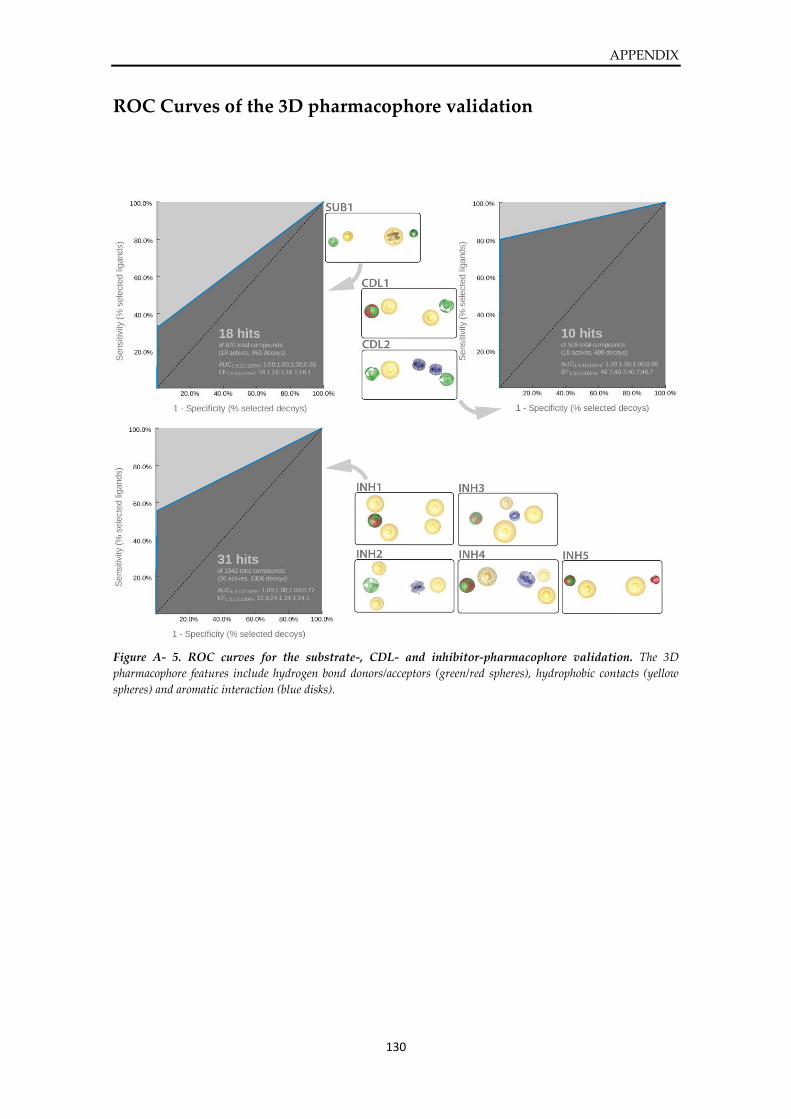
APPENDIX
130
ROC Curves of the 3D pharmacophore validation
Figure A- 5. ROC curves for the substrate-, CDL- and inhibitor-pharmacophore validation. The 3D
pharmacophore features include hydrogen bond donors/acceptors (green/red spheres), hydrophobic contacts (yellow
spheres) and aromatic interaction (blue disks).
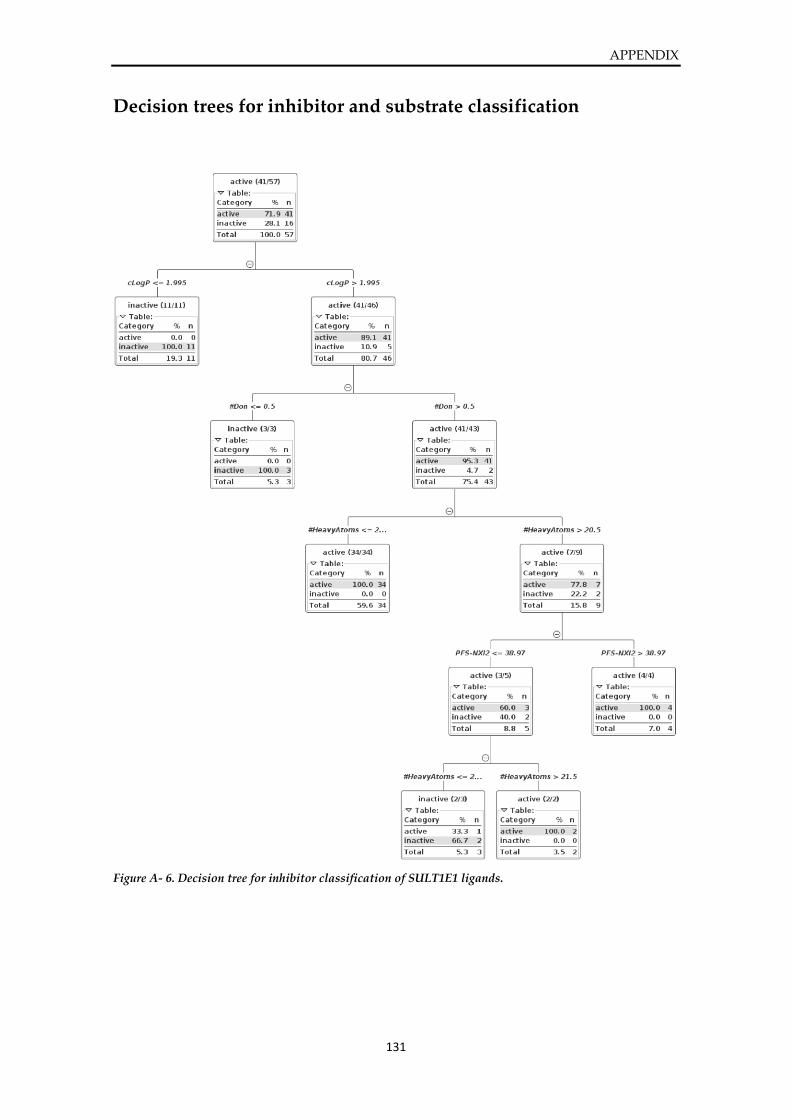
APPENDIX
131
Decision trees for inhibitor and substrate classification
Figure A- 6. Decision tree for inhibitor classification of SULT1E1 ligands.
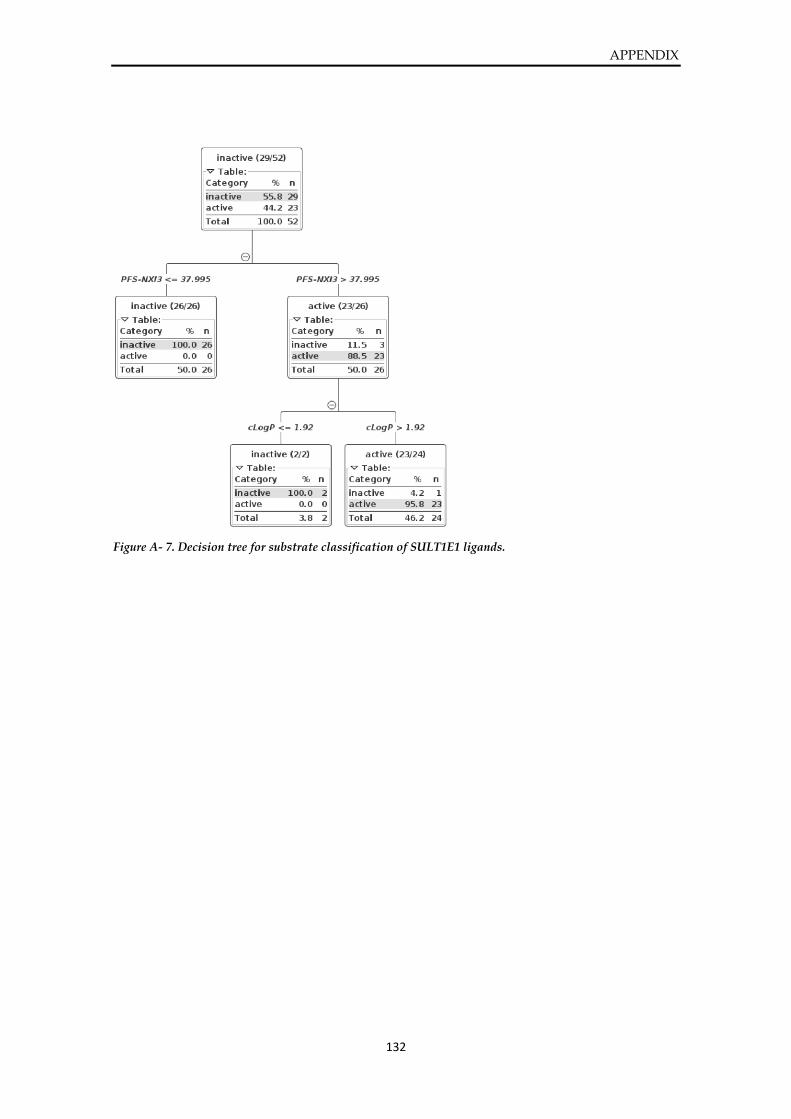
APPENDIX
132
Figure A- 7. Decision tree for substrate classification of SULT1E1 ligands.
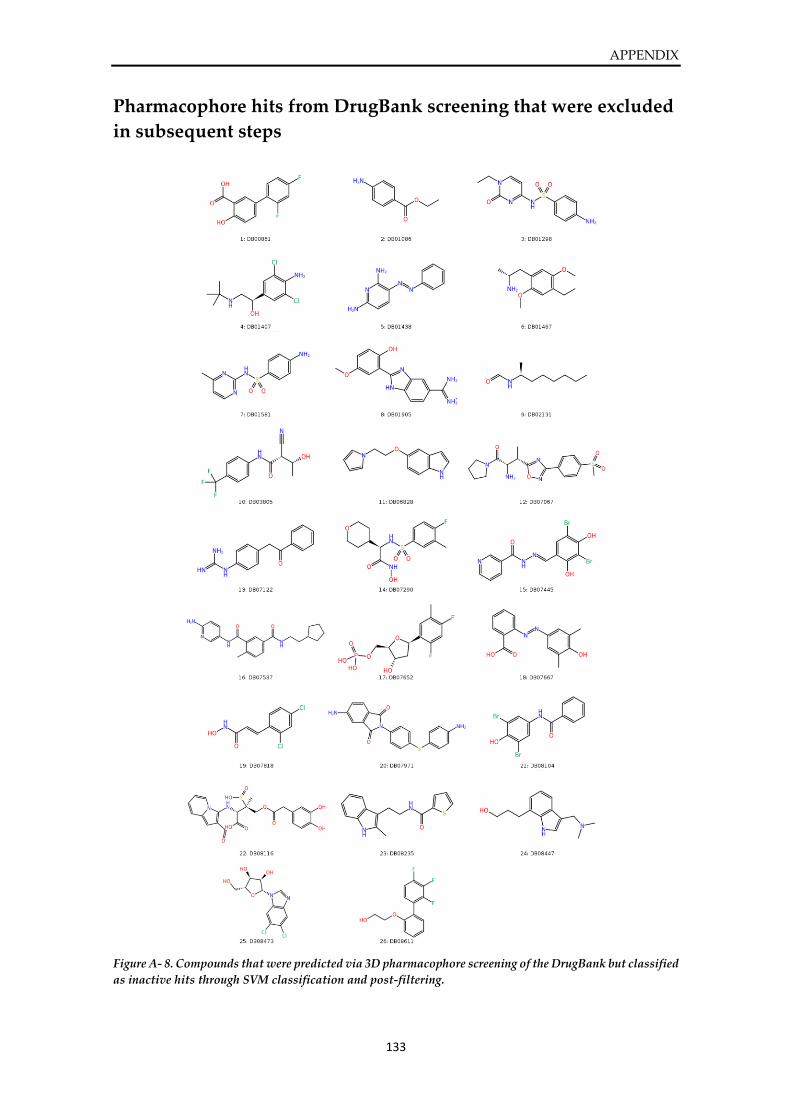
APPENDIX
133
Pharmacophore hits from DrugBank screening that were excluded
in subsequent steps
Figure A- 8. Compounds that were predicted via 3D pharmacophore screening of the DrugBank but classified
as inactive hits through SVM classification and post-filtering.
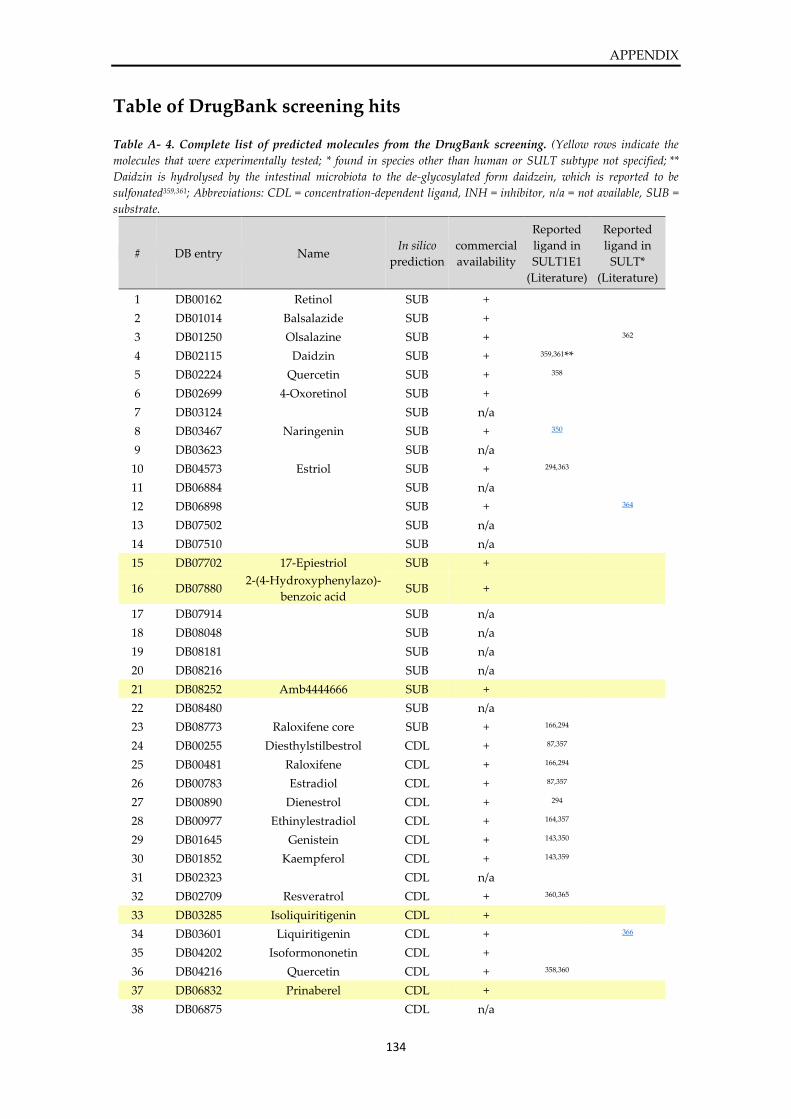
APPENDIX
134
Table of DrugBank screening hits Table A- 4. Complete list of predicted molecules from the DrugBank screening. (Yellow rows indicate the
molecules that were experimentally tested; * found in species other than human or SULT subtype not specified; **
Daidzin is hydrolysed by the intestinal microbiota to the de-glycosylated form daidzein, which is reported to be
sulfonated359,361; Abbreviations: CDL = concentration-dependent ligand, INH = inhibitor, n/a = not available, SUB =
substrate.
# DB entry Name In silico
prediction
commercial
availability
Reported
ligand in
SULT1E1
(Literature)
Reported
ligand in
SULT*
(Literature)
1 DB00162 Retinol SUB +
2 DB01014 Balsalazide SUB +
3 DB01250 Olsalazine SUB + 362
4 DB02115 Daidzin SUB + 359,361**
5 DB02224 Quercetin SUB + 358
6 DB02699 4-Oxoretinol SUB +
7 DB03124 SUB n/a
8 DB03467 Naringenin SUB + 350
9 DB03623 SUB n/a
10 DB04573 Estriol SUB + 294,363
11 DB06884 SUB n/a
12 DB06898 SUB + 364
13 DB07502 SUB n/a
14 DB07510 SUB n/a
15 DB07702 17-Epiestriol SUB +
16 DB07880 2-(4-Hydroxyphenylazo)-
benzoic acid SUB +
17 DB07914 SUB n/a
18 DB08048 SUB n/a
19 DB08181 SUB n/a
20 DB08216 SUB n/a
21 DB08252 Amb4444666 SUB +
22 DB08480 SUB n/a
23 DB08773 Raloxifene core SUB + 166,294
24 DB00255 Diesthylstilbestrol CDL + 87,357
25 DB00481 Raloxifene CDL + 166,294
26 DB00783 Estradiol CDL + 87,357
27 DB00890 Dienestrol CDL + 294
28 DB00977 Ethinylestradiol CDL + 164,357
29 DB01645 Genistein CDL + 143,350
30 DB01852 Kaempferol CDL + 143,359
31 DB02323 CDL n/a
32 DB02709 Resveratrol CDL + 360,365
33 DB03285 Isoliquiritigenin CDL +
34 DB03601 Liquiritigenin CDL + 366
35 DB04202 Isoformononetin CDL +
36 DB04216 Quercetin CDL + 358,360
37 DB06832 Prinaberel CDL +
38 DB06875 CDL n/a
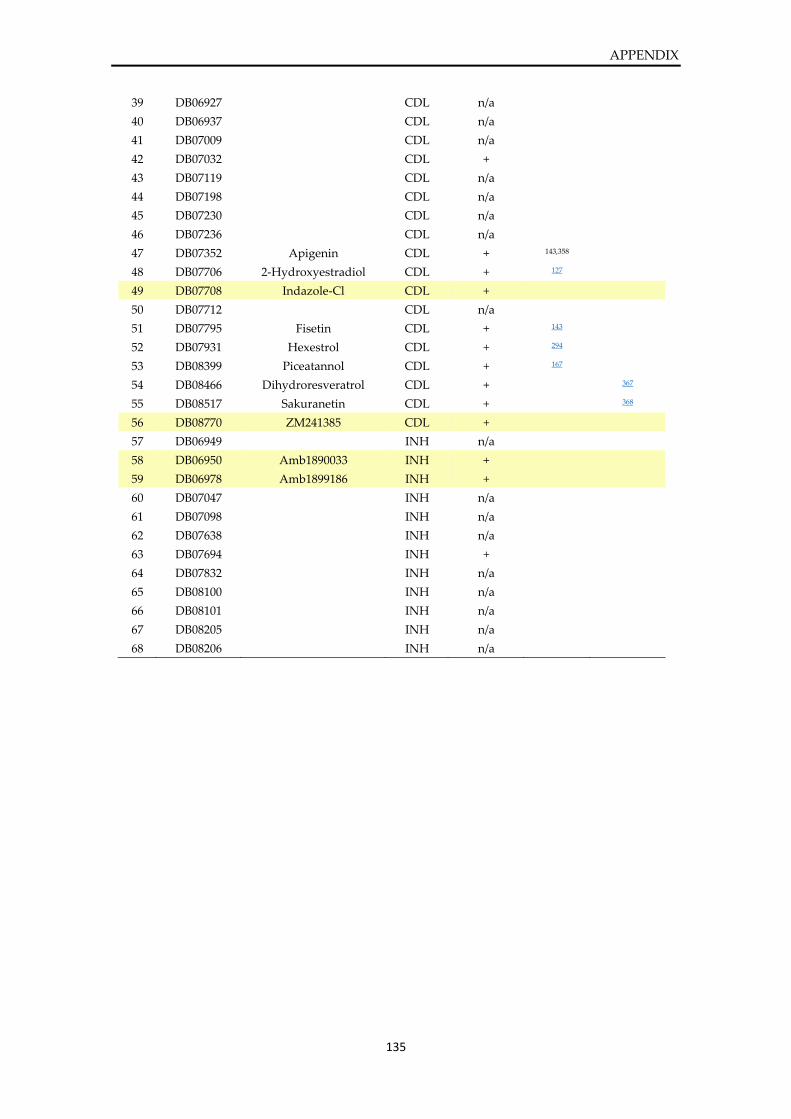
APPENDIX
135
39 DB06927 CDL n/a
40 DB06937 CDL n/a
41 DB07009 CDL n/a
42 DB07032 CDL +
43 DB07119 CDL n/a
44 DB07198 CDL n/a
45 DB07230 CDL n/a
46 DB07236 CDL n/a
47 DB07352 Apigenin CDL + 143,358
48 DB07706 2-Hydroxyestradiol CDL + 127
49 DB07708 Indazole-Cl CDL +
50 DB07712 CDL n/a
51 DB07795 Fisetin CDL + 143
52 DB07931 Hexestrol CDL + 294
53 DB08399 Piceatannol CDL + 167
54 DB08466 Dihydroresveratrol CDL + 367
55 DB08517 Sakuranetin CDL + 368
56 DB08770 ZM241385 CDL +
57 DB06949 INH n/a
58 DB06950 Amb1890033 INH +
59 DB06978 Amb1899186 INH +
60 DB07047 INH n/a
61 DB07098 INH n/a
62 DB07638 INH n/a
63 DB07694 INH +
64 DB07832 INH n/a
65 DB08100 INH n/a
66 DB08101 INH n/a
67 DB08205 INH n/a
68 DB08206 INH n/a
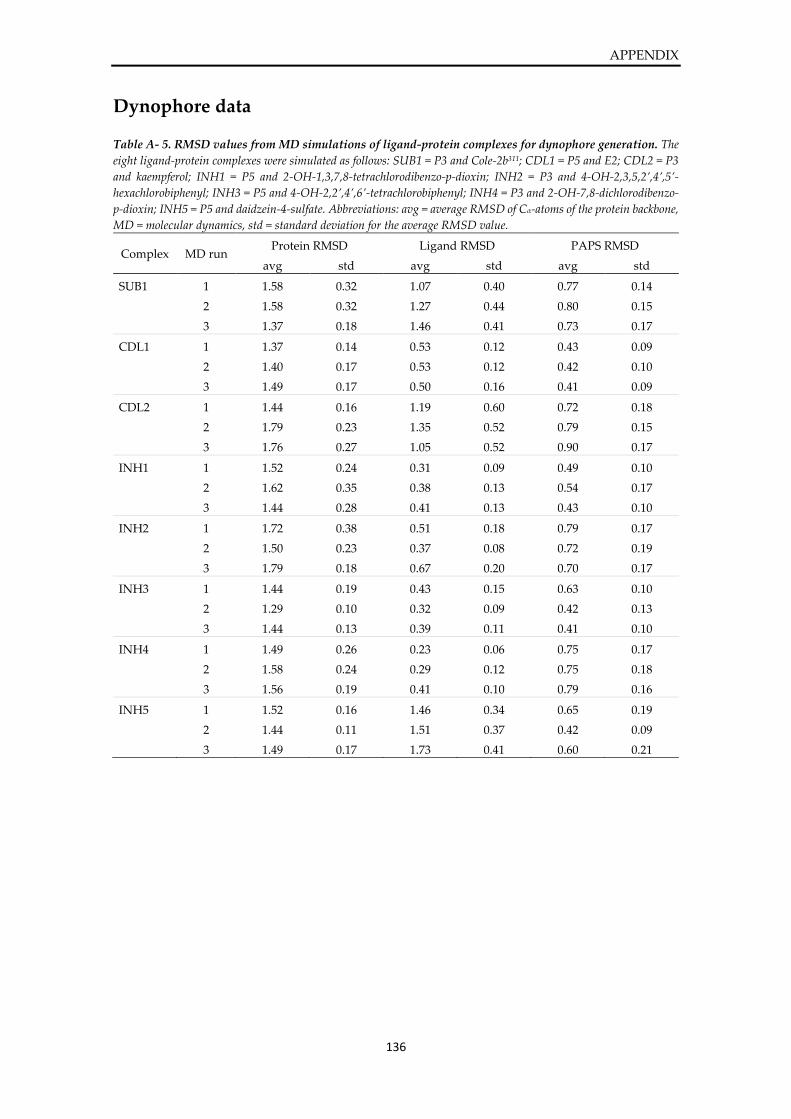
APPENDIX
136
Dynophore data Table A- 5. RMSD values from MD simulations of ligand-protein complexes for dynophore generation. The
eight ligand-protein complexes were simulated as follows: SUB1 = P3 and Cole-2b311; CDL1 = P5 and E2; CDL2 = P3
and kaempferol; INH1 = P5 and 2-OH-1,3,7,8-tetrachlorodibenzo-p-dioxin; INH2 = P3 and 4-OH-2,3,5,2’,4’,5’-
hexachlorobiphenyl; INH3 = P5 and 4-OH-2,2’,4’,6’-tetrachlorobiphenyl; INH4 = P3 and 2-OH-7,8-dichlorodibenzo-
p-dioxin; INH5 = P5 and daidzein-4-sulfate. Abbreviations: avg = average RMSD of Cα-atoms of the protein backbone,
MD = molecular dynamics, std = standard deviation for the average RMSD value.
Complex MD run Protein RMSD Ligand RMSD PAPS RMSD
avg std avg std avg std
SUB1 1 1.58 0.32 1.07 0.40 0.77 0.14
2 1.58 0.32 1.27 0.44 0.80 0.15
3 1.37 0.18 1.46 0.41 0.73 0.17
CDL1 1 1.37 0.14 0.53 0.12 0.43 0.09
2 1.40 0.17 0.53 0.12 0.42 0.10
3 1.49 0.17 0.50 0.16 0.41 0.09
CDL2 1 1.44 0.16 1.19 0.60 0.72 0.18
2 1.79 0.23 1.35 0.52 0.79 0.15
3 1.76 0.27 1.05 0.52 0.90 0.17
INH1 1 1.52 0.24 0.31 0.09 0.49 0.10
2 1.62 0.35 0.38 0.13 0.54 0.17
3 1.44 0.28 0.41 0.13 0.43 0.10
INH2 1 1.72 0.38 0.51 0.18 0.79 0.17
2 1.50 0.23 0.37 0.08 0.72 0.19
3 1.79 0.18 0.67 0.20 0.70 0.17
INH3 1 1.44 0.19 0.43 0.15 0.63 0.10
2 1.29 0.10 0.32 0.09 0.42 0.13
3 1.44 0.13 0.39 0.11 0.41 0.10
INH4 1 1.49 0.26 0.23 0.06 0.75 0.17
2 1.58 0.24 0.29 0.12 0.75 0.18
3 1.56 0.19 0.41 0.10 0.79 0.16
INH5 1 1.52 0.16 1.46 0.34 0.65 0.19
2 1.44 0.11 1.51 0.37 0.42 0.09
3 1.49 0.17 1.73 0.41 0.60 0.21
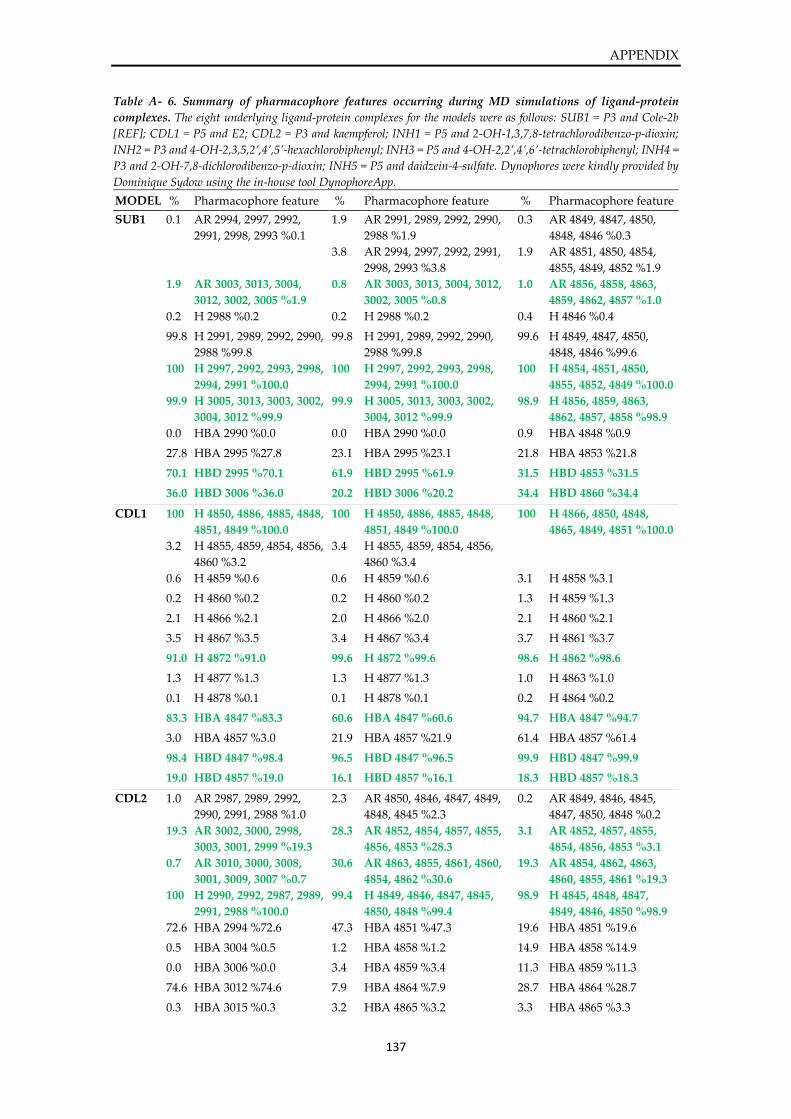
APPENDIX
137
Table A- 6. Summary of pharmacophore features occurring during MD simulations of ligand-protein
complexes. The eight underlying ligand-protein complexes for the models were as follows: SUB1 = P3 and Cole-2b
[REF]; CDL1 = P5 and E2; CDL2 = P3 and kaempferol; INH1 = P5 and 2-OH-1,3,7,8-tetrachlorodibenzo-p-dioxin;
INH2 = P3 and 4-OH-2,3,5,2’,4’,5’-hexachlorobiphenyl; INH3 = P5 and 4-OH-2,2’,4’,6’-tetrachlorobiphenyl; INH4 =
P3 and 2-OH-7,8-dichlorodibenzo-p-dioxin; INH5 = P5 and daidzein-4-sulfate. Dynophores were kindly provided by
Dominique Sydow using the in-house tool DynophoreApp.
MODEL % Pharmacophore feature % Pharmacophore feature % Pharmacophore feature
SUB1 0.1 AR 2994, 2997, 2992,
2991, 2998, 2993 %0.1
1.9 AR 2991, 2989, 2992, 2990,
2988 %1.9
0.3 AR 4849, 4847, 4850,
4848, 4846 %0.3
3.8 AR 2994, 2997, 2992, 2991,
2998, 2993 %3.8
1.9 AR 4851, 4850, 4854,
4855, 4849, 4852 %1.9
1.9 AR 3003, 3013, 3004,
3012, 3002, 3005 %1.9
0.8 AR 3003, 3013, 3004, 3012,
3002, 3005 %0.8
1.0 AR 4856, 4858, 4863,
4859, 4862, 4857 %1.0
0.2 H 2988 %0.2 0.2 H 2988 %0.2 0.4 H 4846 %0.4
99.8 H 2991, 2989, 2992, 2990,
2988 %99.8
99.8 H 2991, 2989, 2992, 2990,
2988 %99.8
99.6 H 4849, 4847, 4850,
4848, 4846 %99.6
100 H 2997, 2992, 2993, 2998,
2994, 2991 %100.0
100 H 2997, 2992, 2993, 2998,
2994, 2991 %100.0
100 H 4854, 4851, 4850,
4855, 4852, 4849 %100.0
99.9 H 3005, 3013, 3003, 3002,
3004, 3012 %99.9
99.9 H 3005, 3013, 3003, 3002,
3004, 3012 %99.9
98.9 H 4856, 4859, 4863,
4862, 4857, 4858 %98.9
0.0 HBA 2990 %0.0 0.0 HBA 2990 %0.0 0.9 HBA 4848 %0.9
27.8 HBA 2995 %27.8 23.1 HBA 2995 %23.1 21.8 HBA 4853 %21.8
70.1 HBD 2995 %70.1 61.9 HBD 2995 %61.9 31.5 HBD 4853 %31.5
36.0 HBD 3006 %36.0 20.2 HBD 3006 %20.2 34.4 HBD 4860 %34.4
CDL1 100 H 4850, 4886, 4885, 4848,
4851, 4849 %100.0
100 H 4850, 4886, 4885, 4848,
4851, 4849 %100.0
100 H 4866, 4850, 4848,
4865, 4849, 4851 %100.0
3.2 H 4855, 4859, 4854, 4856,
4860 %3.2
3.4 H 4855, 4859, 4854, 4856,
4860 %3.4
0.6 H 4859 %0.6 0.6 H 4859 %0.6 3.1 H 4858 %3.1
0.2 H 4860 %0.2 0.2 H 4860 %0.2 1.3 H 4859 %1.3
2.1 H 4866 %2.1 2.0 H 4866 %2.0 2.1 H 4860 %2.1
3.5 H 4867 %3.5 3.4 H 4867 %3.4 3.7 H 4861 %3.7
91.0 H 4872 %91.0 99.6 H 4872 %99.6 98.6 H 4862 %98.6
1.3 H 4877 %1.3 1.3 H 4877 %1.3 1.0 H 4863 %1.0
0.1 H 4878 %0.1 0.1 H 4878 %0.1 0.2 H 4864 %0.2
83.3 HBA 4847 %83.3 60.6 HBA 4847 %60.6 94.7 HBA 4847 %94.7
3.0 HBA 4857 %3.0 21.9 HBA 4857 %21.9 61.4 HBA 4857 %61.4
98.4 HBD 4847 %98.4 96.5 HBD 4847 %96.5 99.9 HBD 4847 %99.9
19.0 HBD 4857 %19.0 16.1 HBD 4857 %16.1 18.3 HBD 4857 %18.3
CDL2 1.0 AR 2987, 2989, 2992,
2990, 2991, 2988 %1.0
2.3 AR 4850, 4846, 4847, 4849,
4848, 4845 %2.3
0.2 AR 4849, 4846, 4845,
4847, 4850, 4848 %0.2
19.3 AR 3002, 3000, 2998,
3003, 3001, 2999 %19.3
28.3 AR 4852, 4854, 4857, 4855,
4856, 4853 %28.3
3.1 AR 4852, 4857, 4855,
4854, 4856, 4853 %3.1
0.7 AR 3010, 3000, 3008,
3001, 3009, 3007 %0.7
30.6 AR 4863, 4855, 4861, 4860,
4854, 4862 %30.6
19.3 AR 4854, 4862, 4863,
4860, 4855, 4861 %19.3
100 H 2990, 2992, 2987, 2989,
2991, 2988 %100.0
99.4 H 4849, 4846, 4847, 4845,
4850, 4848 %99.4
98.9 H 4845, 4848, 4847,
4849, 4846, 4850 %98.9
72.6 HBA 2994 %72.6 47.3 HBA 4851 %47.3 19.6 HBA 4851 %19.6
0.5 HBA 3004 %0.5 1.2 HBA 4858 %1.2 14.9 HBA 4858 %14.9
0.0 HBA 3006 %0.0 3.4 HBA 4859 %3.4 11.3 HBA 4859 %11.3
74.6 HBA 3012 %74.6 7.9 HBA 4864 %7.9 28.7 HBA 4864 %28.7
0.3 HBA 3015 %0.3 3.2 HBA 4865 %3.2 3.3 HBA 4865 %3.3
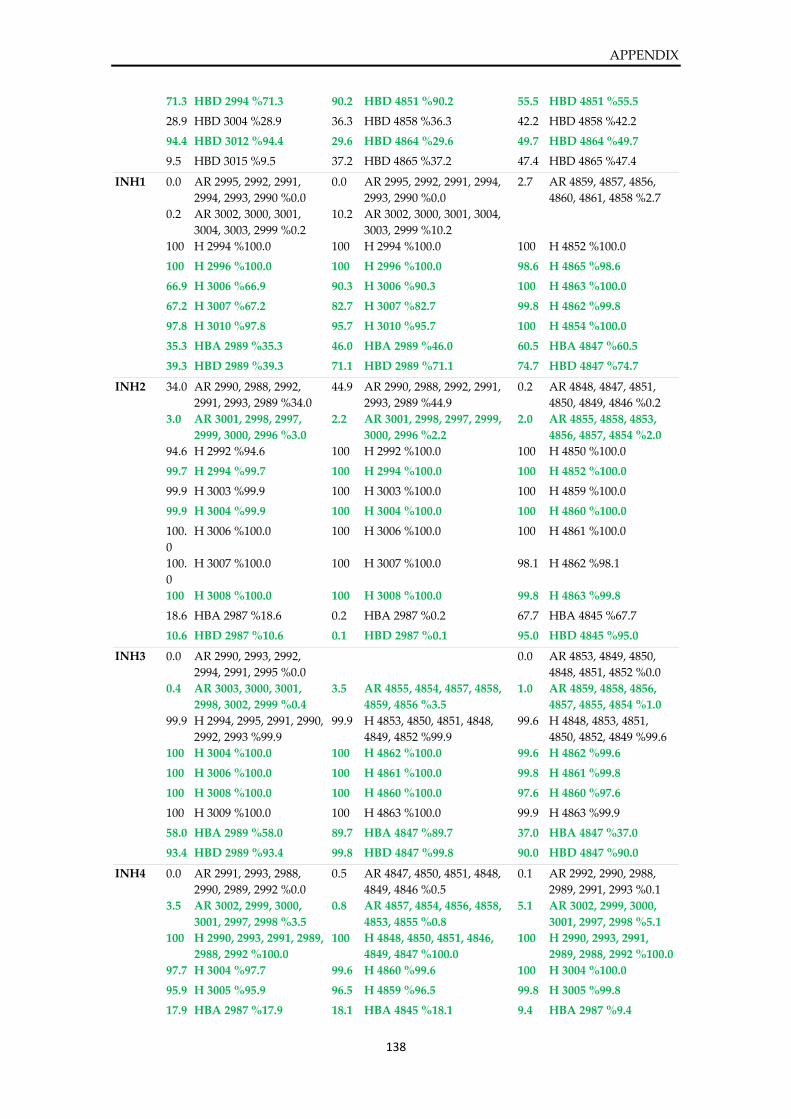
APPENDIX
138
71.3 HBD 2994 %71.3 90.2 HBD 4851 %90.2 55.5 HBD 4851 %55.5
28.9 HBD 3004 %28.9 36.3 HBD 4858 %36.3 42.2 HBD 4858 %42.2
94.4 HBD 3012 %94.4 29.6 HBD 4864 %29.6 49.7 HBD 4864 %49.7
9.5 HBD 3015 %9.5 37.2 HBD 4865 %37.2 47.4 HBD 4865 %47.4
INH1 0.0 AR 2995, 2992, 2991,
2994, 2993, 2990 %0.0
0.0 AR 2995, 2992, 2991, 2994,
2993, 2990 %0.0
2.7 AR 4859, 4857, 4856,
4860, 4861, 4858 %2.7
0.2 AR 3002, 3000, 3001,
3004, 3003, 2999 %0.2
10.2 AR 3002, 3000, 3001, 3004,
3003, 2999 %10.2
100 H 2994 %100.0 100 H 2994 %100.0 100 H 4852 %100.0
100 H 2996 %100.0 100 H 2996 %100.0 98.6 H 4865 %98.6
66.9 H 3006 %66.9 90.3 H 3006 %90.3 100 H 4863 %100.0
67.2 H 3007 %67.2 82.7 H 3007 %82.7 99.8 H 4862 %99.8
97.8 H 3010 %97.8 95.7 H 3010 %95.7 100 H 4854 %100.0
35.3 HBA 2989 %35.3 46.0 HBA 2989 %46.0 60.5 HBA 4847 %60.5
39.3 HBD 2989 %39.3 71.1 HBD 2989 %71.1 74.7 HBD 4847 %74.7
INH2 34.0 AR 2990, 2988, 2992,
2991, 2993, 2989 %34.0
44.9 AR 2990, 2988, 2992, 2991,
2993, 2989 %44.9
0.2 AR 4848, 4847, 4851,
4850, 4849, 4846 %0.2
3.0 AR 3001, 2998, 2997,
2999, 3000, 2996 %3.0
2.2 AR 3001, 2998, 2997, 2999,
3000, 2996 %2.2
2.0 AR 4855, 4858, 4853,
4856, 4857, 4854 %2.0
94.6 H 2992 %94.6 100 H 2992 %100.0 100 H 4850 %100.0
99.7 H 2994 %99.7 100 H 2994 %100.0 100 H 4852 %100.0
99.9 H 3003 %99.9 100 H 3003 %100.0 100 H 4859 %100.0
99.9 H 3004 %99.9 100 H 3004 %100.0 100 H 4860 %100.0
100.
0
H 3006 %100.0 100 H 3006 %100.0 100 H 4861 %100.0
100.
0
H 3007 %100.0 100 H 3007 %100.0 98.1 H 4862 %98.1
100 H 3008 %100.0 100 H 3008 %100.0 99.8 H 4863 %99.8
18.6 HBA 2987 %18.6 0.2 HBA 2987 %0.2 67.7 HBA 4845 %67.7
10.6 HBD 2987 %10.6 0.1 HBD 2987 %0.1 95.0 HBD 4845 %95.0
INH3 0.0 AR 2990, 2993, 2992,
2994, 2991, 2995 %0.0
0.0 AR 4853, 4849, 4850,
4848, 4851, 4852 %0.0
0.4 AR 3003, 3000, 3001,
2998, 3002, 2999 %0.4
3.5 AR 4855, 4854, 4857, 4858,
4859, 4856 %3.5
1.0 AR 4859, 4858, 4856,
4857, 4855, 4854 %1.0
99.9 H 2994, 2995, 2991, 2990,
2992, 2993 %99.9
99.9 H 4853, 4850, 4851, 4848,
4849, 4852 %99.9
99.6 H 4848, 4853, 4851,
4850, 4852, 4849 %99.6
100 H 3004 %100.0 100 H 4862 %100.0 99.6 H 4862 %99.6
100 H 3006 %100.0 100 H 4861 %100.0 99.8 H 4861 %99.8
100 H 3008 %100.0 100 H 4860 %100.0 97.6 H 4860 %97.6
100 H 3009 %100.0 100 H 4863 %100.0 99.9 H 4863 %99.9
58.0 HBA 2989 %58.0 89.7 HBA 4847 %89.7 37.0 HBA 4847 %37.0
93.4 HBD 2989 %93.4 99.8 HBD 4847 %99.8 90.0 HBD 4847 %90.0
INH4 0.0 AR 2991, 2993, 2988,
2990, 2989, 2992 %0.0
0.5 AR 4847, 4850, 4851, 4848,
4849, 4846 %0.5
0.1 AR 2992, 2990, 2988,
2989, 2991, 2993 %0.1
3.5 AR 3002, 2999, 3000,
3001, 2997, 2998 %3.5
0.8 AR 4857, 4854, 4856, 4858,
4853, 4855 %0.8
5.1 AR 3002, 2999, 3000,
3001, 2997, 2998 %5.1
100 H 2990, 2993, 2991, 2989,
2988, 2992 %100.0
100 H 4848, 4850, 4851, 4846,
4849, 4847 %100.0
100 H 2990, 2993, 2991,
2989, 2988, 2992 %100.0
97.7 H 3004 %97.7 99.6 H 4860 %99.6 100 H 3004 %100.0
95.9 H 3005 %95.9 96.5 H 4859 %96.5 99.8 H 3005 %99.8
17.9 HBA 2987 %17.9 18.1 HBA 4845 %18.1 9.4 HBA 2987 %9.4
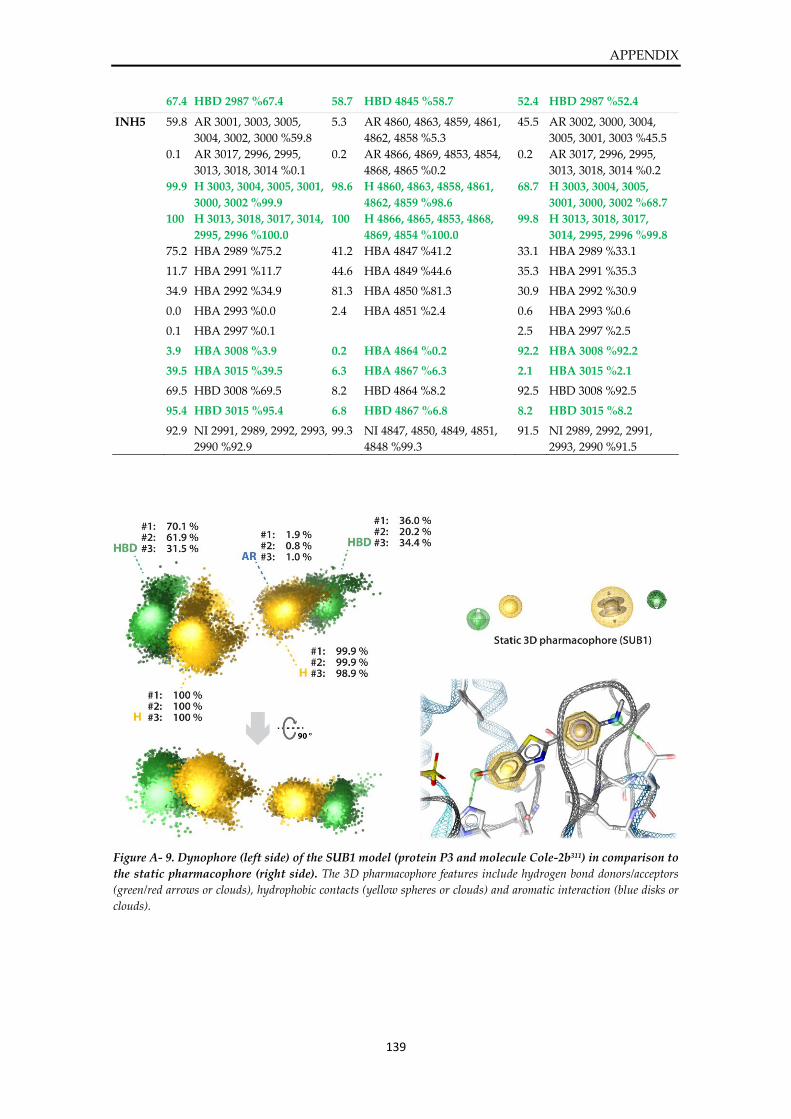
APPENDIX
139
67.4 HBD 2987 %67.4 58.7 HBD 4845 %58.7 52.4 HBD 2987 %52.4
INH5 59.8 AR 3001, 3003, 3005,
3004, 3002, 3000 %59.8
5.3 AR 4860, 4863, 4859, 4861,
4862, 4858 %5.3
45.5 AR 3002, 3000, 3004,
3005, 3001, 3003 %45.5
0.1 AR 3017, 2996, 2995,
3013, 3018, 3014 %0.1
0.2 AR 4866, 4869, 4853, 4854,
4868, 4865 %0.2
0.2 AR 3017, 2996, 2995,
3013, 3018, 3014 %0.2
99.9 H 3003, 3004, 3005, 3001,
3000, 3002 %99.9
98.6 H 4860, 4863, 4858, 4861,
4862, 4859 %98.6
68.7 H 3003, 3004, 3005,
3001, 3000, 3002 %68.7
100 H 3013, 3018, 3017, 3014,
2995, 2996 %100.0
100 H 4866, 4865, 4853, 4868,
4869, 4854 %100.0
99.8 H 3013, 3018, 3017,
3014, 2995, 2996 %99.8
75.2 HBA 2989 %75.2 41.2 HBA 4847 %41.2 33.1 HBA 2989 %33.1
11.7 HBA 2991 %11.7 44.6 HBA 4849 %44.6 35.3 HBA 2991 %35.3
34.9 HBA 2992 %34.9 81.3 HBA 4850 %81.3 30.9 HBA 2992 %30.9
0.0 HBA 2993 %0.0 2.4 HBA 4851 %2.4 0.6 HBA 2993 %0.6
0.1 HBA 2997 %0.1 2.5 HBA 2997 %2.5
3.9 HBA 3008 %3.9 0.2 HBA 4864 %0.2 92.2 HBA 3008 %92.2
39.5 HBA 3015 %39.5 6.3 HBA 4867 %6.3 2.1 HBA 3015 %2.1
69.5 HBD 3008 %69.5 8.2 HBD 4864 %8.2 92.5 HBD 3008 %92.5
95.4 HBD 3015 %95.4 6.8 HBD 4867 %6.8 8.2 HBD 3015 %8.2
92.9 NI 2991, 2989, 2992, 2993,
2990 %92.9
99.3 NI 4847, 4850, 4849, 4851,
4848 %99.3
91.5 NI 2989, 2992, 2991,
2993, 2990 %91.5
Figure A- 9. Dynophore (left side) of the SUB1 model (protein P3 and molecule Cole-2b311) in comparison to
the static pharmacophore (right side). The 3D pharmacophore features include hydrogen bond donors/acceptors
(green/red arrows or clouds), hydrophobic contacts (yellow spheres or clouds) and aromatic interaction (blue disks or
clouds).
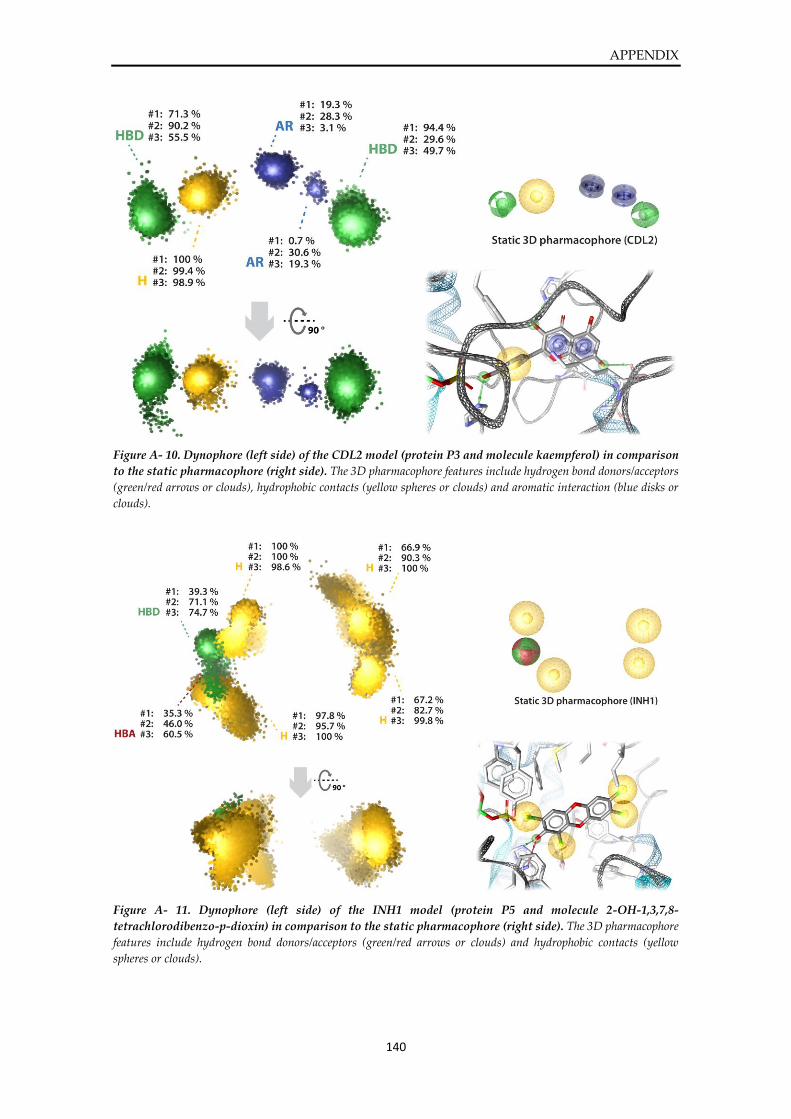
APPENDIX
140
Figure A- 10. Dynophore (left side) of the CDL2 model (protein P3 and molecule kaempferol) in comparison
to the static pharmacophore (right side). The 3D pharmacophore features include hydrogen bond donors/acceptors
(green/red arrows or clouds), hydrophobic contacts (yellow spheres or clouds) and aromatic interaction (blue disks or
clouds).
Figure A- 11. Dynophore (left side) of the INH1 model (protein P5 and molecule 2-OH-1,3,7,8-
tetrachlorodibenzo-p-dioxin) in comparison to the static pharmacophore (right side). The 3D pharmacophore
features include hydrogen bond donors/acceptors (green/red arrows or clouds) and hydrophobic contacts (yellow
spheres or clouds).
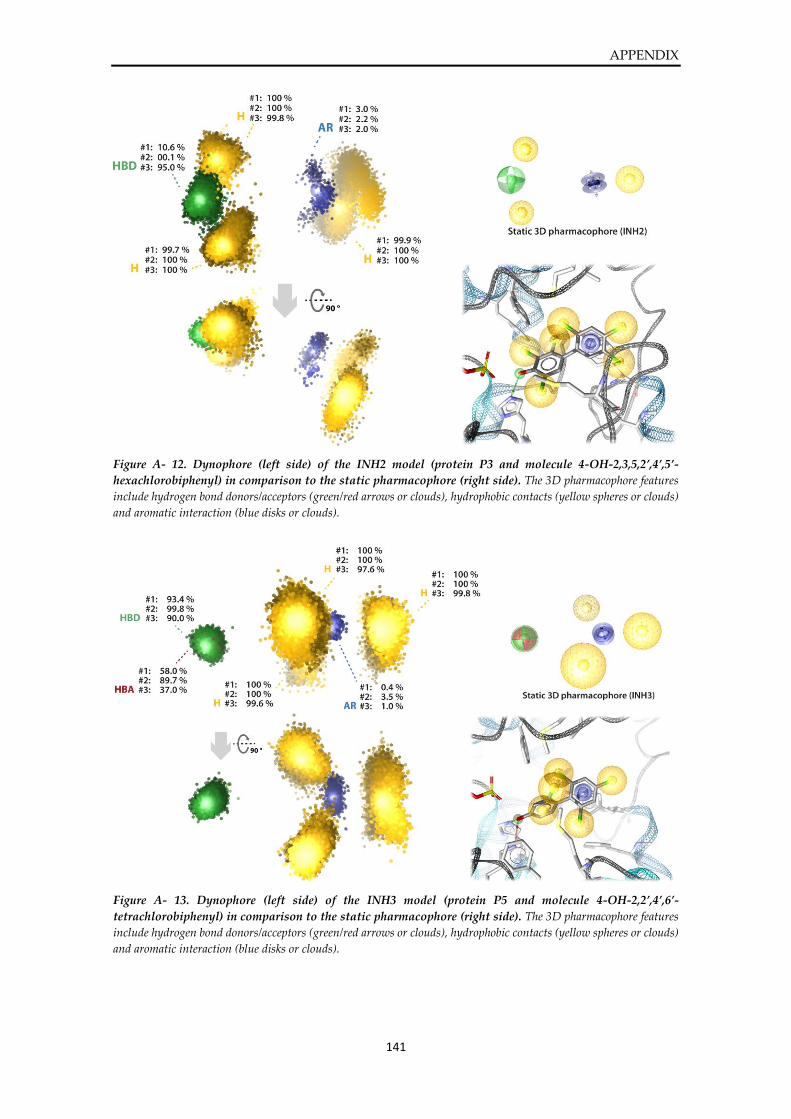
APPENDIX
141
Figure A- 12. Dynophore (left side) of the INH2 model (protein P3 and molecule 4-OH-2,3,5,2’,4’,5’-
hexachlorobiphenyl) in comparison to the static pharmacophore (right side). The 3D pharmacophore features
include hydrogen bond donors/acceptors (green/red arrows or clouds), hydrophobic contacts (yellow spheres or clouds)
and aromatic interaction (blue disks or clouds).
Figure A- 13. Dynophore (left side) of the INH3 model (protein P5 and molecule 4-OH-2,2’,4’,6’-
tetrachlorobiphenyl) in comparison to the static pharmacophore (right side). The 3D pharmacophore features
include hydrogen bond donors/acceptors (green/red arrows or clouds), hydrophobic contacts (yellow spheres or clouds)
and aromatic interaction (blue disks or clouds).
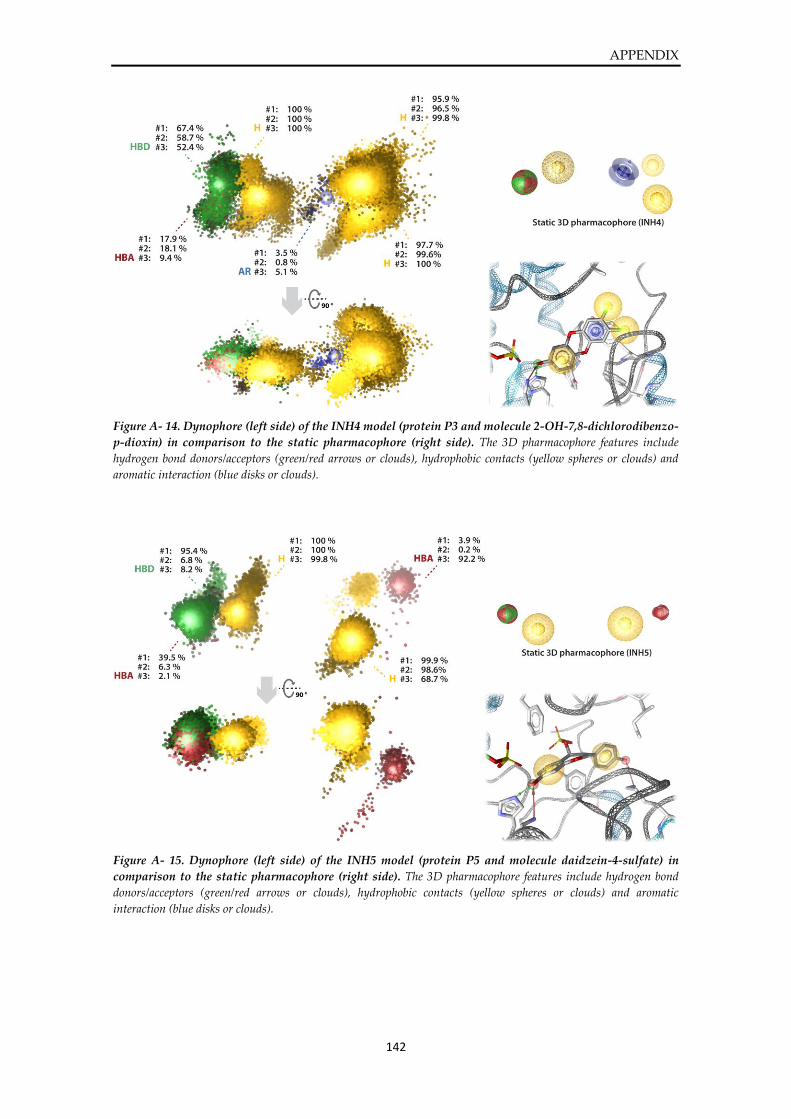
APPENDIX
142
Figure A- 14. Dynophore (left side) of the INH4 model (protein P3 and molecule 2-OH-7,8-dichlorodibenzo-
p-dioxin) in comparison to the static pharmacophore (right side). The 3D pharmacophore features include
hydrogen bond donors/acceptors (green/red arrows or clouds), hydrophobic contacts (yellow spheres or clouds) and
aromatic interaction (blue disks or clouds).
Figure A- 15. Dynophore (left side) of the INH5 model (protein P5 and molecule daidzein-4-sulfate) in
comparison to the static pharmacophore (right side). The 3D pharmacophore features include hydrogen bond
donors/acceptors (green/red arrows or clouds), hydrophobic contacts (yellow spheres or clouds) and aromatic
interaction (blue disks or clouds).
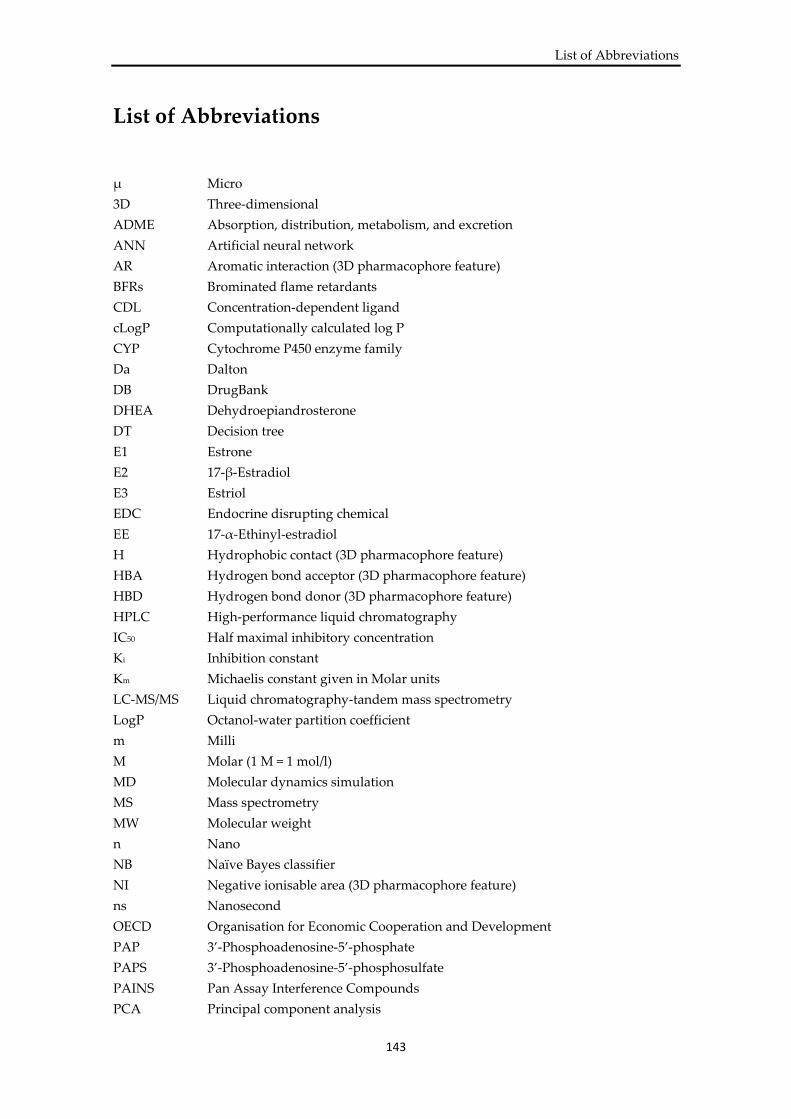
List of Abbreviations
143
List of Abbreviations
µ Micro
3D Three-dimensional
ADME Absorption, distribution, metabolism, and excretion
ANN Artificial neural network
AR Aromatic interaction (3D pharmacophore feature)
BFRs Brominated flame retardants
CDL Concentration-dependent ligand
cLogP Computationally calculated log P
CYP Cytochrome P450 enzyme family
Da Dalton
DB DrugBank
DHEA Dehydroepiandrosterone
DT Decision tree
E1 Estrone
E2 17-β-Estradiol
E3 Estriol
EDC Endocrine disrupting chemical
EE 17-α-Ethinyl-estradiol
H Hydrophobic contact (3D pharmacophore feature)
HBA Hydrogen bond acceptor (3D pharmacophore feature)
HBD Hydrogen bond donor (3D pharmacophore feature)
HPLC High-performance liquid chromatography
IC50 Half maximal inhibitory concentration
Ki Inhibition constant
Km Michaelis constant given in Molar units
LC-MS/MS Liquid chromatography-tandem mass spectrometry
LogP Octanol-water partition coefficient
m Milli
M Molar (1 M = 1 mol/l)
MD Molecular dynamics simulation
MS Mass spectrometry
MW Molecular weight
n Nano
NB Naïve Bayes classifier
NI Negative ionisable area (3D pharmacophore feature)
ns Nanosecond
OECD Organisation for Economic Cooperation and Development
PAP 3’-Phosphoadenosine-5’-phosphate
PAPS 3’-Phosphoadenosine-5’-phosphosulfate
PAINS Pan Assay Interference Compounds
PCA Principal component analysis
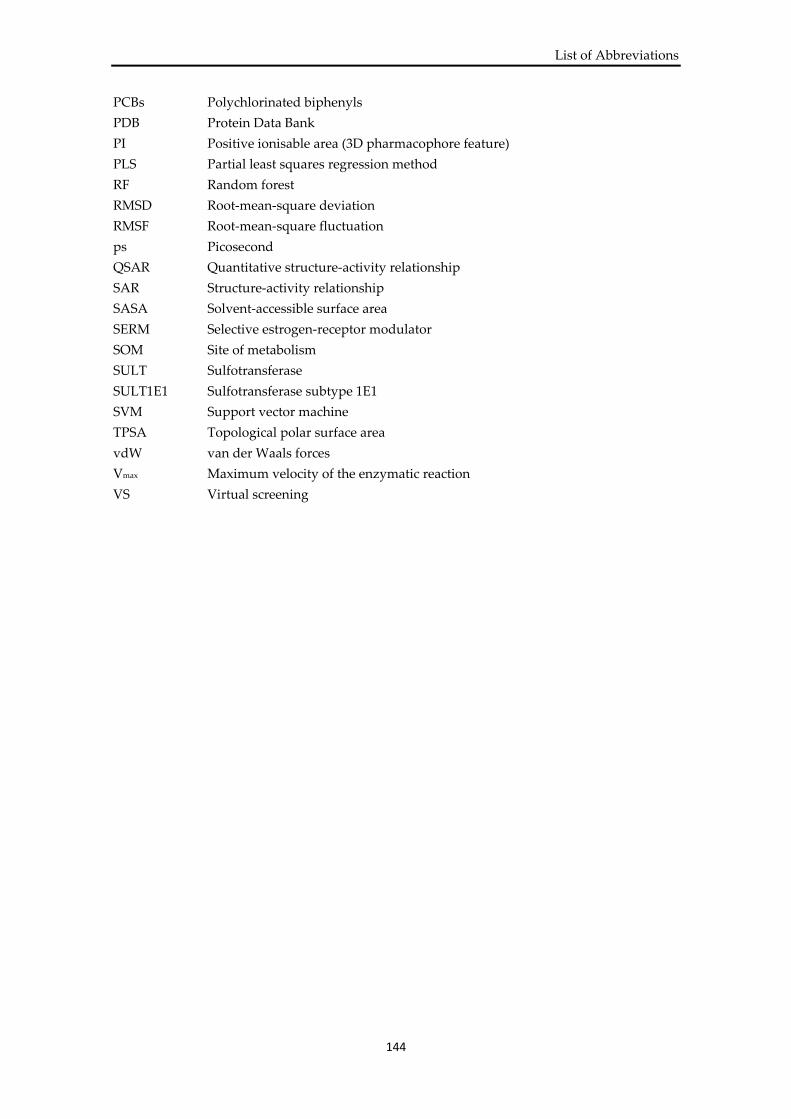
List of Abbreviations
144
PCBs Polychlorinated biphenyls
PDB Protein Data Bank
PI Positive ionisable area (3D pharmacophore feature)
PLS Partial least squares regression method
RF Random forest
RMSD Root-mean-square deviation
RMSF Root-mean-square fluctuation
ps Picosecond
QSAR Quantitative structure-activity relationship
SAR Structure-activity relationship
SASA Solvent-accessible surface area
SERM Selective estrogen-receptor modulator
SOM Site of metabolism
SULT Sulfotransferase
SULT1E1 Sulfotransferase subtype 1E1
SVM Support vector machine
TPSA Topological polar surface area
vdW van der Waals forces
Vmax Maximum velocity of the enzymatic reaction
VS Virtual screening
List of Figures
145
List of Figures
Figure 1. Overview on different prediction endpoints and the three pillars of science supporting metabolism
studies. Abbreviations: LC-MS = liquid chromatography-mass spectrometry, MD = molecular dynamics, MIFs
= molecular interaction fields, NMR = nuclear magnetic resonance, QM/MM = quantum mechanics/ molecular
mechanics, QSAR = quantitative structure-activity relationship, SOM = site of metabolism. ............................ 7
Figure 2. Clustering of SULT subtypes based on sequence similarities of the complete amino acid sequences
(left) and the local sequences of the substrate binding sites (right). (Picture adapted from Allali-Hassani
et al.85, originally published in PLoS Biology).................................................................................................... 13
Figure 3. Structure of the SULT1E1 monomer of PDB entry 1HY393 (chain B). The three loops that surround the
substrate binding site of SULTs are highlighted as red protein backbones while the part of loop 3 that spans the
cofactor-binding site is highlighted in cyan. The cofactor PAPS (3’-phosphoadenosine-5’-phosphosulfate) and
catalytically-important amino acids Lys105 and His107 are depicted as ball-and-stick-models. Abbreviations: L
= ligand, PAP = 3’-phosphoadenosine-5’-phosphate........................................................................................... 14
Figure 4. Catalytic cycle of sulfotransferases. Potentially occurring dead-end complexes include E·PAPS·L-S and
E·PAP·L. Abbreviations: E = enzyme, L = ligand, L-S = sulfonated ligand, PAP = 3’-phosphoadenosine-5’-
phosphate, PAPS = 3’-phosphoadenosine-5’-phosphosulfate. The figure was adapted from Tibbs et al. originally
published in the Journal Drug Metabolism and Pharmacokinetics90. ................................................................. 15
Figure 5. Metabolic reactions catalysed by SULT1E1 and examples of molecules that are transformed by the
enzyme. Abbreviations: EDCs = endocrine disrupting compounds, SULT = sulfotransferases. ....................... 17
Figure 6. Depiction of the four co-crystallised ligands in the active site of SULT1E1 after superimposition
of the five crystal structures of SULT1E1. The preserved water molecule, which was found in all four
structures complexed with PAP, is highlighted as a red sphere. The PAPS molecule from PDB entry 1HY3 is
depicted as black lines and PAP from the other four PDB structures as grey ball-and-stick model. The co-
crystallised ligands are 3,5,3’,5’-tetrachlorobiphenyl-4,4’-diol (TCB) (yellow), estradiol (blue), 3,3’,5,5’-
tetrabromo bisphenol A (red), and 3-OH-2,2’,4,4’-tetrabromo-diphenyl ether (turquoise). ............................... 37
Figure 7. Structural features of SULT1E1. View on the active site of SULT1E1 with bound cofactor PAPS and
amino acid residues Lys105 and His107 which play a key role in the sulfonation reaction (ball-and-stick
representations). The three loops that surround the active site are highlighted in dark red and the colour scale
from blue to yellow indicates areas of polarity and hydrophobicity, respectively. .............................................. 38
Figure 8. Aligned SULT1E1 crystal structures (1G3M298, 1HY393, 4JVL299, 4JVM299, 4JVN299). All available crystal
structures of SULT1E1 were aligned. Differences in the protein backbones are given as RMSD plot with amino
acid numbering on the abscissa (averaged values for Cα-atoms over all five structures, values in Å). The distances
between the three loops were determined (given in Å). Points of measurement are indicated as balls in the image
detail on the right. Protein backbones of 1HY3 chain A and B are highlighted in dark grey and yellow,
respectively. ........................................................................................................................................................ 39
Figure 9. Superimposition of the structures of SULT subtypes 1A1, 1E1, and 2A1 and their 3- and 2-
dimensional similarities as RMSD (grey matrix) and sequence similarity matrices (coloured matrix).
The structures of SULT1A1 (PDBID 2D06301, yellow backbone), SULT1E1 (PDBID 1HY393, grey backbone),
and SULT2A1 (PDBID 3F3Y [to be published], blue backbone) were aligned to illustrate the differences of loop
structures between the three different SULT subtypes. Grey matrix: RMSD plot for Cα-atoms of the three SULT
subtypes. Values given in Å. Coloured matrix: Pairwise sequence similarity matrix for all three subtypes. Values
were calculated by taking the number of positive matches between sequences i and j, divided by the length of
sequence j. (Positive residue substitutions are defined by the condition BLOSUM62 substitution score > 0273)
............................................................................................................................................................................ 40
Figure 10. In silico workflow for the development of a prediction model for SULT1E1. ................................ 41
Figure 11. Snapshots from MD simulations of the apo (left) and cofactor-bound (right) structure of SULT1E1
(PDB ID 1HY393). Upper part: View inside the active site of the enzyme. Loops 1 to 3 are highlighted in blue-
green colour scale that indicates the progress of time (total simulation time: 100 ns). The range of loop flexibility
List of Figures
146
is given in Å and was measured based on Cα-atom distances on loop residues 85 to 89 (loop 1), 144 to 149 (loop
2), and 239 to 254 (loop 3). Lower part: Focus on the cofactor-binding sites and their loop fluctuations in absence
and presence of cofactor PAPS. The cofactor is given as ball-and-stick representation. Abbreviations: fluct. =
fluctuations. ....................................................................................................................................................... 44
Figure 12. Depiction of amino acid residue movement of Lys85 observed during MD simulations of SULT1E1
in comparison to its PDB template (1HY393). The movement of amino acid Lys85 is described in reference to
the sulphur atom of PAPS and residue His107, and given as RMSD plot and distance range in Δ Å. Cofactor
PAPS is represented as ball-and-stick model. The PDB template is highlighted in cyan. .................................. 45
Figure 13. Superimposition of enzyme conformations that were extracted from MD simulations in
comparison to the PDB template. The three loops that encircle the active site of SULT1E1 are highlighted in
red (apo structures on the left) and cyan (cofactor-bound structures on the right). The backbone of PDB template
1HY393 is shown in yellow and cofactor PAPS is represented as ball-and-stick model. Conformational differences
between the five apo or cofactor-bound structures and the PDB are given as RMSD plots. .............................. 47
Figure 14. PCA plots for the dataset of active inhibitors of SULT1E1. Specific molecule clusters are indicated as
green, cyan, blue, and red dots for flavonoids (#17), dibenzofurans (#8), biphenyls (#33), and dibenzo-p-dioxins
(#3), respectively. Black dots indicate molecules which are structurally different from the four mentioned
molecule clusters. The asterisk (*) indicates molecules from a publication by Kehoe et al.306. ............................ 48
Figure 15. PCA plots for the dataset of active substrates of SULT1E1. Molecule clusters are indicated by green,
cyan, and blue dots representing molecules with chemical scaffolds of arylbenzothiazoles (#14), phenols (#8), and
steroids (#12), respectively. Black dots indicate molecules that are structurally different from the three mentioned
molecule clusters. ............................................................................................................................................... 49
Figure 16. Visualization of the ensemble docking setup and results. Upper part: Visualization of the number of
docking events for each protein-ligand combination. The colour scale from dark-blue to white indicates the
number of docking events (max. number = 100) that was observed for every protein (five apo and five cofactor-
conformations) and ligand (inhibitor, substrate, or CDL) combination. Lower part: Heat maps indicating the
occurrence frequency of 3D pharmacophore features for each ligand-protein combination. The maximum number
of 3D pharmacophore features (including hydrogen bonds, hydrophobic contacts, aromatic areas, or ionic
interactions) that was observed equalled ten. The colour scale from dark-blue to white indicates the number of
docking events in which the number of features was observed (max. number of events = 100). ......................... 50
Figure 17. Depiction of the active sites of cofactor-bound conformations P1 to P5. The colour scale is based on
atom types with red, blue, yellow, and grey indicating oxygen, nitrogen, sulphur, and carbon atoms, respectively.
Black arrows indicate spatial restrictions found in the active site conformations. Cofactor PAPS is depicted as
stick-model. On the right side, an example of ligand-complexes is shown for the ligand kaempferol. From a total
of one hundred docking runs, the ligand was docked 24 % into P1, 1 % into P2, 74 % into P3, 0 % into P4 and
1 % into P5. PAPS and the two catalytically important amino acids Lys105 and His107 are represented as ball-
and-stick models. The arrows indicate steric restrictions on ligand binding. ..................................................... 51
Figure 18. Comparison of amino acid residue Lys85 in cofactor-bound conformations P1 to P5 in
comparison to the PDB template. The cofactor PAPS is depicted as stick-model. ........................................ 53
Figure 19. Statistical visualization indicating the maximum number of observed 3D pharmacophore
features per ligand-protein complex. The colour scale from dark-blue to green shows the maximum number
of pharmacophore features (including hydrogen bonds, hydrophobic contacts, aromatic areas, or ionic
interactions) that was observed in a ligand-protein complex (maximum occurrence = 100 times). ................... 54
Figure 20. Depiction of the crystal structures of SULT1E1 with their co-crystallised ligands and associated
3D pharmacophores. A: PDB entry 1G3M298 with ligand 3,5,3’,5’-tetrachlorobiphenyl-4,4’-diol; B: PDB entry
4JVL299 with ligand 17-β-estradiol; C: PDB entry 4JVM299 with ligand 4,4’-propane-2,2-diylbis(2,6-
bibromophenol); D: PDB entry 4JVN299 with ligand 2,6-dibromo-3-(2,4-dibromophenoxy)phenol. For reasons of
clarity, not all amino acid residues that are involved in 3D pharmacophore feature formation are depicted. .... 56
Figure 21. Depiction of the final eight 3D pharmacophores and their associated docking conformations. The
illustrated docking complexes comprise a substrate (1), two CDLs (2, 3), and five inhibitors (4 – 8). The image
details show the eight pharmacophores without exclusion volumes for reasons of clarity. The 3D pharmacophore
features include hydrogen bond donors/ acceptors (arrows or spheres in green/ red), hydrophobic contacts (yellow
spheres), and aromatic areas (blue disks). Ligands: 1 = 2-(4-dimethylaminophenyl)-1,3-benzothiazol-6-ol; 2 = 17-
List of Figures
147
β-estradiol; 3 = kaempferol; 4 = 2-OH-1,3,7,8-tetrachlorodibenzo-p-dioxin; 5 = 4-OH-2,3,5,2’,4’,5’-
hexachlorobiphenyl; 6 = 4-OH-2,2’,4’,6’-tetrachlorobiphenyl; 7 = 2-OH-7,8-dichlorodibenzo-p-dioxin; 8 =
daidzein-4-sulfate. .............................................................................................................................................. 58
Figure 22. Depiction of the dynophore generated from a MD simulation of E2 bound to SULT1E1 in
comparison to the static 3D pharmacophore CDL1. For reasons of clarity, the dynophore, which is
illustrated on the left side from two different angles, shows only the interaction features relevant for the static
3D pharmacophore CDL1. Percentages indicate the time-dependent occurrences of superfeatures found in the
three MD simulations #1, #2, and #3. The static 3D pharmacophore CDL1 (upper right) was created on the basis
of docked E2 in the active site of the enzyme. The 3D pharmacophore features include hydrogen bond
donors/acceptors (green/red arrows or clouds) and hydrophobic contacts (yellow spheres or clouds).
Abbreviations: H = hydrophobic contact, HBA/D = hydrogen bond acceptor/donor. ......................................... 60
Figure 23. Illustration of the final model for in silico prediction of SULT1E1 ligands. The process of prediction
starts with screening a given database with the eight 3D pharmacophores. According to their classification into
substrates, inhibitors, or CDLs, the hits are subsequently submitted to a specific molecule filter (OH- or hydroxyl-
group filter) and the SVM classification models (SVM-S and –I). ..................................................................... 66
Figure 24. Compounds from virtual screening of the DrugBank selected for experimental evaluation. The
compounds 1 to 4 are predicted CDLs, compounds 5 and 6 predicted inhibitors and compounds 7 to 9 predicted
substrates of SULT1E1. The ligands are 1 isoliquiritigenin (DB03285), 2 indazole-Cl (DB07708), 3 prinaberel
(DB06832), 4 ZM241385 (DB08770), 5 Amb1890033 (DB06950), 6 Amb1899186 (DB06978), 7 2-(4-
hydroxyphenylazo)-benzoic acid (DB07880), 8 Amb4444666 (DB08252), and 9 17-Epiestriol (DB07702). .... 69
Figure 25. Dose-response curves indicating IC50 values for all experimentally tested compounds. Data were
derived in triplicate experiments (with the exception of the data points retrieved for zero activity of compounds
1 to 6). Coloured curves indicate the ligand types of substrates (green), inhibitors (orange), and CDLs (blue). 73
Figure 26. Product ion mass spectra of sulfonated metabolites of isoliquiritigenin (1), indazole-Cl (2),
prinaberel (3), ZM241385 (4), 2-(4-hydroxyphenylazo)-benzoid acid (7), Amb444666 (8), and 17-
epiestriol (9). Deprotonated precursor ions ([M-H]-) are indicated by black rhombi. For each sulfonated
metabolite, the predicted structure is given as inset in the corresponding spectrum. Two further metabolites were
predicted for compounds 1 and 2, which are indicated with an asterisk. ............................................................ 75
Figure 27. Ensemble docking results of the nine experimentally tested compounds. The nine compounds of
CDLs (blue numbering), inhibitors (orange numbering), and substrates (green numbering) were each docked
100 times each into the protein conformations extracted from MD simulations (P1 to P5) and/or the PDB
template 1HY393. ................................................................................................................................................ 77
Figure 28. Putative binding modes of the four selected and experimentally evaluated molecules that were
predicted CDLs of SULT1E1. The ligands depicted are isoliquiritigenin (1), indazole-Cl (2), prinaberel (3), and
ZM241385 (4). The 3D pharmacophore features include hydrogen bond donors/acceptors (green/red arrows),
hydrophobic contacts (yellow spheres), aromatic interaction (blue disks), and positive ionisable areas (blue-rayed
star). ................................................................................................................................................................... 78
Figure 29. Putative binding modes of the two selected and experimentally evaluated molecules that were
predicted inhibitors of SULT1E1. The ligands depicted are Amb1890033 (5) and Amb1899186 (6). The 3D
pharmacophore features include hydrogen bond donors/acceptors (green/red arrows), hydrophobic contacts
(yellow spheres), and aromatic interaction (blue disks). ..................................................................................... 78
Figure 30. Putative binding modes of the selected and experimentally evaluated molecules that were
predicted substrates of SULT1E1. The ligands are 2-(4-hydroxyphenylazo)benzoic acid (7), Amb4444666 (8),
and epiestriol (9). The 3D pharmacophore features include hydrogen bond donors/acceptors (green/red arrows),
hydrophobic contacts (yellow spheres), aromatic interaction (blue disks), and negative ionisable areas (red-rayed
star). ................................................................................................................................................................... 79
Figure A- 1 Sequence alignment of SULT subtypes 2A1 (PDBID 3F3Y), 1E1 (PDBID 1HY3) and 1A1 (PDBID
2D06). Amino acids of loops 1, 2 and 3 surrounding the active site of SULTs are highlighted through black boxes.
Colouring of amino acids indicates the following: red = small and hydrophobic residues (incl. Y) (AVFPMILW),
blue = acidic residues (DE), magenta = basic residues (excl. H) (RK), green = hydroxyl, sulfhydryl, amine (incl.
G) (STYHCNGQ), grey = unusual amino/imino acids etc (other residues). Symbols underneath the sequences:
List of Figures
148
asterisk (*) = positions with fully conserved residues; colon (:) = conservation between groups of strongly similar
properties (scoring > 0.5 in the Gonnet PAM 250 matrix); period (.) = conservation between groups of weakly
similar properties (scoring ≤ 0.5 in the Gonnet PAM 250 matrix). ................................................................. 123
Figure A- 2. RMSD plots (Cα-atoms) of the protein SULT1E1 from MD simulations of apo and cofactor-
bound conformations. Total simulation time was 100 ns for each run. ........................................................ 127
Figure A- 3. RMSD plots of the cofactor PAPS bound to SULT1E1 from MD simulations. The RMSD values
were calculated based on all heavy atoms of the cofactor PAPS. Total simulation time was 100 ns for each run.
.......................................................................................................................................................................... 128
Figure A- 4. RMSF plots of the amino acid residues of SULT1E1 from MD simulations of apo and cofactor-
bound SULT1E1. The simulation time equalled 100 ns. ................................................................................. 129
Figure A- 5. ROC curves for the substrate-, CDL- and inhibitor-pharmacophore validation. The 3D
pharmacophore features include hydrogen bond donors/acceptors (green/red spheres), hydrophobic contacts
(yellow spheres) and aromatic interaction (blue disks). .................................................................................... 130
Figure A- 6. Decision tree for inhibitor classification of SULT1E1 ligands. ................................................... 131
Figure A- 7. Decision tree for substrate classification of SULT1E1 ligands. .................................................. 132
Figure A- 8. Compounds that were predicted via 3D pharmacophore screening of the DrugBank but classified
as inactive hits through SVM classification and post-filtering. ............................................................ 133
Figure A- 9. Dynophore (left side) of the SUB1 model (protein P3 and molecule Cole-2b311) in comparison to
the static pharmacophore (right side). The 3D pharmacophore features include hydrogen bond
donors/acceptors (green/red arrows or clouds), hydrophobic contacts (yellow spheres or clouds) and aromatic
interaction (blue disks or clouds). ..................................................................................................................... 139
Figure A- 10. Dynophore (left side) of the CDL2 model (protein P3 and molecule kaempferol) in comparison
to the static pharmacophore (right side). The 3D pharmacophore features include hydrogen bond
donors/acceptors (green/red arrows or clouds), hydrophobic contacts (yellow spheres or clouds) and aromatic
interaction (blue disks or clouds). ..................................................................................................................... 140
Figure A- 11. Dynophore (left side) of the INH1 model (protein P5 and molecule 2-OH-1,3,7,8-
tetrachlorodibenzo-p-dioxin) in comparison to the static pharmacophore (right side). The 3D
pharmacophore features include hydrogen bond donors/acceptors (green/red arrows or clouds) and hydrophobic
contacts (yellow spheres or clouds)................................................................................................................... 140
Figure A- 12. Dynophore (left side) of the INH2 model (protein P3 and molecule 4-OH-2,3,5,2’,4’,5’-
hexachlorobiphenyl) in comparison to the static pharmacophore (right side). The 3D pharmacophore
features include hydrogen bond donors/acceptors (green/red arrows or clouds), hydrophobic contacts (yellow
spheres or clouds) and aromatic interaction (blue disks or clouds). ................................................................. 141
Figure A- 13. Dynophore (left side) of the INH3 model (protein P5 and molecule 4-OH-2,2’,4’,6’-
tetrachlorobiphenyl) in comparison to the static pharmacophore (right side). The 3D pharmacophore
features include hydrogen bond donors/acceptors (green/red arrows or clouds), hydrophobic contacts (yellow
spheres or clouds) and aromatic interaction (blue disks or clouds). ................................................................. 141
Figure A- 14. Dynophore (left side) of the INH4 model (protein P3 and molecule 2-OH-7,8-dichlorodibenzo-
p-dioxin) in comparison to the static pharmacophore (right side). The 3D pharmacophore features include
hydrogen bond donors/acceptors (green/red arrows or clouds), hydrophobic contacts (yellow spheres or clouds)
and aromatic interaction (blue disks or clouds). ............................................................................................... 142
Figure A- 15. Dynophore (left side) of the INH5 model (protein P5 and molecule daidzein-4-sulfate) in
comparison to the static pharmacophore (right side). The 3D pharmacophore features include hydrogen
bond donors/acceptors (green/red arrows or clouds), hydrophobic contacts (yellow spheres or clouds) and
aromatic interaction (blue disks or clouds). ...................................................................................................... 142
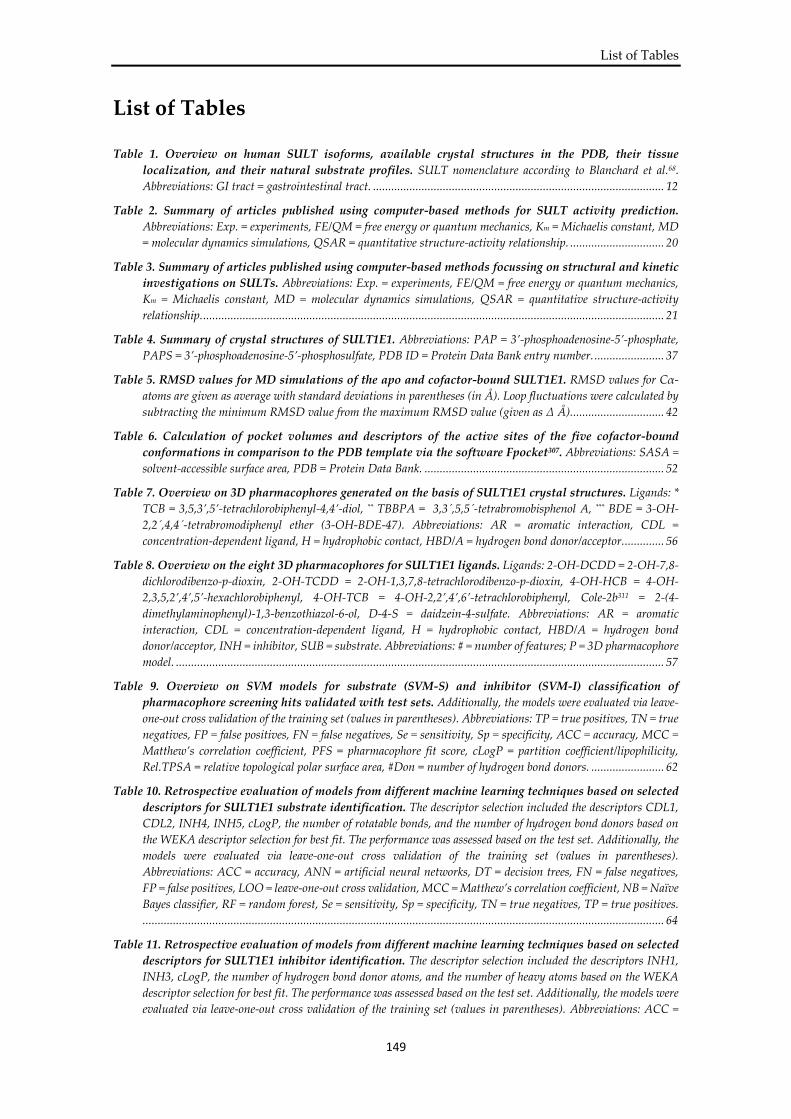
List of Tables
149
List of Tables
Table 1. Overview on human SULT isoforms, available crystal structures in the PDB, their tissue
localization, and their natural substrate profiles. SULT nomenclature according to Blanchard et al.68.
Abbreviations: GI tract = gastrointestinal tract. ................................................................................................ 12
Table 2. Summary of articles published using computer-based methods for SULT activity prediction.
Abbreviations: Exp. = experiments, FE/QM = free energy or quantum mechanics, Km = Michaelis constant, MD
= molecular dynamics simulations, QSAR = quantitative structure-activity relationship. ............................... 20
Table 3. Summary of articles published using computer-based methods focussing on structural and kinetic
investigations on SULTs. Abbreviations: Exp. = experiments, FE/QM = free energy or quantum mechanics,
Km = Michaelis constant, MD = molecular dynamics simulations, QSAR = quantitative structure-activity
relationship. ........................................................................................................................................................ 21
Table 4. Summary of crystal structures of SULT1E1. Abbreviations: PAP = 3’-phosphoadenosine-5’-phosphate,
PAPS = 3’-phosphoadenosine-5’-phosphosulfate, PDB ID = Protein Data Bank entry number. ....................... 37
Table 5. RMSD values for MD simulations of the apo and cofactor-bound SULT1E1. RMSD values for Cα-
atoms are given as average with standard deviations in parentheses (in Å). Loop fluctuations were calculated by
subtracting the minimum RMSD value from the maximum RMSD value (given as Δ Å). .............................. 42
Table 6. Calculation of pocket volumes and descriptors of the active sites of the five cofactor-bound
conformations in comparison to the PDB template via the software Fpocket307. Abbreviations: SASA =
solvent-accessible surface area, PDB = Protein Data Bank. ............................................................................... 52
Table 7. Overview on 3D pharmacophores generated on the basis of SULT1E1 crystal structures. Ligands: *
TCB = 3,5,3’,5’-tetrachlorobiphenyl-4,4’-diol, ** TBBPA = 3,3´,5,5´-tetrabromobisphenol A, *** BDE = 3-OH-
2,2´,4,4´-tetrabromodiphenyl ether (3-OH-BDE-47). Abbreviations: AR = aromatic interaction, CDL =
concentration-dependent ligand, H = hydrophobic contact, HBD/A = hydrogen bond donor/acceptor. ............. 56
Table 8. Overview on the eight 3D pharmacophores for SULT1E1 ligands. Ligands: 2-OH-DCDD = 2-OH-7,8-
dichlorodibenzo-p-dioxin, 2-OH-TCDD = 2-OH-1,3,7,8-tetrachlorodibenzo-p-dioxin, 4-OH-HCB = 4-OH-
2,3,5,2’,4’,5’-hexachlorobiphenyl, 4-OH-TCB = 4-OH-2,2’,4’,6’-tetrachlorobiphenyl, Cole-2b311 = 2-(4-
dimethylaminophenyl)-1,3-benzothiazol-6-ol, D-4-S = daidzein-4-sulfate. Abbreviations: AR = aromatic
interaction, CDL = concentration-dependent ligand, H = hydrophobic contact, HBD/A = hydrogen bond
donor/acceptor, INH = inhibitor, SUB = substrate. Abbreviations: # = number of features; P = 3D pharmacophore
model. ................................................................................................................................................................. 57
Table 9. Overview on SVM models for substrate (SVM-S) and inhibitor (SVM-I) classification of
pharmacophore screening hits validated with test sets. Additionally, the models were evaluated via leave-
one-out cross validation of the training set (values in parentheses). Abbreviations: TP = true positives, TN = true
negatives, FP = false positives, FN = false negatives, Se = sensitivity, Sp = specificity, ACC = accuracy, MCC =
Matthew’s correlation coefficient, PFS = pharmacophore fit score, cLogP = partition coefficient/lipophilicity,
Rel.TPSA = relative topological polar surface area, #Don = number of hydrogen bond donors. ........................ 62
Table 10. Retrospective evaluation of models from different machine learning techniques based on selected
descriptors for SULT1E1 substrate identification. The descriptor selection included the descriptors CDL1,
CDL2, INH4, INH5, cLogP, the number of rotatable bonds, and the number of hydrogen bond donors based on
the WEKA descriptor selection for best fit. The performance was assessed based on the test set. Additionally, the
models were evaluated via leave-one-out cross validation of the training set (values in parentheses).
Abbreviations: ACC = accuracy, ANN = artificial neural networks, DT = decision trees, FN = false negatives,
FP = false positives, LOO = leave-one-out cross validation, MCC = Matthew’s correlation coefficient, NB = Naïve
Bayes classifier, RF = random forest, Se = sensitivity, Sp = specificity, TN = true negatives, TP = true positives.
............................................................................................................................................................................ 64
Table 11. Retrospective evaluation of models from different machine learning techniques based on selected
descriptors for SULT1E1 inhibitor identification. The descriptor selection included the descriptors INH1,
INH3, cLogP, the number of hydrogen bond donor atoms, and the number of heavy atoms based on the WEKA
descriptor selection for best fit. The performance was assessed based on the test set. Additionally, the models were
evaluated via leave-one-out cross validation of the training set (values in parentheses). Abbreviations: ACC =
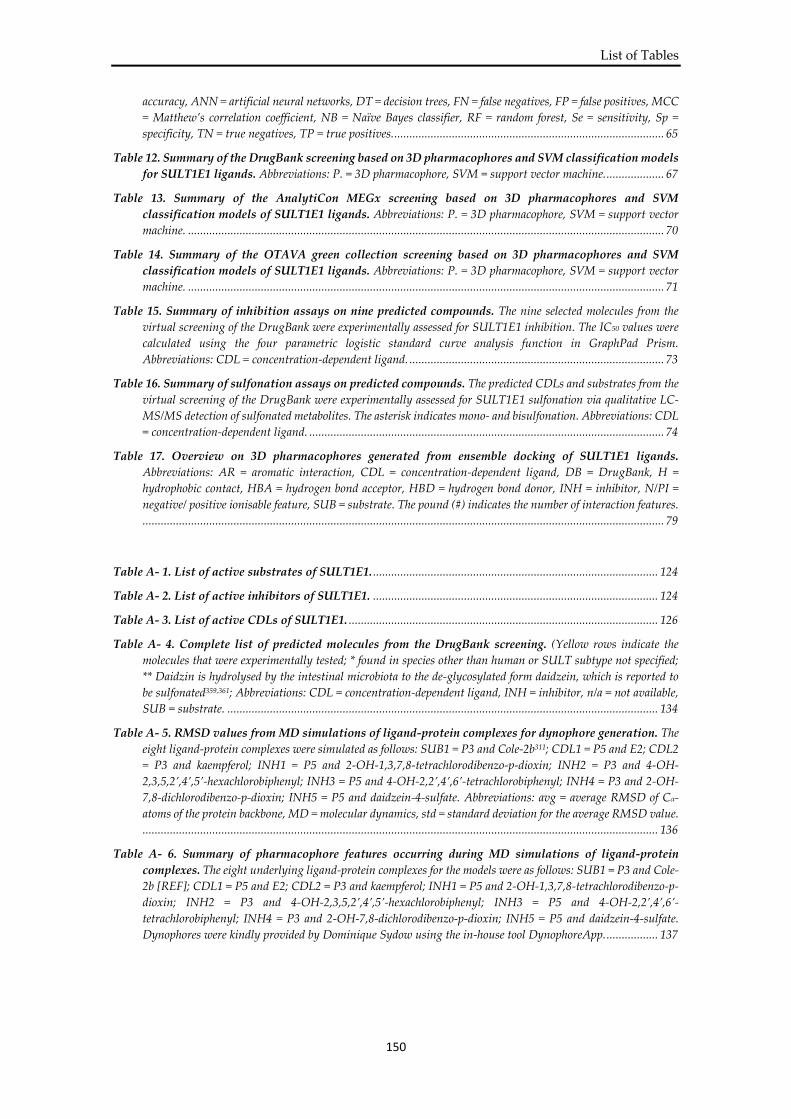
List of Tables
150
accuracy, ANN = artificial neural networks, DT = decision trees, FN = false negatives, FP = false positives, MCC
= Matthew’s correlation coefficient, NB = Naïve Bayes classifier, RF = random forest, Se = sensitivity, Sp =
specificity, TN = true negatives, TP = true positives. ......................................................................................... 65
Table 12. Summary of the DrugBank screening based on 3D pharmacophores and SVM classification models
for SULT1E1 ligands. Abbreviations: P. = 3D pharmacophore, SVM = support vector machine. ................... 67
Table 13. Summary of the AnalytiCon MEGx screening based on 3D pharmacophores and SVM
classification models of SULT1E1 ligands. Abbreviations: P. = 3D pharmacophore, SVM = support vector
machine. ............................................................................................................................................................. 70
Table 14. Summary of the OTAVA green collection screening based on 3D pharmacophores and SVM
classification models of SULT1E1 ligands. Abbreviations: P. = 3D pharmacophore, SVM = support vector
machine. ............................................................................................................................................................. 71
Table 15. Summary of inhibition assays on nine predicted compounds. The nine selected molecules from the
virtual screening of the DrugBank were experimentally assessed for SULT1E1 inhibition. The IC50 values were
calculated using the four parametric logistic standard curve analysis function in GraphPad Prism.
Abbreviations: CDL = concentration-dependent ligand. .................................................................................... 73
Table 16. Summary of sulfonation assays on predicted compounds. The predicted CDLs and substrates from the
virtual screening of the DrugBank were experimentally assessed for SULT1E1 sulfonation via qualitative LC-
MS/MS detection of sulfonated metabolites. The asterisk indicates mono- and bisulfonation. Abbreviations: CDL
= concentration-dependent ligand. ..................................................................................................................... 74
Table 17. Overview on 3D pharmacophores generated from ensemble docking of SULT1E1 ligands.
Abbreviations: AR = aromatic interaction, CDL = concentration-dependent ligand, DB = DrugBank, H =
hydrophobic contact, HBA = hydrogen bond acceptor, HBD = hydrogen bond donor, INH = inhibitor, N/PI =
negative/ positive ionisable feature, SUB = substrate. The pound (#) indicates the number of interaction features.
............................................................................................................................................................................ 79
Table A- 1. List of active substrates of SULT1E1. .............................................................................................. 124
Table A- 2. List of active inhibitors of SULT1E1. .............................................................................................. 124
Table A- 3. List of active CDLs of SULT1E1. ...................................................................................................... 126
Table A- 4. Complete list of predicted molecules from the DrugBank screening. (Yellow rows indicate the
molecules that were experimentally tested; * found in species other than human or SULT subtype not specified;
** Daidzin is hydrolysed by the intestinal microbiota to the de-glycosylated form daidzein, which is reported to
be sulfonated359,361; Abbreviations: CDL = concentration-dependent ligand, INH = inhibitor, n/a = not available,
SUB = substrate. .............................................................................................................................................. 134
Table A- 5. RMSD values from MD simulations of ligand-protein complexes for dynophore generation. The
eight ligand-protein complexes were simulated as follows: SUB1 = P3 and Cole-2b311; CDL1 = P5 and E2; CDL2
= P3 and kaempferol; INH1 = P5 and 2-OH-1,3,7,8-tetrachlorodibenzo-p-dioxin; INH2 = P3 and 4-OH-
2,3,5,2’,4’,5’-hexachlorobiphenyl; INH3 = P5 and 4-OH-2,2’,4’,6’-tetrachlorobiphenyl; INH4 = P3 and 2-OH-
7,8-dichlorodibenzo-p-dioxin; INH5 = P5 and daidzein-4-sulfate. Abbreviations: avg = average RMSD of Cα-
atoms of the protein backbone, MD = molecular dynamics, std = standard deviation for the average RMSD value.
.......................................................................................................................................................................... 136
Table A- 6. Summary of pharmacophore features occurring during MD simulations of ligand-protein
complexes. The eight underlying ligand-protein complexes for the models were as follows: SUB1 = P3 and Cole-
2b [REF]; CDL1 = P5 and E2; CDL2 = P3 and kaempferol; INH1 = P5 and 2-OH-1,3,7,8-tetrachlorodibenzo-p-
dioxin; INH2 = P3 and 4-OH-2,3,5,2’,4’,5’-hexachlorobiphenyl; INH3 = P5 and 4-OH-2,2’,4’,6’-
tetrachlorobiphenyl; INH4 = P3 and 2-OH-7,8-dichlorodibenzo-p-dioxin; INH5 = P5 and daidzein-4-sulfate.
Dynophores were kindly provided by Dominique Sydow using the in-house tool DynophoreApp. ................. 137