Embed Size (px)
Citation preview

Criteria for Assessment of Performance of Cancer Risk Prediction Models: Overview
Ruth Pfeiffer
Cancer Risk Prediction Workshop, May 21, 2004
Division of Cancer Epidemiology and Genetics
National Cancer Institute

Cancer Risk Prediction Models
• Model input: – Individual’s age and risk factors– Age interval at risk
• Model output: – Estimate of individual’s absolute risk of
developing cancer over a given time period (e.g. the next 5 years).

Definition of Absolute Risk for Cancer in [a, a+]
1
1 1 2
( ; , ) ( , | ; )
( , )exp ( , ) ( )a t
a a
r x a P T a cause c T a x
h t x h u x h u du dt
1
2
( , ) - hazard of cancer incidence at age
( ) - competing mortality hazard
- individual risk or protective factors
h t x t
h t
x

Applications of absolute risk prediction models
• Population level: – Estimate population disease burden– Estimate impact of changing the risk factor distribution
in the general population– Plan intervention studies
• Individual level: – Clinical decision-making:
• Modification of known risk factors (diet, exercise)• Weighing risks and benefits of intervention ( eg
chemoprevention)
– Screening recommendations

Evaluating the performance of risk models
• How well does model predict for groups of individuals: Calibration
• How well does model categorize individuals: Accuracy scores
• How well does model distinguish between individuals who will and will not experience event: Discriminatory Accuracy

Independent population for validation
Assume population of N individuals followed over time period
Define
1, if ith subject develops cancer in
0, otherwiseiY
;
i,
( ) absolute risk for ith subject
with baseline covariates age
i ir r x a
x a

Assessing Model Calibration
Goodness-of-fit criteria based on comparing observed (O) with expected (E) number of events overall and in subgroups of risk factors of the population
Use Poisson approximation to sum of independent binomial random variables with ri<<1
1 1
, N N
i i
i i
O Y E r

Assessing Model Calibration, cont.
Unbiased (well calibrated)
Remark:
1
1 0
1( )
N
i
i
Y rdF rN
1
0
( ) ( ) ( )X
rdF r r x dG x
Brier Score
21( )i i
i
BS O rN
Brier Score = Mean Squared Error (measure of accuracy)
Brier, 1950

Comparison of observed (O) and expected (E) cases of invasive breast cancer (Gail et al Model 2) in placebo arm of Breast Cancer Prevention Trial (Table 4, Costantino et al, JNCI, 1999)
Age Group
# women
O E E/O
<=49 2332 60 55.9 0.9
50-59 1807 43 48.4 1.1
>=60 1830 52 54.7 1.1
All ages
5969 155 159.0 1.0

Assess model performance for clinical decision making
For clinical decision making a decision rule is needed
for some threshold r*
1, if *
0, otherwise
ii
r r

For given threshold r* define sensitivity and specificity of decision rule as
1
*
*
0
1
0
1sens(r*)= ( ),
proportion of cases with *
1spec(r*)= (1 ) ( )
1
with = ( )
r
r
rdF r
r r
r dF r
rdF r

Problem: sensitivity and specificity not always appropriate measures
Example: rare disease π=P(Y=1)=0.01
Sensitivity =0.95, specificity=0.95
( 1| 1)
( 1| 1)
( 1| 1) ( 1| 0)(1 )
0.95 0.010.16
0.95 0.01 (1 0.95) 0.99
ppv P Y
P Y
P Y P Y

Accuracy Scores
Measure how well true disease outcome predicted
Quantify clinical value of decision rule (Zweig & Campbell, 1993)
• Positive predictive value • Negative predictive value • Weighted combinations of both
Depend on sensitivity, specificity, disease prevalence
( 1| 1)ppv P Y ( 0 | 0)npv P Y

Measures of Discrimination for Range of Thresholds
• ROC curve (plots sensitivity against 1-specificity)• Area under the ROC curve (AUC) ~Mann-
Whitney-Wilcoxon Rank Sum Test ~ Gini index for rare events
• Concordance statistic (Rockhill et al, 2001; Bach et al, 2003)
• Partial area under the curve (Pepe, 2003; Dodd&Pepe, 2003)


Decision Theoretic Framework
Specify loss function for each combination of true disease status and decision:
Y=0 Y=1 δ=0 C00 C01 δ=1 C10 C11

Known Loss Function
1 * 1
11 01 10
* 0 *
*
00
0
( ) ( ) (1 ) ( )
+ (1 ) ( ) min
r
r r
r
EL C rdF r C rdF r C r dF r
C r dF r
10 00
10 01 00 11*
C Cr
C C C C

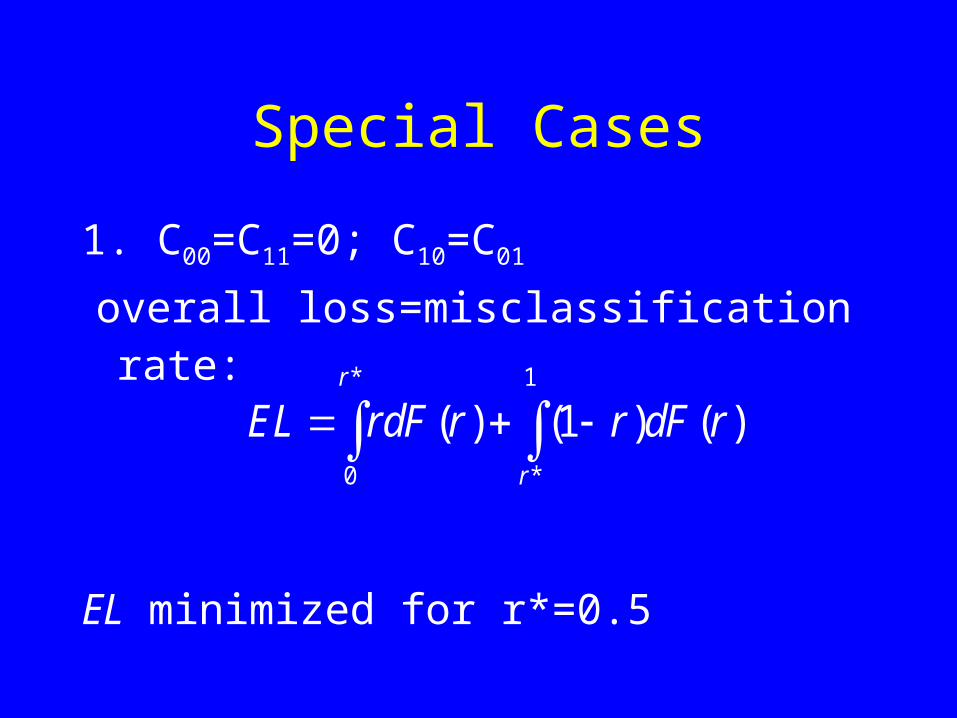
11 01
10 00
sens(r*) (1 sens(r*))
(1 )(1 spec(r*))+ (1 )spec(r*)
EL C C
C C
If sens(r*)=1 and spec(r*)=1
11 00 (1 )EL C C
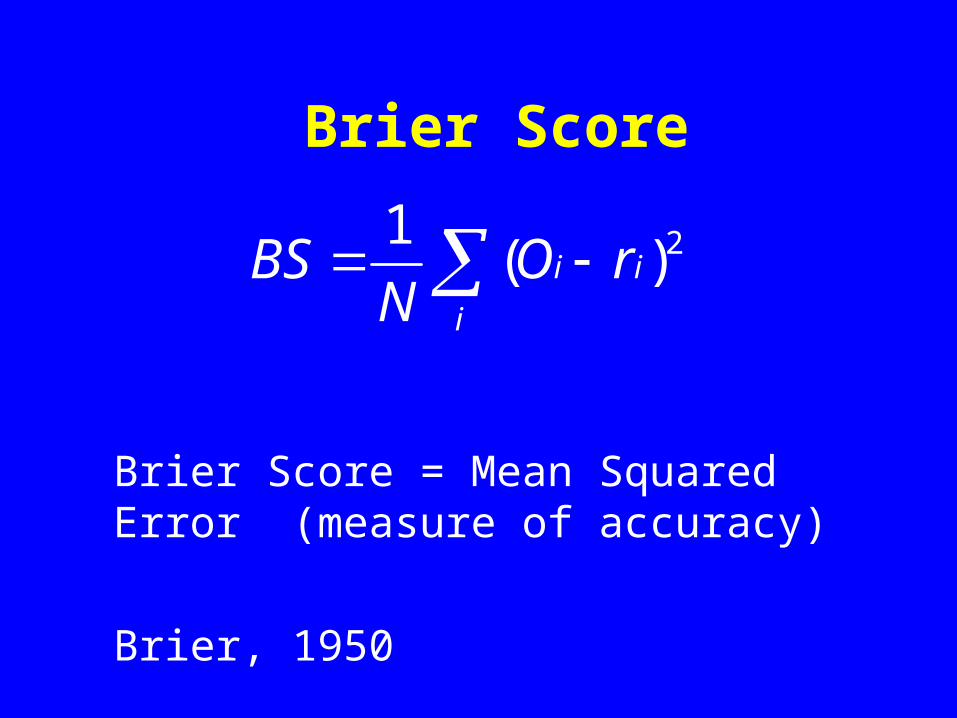
Special Cases
1. C00=C11=0; C10=C01
overall loss=misclassification rate:
EL minimized for r*=0.5
* 1
0 *
( ) (1 ) ( )r
r
EL rdF r r dF r

Special Cases, cont
2.
10
01 10* 1
Cr
C C
00 11 ; 10 01,0C C C C
11 01
10 00
sens(r*) (1 sens(r*))
(1 )(1 spec(r*))+ (1 )spec(r*)
EL C C
C C
If sens(r*)=1 and spec(r*)=1
11 00 (1 )EL C C
Recall:
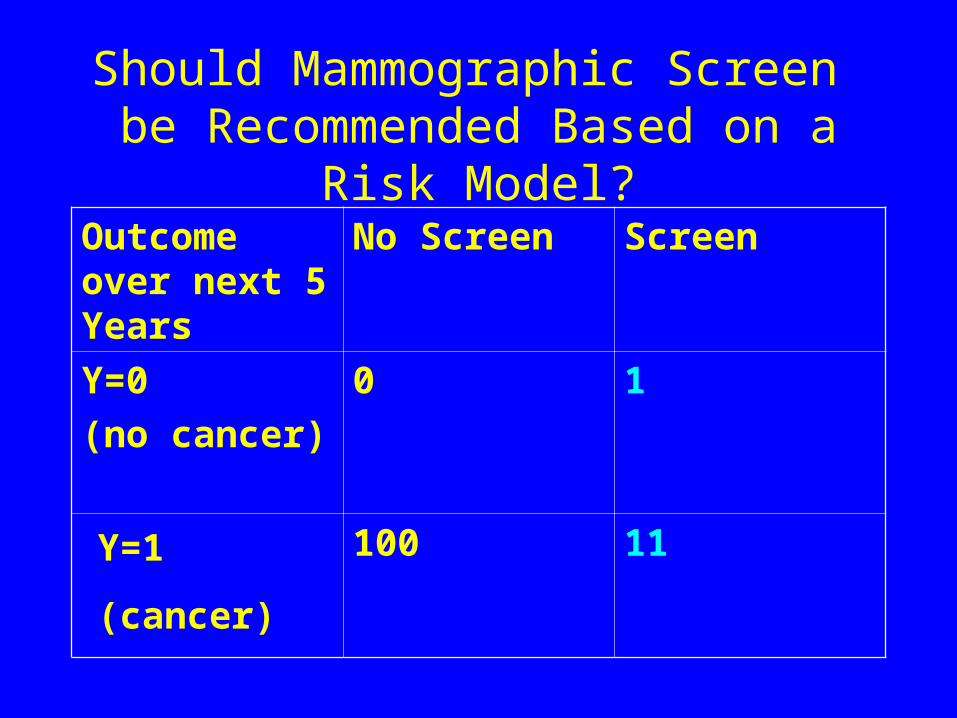
Should Mammographic Screen be Recommended Based on a Risk Model?
Outcome over next 5 Years
No Screen Screen
Y=0
(no cancer)
0 1
100 11Y=1
(cancer)

Ratio of Expected Loss to Minimum Expected Loss vs Sensitivity

Intervention Setting
Two outcomes: eg Y1=breast cancer
Y2=stroke
Loss Y1=0 Y1=1 Y2=0 C00 C01 Y2=1 C10 C11

Intervention Setting
Intervention does not change cost, it changes probability function of joint outcomes
No intervention: P δ=0(Y1, Y2)
Intervention: P δ=1(Y1, Y2)
1 2
, ,
( , )
ji k
i j k
EL C P Y i Y j

Ideally we would have joint risk model for both outcomes, Y1, Y2
Simplification: Pi(Y1=1, Y2=1|x) = p2i ri(x)
p21 = p20 ρ2
r1 (x) = r0 (x)ρ1
1 2
, ,
( , ) min *
ki k
i j k
EL C P Y i Y j r
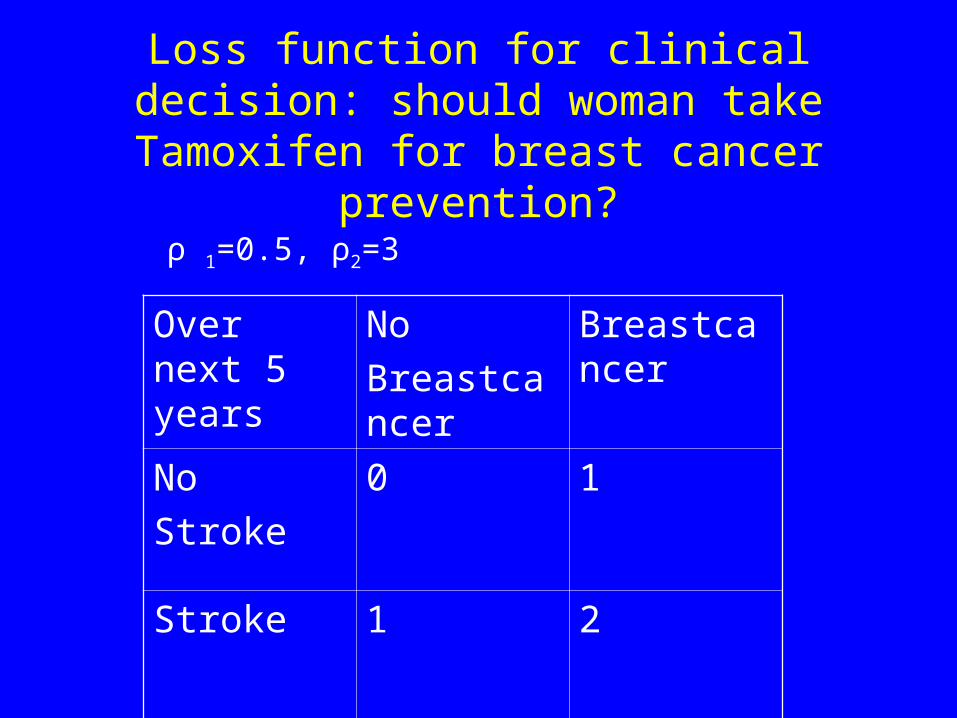
Loss function for clinical decision: should woman take Tamoxifen for breast cancer
prevention?
Over next 5 years
No
Breastcancer
Breastcancer
No
Stroke
0 1
Stroke 1 2
ρ 1=0.5, ρ2=3

Ratio of Expected Loss to Expected Loss with sens=spec=1 vs Sensitivity

Summary
• For certain applications (screening) high sensitivity and specificity more important than others (clinical decision making)
• Always want a well calibrated model
• Discriminatory aspects of models may be less important than accuracy and calibration

Collaborators
Mitchell Gail, NCI
Andrew Freedman, NCI Patricia Hartge, NCI

References
Brier GW, 1950, Monthly Weather Review, 75, 1-3
Dodd LE, Pepe M, 2003, JASA 98 (462): 409-417
Efron B, 1986, JASA 81 (394): 461-470
Efron B, 1983, JASA 78 (382): 316-329
Gail MH et al, 1999, JNCI, 91 (21): 1829-1846
Hand DJ, 2001, Statistica Neerlandica, 55 (1): 3-16
Hand DJ, 1997, Construction and assessment of classification rules, Wiley.
Pepe MS 2000, JASA, 95 (449): 308-311
Schumacher M, et al, 2003, Methods of information in medicine 42: 564-571
Steyerberg EW, et al, 2003, Journal of Clinical Epidemiology 56: 441-447

AUC value for the Gail et al Model 2
0.58

Relative Risk Estimates for “Gail Model” Risk Factor
Age at menarche (yrs.) (>14, 12-13, <12) 1.00-1.21
Number of Biopsies (0, 1, 2+) 1.00-2.88
Age at first live birth (yrs.)
(<20, 20-24, 25-29, > 30)
1.00-1.93
# of first degree relatives with breast cancer
(0, 1, 2+)
1.00-6.80

Intervention Setting
Two outcomes: eg Y1=breast cancer
Y2=stroke
Loss Y1=0 Y1=1 Y2=0 Y2=1 δ=0 C1
00 C101 C2
00 C201
δ=1 C110 C1
11 C210 C2
11