Embed Size (px)
Citation preview

DOT/FAAAM9-6 Prediction of Stccess in
FAA Air Traffic Control FieldOffice of Aviation Medicine Training as a Function ofWashington, D.C. 20591 Selection and Screening
Test Performance
NCarol A. Manning(V) Pamela S. Della Rocco
Kevin D. Bryant
CCivil Aeromedical InstituteFederal Aviation AdministrationOklahoma City, OK 73125
May 1989
$
This document is available to the publicthrough the National Technical InformationService, Springfield, Virginia 22161.
UeteJUN22 1989olonstot.m U HFoct"A AviatioAdli~rdstrotim

NOTICE
This document is disseminated under the sponsorship of theDepartment of Transportation in the interest of informationexchange. The United States Government assumes no liabilityfor the contents or use thereof.
m . im m um uml l m um •In

Technical Neport Documentation Page
1. Report No. 2. Government Accession No. 3. Recpient's Cotalog N
DOT/FAA/AM-89 /
4. Title and Subtitle 5. Report Date
PREDICTION OF SUCCESS IN FAA AIR TRAFFIC CONTROL MAY 1989
FIELD TRAINING AS A FUNCTION OF SELECTION AND 6.Per.orm.ng Orgo z..on Code
SCREENING TEST PERFORMANCE8. Performing Organ zatson Report No
7. Author's) Carol A. Manning, Pamela S. Della Rocco,
and Kevin D. Bryant9. Performing Organization Name and Address 10. Work Un,? No (TRAIS)
FAA Civil Aeromedical Institute
P. 0. Box 25082 11. Contract or Grant No.
Oklahoma City, OK 7312513. Type of Report and Period Cooered
12. Sponsoring Agency Name and Address
Office of Aviation MedicineFederal Aviation Administration800 Independence Avenue, S.W. 14. Sponsoring Agency Code
Washington, D.C. 20591 AAM-500
15. Supplementary Notes
This study was conducted under tasks AM-C-88/89-HRRl12 and AM-C-88/89-I-RRI05.
16. Abstract This study compared correlations between Office of Personnel Management(OPM) selection test scores for Air Traffic Control Specialists (ATCSs) and scoresfrom the FAA Academy's second-stage screening program with measures of field trainingperformance. Field training performance measures were collected for 3,185 en routeand 1,740 terminal ATCS developmentals. Baseline data were also collected from over125,000 applicants who took the OPM ATCS selection battery and over 9,000 entrants toAcademy programs. Separate analyses were conducted for developmentals assigned to enroute centers, VFR towers, and terminal radar facilities. The Multiplex ControllerAptitude Test (MCAT) predicts field training performance better for en routedevelopmentals than any other OPM test. MCAT is not predictive of field trainingperformance for terminal developmentals, but scores on the Occupational Knowledge Test(OKT) are predictive. For both en route and terminal developmentals, Academylaboratory performance scores are more predictive of field training performance than!are academic test scores; for developmentals at VFR towers, the average Academy blocktest score predicts about as well as the laboratory performance scores. Adjustingcorrelations for restriction in the range of scores on selection procedures revealedthat while the OPM rating and the Academy course grade predict some measures ofdevelopmental training performance equally well, the Academy performance measures,particularly the laboratory performance scores, are better predictors of supervisor/OJT instructor ratings and training status than are OPM scores. It was concluded thatit is not only appropriate, but also essential, that any analyses of trainingperformance be conducted separately for developmentals in each option because ofdisparate relationships between predictors and criteria.
17. Key Words 18. Distribution Statement
Air Traffic Control Specialist Document is available to the public
Selection through the National Technical
Training Information Service, Springfield, VA
Validity 22161.
19. Security Clossif. (of this report) 20. Security Classif. (of this page) 21. No. of Pages 22. Price
UNCV.ASSIFIED UNCLASSIFIED 32
Farm DOT F 1"Zu.7 s8-72, Reproduction of completed page authorized

PREDICTION OF SUCCESS IN FAA AIR TRAFFIC CONTROL FIELD TRAINING
AS A FUNCTION OF SELECTION AND SCREENING TEST PERFORMANCE
C. A. Manning, P. S. Della Rocco, and K. D. Bryant
INTRODUCTION
Applicants for the job of Air Traffic Control Specialist (ATCS) in theFederal Aviation Administration (FAA) must undergo a two-stage selectionprocess. First, they take a battery of written tests, meet medical andsecurity qualifications, and complete an interview. If successful, they arehired. The next step is to complete a performance-based screening program.The purpose of this study is to compare correlations between measures ofaptitude from both selection procedures to measures of success in fieldtraining.
The first method used to select ATCSs is the Office of PersonnelManagement (OPM) Air Traffic Control Specialist test battery. The batteryis comprised of two aptitude tests, which determine a qualifying score, anda job knowledge test, which may add extra points to the qualifying score forthose who pass the aptitude tests. The second type of selection procedureis undertaken at the FAA Academy in Oklahoma City. Applicants who pass thepreviously mentioned written test battery with a sufficiently high score,and pass the medical and security qualifications and the interview may behired as FAA employees, but must successfully complete the Academy programin order to retain their positions.
Few studies have been conducted to ascertain the validity of the ATCSselection procedures. VanDeventer (1981) examined the validity of Academyprograms in predicting field training attrition and. supervisor ratings fordevelopmentals who entered the Academy between 1976 and 1978. VanDeventer(1984) compared performance on the OPM ATCS selection tests with performanceat the FAA Academy, but did not examine criteria based upon field trainingor job performance measures. Manning, Kegg, and Collins (1988) brieflydiscussed the relationship between Academy performance and status in fieldtraining. Other unpublished analyses examined the relationship betweenAcademy component scores and field training status, but to date, no studieshave been conducted which 1) correlate OPM ATCS selection test performancewith measures of performance in field training, or 2) examine field trainingperformance criterion measures other than training status and supervisorratings. This study correlated measures obtained from both selectionprocedures with several measures of performance in ATCS field training.These analyses are important because they allow the FAA to evaluate thevalidity of its selection procedures.
1
METHOD
Measures included in the study.
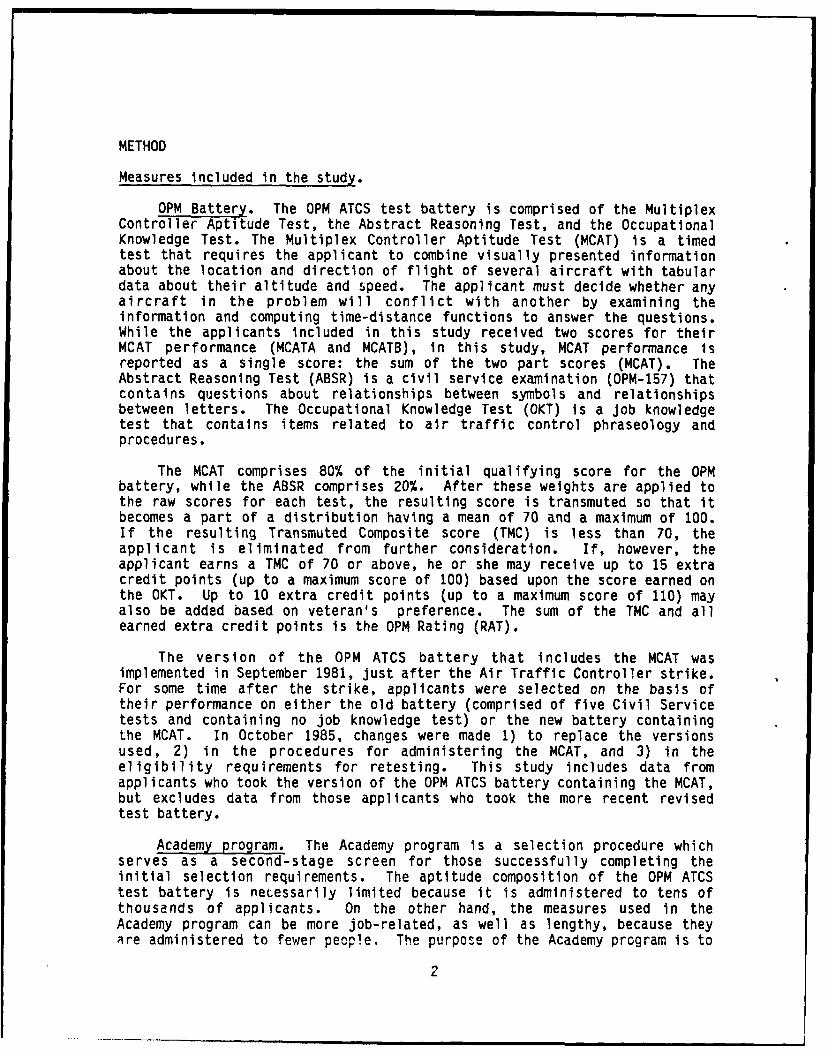
OPM Battery. The OPM ATCS test battery is comprised of the MultiplexController Aptitude Test, the Abstract Reasoning Test, and the OccupationalKnowledge Test. The Multiplex Controller Aptitude Test (MCAT) is a timedtest that requires the applicant to combine visually presented informationabout the location and direction of flight of several aircraft with tabulardata about their altitude and speed. The applicant must decide whether anyaircraft in the problem will conflict with another by examining theinformation and computing time-distance functions to answer the questions.While the applicants included in this study received two scores for theirMCAT performance (MCATA and MCATB), in this study, MCAT performance isreported as a single score: the sum of the two part scores (MCAT). TheAbstract Reasoning Test (ABSR) is a civil service examination (OPM-157) thatcontains questions about relationships between symbols and relationshipsbetween letters. The Occupational Knowledge Test (OKT) is a job knowledgetest that contains items related to air traffic control phraseology andprocedures.
The MCAT comprises 80% of the initial qualifying score for the OPMbattery, while the ABSR comprises 20%. After these weights are applied tothe raw scores for each test, the resulting score is transmuted so that itbecomes a part of a distribution having a mean of 70 and a maximum of 100.If the resulting Transmuted Composite score (TMC) is less than 70, theapplicant is eliminated from further consideration. If, however, theapplicant earns a TMC of 70 or above, he or she may receive up to 15 extracredit points (up to a maximum score of 100) based upon the score earned onthe OKT. Up to 10 extra credit points (up to a maximum score of 110) mayalso be added based on veteran's preference. The sum of the TMC and allearned extra credit points is the OPM Rating (RAT).
The version of the OPM ATCS battery that includes the MCAT wasimplemented in September 1981, just after the Air Traffic Controller strike.For some time after the strike, applicants were selected on the basis oftheir performance on either the old battery (comprised of five Civil Servicetests and containing no job knowledge test) or the new battery containingthe MCAT. In October 1985, changes were made 1) to replace the versionsused, 2) in the procedures for administering the MCAT, and 3) in theeligibility requirements for retesting. This study includes data fromapplicants who took the version of the OPM ATCS battery containing the MCAT,but excludes data from those applicants who took the more recent revisedtest battery.
Academy program. The Academy program is a selection procedure whichserves as a second-stage screen for those successfully completing theinitial selection requirements. The aptitude composition of the OPM ATCStest battery is necessarily limited because it is administered to tens ofthousands of applicants. On the other hand, the measures used in theAcademy program can be more job-related, as well as lengthy, because theyare administered to fewer people. The purpose of the Academy program is to
2

evaluate the ability of a student to apply a set of procedures in anappropriate manner for the nonradar control of air traffic. The programincludes several academic tests, six laboratory problems, and a ControllerSkills Test.
The six laboratory problems, each one-half hour in length, require thestudent to apply the principles of air traffic control learned during theacademic parts of the course to situations in which simulated aircraft movethrough a synthetic airspace. The performance of students is evaluated bycertified instructors who formerly controlled air traffic. The gradinginstructors assign both a Technical Assessment (based on observable errorsmade) and an Instructor Assessment (based on the instructor's rating of thestudent's potential). These assessment scores are averaged to yield thelaboratory score for a single problem.
The Controller Skills Test (CST) measures the application of airtraffic control principles to resolve air traffic situations in a paper-and-pencil format. The composite score in the program is based on a weightedsum of the Block Average (BA; average of the academic block tests), theComprehensive Phase Test (CPT); a comprehensive test covering all academicmaterial), the Lab Average (AVL5); the average score on the best 5 of thesix graded laboratory problems), and the Controller Skills Test (CST). Acomposite grade of 70 is required to pass.
From 1976-1985, the second stage screening process was conducted in twoparts: the En Route Initial Qualification Training program and the TerminalInitial Qualification Training program. Each program addressed theapplication of nonradar procedures in a different type of airspace. Academyentrants were assigned to one or the other of the programs on a more or lessrandom basis (no information about their aptitude, as measured by OPMrating, was used to make the "option" assignment).
For both the En Route and Terminal programs, the same weights wereapplied to the program components to yield the composite score (NLCOMP): 2%for the Block Average, 8% for the Comprehensive Phase Test, 65% for the LabAverage, and 25% for the CST. Those who successfully completed either the EnRoute or Terminal program went to a facility in the corresponding option.Those who did not successfully complete the program were separated from theGS-2152 job series.
In 1985, the two programs were combined into one, the ATCS Screeningprogram. The purpose of the single program was to allow facilityassignments to be based, when possible, upon the grade earned in theprogram. Although the screen program contains the same lessons, and the For
same or comparable tests and laboratory problems as those in the En Route Iprogram, it was necessary to change the weights applied to the componentscores of the screen program to maintain the average pass rate obtained in Ithe combination of the En Route and Terminal programs.
Because these programs differed considerably, and because many of thegraduates of the recently implemented screen program have not yet completedtheir training, this study addresses only entrants and graduates of the En ......
.i ity Y odes
3 1 Avall nd/ort
9IDst Special
'•'LI .(

Route and Terminal programs, and excludes those in the screen. Theperformance of students from the En Route and Terminal programs will beexamined separately.
Field trainin . After passing one of the Academy programs, successfulstudents (now called developmentals) move to a field facility and beginfield training. Facilities differ according to the amount and type of airtraffic they control; thus, the amount and type of training undertaken bydevelopmentals is dependent on the type of facility to which they areassigned. Because of the differences between the jobs performed by thedifferent facilities, it was necessary to analyze the measures separatelyaccording to the type of facility providing the training.
The measures of field training performance included in this study arefinal disposition In field training at the first facility, variablesreflecting success rates in specific phases of training (particularly thosephases in which the developmental is taking on-the-job training), times tocomplete training phases, times to attain full performance level (FPL)status, and subjective performance ratings. Field training disposition wasobtained by comparing automated personnel records with records of fieldtraining completions.
The field training performance variables (success rates, times tocomplete training phases) were obtained from FAA training phase completionreports that include information for each phase of qualification trainingcompleted by a developmental. Each report contains start and completiondates and a grade. Training times were computed by calculating the timebetween the start and completion of a phase.
Subjective performance ratings were provided by the ATCS supervisor oran OJT instructor on the phase completion report submitted at the completioncf each training phase. Each subjective performance rating Is a globalassessment of a developmental's performance in a stage of training ascompared with other developmentals. The global rating was used because anunpublished study expanding VanDeventer's (1981) results suggested that aglobal rating was predicted as well by the Academy program components aswere other ratings addressing more specific aspects of performance.
Subjects. Three sets of analyses were conducted. The first setaddresses the performance of applicants between 1981 and 1985 who took theversion of the OPM ATCS test battery that contained the MCAT but did notcontain the revised versions, testing procedures, or eligibilityrequirements. Data from these applicants were employed because the group ofAcademy entrants examined in this study applied during this time. The groupof ATCS applicants consisted of 127,807 applicants who took the tests forthe first time between September 1981 and September 1985.
The second set of analyses addresses Academy performance. The totalpopulation of Academy entrants from August 1981 to September 1985 consistedof 13,533 entrants. These were divided into three groups: 8,536 En Routeand 4,997 Terminal entrants. Data were eliminated from the sample forentrants who repeated a program (although data for their first entry were
4

retained), for entrants who came from special emphasis programs and took theOPM ATCS test battery noncompetitively and for other entrants for whom noOPM scores were available.
The third set of analyses addresses field training performance. Thesample of developmentals for which field training records were analyzedconsisted of those from the group above who successfully completed one ofthe Academy programs. In order to obtain this sample, those enteringdirectly into field training and bypassing the Academy program, thoseentering field training twice after repeating the Academy program, thoseentering the flight service station program as their first ATCS specialty,and those leaving field training for reasons unrelated to performance wereeliminated from the sample of developmentals taking field training betweenAugust 1981 and January 1989.
Additional developmentals were eliminated from the sample because ofthe type of facility to which they were assigned. The level of complexity(though not the amount) of the traffic controlled by most en routefacilities is fairly similar. On the other hand, the type, amount, andcomplexity of the traffic handled by the terminal facilities differsconsiderably. A relatively low number of Academy graduates enter certaintypes of facilities, e.g., level 1 en route centers and nonradar towers(because of the small number of facilities and employees staffing them) andlevel 5 terminal facilities (because many regions are reluctant to send newhires to the most complex terminal facilities).
Consequently, for the purpose of this study, the analyses of fieldtraining data were limited to developmentals entering level 2-3 en routecenters (excluding Anchorage Center, which recently became a level 2center), VFR towers, and level 2-4 terminal radar facilities. Aftertraining records were eliminated because of the restrictions discussedabove, 4925 developmental records were available for analysis (3185 were foren route developmentals and 1740 were for terminal developmentals).
RESULTS
Applicants' OPM ATCS battery performance.
Table 1Mean scores on OPM ATCS battery component tests
for all Sept 1981 - Sept 1985 applicantsN=127,807
Measure Mean Std. Dev.MCAT 9 1T. -ABSR 30.5 9.5OKT 28.8 11.3TMC 73.1 12.2RAT 74.1 13.1
5
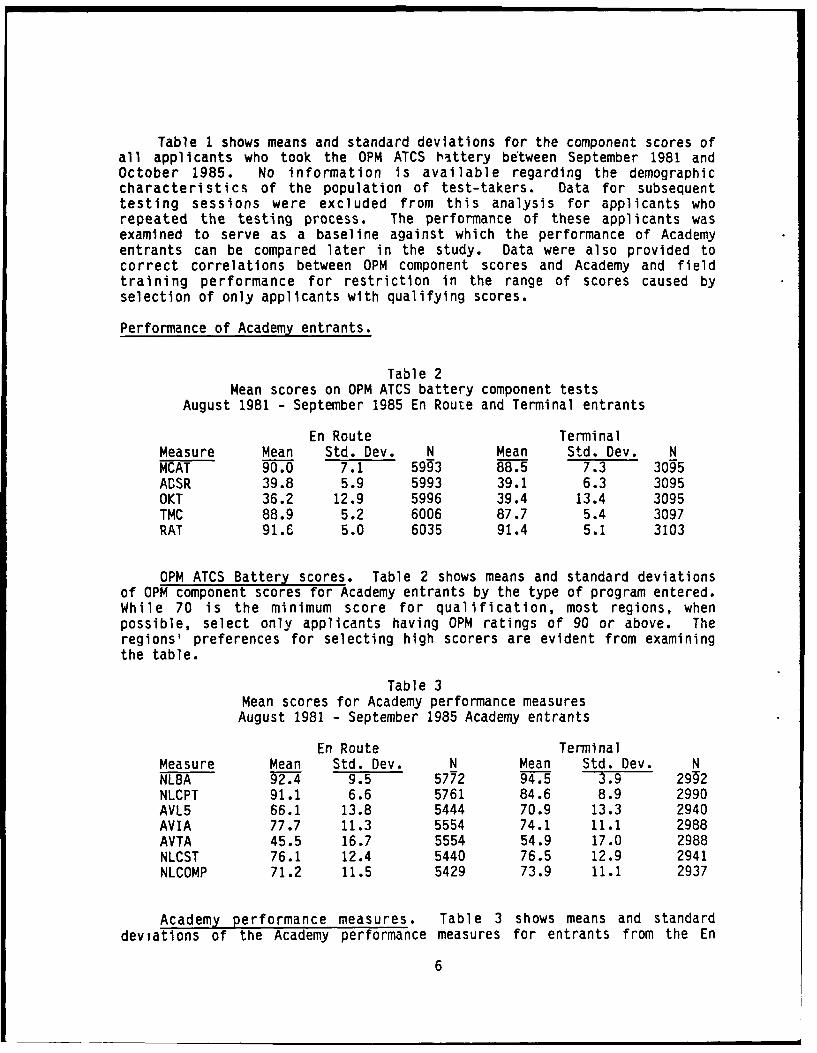
Table 1 shows means and standard deviations for the component scores ofall applicants who took the OPM ATCS hattery between September 1981 andOctober 1985. No information is available regarding the demographiccharacteristics of the population of test-takers. Data for subsequenttesting sessions were excluded from this analysis for applicants whorepeated the testing process. The performance of these applicants wasexamined to serve as a baseline against which the performance of Academyentrants can be compared later in the study. Data were also provided tocorrect correlations between OPM component scores and Academy and fieldtraining performance for restriction in the range of scores caused byselection of only applicants with qualifying scores.
Performance of Academy entrants.
Table 2Mean scores on OPM ATCS battery component tests
August 1981 - September 1985 En Route and Terminal entrants
En Route TerminalMeasure Mean Std. Dev. N Mean Std. Dev. NMCAT 90.0 7.1 5993 88.5 7.3 3095ACSR 39.8 5.9 5993 39.1 6.3 3095OKT 36.2 12.9 5996 39.4 13.4 3095TMC 88.9 5.2 6006 87.7 5.4 3097RAT 91.6 5.0 6035 91.4 5.1 3103
OPM ATCS Battery scores. Table 2 shows means and standard deviationsof OPM component scores for Academy entrants by the type of program entered.While 70 is the minimum score for qualification, most regions, whenpossible, select only applicants having OPM ratings of 90 or above. Theregions' preferences for selecting high scorers are evident from examiningthe table.
Table 3Mean scores for Academy performance measuresAugust 1981 - September 1985 Academy entrants
En Route TerminalMeasure Mean Std. Dev. N Mean Std. Dev. NNLBA 92.4 9.5 5772 94.5 3.9 2992NLCPT 91.1 6.6 5761 84.6 8.9 2990AVL5 66.1 13.8 5444 70.9 13.3 2940AVIA 77.7 11.3 5554 74.1 11.1 2988AVTA 45.5 16.7 5554 54.9 17.0 2988NLCST 76.1 12.4 5440 76.5 12.9 2941NLCOMP 71.2 11.5 5429 73.9 11.1 2937
Academy performance measures. Table 3 shows means and standard
deviations of the Academy performance measures for entrants from the En
6

Route and Terminal programs for those taking the OPM ATCS test battery.Because the En Route and Terminal programs were comprised of differentlessons, tests, and laboratory problems, it is not appropriate to comparethe performance measures from those two programs.
Note from examining the tables that the academic portions of theprograms (block average, NLBA; comprehensive phase test, NLCPT) areconsiderably easier than the performance-based laboratory problems. Theaverage instructor assessment (AVIA), the average of the instructorassessments made for individual laboratory problems, compensates for the lowtechnical scores (AVTA, which is the average of the technical assessmentsmade for individual laboratory problems). The Controller Skills test(NLCST) combines the application of nonradar procedures with the objectiveformat of a paper-and-pencil test. The data show that, regardless ofoption, this test is more difficult for students than the other, moretraditional, academic tests included in the programs.
Table 4Correlations* between Academy and OPM battery component scores
En Route entrants 1981-1985(N=5298)
Measure MCAT ABSR OKT TMC RATNLBA .16 .12 .15 .18 .19
NLCPT .15 .09 .22 .17 .24AVL5 .26 .15 .12 .28 .22AVIA .26 .14 .12 .28 .23AVTA .25 .15 .14 .27 .22NLCST .28 .21 .16 .32 .28
NLCOMP .28 .18 .15 .31 .26*All correlations were significantly different from 0 at p < .01.
Table 5Correlations* between Academy and OPM battery component scores
Terminal entrants 1981-1985(N=2930)
Measure MCAT ABSR OKT TMC RATNLBA .08 .05 .31 .08 .16NLCPT -.02* .02* .31 -.01* .07AVL5 .23 .11 .16 .24 .20AVIA .22 .10 .16 .23 .19AVTA .22 .12 .18 .23 .21NLCST .20 .15 .24 .22 .25NLCOMP .24 .13 .22 .25 .23* Correlations are not significant at p ( .01.
7

Correlations between Academy and OPM ATCS battery scores. Tables 4 and5 show correlations between OPM ATCS battery components and Academyperformance measures for the En Route and Terminal programs. Allcorrelations, except those starred, are statistically significant at the .01level.
Examination of the tables shows that the MCAT is more predictive ofperformance-based measures like the labs, CST, and consequently, the overallcourse grade, than the academic components.
Correlations between the Abstract Reasoning Test (ABSR) and the Academycomponents scores are lower than for the MCAT. The ABSR is most predictiveof scores on the Controller Skills Test (CST) for both programs, though thecorrelation is lower, in general, with components of the Terminal program.The ABSR has lower correlations with the course grade than any othercomponent of the OPM rating.
While most other components have higher correlations with measures fromthe En Route program than measures from the Terminal program, theOccupational Knowledge Test (OKT) has higher correlations with measures fromthe Terminal program. In general, the OKT is more predictive of academicperformance measures (block average, NIUA; comprehensive phase test, NLCPT;and NLCST) than laboratory performance measures. Also, the OKT score has ahigher correlation with the Terminal course grade (r=.22) than the En Routecourse grade (r=.15).
In examining the relative predictability of the Transmuted Compositescore (TMC) as compared with the OPM rating (RAT), it appears that the TMCis more predictive of the lab scores and the course grade than the RAT.However, the RAT is more predictive of academic test performance than theTMC. Overall, TMC is the highest predictor of course grade, although themagnitude of the correlation is higher for the En Route than for theTerminal program.
Table 6Correlations between Academy and OPM battery component scores
Adjusted for restriction in the range of OPM scoresEn Route program
Measure MCAT ABSR OKT TMC RATNLBA .35 .19 .13 .40 .45NLCPT .33 .14 .19 .38 .54AVL5 .51 .24 .11 .57 .51AVIA .52 .22 .11 .57 .53AVTA .51 .24 .12 .55 .51NLCST .55 .33 .14 .62 .61NLCOMP .55 .28 .13 .61 .58
8

Table 7Correlations between Academy and OPM battery component scores
Adjusted for restriction in the range of OPM scoresTerminal program
Measure MCAT ABSR OKT TMC RATNLBA .17 .08 .27 .18 .38NLCPT -.04 .03 .27 -.02 .18AVL5 .46 .17 .14 .49 .46AVIA .45 .15 .14 .47 .45AVTA .45 .18 .15 .47 .48NLCST .41 .22 .20 .45 .55NLCOMP .48 .19 .19 .50 .52
Tables 6 and 7 show the correlations between Academy and OPM componentscores adjusted for restriction in range resulting from selecting entrantsfor the Academy from applicants with high OPM scores. Thorndyke's (1949)formula was used to calculate the adjustment for restriction in range.Adjusting the correlations between the MCAT, TMC, and RAT and the Academycomponents for restriction in range resulted in considerably highercorrelations than those displayed in Tables 4 and 5. However, thecorrelation between the ABSR and Academy scores increased only slightly andthe correlation between the OKT and Academy scores was reduced (because thestandard deviation of OKT scores was not reduced by the selection process).
En route field training performance.
The differences between the type of services provided by en route andterminal facilities and the corresponding differences in the types oftraining provided to developmentals requires their training data to beanalyzed separately. Consequently, the analyses of training performancemeasures will be conducted separately for each option and type of facility;first for en route developmentals, then for developmentals assigned to VFRtowers, and finally for developmentals assigned to terminal radarfacilities.
OPM and Academy performance scores for en route developmentals. Table8 shows mean OPM ATCS battery and En Route Academy scores for developmentalsassigned to en route facilities. Data were excluded from analyses of enroute developmentals for those assigned to level I en route facilities orAnchorage Center.
9
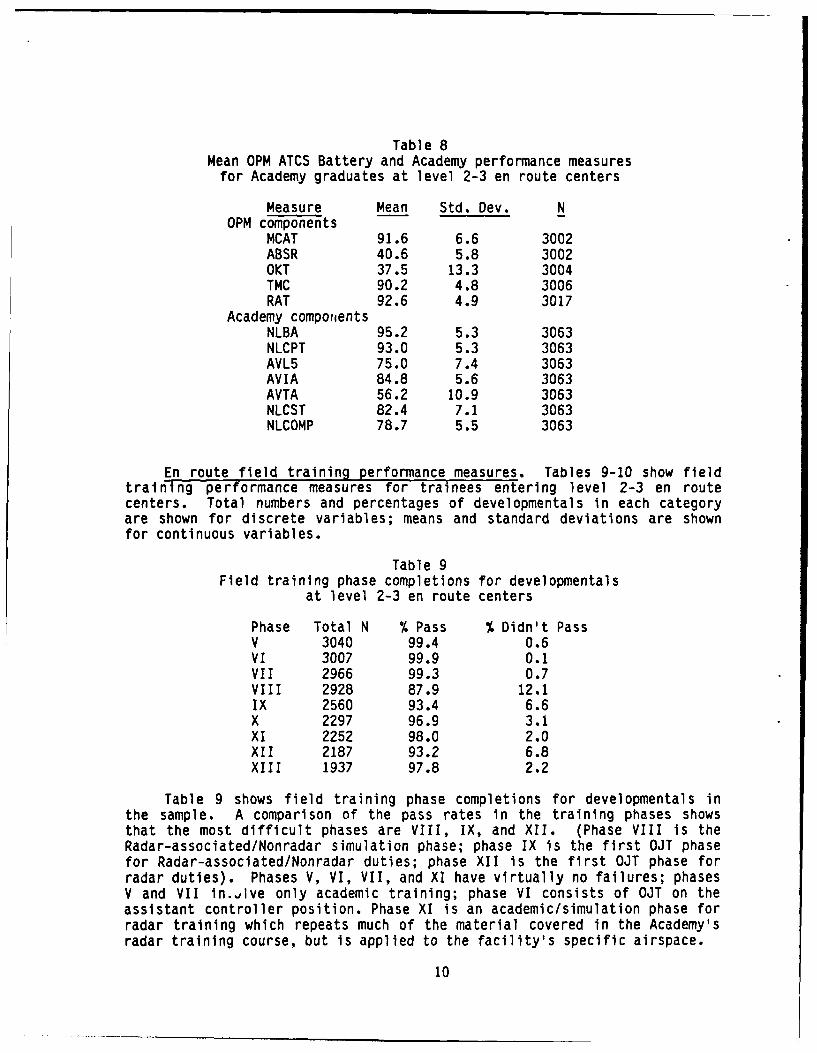
Table 8Mean OPM ATCS Battery and Academy performance measuresfor Academy graduates at level 2-3 en route centers
Measure Mean Std. Dev. NOPM components
MCAT 91.6 6.6 3002ABSR 40.6 5.8 3002OKT 37.5 13.3 3004TMC 90.2 4.8 3006RAT 92.6 4.9 3017
Academy comporientsNLBA 95.2 5.3 3063NLCPT 93.0 5.3 3063AVL5 75.0 7.4 3063AVIA 84.8 5.6 3063AVTA 56.2 10.9 3063NLCST 82.4 7.1 3063NLCOMP 78.7 5.5 3063
En route field training performance measures. Tables 9-10 show fieldtraining performance measures for trainees entering level 2-3 en routecenters. Total numbers and percentages of developmentals in each categoryare shown for discrete variables; means and standard deviations are shownfor continuous variables.
Table 9Field training phase completions for developmentals
at level 2-3 en route centers
Phase Total N % Pass % Didn't PassV 3040 99.4 0.6VI 3007 99.9 0.1VII 2966 99.3 0.7VIII 2928 87.9 12.1IX 2560 93.4 6.6X 2297 96.9 3.1XI 2252 98.0 2.0XII 2187 93.2 6.8XIII 1937 97.8 2.2
Table 9 shows field training phase completions for developmentals inthe sample. A comparison of the pass rates in the training phases showsthat the most difficult phases are VIII, IX, and XII. (Phase VIII is theRadar-associated/Nonradar simulation phase; phase IX is the first OJT phasefor Radar-associated/Nonradar duties; phase XII is the first OJT phase forradar duties). Phases V, VI, VII, and XI have virtually no failures; phasesV and VII in..lve only academic training; phase VI consists of OJT on theassistant controller position. Phase XI is an academic/simulation phase forradar training which repeats much of the material covered in the Academy'sradar training course, but is applied to the facility's specific airspace.
10

Because virtually all developmentals passed these phases and theacademic phases have consistent training times, almost no variability can beobserved in measures of training performance for these phases.Consequently, the measures of performance for phases V, VI, VII, and XI wereexcluded from further analysis.
It may also be noted by examining Table 9 that the total number ofdevelopmentals completing phase X is lower than the number completing phaseXI; a new type of training (conducted on an experimental basis from 1986until 1988, then implemented for all facilities as a optional track oftraining) has resequenced training so that phase X is not required to becompleted until after phase XII.
Table 10Continuous measures of field training performance for developmentals
at level 2-3 en route centers
Measure Mean Std. Dev. NRadar-associated/Nonradar:
Time in Ph IX 72.7 49.4 2529Hrs in Ph IX 125.7 58.6 2532Time in Ph X 131.5 111.5 2272Hrs in Ph X 137.4 89.1 2268Adj time in X 33.9 35.0 1859Adj hrs in X 34.7 30.5 1867Mean IPRA 4.0 0.6 2063
Radar:Time in Ph XII 90.9 60.2 2159Hrs in Ph XII 141.1 59.8 2157Time in Ph XIII 160.5 119.6 1929Hrs in Ph XIII 161.1 94.4 1927Adj time in XIII 41.4 34.6 1479Adj hrs in XIII 40.3 27.3 1478Mean IPRD 4.2 0.6 1695
Time to FPL (yrs) 3.0 0.6 1894
In Table 10, training times (e.g., time in phase IX) are the number ofcalendar days occurring between the beginning and the completion of a phaseof training. The number of hours in a phase is the actual number of hoursof on-the-job training (OJT) taken during the phase. Not all en routephases require OJT, but OJT phases are most frequently represented in theseanalyses (for reasons discussed above). Because the areas of specializationto which developmentals are assigned have varying numbers of sectors ofairspace (usually ranging between 5 and 8), it was necessary to adjust thetotal times spent in certain training phases for the number of sectors inthe area of specialization. In Table 10, adjusted time is the total numberof calendar days in the phase divided by the number of sectors on which thedevelopmental trained during that phase. The result is the average numberof days per sector.
11

Similarly, the adjusted number of hours in a phase is the total numberof hours divided by the number of sectors on' which the developmentaltrained, yielding the average number of OJT hours per sector. Thiscomputation is necessary for only phases X and XIII in the en route option;phases IX and XII both encompass training for the first two sectors in thearea of specialization (for the Radar-associated/Nonradar and radarpositions, respectively) and no adjustment is required.
The indication of performance (IP) is the subjective performance ratingmade by a supervisor or OJT instructor. The rater evaluates thedevelopmental's performance as compared with all other developmentals he orshe ever observed in training in a specific phase. IPs are assigned foreach phase of field training. The scale for an IP ranges from 1 (in thebottom 10% of all controllers observed in training in this phase) to 6 (inthe top 10% of all controllers observed in training in this phase). For thepurpose of these analyses, the IPs for the Radar-associated/Nonradar phases(VIII, IX, and X) were averaged to produce the IPRA variable and the IPs forthe radar phases (XI, XII, and XIII) were averaged to produce the variableIPRD.
The data represented in Table 10 suggest that developmentals do notspend all of their time in training. The number of days in trainingencompasses calendar days and not work days; the average amount of timespent in the first OJT phase is less than 3 hours per day (2.8 hours inphase IX, the first phase of Radar-associated/Nonradar OJT, and 2.6 hours inphase XII the first phase of radar OJT). For subsequent OJT phases,training time is about 2 hours or less per day (2.1 hours in phase X, thephase reflecting OJT on the remainder of the Radar-associated/Nonradarsectors, and 1.8 hours in phase XIII, the phase reflecting OJT on theremainder of the radar sectors). The data in Table 10 also suggest that ittakes longer for developmentals to complete radar OJT than nonradar.
Table 11Discrete field training performance measures for developmentals
at level 2-3 en route centers
I. Stage in training at which failure occurredTotal N % Didn't % Failed % Failed % Failed
Fail Radar Rad Assoc Asst Cont3063 71.5 7.7 20.1 0.8
(N missing=8)
II. Status in trainingTotal N % Orig % Switched % Separated
Option Options3185 69.0 15.0 16.0
(N missing=O)
The results represented in Table 11 describe the stage in training at
which failure occurred, and the final status in training for each
12
developmental. The variable describing the stage in training at whichfailure occurred is based upon data regarding phase completions, while thevariable describing status in training is based upon personnel recordsdescribing reassignments, separations, etc. Section I includes categoricalvariables describing training status; the categories included as a part ofthe "stage in training" variable are: whether failure occurred at all,occurred during radar, Radar-associated/Nonradar, or assistant controllerphases of training. This categorization is an ordinal scale measuringdegree of success in specific phases of training, because those failingradar training (during phases XI, XII, or XIII) successfully completed allearlier phases, while those failing radar associate training (VIII, IX, orX) and those who failed Assistant Controller training (V, VI, or VII)failed during the earlier and earliest stages of training, respectively.
Section II of Table 11 describes status in training. The categoriesrepresent the final disposition in training at the first facility. ATCSsare categorized as remaining in the en route option (as FPL, still intraining, or as a transfer to another en route facility before reaching FPLat the first en route facility), switching options (which usually occurs asa result of failure), and failing (and separating from the ATCS occupation).As mentioned above, those leaving for reasons unrelated to failure wereexcluded from all analyses. Again, this categorization is an ordinal scalewhere remaining in the original option is considered more desirable thanswitching options and switching options is considered more desirable thanseparating from the occupation. Switching options before reaching FPLstatus in the original option is considered less desirable than remaining inthe en route option because most switches from the en route option occur asa result of failure, generally with involve a reduction in grade, andusually with a lower maximum grade than the GS-14 allowed at level 3centers.
The percentage of developmentals in I categorized as "not failing" isslightly higher than the percentage of developmentals categorized as part ofthe original option in II. The reason for this is that not all failures oroption switches are reported with phase completions. Recall that the lossrates reported in this table should not be interpreted as representingoccupational losses, because those leaving for reasons unrelated to failure(about 4% of the total, on the average), were excluded from all analysesalong with other developmentals entering the system through pre-Academyspecial training programs or entering the system noncompetitively.
Correlations between selection procedures and measures of fieldtraining performance for en route developmentals. Table 12 showsintercorrelations between the continuous measures of field trainingperformance. The variables based on time to complete training are expectedto have positive correlations with each other if the time required to finishtraining on one sector is related to the time required to complete trainingon another sector. Variables based on time to complete training areexpected to have negative correlations with Indication of Performancevariables (IPRA and IPRD) if learning to control air traffic within a sectorquickly is considered desirable by supervisors and OJT instructors. Thecorrelations in Table 12 suggest that 1) the correlations between days and
13

hours required to complete training within any given phase are lower thanmight be expected (probably due to operational constraints of thefacilities), 2) the measures of training completion times for phasesinvolving taking OJT on the first two sectors in the area of specialization(phases IX and XII) are more highly correlated with other trainingperformance measures (both based upon training times for other phases and onsupervisor/OJT instructor ratings) than are measures of training completiontimes in subsequent OJT phases (X and XIII), even though the lattermeasures were adjusted for the number of sectors on which the developmentaltrained, and 3) the indication of performance variables (IPRA and IPRD) havefairly high correlations with most of the other training performancemeasures, even though they are based upon assessments likely to beindependent of training time.
Table 12
Intercorrelations* between measures of field training performancefor 1981-1985 En Route Academy graduates
N=(1143)
Days9 Hrs9 ADayslO AhrslO IPRA Days12 Hrs12 Adays13 Ahrs13 IPRD CertMeasure
Days9 1.0 .50 .26 .20 -.24 .39 .31 .20 .28 -.18 .28Hrs9 1.0 .16 .30 -.22 .29 .44 -.0l* .23 -.16 .06*Adays10 1.0 .38 -.07 .28 .23 .18 .20 -.07 .23AhrslO 1.0 -.04* .20 .32 .06* .27 -.03* .13IPRA 1.0 -.20 -.23 -.06* -.12 .36 -.22Days12 1.0 .51 .30 .25 -.31 .34Hrs12 1.0 .09 .42 -.28 .18Adays13 1.0 .54 -.17 .42Ahrs13 1.0 -.16 .27IPRD 1.0 -.20*Correlations are not significantly different from 0 at 2 < .01.
Also computed were Spearman Rank correlations among the categoricalmeasures of training success and between the categorical variables and thecontinuous variables. It was found that the correlation between TrainingStatus and Stage in Training at which failure occurred is .88. SpearmanRank correlations computed between the categorical variables and thecontinuous variables resulted in significant positive correlations with onlythe Indication of Performance measures [r(status,IPRA)=-.16, P < .01;r(stage, IPRA)=-.16, p < .01; r(status,IPRD)= -.12, 2 < .01; andr(stage,IPRD)=-.11, 2 < .01.] All other correlations with the categoricalmeasures are nonsignificant, except for a significant correlation with thenumber of OJT hours required to complete phase XII [r(status,Hrs12)=.07, 2 <.01; r(stage,Hrs12)=.08, 2 < .11.]
Table 13 contains correlations between OPM ATCS battery scores andmeasures of field training performance at the en route centers. It wasexpected that the OPM components would have positive correlations with theIPs, and negative correlations with measures of training times and trainingstatus. However, most correlations between OPM component tests and field
14

training performance measures are not significantly different from 0.
Notable exceptions are the correlations between the MCAT and certainmeasures of field training performance. The MCAT is significantlycorrelated with the ordinal measures of status in training and stage oftraining in which failure occurred. However, some of the significantcorrelations between the MCAT and times to complete training are in anunanticipated direction from that predicted. For example, the correlationsbetween the MCAT (and consequently, the TMC and the RAT) and times andhours to complete training in phases X and XII are positive. Othercorrelations between the MCAT and times to complete training are positive,but not significantly different from 0. Correlations between the MCAT andthe mean IP measures are both significant and positive (as expected).However, while some correlations are significantly different from 0, lessthan 3 percent of the variance in the measures of training performance isaccounted for by the OPH scores.
Table 13Correlations* between OPM ATCS battery scoresand measures of field training performancefor 1981-1985 En Route Academy graduates
Measure MCAT ABSR OKT TMC RATSpearman Rank correlationsTraining status (N=2992)Status -.12* .03 .00 -.10" -.05*When failed -.12* .03 .00 -.09* -.05*
Pearson correlationsRadar-associated/Nonradar training (N=1669)Time for Phase IX .04 .04 .01 .04 .06*Adj Time Phase X .07* .03 .03 .07* .09*Hrs for Phase IX .05 .04 .01 .06* .07*Adj hrs Phase X .11* .04 .03 .11* .13*Mean IP Ph VIII-X .11* .03 .08* .10* .10*
Radar training (N=1131):Time for Phase XII .05 .03 .00 .05 .04Adj time Phase XIII -.05 -.01 -.03 -.05 -.08*Hrs for Phase XII .08* .09* .00 .10* .10*Adj hrs Phase XIII .04 .04 .03 .05 .06Mean IP Ph XI-XIII .11* .01 .04 .10* .10*Time to FPL -.11" -.02 -.11* -.10" -.15"*Significantly different from 0 at p < .01.
Table 14 shows correlations between Academy component scores (andcourse grade) and measures of field training performance. In general, thelaboratory component scores are more predictive of the field trainingperformance measures than are the academic components. The highestcorrelations are between Academy component scores and the OJTinstructor/supervisor ratings (IPRA and IPRD), and the variables regardingstatus In training and the stage at which failure occurred. The correlation
15

between Academy component scores and the time required to attain FPL statusIs higher than the correlation with other temporal measures of trainingperformance.
With regard to Tables 13 and 14, the degree to which the predictorscorrelated with the measures of field training performance depends on thecriterion measure examined. The variables describing training status(status in training and stage of training at which failure occurred) alongwith the Indication of Performance variables are more highly correlated withthe predictor variables than are the measures based on time, although thesame patterns of predictor-criterion relationships are present for thetemporal variables.
Table 14Correlations* between Academy component scores
and measures of field training performancefor 1981-1985 En Route Academy graduates
Measure NLBA NLCPT AVL5 AVIA AVTA NLCST NLCOMPSpeaman Rank correlationsTraining Status (N=2992)Status -.05* -.04 -.24* -.25* -.22* -.08* -.24*When failed -.05* -.04* -.22* -.24* -.20* -.08* -.22*
Pearson correlationsRadar-associated/Nonradar training (N=1669)Time for Phase IX -.04 -.05 -.11 -.09* -.11" .00 -.10*Adj Time Phase X -.02 -.04 -.07* -.04 -.08* .00 -.07*Hrs for Phase IX .02 .00 -.06* -.04 -.06* -.02 -.06*Adj hrs Phase X .00 -.02 -.03 -.02 -.02 .03 -.01Mean IPRA .12* .06* .23* .24* .22* .11* .24*
Radar training (N=1131):Time for Phase XII -.05 -.02 -.13* -.12* -.13* -.08* -.14*Adj time Phase XIII -.03 -.06 -.11" -.08* -.11" -.07 -.12*Hrs for Phase XII -.03 .04 -.12* -.08* -.12* .00 -.10*Adj hrs Phase XIII .02 .00 -.11" -.08* -.11" .00 -.10*Mean IPRD .18* .04 .24* .23* .24* .07* .24*Time to FPL -.09* -.10" -.16* -.13* -.18* -.09* -.18*
*Significantly different from 0 at P < .01.
16

Tables 15 and 16 show the correlations of OPM and Academy componentscores with measures of field training performance, adjusted for restrictionin range. Table 15 contains correlations adjusting for the restriction inthe range of the OPM scores and Table 16 contains correlations adjusting forthe restriction in the range of Academy scores. When corrected forrestriction in range, RAT predicts time to attain FPL status as well as doesNLCOMP, but NLCOMP predicts the supervisor/OJT instructor ratings (IPRA andIPRD) and training status considerably better than does the RAT. Othercorrelations between the temporal performance measures and the RAT arehigher than corresponding correlations with NLCOMP, but are not in thepredicted direction. MCAT and TMC predict training status better than doesthe RAT, which is influenced by points earned on the OKT and Veteran'sPreference points, but RAT predicts other measures of field trainingperformance better than does the TMC. While the uncorrected technicalassessment (AVTA) predicts training status as well as does the instructorassessment (AVIA), correcting the correlations for restriction in rangeproduced a considerably higher correlation between AVIA and training status.
Table 15Correlations between OPM ATCS battery scoresand measures of field training performancefor 1981-1985 En Route Academy graduates
(adjusted for restriction in the range of OPM scores)
Measure MCAT ABSR OKT TMC RATTraining Status (N=2992)Status -.28 .05 .00 -.25 -.13When failed -.28 .05 .00 -.22 -.13
Radar-associated/Nonradar training (N=1669):Time for Phase IX .10 .07 .01 .10 .16Adj Time Phase X .17 .05 .03 .18 .24Hrs for Phase IX .12 .07 .01 .15 .18Adj hrs Phase X .26 .07 .03 .27 .33Mean IP Ph VIII-X .26 .05 .07 .25 .26
Radar training (N=1137):Time for Phase XII .12 .05 .00 .13 .11Adj time Phase XIII -.12 -.02 -.03 -.13 -.21Hrs for Phase XII .19 .15 .00 .25 .26Adj hrs Phase XIII .10 .07 .03 .13 .16Mean IP Ph XI-XIII .26 .02 .03 .25 .26Time to FPL -.26 -.03 -.09 -.25 -.38
17

Table 16Correlations between Academy component scoresand measures of field training performancefor 1981-1985 En Route Academy graduates
(adjusted for restriction in the range of Academy scores)
Measure NLBA NLCPT AVL5 AVIA AVTA NLCST NLCOMPTraining Status (N=2992)Status -.09 -.05 -.42 -.46 -.33 -.14 -.46When failed -.09 -.05 -.39 -.45 -.30 -.14 -.43
Radar-associated/Nonradar training (N=1669):Time for Phase IX -.07 -.06 -.20 -.18 -.17 .00 -.21Adj Time Phase X -.04 -.05 -.13 -.08 -.12 .00 -.15Hrs for Phase IX .04 .00 -.11 -.08 -.09 -.04 -.13Adj hrs Phase X .00 -.03 -.06 -.04 -.03 .05 -.02Mean IPRA .21 .08 .40 .45 .33 .19 .46
Radar training (N=1137):Time for Phase XII -.09 -.03 -.24 -.24 -.20 -.14 -.28Adj time Phase XIII -.05 -.08 -.20 -.16 -.17 -.12 -.25Hrs for Phase XII -.05 .05 -.22 -.16 -.18 .00 -.21Adj hrs Phase XIII .04 .00 -.20 -.16 -.17 .00 -.21Mean IPRD .31 .05 .42 .43 .35 .12 .46Time to FPL -.16 -.12 -.29 -.26 -.27 -.16 -.36
Terminal field training performance: VFR.
The next set of analyses addressed the training performance ofdevelopmentals who successfully completed the Terminal Academy program andentered field training at VFR towers.
Table 17Mean OPM ATCS Battery and Academy performance measures
for Terminal Academy graduates at VFR towers
Measure Mean Std. Dev. NOPM components
MCAT 89.5 6.9 694ABSR 39.0 6.3 694OKT 40.2 13.7 694TMC 88.3 5.2 696RAT 91.7 5.1 697
Academy componentsNLBA 95.5 2.9 697NLCPT 86.1 6.9 697AVL5 76.2 7.3 697AVIA 78.6 6.5 697AVTA 61.5 10.5 697NLCST 81.2 8.2 697NLCOMP 78.6 5.2 697
18

OPM and Academy performance scores for terminal developmentals assi nedto VFR towers. Table 17 shows means and standard deviations of OPM ATCSbattery and Academy component tests for developmentals assigned to VFRtowers.
VFR field training performance measures. Developmentals at VFR towers mustsuccessfully complete four phases of field training: Flight Data, ClearanceDelivery, Ground Control, and Local Control. Tables 18-20 show fieldtraining performance measures related to these phases of training fortrainees entering VFR towers. Total numbers and percentages ofdevelopmentals in each category are shown for discrete variables; means andstandard deviations are shown fcr continuous variables.
Table 18
Status in training phases at VFR towersfor 1981-1985 Terminal Academy graduates
Phase N % Passed % Didn't passFlight Data 687 99.4 0.6Clearance Deliv 675 99.1 0.8Ground Control 685 98.5 1.5Local Control 667 95.1 4.9
Table 18 shows success rates in field training at VFR towers. Acomparison of the pass rates in the training phases indicates a very lowfailure rate in every phase of VFR tower training. The phases with thehighest loss rates are Local Control and Ground Control. Data regarding theFlight Data and Clearance Delivery phases of training were eliminated fromsubsequent analyses because virtually all developmentals passed thesetraining phases.
Table 19Status in training for developmentals
at VFR towers
Total N % Orig % Switched % Switched % SeparatedFacility Facility Options
697 91.1 1.7 0.3 6.9
Table 19 shows status in training for develoomentals assigned to VFRtowers. A higher percentage of VFR tower developmentals remained in theiroriginal option than did en route developmentals. VFR tower cab duties areconsidered easier than en route duties and is reflected in grade levels:the maximum grades at VFR facilities range from GS-10 to GS-12, while atlevel 2-3 en route facilities the maximum grades range from GS-13 to GS-14.
Table 20 shows continuous measures of field training performance fordevelopmentals assigned to VFR towers. Again, time to complete phases oftraining is measured in calendar days, while hours in training are theactual number of OJT hours used to complete a training phase. Mean IPCB isthe mean Indication of Performance for all phases of tower cab training atVFR towers. Time to FPL is the number of years between EOD and completion
19

of the Local Control Phase for those who successfully completed training.It can be seen that it takes much longer to complete Local Control thanGround Control and that standard deviations of training times and hours inall training phases are very high.
Table 20Continuous measures of field training performance for developmentals
at VFR towers
Measure Mean Std. Dev. NTime in Ground ntrol 84.8 58.7 680Time in Local Control 189.1 111.2 652Hrs in Ground Control 48.7 29.4 679Hrs in Local Control 108.3 43.2 649Mean IPCB 4.1 0.9 459Time to FPL (yrs) 1.1 0.4 626
Correlations between selection procedures and measures of fieldtraining performance for developmentals at VFR towers. Table 21 showsintercorrelations between continuous measures of field training performance.Again, the correlations between times and hours required to completetraining within a phase are higher than corresponding correlations betweenphases. High correlations are observed between times required to completethe Ground Control and Local Control phases and the time to attain FPLstatus; this is not surprising because these phases comprise the majority oftower cab training at VFR towers. Correlations between training times andthe Indication of Performance measure were reasonably high.
Table 21Intercorrelations* between measures of field training performance
for 1981-1985 Terminal Academy graduates at VFR towersN=(442)
Measure DaysGC HrsGC DaysLC HrsLC IPCB FPLDaysGC 1.0 .29 .45 .18 -.27 .60HrsGC 1.0 .15 .40 -.29 .22DaysLC 1.0 .39 -.33 .87HrsLC 1.0 -.35 .38Mean IPCB 1.0 -.39Time to FPL 1.0
* All correlations are significantly different from 0
at p<.001
Also computed were Spearman Rank correlations between the categoricalmeasure of training status and the continuous measures shown above. None ofthe correlations was significantly different from 0 at the .01 level ofsignificance.
Table 22 contains correlations between OPM ATCS battery componentscores and measures of field training performance at VFR towers. As a rule,the correlations are both low and nonsignificant, with the exception of
20

correlations between the OKT score and several of the measures of fieldtraining performance. This finding was not observed for en routedevelopmentals. It is anticipated that the significant correlation betweenthe OKT scores and field training performance measures occurred fordevelopmentals in terminal and not en route facilities because the majorityof entrants having prior air traffic control experience (and consequentlyearning high OKT scores) would have ordinarily gained this experience byworking in military terminal facilities. Military facilities more closelyresemble the FAA's VFR and terminal radar facilities than they do the FAA'sen route facilities. Other positive, but nonsignificant, correlations wereobserved between the MCAT, ABSR, TMC, RAT and the temporal trainingperformance measures.
Table 22Correlations* between OPM ATCS battery scoresand measures of field training performance
for 1981-1985 Terminal Academy graduates at VFR towers
Measure MCAT ABSR OKT TMC RATSpearman Rank correlations (N=441)Status -.04 .09 -.06 .00 -.05
Pearson correlations (N=441)Days GC .06 .06 -.20* .08 -.02Hrs GC .04 .07 -.14* .06 -.01Days LC .00 .04 -.12* .02 .00Hrs LC .02 .06 .00 .04 .06Mean IPCB .02 -.11 .14* -.03 .04Time to FPL .03 .05 -.25* .04 -.03* Significantly different from 0 at p < .01.
Table 23Correlations between Academy component scores
and measures of field training performancefor 1981-1985 Terminal Academy graduates
at VFR towers
Measure NLBA NLCPT AVL5 AVIA AVTA NLCST NLCOMPSpearman Rank correlations (N=441)Status -.04 .02 -.08 -.06 -.08 .00 -.08
Pearson correlations (N=441)Days GC -.16* -.12* -.13* -.10 -.12* .04 -.12*Hrs GC -.07 -.07 -.13* -.15* -.15* .00 -.13*Days LC -.16* -.09 -.18* -.13* -.17" -.03 -.18*Hrs LC -.12* -.06 -.17* -.20* -.17* -.06 -.18*Mean IPCB .16* .12 .26* .26* .26* .03 .26*Time to FPL -.18* -.17* -.19" -.17"1 -.19* -.05 -.21** Significantly different from 0 at 2 < .01.
21

Table 23 contains correlations of the Academy component scores andcourse grade with measures of field training performance at VFR towers. Ashad been observed from the examining data from en route developmentals, theLab performance scores are fairly good predictors of field trainingperformance. The lab scores again have higher correlations with Indicationof Performance ratings (IPCB) than any other field training performancemeasure. However, for terminal developmentals at VFR towers, the Blockaverage is a fairly good predictor of field training performance; the CSTgrades are not correlated with any of the training performance measures; andstatus In training is not predicted well by any Academy component score.
Table 24Correlations between OPM ATCS battery scoresand measures of field training performance
for 1981-1985 Terminal Academy graduates at VFR towers(adjusted for restriction in the range of OPM scores)
Measure MCAT ABSR OKT TMC RATStatus -.09 .14 -.05 .00 -.13
Days GC .14 .09 -.17 .19 -.05Hrs GC .09 .11 -.12 .14 -.03Days LC .00 .06 -.10 .05 .00Hrs LC .05 .09 .00 .09 .15Mean IPCB .05 -.17 .12 -.07 .10Time to FPL .07 .08 -.21 .09 -.08
Table 25Correlations between Academy component scoresand measures of field training performance
for 1981-1985 Terminal Academy graduates at VFR towers(adjusted for restriction in the range of Academy scores)
Measure NLBA NLCPT AVL5 AVIA AVTA NLCST NLCOMPStatus -.05 .03 -.15 -.10 -.13 .00 -.17
Days GC -.21 -.15 -.23 -.17 -.19 .06 -.25Hrs GC -.09 -.09 -.23 -.25 -.24 .00 -.27Days LC -.21 -.12 -.32 -.22 -.27 -.05 -.36Hrs LC -.16 -.08 -.30 -.33 -.27 -.09 -.36Mean IPCB .21 .15 .44 .42 .40 .05 .50Time to FPL -.24 -.22 -.33 -.28 -.30 -.08 -.42
22

Tables 24 and 25 contain correlations of OPM and Academy componentscores with measures of VFR training performance, adjusted for restrictionin range. When corrected for restriction in range, the correlations betweenthe OKT and training performance measures declined because the standarddeviation of OKT scores for terminal Academy graduates is higher than thestandard deviation in the unrestricted population of applicants. Theresults suggest that Academy scores (with the exception of the CST) arebetter predictors of most measures of field training performance at VFRfacilities than are the OPM scores, although the OKT is somewhat predictiveof training performance at VFR towers, and both OPM and Academy scores arepoor predictors of VFR training status.
Terminal field training performance: Radar.
The final analyses address training performance of developmentals whosuccessfully completed the Terminal Academy program and were assigned toterminal radar facilities.
OPM and Academy performance scores for terminal developmentals assignedto radar facilities. Table 26 shows means and standard deviations of OPMATCS battery and Academy component tests for developmentals assigned toterminal radar facilities.
Table 26Mean OPM ATCS Battery and Academy performance measures
for Terminal Academy graduates at radar facilities
Measure Mean Std. Dev. NOPM components
MCAT 89.1 7.3 966ABSR 39.6 6.2 966OKT 41.4 13.4 966TMC 88.2 5.3 966RAT 91.9 5.3 966
Academy componentsNLBA 95.5 3.1 966NLCPT 86.7 7.6 966AVL5 77.7 7.5 966AVIA 79.7 6.8 966AVTA 63.9 10.8 966NLCST 81.4 8.2 966NLCOMP 79.7 5.5 966
Terminal radar field training performance measures. Tables 27-29 showfield training performance measures for trainees entering terminal radarfacilities. Total numbers and percentages of developmentals in eachcategory are shown for discrete variables; means and standard deviations areshown for continuous variables.
23
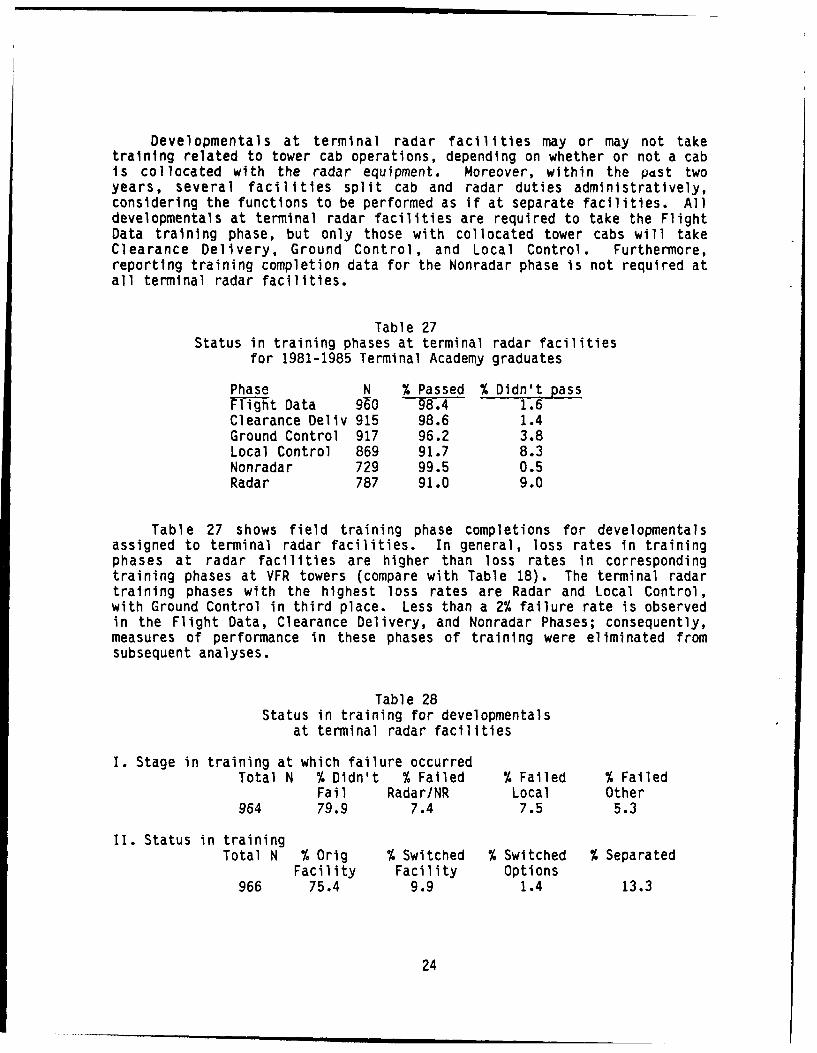
Developmentals at terminal radar facilities may or may not taketraining related to tower cab operations, depending on whether or not a cabis collocated with the radar equipment. Moreover, within the pdst twoyears, several facilities split cab and radar duties administratively,considering the functions to be performed as if at separate facilities. Alldevelopmentals at terminal radar facilities are required to take the FlightData training phase, but only those with collocated tower cabs will takeClearance Delivery, Ground Control, and Local Control. Furthermore,reporting training completion data for the Nonradar phase is not required atall terminal radar facilities.
Table 27Status in training phases at terminal radar facilities
for 1981-1985 Terminal Academy graduates
Phase N % Passed % Didn't passFlight Data 960 98.4 1.6Clearance Deliv 915 98.6 1.4Ground Control 917 96.2 3.8Local Control 869 91.7 8.3Nonradar 729 99.5 0.5Radar 787 91.0 9.0
Table 27 shows field training phase completions for developmentalsassigned to terminal radar facilities. In general, loss rates in trainingphases at radar facilities are higher than loss rates in correspondingtraining phases at VFR towers (compare with Table 18). The terminal radartraining phases with the highest loss rates are Radar and Local Control,with Ground Control in third place. Less than a 2% failure rate is observedin the Flight Data, Clearance Delivery, and Nonradar Phases; consequently,measures of performance in these phases of training were eliminated fromsubsequent analyses.
Table 28Status in training for developmentals
at terminal radar facilities
I. Stage in training at which failure occurredTotal N % Didn't % Failed % Failed % Failed
Fail Radar/NR Local Other964 79.9 7.4 7.5 5.3
II. Status in trainingTotal N % Orig % Switched % Switched % Separated
Facility Facility Options966 75.4 9.9 1.4 13.3
24

Table 28 shows status in training for developmentals assigned toterminal radar facilities. It can be seen that about 6% more developmentalsat terminal radar facilities remained at their original facility than did enroute developmentals (compare with Table 11). However, their statusdiffered after being transferred. The percentage of developmentalsseparating from the two options was comparable (13.3% for terminal radar and16.0% for en route). However, 15% of en route developmentals notsucceeding at their original facility switched options, but only 1.4% ofdevelopmentals at terminal radar facilities did so. Most terminal radarfailures who did not fail switched to another terminal facility.
Procedures for reassigning those who fail differ between the en routeand terminal options. When en route developmentals fail training, they arenot reassigned to another en route facility, because generally, most enroute facilities control the same type and complexity of traffic. En routetraining failures are usually reassigned to either terminal facilities, iffailure occurred during radar training, or to Flight Service Stations, iffailure occurred during the Radar-associated/Nonradar phases of training.
Terminal failures, however, can be reassigned to another terminalfacility because terminal facilities vary considerably in the types andcomplexities of traffic they controlled. Terminal reassignments are usuallymade from radar facilities to VFR towers, although some movement betweendifferent levels of VFR facilities may also occur. Terminal failures mayalso be separated from employment as GS-2152s, depending on the amount oftraining completed, and other factors.
Another difference between developmentals from en route and terminalradar facilities is the stage in training during which they failed. Similarpercentages of en route and terminal radar developmentals failed duringradar training (7.7% in en route as compared with 7.4% in terminal) but amuch higher percentage of en route developmentals failed Radar-associated/Nonradar training (20.1%) than any stage of terminal radartraining other than radar (12.8%).
Table 29Continuous measures of field training performance for developmentals
at terminal radar facilities
Measure Mean Std. Dev. NTime in Ground Control 91.8 56.0 907Time in Local Control 201.7 108.0 851Hrs in Ground Control 52.0 28.8 907Hrs in Local Control 101.9 37.6 852Mean IPCB 4.1 0.8 667ADays Radar 108.6 70.1 312AHrs Radar 72.5 48.1 311IPRD 4.1 1.1 732Time to FPL (yrs) 2.2 0.8 715
25

Table 29 shows continuous measures of field training performance fordevelopmentals assigned to terminal radar facilities. Again, time tocomplete phases of training is measured in calendar days, while hours intraining are the OJT hours used to complete the phase. Because someterminal radar facilities have different numbers of radar positions forwhich ATCSs are responsible, days in training and OJT hours required tocomplete training were adjusted for the number of radar positions handled bythe facility. The mean IPCB is the mean Indication of Performance for thetower cab training (Phases V-IX) while IPRD is the mean Indication ofPerformance for the radar phase. Time to FPL is the number of years fromEOD to completion of the Radar Phase for those who succesefully completedtraining.
As was the case for VFR tower training, note that it takes considerablylonger to complete the Local Control phase than Ground Control and thatstandard deviations for training times in all training phases are very high.However, the time to complete radar training is also high, despite theadjustment for the number of radar positions handled by the facility.
Correlations between selection procedures and measures of fieldtraining performance for developmentals at terminal radar facilities. Table30 shows intercorrelations between continuous measures of field trainingperformance at terminal radar facilities. Most correlations aresignificantly different from 0 at p < .01. The adjusted OJT hours for theradar phase is the variable having the lowest correlations with othermeasures of field training performance.
Table 30Intercorrelations* between measures of field training performance
for 1981-1985 Terminal Academy graduates at terminal radar facilitiesN=(223)
DaysGC HrsGC DaysLC HrsLC IPCB ADaysRD AHrsRD IPRD FPLMeasure
Days GC 1.0 .33 .67 .20 -.39 .17 .08* -.10* .38Hrs GC 1.0 .20 .40 -.31 .15* .23 -.15 .37Days LC 1.0 .32 -.38 .25 .13* -.16 .48Hrs LC 1.0 -.20 .26 .40 -.26 .19Mean IPCB 1.0 -.17 -.07* .30 -.31Days RD 1.0 .73 -.24 .23Hrs RD 1.0 -.20 .04*Mean IPRD 1.0 -.16Time to FPL 1.0*Correlations are not significantly different from 0 at p < .01.
Table 31 contains correlations between the OPM ATCS battery componentscores and measures of field training performance at terminal radarfacilities. Table 32 contains correlations between Academy component scoresand training performance measures.
26

Examination of Tables 31 and 32 shows some results similar to thoseobserved for en route developmentals. Generally, the Academy componenttest scores are better predictors of field training performance measuresthan are the OPM ATCS battery component tests. Another result similar tothat observed for en route developmentals is that the Academy laboratorymeasures and, consequently, the course grade, are better predictors of themeasures of field training performance than are the academic tests. TheABSR again is significantly correlated with the temporal performancemeasures, but not in the predicted direction. On the other hand, the OKTand RAT (as opposed to the TMC, which did not include points contributed bythe OKT) are better predictors of field training performance fordevelopmentals at terminal radar facilities than they are for en routedevelopmentals.
Academy components predict the categorical variables (Status and Stageof Training) and the Indication of Performance variables (IPCB and IPRD)better than other field training measures based upon training times.
Table 31Correlations between OPM ATCS battery scoresand measures of field training performancefor 1981-1985 terminal radar developmentals
Measure MCAT ABSR OKT TMC RATSpearman Rank correlationsTraining status (N=962)Status -.05 .04 -.09* -.03 -.08Stage of training -.05 .06 -.07 -.02 -.07
Pearson correlationsTower cab training (N=663)Days GC .00 .15* -.26* .06 -.12*Hrs GC .00 .11* -.20* .04 -.10*Days LC -.03 .12* -.18* .02 -.10*Hrs LC -.03 .09 -.10* .01 -.07Mean IPCB .03 -.03 .20* .02 .13*
Radar training (N=294)Days RD -.03 .07 -.14* .00 -.09*Hrs RD -.02 .08 -.12 .02 -.07Mean IP RD .17* -.02 .14* .13 .15*
Time to FPL -.03 .07 -.19* .00 -.16*
* Significantly different from 0 at p < .01.
27

Table 32Correlations between Academy component scores
and measures of field training performancefor 1981-1985 terminal radar developmentals
Measure NLBA NLCPT AVL5 AVIA AVTA NLCST NLCOMPSpearman Rank correlationsTraining status (N=962)Status -.12* -.Og* -.26* -.26* -.25* -.09* -.28*Stage of training -.11" -.06 -.25* -.25* -.24* -.10" -.28*
Pearson correlationsTower cab training (N=663)Days GC -.09* -.04 -.13* -.12* -.12* .01 -.12*Hrs GC -.03 .00 -.09* -.10" -.10* -.05 -.10*Days LC -.03 -.02 -.11* -.12* -.11* -.08 -.13*Hrs LC -.02 .00 -.06 -.06 -.07 -.08 -.08Mean IPCB .15* .12* .26* .28* .23* .08 .28*
Radar training (N=294)Days RD -.04 -.05 -.14* -.15* -.10 -.12 -.18*Hrs RD .01 -.03 -.04 -.03 .00 -.17* -.10Mean IPRD .08 .07 .29* .34* .28* .11 .30*
Time to FPL -.05 .00 -.13 -.19* -.10 -.03 -.12* Significantly different from 0 at 2 < .01.
Table 33Correlations between OPM ATCS battery scoresand measures of field training performancefor 1981-1985 terminal radar developmentals
(adjusted for restriction in the range of OPM scores)
Measure MCAT ABSR OKT TMC RATTraining status (N=962)Status -.11 .06 -.08 -.07 -.20Stage of training -.11 .09 -.06 -.05 -.17
Tower cab training (N=663)Days GC .00 .23 -.22 .14 -.29Hrs GC .00 .17 -.17 .09 -.24Days LC -.07 .18 -.15 .05 -.24Hrs LC -.07 .14 -.08 .02 -.17Mean IPCB .07 -.05 .17 .05 .31
Radar training (N=294)Days RD -.07 .11 -.12 .00 -.22Hrs RD -.04 .12 -.10 .05 -.17Mean IP RD .36 -.03 .12 .29 .35
Time to FPL -.07 .11 -.16 .00 -.37
28

Tables 33 and 34 contain correlations of OPM ATCS battery componentsand Academy component scores with field training performance measures,adjusted for restriction in range. When corrected for restriction in range,RAT and NLCOMP have about the same correlations with temporal measures ofthe tower cab portion of training, but NLCOMP has higher correlations withthe temporal measures of radar training, training status, and the Indicationof Performance Variables than the RAT.
Table 34Correlations between OPM ATCS battery scoresand measures of field training performancefor 1981-1985 terminal radar developmentals
(adjusted for restriction in the range of Academy scores)
Measure NLBA NLCPT AVL5 AVIA AVTA NLCST NLCOMPTraining status (N=962)Status -.15 -.11 -.43 -.40 -.38 -.14 -.51Stage of training -.14 -.07 -.42 -.39 -.36 -.16 -.51
Tower cab training (N=663)Days GC -.11 -.05 -.23 -.19 -.19 .02 -.24Hrs GC -.04 .00 -.16 -.16 -.16 -.08 -.20Days LC -.04 -.02 -.19 -.19 -.17 -.13 -.26Hrs LC -.03 .00 -.11 -.10 -.11 -.13 -.16Mean IPCB .19 .14 .43 .43 .35 -.13 .51
Radar training (N=294)Days RD -.05 -.06 -.24 -.24 -.16 -.19 -.35Hrs RD .01 -.04 -.07 -.05 .00 -.26 -.20Mean IPRD .10 .08 .47 .51 .42 .17 .54
Time to FPL -.06 .00 -.23 -.30 -.16 -.05 -.24
CONCLUSIONS
This study examined the relationships between the component test scoresfrom the OPM ATCS test battery, the component test and average laboratoryscores from the En Route and Terminal Academy screening programs, andmeasures of field training performance at three types of air trafficfacilities: en route centers, VFR towers, and terminal radar facilities.This investigation was important because no previous studies have 1)analyzed the relationship between OPM selection test scores and fieldtraining performance, and 2) compared the relative contributions of the OPMand Academy selection procedures in predicting field training performance.
The data suggest that the validity of the predictor components dependsupon the type of facility to which the developmental is assigned. Fordevelopmentals assigned to en route facilities, the MCAT has highercorrelations with field training performance measures than any other OPMtests. The OKT and ABSR do not correlate well with the criterion measures
29

obtained for en route developmentals. However, for terminal developmentals,the OKT predicts field training performance at both VFR towers and terminalradar facilities better than any other test included in the OPM battery,while the MCAT has no relationship with most measures of terminal fieldtraining performance. The OKT may predict terminal performance better thanen route because most applicants with high OKT scores gained theirexperience by working at military facilities which resemble the FAA's VFRand terminal radar facilities more closely than they resemble en routecenters. The MCAT may fail to predict terminal training performance becauseits items address the movement of aircraft at constant speed through enroute airspace and do not simulate the activities of converging aircraft.
An unusual finding for developmentals in both options is that some ofthe OPM components are correlated with the temporal measures of fieldtraining performanre in an unpredicted direction. For enroutedevelopmentals, the MCAT has significant positive correlations with severalmeasures of training times, while for terminal developmentals at radarfacilities, the ABSR has significant positive correlations with trainingtime measures. The correlations of MCAT and ABSR with other types oftraining performance measures (training status, supervisor ratings, and timeto complete training) Pre either in the anticipated direction or arenonsignificant. Additional analyses revealed that the unanticipatedrelationship between the MCAT and training times is present fordevelopmentals at facilities in only one or two regions, while thecorresponding correlations for facilities in other regions are notsignificantly different from 0. Similar results were observed for terminalradar facilities analyzed by region. Additional investigation is warrantedto clarify these complex results.
For developmentals in both options, Academy lab scores, including boththe average Technical Assessment and average Instructor Assessment, havehigher correlations with the measures of field training performance than doacademic tests. When adjusted for restriction in range, AVIA predicts enroute training status much better than does AVTA, but this relationship doesnot occur for terminal developmentals. The academic tests havenonsignificant correlations with the objective criterion measures fordevelopmentals at enroute and terminal radar facilities, but NLBA issignificantly correlated with most training performance measures for VFRtower developmentals. Significant correlations are also characteristic ofthe relationship between most of the Academy component test scores and thesubjective field performance ratings.
Academy scores appear to be much better predictors of the trainingperformance measures than do OPM scores, until the correlations are adjustedfor restriction in range. Upon analyzing the corrected correlations, itappears that the OPM rating predicts the amount of time required to completeen route and terminal radar training phases and to attain FPL status aboutas well, and for some variables, better than the corresponding Academycourse grade. (However, for en route developmentals, the direction ofprediction for all temporal variables except time to FPL is not in thepredicted direction). On the other hand, for both options, course gradepredict field supervisor/OJT instructor ratings and training status better
30

than does the OPM rating. OPM scores do not predict any measure of VFRtower training as well as the Academy course grade. Examining the terminalcorrelations adjusted for restriction in range suggested that including theABSR in the computation of the RAT may have reduced its predictability as aresult of combining the positive (though only marginally significant)correlations of ABSR with measures of training times with the correspondingnegative correlations contributed by the OKT.
The other issue that should be addressed is the relevance of themeasures of field training performance identified during this study ascriteria. Each type of measure has its flaws; with regard to measurementerror, other factors that might influence the the assigned values, andsubjectivity of measurement. Several types of measures were included in thestudy to allow comparison and evaluation of their utility. Based on theresults of the study, it appears that training status, subjectiveperformance ratings, and time to reach FPL status may be the most productivemeasures of training performance to use in future studies, but additionalresearch on this topic is warranted.
While the data are complex, it appears that it is not only appropriate,but also essential, that any analyses of training performance be conductedindependently for developmentals in each option because of disparaterelationships between predictors and criteria. It also appears that whileAcademy and OPM scores predict some measures of training performance aboutequally well, the Academy performance measures, particularly laboratoryscores, are better predictors of supervisor/OJT instructor ratings andtraining status than are OPM scores.
31

REFERENCES
Manning, C. A., Kegg, P. S., and Collins, W. E. Studies of poststrlke airtraffic control specialist trainees: II. Selection and screeningprograms. FAA Office of Aviation Medicine Report No. FAA-AM-88-3,1988.
Thorndyke, R. L.: Personnel Selection, New York: Wiley, 1949.
VanDeventer, A. D. Field training performance of FAA Academy Air TrafficControl Graduates. Presented at the annual Scientific Meeting of theAerospace Medical Association, 1981.
VanDeventer, A. D. A followup evaluation of the new aptitude testingprocedures for selection of FAA air traffic control specialists. InVanDeventer, A. D., Collins, W. E., Manning, C. A., Taylor, D. K., andBaxter, N. E. Studies of poststrike air traffic control specialisttrainees: I. Age, biographical factors, and selection test perfomancerelated to Academy training success. FAA Office of Aviation MedicineReport No. FAA-AM-84-6, 1984.
32


![FAA - Metallic Materials Properties Development and Standardization [FAA 2003]](https://img.pdfslide.us/doc/110x75/55cf9817550346d03395859c/faa-metallic-materials-properties-development-and-standardization-faa-2003.jpg)