Embed Size (px)
Citation preview

Prediction of Industrial Process Parameters using
Artificial Intelligence Algorithms
Abdelmoula Khdoudi
Artificial Intelligence for Engineering Sciences Team - IASI ENSAM-University My ISMAIL
Meknes, Morocco [email protected] [email protected]
Tawfik Masrour
Artificial Intelligence for Engineering Sciences Team - IASI ENSAM-University My ISMAIL
Meknes, Morocco [email protected]
Abstract—In the present paper, a method of defining
the industrial process parameters for a new product
using machine learning algorithms will be presented. The
study will describe how to go from the product
characteristics till the prediction of the suitable machine
parameters to produce a good quality of this product,
and this is based on an historical training dataset of
similar products with their respective process
parameters. In the first part of our study, we will focus
on the ultrasonic welding process definition, welding
parameters and on how it operate. While in second part,
we present the design and implementation of the
prediction models such multiple linear regression,
support vector regression, and we compare them to an
artificial neural networks algorithm. In the following
part, we present a new application of Convolutional
Neural Networks (CNN) to the industrial process
parameters prediction. In addition, we will propose the
generalization approach of our CNN to any prediction
problem of industrial process parameters. Finally the
results of the four methods will be interpreted and
discussed.
Keywords— Artificial Intelligence, Industrial Process,
Ultrasonic Welding, Convolutional Neural Network, Parameters Prediction.
I. INTRODUCTION
A. Motivation
The actual study present the application of machine
learning algorithms in the manufacturing field in order to
save time during the setting of machines and process
parameters for a new type of product. Generally, this activity is conducted by process engineers and it is based on previous
experience, product similarity study and comparison with old
products, physical tests of several values and the correlation
of parameters with the quality output of the desired product.
In this paper we will develop and compare, based on the
product characteristics as input data and process parameters
values as output, several machine learning models that will
help on predicting the best parameters value for a new
product. The model will learn how the parameters of the
machine changes according to different type of products
(historical dataset) and then, will be able to estimate a new parameters value for a new set of characteristics for a new
coming product.
B. Related work
In Prediction of Best Combination of Process Parameters
for Petonation Gun Coating Process Through Taguchi
Technique, K.N.Balan, et al., experimented the optimization
of D-spray coating process parameters using Taguchi method, and this in order to find the best processing
conditions and to get higher quality of coating. They
managed to define very few experiments depended on the
number and level of each factor.
In Prediction of Optimal Process Parameters for
Abrasive Assisted Drilling of SS304, Kapil Kumar, et al.,
presented a cutting parameters optimization study based on
factorial design of response methodology (RSM) in order to
improve the surface finish of stainless steel SS304 in the
abrasive assisted drilling. They carried out an analysis of
variance in order to find out the significance and percentage
contribution of process parameters. They reached an overall improvement of 10.81% in surface finish by optimizing the
spindle speed, feed rate, and slurry concentration.
Also, RSM methodology was used by B.Vijaya Sankar,
et al., in their work Prediction of Spot Welding Parameters
for Dissimilar Weld Joints. They presented a study on how to
reach a desired mechanical properties of spot weld which are
the Tensile Strength and the Hardness by optimizing the
Electrode force, Weld Current and the Weld time.
Finally, in Intelligent Prediction of Process Parameters
for Bending Forming, Shengle Ren, et al., introduced a
machine learning technique to the concept of process parameters prediction. They experimented mainly the
Artificial Neural Networks for the prediction of the pipe
forming process parameters which are the bending moment
and the boost power. They considered twelve ANN inputs
which are mainly related to the pipe characteristics, and they
reached an error value that is under 2%.
In our present study, we experiment four machine
learning algorithms in order to compare the results of each
model and its accuracy for each parameter. Also, we will
introduce a new approach of predicting the process
parameters which is the using of Convolutional Neural
Networks. The value add of using ML models is to avoid any physical experiments and save material and time. This
advantage is not present in the classical optimization
methods.
II. THE ULTRASONIC WELDING PROCESS
A. The Ultrasonic Welding System
The generator (Power Supply): it sends an alternating
current whose frequency corresponds to the vibration sought
of the welding. The converter (or transducer) which is
composed from piezoelectric ceramics: it transforms the
alternating current into mechanical vibrations [3]. The
booster: Due to their mechanical resonance frequency, they

allow to mechanically vary the amplitude of the vibration.
The sonotrode: it is the ultimate element of the chain (Fig.1)
that transmits the produced vibration and thus allows the
transfer of energy.
Fig. 1. The Ultrasonic Welding System
B. The Ultrasonic Welding Parameters
1) The Energy and the Welding Time The welding energy propagates through the material
(copper) for a certain time to ensure the weldability of the
node. Depending on the vibration amplitude of the
sonotrode, the welding pressure and the quality of the wires,
the welding time varies between 0.2 and 1.5 seconds. During the welding operation and through the first contact phase
between the wires and the welding parts - compression
process - a time of at least 0.2 seconds is required. A slow
welding time (more than 1.5 seconds) can cause overheating,
damage to the ultrasonic nodes and a significant reduction in
the service life of the wear parts.
2) Welding Pressure During the welding operation, the sonotrode apply high
frequency vibrations to the workpiece in parallel to a
working pressure that is driven by pneumatic force. The
pressure ensure a good mechanical adhesion and welding
point compression [3]. The welded point strength increase proportionally by the pressure increase but passing a certain
limit, some defects can be observed such as node burn,
welding burr or even material structure damage.
3) Welding Amplitude The amplitude represent the upward-downward
displacement of horn during the application of high
frequency vibration. The square value of the amplitude gives
the heating quantity generated at the contact surface
sonotrode/piece. With higher amplitude value, the higher is
the impact of friction and then the better is the weldability.
C. The Welding of Electrical Copper wires
In this application, the output product of the welding process is a set of wires welded together (different sections), the welding points must be consistent : resistant to a certain breaking force defined by the customer, not burned and without burrs [5]. Due to dimensional limitations of the used machine, the number of wires that can be welded is fixed to maximum five wires per side for points in bilateral welding or fifteen wires on one side (unilateral node) (Fig.2).
Fig. 2. Layout of a welding node (unilateral or bilateral)
The wires produced within the factory are in different
sections. The number of combinations that we can compose
by playing on the number of wires per node and each wire
section is huge.
D. Setting the Process Parameters for a New Product.
The actual approach used in real production to set the ultrasonic welding parameters follows some heuristic steps.
The user define some random values of Energy, Pressure and
Amplitude (generally based on personal experience), then
perform the welding operation for the new product. The node
is inspected visually and tested on the pull force machine to
check its pull force resistance. Results are rarely positive
since the first trial, that means the machine user adjust the
parameters value several times to reach the requested pull
force resistance and the aspect conformance.
The procedure of searching the best parameters is
actually costly because some major loses are unavoidable
such as machine’s energy consumed during the tests,
material rejects after pull force test for each sample, time
lose for one or two persons spending at least 20 minutes per
new product (in average 2.5 tests are performed for each new part), a new customer project can contains 80 new product.
III. DATA PREPARATION AND WORK METHOLOGY
The goal of the study is to develop a model which predict
with acceptable accuracy ‘and without the need of physical
tests’ the values of Pressure, Energy and Amplitude that
leads to a quality output product, and this, based only on
raw-material characteristics. The best candidate to develop
such efficient model is to use Machine Learning algorithms, that was demonstrated to predict with high accuracy, new
outputs and decisions by learning the hidden features in
existing data [6][7][8][9][10]. In our study, the Supervised
Learning Methods will be deployed to explore an existing
process/product dataset.
A. Data Preparation
The dataset was issued from the Ultrasonic welding
service of an electrical harness production factory. It
contains brut data on existing products (currently in
production). In some form, the product characteristics was
reported in the dataset in addition to their corresponding
ultrasonic parameters.
Fig. 3. Data structure as received from the company

Fig. 4. Data structure after manipulation and cleaning
B. Conduct of the Study
For any new product, a new set of parameters should be
defined in order to get a good welding result. Since we are
making the welding operation on the same machine with the
same operator and the same row material type, then the
parameters are a function of the product design
(characteristics). Based on our product and process
knowledge, it was not complicated to make a first analysis to
select some first set of characteristics suspected to lead to
parameters changes. This decision was also confirmed by
checking the dataset values of Energy, Pressure and
Amplitude.
By this, the selected product characteristics, that will be considered as prediction model input are the cross section value for each wire in both welding point sides.
The maximum number of wires that can be welding is
five per side for bilateral point and fifteen in one side for unilateral point. According to the physical tests, for the same
number and section of wires, the parameters are the same.
For this fact, our input table will consider only the number of
wires without taking in consideration the side. In the next
two sections, we will perform predictions based on five
models which are multiple linear regression, support vector
regression, artificial neural networks and finally an
introduction of convolutional neural networks application to
the field of multi-output regression. The 3D output
parameters are in different scales, in addition, we cannot
predict them separately because they are dependent, which mean, we should know which combination of Energy,
Amplitude and Pressures values are suitable for a new
product. This cannot be guaranteed if we predict each value
independently. However, to compare the accuracy of
different models, we will evaluate the loss value of each
parameter separately. Since it is not possible to calculate the
accuracy of a linear continuous output, and in order to
simulate the prediction accuracy of the used models, we will
refer to real process limits. The lower and upper tolerance of
±15% of each welding parameters included in the test data
should not be exceeded. That means, if the predicted value is
included in the range of tolerance (±15% of the real value), we considered it as correct prediction, and as wrong
prediction if the value is out of this process tolerance. This
limit is fixed based on company experience, that’s mean if a
change of less than 15% of any process parameter, the
quality result is not negatively impacted.
IV. PREDICTION OF PROCESS PARAMETERS USING MACHINE
LEARNING ALGORITHMS
In this section, we will present the predictive models that
we used for our study. The selected methods (Multiple
Linear Regression and Support Vector Regression) showed
better results on our case study during our pre-tests. Then we
decided to compare them with the Artificial Neural Network
algorithm and to select the one which give a better prediction
results on the validation data.
A. Multiple Linear Regression Model
The multiple regression models are mathematical models
used in many situations to study the association between
input data (exploratory factors) and a variable to explain, this
can be privileged for a description purpose and / or for a
prediction purpose as it’s the case for our study [11] [12].
The output variables of our model are the process
parameters Energy, Amplitude and Pressure, which are
dependent variables and should be predicted in parallel, this
is a characterization of Multi-Outputs Regression.
Using existing libraries of multi-output variables
regression, we managed to predict simultaneously the three
parameters of the ultrasonic welding process for a
completely new input values which are the cross section of
each wire in the welding node, and based on the prediction
table (Tab.I), we will calculate the accuracy and loss for each
parameters separately to have a better overview about the
model behavior in respect to each variable, Below is a part of
the prediction result for this model (Fig.5), following the
process tolerance limit.
TABLE I. PREDICTED PARAMETERS USING MULTIPLE LINEAR
REGRESSION MODEL
Energy
(Ws)
Amplitude
(%)
Pressure
(Bar)
241.16 68.08 1.75
663.17 83.18 2.49
212.32 67.52 1.69
301.73 69.56 1.86
299.95 70.42 1.86
1426.84 81.66 4.39
193.61 66.87 1.65
433.91 69.81 2.14
351.93 72.21 1.91
249.10 69.21 1.70
Fig. 5. Representation of real Energy vs predicted Energy values using
Multiple Linear Regression Model.
Mean Absolute Error: 30.07
Accuracy: 90%

The predicted values of Energy was considered as satisfying
since 90% of the values are inside the range of ± 15% of the
real value (Fig.6). For a comparison purpose, we calculate
also the mean-absolute-error between the predicted and real
Energy values. The loss value will be compared to the rest of
models that will be presented in the next sections.
Fig. 6. Representation of real Amplitude vs predicted Amplitude values
using Multiple Linear Regression Model.
Mean Absolute Error: 10.73
Accuracy: 70%
Fig. 7. Representation of real Pressure vs predicted Pressure values
using Multiple Linear Regression Model.
Mean Absolute Error: 0.26
Accuracy: 50%
B. Support Vector Regression
The goal in this section is to apply the concept of
Support Vector Machine for regression purpose, that means
the response variable is not a categorical variable but a
quantitative numerical variable. We are trying to do
numerical prediction using a set of attributes and to find the
relationship between the n-dimensional real vector attribute
X and the p-dimensional response variable Y (while minimizing an error). This method consist of searching for
the vectorial function f(X) which has at most, a deviation ε
with respect to the training data, and which is flat as possible
(complexity)[13]. To apply Multi-output SVR algorithm to our data, we started by defining and tuning of the standard hyper parameters which are: C=35, Kernel=Radial Basis Function,
ε=0.1 and =0.025.
We performed then the prediction test for the same data as previous section (new unseen data), which gave us the result below (Tab.II).
TABLE II. PREDICTED PARAMETERS USING SUPPORT VECTOR
REGRESSION MODEL
Energy
(Ws)
Amplitude
(%)
Pressure
(Bar)
266.58 73.81 2.12
938.99 94.67 3.44
390.16 76.52 2.07
330.58 76.71 2.29
351.03 80.27 2.33
1038.22 83.57 3.50
234.03 68.62 1.87
358.35 76.98 2.26
463.77 80.78 2.30
783.68 90.72 2.63
Fig. 8. Representation of real Energy vs predicted Energy values using
SVR Model.
Mean Absolute Error: 187.6
Accuracy: 20%
The loss value is significant for Energy parameter compared to multiple linear regression model (which has MAE=30,07),
also we can see that only 20% of prediction results are inside
the range of [-15%,+15%] compared to real Energy values
(Fig.8).
During the model tuning, different values of ‘C’ was tested, the previous prediction results concern the best C value for our data, whih is C=35.
Fig. 9. Representation of real Amplitude vs predicted Amplitude values
using SVR Model.
Mean Absolute Error: 9.08
Accuracy: 80%
For the Amplitude parameter prediction, our SVR model perform better than the Multiple Linear Regression model in term of loss value as well as the accuracy value since 80% of the predicted value are inside the defined range (Fig.9).
Fig. 10. Representation of real Pressure vs predicted Pressure values using SVR Model.

Mean Absolute Error: 0.35
Accuracy: 40%
C. Artificial Neural Networks
Artificial neural networks was studied and described in multitude research work. In short description, the goal of
ANN is to predict a Y-output (a characteristic) through a set
of input Xi data, which are called observations. One of the
ways to achieve this, highlighted by the research [14], was to
simulate the response of an "artificial" neuron to these
observations and to develop an algorithm to process and
weight the observations to predict a characteristic. We will
not develop the theoretical part of Artificial Neural Networks
since it is deeply covered in other research works [15]. Our
goal is find and apply this state of the art algorithms to new
areas and achieve better development of the concerned field.
For our case study, we fed our data to different model
architecture and checked the Mean Absolute Error value as
well as the prediction result for a new input data. Our selected model architecture is described as below (Tab.III):
TABLE III. ARCHITECTURE AND HYPERPARAMETERS OF THE ANN
MODEL
Number of inputs 15
Number of hidden layers 1
Number of outputs 3
Neurons in the hidden layer 128
Activation function Rectifier Linear Unit
Learning rate 0.003
Regularization 35%
Optimizer Stochastic Gradient Descent
TABLE IV. TREDICTED PARAMETERS USING ARTIFICIAL NEURAL
NETWORKS MODEL
Energy
(Ws)
Amplitude
(%)
Pressure
(Bar)
398.03 68.06 1.97
512.58 90.66 3.18
429.90 72.73 2.11
408.48 70.51 2.13
410.00 72.35 2.27
530.85 87.01 3.41
395.34 65.92 1.81
415.69 70.36 2.01
429.35 76.27 2.36
496.58 86.47 2.60
Fig. 11. Representation of real Energy vs predicted Energy values using
Artificial Neural Networks model.
Mean Absolute Error: 16.25
Accuracy: 90%
Our Artificial Neural Networks model shows a good accuracy with the lowest loss value compared to both previous algorithms (Fig.11), which make it the best model in Energy prediction for new data, this is also explained by the capacity of generalization obtained from the weight regularization layer that we added before the output layer.
This model shows a stable behavior after 3000 iterations (approximatly 15 secondes of training).
The prediction of Amplitude values should be improved since it still lower than both previous algorithms (Fig.12).
Fig. 12. Representation of real Amplitude vs predicted Amplitude values
using Artificial Neural Networks model.
Mean Absolute Error: 15.41
Accuracy: 40%
For the Pressure parameter prediction (Fig.13), the ANN
model shows also the lowest loss value for the new data compared to both previous methods. Even that, the multi-
output regression model still performing the best accuracy
for this prediction.
Fig. 13. Representation of real Pressure vs predicted Pressure values
using Artificial Neural Networks model.
Mean Absolute Error: 0.24
Accuracy: 40%
V. NEW APPROACH OF CONVOLUTIONAL NEURAL NETWORKS
IMPLEMENTATION FOR PROCESS PARAMETERS PREDICTION
In this section, we will experiment the application of
Convolutional Neural Networks algorithm that is mainly
used for image recognition and classification [16][17], to a
new field which is based on numerical data input and output.
In our case, both input and output are initially numerical
values (used in previous section with regression models).

The training input data represents the product
characteristics (in our case wire cross sections) for an
existing good quality finished product dataset, and the labels
(output data) are the process parameters values (in our case
Energy, Amplitude and Pressure) that are used to produce
correctly this product and in respect to quality requirement.
The approach consist of converting the input data to a
gray scaled pixels that will form a 2D image. Since our
maximum input values are 15 (case of unilateral welding
node), we decided to accept up to 16 input value for each
product. For the product that are composed by less than 16
wires, we set a value of zero in the remaining columns
(Fig.14).
Fig. 14. Conversion of products characteristics into 2D matrix
For this specific problem, the position of wires is not
considered due to their small impact on the result, which
allow us to generate more 2D images from the same product
by random permutation of matrix elements that we considered as data augmentation step (Fig.15).
Fig. 15. Data augmentation by random permutation of matrix elements (6
new generations)
To allow different convolution operations (which lead to
smaller image), we increased the scale of the input images
from 4x4 pixels into 16x16 pixels using matrix interlaced
replication .
After the data transformation to 2D matrix, data
augmentation by elements permutation (6 times for each
matrix), conversion of 2D matrix to gray scaled images and their size increase, our dataset was ready to feed our
designed CNN model.
The model is composed from two convolution layers, one
pooling layer and 2 fully connected layers. The detailed architecture is showed in Fig.16. The training outputs are
kept as numerical values and we used a rectifier linear unit in
the output layer in order to allow continuous output
prediction. We included the batch normalization during the
training phase with Stochastic Gradient Descent
optimization.
Fig. 16. The designed architecure of Convolutional Neural Networks model for industrial process parameters prediction based on product characteristics
inputs.
A regularization layer (of type Dropout with p=35%) was
used after the pooling layer in order to improve the
generalization ability of our model and to avoid the over-
fitting effect. The following figures (Fig.17, Fig.18, Fig.19)
shows the prediction results for a new input data and the
calculated error for each parameter. The CNN model is giving a good result on Energy prediction (close to the result
obtained on the ANN model). The prediction accuracy for
the Energy is 100% (inside +/-15% range) which is the best
accuracy result for all the presented methods. Also, the result
of Amplitude value prediction is more accurate than ANN
model. We can notice that the model still need more
parametrization in order to predict in a better way the
Pressure and the Amplitude values (Tab.V).
TABLE V. PREDICTED PARAMETERS USING CONVOLUTIONAL NEURAL
NETWORKS MODEL
Energy
(Ws)
Amplitude
(%)
Pressure
(Bar)
231.177 74.2211 2.00535
708.794 97.398 0.868664
210.754 71.2066 1.91596
294.413 72.5827 2.08099
279.429 76.2082 2.1896
1418.77 119.957 5.45809
168.135 62.4882 2.23339
543.234 73.8032 3.61656
324.864 69.0733 1.17486
218.227 72.7605 1.6103
Fig. 17. Representation of real Energy vs predicted Energy values using
CNN model.
Mean Absolute Error: 26.2
Accuracy: 100%
Fig. 18. Representation of real Amplitude vs predicted Amplitude values
using CNN model.
Mean Absolute Error: 11.0
Accuracy: 60%
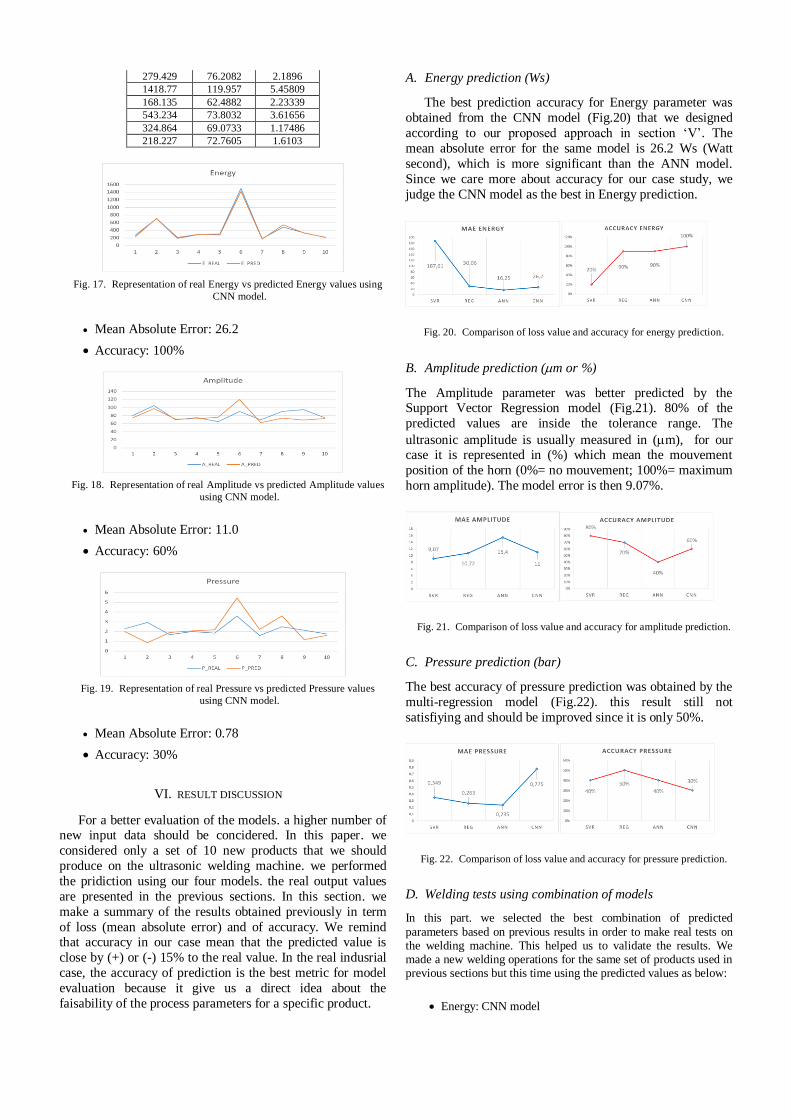
Fig. 19. Representation of real Pressure vs predicted Pressure values
using CNN model.
Mean Absolute Error: 0.78
Accuracy: 30%
VI. RESULT DISCUSSION
For a better evaluation of the models. a higher number of new input data should be concidered. In this paper. we
considered only a set of 10 new products that we should
produce on the ultrasonic welding machine. we performed
the pridiction using our four models. the real output values
are presented in the previous sections. In this section. we
make a summary of the results obtained previously in term
of loss (mean absolute error) and of accuracy. We remind that accuracy in our case mean that the predicted value is
close by (+) or (-) 15% to the real value. In the real indusrial
case, the accuracy of prediction is the best metric for model
evaluation because it give us a direct idea about the
faisability of the process parameters for a specific product.
A. Energy prediction (Ws)
The best prediction accuracy for Energy parameter was
obtained from the CNN model (Fig.20) that we designed
according to our proposed approach in section ‘V’. The
mean absolute error for the same model is 26.2 Ws (Watt
second), which is more significant than the ANN model.
Since we care more about accuracy for our case study, we
judge the CNN model as the best in Energy prediction.
Fig. 20. Comparison of loss value and accuracy for energy prediction.
B. Amplitude prediction (m or %)
The Amplitude parameter was better predicted by the Support Vector Regression model (Fig.21). 80% of the
predicted values are inside the tolerance range. The
ultrasonic amplitude is usually measured in (m), for our case it is represented in (%) which mean the mouvement
position of the horn (0%= no mouvement; 100%= maximum
horn amplitude). The model error is then 9.07%.
Fig. 21. Comparison of loss value and accuracy for amplitude prediction.
C. Pressure prediction (bar)
The best accuracy of pressure prediction was obtained by the
multi-regression model (Fig.22). this result still not
satisfiying and should be improved since it is only 50%.
Fig. 22. Comparison of loss value and accuracy for pressure prediction.
D. Welding tests using combination of models
In this part. we selected the best combination of predicted
parameters based on previous results in order to make real tests on the welding machine. This helped us to validate the results. We made a new welding operations for the same set of products used in previous sections but this time using the predicted values as below:
Energy: CNN model

Amplitude: SVR model
Pressure: Regression model
In below photos (Fig.23) we can see the tested products before and after welding.
Fig. 23. Photos of testing samples after welding
The judgement of these tests was the same as the customer requirements. which are: the pull force value, the peel force
value and the visual aspect of the welded node. For the ten
welded product. 8 products was completely conform. 2
products was not acceptable as their peel force value is a bit
under the limit (Tab.VI). also the visual aspect was not
correct (damaged copper stand).
TABLE VI. QAULITY EVALUATION OF THE WELDED SAMPLES
Visual
judgement
Pull
force
result
(N)
Pull force
treshhold
(N)
Peel
force
result
(N)
Peel force
treshhold (N)
OK 85 76 25 16
OK 500 311 118 87
OK 85 76 20 16
OK 213 201 43 45
OK 170 151 31 31
OK 465 311 90 87
N.OK 104 101 19 20
OK 115 101 23 20
OK 83 76 31 16
OK 106 101 26 20
VII. CONCLUSION
In this study, we presented two new approachs that can be further deployed in the industrial process field.
The first practice is to predict the process parameters for a
new product taking their main characteristics as input (dimension, type, material etc.). For the training data. we
used a list of different products that was previously produced
in the same process and we defined their characteristics as
training inputs. and their process parameters as training
output. Then we built different machine learning algorithms
to learn the relationship between the products characteristics
and the process parameters. As demonstration. we applied
this practice on ultrasonic welding process of copper wires.
We concluded that for our case study. different models and
algorithms can be used combinly to predict different
parameters type.
The second contribution that we intended to introduce in this
paper is an approach to use Convolutional Neural Networks
to predict industrial process parameters following the same
practice that we presented previoustly. We demonstarated
the way to built a CNN model that can predict correctly the
process parameters based on products characteristics. We also presented a generalization methology that can be
applied to any similar problem.
REFERENCES
[1] K. S. Krishnamoorthi, “Process control”, Integrated Product, Process and Enterprise Design, pp. 304-341, 1997
[2] B. Balasko, S. Nemeth, G. Nagy, J. Abonyi, “Integrated Process and
Control System Model for Product Quality Control - Application to a Polypropylene Plant”, Chemical Product and Process Modeling, vol. 3,
2008
[3] L. Breiman and J.H. Friedman, "Predicting multivariate responses in multiple linear regression." Journal of the Royal Statistical Society:
Series B (Statistical Methodology), vol. 59, pp. 3-54, 1997.
[4] L. D. Rozenberg, “Physics of the Ultrasonic Welding Process”, Physical Principles of Ultrasonic Technology, pp. 151-195, 1973
[5] D. Zhao, K. Zhao, D. Ren, X. Guo, “Ultrasonic Welding of
Magnesium–Titanium Dissimilar Metals: A Study on Influences of Welding Parameters on Mechanical Property by Experimentation and
Artificial Neural Network”, Journal of Manufacturing Science and Engineering, vol. 139, pp. 031019, 2017
[6] G. E. Cook, “Feedback and adaptive control in automated arc welding systems”, Metal Construction, vol. 13, pp.551-556, 1981.
[7] N. Gunaraj, and V. Murugan, “Prediction and control of weld
bead geometry and shape relationships in submerged arc welding of pipes”, J. Mater Process Technol, vol. 168, pp. 478-487, 2005.
[8] J. Rui Hou, "Introduction and Applications of BP Artificial Neutral
Network", Science & Technology Information, vol. 3, pp. 75-77, 2011.
[9] L. Guo, S.H. Wang, Q.M. Zhang, "Optimization and performance of fiber laser welding based on BP neural network", Applied Laser. J. Vol.
6, pp. 30-32, 2010.
[10] K. Brahma Raju, N. Harsha, V.K. Viswanadha Raju, " Prediction of Tensile Strength of Friction Stir Welded Joints Using Artificial Neural
Networks", International Journal of Engineering Research & Technology, pp. 1-5, 2012.
[11] L. Breiman and J.H. Friedman, "Predicting multivariate responses in
multiple linear regression." Journal of the Royal Statistical Society: Series B (Statistical Methodology), vol. 59, pp. 3-54, 1997.
[12] H. Borchani, G. Varando, C. Bielza, and P. Larrañaga, "A survey on multi‐output regression." Wiley Interdisciplinary Reviews: Data
Mining and Knowledge Discovery vol. 5, pp. 216-233, 2015.
[13] A. J. Smola and B. Schölkopf, “A tutorial on support vector regression”, Statistics and Computing, vol. 14, pp. 99–222, 2004.
[14] Y. LeCun, Y.Bengio, G. Hinton, “Deep Learning”, Nature-
Intetnational journal of science, vol. 521, pp. 436–444, May 2015.
[15] J. Schmidhuber ,“Deep learning in neural networks: An overview”, Elsevier Ltd, vol. 61, pp. 85-117, January 2015.
[16] Y. Le Cun, B. Boser, J. S. Denker, D. Henderson, R. E. Howard, W.
Hubbard, and L. D. Jackel, “Backpropagation applied to handwritten zip code recognition,” Neural Comput., vol. 1, pp. 541–551, 1989.
[17] C. Nebauer, “Evaluation of convolutional neural networks for visual
recognition”, IEEE Transactions on Neural Networks, vol. 9, pp. 685-696, 1998.
[18] K. Vassiljeva, E. Petlenkov, V. Vansovits and A. Tepljakov, "Artificial intelligence methods for data based modeling and analysis
of complex processes: Real life examples", Data Stream Mining & Processing (DSMP), IEEE First International Conference on. IEEE, pp.
363-368, August 2016
[19] G.E. Cook, R.J. Barnett, K. Anderson, and A.M. Strauss, “Weld modeling and control using artificial neural networks”, IEEE
Trans. Indus. Appl., vol. 31, pp. 1484-1491, 1995.
[20] D.S. Nagesh, and G.L. Datta, “Prediction of weld bead geometry and penetration in shielded metal-arc welding using artificial
neural networks”, J. Mater. Process. Technol., vol. 123, pp. 303-312, 2002.