Embed Size (px)
Citation preview
IJISET - International Journal of Innovative Science, Engineering & Technology, Vol. 2 Issue 9, September 2015.
www.ijiset.com
ISSN 2348 – 7968
Prediction of petrophysical parameters applying multi attribute analysis and probabilistic neural
network techniques of seismic data for Komombo Basin, Upper Egypt.
Othman, A. A. A. 1, Ewida, H. F. 2, Fathi, M. M. Ali 1 and Embaby, M. M. A. A.3
1 Geology Department, Faculty of Science, Al Azhar University. 2 British Petroleum Company.
3 Ganoub El Wadi Petroleum Holding Company, Cairo, Egypt.
Abstract
In this study, we use new techniques to predict well log properties from seismic data. We focus on one of the oil fields located in Komombo Basin- Upper Egypt. The major reservoir unit in the interested area consists of mainly alternating sandstone and shale sequences known as Abu Ballas Formation and Six Hills Formation. The sandstone within these Formations is occasionally is fine to medium grained. In this study we focus on the Six Hills (E) member reservoir, from the available seismic and well data we studied the reservoir characterization through conventional seismic attribute analysis. The distribution of petrophysical parameters using Multi attribute analysis were done through seismic and wells data. According to the results, the cross correlation between actual porosity derived from well logs and those estimated from Multi attribute analysis is around 72%, while the same increased to 81% when Probabilistic Neural Network (PNN) is used. The cross correlation between actual Shale content derived from well logs and estimated using Multi attribute analysis is around 65%, while the same increased to 73% when (PNN) is used. The cross correlation between actual Water Saturation derived from well logs and estimated using Multi attribute analysis is around 47%, while the same increased to 62% when (PNN) is used. Petrophysical parameters generated from the predicted seismic are found to be validated at well location. This has enhanced the confidence level in field development and may serve as a guide for further development of the area. Keywords: Komombo Basin, Multi-attribute, Neural Network
Introduction
Komombo area included Al Baraka oilfield which consider as the first oilfield discovered outside Egypt’s conventional producing areas. The concession is situated in the Komombo Basin, located 800 km south of Cairo and is characterized by multiple stacked sand reservoirs. The concession contains the producing Al Baraka oilfield, covering a development area of 50 Km2. This study aims to identify the subsurface information of the area by using seismic data and well data. This paper addresses recurrent questions in hydrocarbon reservoir characterization. What are the
638
IJISET - International Journal of Innovative Science, Engineering & Technology, Vol. 2 Issue 9, September 2015.
www.ijiset.com
ISSN 2348 – 7968
properties of rock? The other aims of this study are generate of petrophysical parameters for detailed reservoir characterization of the area. The petrophysical parameters were distributed using Multi Attributes and Probabilistic Neural Network (PNN) techniques. The data used for the present study include seismic and borehole data. The seismic data cover about (186 km2) of the area which represent part from Komombo Basin. The well data include VSP (Vertical Seismic Profiles), composite log in the form of las file format including (GR, Resistivity, Density, Sonic and Neutron) and Mud logging data for wells.
Location area and geological setting
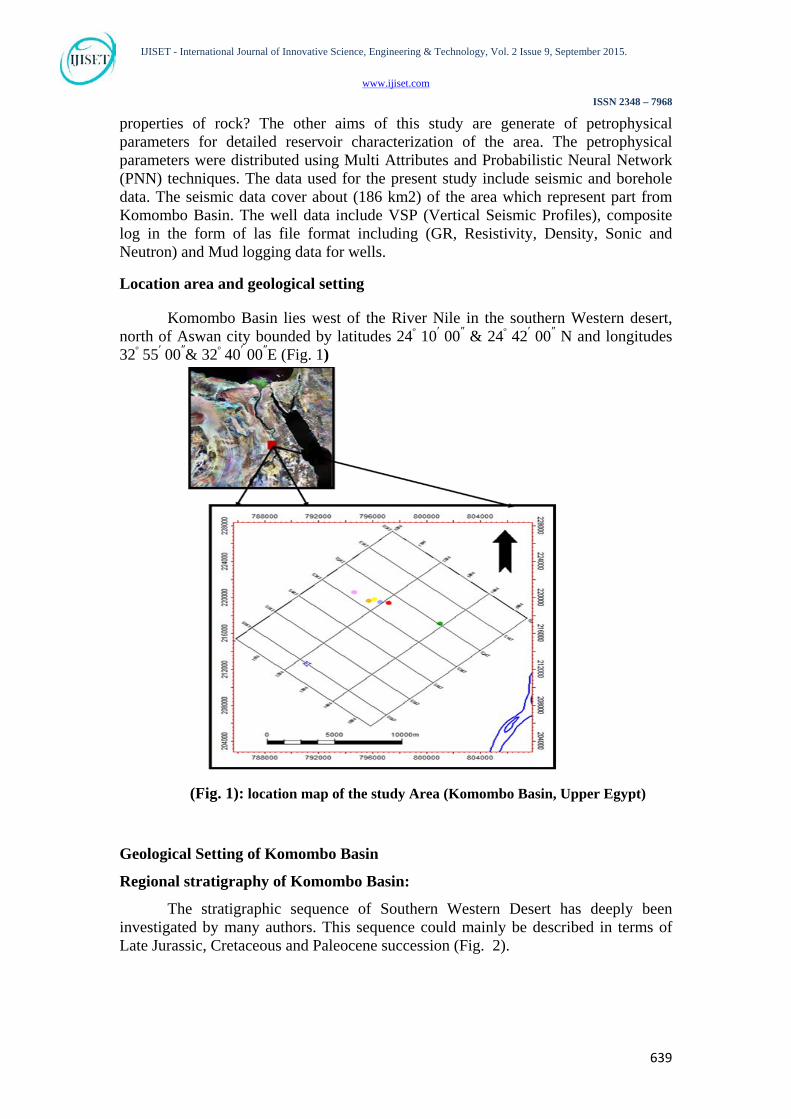
Komombo Basin lies west of the River Nile in the southern Western desert, north of Aswan city bounded by latitudes 24ᵒ 10′ 00″ & 24ᵒ 42′ 00″ N and longitudes 32ᵒ 55′ 00″& 32ᵒ 40′ 00″E (Fig. 1)
Geological Setting of Komombo Basin
Regional stratigraphy of Komombo Basin:
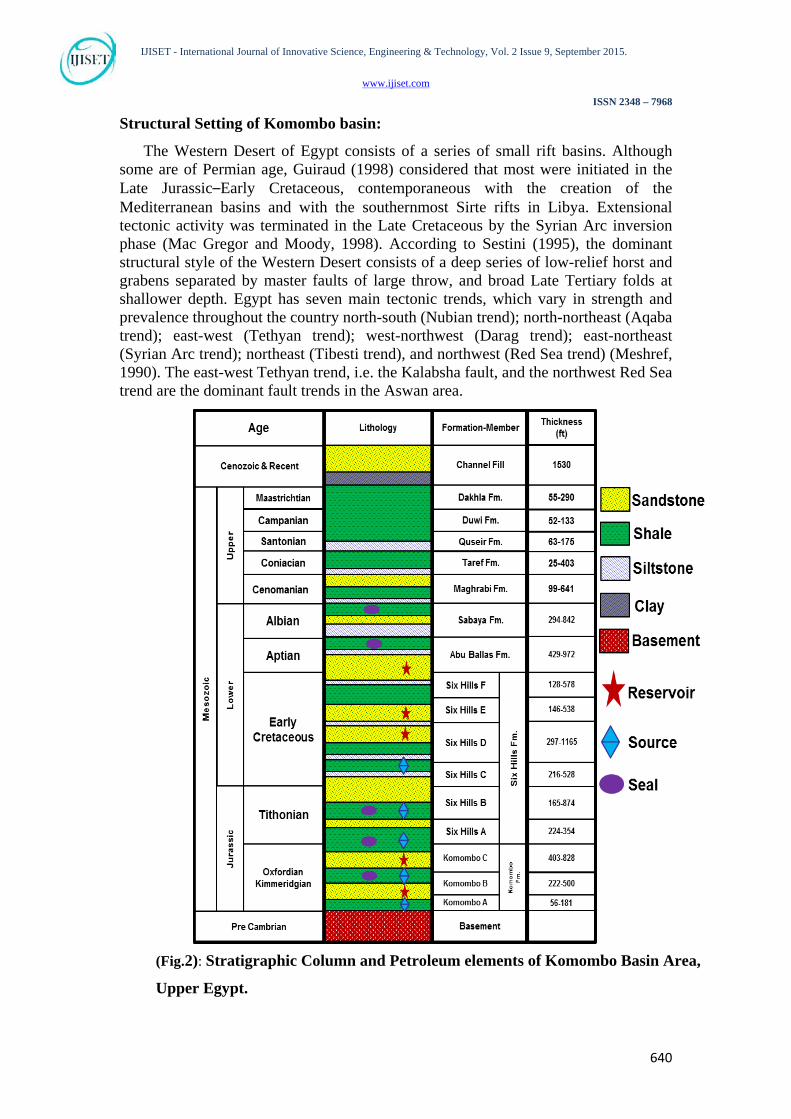
The stratigraphic sequence of Southern Western Desert has deeply been investigated by many authors. This sequence could mainly be described in terms of Late Jurassic, Cretaceous and Paleocene succession (Fig. 2).
(Fig. 1): location map of the study Area (Komombo Basin, Upper Egypt)
639
IJISET - International Journal of Innovative Science, Engineering & Technology, Vol. 2 Issue 9, September 2015.
www.ijiset.com
ISSN 2348 – 7968
(Fig.2): Stratigraphic Column and Petroleum elements of Komombo Basin Area,
Upper Egypt.
Structural Setting of Komombo basin:
The Western Desert of Egypt consists of a series of small rift basins. Although some are of Permian age, Guiraud (1998) considered that most were initiated in the Late Jurassic–Early Cretaceous, contemporaneous with the creation of the Mediterranean basins and with the southernmost Sirte rifts in Libya. Extensional tectonic activity was terminated in the Late Cretaceous by the Syrian Arc inversion phase (Mac Gregor and Moody, 1998). According to Sestini (1995), the dominant structural style of the Western Desert consists of a deep series of low-relief horst and grabens separated by master faults of large throw, and broad Late Tertiary folds at shallower depth. Egypt has seven main tectonic trends, which vary in strength and prevalence throughout the country north-south (Nubian trend); north-northeast (Aqaba trend); east-west (Tethyan trend); west-northwest (Darag trend); east-northeast (Syrian Arc trend); northeast (Tibesti trend), and northwest (Red Sea trend) (Meshref, 1990). The east-west Tethyan trend, i.e. the Kalabsha fault, and the northwest Red Sea trend are the dominant fault trends in the Aswan area.
640

IJISET - International Journal of Innovative Science, Engineering & Technology, Vol. 2 Issue 9, September 2015.
www.ijiset.com
ISSN 2348 – 7968
Depth Structural Contour Map:
a) Depth Structural contour map on the top of Six Hills E (E. Cretaceous) Member.
From the horizon and fault interpretation, structure map were produced. Structural highs are stretch over the field in the northwest direction while structural lows were observed in the southeast. (Fig. 3) is the Depth structure map of horizon Six Hills E The field fault population is characterized mostly by NW-SE trending faults that are curvy- shaped, all almost parallel to the main fault boundary. Six Hills E Member is an important reservoir in this area.
Multi attribute and neural network techniques applied for Six Hills E
Background
The idea of using multiple seismic attributes to predict petrophysical parameters was first proposed by Schultz, Ronen, Hattori and Corbett in a series of three articles in the Leading Edge. (Seismic-guided estimation of log properties, Parts 1, 2 and 3 by Schultz et al, The Leading Edge, May, June and July, 1994). In these articles, they point out that the traditional approach to using seismic data to derive reservoir parameters has consisted in looking for a physical relationship between the parameter to be mapped and some attribute of the seismic data. The integration of well-log and seismic data has been a consistent aim of geoscientists. This has become increasingly important (and successful) in recent years because of the shift from exploration to development of existing fields, with large numbers of wells penetrating them. One type of integration is forward modeling of synthetic seismic data from the logs. A second type of integration is inverse modeling of the logs from the seismic data. This is called seismic inversion and has been described by numerous authors (e.g., Lindseth, 1979; Cooke and Schneider, 1983; Oldenburg et al., 1983; and Chi et al. 1984).
F1
F2 F3
F4
F5
F6
F7
(Fig. 3): Depth Structural Contour Map on top Six Hills E (E. Cretaceous
F1
F7
F2 F3
F4
F5
F6
641
IJISET - International Journal of Innovative Science, Engineering & Technology, Vol. 2 Issue 9, September 2015.
www.ijiset.com
ISSN 2348 – 7968
Workflows for utilizing seismic data to generate petrophysical data in reservoir characterization will be shown. We are using 3D seismic dataset at Komombo Area in South western desert on the west bank of the river Nile. This public domain dataset is fairly completed with seismic and wells data: • Input 186 Km2 of 3D seismic data • Input Vertical seismic profile (VSP) for Al Baraka-1 well • Petrophysical evaluation for seven wells
• Input Formation tops for wells
• Generation of seismic volumes after applied PNN techniques
Methodology
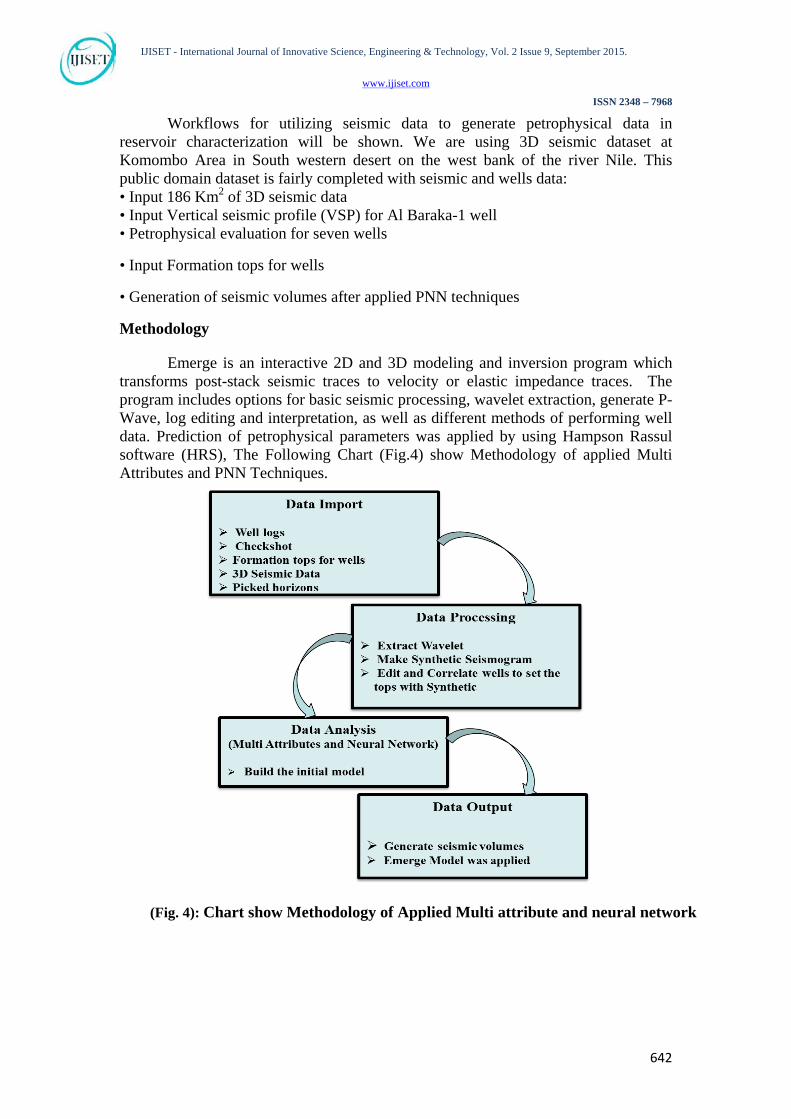
Emerge is an interactive 2D and 3D modeling and inversion program which transforms post-stack seismic traces to velocity or elastic impedance traces. The program includes options for basic seismic processing, wavelet extraction, generate P- Wave, log editing and interpretation, as well as different methods of performing well data. Prediction of petrophysical parameters was applied by using Hampson Rassul software (HRS), The Following Chart (Fig.4) show Methodology of applied Multi Attributes and PNN Techniques.
(Fig. 4): Chart show Methodology of Applied Multi attribute and neural network
642

IJISET - International Journal of Innovative Science, Engineering & Technology, Vol. 2 Issue 9, September 2015.
www.ijiset.com
ISSN 2348 – 7968
Prediction of Petrophysical Parameters:
a) Prediction of Total Porosity:
Porosity is an important property of a reservoir because hydrocarbon (oil and gas) can fill in voids of porous rocks. The prediction of reservoir properties has been continuously developed for many years. The prediction of physical properties such as porosity from empirical correlations of multivariate linear regression between seismic attributes and well log data was introduced by numerous authors (Schultz et al., 1994; Russell et al., 1997; Hampson et al., 2001). A seismic attribute analysis to estimate physical properties such as porosity, permeability and others in a reservoir were studied (Brown, 1996; Leiphart and Hart, 2001; Tebo and Hart, 2003; Calderon and Castagna, 2007).
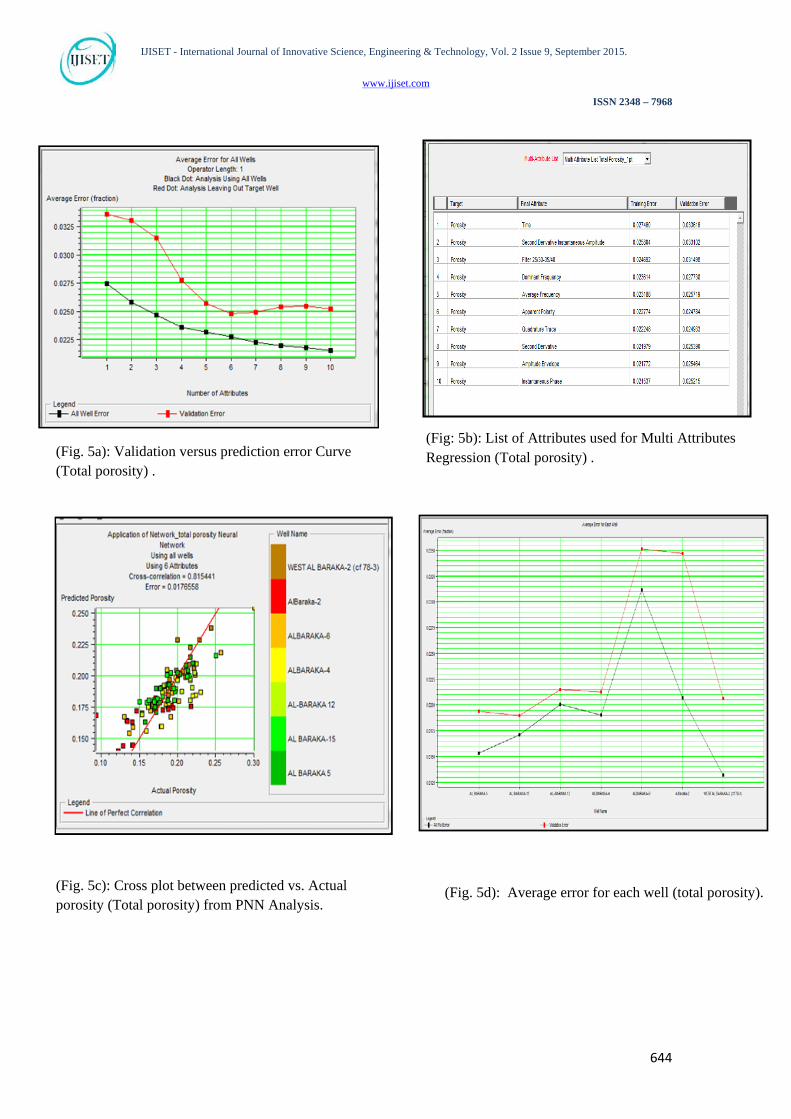
Seismic attribute analysis was applied to predict total porosity, Figures (5a,b,c and d) show examples in which a target log property, in this case total porosity, is plotted against seismic attributes. We used 6 attributes with cross correlation about 0.72 and error about 0.02, but when applying the probabilistic neural network we noticed an increase in cross correlation up to 0.81 and a decrease in error down to 0.01.
b) Prediction of Shale Content:
Seismic attribute analysis was applied to predict Shale Content, Figures (6 a,b,c and d) show examples in which a target log property, in this case Shale content, is plotted against seismic attributes. We used 4 attributes with cross correlation about 0.65 and error about 0.15, but when applying the probabilistic neural network we noticed an increase in cross correlation up to 0.73 and a decrease in error down to 0.13.
c) Prediction of Effective Porosity:
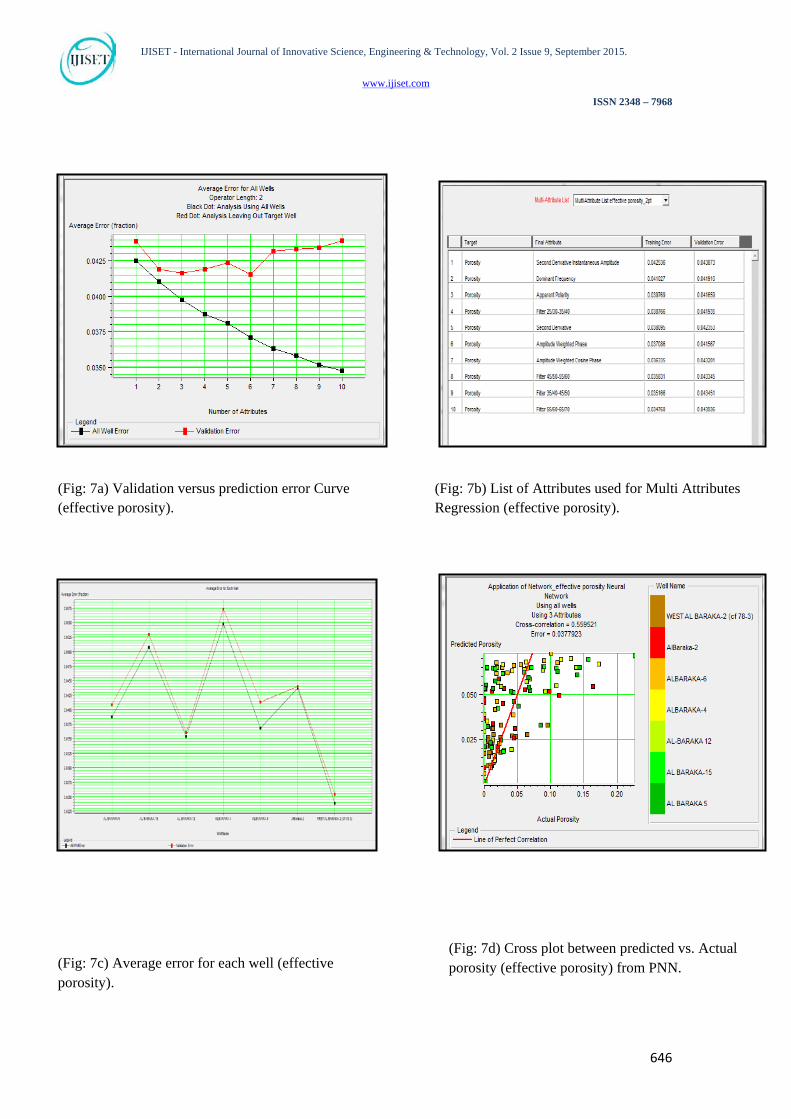
Seismic attribute analysis was applied to predict Effective Porosity Figures (7 a,b,c and d) show examples in which a target log property, in this case Effective porosity, is plotted against seismic attributes. We used 3 attributes with cross correlation about 0.47 and error about 0.039, but when applying the probabilistic neural network we noticed an increase in cross correlation up to 0.55 and a decrease in error down to 0.037.
d) Prediction of Water Saturation:
Seismic attribute analysis was applied to predict Water Saturation Figures (8 a,b,c and d) show examples in which a target log property, in this case Water saturation, is plotted against seismic attributes. We used 2 attributes with cross correlation about 0.47 and error about 0.039, but when applying the probabilistic neural network we noticed an increase in cross correlation up to 0.62 and a decrease in error down to 0.037.
643
IJISET - International Journal of Innovative Science, Engineering & Technology, Vol. 2 Issue 9, September 2015.
www.ijiset.com
ISSN 2348 – 7968
(Fig. 5d): Average error for each well (total porosity).
(Fig: 5b): List of Attributes used for Multi Attributes Regression (Total porosity) .
(Fig. 5c): Cross plot between predicted vs. Actual porosity (Total porosity) from PNN Analysis.
(Fig. 5a): Validation versus prediction error Curve (Total porosity) .
644

IJISET - International Journal of Innovative Science, Engineering & Technology, Vol. 2 Issue 9, September 2015.
www.ijiset.com
ISSN 2348 – 7968
(Fig: 6d) Cross plot between predicted vs. Actual (shale content) from PNN.
(Fig: 6b) Average error for each well (shale content).
(Fig: 6c) List of Attributes used for Multi Attributes Regression (Shale content).
(Fig: 6a) Validation versus prediction error Curve (Shale content).
645
IJISET - International Journal of Innovative Science, Engineering & Technology, Vol. 2 Issue 9, September 2015.
www.ijiset.com
ISSN 2348 – 7968
(Fig: 7c) Average error for each well (effective porosity).
(Fig: 7b) List of Attributes used for Multi Attributes Regression (effective porosity).
(Fig: 7a) Validation versus prediction error Curve (effective porosity).
(Fig: 7d) Cross plot between predicted vs. Actual porosity (effective porosity) from PNN.
646

IJISET - International Journal of Innovative Science, Engineering & Technology, Vol. 2 Issue 9, September 2015.
www.ijiset.com
ISSN 2348 – 7968
(Fig: 8d) Cross plot between predicted vs. Actual (water saturation) from PNN.
(Fig: 8b) List of Attributes used for Multi Attributes Regression (water saturation).
(Fig: 8c) Average error for each well (water saturation).
(Fig: 8a) Validation versus prediction error Curve (water saturation).
647
IJISET - International Journal of Innovative Science, Engineering & Technology, Vol. 2 Issue 9, September 2015.
www.ijiset.com
ISSN 2348 – 7968
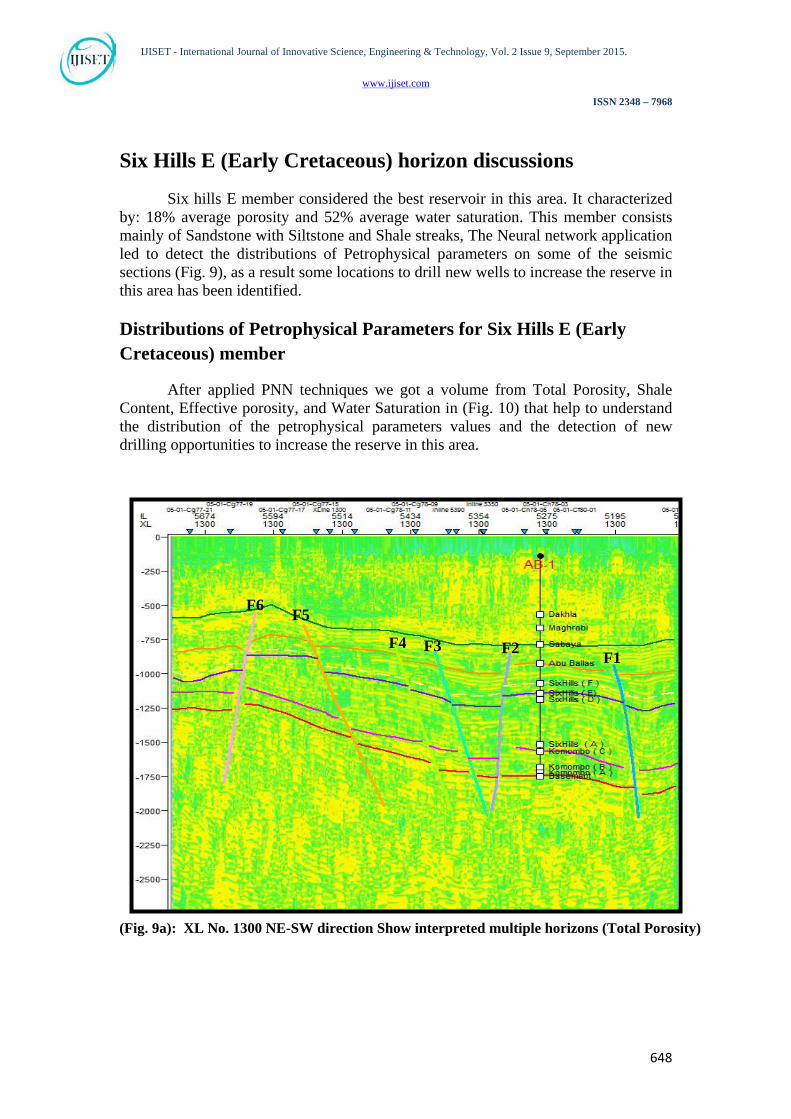
Six Hills E (Early Cretaceous) horizon discussions
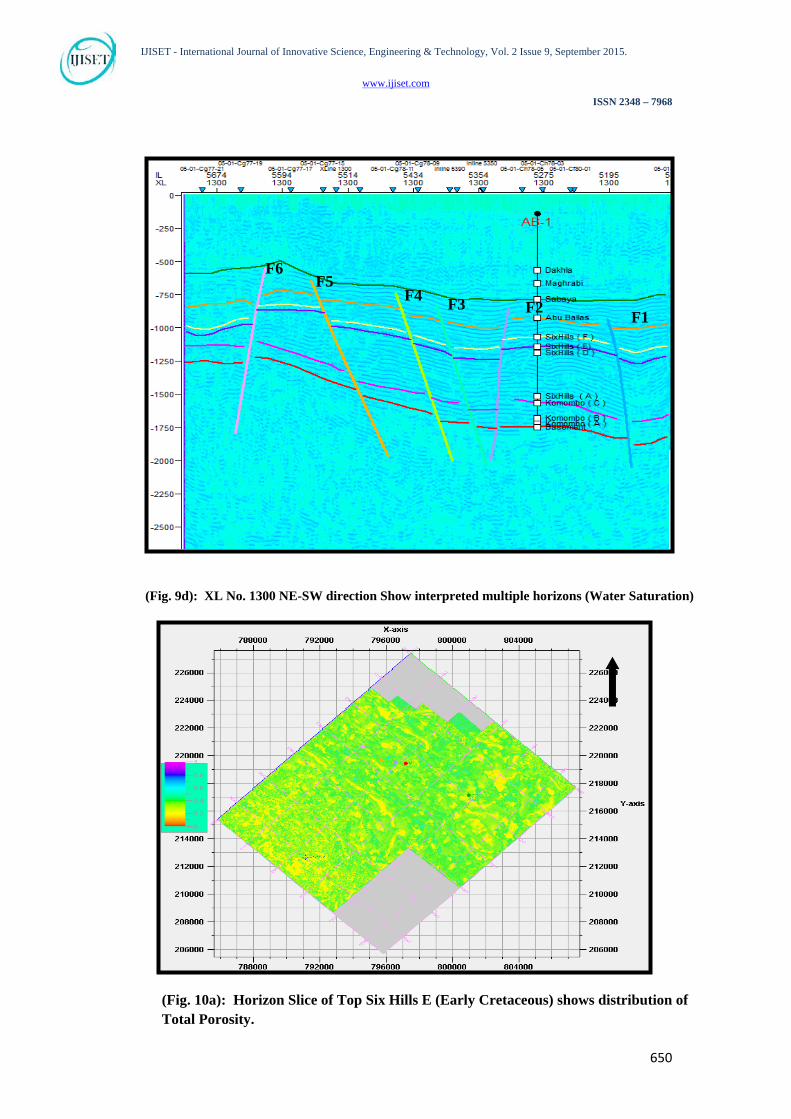
Six hills E member considered the best reservoir in this area. It characterized by: 18% average porosity and 52% average water saturation. This member consists mainly of Sandstone with Siltstone and Shale streaks, The Neural network application led to detect the distributions of Petrophysical parameters on some of the seismic sections (Fig. 9), as a result some locations to drill new wells to increase the reserve in this area has been identified.
Distributions of Petrophysical Parameters for Six Hills E (Early Cretaceous) member
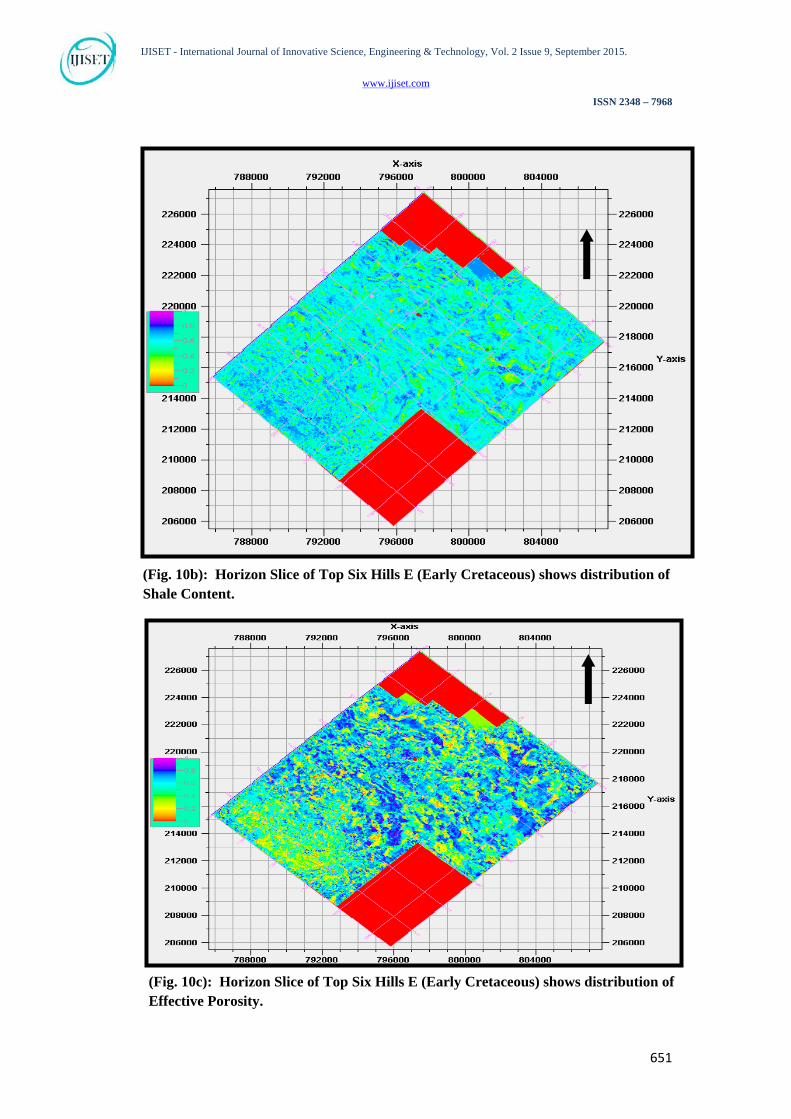
After applied PNN techniques we got a volume from Total Porosity, Shale Content, Effective porosity, and Water Saturation in (Fig. 10) that help to understand the distribution of the petrophysical parameters values and the detection of new drilling opportunities to increase the reserve in this area.
(Fig. 9a): XL No. 1300 NE-SW direction Show interpreted multiple horizons (Total Porosity)
F1 F2 F3 F4
F5 F6
648
IJISET - International Journal of Innovative Science, Engineering & Technology, Vol. 2 Issue 9, September 2015.
www.ijiset.com
ISSN 2348 – 7968
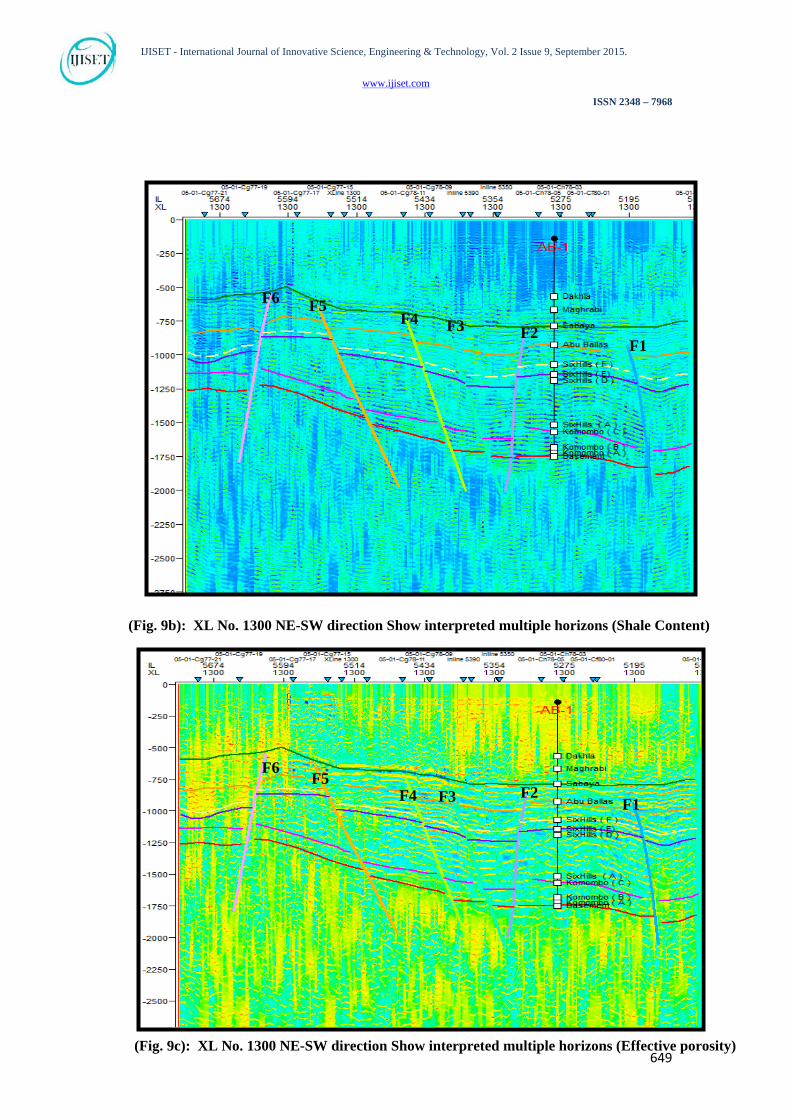
(Fig. 9c): XL No. 1300 NE-SW direction Show interpreted multiple horizons (Effective porosity)
F1 F2 F3 F4
F5 F6
F1 F2 F3 F4
F5 F6
(Fig. 9b): XL No. 1300 NE-SW direction Show interpreted multiple horizons (Shale Content)
649
IJISET - International Journal of Innovative Science, Engineering & Technology, Vol. 2 Issue 9, September 2015.
www.ijiset.com
ISSN 2348 – 7968
(Fig. 9d): XL No. 1300 NE-SW direction Show interpreted multiple horizons (Water Saturation)
(Fig. 10a): Horizon Slice of Top Six Hills E (Early Cretaceous) shows distribution of Total Porosity.
F1 F2 F3 F4 F5
F6
650
IJISET - International Journal of Innovative Science, Engineering & Technology, Vol. 2 Issue 9, September 2015.
www.ijiset.com
ISSN 2348 – 7968
(Fig. 10b): Horizon Slice of Top Six Hills E (Early Cretaceous) shows distribution of Shale Content.
(Fig. 10c): Horizon Slice of Top Six Hills E (Early Cretaceous) shows distribution of Effective Porosity.
651
IJISET - International Journal of Innovative Science, Engineering & Technology, Vol. 2 Issue 9, September 2015.
www.ijiset.com
ISSN 2348 – 7968
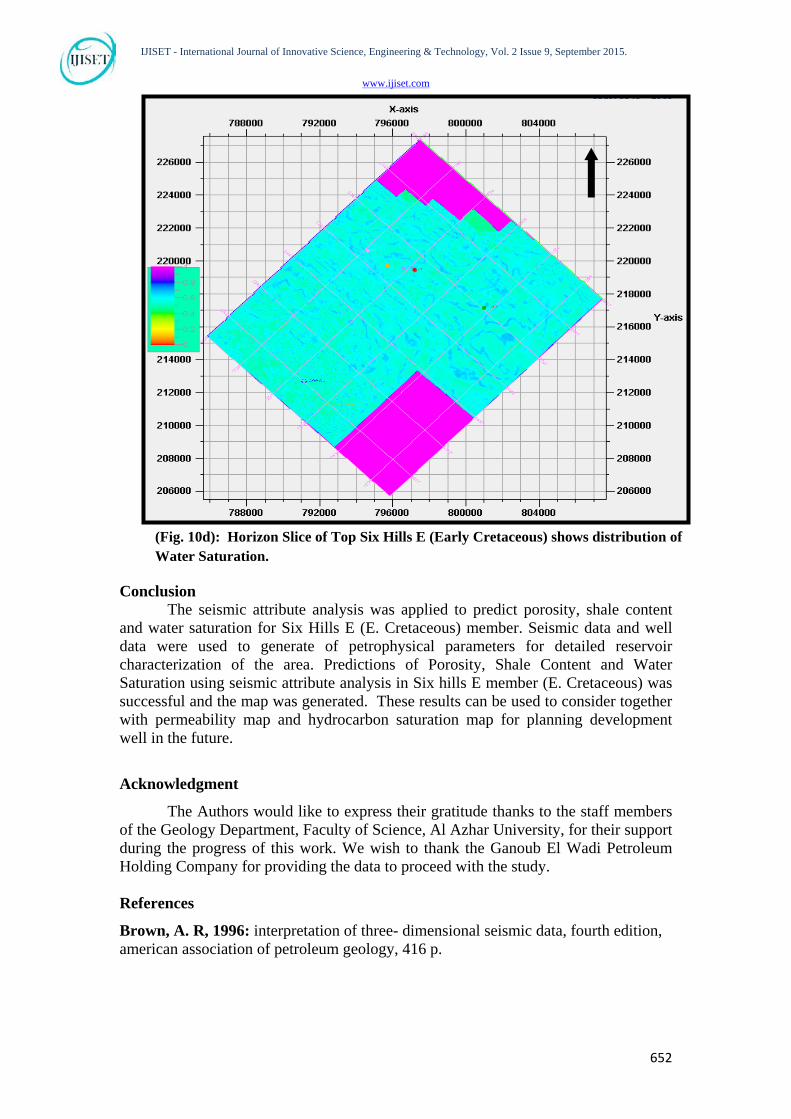
Conclusion The seismic attribute analysis was applied to predict porosity, shale content
and water saturation for Six Hills E (E. Cretaceous) member. Seismic data and well data were used to generate of petrophysical parameters for detailed reservoir characterization of the area. Predictions of Porosity, Shale Content and Water Saturation using seismic attribute analysis in Six hills E member (E. Cretaceous) was successful and the map was generated. These results can be used to consider together with permeability map and hydrocarbon saturation map for planning development well in the future.
Acknowledgment
The Authors would like to express their gratitude thanks to the staff members of the Geology Department, Faculty of Science, Al Azhar University, for their support during the progress of this work. We wish to thank the Ganoub El Wadi Petroleum Holding Company for providing the data to proceed with the study.
References
Brown, A. R, 1996: interpretation of three- dimensional seismic data, fourth edition, american association of petroleum geology, 416 p.
(Fig. 10d): Horizon Slice of Top Six Hills E (Early Cretaceous) shows distribution of Water Saturation.
652
IJISET - International Journal of Innovative Science, Engineering & Technology, Vol. 2 Issue 9, September 2015.
www.ijiset.com
ISSN 2348 – 7968
Calderon, J.E and Castagna, J., 2007: Porosity and lithologic estimation using rock physics and multi-attribute transforms in Balcon Field, Colombia, The Leading Edge 26, 142-150.
Chi, C. Y., Mendel, J. M., and Hampson, D., 1984: A computationally fast approach to maximum-likelihood deconvolution: Geophysics, 49, 550–565. Cooke,D. A., and Schneider,W. A., 1983: Generalized linear inversion of reflection seismic data: Geophysics, 48, 665–676. Guiraud, R. 1998: Mesozoic rifting and basin inversion along the northern African Tethyan margin: an overview. In D.S. Mac Gregor, R.T.J. Moody and D.D. Clark-Lowes (Eds.), Petroleum Geology of North Africa. Geological Society of London Special Publication, v. 132, p. 217-229. Hampson, D.P., Schuelke, J. S., and Quireor, J. A., 2001: Use of multi attribute transforms to predict log properties from seismic data; Geophysics, vol-66, No1,
Leiphart, D.J, and Hart, B.S, 2001: Comparison of linear regression and probabilistic Neural Network to predict porosity from 3D seismic attributes in lower Brushy Canyon Channeled sandstone, southeast New Mexico, Geophysics 66, 1349-1358.
Lindseth, R.O., 1979: Synthetic sonic logs – A process for stratigraphic interpretation: Geophysics, 44, 3-26.
MacGregor, D.S. and R.T.J. Moody 1998: Mesozoic and Cenozoic petroleum systems of North Africa. In D.S. MacGregor, R.T.J. Moody and D.D. Clark-Lowes (Eds.), Meshref, W. M, 1990: Tectonic Framework, in Said, R, ed, The Geology of Egypt: Rotterdam/Brookfield, Balkema,. pp. 113 - 155.
Schultz, P. S., Ronen, S., Hattori, M., and Corbett, C., 1994: Seismic guided estimation of log properties, parts 1, 2, and 3: The Leading Edge, 13, 305–310, 674–678 and 770–776. Sestini, G. 1995: Egypt. In H. Kulke (Ed.), Regional Petroleum Geology of the World, Part II: Africa, America, Australia and Antarctica. Berlin-Stuttgart, Gebrüder Borntraeger, p. 57-87. Tebo, J.M, and Hart, B.S, 2003: 3D seismic attribute study for reservoir characterization of carbonate buildups using a volume-based method, CSPG/CSEG Joint convention, June 2-6.
653