Embed Size (px)
Citation preview
Mutation Research, 241 (1990) 21-36 21 Elsevier
MUTGEN 01537
Prediction of carcinogenic potency from toxicological data
C.C. Travis a, S.A. Richter Pack a, m.w. Saulsbury a and M.W. Yambert b a Office of Risk Analysis, Health and Safety Research Division, Oak Ridge National Laboratory *, Oak Ridge, TN 37831-6109
and b Computing and Telecommunication Division, Oak Ridge National Laboratory *, Oak Ridge, TN 37831-6109 (U.S.A.)
(Received 5 October 1988) (Revision received 20 November 1989)
(Accepted 4 December 1989)
Keywords: Carcinogenic potency; Relative potency; Potency, carcinogenic, relative; Toxicity, acute
1. Introduction Previous studies on the relationship between
The carcinogenic potency of most hazardous substances is not well characterized. Long-term animal cancer bioassays, on which human carcino- genic potency estimates are most often based, are expensive, time-consuming and often inconclusive (Burnett and Corbett, 1987). Given the large num- ber of potential carcinogens in the environment, it is imperative that methods be developed for pre- dicting the carcinogenic potency of a compound based on results from short-term assays. This re- port presents a computerized method for predic- ting the carcinogenic potency of known mouse carcinogens using all available short-term toxico- logical data and a relative potency approach.
The submitted manuscript has been authored by a contractor of the U.S. Government under contract No. DE-AC05- 84OR21400. Accordingly, the U.S. Government retains a non- exclusive, royalty-free license to publish or reproduce the pub- lished form of this contribution, or allow others to do so, for U.S. Government purposes.
* Research sponsored by the Agency for Toxic Substances and Disease Registry under Interagency Agreement number 1857-A011-A1, applicable under Martin Marietta Energy Systems, Inc., Contract No. DE-AC05-84OR21400 with the U.S. Department of Energy.
Correspondence: Dr. Curtis Travis, Office of Risk Analysis, Health and Safety Research Division, Oak Ridge National Laboratory, P.O. Box 2008, Oak Ridge, TN 37831-6109 (U.S.A.).
carcinogenic potency of known animal carcino- gens and potency in the Ames test (McCann et al., 1988; Piegorsch and Hoel, 1988) or the LD50 (Zeise et al., 1984; Metzger et al., 1989) have shown limited correlation. The proposed method does not rely on a single type of short-term data nor on a single general assumption about the mechanism of cancer; instead it makes use of all available information on a compound's ability to express a variety of harmful effects (e.g. genotoxic- ity, cytotoxicity, reproductive effects, and chronic and subchronic tumorigenicity).
The method, which builds on proposals by Mc- Millian et al. (1980) and Jones et al. (1985, 1988), is based on relative comparisons of toxicological data from the Registry of Toxic Effects of Chem- ical Substances (RTECS) database (Sweet, 1987) developed by the National Institute of Occupa- tional Safety and Health (NIOSH). The method is currently being tested with additional databases, such as the Environmental Protection Agency's Gene-Tox database of genetic activity profiles. However, Gene-Tox reports only data from short-term genotoxic assays and thus cannot pro- vide the range of information necessary for this study. In this paper, we describe the relative potency method and its application to the predic- tion of the potency of mouse carcinogens obtained through long-term animal bioassays. At present, the method is only intended for predicting the carcinogenic potency of positive mouse carcino-
0165-1218/90/$03.50 © 1990 Elsevier Science Publishers B.V. (Biomedical Division)
22
gens; it is not intended for use in separating positive from negative carcinogens. The latter is an important problem and will be the focus of future research efforts.
2. Methodology
Following Jones et al. (1985, 1988), toxicologi- cal data for this study were obtained from RTECS (Sweet, 1987), which lists the lowest dose in a given toxicity assay reported to produce a specific effect. RTECS reports only positive data, and thus does not report on chemicals which are negative in a given assay system. RTECS only distinguishes between the presence or absence of enzyme activa- tion for mutation assays using microorganisms (i.e. Salmonella). For other short-term assays (such as sister-chromatid exchange), no such distinction is made. RTECS also lacks extensive peer-review of its data. We acknowledge that these are limita- tions of the RTECS database, but have used it because of its convenience. We note that the ultimate evaluation of the appropriateness of the RTECS database for making cancer potency estimates lies in the accuracy of the predictions.
5 different types of data are listed in RTECS: irritation, mutation, toxicity, reproductive and tumor. All but irritation were used in our analysis. RTECS reports data on the 20 most common mutation test systems. Each mutation data entry includes: (1) the short-term test system (a com- plete list of which is listed in Table 1); (2) the test species (both host and indicator organisms where applicable); (3) route of exposure for in vitro assays, and (4) measurement units. Acute toxicity data are reported as 1 of 4 endpoints: the LDLo, the lowest dose reported to produce death in a population within a given time frame; the LD50, the dose which causes death in 50% of the popula- tion; or the LCLo and LC50, which report acute toxicities in terms of inhalation concentrations. Tumorigenicity data are listed as the lowest dose to produce tumors (TDLo), and additional doses reported to have caused tumors (TD), for each route and species used in a bioassay. Reproductive toxicity data are reported as TDs by route, species, and dosing regime, which are very specific for reproductive tests (see Sweet, 1987).
We used the reciprocal of the mouse TD50 (Peto et al., 1984; Sawyer et al., 1984; Gold et al., 1984, 1986, 1987), the lifetime dose rate that will halve the lifetime probabili ty of remaining tumor- less, as the measure of mouse carcinogenic potency.
In the case of tumors at multiple sites, we used the TD50 representing the target organ with the lowest TD50. To qualify for our study, a chemical had to: (1) have a statistically significant ( P < 0.05) mouse TD50, and (2) have at least 6 data entries in RTECS in common with our composite reference standard. 156 compounds qualified for the study.
The reference standard To evaluate the battery of toxicological data,
we used a relative potency approach. Relative potency ( R P ) is a concept used to standardize disparate data to a common scale. It is most often defined as the ratio of the dose of a reference compound (DR) to the dose of a test compound (DT), required to produce a specific result in a given assay, or
R P = D R / D T
When a reference and test compound have been tested in multiple assays, we define the relative potency as the geometric mean of the relative potencies in the individual test assays. Thus, if two chemicals, C R and C T, have test results (TiR, TiT ) in a sequence of test systems, then the relative potency of the two compounds is the geometric mean of the ratios TiR/TIT.
Relative potency methods have traditionally been based upon a single compound reference standard: benzo[a]pyrene [B(a)P] (McMillian et al., 1980; Holland et al., 1981; Jones et al., 1985, 1988). In some cases (Jones et al., 1985, 1988), additional compounds are chosen as secondary references to allow matches to test chemicals to be made where data gaps occur for B(a)P. A possible alternative to choosing a single compound refer- ence standard is to utilize data from several com- pounds to define a reference standard.
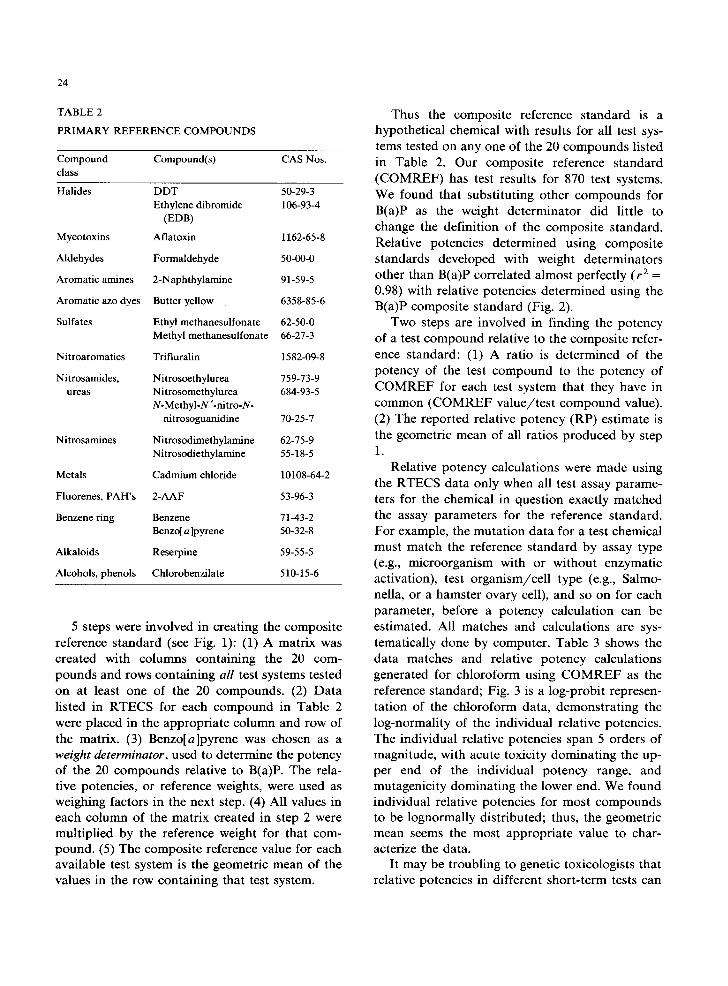
Using 20 thoroughly tested compounds, we created a Composite Reference Standard. The 20 compounds (Table 2) were chosen because each contains enough data in RTECS to qualify as a
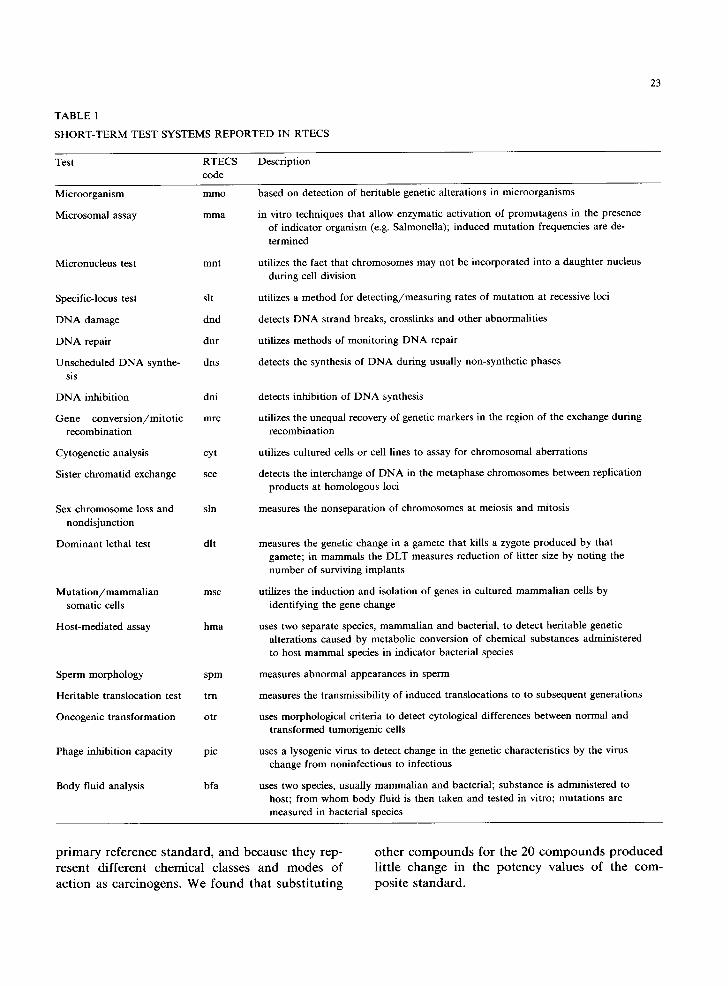
TABLE 1
SHORT-TERM TEST SYSTEMS REPORTED IN RTECS
23
Test RTECS Description code
Microorganism mmo
Microsomal assay mma
Micronucleus test mnt
Specific-locus test sit
DNA damage dnd
DNA repair dnr
Unscheduled DNA synthe- dns sis
DNA inhibition dni
Gene convers ion/mitot ic mrc recombination
Cytogenetic analysis cyt
Sister chromatid exchange sce
Sex chromosome loss and sin nondisjunction
Dominant lethal test dlt
Mutat ion/mammalian msc somatic cells
Host-mediated assay hma
Sperm morphology spm
Heritable translocation test trn
Oncogenic transformation otr
Phage inhibition capacity pic
Body fluid analysis bfa
based on detection of heritable genetic alterations in microorganisms
in vitro techniques that allow enzymatic activation of promutagens in the presence of indicator organism (e.g. Salmonella); induced mutation frequencies are de- termined
utilizes the fact that chromosomes may not be incorporated into a daughter nucleus during cell division
utilizes a method for detecting/measuring rates of mutation at recessive loci
detects DNA strand breaks, crosslinks and other abnormalities
utilizes methods of monitoring DNA repair
detects the synthesis of DNA during usually non-synthetic phases
detects inhibition of DNA synthesis
utilizes the unequal recovery of genetic markers in the region of the exchange during recombination
utilizes cultured cells or cell lines to assay for chromosomal aberrations
detects the interchange of DNA in the metaphase chromosomes between replication products at homologous loci
measures the nonseparation of chromosomes at meiosis and mitosis
measures the genetic change in a gamete that kills a zygote produced by that gamete; in mammals the DLT measures reduction of litter size by noting the number of surviving implants
utilizes the induction and isolation of genes in cultured mammalian cells by identifying the gene change
uses two separate species, mammalian and bacterial, to detect heritable genetic alterations caused by metabohc conversion of chemical substances administered to host mammal species in indicator bacterial species
measures abnormal appearances in sperm
measures the transmissibility of induced translocations to to subsequent generations
uses morphological criteria to detect cytological differences between normal and transformed tumorigenic cells
uses a lysogenic virus to detect change in the genetic characteristics by the virus change from noninfectious to infectious
uses two species, usually mammalian and bacterial; substance is administered to host; from whom body fluid is then taken and tested in vitro; mutations are measured in bacterial species
p r i m a r y r e f e r e n c e s t a n d a r d , a n d b e c a u s e t h e y r e p -
r e s e n t d i f f e r e n t c h e m i c a l c l a s s e s a n d m o d e s o f
a c t i o n as c a r c i n o g e n s . W e f o u n d t h a t s u b s t i t u t i n g
o t h e r c o m p o u n d s f o r t h e 20 c o m p o u n d s p r o d u c e d
l i t t l e c h a n g e in t h e p o t e n c y v a l u e s o f t h e c o m -
p o s i t e s t a n d a r d .
24
TABLE 2
PRIMARY REFERENCE COMPOUNDS
Compound Compound(s) CAS Nos. class
Halides DDT 50-29-3 Ethylene dibromide 106-93-4
(EDB)
Mycotoxins Aflatoxin 1162-65-8
Aldehydes Formaldehyde 50-00-0
Aromatic amines 2-Naphthylamine 91-59-5
Aromatic azo dyes Butter yellow 6358-85-6
Sulfates Ethyl methanesulfonate 62-50-0 Methyl methanesulfonate 66-27-3
Nitroaromatics Trifluralin 1582-09-8
Nitrosamides, Nitrosoethylurea 759-73-9 ureas Nitrosomethylurea 684-93-5
N-Methyl-N '-nitro-N- nitrosoguanidine 70-25-7
Nitrosamines Nitrosodimethylamine 62-75-9 Nitrosodiethylamine 55-18-5
Metals Cadmium chloride 10108-64-2
Fluorenes, PAH's 2-AAF 53-96-3
Benzene ring Benzene 71-43-2 Benzol a]pyrene 50-32-8
Alkaloids Reserpine 59-55-5
Alcohols, phenols Chlorobenzilate 510-15-6
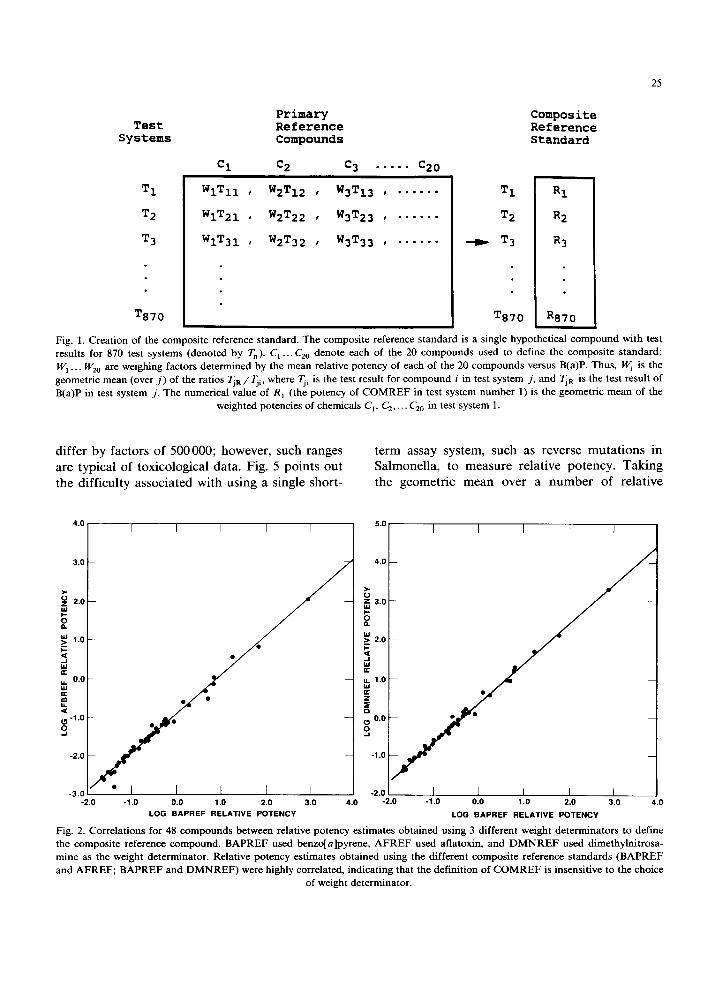
5 steps were involved in creating the composite reference standard (see Fig. 1): (1) A matrix was created with columns containing the 20 com- pounds and rows containing all test systems tested on at least one of the 20 compounds. (2) Data listed in RTECS for each compound in Table 2 were placed in the appropriate column and row of the matrix. (3) Benzo[a]pyrene was chosen as a weight determinator, used to determine the potency of the 20 compounds relative to B(a)P. The rela- tive potencies, or reference weights, were used as weighing factors in the next step. (4) All values in each column of the matrix created in step 2 were multiplied by the reference weight for that com- pound. (5) The composite reference value for each available test system is the geometric mean of the values in the row containing that test system.
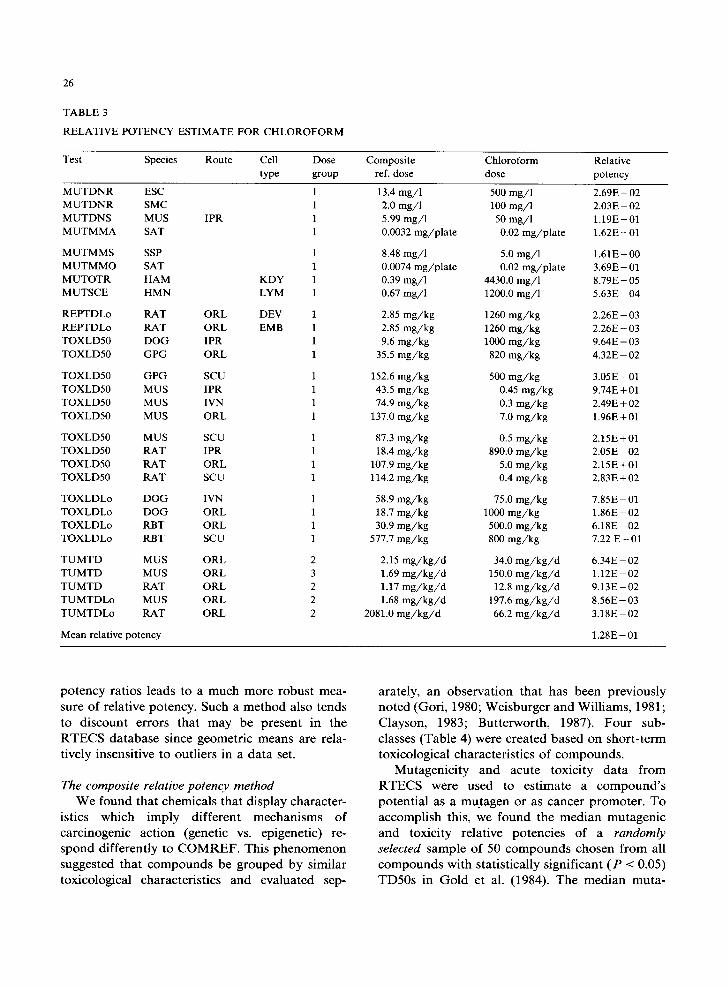
Thus the composite reference standard is a hypothetical chemical with results for all test sys- tems tested on any one of the 20 compounds listed in Table 2. Our composite reference standard (COMREF) has test results for 870 test systems. We found that substituting other compounds for B(a)P as the weight determinator did little to change the definition of the composite standard. Relative potencies determined using composite standards developed with weight determinators other than B(a)P correlated almost perfectly ( r 2 = 0.98) with relative potencies determined using the B(a)P composite standard (Fig. 2).
Two steps are involved in finding the potency of a test compound relative to the composite refer- ence standard: (1) A ratio is determined of the potency of the test compound to the potency of C O M R E F for each test system that they have in common (COMREF value/ tes t compound value). (2) The reported relative potency (RP) estimate is the geometric mean of all ratios produced by step 1.
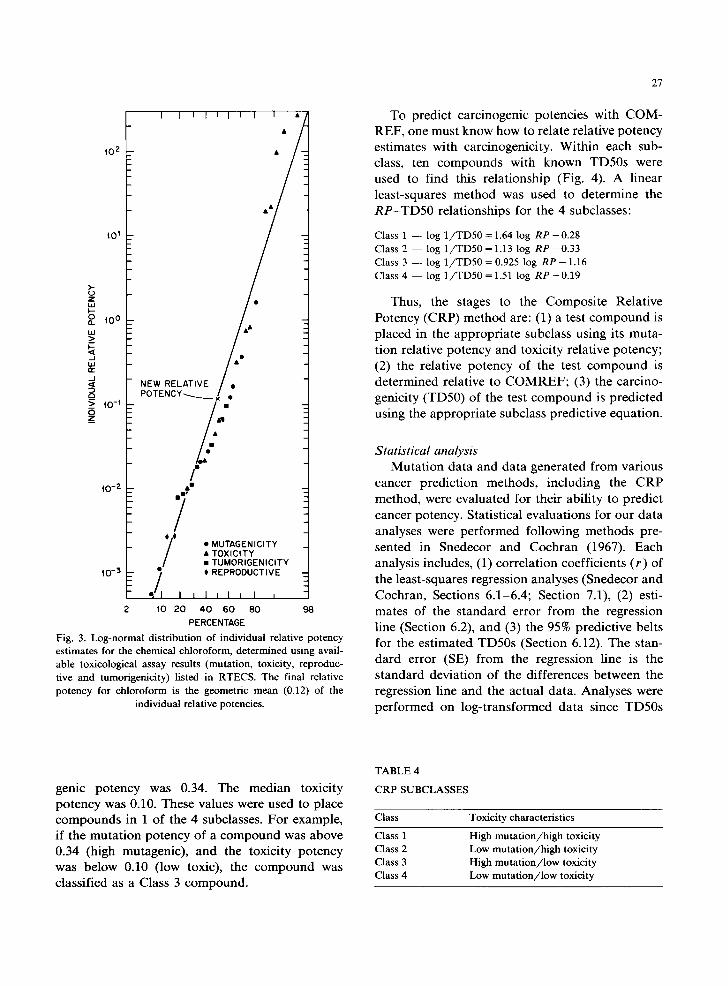
Relative potency calculations were made using the RTECS data only when all test assay parame- ters for the chemical in question exactly matched the assay parameters for the reference standard. For example, the mutation data for a test chemical must match the reference standard by assay type (e.g., microorganism with or without enzymatic activation), test organism/cel l type (e.g., Salmo- nella, or a hamster ovary cell), and so on for each parameter, before a potency calculation can be estimated. All matches and calculations are sys- tematically done by computer. Table 3 shows the data matches and relative potency calculations generated for chloroform using C O M R E F as the reference standard; Fig. 3 is a log-probit represen- tation of the chloroform data, demonstrat ing the log-normality of the individual relative potencies. The individual relative potencies span 5 orders of magnitude, with acute toxicity dominating the up- per end of the individual potency range, and mutagenicity dominating the lower end. We found individual relative potencies for most compounds to be lognormally distributed; thus, the geometric mean seems the most appropriate value to char- acterize the data.
It may be troubling to genetic toxicologists that relative potencies in different short-term tests can
25
Test Systems
T 1
T 2
T 3
T870
Primary Reference Compounds
C1 C 2 C 3 ..... C20
WIT11 , W2TI2 , W3TI3 , ......
WIT21 , W2T22 , W3T23 , ......
WIT31 , W2T32 , W3T33 , ......
T 1
T 2
T 3
T870
Composite Reference Standard
R 1
R 2
R 3
R870
Fig. 1. Creation of the composite reference standard. The composite reference standard is a single hypothetical com ~ound with test results for 870 test systems (denoted by Tn). C 1 ... C20 denote each of the 20 compounds used to define the com)osite standard; W1... W2o are weighing factors determined by the mean relative potency of each of the 20 compounds versus B(a)P. Thus, W i is the geometric mean (over j ) of the ratios TjR/Tji, where Tji is the test result for compound i in test system j, and TjR is the test result of B(a)P in test system j. The numerical value of R l (the potency of COMREF in test system number 1) is the geometric mean of the
weighted potencies of chemicals C l, C 2 .... C20 in test system 1.
d i f f e r b y f a c t o r s o f 5 0 0 0 0 0 ; h o w e v e r , s u c h r a n g e s
a r e t y p i c a l o f t o x i c o l o g i c a l d a t a . Fig. 5 p o i n t s o u t
t h e d i f f i c u l t y a s s o c i a t e d w i t h u s i n g a s ing le s h o r t -
t e r m a s s a y s y s t e m , s u c h as r e v e r s e m u t a t i o n s i n
S a l m o n e l l a , to m e a s u r e r e l a t i v e p o t e n c y . T a k i n g
t h e g e o m e t r i c m e a n o v e r a n u m b e r o f r e l a t i v e
' ' ' ' ' /
I =o ~.oF J -I
Y 4 0'o.,.oL .S-- o/ j -
-2.0 -1.0 0.0 1.0 2.0 3.0 4.0 LOG BAPREF RELATIVE POTENCY
s . 0 [ I I I I I
/
4.0
3.0
2.0
1.0
l " iO r f
I / " I I I I I -2.0 -2.0 -1.0 0.0 1.0 2.0 3.0 4.0
LOG BAPREF RELATIVE POTENCY
Fig. 2. Correlations for 48 compounds between relative potency estimates obtained using 3 different weight determinators to define the composite reference compound. BAPREF used benzo[a]pyrene, AFREF used aflatoxin, and DMNREF used dimethylnitrosa- mine as the weight determinator. Relative potency estimates obtained using the different composite reference standards (BAPREF and AFREF; BAPREF and DMNREF) were highly correlated, indicating that the definition of COMREF is insensitive to the choice
of weight determinator.
26
TABLE 3
RELATIVE POTENCY ESTIMATE FOR CHLOROFORM
Test Species Route Cell Dose Composite Chloroform Relative type group ref. dose dose potency
MUTDNR ESC 1 13.4 mg/ l 500 mg/1 2.69E-02 MUTDNR SMC 1 2.0 mg/l 100 mg/1 2.03E-02 MUTDNS MUS IPR 1 5.99 mg/1 50 mg/ l 1.19E- 01 MUTMMA SAT 1 0.0032 mg/plate 0.02 mg/plate 1.62E-01
MUTMMS SSP 1 8.48 mg/ l 5.0 mg/1 1.61E+00 MUTMMO SAT 1 0.0074 mg/plate 0.02 mg/plate 3.69E- 01 MUTOTR HAM KDY 1 0.39 mg/1 4430.0 mg/1 8.79E- 05 MUTSCE HMN LYM 1 0.67 mg/ l 1200.0 mg/1 5.63E- 04
REPTDLo RAT ORL DEV 1 2.85 mg/kg 1260 mg/kg 2.26E-03 REPTDLo RAT ORL EMB 1 2.85 mg/kg 1260 mg/kg 2.26E-03 TOXLD50 DOG IPR 1 9.6 mg/kg 1000 mg/kg 9.64E- 03 TOXLD50 GPG ORL 1 35.5 mg/kg 820 mg/kg 4.32E- 02
TOXLDS0 GPG SCU 1 152.6 mg/kg 500 mg/kg 3.05 E - 01 TOXLD50 MUS IPR 1 43.5 mg/kg 0.45 mg/kg 9.74E + 01 TOXLDS0 MUS IVN 1 74.9 mg/kg 0.3 mg/kg 2.49E + 02 TOXLDS0 MUS ORL 1 137.0 mg/kg 7.0 mg/kg 1.96E + 01
TOXLD50 MUS SCU 1 87.3 mg/kg 0.5 mg/kg 2.15E + 01 TOXLD50 RAT IPR 1 18.4 mg/kg 890.0 mg/kg 2.05E-02 TOXLD50 RAT ORL 1 107.9 mg/kg 5.0 mg/kg 2.15E + 01 TOXLDS0 RAT SCU 1 114.2 mg/kg 0.4 mg/kg 2.83E + 02
TOXLDLo DOG IVN 1 58.9 mg/kg 75.0 mg/kg 7.85E-01 TOXLDLo DOG ORL 1 18.7 mg/kg 1000 mg/kg 1.86E-02 TOXLDLo RBT ORL 1 30.9 mg/kg 500.0 mg/kg 6.18E-02 TOXLDLo RBT SCU 1 577.7 mg/kg 800 mg/kg 7.22 E - 0 1
TUMTD MUS ORL 2 2.15 mg /kg /d 34.0 m g / k g / d 6.34E- 02 TUMTD MUS ORL 3 1.69 mg /kg /d 150.0 m g / k g / d 1.12E - 02 TUMTD RAT ORL 2 1.17 m g / k g / d 12.8 m g / k g / d 9.13E- 02 TUMTDLo MUS ORL 2 1.68 m g / k g / d 197.6 m g / k g / d 8.56E-03 TUMTDLo RAT ORL 2 2081.0 m g / k g / d 66.2 m g / k g / d 3.18E- 02
Mean relative potency 1.28E - 01
p o t e n c y r a t i o s l e a d s to a m u c h m o r e r o b u s t m e a -
su r e o f r e l a t i ve p o t e n c y . S u c h a m e t h o d a l so t e n d s
to d i s c o u n t e r r o r s t h a t m a y b e p r e s e n t in t h e
R T E C S d a t a b a s e s ince g e o m e t r i c m e a n s a re re la-
t ive ly i n s e n s i t i v e to ou t l i e r s in a d a t a set.
The composite relative potency method W e f o u n d t h a t c h e m i c a l s t h a t d i s p l a y c h a r a c t e r -
i s t ics w h i c h i m p l y d i f f e r e n t m e c h a n i s m s o f
c a r c i n o g e n i c a c t i o n ( g e n e t i c vs. e p i g e n e t i c ) re-
s p o n d d i f f e r e n t l y to C O M R E F . T h i s p h e n o m e n o n
s u g g e s t e d t h a t c o m p o u n d s b e g r o u p e d b y s i m i l a r
t o x i c o l o g i c a l c h a r a c t e r i s t i c s a n d e v a l u a t e d sep-
a ra t e ly , a n o b s e r v a t i o n t h a t h a s b e e n p r e v i o u s l y
n o t e d ( G o r i , 1980; W e i s b u r g e r a n d W i l l i a m s , 1981;
C l a y s o n , 1983; B u t t e r w o r t h , 1987) . F o u r sub -
c l a s ses ( T a b l e 4) w e r e c r e a t e d b a s e d o n s h o r t - t e r m
t o x i c o l o g i c a l c h a r a c t e r i s t i c s o f c o m p o u n d s .
M u t a g e n i c i t y a n d a c u t e t o x i c i t y d a t a f r o m
R T E C S w e r e u s e d to e s t i m a t e a c o m p o u n d ' s
p o t e n t i a l as a mu . t agen o r as c a n c e r p r o m o t e r . T o
a c c o m p l i s h th is , we f o u n d t h e m e d i a n m u t a g e n i c
a n d t ox i c i t y r e l a t i ve p o t e n c i e s o f a randomly selected s a m p l e o f 50 c o m p o u n d s c h o s e n f r o m al l
c o m p o u n d s w i t h s t a t i s t i c a l l y s i g n i f i c a n t ( P < 0 .05)
T D 5 0 s in G o l d et al. (1984) . T h e m e d i a n m u t a -
iO 2
101
>- 0 Z LiJ i- n ° 10 0 h l
. J
I1=
._1
Q
N i0-I O Z
10-2
t0-3
I I I I I I I I I •
&•
• A• •&
•o
NEW RELATIVE P O T E N C Y - ~ . / •
/
~ a
.7' ,/, ,
1o 20
• MUTAGENICITY • TOXICITY • TUMORIGENICITY t REPRODUCTIVE
t I I I t I t 2 4 0 60 80 98
PERCENTAGE
Fig. 3. Log-normal distribution of individual relative potency estimates for the chemical chloroform, determined using avail- able toxicological assay results (mutation, toxicity, reproduc- tive and tumorigenicity) listed in RTECS. The final relative potency for chloroform is the geometric mean (0.12) of the
individual relative potencies.
27
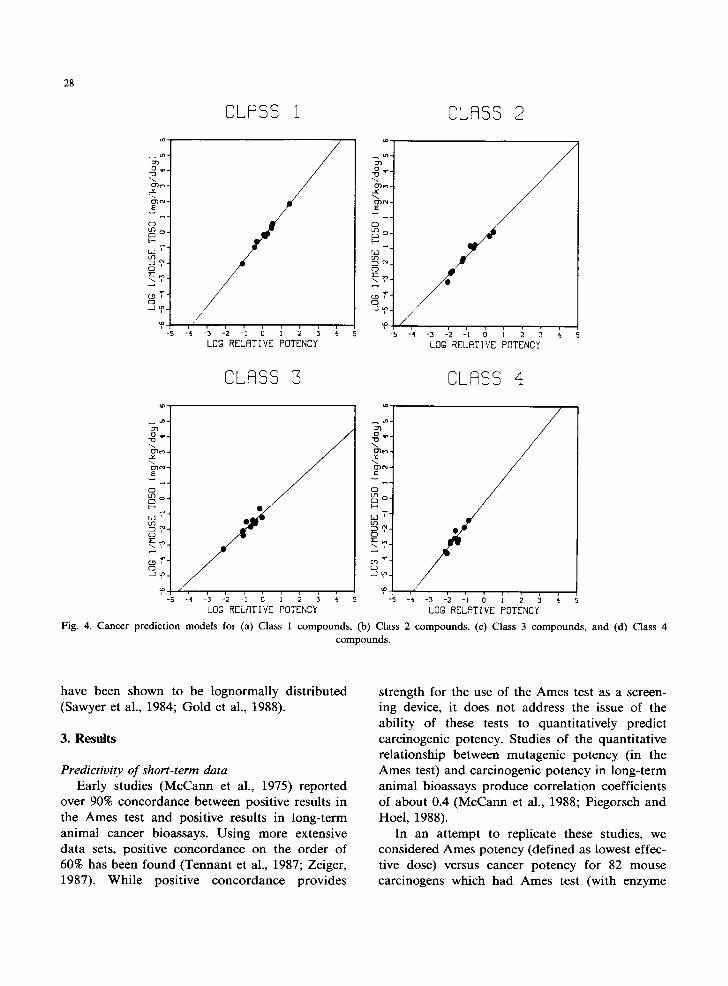
To predict carcinogenic potencies with COM- REF, one must know how to relate relative potency estimates with carcinogenicity. Within each sub- class, ten compounds with known TD50s were used to find this relationship (Fig. 4). A linear least-squares method was used to determine the R P - T D 5 0 relationships for the 4 subclasses:
Class 1 - - log 1 / T D 5 0 =1.64 log R P - 0 . 2 8
Class 2 - - log 1 / T D 5 0 = 1.13 log R P - 0 . 3 3
Class 3 - - log 1 / T D 5 0 = 0.925 log R P - 1.16 Class 4 - - log 1 / T D 5 0 = 1.51 log R P - 0 . 1 9
Thus, the stages to the Composite Relative Potency (CRP) method are: (1) a test compound is placed in the appropriate subclass using its muta- tion relative potency and toxicity relative potency; (2) the relative potency of the test compound is determined relative to COMREF; (3) the carcino- genicity (TD50) of the test compound is predicted using the appropriate subclass predictive equation.
Statistical analysis Mutation data and data generated from various
cancer prediction methods, including the CRP method, were evaluated for their ability to predict cancer potency. Statistical evaluations for our data analyses were performed following methods pre- sented in Snedecor and Cochran (1967). Each analysis includes, (1) correlation coefficients ( r ) of the least-squares regression analyses (Snedecor and Cochran, Sections 6.1-6.4; Section 7.1), (2) esti- mates of the standard error from the regression line (Section 6.2), and (3) the 95% predictive belts for the estimated TD50s (Section 6.12). The stan- dard error (SE) from the regression line is the standard deviation of the differences between the regression line and the actual data. Analyses were performed on log-transformed data since TD50s
genic potency was 0.34. The median toxicity potency was 0.10. These values were used to place compounds in 1 of the 4 subclasses. For example, if the mutation potency of a compound was above 0.34 (high mutagenic), and the toxicity potency was below 0.10 (low toxic), the compound was classified as a Class 3 compound.
TABLE 4
CRP SUBCLASSES
Class Toxicity characteristics
Class 1 High mu ta t i on /h igh toxicity Class 2 Low muta t i on /h igh toxicity Class 3 High muta t ion / low toxicity Class 4 Low muta t ion / low toxicity
28
CLASS 1 CLASS 2
E w
0
[~
"F'-
g
T-
i
-5
t
-'3 -2 4
LOG RELRTIVE POTENCY
:33
( :3
LIJ t " U3
-s 4 -'~ :2 -i 6 i ~ ~ ; L06 RELFtTIVE POTENCY
CLASS 3 CLASS 4
o ~o- b_l T'-
-5 -4 -3 -2 - i 0 1 2 3
LOG RELATIVE POTENCY
i i i l , , l l , 4
~,=,4 , ' 44
t ,1
,"4 -rip4
-5
(/
LOG REL,£TIVE POTENC'(
Fig. 4. Cancer prediction models for (a) Class 1 compounds, (b) Class 2 compounds, (c) Class 3 compounds, and (d) Class 4 compounds.
have been shown to be lognormally distributed (Sawyer et al., 1984; Gold et al., 1988).
3. Results
Predictivity of short-term data Early studies (McCann et al., 1975) reported
over 90% concordance between positive results in the Ames test and positive results in long-term animal cancer bioassays. Using more extensive data sets, positive concordance on the order of 60% has been found (Tennant et al., 1987; Zeiger, 1987). While positive concordance provides
strength for the use of the Ames test as a screen- ing device, it does not address the issue of the ability of these tests to quantitatively predict carcinogenic potency. Studies of the quantitative relationship between mutagenic potency (in the Ames test) and carcinogenic potency in long-term animal bioassays produce correlation coefficients of about 0.4 (McCann et al., 1988; Piegorsch and Hoel, 1988).
In an attempt to replicate these studies, we considered Ames potency (defined as lowest effec- tive dose) versus cancer potency for 82 mouse carcinogens which had Ames test (with enzyme
29
=~ r - 0 . 3 7 O , m .
no \ N - 82 13" ) t~ -
\ 5E - 0.932
~ ,,% o0 °o oi, ~ l i- "0 ooQ
I -4 -3 - 2 -1 O 1 2 3 4 5 6
LOS AMES SALMONELLA POTENCY
t O
o=~ ~- r - 0 .59 J
j j e ] ta , q J r o O ~
o oo, ll
, . . 4 ' °
;f , / , , 21 '
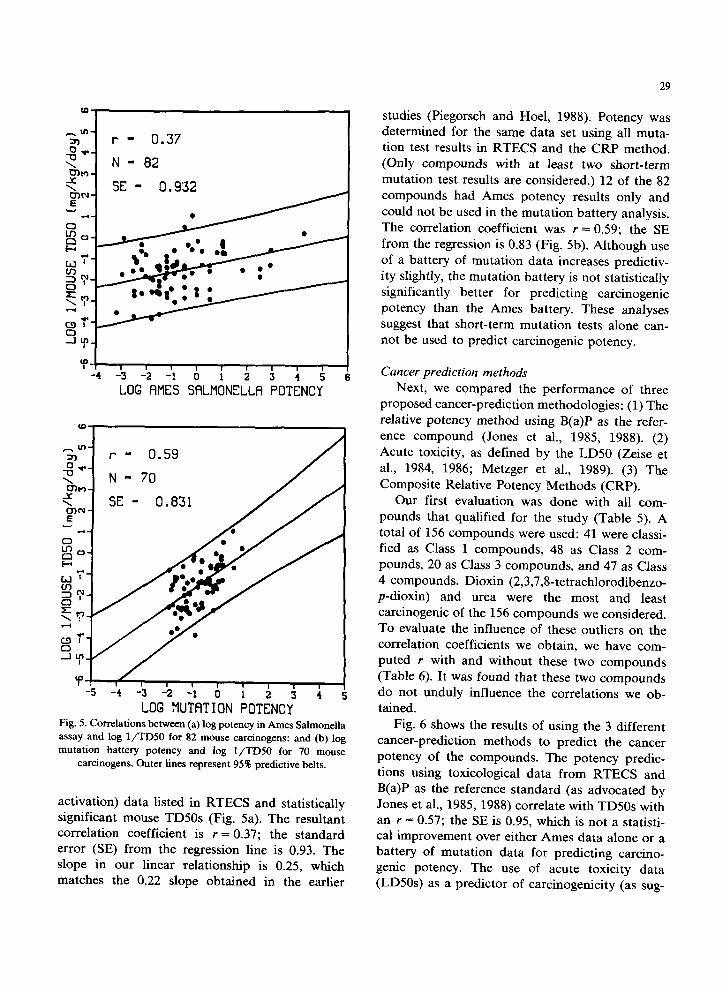
LOS MUTATION POTENCY Fig. 5. Correlations between (a) log potency in Ames Salmonella assay and log I/TD50 for 82 mouse carcinogens: and (b) log mutation battery potency and log 1/XTDS0 for 70 mouse
carcinogens. Outer lines represent 95% predictive belts.
activation) data listed in RTECS and statistically significant mouse TD50s (Fig. 5a). The resultant correlation coefficient is r = 0.37; the standard error (SE) from the regression line is 0.93. The slope in our linear relationship is 0.25, which matches the 0.22 slope obtained in the earlier
studies (Piegorsch and Hoel, 1988). Potency was determined for the same data set using all muta- tion test results in RTECS and the CRP method. (Only compounds with at least two short-term mutation test results are considered.) 12 of the 82 compounds had Ames potency results only and could not be used in the mutation battery analysis. The correlation coefficient was r - -0 .59 ; the SE from the regression is 0.83 (Fig. 5b). Although use of a battery of mutation data increases predictiv- ity slightly, the mutation battery is not statistically significantly better for predicting carcinogenic potency than the Ames battery. These analyses suggest that short-term mutation tests alone can- not be used to predict carcinogenic potency.
Cancer prediction methods Next, we compared the performance of three
proposed cancer-prediction methodologies: (1) The relative potency method using B(a)P as the refer- ence compound (Jones et al., 1985, 1988). (2) Acute toxicity, as defined by the LD50 (Zeise et al., 1984, 1986; Metzger et al., 1989). (3) The Composite Relative Potency Methods (CRP).
Our first evaluation was done with all com- pounds that qualified for the study (Table 5). A total of 156 compounds were used: 41 were classi- fied as Class 1 compounds, 48 as Class 2 com- pounds, 20 as Class 3 compounds, and 47 as Class 4 compounds. Dioxin (2,3,7,8-tetrachlorodibenzo- p-dioxin) and urea were the most and least carcinogenic of the 156 compounds we considered. To evaluate the influence of these outliers on the correlation coefficients we obtain, we have com- puted r with and without these two compounds (Table 6). It was found that these two compounds do not unduly influence the correlations we ob- tained.
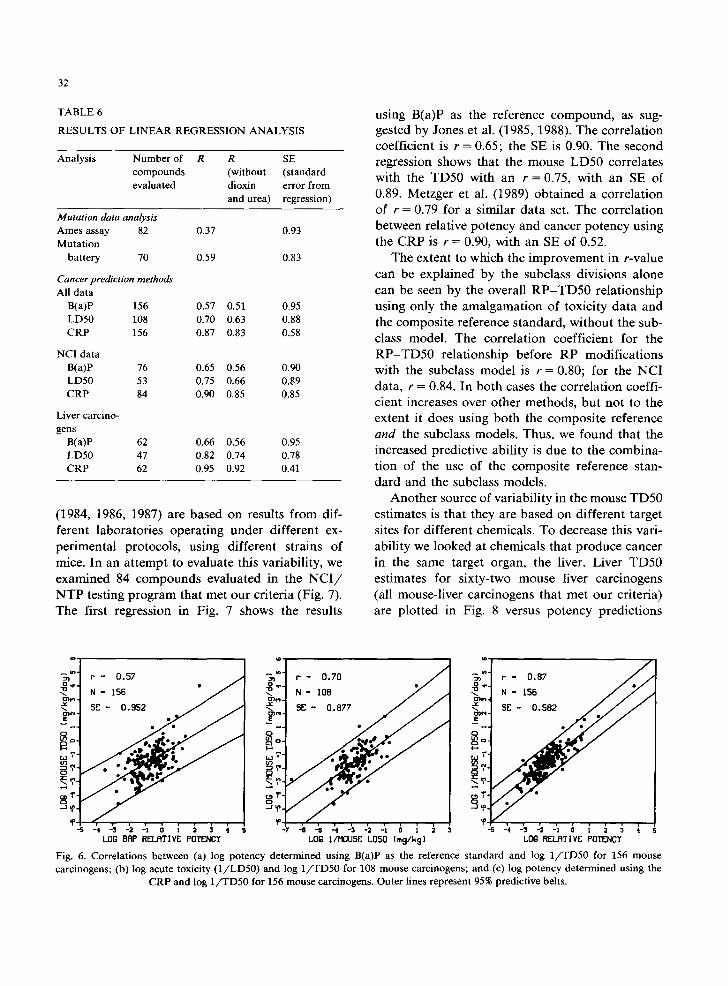
Fig. 6 shows the results of using the 3 different cancer-prediction methods to predict the cancer potency of the compounds. The potency predic- tions using toxicological data from RTECS and B(a)P as the reference standard (as advocated by Jones et al., 1985, 1988) correlate with TD50s with an r = 0.57; the SE is 0.95, which is not a statisti- cal improvement over either Ames data alone or a battery of mutation data for predicting carcino- genic potency. The use of acute toxicity data (LD50s) as a predictor of carcinogenicity (as sug-
30
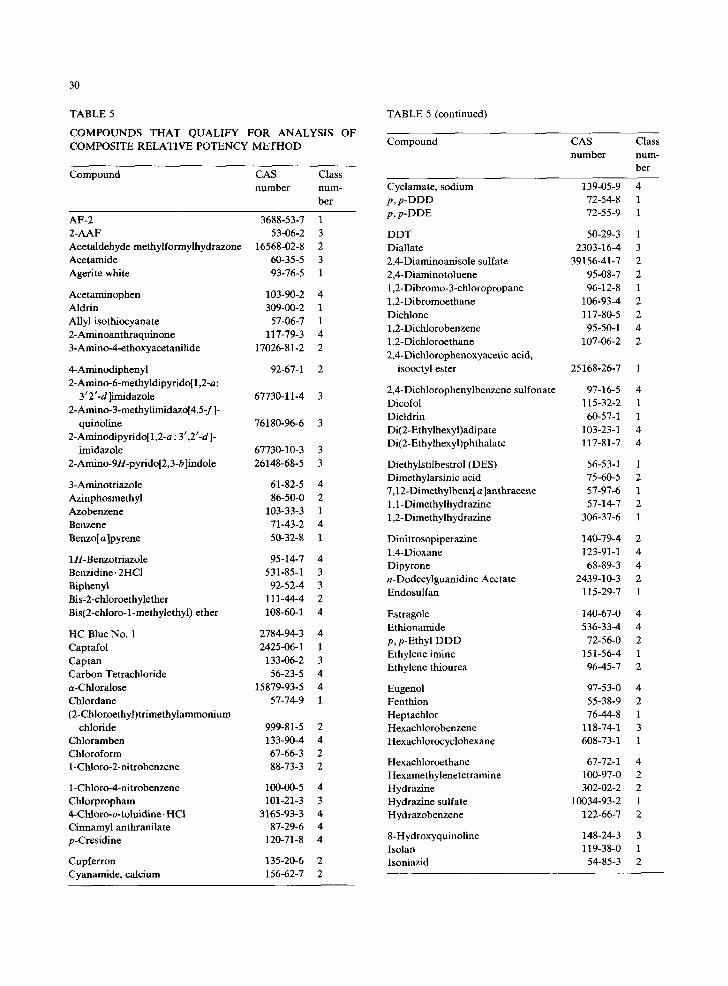
TABLE 5
COMPOUNDS THAT QUALIFY FOR ANALYSIS OF COMPOSITE RELATIVE POTENCY METHOD
Compound CAS Class number num-
ber
AF-2 3688-53-7 1 2-AAF 53-06-2 3 Acetaldehyde methylformylhydrazone 16568-02-8 2 Acetamide 60-35-5 3 Agerite white 93-76-5 1
Acetaminophen 103-90-2 4 Aldrin 309-00-2 1 Allyl isothiocyanate 57-06-7 1 2-Aminoanthraquinone 117-79-3 4 3-Amino-4-ethoxyacetanilide 17026-81-2 2
4-Aminodiphenyl 92-67-1 2 2-Amino-6-methyldipyrido[1,2-a:
3'2'-d ]imidazole 67730-11-4 3 2-Amino-3-methylimidazo[4,5-f ]-
quinoline 76180-96-6 3 2-Aminodipyrido[1,2-a : 3',2'-d ]-
imidazole 67730-10-3 3 2-Amino-9H-pyrido[2,3-b]indole 26148-68-5 3
3-Aminotriazole 61-82-5 4 Azinphosmethyl 86-50-0 2 Azobenzene 103-33-3 1 Benzene 71-43-2 4 Benzo[a ]pyrene 50-32-8 1
1H-Benzotriazole 95-14-7 4 Benzidine- 2HCI 531-85-1 3 Biphenyi 92-52-4 3 Bis-2-chloroethylether 111-44-4 2 Bis(2-chloro-l-methylethyl) ether 108-60-1 4
HC Blue No. 1 2784-94-3 4 Captafol 2425-06-1 1 Captan 133-06-2 3 Carbon Tetrachloride 56-23-5 4 a-Chloralose 15879-93-5 4 Chlordane 57-74-9 1 (2-Chloroethyl)trimethylammonium
chloride 999-81-5 2 Chloramben 133-90-4 4 Chloroform 67-66-3 2 1 -Chloro- 2-nitrobenzene 88-73-3 2
1 -Chloro-4-nitrobenzene 100-00-5 4 Chlorpropham 101-21-3 3 4-Chloro-o-toluidine. HCI 3165-93-3 4 Cinnamyl anthranilate 87-29-6 4 p-Cresidine 120-71-8 4
Cupferron 135-20-6 2 Cyanamide, calcium 156-62-7 2
TABLE 5 (continued)
Compound CAS Class number num-
ber
Cyclamate, sodium 139-05-9 4 p, p-DDD 72-54-8 l p, p-DDE 72-55-9 1
DDT 50-29-3 1 Diallate 2303-16-4 3 2,4-Diaminoanisole sulfate 39156-41-7 2 2,4-Diaminotoluene 95-08-7 2 1,2-Dibromo-3-chloropropane 96-12-8 1 1,2-Dibromoethane 106-93-4 2 Dichlone 117-80-5 2 1,2-Dichlorobenzene 95-50-1 4 1,2-Dichloroethane 107-06-2 2 2,4- Dichlorophenoxyacetic acid,
isooctyl ester 25168-26-7 1
2,4-Dichlorophenylbenzene sulfonate 97-16-5 4 Dicofol 115-32-2 1 Dieldrin 60-57-1 1 Di(2-Ethylhexyl)adipate 103-23-1 4 Di(2-Ethylhexyl)phthalate 117-81-7 4
Diethylstilbestrol (DES) 56-53-1 1 Dimethylarsinic acid 75-60-5 2 7,12-Dimethylbenz[ a ]anthracene 57-97-6 1 1,1-Dimethylhydrazine 57-14-7 2 1,2-Dimethylhydrazine 306-37-6 1
Dinitrosopiperazine 140-79-4 2 1,4-Dioxane 123-91-1 4 Dipyrone 68-89-3 4 n-Dodecylguanidine Acetate 2439-10-3 2 Endosulfan 115-29-7 1
Estragole 140-67-0 4 Ethionamide 536-33-4 4 p,p-Ethyl DDD 72-56-0 2 Ethylene imine 151-56-4 1 Ethylene thiourea 96-45-7 2
Eugenol 97-53-0 4 Fenthion 55-38-9 2 Heptachlor 76-44-8 1 Hexachlorobenzene 118-74-1 3 Hexachlorocyclohexane 608-73-1 1
Hexachloroethane 67-72-1 4 Hexamethylenetetramine 100-97-0 2 Hydrazine 302-02-2 2 Hydrazine sulfate 10034-93-2 1 Hydrazobenzene 122-66-7 2
8-Hydroxyquinoline 148-24-3 3 Isolan 119-38-0 1 Isoniazid 54-85-3 2
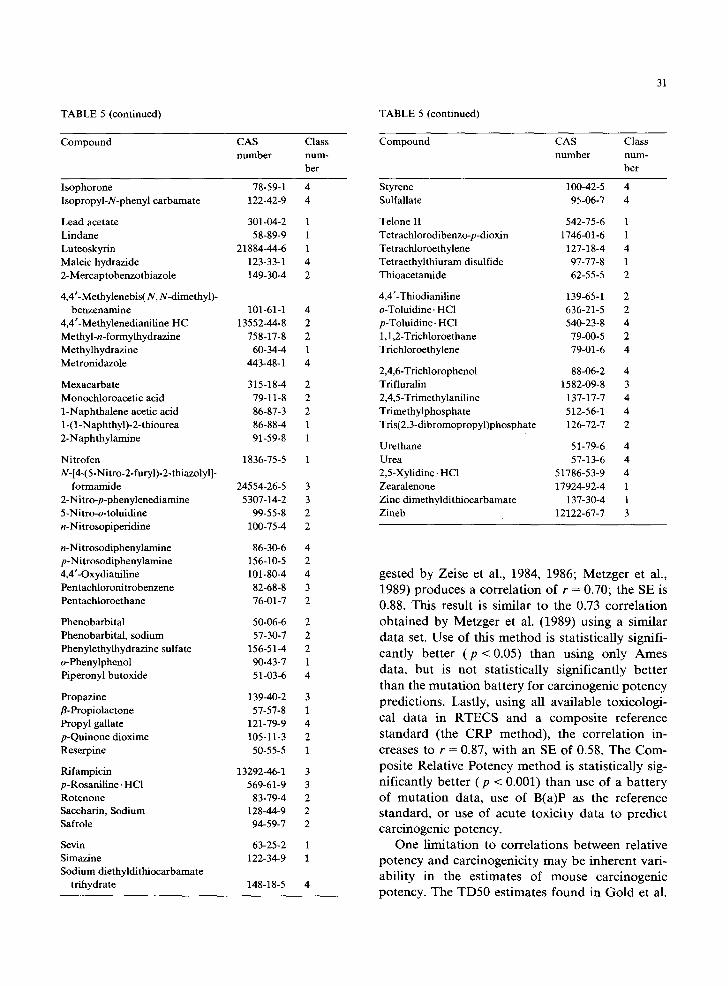
TABLE 5 (continued)
Compound CAS Class number num-
ber
Isophorone 78-59-1 4 Isopropyl-N-phenyl carbamate 122-42-9 4
Lead acetate 301-04-2 1 Lindane 58-89-9 1 Luteoskyrin 21884-44-6 1 Maleic hydrazide 123-33-1 4 2-Mercaptobenzothiazole 149-30-4 2
4,4'-Methylenebis( N, N-dimethyl)- benzenamine 101-61-1 4
4,4 '-Methylenedianiline HC 13552-44-8 2 Methyl-n- formylhydrazine 758-17-8 2 Methylhydrazine 60-34-4 1 Metronidazole 443-48-1 4
Mexacarbate 315-18-4 2 Monochloroacetic acid 79-11-8 2 1-Naphthalene acetic acid 86-87-3 2 1-( 1 -Naphthyl)-2-thiourea 86-88-4 1 2-Naphthylamine 91-59-8 1
Nitrofen 1836-75-5 1 N-[4-(5-Nitro-2- furyl)-2-thiazolyl]-
formamide 24554-26-5 3 2-Nitro-p-phenylenediamine 5307-14-2 3 5-Nitro-o-toluidine 99-55-8 2 n-Nitrosopiperidine 100-75-4 2
n-Nitrosodiphenylamine 86-30-6 4 p-Nitrosodiphenylamine 156-10-5 2 4,4'-Oxydianiline 101-80-4 4 Pentachloronitrobenzene 82-68-8 3 Pentachloroethane 76-01-7 2
Phenobarbital 50-06-6 2 Phenobarbital, sodium 57-30-7 2 Phenylethylhydrazine sulfate 156-51-4 2 o-Phenylphenol 90-43-7 1 Piperonyl butoxide 51-03-6 4
Propazine 139-40-2 3 fl-Propiolactone 57-57-8 1 Propyl gallate 121-79-9 4 p-Quinone dioxime 105-11-3 2 Reserpine 50-55-5 1
Rifampicin 13292-46-1 3 p-Rosaniline. HCI 569-61-9 3 Rotenone 83-79-4 2 Saccharin, Sodium 128-44-9 2 Safrole 94-59-7 2
Sevin 63-25-2 1 Simazine 122-34-9 1 Sodium diethyldithiocarbamate
trihydrate 148-18-5 4
TABLE 5 (continued)
Compound CAS Class number num-
ber
31
Styrene 100-42-5 4 Sulfallate 95-06-7 4
Telone II 542-75-6 1 Tetrachlorodibenzo-p-dioxin 1746-01-6 1 Tetrachloroethylene 127-18-4 4 Tetraethylthiuram disulfide 97-77-8 1 Thioacetamide 62-55-5 2
4,4'-Thiodianiline 139-65-1 2 o-Toluidine. HC1 636-21-5 2 p-Toluidine- HCI 540-23-8 4 1,1,2-Trichloroethane 79-00-5 2 Trichloroethylene 79-01-6 4
2,4,6-Trichlorophenol 88-06-2 4 Trifluralin 1582-09-8 3 2,4,5-Trimethylaniline 137-17-7 4 Trimethylphosphate 512-56-1 4 Tris(2,3-dibromopropyl)phosphate 126-72-7 2
Urethane 51-79-6 4 Urea 57-13-6 4 2,5-Xylidine- HC1 51786-53-9 4 Zearalenone 17924-92-4 1 Zinc dimethyldithiocarbamate 137-30-4 1 Zineb 12122-67-7 3
ges ted by Ze i se et al., 1984, 1986; M e t z g e r et al.,
1989) p r o d u c e s a c o r r e l a t i o n o f r = 0.70; the SE is
0.88. Th i s resul t is s imi la r to the 0.73 c o r r e l a t i o n
o b t a i n e d by M e t z g e r et al. (1989) us ing a s imi la r
d a t a set. U s e of this m e t h o d is s ta t i s t i ca l ly s ignif i -
can t ly be t t e r ( p < 0.05) t h a n u s ing o n l y A m e s
data , bu t is no t s ta t i s t i ca l ly s ign i f i can t ly b e t t e r
t h a n the m u t a t i o n b a t t e r y for c a r c i n o g e n i c p o t e n c y
p red ic t ions . Last ly , u s ing all a v a i l a b l e t ox i co log i -
cal d a t a in R T E C S a n d a c o m p o s i t e r e f e r e n c e
s t a n d a r d ( the C R P m e t h o d ) , the c o r r e l a t i o n in-
c reases to r = 0.87, w i t h an SE of 0.58. T h e C o m -
pos i t e R e l a t i v e P o t e n c y m e t h o d is s t a t i s t i ca l ly sig-
n i f i can t ly b e t t e r ( p < 0.001) t h a n use o f a b a t t e r y
o f m u t a t i o n data , use o f B(a)P as the r e f e r ence
s t anda rd , o r use o f a c u t e tox ic i ty d a t a to p r e d i c t c a r c i n o g e n i c p o t e n c y .
O n e l i m i t a t i o n to c o r r e l a t i o n s b e t w e e n re l a t ive
p o t e n c y a n d c a r c i n o g e n i c i t y m a y be i n h e r e n t var i -
ab i l i ty in the e s t ima te s o f m o u s e c a r c i n o g e n i c
po tency . T h e T D 5 0 e s t i m a t e s f o u n d in G o l d et al.
32
TABLE 6
RESULTS OF LINEAR REGRESSION ANALYSIS
Analysis Number of R R SE compounds (without (standard evaluated dioxin error from
and urea) regression)
Mutation data analysis Ames assay 82 0.37 0.93 Mutation
battery 70 0.59 0.83
Cancer prediction methods All data
B(a)P 156 0.57 0.51 0.95 LD50 108 0.70 0.63 0.88 CRP 156 0.87 0.83 0.58
NCI data B(a)P 76 0.65 0.56 0.90 LD50 53 0.75 0.66 0.89 CRP 84 0.90 0.85 0.85
Liver carcino- gens
B(a)P 62 0.66 0.56 0.95 LD50 47 0.82 0.74 0.78 CRP 62 0.95 0.92 0.41
(1984, 1986, 1987) are based on results from dif- ferent laboratories operating under different ex- perimental protocols, using different strains of mice. In an attempt to evaluate this variability, we examined 84 compounds evaluated in the NCI/ NTP testing program that met our criteria (Fig. 7). The first regression in Fig. 7 shows the results
using B(a)P as the reference compound, as sug- gested by Jones et al. (1985, 1988). The correlation coefficient is r = 0.65; the SE is 0.90. The second regression shows that the mouse LD50 correlates with the TD50 with an r = 0.75, with an SE of 0.89. Metzger et al. (1989) obtained a correlation of r = 0.79 for a similar data set. The correlation between relative potency and cancer potency using the CRP is r = 0.90, with an SE of 0.52.
The extent to which the improvement in r-value can be explained by the subclass divisions alone can be seen by the overall R P - T D 5 0 relationship using only the amalgamation of toxicity data and the composite reference standard, without the sub- class model. The correlation coefficient for the RP-TD50 relationship before RP modifications with the subclass model is r = 0.80; for the NCI data, r = 0.84. In both cases the correlation coeffi- cient increases over other methods, but not to the extent it does using both the composite reference and the subclass models. Thus, we found that the increased predictive ability is due to the combina- tion of the use of the composite reference stan- dard and the subclass models.
Another source of variability in the mouse TD50 estimates is that they are based on different target sites for different chemicals. To decrease this vari- ability we looked at chemicals that produce cancer in the same target organ, the liver. Liver TD50 estimates for sixty-two mouse liver carcinogens (all mouse-liver carcinogens that met our criteria) are plotted in Fig. 8 versus potency predictions
~ " r- 0.57 • /
~ " N- ~ 156 s r -
p,,,. P ~:
N"
i i i , i , i i I
-5 - t -3 -2 -1 0 I 2 3 t 5 LOG BRP RELRTIVE POTENCY
J ~,~'~" r - 0.70 / /
~"" N - 108
m~. 5E - 0.877
-- . % , f j , . , , -
~.,~. :-Jy - J ~ .
LOG l/MOUSE L050 (mg/k 91
/ ~] r - 0 . 8 7 / . 7
. - 1 5 8 /j/ s E - 0.582 / / /
~ . . 7 "
• .
N ; °
LOG RFLRTIVE POTENCY
Fig. 6. Correlations between (a) log potency determined using B(a)P as the reference standard and log 1/TD50 for 156 mouse carcinogens; (b) log acute toxicity (1/LD50) and log 1/TD50 for 108 mouse carcinogens; and (c) log potency determined using the
CRP and log 1/TD50 for 156 mouse carcinogens. Outer lines represent 95% predictive belts.
33
~:,~'" r - 0.65 / o r _ / - N - 76 " /
im~- SE - 0.901
o- .'; 0
~,~-
LOG BFIP RELRTIVE P0TENCY
u~.
o~.
xm~-
ZI ,..,
~ '
• °# •
i @° °
=7 -6 -5 - ' i -3 -2 -I O I 2
LOG I/MOUSE LD50 (mg/k 9}
/ r - 0.90 / /
~ o - °
l- . $
~7-
~ r - ~ m
LOG RELFITIVE POTENCY
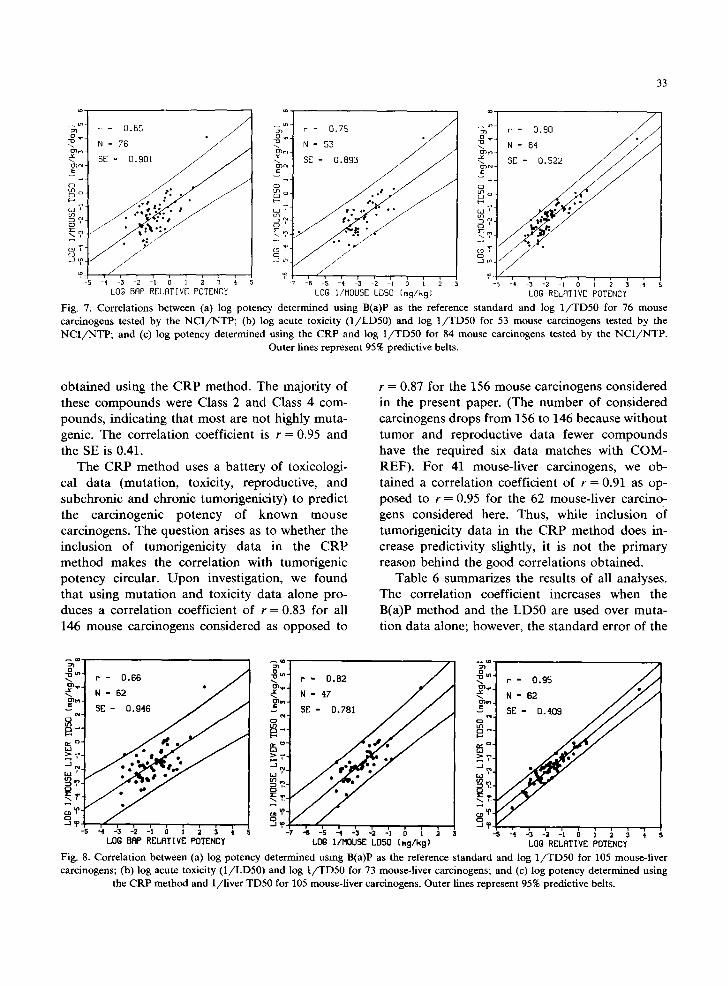
Fig. 7. Correlations between (a) log potency determined using B(a)P as the reference standard and log 1/TDS0 for 76 mouse carcinogens tested by the NCI/NTP; (b) log acute toxicity ( 1 / L D S 0 ) and log 1/TDS0 for 53 mouse carcinogens tested by the NCI/NTP; and (c) log potency determined using the CRP and log 1/TDS0 for 84 mouse carcinogens tested by the NCI/NTP.
Outer lines represent 95% predictive belts.
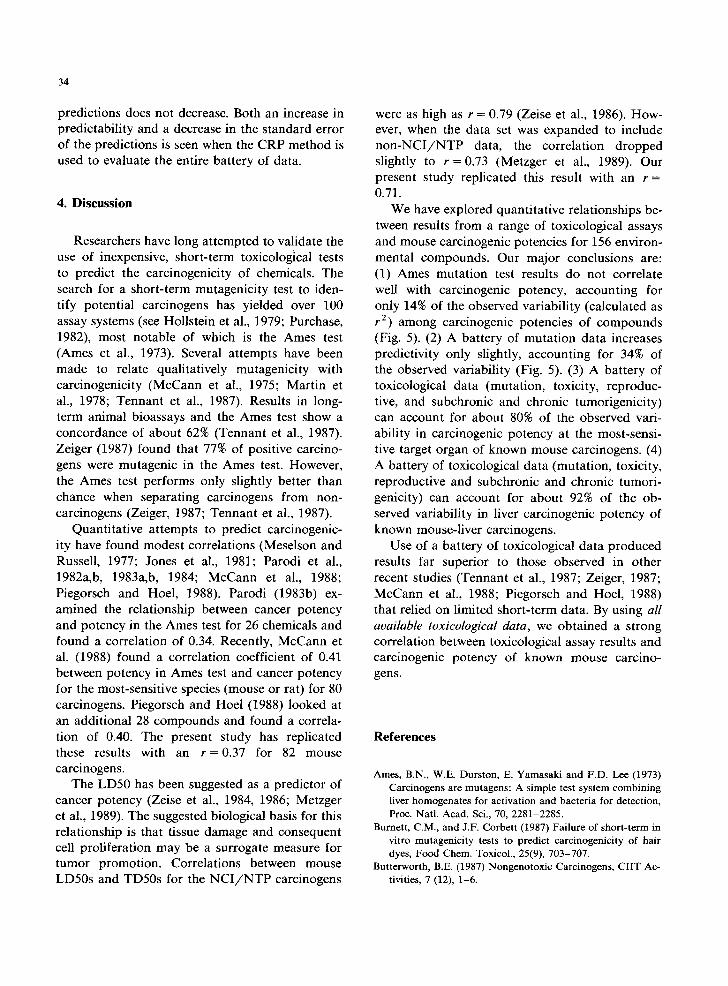
obtained using the CRP method. The majority of these compounds were Class 2 and Class 4 com- pounds, indicating that most are not highly muta- genic. The correlation coefficient is r = 0.95 and the SE is 0.41.
The CRP method uses a battery of toxicologi- cal data (mutation, toxicity, reproductive, and subchronic and chronic tumorigenicity) to predict the carcinogenic potency of known mouse carcinogens. The question arises as to whether the inclusion of tumorigenicity data in the CRP method makes the correlation with tumorigenic potency circular. U p o n investigation, we found that using mutation and toxicity data alone pro- duces a correlation coefficient of r = 0.83 for all 146 mouse carcinogens considered as opposed to
r = 0.87 for the 156 mouse carcinogens considered in the present paper. (The number of considered carcinogens drops from 156 to 146 because without tumor and reproductive data fewer compounds have the required six data matches with COM- REF). For 41 mouse-liver carcinogens, we ob- tained a correlation coefficient of r = 0.91 as op- posed to r = 0.95 for the 62 mouse-liver carcino- gens considered here. Thus, while inclusion of tumorigenicity data in the CRP method does in- crease predictivity slightly, it is not the primary reason behind the good correlations obtained.
Table 6 summarizes the results of all analyses. The correlation coefficient increases when the B(a)P method and the LDS0 are used over muta- tion data alone; however, the standard error of the
oL,_ r - 0.68 o~..
c~ tW
N o' . . . I
b.I ~,,,
/ N - 62
SE - 0 . 9 4 6
¢S i , n i , , , v i
-5 -4 -3 -2 -1 0 1 2 3 4 LOG BRP RELATIVE POTENCY
w
o b~ 0--"
f i t:o-
~- ~- ~ -
-7 -8 -5 - t -3 -2 -1 0 I LOG 1/MOUSE L 0 5 0 (mg/k 91
/ r - 0 . 8 2 /
l
SE - 0.781 f / j/ss/ • se
i l , , i i i i v
i
o~ , . r - 0.95
g'- N- //I/ ~'" 9[- 0.
~ T ' - : 141 t "
g~ LOG RELATIVE POTENCY
Fig. 8. Correlation between (a) log potency determined using B(a)P as the reference standard and log 1/TD50 for 105 mouse-liver carcinogens; (b) log acute toxicity (1 /LDS0) and log 1/TDS0 for 73 mouse-liver carcinogens; and (c) log potency determined using
the CAP method and 1/ l iver TD50 for 105 mouse-liver carcinogens. Outer lines represent 95% predictive belts.
34
predictions does not decrease. Both an increase in predictability and a decrease in the standard error of the predictions is seen when the CRP method is used to evaluate the entire battery of data.
4. Discussion
Researchers have long attempted to validate the use of inexpensive, short-term toxicological tests to predict the carcinogenicity of chemicals. The search for a short-term mutagenicity test to iden- tify potential carcinogens has yielded over 100 assay systems (see Hollstein et al., 1979; Purchase, 1982), most notable of which is the Ames test (Ames et al., 1973). Several attempts have been made to relate qualitatively mutagenicity with carcinogenicity (McCann et al., 1975; Martin et al., 1978; Tennant et al., 1987). Results in long- term animal bioassays and the Ames test show a concordance of about 62% (Tennant et al., 1987). Zeiger (1987) found that 77% of positive carcino- gens were mutagenic in the Ames test. However, the Ames test performs only slightly better than chance when separating carcinogens from non- carcinogens (Zeiger, 1987; Tennant et al., 1987).
Quantitative attempts to predict carcinogenic- ity have found modest correlations (Meselson and Russell, 1977; Jones et al., 1981; Parodi et al., 1982a,b, 1983a,b, 1984; McCann et al., 1988; Piegorsch and Hoel, 1988). Parodi (1983b) ex- amined the relationship between cancer potency and potency in the Ames test for 26 chemicals and found a correlation of 0.34. Recently, McCann et al. (1988) found a correlation coefficient of 0.41 between potency in Ames test and cancer potency for the most-sensitive species (mouse or rat) for 80 carcinogens. Piegorsch and Hoel (1988) looked at an additional 28 compounds and found a correla- tion of 0.40. The present study has replicated these results with an r = 0 . 3 7 for 82 mouse carcinogens.
The LD50 has been suggested as a predictor of cancer potency (Zeise et al., 1984, 1986; Metzger et al., 1989). The suggested biological basis for this relationship is that tissue damage and consequent cell proliferation may be a surrogate measure for tumor promotion. Correlations between mouse LD50s and TD50s for the N C I / N T P carcinogens
were as high as r --- 0.79 (Zeise et al., 1986). How- ever, when the data set was expanded to include non-NCI/NTP data, the correlation dropped slightly to r = 0.73 (Metzger et al., 1989). Our present study replicated this result with an r = 0.71.
We have explored quantitative relationships be- tween results from a range of toxicological assays and mouse carcinogenic potencies for 156 environ- mental compounds. Our major conclusions are: (1) Ames mutation test results do not correlate well with carcinogenic potency, accounting for only 14% of the observed variability (calculated as r 2) among carcinogenic potencies of compounds (Fig. 5). (2) A battery of mutation data increases predictivity only slightly, accounting for 34% of the observed variability (Fig. 5). (3) A battery of toxicological data (mutation, toxicity, reproduc- tive, and subchronic and chronic tumorigenicity) can account for about 80% of the observed vari- ability in carcinogenic potency at the most-sensi- tive target organ of known mouse carcinogens. (4) A battery of toxicological data (mutation, toxicity, reproductive and subchronic and chronic tumori- genicity) can account for about 92% of the ob- served variability in liver carcinogenic potency of known mouse-liver carcinogens.
Use of a battery of toxicological data produced results far superior to those observed in other recent studies (Tennant et al., 1987; Zeiger, 1987; McCann et al., 1988; Piegorsch and Hoel, 1988) that relied on limited short-term data. By using all available toxicological data, we obtained a strong correlation between toxicological assay results and carcinogenic potency of known mouse carcino- gens.
References
Ames, B.N., W.E. Durston, E. Yamasaki and F.D. Lee (1973) Carcinogens are mutagens: A simple test system combining liver homogenates for activation and bacteria for detection, Proc. Natl. Acad. Sci., 70, 2281-2285.
Burnett, C.M., and J.F. Corbett (1987) Failure of short-term in vitro mutagenicity tests to predict carcinogenicity of hair dyes, Food Chem. Toxicol., 25(9), 703-707.
Butterworth, B.E. (1987) Nongenotoxic Carcinogens, CIIT Ac- tivities, 7 (12), 1-6.
Clayson, D.B. (1983) Trans-species and trans-tissue extrapola- tion of carcinogenicity bioassays, in: R. Lagenback, S. Nesnow and J. Rice (Eds.), Organ and Species Specificity in Chemical Carcinogens, EPA-600/9-83-008. PB83-220137.
Gold, L.S., C.B. Sawyer, R. Magaw, G.M. Backman, M. de Veciana, L. Levinson, R. Peto, M.C. Pike and B.N. Ames (1984) A carcinogenic potency database of the standardized results of animal bioassays, Environ. Health Perspect., 58, 9-319.
Gold, L.S., M. de Veciana, G.M. Backman, R. Magaw, P. Lopipero, M. Smith, M. Blumenthal, R. Levinson, L. Bernstein and B.N. Ames (1986) Chronological supplement to the carcinogenic potency database: Standardized results of animal bioassays published through December 1982, Environ. Health Perspect., 67, 161-200.
Gold, L.S., T.H. Slone, G.M. Blackman, R. Magaw, M. Da Costa, P. Lopipero, M. Bhimenthal and B. Ames (1987) Second chronological supplement to the carcinogenic potency database: Standardized results of animal bioassays published through December 1984 and by the National Toxicology Program through May 1986, Environ. Health Perspect., 74, 238-329.
Gold, L.S., T. Slone and L. Bernstein (1988) Summary of carcinogenic potency (TD50) and positivity for 492 rodent carcinogens in the carcinogenic potency database, Environ. Health Perspect., 79.
Gori, G.B. (1980) The regulation of carcinogenic hazards, Science, 208, 256.
Holland, J.M., D.A. Wolfe and B.R. Clark (1981) Relative potency estimation for synthetic petroleum skin carcino- gens, Environ. Health Perspect., 38, 149-155.
Hollstein, M., J. McCann, F.A. Angelosanto and W.W. Nichols (1979) Short-term tests for carcinogens and mutagens, Mu- tation Res., 65, 133-226.
Jones, C.A., P.J. Marlino, W. Lijinski and E. Huberman (1981) The relationship between the carcinogenicity and mutage- nicity of nitrosamines in a hepatocyte-mediated mutagenic- ity assay, Carcinogenesis, 2, 1075-1077.
Jones, T.D., P.J. Walsh and E. Zeighami (1985) Permissible concentrations of chemicals in air and water derived from RTECS entries: A RASH chemical scoring system, Toxicol. Ind. Health, 1,213-234.
Jones, T.D., P.A. Walsh, A.P. Watson, L.W. Barnthouse and D.A. Sanders (1988) Chemical scoring by a rapid screening hazard (RASH) method, Risk Analysis, 8(1), 99-117.
Martin, C.N., A.C. McDermid and R.C. Garner (1978) Testing of known carcinogens and noncarcinogens for their ability to induce unscheduled DNA synthesis in HeLa, Cancer Res., 38, 2621-2627.
McCann, J., E. Choi, E. Yamasaki and B.N. Ames (1975) Detection of carcinogens as mutagens in the Salmonella/ microsome tests: assays of 300 chemicals, Proc. Natl. Acad. Sci., 73, 950-954.
McCann, J., L.S. Gold, L. Horn, R. McGill, T.E. Graedel and J. Kaldor (1988) Statistical analysis of Salmonella test data and comparison to results of animal cancer tests, Mutation Res., 205, 183-195.
35
McMillian, C.R., L.B. Mote and D.G. DeAngelis (1980) Poten- tial atmospheric carcinogens, phase I: Identification and classifications, EPA 600/2-80-015.
Meselson, M., and K. Russell (1977) Comparisons of carcino- genic and mutagenic potency, in: Origins of Human Cancer, 4, 1473-1481.
Metzger, B., E. Crouch and R. Wilson (1989) On the relation- ship between carcinogenicity and acute toxicity, Risk Anal- ysis, 9(2), 169-177.
Parodi, S., M. Taningher, P. Boero and L. Santi (1982a) Quantitative correlations amongst alkaline DNA fragmen- tation, DNA covalent binding, mutagenicity in the Ames test, and carcinogenicity for 21 compounds, Mutation Res., 93, 1-24.
Parodi, S., M. Taningher, C. Balbi, L. Santi (1982b) Predictive ability of the autoradiographic repair assay in rat liver cells compared with the Ames test, J. Toxicol. Environ. Health, 10, 531-539.
Parodi, S., A. Zunino, L. Ottaggio and M. De Ferrari (1983a) Quantitative correlation between carcinogenicity and sister chromatid exchange induction in vivo for a group of 11 N-nitroso compounds, J. Toxicol. Environ. Health, 11, 337-346.
Parodi, S., M. Taningher, P. Russo, D. Vecchio, G. Fassina and L. Santi (1983b) Quantitative predictivity of the trans- formation in vitro assay compared with the Ames test, J. Toxicol. Environ, Health, 2, 483-510.
Parodi, S., M. Taningher, P. Boero and L. Santi (1984) Quantitative correlation with carcinogenic potency of dif- ferent short-term tests, Toxicol. Pathol., 2(3), 247-255.
Peto, R., M.C. Pike, L. Bernstein, L.S. Gold and B.N. Ames (1984) The TD50: A proposed general convention for the numerical description of the carcinogenic potency of chem- icals in chronic-exposure animal experiments, Environ. Health Perspect., 58, 1-8.
Piegorsch, W.W., and D.G. Hoel (1988) Exploring relation- ships between mutagenic and carcinogenic potencies, Muta- tion Res., 196, 161-175.
Purchase, I.F.H. (1982) An appraisal of predictive tests for carcinogenicity, Mutation Res., 99, 53-71.
Sawyer, C., R. Peto, L. Bernstein and M.C. Pike (1984) Calcu- lation of carcinogenic potency from long-term animal carcinogenesis experiments, Biometrics, 40, 27-40.
Snedecor, G.W., and W.G. Cochran (1967) Statistical Meth- otis, 6th edn., Iowa State University Press, Ames, IA.
Sweet, D.V. (Ed.) (1987) Registry of Toxic Effects of Chemical Substances (RTECS) 1986 edn., National Center for Oc- cupational Safety and Health.
Tennant, R.W., B.H. Margolin, M.D. Shelby, E. Zeiger, J.K. Haseman, J. Spalding, W. Caspary, M. Resnick, S. Stasei- wicz, B. Anderson and R. Minor (1987) Prediction of chemical carcinogenicity in rodents from in vitro genetic toxicity assays, Science, 236, 933-941.
Weisburger, J.H., and G.M. Williams (1981) The decision-point approach for systematic carcinogen testing, Food and Cosmetic Toxicology, 19, 561.
36
Zeiger, E. (1987) Carcinogenicity of matagens: Predictive capa- bility of Salmonella mutagenesis assay for rodent carcino- genicity, Cancer Res., 47, 1287-1296.
Zeise, L., R. Wilson and E. Crouch (1984) Use of acute toxicity to estimate carcinogenic risk, Risk Analysis, 4(3), 187-199.
Zeise, L., E.A.C. Crouch, R. Wilson (1986) A possible relation- ship between toxicity and carcinogenicity, J. Am. Coll. Toxicol., 5(2).