Embed Size (px)
Citation preview
Prediction as a Technology
Prediction as a Technology
Roger A. Pielke Sr. and Roger A. Pielke Jr.
University of Colorado at Boulder
Presented at Spoleto, Italy, July 15, 2006

Congratulations to Italy on the World Cup !!!!
Why is Weather Prediction Possible?
Why is Weather Prediction Possible?
Procedure To Make Weather Predictions
Procedure To Make Weather Predictions
1.Observed initial weather conditions for "grid points" are obtained from satellites, balloon and surface data.
2.The change of the weather in time is solved on a computer for every grid point by marching forward in time steps of a minute or two.
3. Weather maps are periodically output to files for use by forecasters and the public.
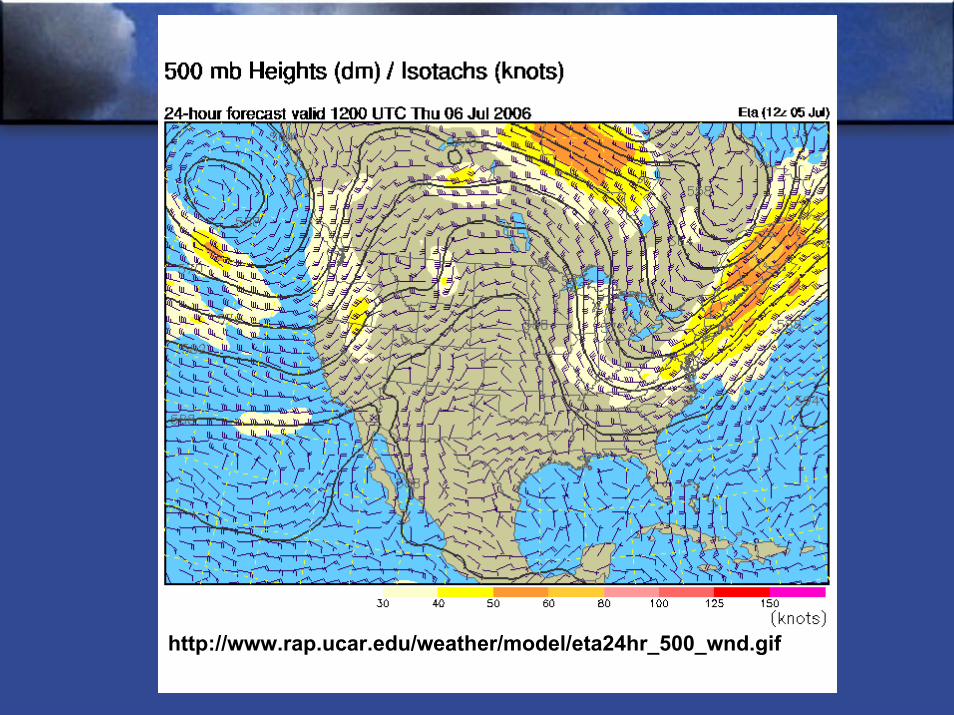
http://www.rap.ucar.edu/weather/model/eta24hr_500_wnd.gif
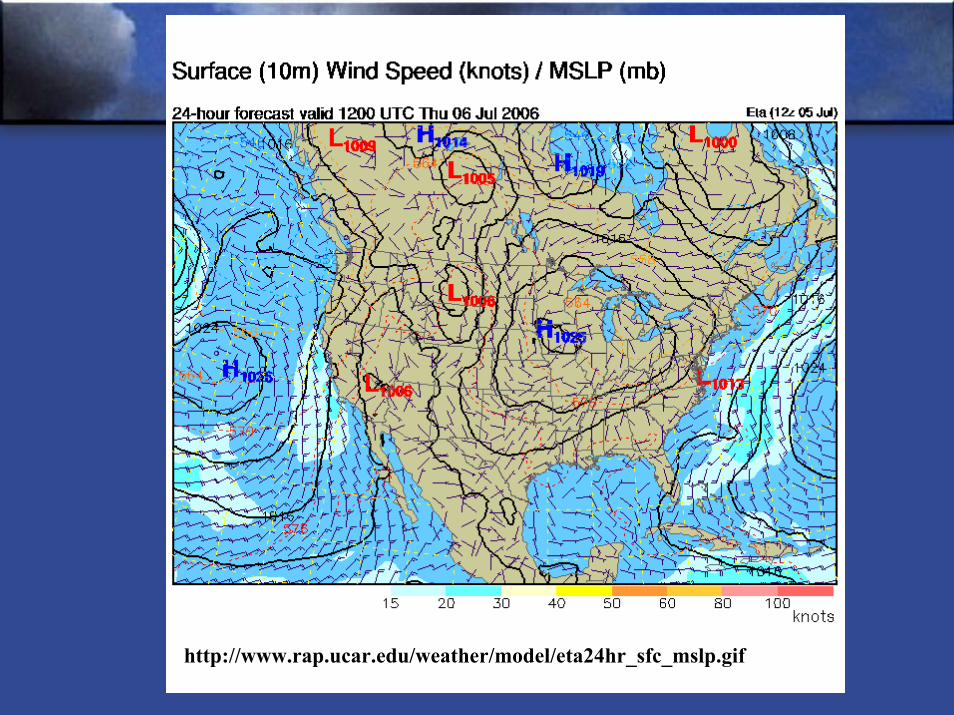
http://www.rap.ucar.edu/weather/model/eta24hr_sfc_mslp.gif
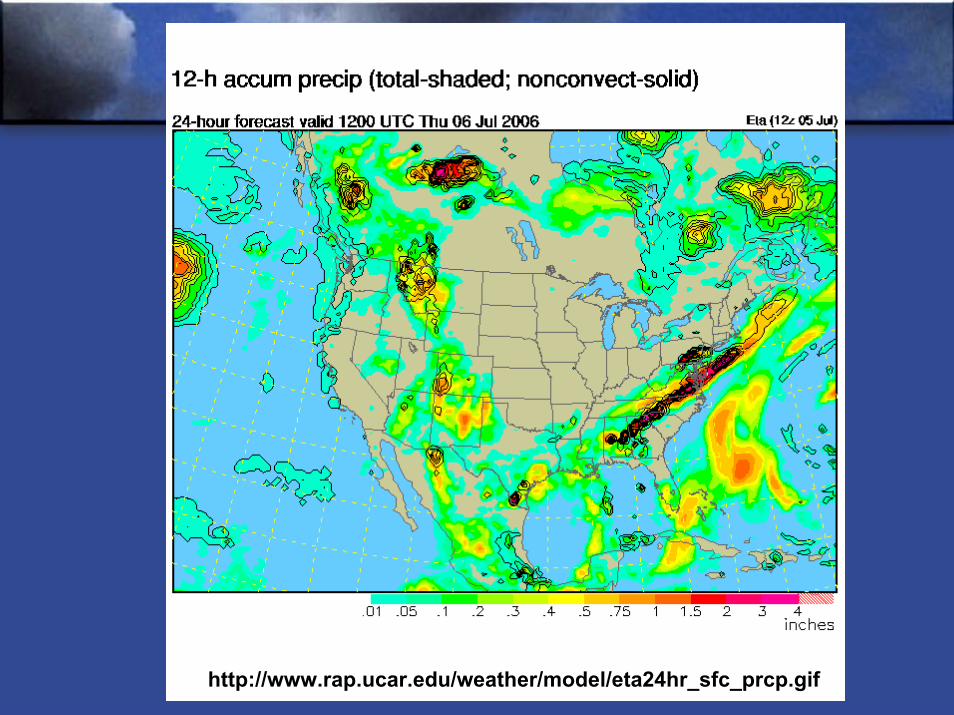
http://www.rap.ucar.edu/weather/model/eta24hr_sfc_prcp.gif
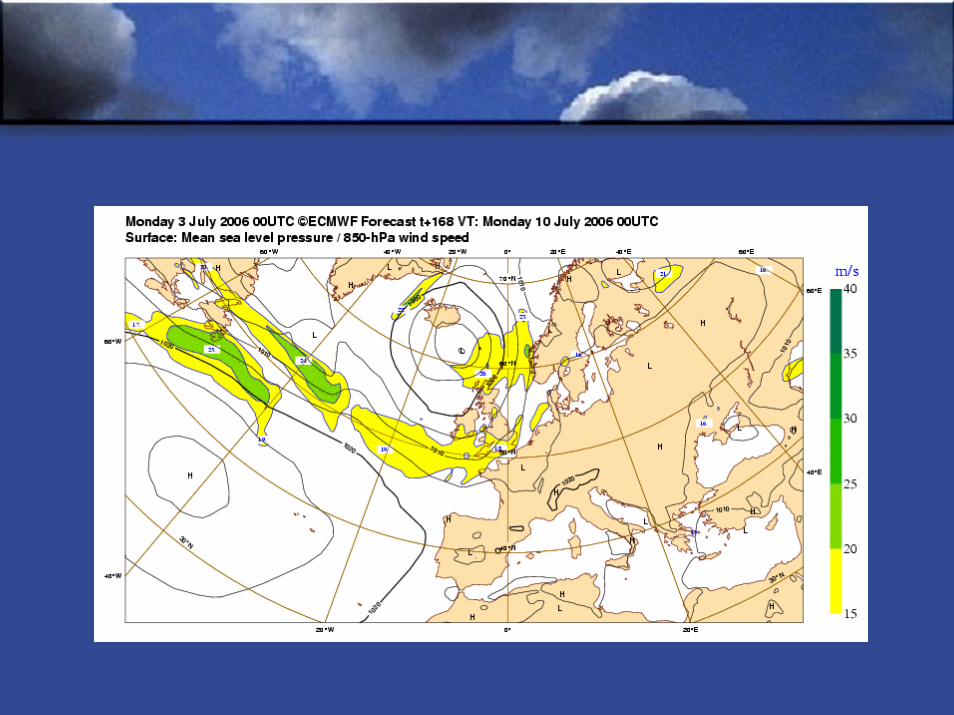
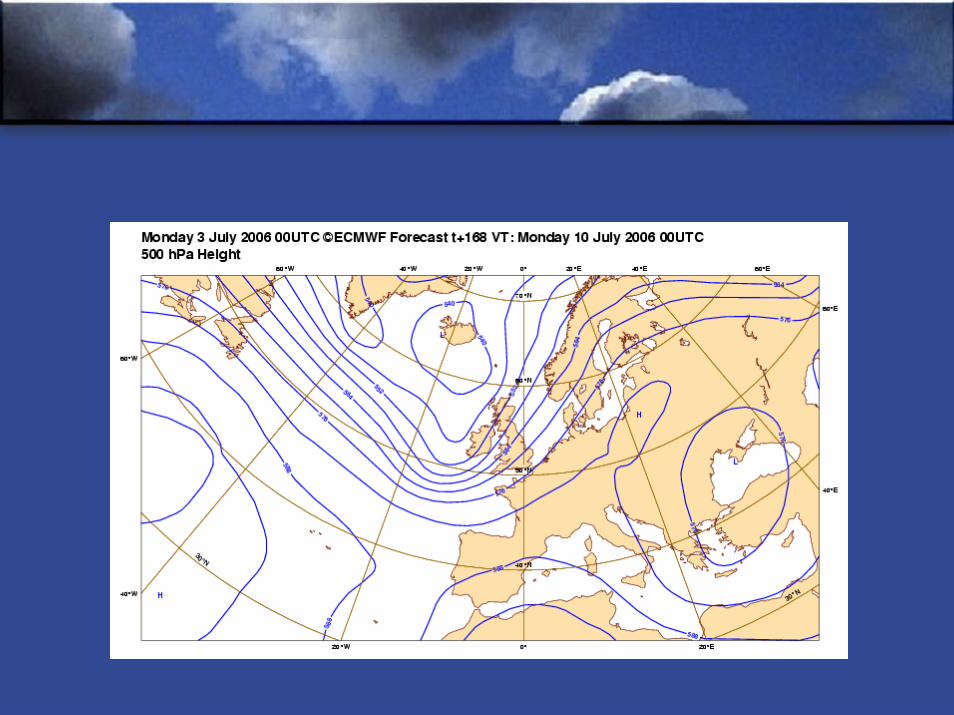
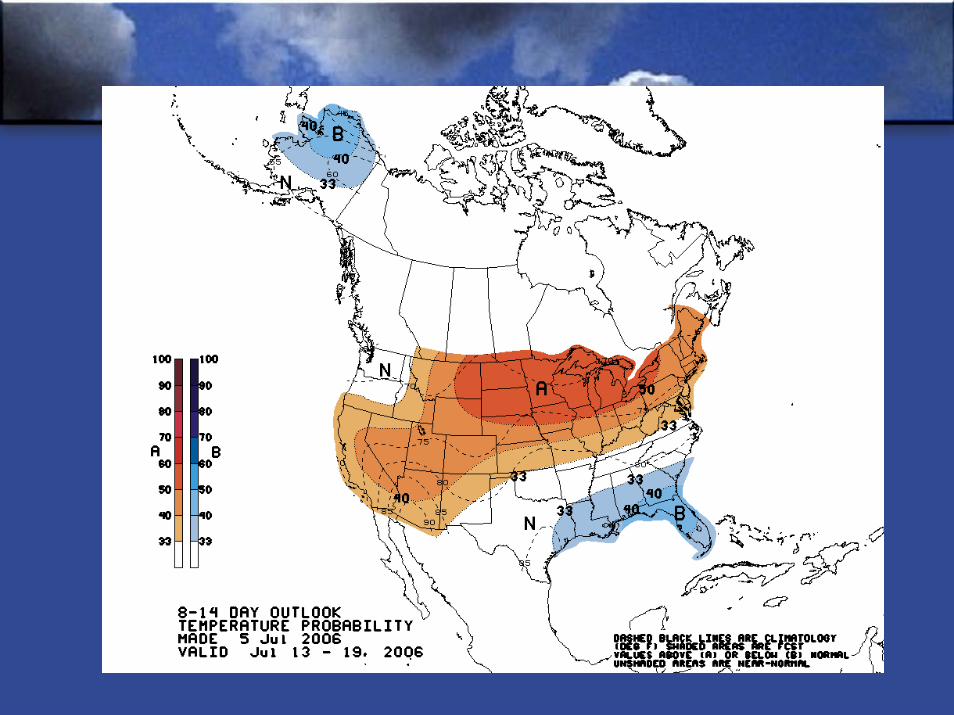
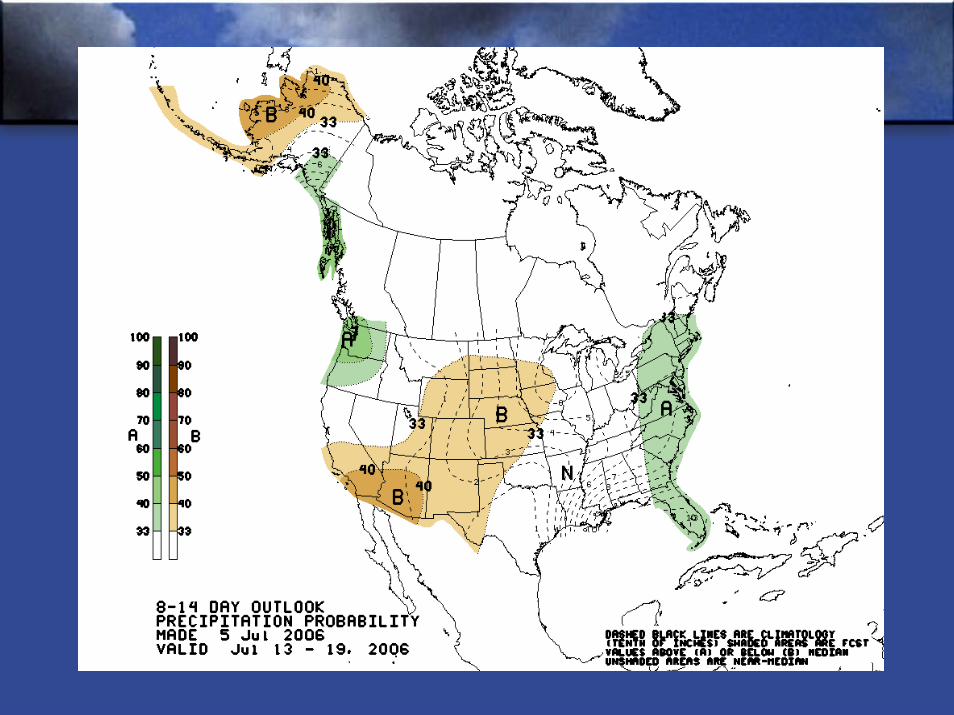
What are the Limits of Weather Prediction?
What are the Limits of Weather Prediction?
What about Multi-Decadal Climate Prediction?
What about Multi-Decadal Climate Prediction?
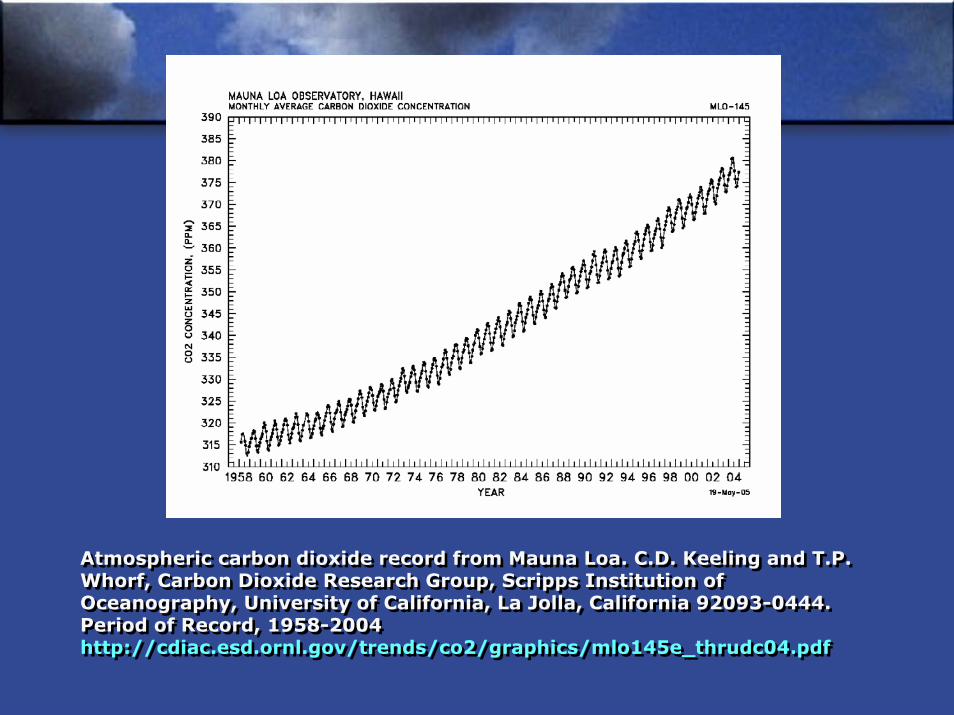
Atmospheric carbon dioxide record from Mauna Loa. C.D. Keeling and T.P. Whorf, Carbon Dioxide Research Group, Scripps Institution of Oceanography, University of California, La Jolla, California 92093-0444. Period of Record, 1958-2004http://cdiac.esd.ornl.gov/trends/co2/graphics/mlo145e_thrudc04.pdf
Atmospheric carbon dioxide record from Mauna Loa. C.D. Keeling and T.P. Whorf, Carbon Dioxide Research Group, Scripps Institution of Oceanography, University of California, La Jolla, California 92093-0444. Period of Record, 1958-2004http://cdiac.esd.ornl.gov/trends/co2/graphics/mlo145e_thrudc04.pdf
What is Necessary for Accurate Multi-Decadal
Climate Prediction?
What is Necessary for Accurate Multi-Decadal
Climate Prediction?
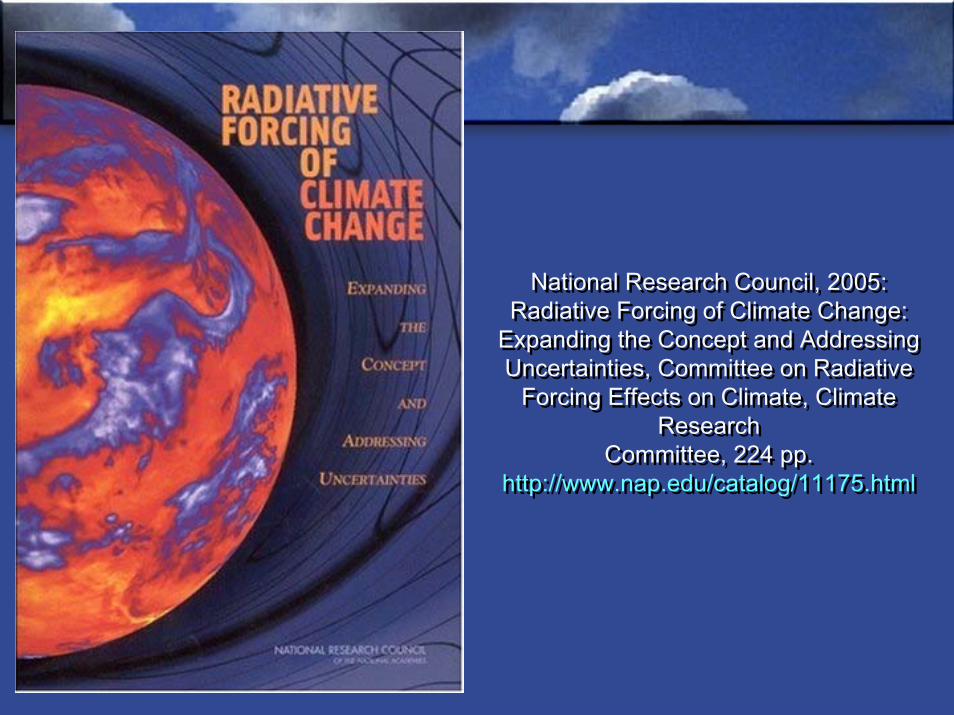
National Research Council, 2005: Radiative Forcing of Climate Change:
Expanding the Concept and Addressing Uncertainties, Committee on Radiative
Forcing Effects on Climate, Climate Research
Committee, 224 pp.http://www.nap.edu/catalog/11175.html
National Research Council, 2005: Radiative Forcing of Climate Change:
Expanding the Concept and Addressing Uncertainties, Committee on Radiative
Forcing Effects on Climate, Climate Research
Committee, 224 pp.http://www.nap.edu/catalog/11175.html
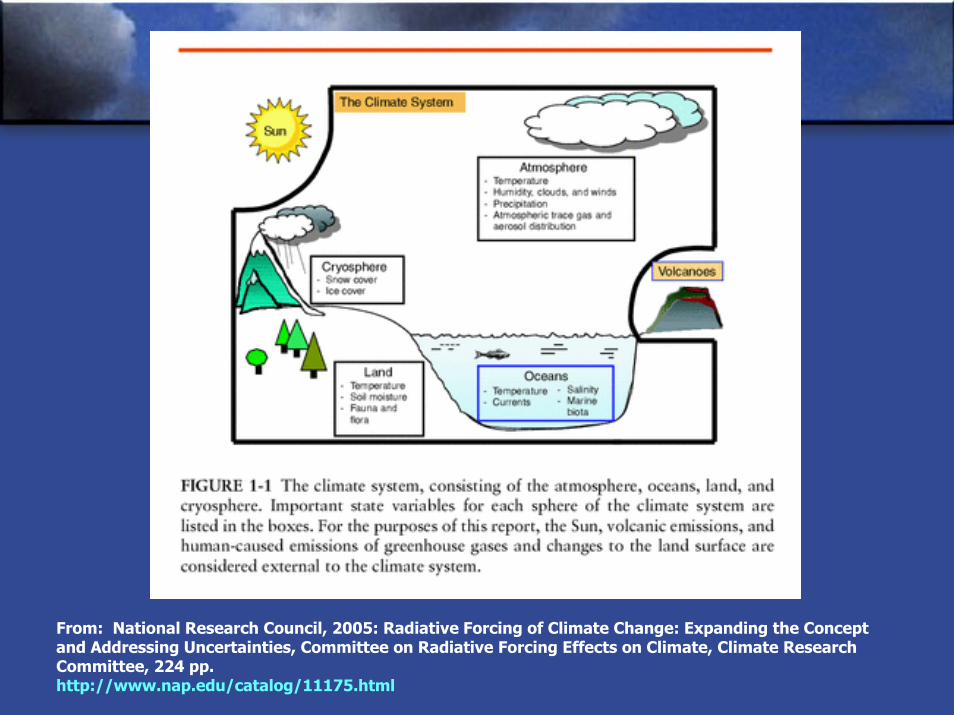
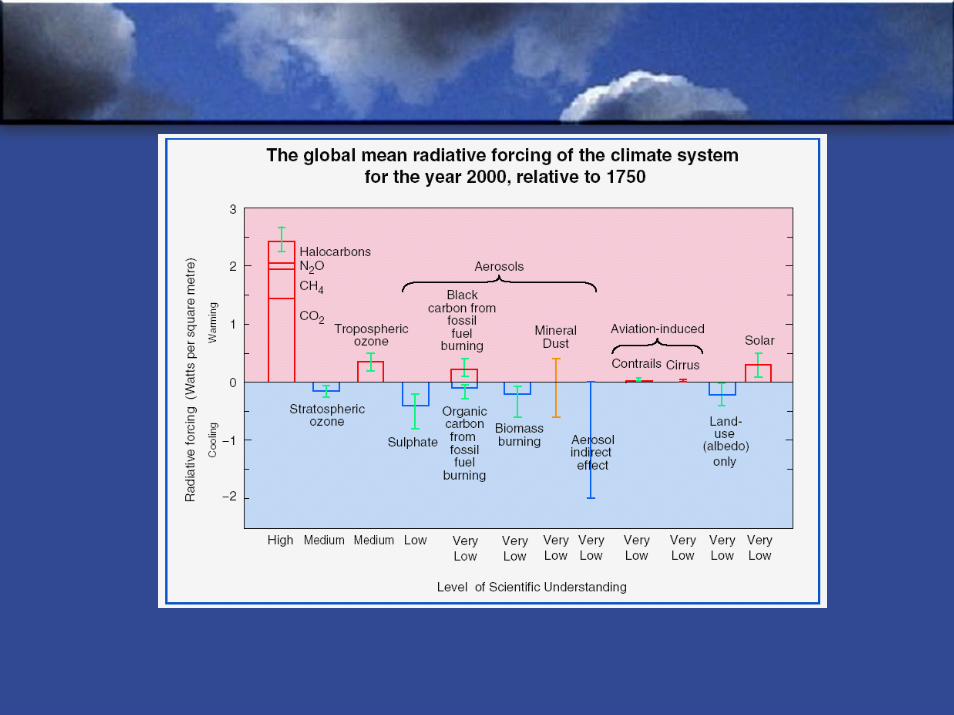
From: National Research Council, 2005: Radiative Forcing of Climate Change: Expanding the Concept and Addressing Uncertainties, Committee on Radiative Forcing Effects on Climate, Climate Research Committee, 224 pp.http://www.nap.edu/catalog/11175.html
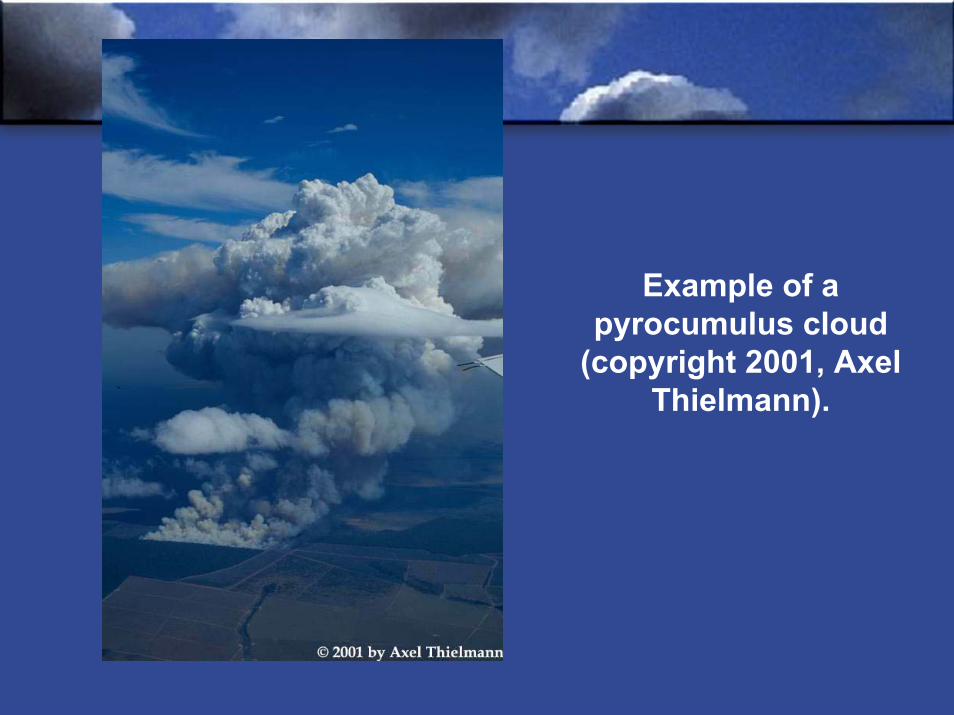
Example of a pyrocumulus cloud
(copyright 2001, AxelThielmann).
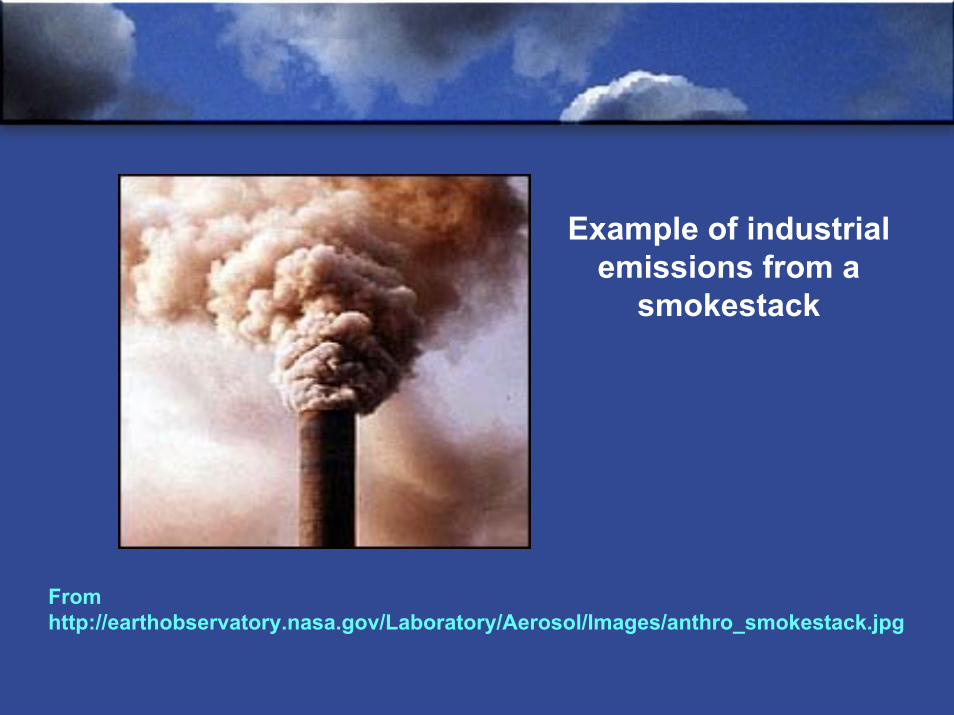
Example of industrial emissions from a
smokestack
Fromhttp://earthobservatory.nasa.gov/Laboratory/Aerosol/Images/anthro_smokestack.jpg
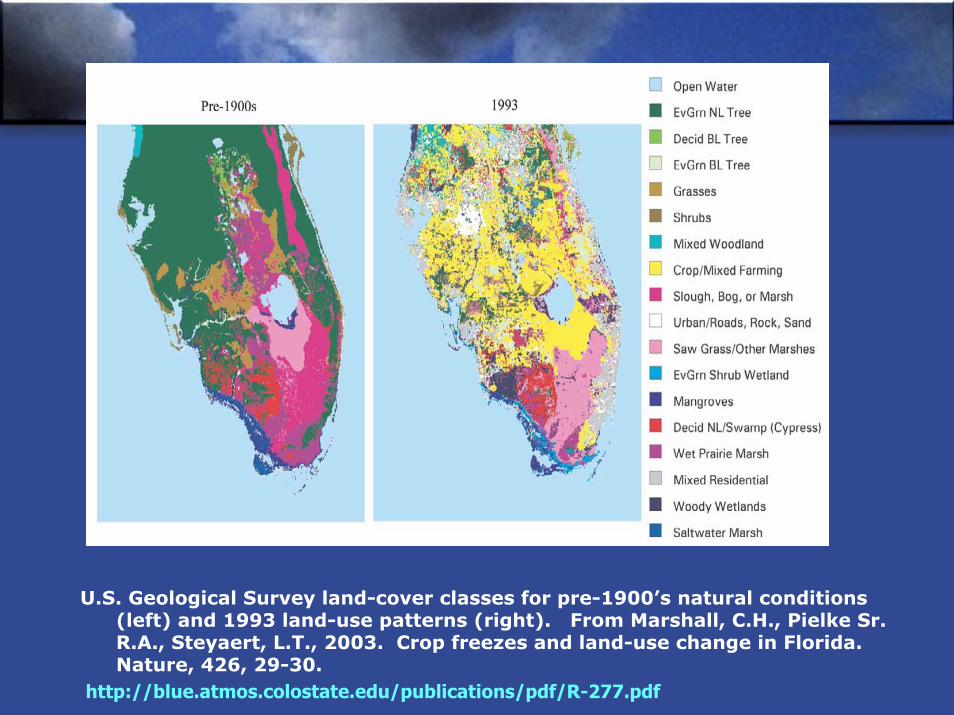
U.S. Geological Survey land-cover classes for pre-1900’s natural conditions (left) and 1993 land-use patterns (right). From Marshall, C.H., Pielke Sr. R.A., Steyaert, L.T., 2003. Crop freezes and land-use change in Florida. Nature, 426, 29-30.
http://blue.atmos.colostate.edu/publications/pdf/R-277.pdf
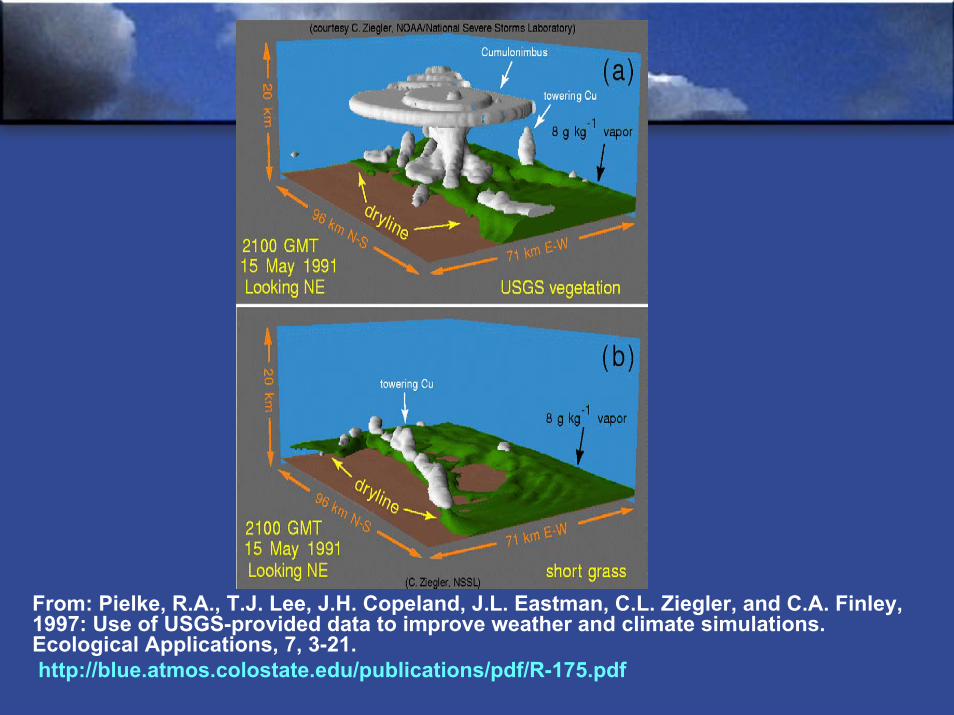
From: Pielke, R.A., T.J. Lee, J.H. Copeland, J.L. Eastman, C.L. Ziegler, and C.A. Finley, 1997: Use of USGS-provided data to improve weather and climate simulations. Ecological Applications, 7, 3-21.http://blue.atmos.colostate.edu/publications/pdf/R-175.pdf
• A Global Averages Surface Temperature Trend Tells Us Little About These Human Climate Forcings
• Most of the Climate Forcings Are On Regional Scales But Have Global Effects
• The Existence of These Human Climate Forcings Makes Multi-Decadal Climate Prediction A Very Difficult Task
What is an Alternative for Decision Makers If Skillful Multi-
decadal Climate Prediction are not Possible?
What is an Alternative for Decision Makers If Skillful Multi-
decadal Climate Prediction are not Possible?
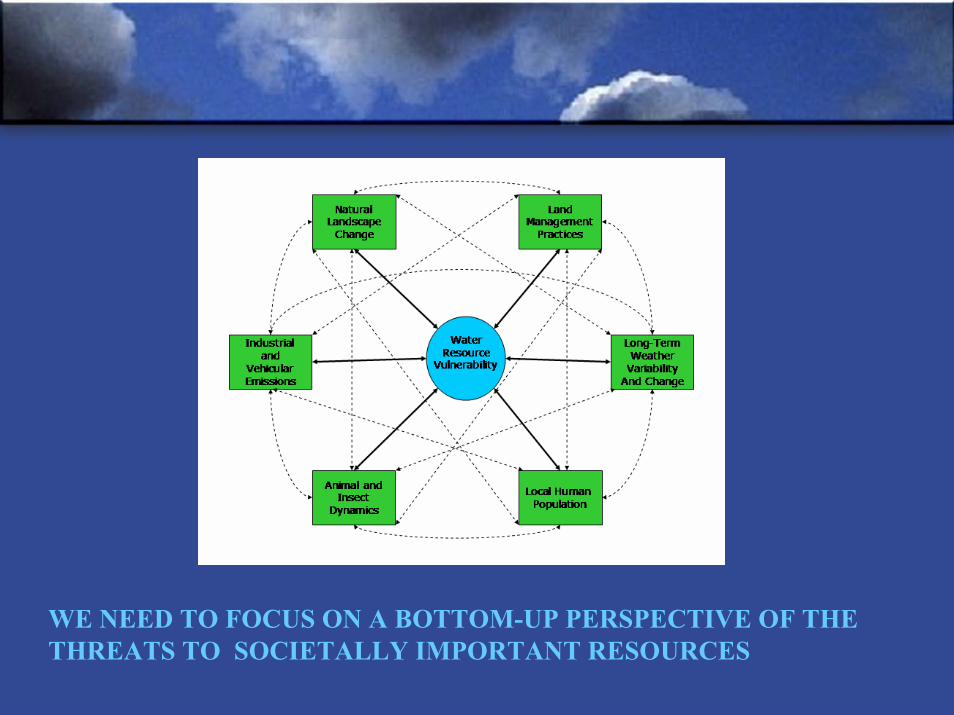
WE NEED TO FOCUS ON A BOTTOM-UP PERSPECTIVE OF THE THREATS TO SOCIETALLY IMPORTANT RESOURCES
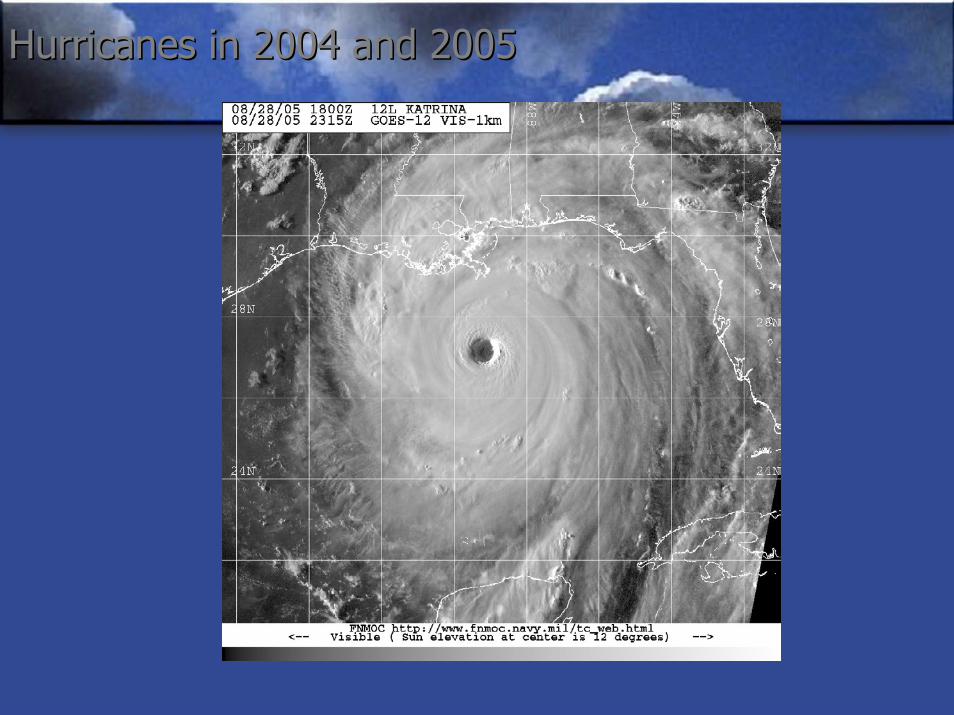
Hurricanes in 2004 and 2005Hurricanes in 2004 and 2005
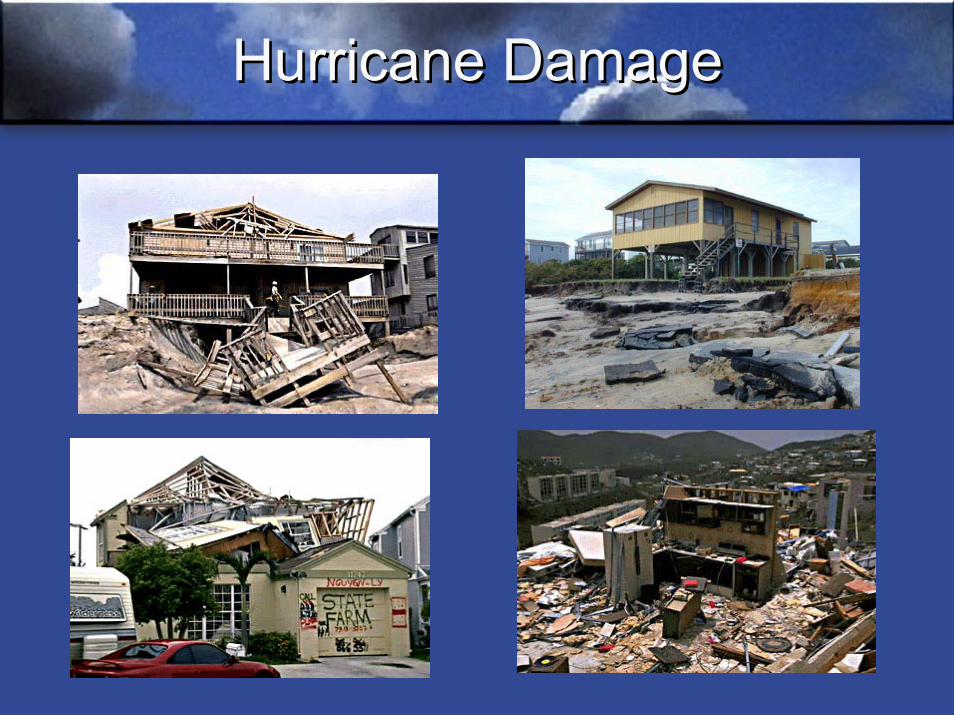
Hurricane DamageHurricane Damage
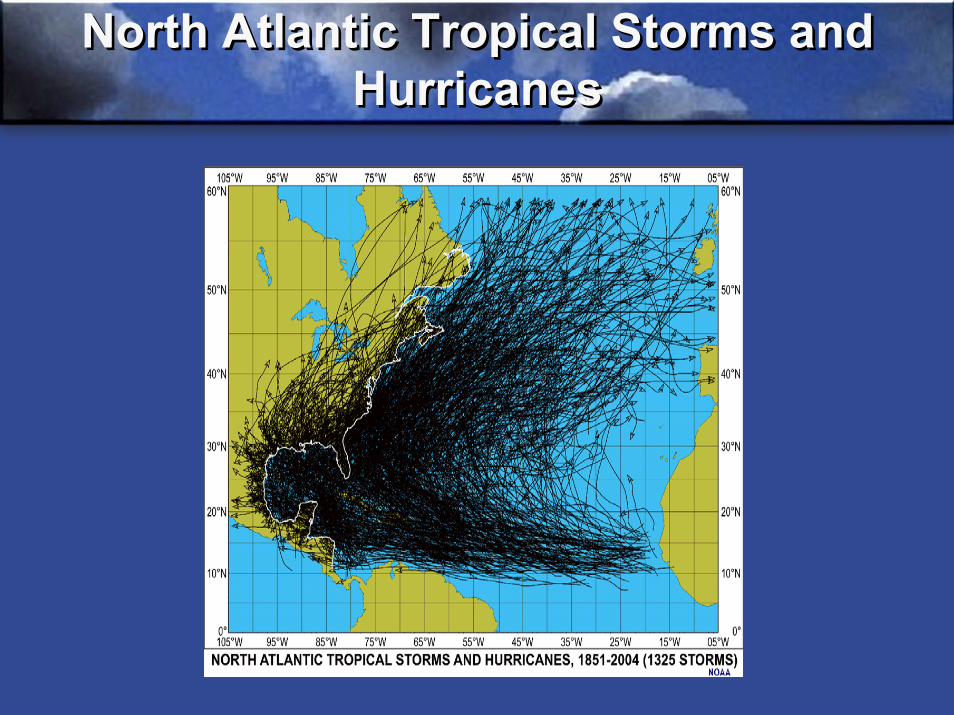
North Atlantic Tropical Storms and Hurricanes
North Atlantic Tropical Storms and Hurricanes
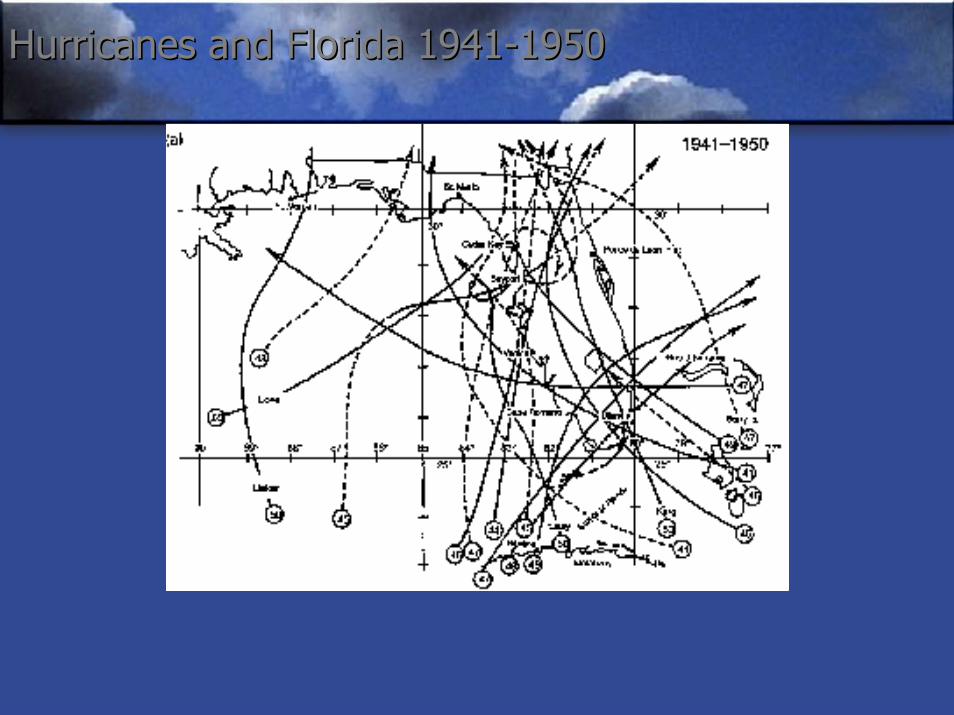
Hurricanes and Florida 1941Hurricanes and Florida 1941--19501950
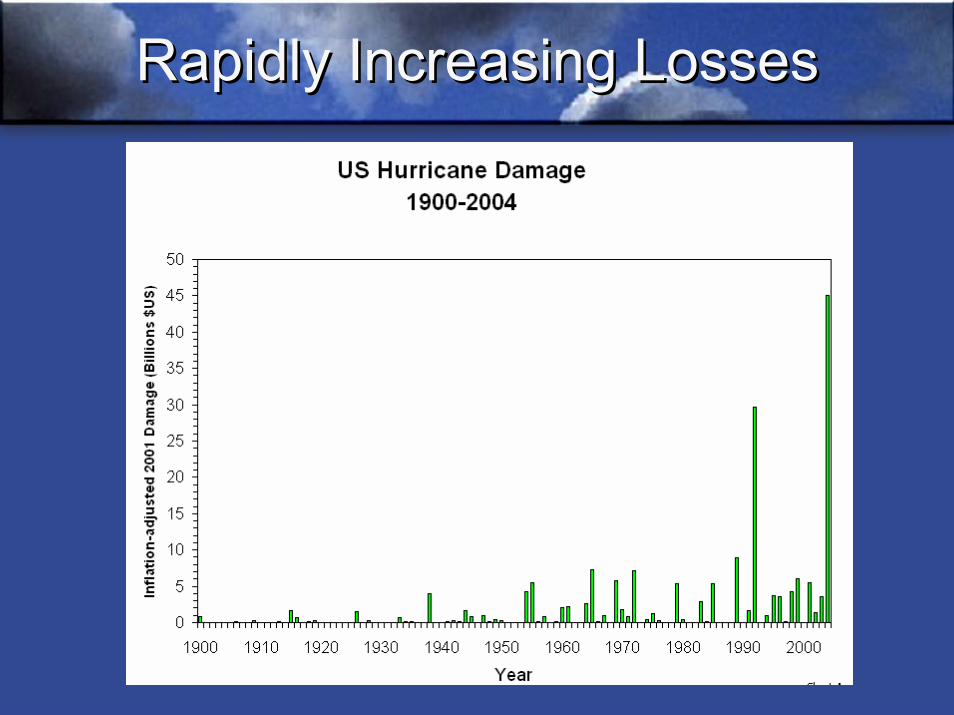
Rapidly Increasing LossesRapidly Increasing Losses
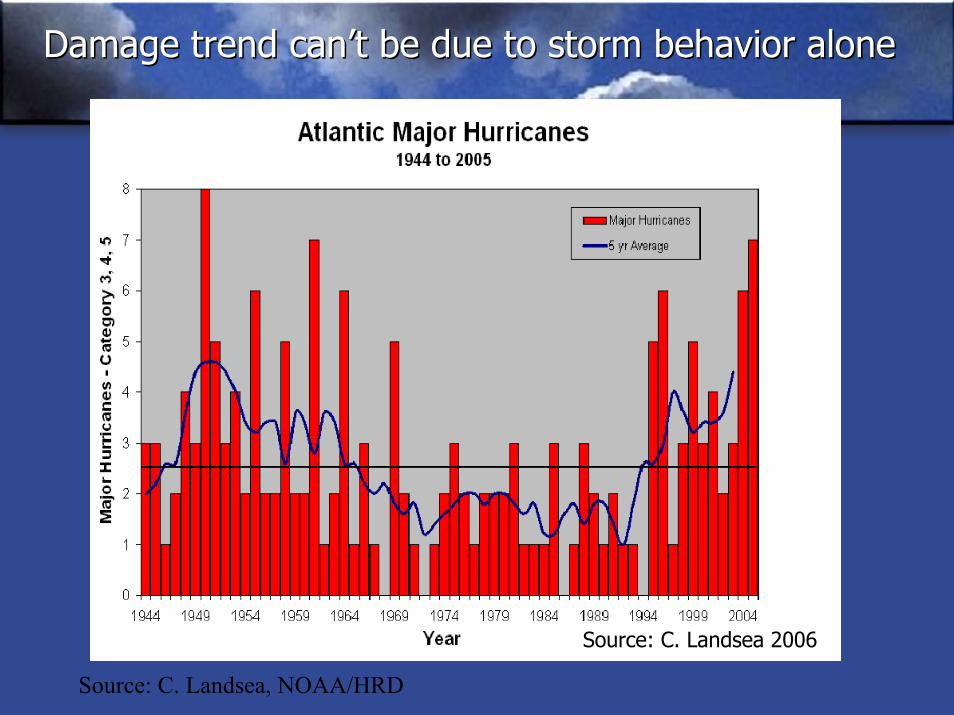
Damage trend can’t be due to storm behavior aloneDamage trend can’t be due to storm behavior alone
Source: C. Landsea 2006Source: C. Landsea 2006
Source: C. Landsea, NOAA/HRD
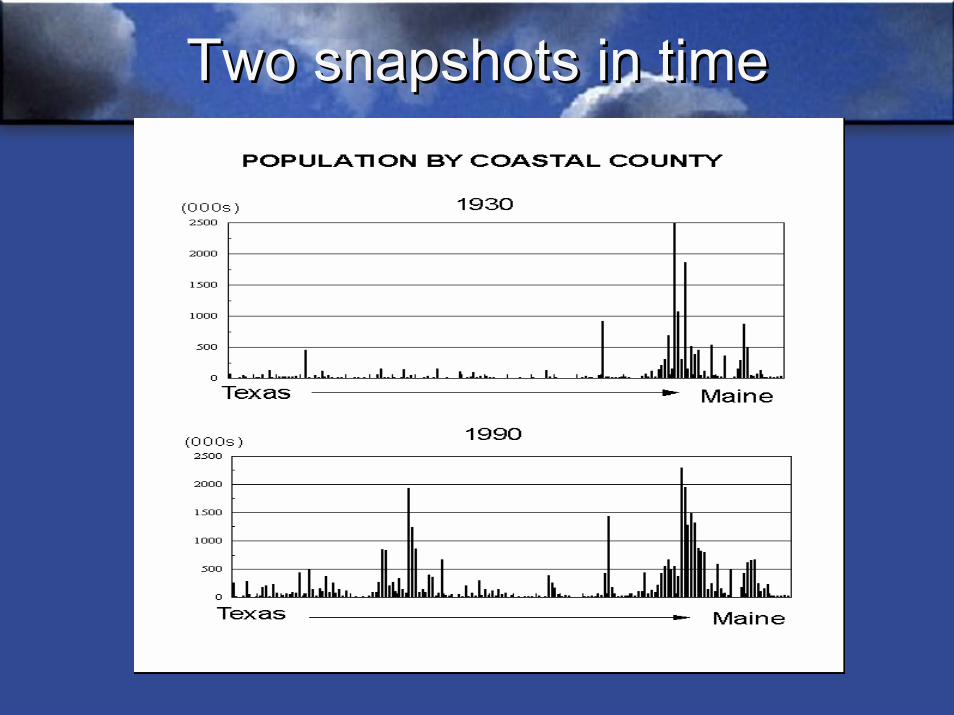
Two snapshots in timeTwo snapshots in time
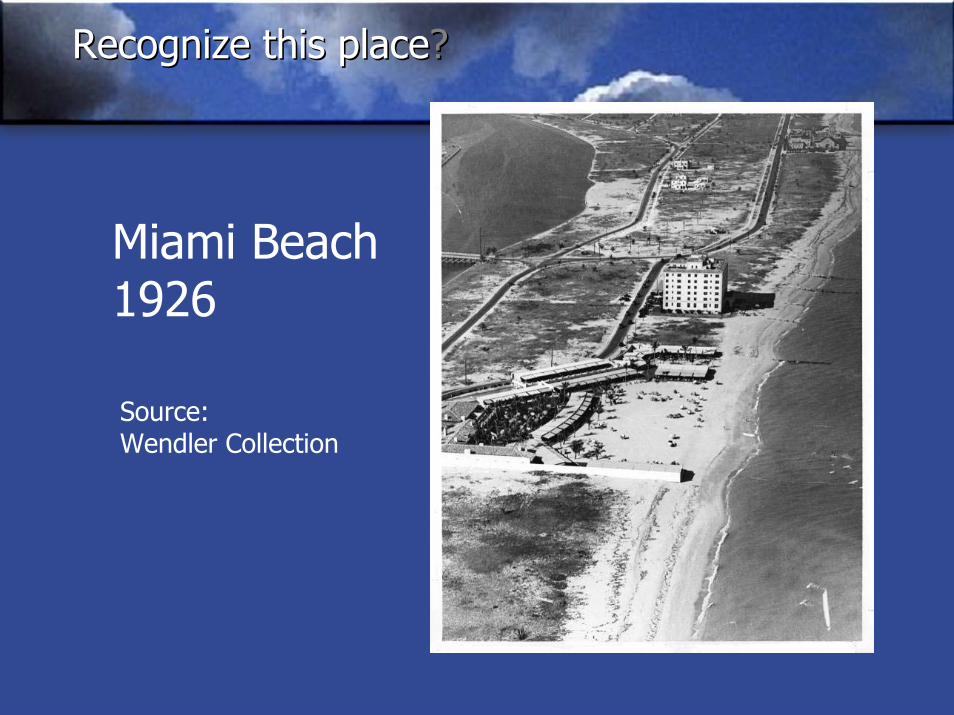
Recognize thisRecognize this placeplace??
Miami Beach1926
Source:Wendler Collection
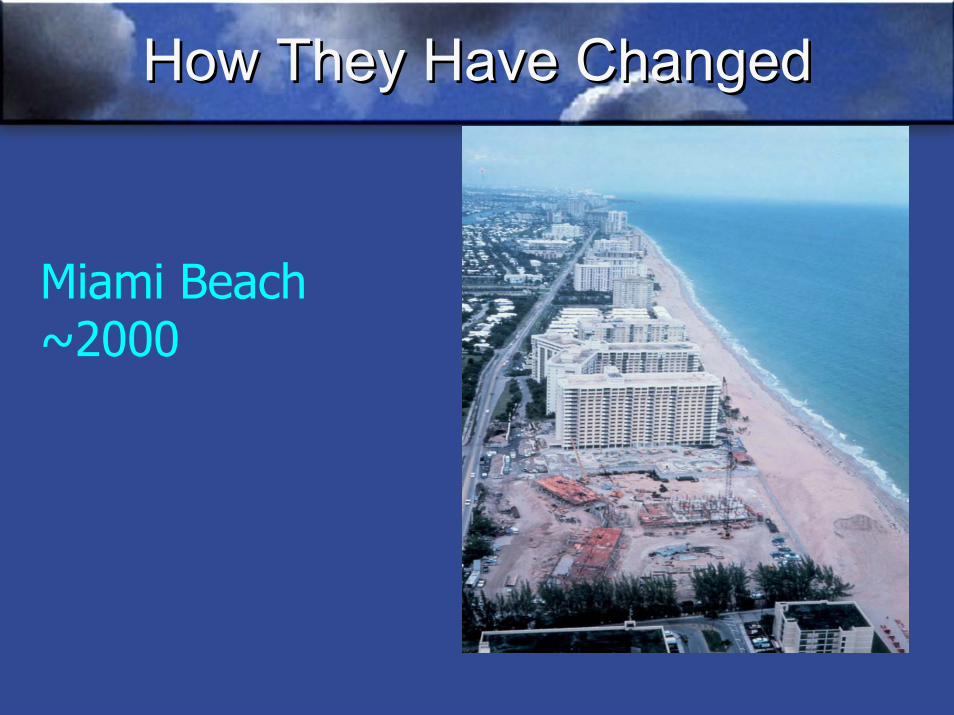
How They Have ChangedHow They Have Changed
Miami Beach~2000
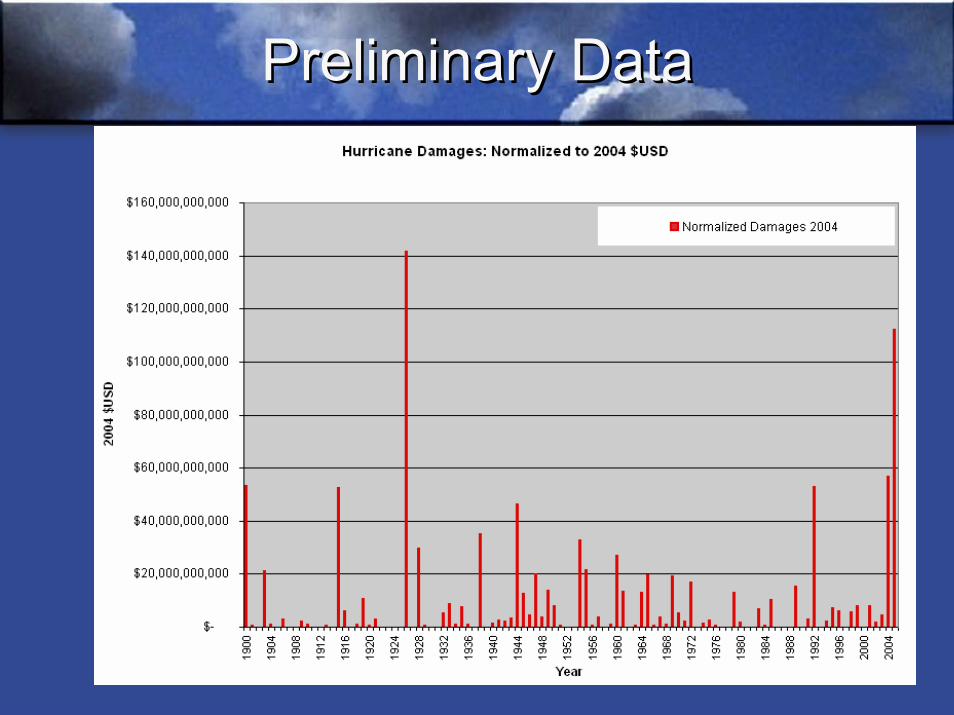
Preliminary DataPreliminary Data
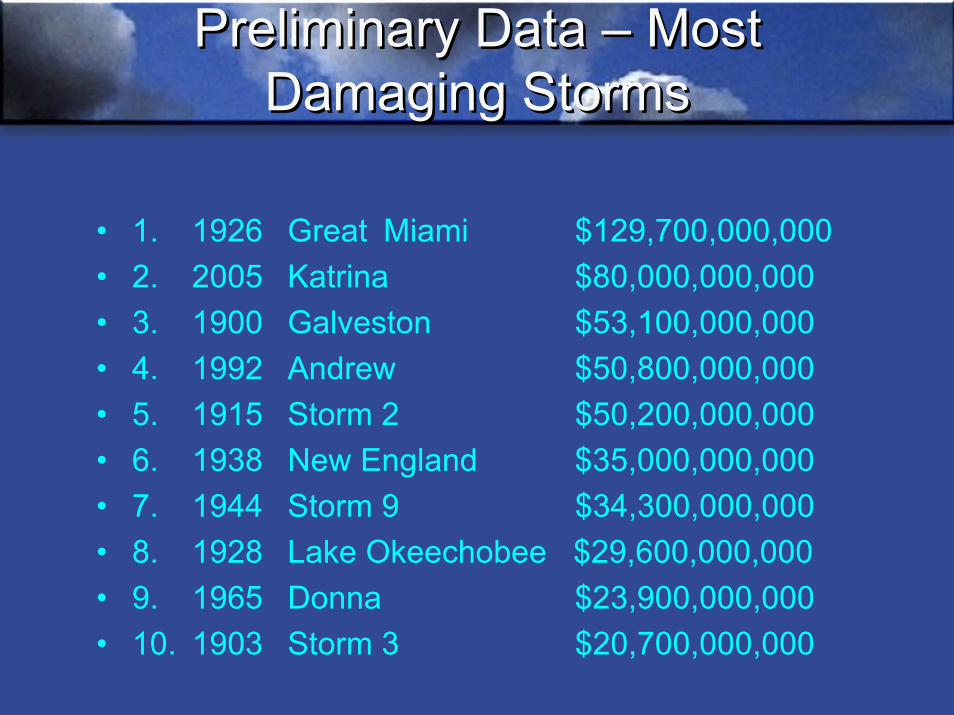
Preliminary Data – Most Damaging Storms
Preliminary Data – Most Damaging Storms
• 1. 1926 Great Miami $129,700,000,000• 2. 2005 Katrina $80,000,000,000• 3. 1900 Galveston $53,100,000,000• 4. 1992 Andrew $50,800,000,000• 5. 1915 Storm 2 $50,200,000,000• 6. 1938 New England $35,000,000,000• 7. 1944 Storm 9 $34,300,000,000• 8. 1928 Lake Okeechobee $29,600,000,000• 9. 1965 Donna $23,900,000,000• 10. 1903 Storm 3 $20,700,000,000
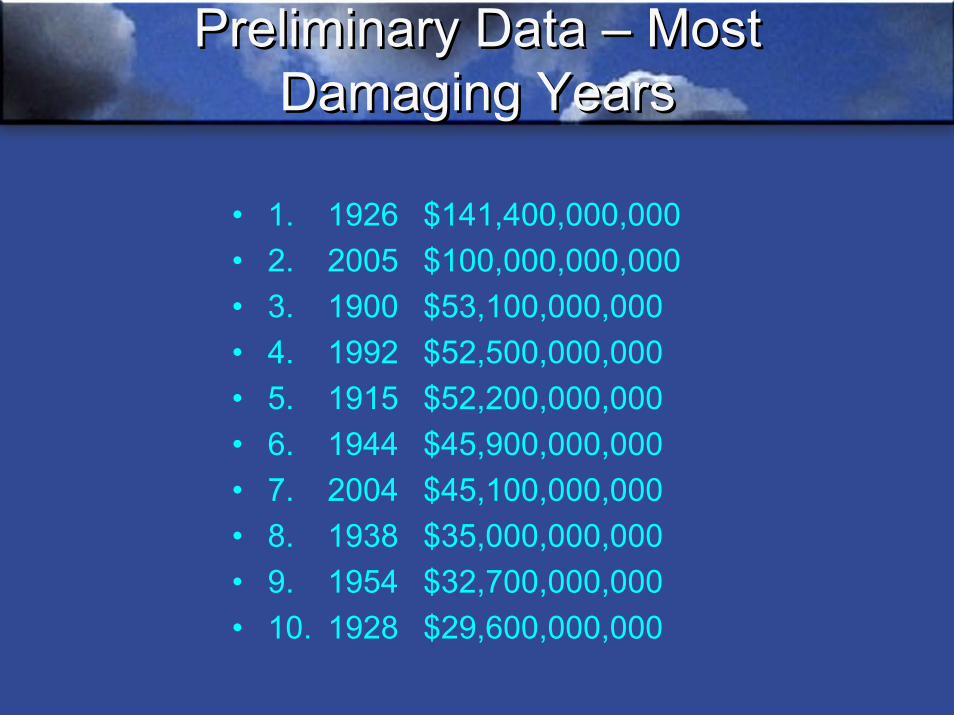
Preliminary Data – Most Damaging Years
Preliminary Data – Most Damaging Years
• 1. 1926 $141,400,000,000• 2. 2005 $100,000,000,000• 3. 1900 $53,100,000,000• 4. 1992 $52,500,000,000• 5. 1915 $52,200,000,000• 6. 1944 $45,900,000,000• 7. 2004 $45,100,000,000• 8. 1938 $35,000,000,000• 9. 1954 $32,700,000,000• 10. 1928 $29,600,000,000
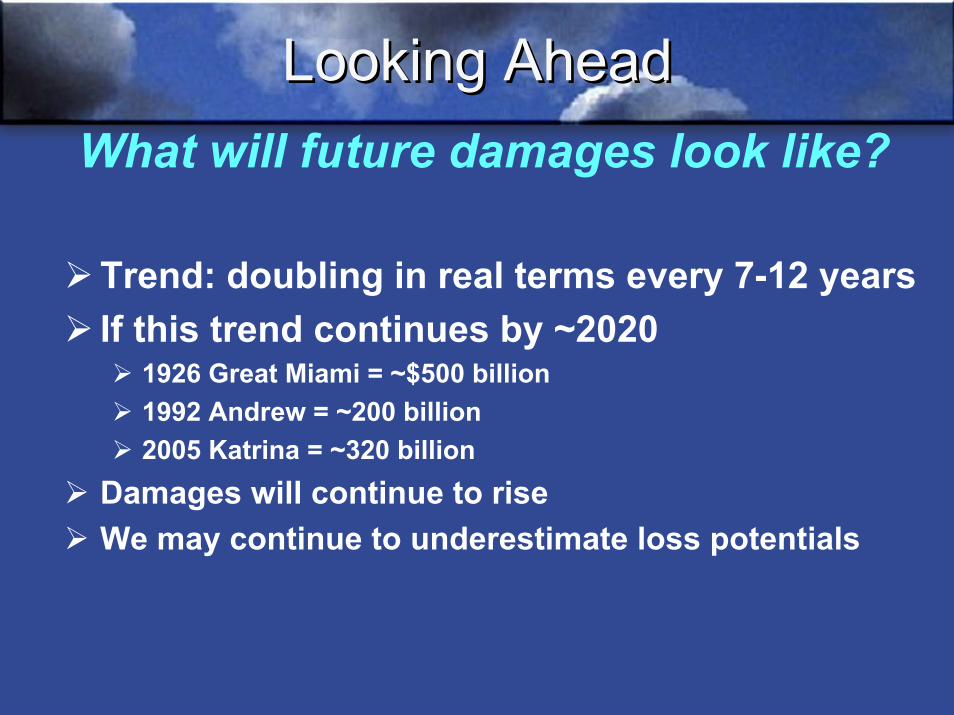
Looking AheadLooking AheadWhat will future damages look like?
Trend: doubling in real terms every 7-12 yearsIf this trend continues by ~2020
1926 Great Miami = ~$500 billion1992 Andrew = ~200 billion2005 Katrina = ~320 billion
Damages will continue to riseWe may continue to underestimate loss potentials
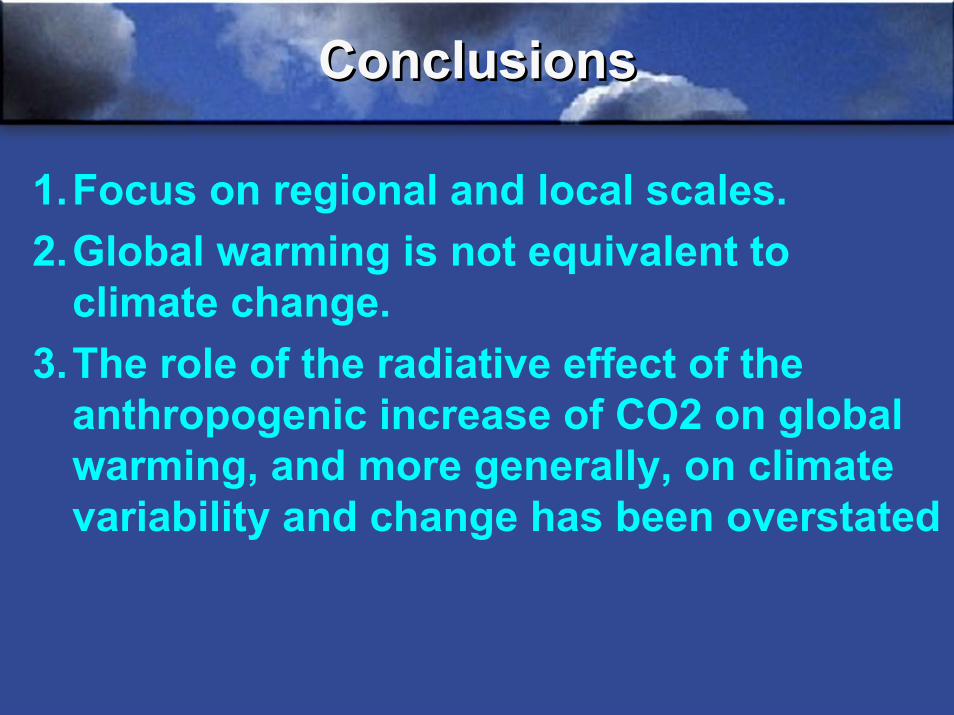
ConclusionsConclusions
1.Focus on regional and local scales. 2.Global warming is not equivalent to
climate change. 3.The role of the radiative effect of the
anthropogenic increase of CO2 on global warming, and more generally, on climate variability and change has been overstated
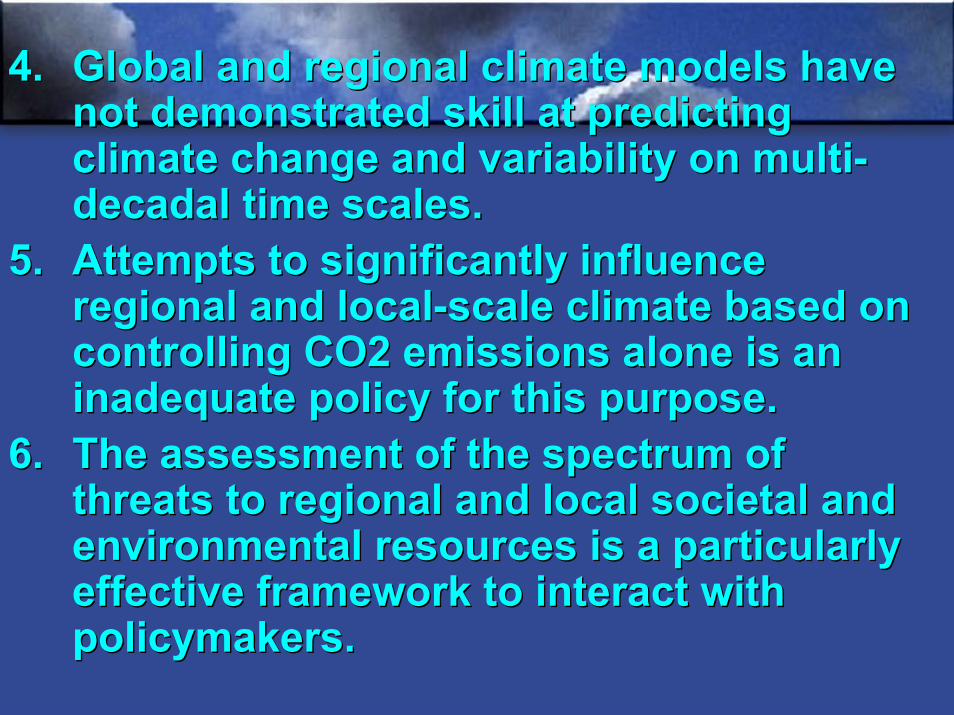
4. Global and regional climate models have not demonstrated skill at predicting climate change and variability on multi-decadal time scales.
5. Attempts to significantly influence regional and local-scale climate based on controlling CO2 emissions alone is an inadequate policy for this purpose.
6. The assessment of the spectrum of threats to regional and local societal and environmental resources is a particularly effective framework to interact with policymakers.
Publications and Presentations available at:
Pielke Sr.’s Research Grouphttp://blue.atmos.colostate.edu
Pielke Jr.’s Research Grouphttp://sciencepolicy.colorado.edu/
Publications and Presentations available at:
Pielke Sr.’s Research Grouphttp://blue.atmos.colostate.edu
Pielke Jr.’s Research Grouphttp://sciencepolicy.colorado.edu/
Weblogshttp://climatesci.atmos.colostate.edu
http://sciencepolicy.colorado.edu/prometheus/
Presentation Prepared by Dallas Staley
Research Coordinator970-491-8293
Email for copies of papers or presentations
Presentation Prepared by Dallas Staley
Research Coordinator970-491-8293
Email for copies of papers or presentations