Embed Size (px)
Citation preview
Prediction and Entropy of Printed EnglishBy C. E. SHANNON
(Manuscript Received Sept. 75,
A new method of estimating the entropy and redundancy of a language isdescribed. This method exploits the knowledge of the language statistics pos-sessed by those who speak the language, and depends on experimental resultsin prediction of the next letter when the preceding text is known. Results ofexperiments in prediction are given, and some properties of an ideal predictor aredeveloped.
1. INTRODUCTION
IN A previous paper1 the entropy and redundancy of a language havebeen defined. The entropy is a statistical parameter which measures,
in a certain sense, how much information is produced on the average foreach letter of a text in the language. If the language is translated into binarydigits (0 or 1) in the most efficient way, the entropy // is the average numberof binary digits required per letter of the original language. The redundancy,on the other hand, measures the amount of constraint imposed on a text inthe language due to its statistical structure, e.g., in English the high fre-quency of the letter £, the strong tendency of H to follow T or of V to followQ. It was estimated that when statistical effects extending over not morethan eight letters are considered the entropy is roughly 2.3 bits per letter,the redundancy about 50 per cent.
Since then a new method has been found for estimating these quantities,which is more sensitive and takes account of long range statistics, influencesextending over phrases, sentences, etc. This method is based on a study ofthe predictability of English; how well can the next letter of a text be pre-dicted when the preceding N letters are known. The results of some experi-ments in prediction will be given, and a theoretical analysis of some of theproperties of ideal prediction. By combining the experimental and theoreti-cal results it is possible to estimate upper and lower bounds for the entropyand redundancy. From this analysis it appears that, in ordinary literaryEnglish, the long range statistical effects (up to 100 letters) reduce theentropy to something of the order of one bit per letter, with a correspondingredundancy of roughly 75%. The redundancy may be still higher whenstructure extending over paragraphs, chapters, etc. is included. However, asthe lengths involved are increased, the parameters in question become more
1 C. E. Shannon, "A Mathematical Theory of Communication," Bell System TechnicalJournal, v. 27, pp. 379-423, 623-656, July, October, 1948.
50
PREDICTION AND ENTROPY OF PRINTED ENGLISH 51
tic and uncertain, and they depend more critically on the type of text
involved.
2. ENTROPY CALCULATION FROM TIIK STATISTICS OF ENGLISH
One method of calculating the entropy // is by a series of approximations7? Fi , F-2 > ' ' ' ' which successively take more and more of the statisticsf the language into account and approach 77 as a limit. Fx may be called
the Y-grani entropy; it measures the amount of information or entropy dueto statistics extending over A" adjacent letters of text. F.v is given by1
FN = -Tfp(bi,j) \0gzpbi(j)V) , ,
= ~Z p(bi,j) lo&pQi.j) + Z p(^ log #(6V)i.j 1:
in which: bi is a block of _Y-1 letters [(Ar-l)-gram]
j is an arbitrary letter following hi
p(bi , j) is the probability of the JV-gram 6» , j
pbi(j) is the conditional probability of letter j after the block b,,
and is given by p(b{ , j)/p(bf).
The equation (1) can be interpreted as measuring the average uncertainty(conditional entropy) of the next letter /' when the preceding _V-1 letters areknown. As .V is increased, /'V includes longer and longer range statisticsand the entropy, 77, is given by the limiting value of FN as N — -> ^ :
H = Lim TV . (2)JV-»oo
The T-gram entropies F.\ for small values of N can be calculated fromstandard tables of letter, digram and trigram frequencies.2 If spaces andpunctuation are ignored we have a twenty-six letter alphabet and Ff, maybe taken (by definition) to be log-2 26, or 4.7 bits per letter. 7<\ involves letterfrequencies and is given by
26
Fi = — X) p(i) Iog2 p(i) = 4.14 bits per letter. (3)t— i
The digram approximation 7^ gives the result
(4)
= 7.70 - 4.14 = 3.56 bits per letter.2 Fletcher Pratt, "Secret and Urgent," Blue Ribbon Books, 1942.

52 TIIK BELL SYSTEM TECHNICAL JOURNAL, JANUARY 1951
The trigram entropy is given by
F-i = - Z p(i,j,k) log, p,-j(k)
X p(i, j, k) log, p(i, j, k) (*, j) log, p(i, j) (5)
= 11.0 - 7,7 = 3.3
In this calculation the trigram table2 used did not take into account tri-grams bridging two words, such as WOW and OWO in TWO WORDS. Tocompensate partially for this omission, corrected trigram probabilities p(it
j, k) were obtained from the probabilities p'(i,j, k) of the table by the follow-ing rough formula:
, J, = ~ p'(i,j, k) + ~ r(f)p(j, k)
where r(i) is the probability of letter i as the terminal letter of a word ands(k) is the probability of k as an initial letter. Thus the trigrams withinwords (an average of 2.5 per word) are counted according to the table; thebridging trigrams (one of each type per word) are counted approximatelyby assuming independence of the terminal letter of one word and the initialdigram in the next or vice versa. Because of the approximations involvedhere, and also because of the fact that the sampling error in identifyingprobability with sample frequency is more serious, the value of F;i is lessreliable than the previous numbers.
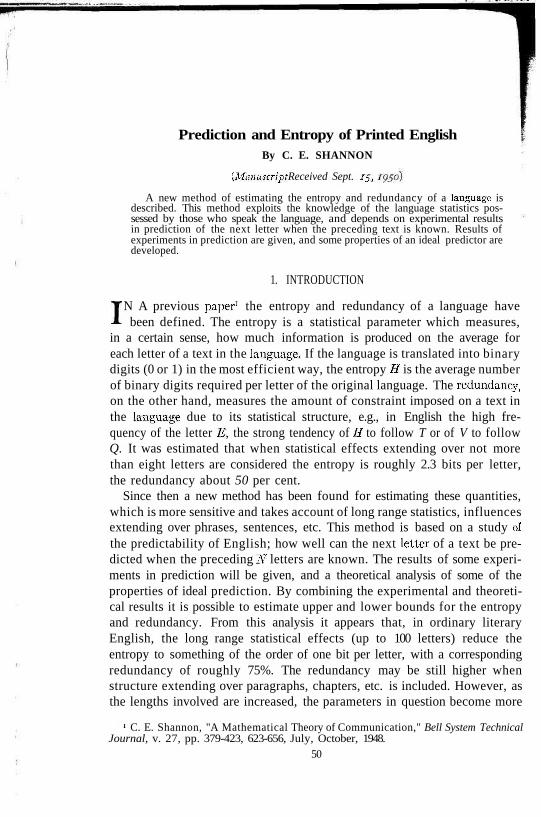
Since tables of .Y-gram frequencies were not available for ,Y > 3, F^ , Fj ,etc. could not be calculated in the same way. However, word frequencieshave been tabulated3 and can be used to obtain a further approximation.Figure 1 is a plot on log-log paper of the probabilities of words againstfrequency rank. The most frequent English word "the" has a probability.071 and this is plotted against 1. The next most frequent word "of" has aprobability of .034 and is plotted against 2, etc. Using logarithmic scalesboth for probability and rank, the curve is approximately a straight linewith slope — 1 ; thus, if pn is the probability of the rath most frequent word,we have, roughly
Zipf4 has pointed out that this type of formula, pn = k/n, gives a rather goodapproximation to the word probabilities in many different languages. The
3 G. De\vcy, "Relative Frequency of English Speech Sounds," Harvard UniversityPress, 1923.
1 G. K. Zipf, "Human Behavior and the Principle of Least Effort," Acldison-WesleyPress, 1949.
PREDICTION AND KNTROPY OF PRINTED ENGLISH 53
uja (6) clearly cannot hold indefinitely since the total probability ~2pn
t ke unity, while 2^ .!/« is infinite. If we assume (in the absence of any
h tier estimate) that the formula pn = .\/n holds out to the n at which the
0.1
0.01
0.001
0.0001
0.00001
-SAY
XREALLY
X-QUALITY
2 4 6 8 10 20 40 60 10O 200 400 1OOO 2000 4000 10,000WORD ORDER
Fig. 1—Relative frequency against rank for English words.
total probability is unity, and that pn — 0 for larger n, we find that thecritical n is the word of rank 8,727. The entropy is then:
8727
— / ! pn Iog2 pn = 11.82 bits per word, (7)i
or 11,82/4.5 = 2.62 bits per letter since the average word length in Englishis 4.5 letters. One might be tempted to identify this value with F4 .B , butactually the ordinate of the /*'>• curve at N = 4.5 will be above this value.The reason is that F4 or F;, involves groups of four or five letters regardlessof word division. A word is a cohesive group of letters with strong internal
54 THE BELL SYSTEM TECHNICAL JOURNAL, JANUARY 1951
statistical influences, and consequently the ]V-grams within words are .restricted than those which bridge words. The effect of this is that we hav(
obtained, in 2.62 bits per letter, an estimate which corresponds more nearly
to, say, F!, or F$.A similar set of calculations was carried out including the space as aj
additional letter, giving a 27 letter alphabet. The results of both 26- anj27-letter calculations are summarized below:
PREDICTION AND ENTROPY OF PRINTED ENGLISH 55
26 letter27 letter
Fa
4.704.76
Pi4.144.03
3.563.32
F, fword3.3 2.623.1 2.14
The estimate of 2.3 for 7;s, alluded to above, was found by several methods
one of which is the extrapolation of the 26-letter series above out to thatpoint. Since the space symbol is almost completely redundant when se-quences of one or more words are involved, the values of FN in the 27-letter
4.5case will be —- or .818 of FN for the 26-letter alphabet when TV is reasonablyO .O
large.3. PREDICTION OF ENGLISH
The new method of estimating entropy exploits the fact that anyonespeaking a language possesses, implicitly, an enormous knowledge of thestatistics of the language. Familiarity with the words, idioms, cliches andgrammar enables him to fill in missing or incorrect letters in proof-reading,or to complete an unfinished phrase in conversation. An experimental demon-stration of the extent to which English is predictable can be given as follows;Select a short passage unfamiliar to the person who is to do the predicting,He is then asked to guess the first letter in the passage. If the guess is correcthe is so informed, and proceeds to guess the second letter. If not, he is tolcthe correct first letter and proceeds to his next guess. This is continuecthrough the text. As the experiment progresses, the subject writes down thcorrect text up to the current point for use in predicting future letters. Thresult of a typical experiment of this type is given below. Spaces were in-cluded as an additional letter, making a 27 letter alphabet. The first line i-the original text; the second line contains a dash for each letter correctlyguessed. In the case of incorrect guesses the correct letter is copied in th
second line.(1) THE ROOM WAS NOT VERY LIGHT A SMALL OBLONG ..,(2) ROD NOT-? 1 SM OBL
(1) READING LAMP ON THE DESK SHED GLOW ON(2) REA 0 D SHED-GLO--0--(1) POLISHED WOOD BUT LESS ON THE SHABBY RED CARPET(2) P-L-S 0---BU--L-S-0 SH RE-C
total of 129 letters, 89 or 69% were guessed correctly. The errors, as., , e expected, occur most frequently at the beginning of words and
W<il hies where the line of thought has more possibility of branching out. ItS '̂ ht be thought that the second line in (8), which we will call the reduced
contains much less information than the first. Actually, both lines con-.' .. game information in the sense that it is possible, at least in prin-
• 1 to recover the first line from the second. To accomplish this we needidentical twin of the individual who produced the sequence. The twin
, kO must be mathematically, not just biologically identical) will respond in, same way when faced with the same problem. Suppose, no\v, we have
i the reduced text of (8). We ask the twin to guess the passage. At eachoint we will know whether his guess is correct, since he is guessing the same
the first twin and the presence of a dash in the reduced text correspondsto a correct guess. The letters he guesses wrong are also available, so that ateach stage he can be supplied with precisely the same information the firsttwin had available.
COMPARISON COMPARISONU^!XT
~~ 14-~ *
PREDICTOR 4
REDUCED TEXT
*•
^L— *•
PREDICTOR
TEXT
1 ~*
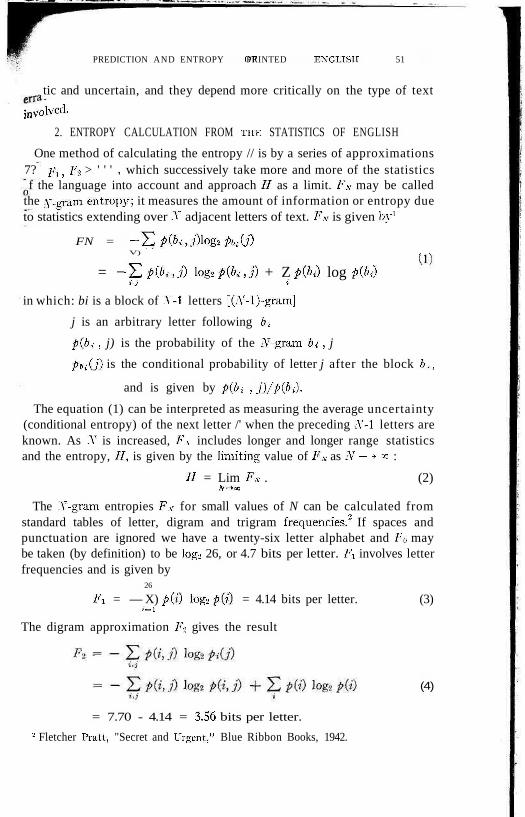
4Fig. 2—Communication system using reduced text.
The need for an identical twin in this conceptual experiment can beeliminated as follows. In general, good prediction does not require knowl-edge of more than N preceding letters of text, with N fairly small. There areonly a finite number of possible sequences of N letters. We could ask thesubject to guess the next letter for each of these possible .V-grams. The com-plete list of these predictions could then be used both for obtaining thereduced text from the original and for the inverse reconstruction process.
To put this another way, the reduced text can be considered to be anencoded form of the original, the result of passing the original text througha reversible transducer. In fact, a communication system could be con-structed in which only the reduced text is transmitted from one point tothe other. This could be set up as shown in Fig. 2, with two identical pre-diction devices.
An extension of the above experiment yields further information con-cerning the predictability of English. As before, the subject knows the textup to the current point and is asked to guess the next letter. If he is wrong,he is told so and asked to guess again. This is continued until he finds thecorrect letter. A typical result with this experiment is shown below. The
56 THE BELT. SYSTEM TECHNICAL JOURNAL, JANUARY 1951R
first line is the original text and the numbers in the second line indicate thcrguess at which the correct letter was obtained.
(1) T H E R E I S N O R E V E R S E O N A M O T O R C Y C(2) 1 1 1 5 1 1 2 1 1 2 1 1 151 1 7 1 1 1 2 1 3 2 1 2 2 7 1 1 1 1 4 1 1 1
(1) F R I E N D O F M I N E F O U N D T H I S O U T( 2 ) 8 6 1 3 1 1 1 1 1 1 1 1 1 1 1 6 2 1 1 1 1 1 1 2 1 1 1 1 1 1
(1) R A T H E R D R A M A T I C A L L Y T H E O T H E R
PREDICTION AND ENTROPY OF PRINTED ENGLISH 57
L E A
1 l 3 j
D A Y
(2) 4 1 1 1 1 1 1 11 5 1 1 1 1 1 1 1 1 1 1 1 6 1 1 1 1 1 1 1 1 1 1 1 1 1 (9)
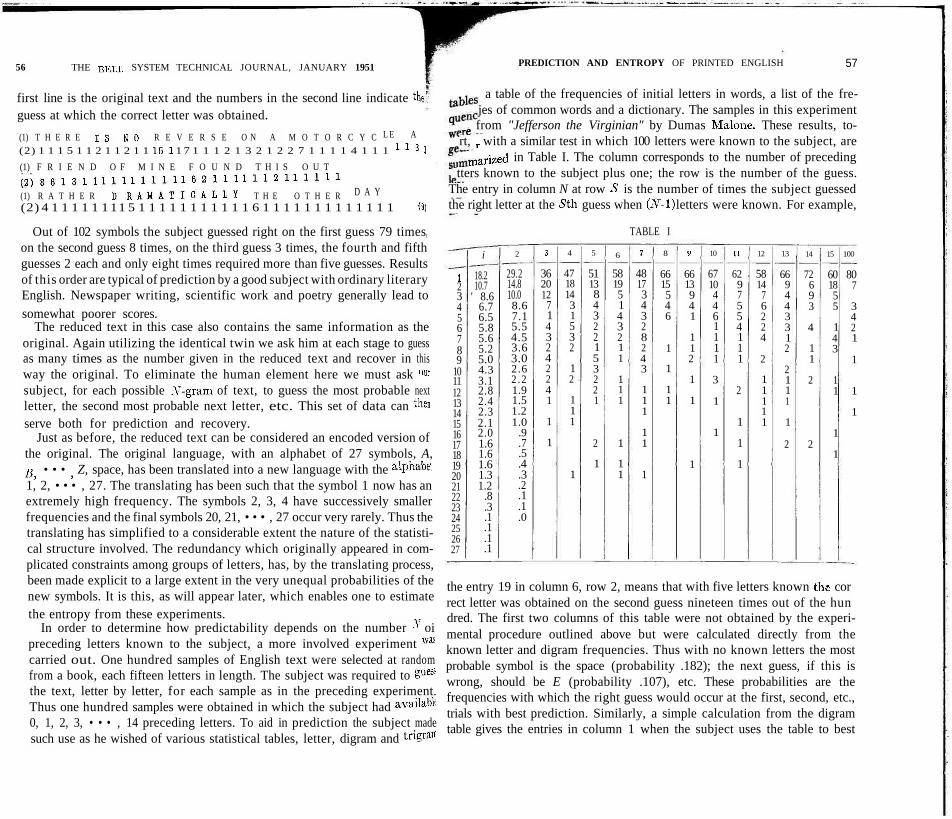
Out of 102 symbols the subject guessed right on the first guess 79 timeson the second guess 8 times, on the third guess 3 times, the fourth and fifthguesses 2 each and only eight times required more than five guesses. Resultsof this order are typical of prediction by a good subject with ordinary literaryEnglish. Newspaper writing, scientific work and poetry generally lead tosomewhat poorer scores.
The reduced text in this case also contains the same information as theoriginal. Again utilizing the identical twin we ask him at each stage to guessas many times as the number given in the reduced text and recover in thisway the original. To eliminate the human element here we must ask outsubject, for each possible .V-gram of text, to guess the most probable nextletter, the second most probable next letter, etc. This set of data can thenserve both for prediction and recovery.
Just as before, the reduced text can be considered an encoded version ofthe original. The original language, with an alphabet of 27 symbols, A,B, • • • , Z, space, has been translated into a new language with the alphabet1, 2, • • • , 27. The translating has been such that the symbol 1 now has anextremely high frequency. The symbols 2, 3, 4 have successively smallerfrequencies and the final symbols 20, 21, • • • , 27 occur very rarely. Thus thetranslating has simplified to a considerable extent the nature of the statisti-cal structure involved. The redundancy which originally appeared in com-plicated constraints among groups of letters, has, by the translating process,been made explicit to a large extent in the very unequal probabilities of thenew symbols. It is this, as will appear later, which enables one to estimatethe entropy from these experiments.
In order to determine how predictability depends on the number .V oipreceding letters known to the subject, a more involved experiment wascarried out. One hundred samples of English text were selected at randomfrom a book, each fifteen letters in length. The subject was required to gues<the text, letter by letter, for each sample as in the preceding experiment.Thus one hundred samples were obtained in which the subject had available0, 1, 2, 3, • • • , 14 preceding letters. To aid in prediction the subject madesuch use as he wished of various statistical tables, letter, digram and trigrair.
a table of the frequencies of initial letters in words, a list of the fre-jes of common words and a dictionary. The samples in this experimentfrom "Jefferson the Virginian" by Dumas Maloiie. These results, to-
rt, r with a similar test in which 100 letters were known to the subject, aremarized in Table I. The column corresponds to the number of preceding
tters known to the subject plus one; the row is the number of the guess.The entry in column N at row 5 is the number of times the subject guessedthe right letter at the Si\\ guess when (N-\) letters were known. For example,
TABLE I
J23456789
101112131415161718192021222324252627
i
18.210.7
' 8.66.76.55.85.65.25.04.33.12.82.42.32.12.01.61.61.61.31.2
.8
.3
.1
.1
.1
.1
2
29.214.810.08.67.15.54.53.63.02.62 .21.91.51.21.0
.9
.7
.5
.4
.3
.2
.1
.1
.0
3
362012
7143242241
1
1
4
47181431532
12
111
1
5
511384322153221
2
1
6
58195143211
111
1
11
7
481734328243
111
11
1
8
6615546
1
1
11
»
6613941
112
1
1
1
10
67104461111
3
1
1
u
6297554111
2
1
1
1
12
5814
76224
2
11111
13
669443312
2111
1
2
14
72693
4
11
2
2
15
601855
143
11
1
1
100
807
3421
1
1
1
the entry 19 in column 6, row 2, means that with five letters known thi correct letter was obtained on the second guess nineteen times out of the hundred. The first two columns of this table were not obtained by the experi-mental procedure outlined above but were calculated directly from theknown letter and digram frequencies. Thus with no known letters the mostprobable symbol is the space (probability .182); the next guess, if this iswrong, should be E (probability .107), etc. These probabilities are thefrequencies with which the right guess would occur at the first, second, etc.,trials with best prediction. Similarly, a simple calculation from the digramtable gives the entries in column 1 when the subject uses the table to best

58 THE BELL SYSTEM TECHNICAL JOURNAL, JANUARY 1951V
advantage. Since the frequency tables are determined from long samples 0(English, these two columns are subject to less sampling error than the others
It will be seen that the prediction gradually improves, apart from son,statistical fluctuation, with increasing knowledge of the past as indicate^by the larger numbers of correct first guesses and the smaller numbers ojhigh rank guesses.
One experiment was carried out with "reverse" prediction, in which th(
subject guessed the letter preceding those already known. Although thetask is subjectively much more difficult, the scores were only slightly poorerThus, with two 101 letter samples from the same source, the subject ob.tained the following results:
No. of guess 1 2 3 4 5 6 7 8 >8Forward .................. 70 10 7 2 2 3 3 0 4Reverse ................... 66 7 4 4 6 2 1 2 9
Incidentally, the .V-grarn entropy FN for a reversed language is equal tethat for the forward language as may be seen from the second form in equa.tion (1). Both terms have the same value in the forward and reversed cases,
4. IDEAL .V-GRAM PREDICTION
The data of Table I can be used to obtain upper and lower bounds to thAT-gram entropies FN • In order to do this, it is necessary first to developsome general results concerning the best possible prediction of a languagtwhen the preceding N letters are known. There will be for the language a setof conditional probabilities/)^ , » , , • • • , *y_i (j). This is the probability whetthe (N-\) gram ii , iz , • • • , in-i occurs that the next letter will be j. Thbest guess for the next letter, when this (Ar-l) gram is known to have oc-curred, will be that letter having the highest conditional probability. Thesecond guess should be that with the second highest probability, etc. Amachine or person guessing in the best way would guess letters in the ordeiof decreasing conditional probability. Thus the process of reducing a terwith such an ideal predictor consists of a mapping of the letters into tb:numbers from 1 to 27 in such a way that the most probable next lette:[conditional on the known preceding (A7-l) gram] is mapped into 1, etcThe frequency of 1's in the reduced text will then be given by
where the sum is taken over all (N-\) grams ii , i2 , • • • , in-\ the j being tinone which maximizes p for that particular (N-\) gram. Similarly, the fnquency of 2's, q% , is given by the same formula with j chosen to be thaletter having the second highest value of p, etc.
On the basis of A7-grams, a different set of probabilities for the symbol
PREDICTION AND ENTROPY OF PRINTED ENGLISH 59
• the reduced text, q"+1, q%+i, ... , g£r+1, would normally result. Since thism H' tion is on the basis of a greater knowledge of the past, one would ex-
t the probabilities of low numbers to be greater, and in fact one canprove the following inequalities:
s sE N+1 -^ V^ w 0 1 0 fl1\qt > L, qt S = i, 2, • • • . (ii)i-i »-i
Th's means that the probability of being right in the first S guesses whenthe preceding N letters are known is greater than or equal to that when
lv C/V-1) are known, for all S. To prove this, imagine the probabilities•bd ii, " ' , i" > •?') arrang£d in a table with j running horizontally and allthe TV-grams vertically. The table will therefore have 27 columns and 27N
rows The term on the left of (11) is the sum of the S largest entries in eachrow summed over all the rows. The right-hand member of (11) is also a sumof entries from this table in which S entries are taken from each row but notnecessarily the S largest. This follows from the fact that the right-handmember would be calculated from a similar table with (TV-1) grams ratherthan TV-grams listed vertically. Each row in the TV-1 gram table is the sumof 27 rows of the TV-gram table, since:
27
p ( k j is, • • • , iy,j) = IL P(ii ,i"z, '' • , itr,j). (12).1=1
The sum of the S largest entries in a row of the TV-1 gram table will equalthe sum of the 27S selected entries from the corresponding 27 rows of theTV-gram table only if the latter fall into S columns. For the equality in (11)to hold for a particular S, this must be true of every row of the TV-1 gramtable. In this case, the first letter of the TV-gram does not affect the set of theS most probable choices for the next letter, although the ordering withinthe set may be affected. However, if the equality in (11) holds for all S, itfollows that the ordering as well will be unaffected by the first letter of theJV-gram. The reduced text obtained from an ideal .V-l gram predictor is thenidentical with that obtained from an ideal N-gram predictor.
Since the partial sums
Qs = E ql 5 = 1 , 2 , - - . (13)i-l
are monotonic increasing functions of N, < 1 for all N, they must all ap-proach limits as N —^ «>. Their first differences must therefore approachlimits as TV —> =o , i.e., the </j approach limits, q™ . These may be interpretedas the relative frequency of correct first, second, • • • , guesses with knowl-edge of the entire (infinite) past history of the text.
60 THE BELL SYSTEM TECHNICAL JOURNAL, JANUARY 1951
The ideal A7-gram predictor can be considered, as has been pointed out, t0
be a transducer which operates on the language translating it into a sequenceof numbers running from 1 to 27. As such it has the following two properties'
1. The output symbol is a function of the present input (the predictednext letter when we think of it as a predicting device) and the prece<J.ing (A7-!) letters.
2. It is instantaneously reversible. The original input can be recovered bya suitable operation on the reduced text without loss of time. In factthe inverse operation also operates on only the (N-\) preceding sym,bols of the reduced text together with the present output.
The above proof that the frequencies of output symbols with an N.\gram predictor satisfy the inequalities:
E > E <?r' 5 = 1, 2, • • • , 27 (14)
can be applied to any transducer having the two properties listed above,In fact we can imagine again an array with the various (A7-l) grams listedvertically and the present input letter horizontally. Since the present outputis a function of only these quantities there will be a definite output symbolwhich may be entered at the corresponding intersection of row and column,Furthermore, the instantaneous reversibility requires that no two entriesin the same row be the same. Otherwise, there would be ambiguity betweenthe two or more possible present input letters when reversing the transla.tion. The total probability of the 5 most probable symbols in the output,
ssay ̂ ri, will be the sum of the probabilities for 5 entries in each row, summed
iover the rows, and consequently is certainly not greater than the sum of the5 largest entries in each row. Thus we will have
Z <??>!>,• 5 = 1, 2 , . - . , 27 (15)i i
In other words ideal prediction as denned above enjoys a preferred positionamong all translating operations that may be applied to a language amwhich satisfy the two properties above. Roughly speaking, ideal predictioncollapses the probabilities of various symbols to a small group more thanany other translating operation involving the same number of letters whictis instantaneously reversible.
Sets of numbers satisfying the inequalities (15) have been studied byMuirhead in connection with the theory of algebraic inequalities.6 If (15holds when the q* and r{ are arranged in decreasing order of magnitude, ant
6 Hardy, Littlewood and Polya, "Inequalities," Cambridge University Press, 1934.
PREDICTION AND ENTROPY OF PRINTED ENGLISH 61
27 £,. 53of = 2-*ri, (this is true here since the total probability in each
is 1), then the first set, gf , is said to majorizs the second set, rt. It is\vn that the majorizing property is equivalent to either of the following
properties:1 The r> can be obtained from the qt by a finite series of "flows." By a
flow is understood a transfer of probability from a larger q to a smallerone, as heat flows from hotter to cooler bodies but not in the reversedirection.
2 The TI can be obtained from the <?j by a generalized "averaging"operation. There exists a set of non-negative real numbers, a a , with
(16)
5. ENTROPY BOUNDS FROM PREDICTION FREQUENCIES
If we know the frequencies of symbols in the reduced text with the idealjV-gram predictor, <?»• , it is possible to set both upper and lower bounds tothe A^gram entropy, FN , of the original language. These bounds are asfollows:
=1i(q" - ?i+i) log i < FN < — ]C q" log q". (17)
The upper bound follows immediately from the fact that the maximumpossible entropy in a language with letter frequencies q" is — ̂ ql log ql.Thus the entropy per symbol of the reduced text is not greater than this.The JV-gram entropy of the reduced text is equal to that for the originallanguage, as may be seen by an inspection of the definition (1) of FX . Thesums involved will contain precisely, the same terms although, perhaps, in adifferent order. This upper bound is clearly valid, whether or not the pre-diction is ideal.
The lower bound is more difficult to establish. It is necessary to show thatwith any selection of Ar-gram probabilities p(ii, i%, ... , i N ) , we will have
27
Ys i(q*i — 9?+i) log i < X p(i, ' • • if/) log pi, • • • iff-i(iff) (18)•—1 i i, • • • , ijv
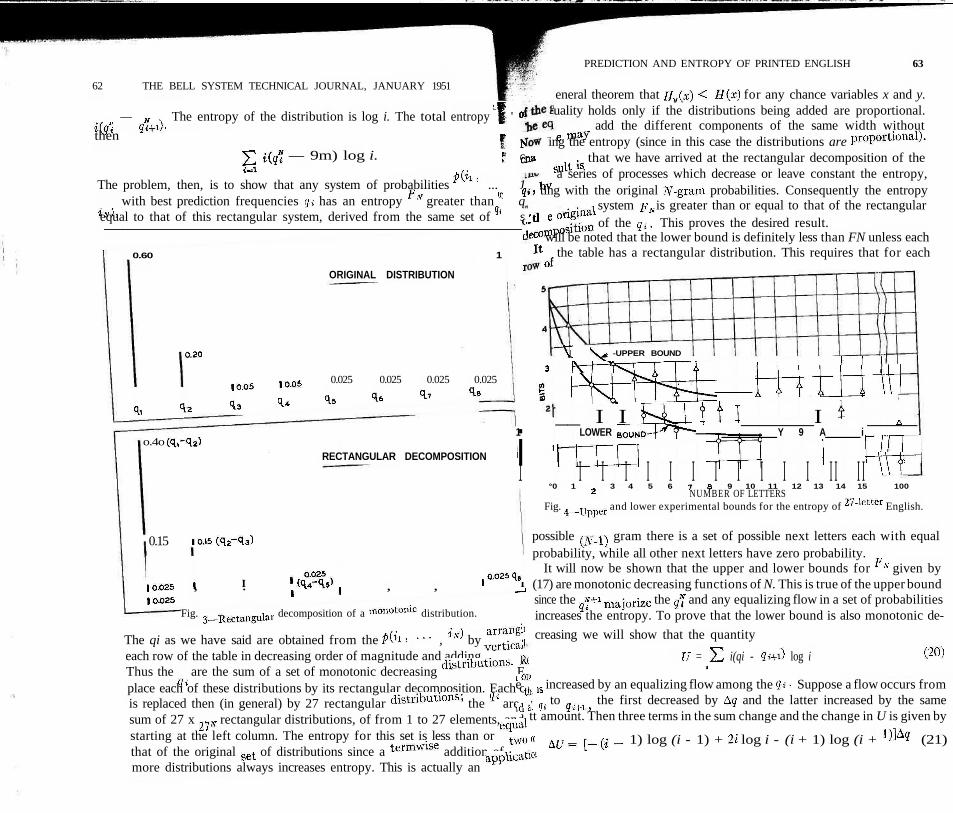
The left-hand member of the inequality can be interpreted as follows:Imagine the q* arranged as a sequence of lines of decreasing height (Fig. 3).The actual q* can be considered as the sum of a set of rectangular distribu-tions as shown. The left member of (18) is the entropy of this set of distribu-tions. Thus, the i'h rectangular distribution has a total probability of
62 THE BELL SYSTEM TECHNICAL JOURNAL, JANUARY 1951
i(qi — q*i+\). The entropy of the distribution is log i. The total entropy L* '
then I *
2 i(q" — 9m) log i. I f4-1 »' c
The problem, then, is to show that any system of probabilities p(ii, ... 1IN), with best prediction frequencies g; has an entropy FN greater than Q, qequal to that of this rectangular system, derived from the same set of q. s
£
0.60 1 (
ORIGINAL DISTRIBUTION 1
0.20
10.05 10.05 0.025 0.025 0.025 0.025
1i la 13 1* Is <U <l7 1e
o.4o (q,-qa)RECTANGULAR DECOMPOSITION j
0.15 10.15 cq2-q3)
10.025 I I Ifcf-oS I10.025 , . ,«fc1»\ , , , 0.025 q, .
Fig. 3—Rectangular decomposition of a monotonic distribution.
The qi as we have said are obtained from the p(ii, ... , i.v) by arrangiieach row of the table in decreasing order of magnitude and adding vertical!Thus the q^ are the sum of a set of monotonic decreasing distributions, Eplace each of these distributions by its rectangular decomposition. Each cis replaced then (in general) by 27 rectangular distributions; the qt are 'sum of 27 x 27W rectangular distributions, of from 1 to 27 elements, andstarting at the left column. The entropy for this set is less than or equa'that of the original set of distributions since a termwise addition of twtmore distributions always increases entropy. This is actually an applicaf
PREDICTION AND ENTROPY OF PRINTED ENGLISH 63
eneral theorem that Hv(x) < H(x) for any chance variables x and y.uality holds only if the distributions being added are proportional.e may add the different components of the same width without
ing the entropy (since in this case the distributions are proportional).~~* suit is that we have arrived at the rectangular decomposition of the
hv a series of processes which decrease or leave constant the entropy,'*' ting with the original ^-gram probabilities. Consequently the entropy, j. e original system FN is greater than or equal to that of the rectangular,Composition of the qt. This proves the desired result.
Tt will be noted that the lower bound is definitely less than FN unless eachOf the table has a rectangular distribution. This requires that for each
~~\ \^ -UPPER BOUND
3 ivT^JTl I l ii i K i |p"U.~ 1 1 1 1 1 \\\
__ I I ?^4>i t t I I I1 LOWER BOUND—•J^f*>~~ . Y 9 A i A
i " M M Tn i iIIT1 I I I I I I I I I I I I I I I \u°0 1 Z 3 4 5 6 7 8 9 10 11 12 13 14 15 " 100
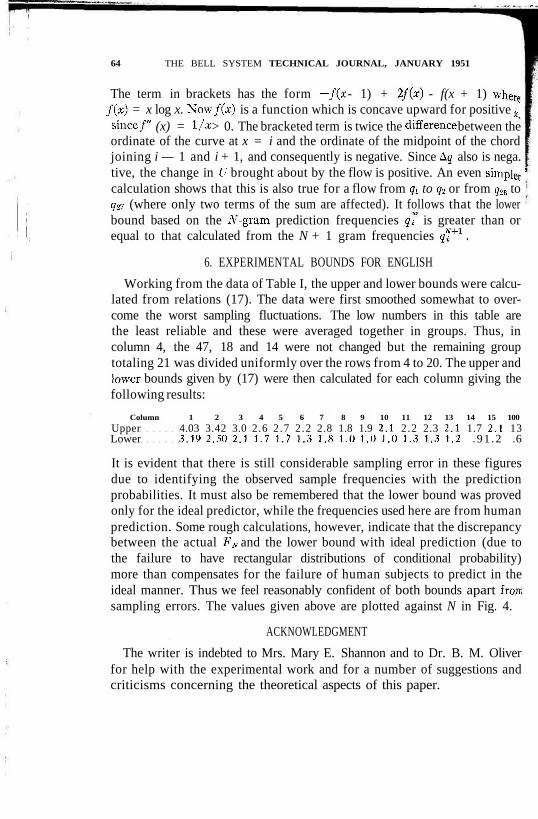
NUMBER OF LETTERSFig. 4—Upper and lower experimental bounds for the entropy of 27-letter English.
possible (A7-l) gram there is a set of possible next letters each with equalprobability, while all other next letters have zero probability.
le | It will now be shown that the upper and lower bounds for FK given by—' (17) are monotonic decreasing functions of N. This is true of the upper bound
since the qt+l majorize the ql and any equalizing flow in a set of probabilities. increases the entropy. To prove that the lower bound is also monotonic de-
,, creasing we will show that the quantityRe f/ = X) i(qi - 9>+i) log i (20)
LOtt *e tht K increased by an equalizing flow among the qi. Suppose a flow occurs fromid al ?i to g,-+1, the first decreased by Ag and the latter increased by the sameial tt amount. Then three terms in the sum change and the change in U is given bylVO°: Atf =[- («- 1) log (i - 1) + 2t log i - (i + 1) log (i + l)]Ag (21):atiot
64 THE BELL SYSTEM TECHNICAL JOURNAL, JANUARY 1951
The term in brackets has the form —f(x - 1) + 2f(x) - f(x + 1) where'f(x) = x log x. Now/(a;) is a function which is concave upward for positive x
since/" (x) = \/x > 0. The bracketed term is twice the difference between theordinate of the curve at x = i and the ordinate of the midpoint of the chordjoining i — 1 and i + 1, and consequently is negative. Since A§ also is nega.tive, the change in U brought about by the flow is positive. An even simpler 'calculation shows that this is also true for a flow from q± to q^ or from g2e to<?27 (where only two terms of the sum are affected). It follows that the lowerbound based on the TV-gram prediction frequencies <?; is greater than orequal to that calculated from the N + 1 gram frequencies ql+1.
6. EXPERIMENTAL BOUNDS FOR ENGLISH
Working from the data of Table I, the upper and lower bounds were calcu-lated from relations (17). The data were first smoothed somewhat to over-come the worst sampling fluctuations. The low numbers in this table arethe least reliable and these were averaged together in groups. Thus, incolumn 4, the 47, 18 and 14 were not changed but the remaining grouptotaling 21 was divided uniformly over the rows from 4 to 20. The upper andlower bounds given by (17) were then calculated for each column giving thefollowing results:
Column 1 2 3 4 5 6 7 8 9 10 11 12 13 14 15 100
Upper 4.03 3.42 3.0 2.6 2 .7 2.2 2.8 1.8 1.9 2.1 2.2 2.3 2.1 1.7 2.1 13Lower 3.19 2.50 2 . 1 1 . 7 1 . 7 1 . 3 1 . 8 1 . 0 1 . 0 1 . 0 1 . 3 1 . 3 1 . 2 .91 .2 .6
It is evident that there is still considerable sampling error in these figuresdue to identifying the observed sample frequencies with the predictionprobabilities. It must also be remembered that the lower bound was provedonly for the ideal predictor, while the frequencies used here are from humanprediction. Some rough calculations, however, indicate that the discrepancybetween the actual VK and the lower bound with ideal prediction (due tothe failure to have rectangular distributions of conditional probability)more than compensates for the failure of human subjects to predict in theideal manner. Thus we feel reasonably confident of both bounds apart fromsampling errors. The values given above are plotted against N in Fig. 4.
ACKNOWLEDGMENT
The writer is indebted to Mrs. Mary E. Shannon and to Dr. B. M. Oliverfor help with the experimental work and for a number of suggestions andcriticisms concerning the theoretical aspects of this paper.