Embed Size (px)
Citation preview
European
Historical
Economics
Society
EHES WORKING PAPERS IN ECONOMIC HISTORY | NO. 35
Predicting the Past: Understanding the Causes of Bank
Distress in the Netherlands in the 1920s
Christopher L. Colvin
Queen’s University Management School, Queen’s University Belfast
Abe de Jong
Rotterdam School of Management, Erasmus University
Philip T. Fliers
Rotterdam School of Management, Erasmus University
JANUARY 2013
EHES Working Paper | No. 35 | January 2013
Predicting the Past: Understanding the Causes of Bank
Distress in the Netherlands in the 1920s
Christopher L. Colvin*
Queen’s University Management School, Queen’s University Belfast
Abe de Jong**
Rotterdam School of Management, Erasmus University
Philip T. Fliers***
Rotterdam School of Management, Erasmus University
Abstract Why do some banks fail in financial crises while others survive? This paper answers this
question by analysing the consequences of the Dutch financial crisis of the 1920s for 143
banks, of which 37 failed. Banks’ choices in balance sheet composition, corporate governance
practices and shareholder liability regimes were found to have a significant impact on their
chances of experiencing distress. Banks bore a higher probability of failing if, on the eve of
the crisis, they: were highly performing; were highly leveraged; had fewer interlocking
directorates with non-banks; and concentrated their managerial interlocks with highly
profitable banks. Banks which chose to adopt shareholder liability regimes with unpaid capital
were more likely to experience distress, but could mitigate this risk by keeping higher
portions of their equity unpaid. Receiver operating characteristic analysis shows that interlock
characteristics in particular have a high predictive power. JEL codes: G01; G21; G33; G34; N24
Keywords: financial crises; bank failures; interlocking directorates; shareholder
liability; the Netherlands; the interwar period
Notice
The material presented in the EHES Working Paper Series is property of the author(s) and should be quoted as such.
The views expressed in this Paper are those of the author(s) and do not necessarily represent the views of the EHES or
its members
Acknowledgements: Versions of this paper were presented at the Economic History Society Annual Conference (April 2012), the European
University Institute (June 2012), Queen’s University Belfast (June 2012), the University of Cologne (July 2012) and Erasmus
University Rotterdam (September 2012). The authors especially thank Fabio Braggion, Carsten Burhop, Joost Jonker, Nathan
Marcus and John Turner for early comments and suggestions.
* Christopher L. Colvin, Queen’s University Management School, Queen’s University Belfast, [email protected]
** Abe de Jong, Rotterdam School of Management, Erasmus University, [email protected]
*** Philip T. Fliers, Rotterdam School of Management, Erasmus University, [email protected]
1
1. Introduction
In the early 1920s, after a period of exceptional economic growth, the Dutch economy suffered a
protracted recession. Following Fisher’s (1933) debt-deflation theory of great depressions, Jonker &
Van Zanden (1995) argue that its principal cause was over-indebtedness combined with price
deflation. Dutch businesses had benefited greatly from the First World War, a conflict in which the
Netherlands remained neutral; a short post-war boom prolonged their prosperity. The large and
sustained declines in aggregate demand and prices that followed were the consequence of falling
export demand and monetary policy due to the gold standard. Debt-deflation put pressure both on
Dutch businesses and on the banking sector that they relied on. Instability for banks has since been
widely seen as constituting a financial crisis (Bernanke & James, 1991; Reinhart & Rogoff, 2009).
Some banks failed; yet others did not. Jonker & Van Zanden (1995) estimate that 35 banks suffered
financial distress in this crisis; De Vries (1989) puts the number closer to 70. Of the 143 banks
considered in this paper, a sample that represents approximately 83 per cent of the nominal equity
value of their sector, 37 suffered distress at some stage in the crisis.
This paper quantitatively investigates the determinants of this unequalled bank distress in the
Netherlands by using discrete choice models to “predict the past”. Bank-level accounting and
corporate governance data included in a popular contemporary investor manual are used to assess
how policy choices influenced the banks’ fate. We ask how the banks’ choices made before the debt-
deflationary shock regarding balance sheet composition, corporate governance practices and
shareholder liability regimes affected the banks in this period. Apart from being an unresolved
historical question, finding an answer is interesting for four further reasons: (1) it facilitates the
economic identification of the roots of bank distress because it forms a quasi-natural experiment of
history in that its causes were largely exogenous, but its effects on the banking sector were partly
determined endogenously; (2) the absence of prudential supervision in the Netherlands at the time
means that this episode illustrates how banks may behave when there is little expectation of state
2
intervention; (3) we provide a more nuanced understanding of the causes and consequences of
banking crises, in that we explore the timing of banks’ distress and discriminate between their
different strategies for resolving it; and (4) understanding bygone corporate governance practices and
shareholder liability regimes aids policymakers who want new solutions to more recent financial
disasters. The policy implications of this paper concern: (1) how banks should structure their balance
sheet to weather a crisis; (2) how banks should structure their boards of directors to ensure business
longevity; (3) how banks should cope with the inter-connectedness of the financial sector and the
varying dependence of the industrial sector on their financial services; and (4) how shareholders
might encourage bankers to behave in an ex ante risk-averse manner through the use of exotic
liability regimes.
The Dutch crisis has already seen some important scholarship. De Vries (1989) gives a
detailed historical narrative of its unfolding from the perspective of De Nederlandsche Bank (DNB),
the Netherlands’ bank of issue, which arguably began its journey to becoming a modern central bank
in consequence of its actions in the 1920s. Jonker (1989, 1991) finds evidence consistent with the
hypothesis that the close ties between bankers and their borrowers via interlocking directorates, a
corporate governance structure that emerged in the country in the 1910s, soon extended the crisis
from the non-financial to the financial sector. Colvin (2013) describes a case study of a universal
bank in which conflicts of interest arising from one such interlock, in particular the accompanying
direction of managerial influence, resulted in the near failure of the country’s second-largest
financial institution. Finally, Colvin (2011) provides evidence that, among the specialist banks for
small-scale urban enterprise in the 1920s, those which in some way limited shareholder liability were
more likely to fail.
The paper is closely related to various works in banking and finance, as well as in economic
history. Most importantly, it relates to work on the causes and consequences of financial crises, a
theme which, given recent bank failures, has lately been revived. Of specific relevance are Acharya
et al. (2009), arguing that the possibility of state intervention might create moral hazard; Jordan et al.
3
(2010), claiming that, with such a possibility, the early identification of distressed banks is
warranted; and Campello et al. (2010), measuring the impact of credit constraints on firm behaviour.
Following Meyer & Pifer (1970), Martin (1977), and Pettaway & Sinkey (1980), we use bank-level
accounting data, focusing on measures of capital adequacy, asset quality, managerial relations,
earnings and liquidity. The methodology employed follows work which uses discrete choice models
to determine why banks fail (Kolari et al., 2002; Kumar & Ravi, 2007). Closest to the Dutch case are
writings on: (1) the consequence of management structure for bank performance, such that the size of
a bank’s board negatively affects costs and efficiency, as claimed by Simpson & Gleason (1999); (2)
the risk implications of interlocking directorates between banks and their clients, where Kroszner &
Strahan (2001) find that bankers sitting on the boards of their clients cause conflicts of interest, and,
for Cooper & Uzun (2010), that bank risk is positively related to bank directors’ holding multiple
board appointments; and (3) the use of exotic liability regimes in banks, where Esty (1998) finds that
banks which abide by stricter liability regimes are less risky, and Grossman & Imai (2013) find that
contingent capital is better at reducing risk for banks with higher leverage.
Our principal results are as follows. First, we find that the balance sheet composition of banks
before the crisis period had a significant impact on their probability of suffering distress in the 1920s.
In particular, banks with lower shares of their assets in the form of long-term loans, and banks which
were highly profitable, were at greater risk of suffering distress. We find that banks which suffered
distress early and late in the 1920s had different attributes. Specifically, banks with more liquid
balance sheets tended to suffer earlier and big banks suffered later. Moreover, general commercial
banks are found to have been more likely to suffer distress than those which specialised in mortgage
lending.
In testing whether the composition of banks’ two-tier board structure had a significant impact
on the probability that they would suffer distress, our findings complement the historiography of the
Dutch crisis by exploring how interlocking directorates influence banks’ performance. Banks with
larger boards and more interlocking directorates had a higher probability of suffering. If we control
4
for the effects of a larger board and the attributes of such interlocks, we find that banks which
concentrated their managerial connections in large, profitable, financial firms were more at risk. So
were banks which concentrated their managerial interlocks in non-financial firms, but diversified this
portfolio throughout many industrial sectors.
In a separate analysis, we find that 96 of the 143 banks in our sample had chosen a liability
regime with portions of unpaid shareholder capital, and 22 of the 37 banks which experienced
distress during the crisis. Our analysis suggests that banks bearing this extended form of liability
adapted their balance sheets to compensate for their lack of equity. Subsequent regression analysis
shows that, while banks which chose to extend the liability of their shareholders were more likely to
experience distress, they could mitigate this effect by having higher portions of their equity unpaid.
The paper proceeds as follows. First, the historical and institutional context necessary to
understand the arguments of this paper is introduced in Section 2. Our bank-level accounting and
corporate governance data and the empirical strategy used in the analysis are discussed in Section 3.
In Section 4 we define the variables used in our regression exercises and present their descriptive
statistics, going on in Section 5 to discuss the results of our regression models for bank failure and
resolution in relation to our a priori expectations. We next compare in Section 6 how well our
regression models could predict the past and in Section 7 conclude by assessing the importance of a
bank’s corporate governance for its performance during a deflationary recession.
2. Historical and institutional context
At the turn of last century, the Netherlands’ banks played second fiddle to the country’s capital
markets. Commercial banks were nothing like those in neighbouring Germany, where universal
banks had emerged as a significant force in the Reich’s financial machine (Fohlin, 1999). In fact, the
Netherlands went in very little for banking: 64 per cent of the kingdom’s money supply in 1913 was
in the form of paper money, versus 37 per cent in Germany, 29 per cent in Belgium and just 4 per
5
cent in Britain (Van Zanden, 1991, p. 125). Jonker (2002) argues that the Netherlands had not
produced out banks because its sophisticated financial inheritance could do without them.
Amsterdam’s merchants had developed a flexible credit source called prolongatie, a short-term
credit instrument which demanded financial securities – primarily exchange-listed shares – as
collateral. This highly liquid on-call money market, which operated in a similar way to modern
repurchase agreements (repos), was unique to the Netherlands and outcompeted banks on cost. It
enabled firms to meet both short-term and long-term credit requirements, as the instrument could be
easily rolled-over.
From about 1911, in particular during the First World War, the country started to look more
like a bank-based economy. Just before it, a wave of bank mergers had built sophisticated multi-
branch networks with a wide portfolio of clients (Jonker, 1995). The prolongatie market gave way to
bank finance when Amsterdam’s stock exchange closed in 1914 due to the outbreak of war (De
Vries, 1976).1 The war itself and the subsequent short post-war economic boom hastened the move
by banks to widen their services; they now took a direct part in industrial ventures, not merely
bringing them to market. The regulatory regime at the time remained laissez faire: Dutch law did not
prohibit commercial banks from engaging in investment banking, imposed no requirement on
minimum bank capitalisation, and allowed banks to adopt various exotic shareholder liability
regimes. Moreover, the country lacked a modern central bank; while De Nederlandsche Bank (DNB)
as bank of issue monopolised the issuing of paper money, it was a private business answerable to
shareholders, had no formal duty of regulatory oversight and neither a de facto nor a de jure function
as a lender-of-last-resort in crises.2
1 Although the prolongatie market continued to be used after the war (Euwe, 2010), it never fully recovered. 2 However, DNB supervised the banking sector in certain informal ways: (1) its governors were traditionally sent
news of changes in the board composition of all Dutch financial institutions; and (2) it could choose the financial terms
for its short-term debt instrument, access to its bill rediscounting facility. The latter was especially controversial at the
time; some private banks complained that it was abusing its position as the Dutch state’s bank of issue. With its
monopoly over the printing of paper money, it could allegedly offer loans at terms no private bank could match
(Communication between the director of the Bond Geld- en Effectenhandel and the Minister of Finance, December 1917,
6
By tradition, Dutch firms employed a dual board structure similar to the German model, with
a management board made up of directeuren (executive directors) and supervisory board of
commissarissen (non-executive directors).3 Jonker (1989, 1991) uses the number of interlocks
between banks and industry to measure their scope. He argues that an increase in interlocks suggests
a move towards universal service provision, where banks simultaneously do business as both
commercial and investment banks, since banks install directors in the firms which they finance. He
argues that bankers sitting on the board of multiple firms positioned themselves as “bearers of
capitalism” able to control Dutch economic development.4 He finds that in the early 1920s interlocks
more than doubled, from 200 in 1920 to 431 in 1923. Many of these were due to changes at the
Netherlands’ second-largest bank, the Rotterdamsche Bankvereeniging (Robaver): from 20
interlocks in 1910 to 127 in 1923.5 But the trend included many more: De Jong & Röell (2005, p.
497) find that in 1923 the proportion of non-financial exchange-listed firms with no bank interlocks
was 40 per cent, while 22 per cent had one interlock, 12 per cent had two, eight per cent had three
and 18 per cent more than three.6
The structure of Dutch banking changed quite significantly over the first two decades of the
twentieth century, with an increase in concentration, the market entry of new banks, and the adoption
of a universal banking business model by some incumbents. However, the scale and scope of the
Netherlands’ banks remained highly diverse. Although the size of the five largest banks increased in
Archief van de Bond voor de Geld- en Effectenhandel te 's-Gravenhage, Access No. 2.19.042.14, Nationaal Archief
(henceforth NA), The Hague). 3 Members of both boards were normally appointed at shareholders’ meetings on the advice of sitting directeuren (De
Jong & Röell, 2005); as a rule, their appointment could be assumed. 4 Jonker revisits earlier notions of the relevance of interlocking directorates put forward by Wibaut (1913), who
argues that the Netherlands’ largest banks were gradually starting to dominate the economy by buying equity stakes in
industry and increasing credit supply. Wibaut sees this as a conscious strategy by the bankers to strive for hegemony,
which led to a prominent role for them in the decision making process of industrial firms. 5 This was described on the eve of the crisis by the son of Robaver’s president as part of an expansionary strategy to
emulate Germany’s universal banks (Westerman, 1920). 6 Most interlocks were between the supervisory boards of banks and non-financial firms (47 per cent), but a
substantial portion involved a directeur of a bank sitting as a commissaris of a non-financial firm (29 per cent).
7
relation to the rest, they by no means dominated;7 a host of smaller, often specialised, banks co-
existed. These included smaller algemene banken (general commercial banks), such as the
Rotterdam-based Marx & Co.’s Bank and the Amsterdam-based Bank-Associatie and Algemeene
Spaar- en Depositobank. Like Robaver, these too operated as full-service financial firms, but to
smaller geographical markets. Other players included: private banking houses, such as Hope & Co.;
unit-independent provincial banks offering a narrower range of services, such as bill discounting; and
scores of specialist mortgage banks. Cooperative rural banks (boerenleenbanken) and banks for
small-scale urban enterprise (middenstandsbanken) were emerging with the turn of the century. A
handful of overseas banks also operated as free-standing companies servicing firms in the Dutch
colonies.
Between 1920 and 1924, De Vries (1989) counts the (near-) failure of at least four algemene
banken, including the country’s second-largest bank, 26 provincial banks and two overseas ones. He
estimates that at least 200 million guilders was lost between 1920 and 1922, a figure largely
confirmed by our research.8 The history of Marx & Co. and Robaver are particularly enlightening:
the former for DNB’s (lack of) involvement when it failed in 1922; the latter for the poisonous
relationship between the bank and the non-financial firms which it had helped to finance (Colvin,
2013). Jonker (1991, 1995) argues that many banks performed badly because they lacked the
knowledge and experience to finance industries. He concludes that the crisis caused a loss in
business confidence and eventually to a retreat from the universal banking business model. In
addition, Colvin (2011) contends that banks that chose extended shareholder liability regimes – such
as double liability, or systems of paid and unpaid capital – stood a better chance of surviving the
crisis.
7 The Netherlands’ Big Five comprised: Amsterdamsche Bank, Incasso-Bank, Nederlandsche Handel Maatschappij,
Rotterdamsche Bankvereeniging and Twentsche Bank. All five eventually merged into what is now ABN AMRO (De
Vries et al., 1999). 8 This is likely an underestimate of the true damage done: just the 18 banks in our sample which failed outright were
valued at 208 million guilders immediately prior to the crisis, approximately 1.2 billion euros in today’s money.
8
The purpose of the present paper is to use quantitative measures to explore the causes of the
1920s crisis. Existing hypotheses here largely rely on narrative histories and case study evidence.
While each story is individually convincing, its part in the whole is unclear. How did management
structures affect bank performance? How far did the links between banks and clients influence the
ability to weather the crisis? And did the various shareholder liability options available to banks
militate for or against the effects of debt-deflation? The method and sources used in this paper allow
us to put these questions side-by-side in one analysis; we can then judge the relative value of
competing hypotheses on the causes and consequences of the Dutch crisis.
3. Data and empirical strategy
We use discrete choice models to estimate whether pre-crisis bank-level characteristics can predict
crisis-period performance. Our dataset contains information on a sample of banks extracted from the
1920 and 1921 editions of the Van Oss Effectenboek, an investor manual published annually. Our
data pertain to the fiscal year 1917, which we choose for two reasons: it is the last stable year
preceding the crisis, and it is the year in which bank-level data are available for the largest number of
banks. We differentiate between banks which suffered distress and those which did not. Among the
former, we distinguish banks which failed outright, from those which were rescued through merger
and those which continued after their balance sheet was restructured.
The Van Oss investor manuals are very useful sources for the present study because they
bring together balance sheets, profit-and-loss accounts and detailed corporate governance
information. Moreover, they include the banks’ location, year of foundation, corporate statement,
stock listing, stock prices and executive compensation levels. Our sample constitutes all the financial
institutions for which sufficient data were available in Van Oss and includes the vast majority of
banks that were listed on Amsterdam’s stock exchange during the period, together with other banks
which the manual’s compilers felt were important enough to mention. Our database comprises 143
9
unique banks, where we distinguish between general (commercial) banks, specialized mortgage
banks and shipping banks that specialized in financing shipping companies. These 143 banks amount
to 89 per cent of the banks in the Netherlands counted by Van Oss, which come to 83 per cent of the
sector’s nominal equity capital.9 Not all the banks listed in the guide are included in the sample;
some of them provided incomplete data, because financial information was supplied voluntarily.
We standardised and converted the accounting information detailed in the Van Oss to match
the categories used in modern balance sheets and profit and loss accounts, in order to facilitate
comparative financial ratio analysis. Table 1 shows the balance sheet of Marx & Co as an example of
the sector including both non-standardised (Panel A) and standardised (Panel B) balance sheets.
Table 2 summarises the relative importance of various balance sheet items for the 143 banks in our
sample. Our Data appendix elaborates on the data gathering and conversion process.
In addition to reporting financial accounting data, Van Oss supplies comprehensive lists of all
the banks’ directors, i.e. directeuren and commissarissen. We digitised and cross-referenced these
lists with all other banks and non-financial firms in the same fiscal year to map any interlocking
directorates in this period. Van Oss also reports the distribution of profits to these directors and
supervisors in the form of tantièmes (cash compensation). This was the only information about their
pay which was published at the time, but it is an imperfect indicator of executive compensation;
evidence suggests that banks also remunerated their executives by granting them privileged access to
new stock issues – a form of insider dealing permitted by law.10
9 We exclude DNB and Javasche Bank from our sample since they acted as circulatie banken (banks of issue) for the
Netherlands and the Dutch East Indies, including these banks would substantially increase the percentage of the sector’s
nominal equity capital covered by our data. 10 A cursory glance at the new issues books of Robaver reveals that privileged insiders had first rights to any new
public offering at a discounted price. These insiders included bank managers, but also past and future customers (Inv. No.
1090-1105, Archief van het Hoofdkantoor van de Rotterdamsche Bank NV, Access No. 2.17.33, NA).
10
Figure 1 shows the weighted stock price index of distressed and non-distressed banks,11 along
with the Net National Product at factor costs,12 illustrating the depth of the crisis. The figure
confirms that the choice to select 1917 as point of reference for the prediction is justifiable on the
grounds that it offers a middle road between setting the date too late and thus already incorporating
crisis effects, and setting it too early and not finding results because data are not representative of the
pre-crisis conditions. Stock prices typically contain forward-looking information. In 1917, the stock
prices are still at levels comparable to previous years and the major changes only set in after 1920.
The Net National Product is growing at a stable pace. Dating the crisis period is controversial.
Bernanke & James (1991) date it to 1921 to 1922 only, while Colvin (2011) considers the period
1920 to 1927. This much longer period is preferable, because signs of bank distress were observed
long after the Dutch economy had stabilised and some problems caused by the crisis took many years
to be fully manifest. Figure 1 suggests that the recovery of the banking sector began only in 1926.
The longer period encompasses the earliest signs of bank distress before the major failure of Marx &
Co.’s Bank in 1922, extends the period beyond the Robaver debacle in 1924 and finally includes the
government-backed reorganisation of the middenstandsbanken in 1927, which forever changed
expectations about the role of the state in crisis resolution in the Netherlands, as such we follow
Colvin (2011) and date the crisis from 1920 to 1927.
The four sources used in the construction of the dependent variables, which measure distress
through liquidation, merger or reorganisation, are: (1) Kramer (1926), a PhD dissertation on firm
reorganisations during the crisis period; (2) De Vries (1989), an official history of DNB in the crisis
11 Stock prices (including dividends) are weighted to reflect a hypothetical portfolio which includes all the listed
financial firms according to the book value of their equity on 31 December 1917. Our index therefore reflects what a
possible investor who composed his portfolio in 1918, and kept this portfolio fixed, would observe when looking back at
his investments. 12 Net National Product (NNP) is the sum of employees, proprietors, rental, corporate, interest, and government
income less the subsidies which government pays to any of those groups, plus or minus the aggregation discrepancy.
1913 is the base and reference year (1913 = 100). Deflator spliced at 1920-1921. NNP and population from Van der Bie
& Smits (2001). Deflator from Van der Bie (1995) for 1913-1920, and Den Bakker et al. (1990) for 1921-1929.
11
period, using the archives of this bank; (3) DNB (2000), a list of all banks operating in the
Netherlands throughout the nineteenth and twentieth centuries; and (4) news and commentary from
the financial press compiled by the authors from an online newspaper database.13 Each has its
advantages and disadvantages. Source (4) is particularly useful; unlike the others, it enables us to
identify the banks that suffered in the crisis period and needed to be reorganised financially, but did
not exit the market altogether through liquidation or merger. Table 3 provides an overview of the
complementarity of the sources used.
We supplement our dataset with data on 232 non-financial corporations pertaining to the
fiscal year 1917. We use this non-financial accounting data to construct firm characteristics, which
are then averaged across the firms that share a managerial connection with a bank through
interlocking directorates. This lets us capture any specific interlock characteristics which influence
the behaviour of financial corporations in our dataset. Consequently we can quantify the effect of
interlocks hypothesised by Jonker (1991) by relating firm characteristics including size, leverage and
profitability, to the interlocks held by banks.
The median non-financial firm in our sample has three million guilders in assets, financed by
34 per cent of debt, generating a profit of five per cent. The data on the non-financial sector are
dominated by industrial firms (20 per cent) and free-standing companies with foreign agricultural
businesses (24 per cent). Indeed, the median profitability of non-financial corporations is driven by
the profitability of these overseas agricultural corporations (6.6 per cent). We use this information to
estimate the effect the banks’ exposure to non-financial firms had on their probability of
experiencing distress during the 1920s.
4. Variables and hypotheses
As our core dependent variable indicating distress, we define a dummy variable which equals one if
13 The Koninklijke Bibliotheek’s searchable historical newspaper collection is available at: http://kranten.kb.nl.
12
and only if a bank experiences distress in the period 1920 to 1927, the core crisis period. We define
three mutually exclusive types of distress: liquidation (including bankruptcy), merger and
reorganisation. Figure 2 is a timeline of bank distress for the period 1920 to 1927. Notice that the
crisis came in two phases: 1920 to 1922 as the first phase of bank distress, when a high proportion of
failures were resolved through merger; and 1923 to 1927 as the second, when by far the most crisis-
stricken banks looked to financial reorganisation.14
The modern literature describing bank failures and their determinants focuses on several
categories of explanatory or predictive factor. We selected the most appropriate indicators from it
and adapted them to the historical context. Where possible, we also constructed measures similar to
those used by contemporary financial observers who directly witnessed the 1920s banking crisis. We
define eight categories of dependent variable, inspired by the modern CAMELS Rating System
(Thomson, 1991): (1) asset quality; (2) loan book quality; (3) capital adequacy; (4) earnings
sufficiency; (5) liquidity and solvency; (6) capital structure; (7) management structure; (8)
shareholder liability structure.
Table 4 reports by category concise definitions of all the variables used in the regression
analysis. We use the variable of size (natural logarithm of total assets), which proxies for a possible
“too big to fail” doctrine and of age (natural logarithm of the difference between the year of
foundation and 1917), which proxies for banks’ asset selection experience (Tornhill and Amit, 2003).
For loan book quality, we use the ratio of short-term loans outstanding to total assets (Martin; 1977,
Thomson; 1991). With respect to capital adequacy, we use a working capital ratio and measure the
equity reserves as a proportion of total assets (Cielen, 2004). For earnings sufficiency, we use return
on assets and a measure of interest rate dependency (Kolari et al., 2002). For liquidity and solvency,
14 We used alternative specifications of these phases in order to explore the possibility that distress events which
became public in 1923 might merely have hidden the banks’ problems longer. We find that banks which were seen to be
affected by the crisis in 1923 were more likely to: (1) have no interlocking directorates with DNB; and (2) be interlocked
with more profitable and bigger non-financials. We conclude, therefore, that banks that experienced distress in 1923 had
more in common with banks which experienced distress after 1923.
13
we capture the liquidity of banks’ assets by calculating a current ratio and measure how well banks
manage to match the maturity of their assets with the maturity of their financing instruments, a
measure popular among contemporaries (Verrijn Stuart, 1921; Klijnveld, 1922; Sternheim, 1925).
Additionally, we posit that banks that were stock listed were more liquid (Edelman and Baker, 1990).
To capture the effects of differences in capital structure we use total leverage (debt to total assets)
and deposits to total assets (Zmijewski, 1984).
Two sets of variables are specifically relevant to the Dutch case. First, we quantify the impact
of banks’ interlocking directorates with industrial firms and other financials in order to reassess the
hypotheses advanced in Jonker (1991). Second, we evaluate whether shareholder liability
arrangements matter for bank stability, a hypothesis developed in Colvin (2011) for the case of banks
set up for small-scale enterprises. We explore these in more detail below.
We argue that management structure may play a significant part in the performance of banks.
We introduce managerial influences by looking at the interconnectedness of banks and the
connectedness of banks and non-financial firms.15 Interlocking directorates refer to a corporate
governance structure whereby directors serve on the boards of multiple firms. Interlocking
directorates measure two things: (1) the relative independence of a bank or firm’s board, since banks
or firms which have more interlocking directors may have a higher chance of suffering from
conflicts of interest of bankers on the board (Kroszner & Strahan, 2001); and (2) the influence of
banks, where banks with more interlocks are potentially more powerful in terms of financial and
industrial dominance. Jonker (1991) argues that the connectedness of banks and non-financial firms
aggravated the crisis by creating conflicts of interest and by exposing them financially to industrials
– interlocks were usually the consequence of financial linkages through debt or equity. We use
15 In the ensuing analysis of interlocking directorates, we treat connections involving either directeuren or
commissarissen as identical; we found that separately measuring interlocks involving each tier of banks’ management
boards did not affect our results and yielded no additional insight.
14
measures of asset size, asset size concentration, leverage, profitability and industry concentration
averaged across interlocks in order to quantitatively examine Jonker’s hypotheses.16
Dutch banks were able to adopt various shareholder liability regimes. A substantial majority
did not limit liability to shareholders’ initial inlay, as is the norm today; they used systems of paid
and unpaid share capital, where the unpaid portion could be called if certain conditions were met,
such as the threat of liquidation, or, in extreme cases could be recovered in a bankruptcy court. Some
67 per cent of banks chose to adopt some sort of extended liability. A wide variety of such regimes
existed, ranging from only one per cent unpaid share capital to the maximum of 100 per cent.17 The
mean bank in our sample had 25 per cent of its share capital left unpaid, suggesting that its
shareholders would stand to lose additional assets if it called upon them to put up more money.
The potential effects of these non-standard liability regimes are contradictory. On the one
hand, standard asset pricing models view limited liability constructs as a call option because
shareholders can walk away from their investment, leaving any remaining debts to creditors; they are
uninterested in downside risks (Evans & Quigley, 1995). Extending liability beyond the limited case
thus means that shareholders act like debt-holders should their bank call its unpaid share portion;
shareholders here are acutely interested in their bank’s downside risks and so may be less willing to
support risk-loving managers. In line with Esty (1998) and Grossman & Imai (2013), who find that
banks with increased liability provisions tend to take fewer risks because shareholders have an
incentive to monitor their bank’s board, we hypothesise that Dutch banks with unpaid equity capital
were probably more risk-averse and thus were less likely to end up in distress.
16
Van Oss lists eleven industrial categories: (1) industrial; (2) agriculture; (3) mining; (4) oil; (5) rubber; (6) shipping;
(7) tobacco; (8) tea; (9) railways; (10) tram transport; and (11) various. To calculate the characteristics of the interlocks
we use balance sheet characteristics of banks or non-financial firms and construct a value weighted average using total
assets at the beginning of 1918 for each. With respect to the size concentration, we use a Herfindahl-index, which uses
the portion of each interlock’s total assets relative to the total amount of assets of interlocked banks or non-financials.
With respect to industry concentration, we use a Herfindahl-index, where the share of banks’ interlocks in each industry
is used. 17 Only two banks used the single liability regime in which they left the full equity capital unpaid: Veendammer
Hypotheekbank and Vaderlandsche Hypotheekbank.
15
On the other hand, we surmise that banks which had a higher portion of their equity capital
left unpaid faced a higher probability of being liquidated or going bankrupt because their financial
resources would be depleted more quickly, rendering them less financially flexible. As a
consequence of these banks initially having a large proportion of their capital unpaid and therefore
illiquid, we expect that there may be a positive relationship between unpaid equity capital and the
probability of overall distress.
Among the second order consequences, there are indications that some banks permitted
voluntary equity top-ups to be made by shareholders and that these banks had limited (and fixed)
claims on annual dividends; we therefore expect any relationship to be non-linear. Thus we use a
dummy variable to capture the effect of the liability regime choice and use the portion of equity
capital paid to capture the incremental effect.
5. Understanding bank distress
This analysis is conducted in six parts. First we analyse the determinants discussed above in a
univariate setting, distinguishing between different sub-samples on the basis of distress timing and
resolution. In the second, we develop our baseline model, comprising core variables popularly used
in studies of bank distress. Additionally we investigate whether there are any systematic differences
between banks which failed early and those which failed late in the crisis period. In the third
exercise, we analyse whether there are systematic differences in the survival of different types of
bank and in different geographical markets. In the fourth exercise, we focus on the two categories of
variable – management structure and the characteristics of interlocked firms – which are included to
investigate the specific hypotheses proposed in this paper and to quantitatively re-evaluate the
historiography of the Dutch crisis. In the fifth exercise, we ask how banks’ choice of liability regime
affects the probability of their distress. Finally, robustness exercises are reported which test the
sensitivity of our results to changes in the composition of our sample and to extra control variables
16
which could not be calculated for the full sample.
Table 5 summarises the mean values for all variables as specified across the full sample of
143 banks and the various sub-samples. We find that general commercial banks make up the largest
portion in terms of asset size, while mortgage banks dominate in terms of number. Mortgage banks
were highly specialized in long-term funds, unlike general banks, which held approximately equal
totals of short- and long-term loans. We find that general banks were better able than mortgage and
shipping banks to match the maturity of their assets with their liabilities and held significantly higher
amounts in deposits. Furthermore, general banks interlocked with non-financial corporations
significantly more directorates than more specialised banks did. We find that banks which chose a
regime leaving some portion of shareholder equity unpaid were significantly smaller and more liquid
than the others (in terms of assets) and tended to be unlisted. Table 5 also presents statistics for sub-
samples for executive pay and by liability regime.
5.1 A univariate analysis of bank distress, timing and resolution
Table 6 reports the mean and median values of all variables as specified across the full sample of 143
banks, categorised by distress experience during the 1920s. We find that banks which experienced
distress during this period were younger and more likely to have a stock listing and more in deposits.
Additionally we see that banks which did not suffer distress held more working capital, were more
liquid, were interlocked with larger non-financial corporations and had a regime which left
shareholder equity unpaid. When we separate the early distress events (1920 to 1921) from the late
(1923 to 1927), we find that: (1) banks which matched the maturity of their (short-term) assets with
that of their (short-term) liabilities were more prone to debt-deflationary shock and subsequently
suffered distress earlier; (2) banks which had fewer interlocking directorates experienced distress
earlier; and (3) banks which had interlocking directorates with large banks were more likely to
experience distress during the latter part of the crisis.
17
Table 7 reports the mean and median values of all variables as specified across the sub-
sample of 37 banks which suffered distress, separated by the manner in which they resolved this. We
find that the largest and the smallest banks tended to be reorganised, while the medium-sized ones
tended to be liquidated. Additionally, we find that banks which had invested deeply in long-term
loans were more likely to be liquidated or reorganised, whereas banks which held substantial
deposits were more likely to be reorganised. More important in determining the manner of
resolution, however, are the interlocking directorates: (1) banks which had more interlocking
directorates were more likely to be liquidated or reorganised than merged; (2) when compared to the
banks that were forced to merge, the banks which were liquidated were the ones which concentrated
their interlocks with larger banks and were interlocked with highly levered banks; and (3) the banks
which were merged were more often interlocked with non-financial corporations.
5.2 Developing a baseline model of distress
A series of seven regressions are reported in Table 8. We examine the effect of five categories of
variable independently and then together. Model 1 is concerned with the quality of banks’ assets;
Model 2 with banks’ loan quality; Model 3 with banks’ capital adequacy; Model 4 with the
sufficiency of banks’ earnings; and Models 5 and 6 with liquidity and leverage. Model 7 combines
the previous categories and constitutes the baseline model in all further regression analyses. We
briefly discuss this baseline model (Model 7) and the fundamental variables below.
Asset quality: We find that larger banks were more likely than others to experience distress in
the 1920s. This refutes the claim made by one contemporary observer of the crisis (Verrijn Stuart,
1921) that larger (and possibly better diversified) banks would be better able to weather a crisis. We
find that a bank’s age is consistently important, even after controlling for potential non-linearity. The
relationship suggests that the older banks were more likely to survive the 1920s, each additional year
of business reducing by 13 per cent the probability of experiencing distress. A possible explanation is
18
that their directors had more experience of bank management (for example, in terms of experience of
asset selection) and were therefore better equipped to navigate through a crisis.
Loan quality: The quality of a bank’s loan book is a very important determinant of crisis-
period failure. Banks with a higher proportion of their balance sheet made up of (long-term) loans
outstanding had a lower probability of distress – 10 per cent more chance for every one per cent of
its loans. Banks investing more in short-term loans were also less likely to experience distress during
the 1920s – 0.6 per cent more change for every additional guilder in their short-term loans. Note,
however, that this risk reduction is significantly lower than the 12 per cent for their long-term loans;
hence it could be argued that short-term loans were inherently more risky in the 1920s, much in line
with an inverted-interest yield curve (Harvey, 1989).
Capital adequacy: To begin with, the size of a bank’s working capital relative to its liabilities
negatively affects the probability that it will experience distress – good working capital ratios signal
high quality. Second, we find that banks’ financial flexibility in terms of reserves is negatively
related to the probability of distress – more reserves indicate a higher level of financial flexibility
which can be used to better weather a deflationary shock, where an increase of one per cent in equity
reserves (at the median) results in a risk reduction of 75 per cent.
Earnings sufficiency: Banks’ dependency on interest income and expenses has virtually no
effect on the probability of experiencing distress. However, banks’ profitability (returns on assets)
increases the probability of distress, implying the riskiness of banks’ operational activities (cash flow
risk). This may be explained by the theory of “crisis cycles”, where periods of modest growth lay the
foundation for the next crisis (Thakor, 2012). Supporting the claim of “crisis waves”, we find that
banks were more profitable and were more highly valued before the crisis of the 1920s; from 1916 to
1919, the stock prices of banks which would go on to experience distress increased by about 10 per
cent (0.6 per cent for non-distressed banks). This suggests that the banks which did best out of the
post-war settlement had most to lose in any ensuing economic reversal.
19
Liquidity: With respect to liquidity, we find that banks which were more dependent on less
liquid assets were more prone to experience distress during a deflation. The same is found for banks
which were better able to match the maturity of their assets; these banks were less prone to the risk
of deflation and less likely to experience distress. Moreover, we find that banks which had their
stocks listed on Amsterdam’s stock exchange were more likely to experience distress, as their
liquidity and thus their market liquidity risk increased (Kalev et al., 2003).
Leverage: We find that banks which were more highly levered (in terms of total debt,
deposits or bonds) stood a higher chance of falling into distress. This confirms the conjecture of
Jonker & Van Zanden (1995) that this was indeed a deflationary crisis. Additionally, we find that
holding additional deposits increased the risk of experiencing distress – by 51 per cent for each per
cent increase (relative to the asset base).
5.3 Accounting for the effects of region and bank type
We include various dummy variables in Table 8 to capture regional (inter-bank lending and
geographic specialisation) and bank type (business model) differences in the experience of the 1920s.
We use Model 13, a combination of these, in all subsequent regressions.
Regional fixed effects: Banks located in Zuid-Holland, Noord-Holland and Groningen had a
higher probability than banks from other provinces of experiencing distress. With respect to the
baseline model, the following changes occur after correcting for regional fixed effects and city fixed
effects: (1) there is a significant change in the effect of size when including regional effects,
indicating that the largest banks are concentrated in particular regions and cities; and (2) banks’
involvement in long-term loans becomes significant after controlling for city fixed effects, indicating
that the business of granting loans may have been concentrated in the banks’ home cities. When
credit takers live close to lenders, it is easier to monitor their progress. Part of the effect of having
more reserves as protection against exogenous shocks derives from regional differences. The
20
leverage effect is significantly influenced by region and city fixed effects, indicating that banks in the
same region would lend to each other. Banks’ level of leverage also appears to have differed by
region.
Bank type fixed effect: Compared to shipping banks, commercial banks and banks which
specialised in mortgage business stood a lower chance of going into distress. This can be explained
by the business model of any given bank, since mortgage banks were more prone to domestic shocks
and shipping banks would have been highly sensitive to the international trade demand.
Controlling for all fixed effects: We find that general commercial banks and, in particular,
mortgage banks had a lower probability than shipping banks of going into distress, even after
controlling for regional fixed effects. In addition, we find that banks’ characteristics – such as having
their stock listed in Amsterdam, their asset liquidity, their leverage and the amount of deposits they
held – were significantly influenced by their type and their operating region. Thus, we find that it is
relevant here to include fixed effects in subsequent regressions, where the type effects in particular
show a significant impact in risk reduction in the range of 11 to 21 per cent in the case of the median
bank.
5.4 Re-evaluating the causes of the Dutch crisis
Table 10 shows the results of the logistic regressions with respect to our hypotheses, where Model 14
encapsulates the effect of banks’ management structure on the probability of experiencing distress
during the 1920s; Model 15 focuses on the characteristics of interlocked banks; Model 16 relates to
the characteristics of interlocked non-financials; and Model 17 combines all these effects.
Management structure: We find that high board size significantly reduces the probability that
a bank would experience distress during the 1920s. We suggest that a larger board signifies increased
experience on the part of members; a bank possessing it has more “in-house experience” to cope with
crisis situations; consequently a one per cent increase in board size results in a reduction of distress
21
probability in the range of nine to 19 per cent.18 Second, we find that the banks which were
interlocked with many non-financials were significantly less prone to the effects of the 1920s crisis.
In contrast, we find that those banks which were more interlocked with other banks (i.e. which had
board members who were directors of other banks), they were significantly more prone to experience
distress, indicating a conflict of interest for boards at the time – supporting the claim of Colvin
(2013) and much in line also with Ferris et al. (2003).19 We also find that having a banker from DNB
on the board had no significant effect and what effect it had was comparatively small.
Characteristics of interlocked banks: We find that there are diversification properties in
having interlocked directors or supervisors, since the average size of the interlock (in terms of total
assets) was observed to have a negative effect on the probability of experiencing distress. However,
we find that, as banks concentrated their interlocks with primarily large firms, the risk to them
increased significantly, inherently increasing the risk profile of their operations by making them
dependent on a couple of other big banks. The adverse effect of increased concentration is ten times
greater than the effect of an increased size of interlocked banks. We find that the average leverage of
interlocked banks, despite being marginally non-significant at standard levels of significance,
increases the chance that a bank will experience distress. This finding is best explained by the
correlated solvency of the banking sector, which is dependent on the welfare of the industry. This
view is supported by the finding that the profitability of interlocked banks before the crisis was an
18 Board size is constructed as the total number of directors and supervisors on the board of a bank. Making a
distinction between directors and supervisors does not yield any systematically different results. The results remain
robust after controlling for potential non-linear properties. 19 In an alternative specification, board independency (measured by the ratio of directors to supervisory board
members on the board), has only limited (non-significant) influence on the probability of distress. It can be argued that
board size influences the number of interlocks and the relation between the characteristics of the interlocks and the
probability of distress. However, removing board size from the analysis in Model 18 has an impact only on the variables
of stock listing and liquidity. We argue that the main cause of this is that bankers explicitly prefer to sit on the boards of
listed and highly liquid banks, because: (1) there is more money to be earned from stock market trading (pointing to
insider trading); (2) there is a reputation effect since banks with high liquidity subsequently manage more assets, which is
deemed prestigious.
22
important factor in determining the probability of distress during the 1920s, since the cash flows of
the banks were naturally correlated.
Characteristics of interlocked non-financial firms: We find that banks which were
interlocked with highly profitable non-financial corporations (in 1917) were more likely to
experience distress. This can be explained by the immense post-war increase in the assets of the
industrial sector. The demand for industrial goods immediately following the end of the First World
War increased significantly and consequently raised the demand for industrial credit. This rapid
growth put considerable strain on the operating risk to non-financial corporations; thus, when entire
industries were unable to make due loan payments, their banks suffered. We find that banks which
had concentrated their interlocking directorates in a limited number of industries (i.e. were highly
concentrated) were less likely to experience distress, the effect ranging from a 20 to a 25 per cent
increase in distress probability for each percentage increase in concentration in a particular industrial
sector. As the leverage of the interlocked firms increased, the risk of contagion followed, increasing
between 26 and 35 per cent for each percentage of leverage increase. Although it is not significant at
standard levels of significance, this observation is consistent with the verdict that the 1920s’
depression was at root a debt deflationary crisis. Additionally, we find that the level of dilution of
control that a bank experiences on the board of interlocked non-financials significantly increased the
probability of experiencing distress during the 1920s. Because non-financials had larger boards,
banks could exert less influence in board meetings.
In summary, we find evidence that Jonker (1991) was correct in believing that interlocks
added to the risk for banks. However, we show that Jonker’s ideas can be expressed more precisely
in terms of the characteristics of interlocked banks and non-financial firms, such as firm size,
leverage, profitability and (industry) concentration.
23
5.5 Explaining the influence of exotic liability regimes
The Dutch financial sector of the early twentieth century was characterised by a wide variety of
banks with different regimes for shareholder liability.20 Much like the British and Irish banking
sectors during the nineteenth century (Hickson and Turner, 2003; Hickson et al., 2005), many banks
in the Netherlands, from our evidence, chose some form of shareholder liability regime which left
unpaid some portion of the equity capital. We find that 67 per cent of the banks in our sample chose
this and that these banks left on average 25 per cent of their equity capital unpaid, even though there
is a large variation in the portion of unpaid capital.21 We argue that the liability regime choice made
by the different banks significantly affected their business model, showing that the liability regime
choice had a significant effect on the way that profits were redistributed and dividends paid.22 We
define banks as having some form of extended shareholder liability regime if they had a portion of
equity capital left unpaid and we capture the incremental effect by calculating the size of this portion.
Table 11 reports that banks with a liability regime in which there was equity capital left
unpaid were significantly different in terms of their balance sheet characteristics, management
structure and interlocking directorates. Given the number of differences and the size of these
differences, it is very likely that banks’ liability regime choice determines from the outset how a
20 The description in this section is based on research collected from annual reports, statutes and investor prospectuses
in DNB’s archive, for banks operating in the Netherlands (Archive Section No. C.00.01, Archief van De Nederlandsche
Bank NV, Access No. 2.25.08, NA). 21 Some banks compelled all their shareholders to pay only a certain percentage – usually about 20 per cent – which
resulted in equal dividend payments for all shareholders. These banks had provisions that, if more of the capital needed
to be paid up, they would advertise it in the papers (usually three months before the payment was due). To make sure
their shareholders paid the outstanding proportion, banks warned that they would publish the names or at least the
registry numbers of the shares of shareholders who failed to pay their dues. If the payments were not received before a
certain deadline, these shares would be cancelled and re-sold. 22 Dividends were sometimes paid according to the portion of equity paid by shareholders; e.g. the Noord-
Amerikaansche Hypotheekbank stated that: ‘dividends will be distributed among shareholders according to the number
of shares they own with a maximum value of five per cent of the value of equity capital paid’ (Algemeen Handelsblad, 22
June 1916, p. 4). Some banks required their shareholders to pay only a minimum proportion of their shares, sometimes as
low as 10 per cent, and permitted them to top this up as they desired. The dividend on the required portion was higher
than on the voluntary proportion.
24
bank is structured and how it executes its business model. This is similarly argued, with different
data, in Colvin (2011). Most striking here is that banks with unpaid equity capital have similar levels
of profitability and board sizes, but substantially fewer interlocking directorates. Moreover, we find
that banks with unpaid equity capital are younger, smaller and tend to be unlisted. We argue that
banks which had portions of their equity capital left unpaid were less liquid, due to limited tradability
and transferability (Woodward, 1985) and hence did not have their stock listed in Amsterdam.
We subsequently construct a new baseline model using all the balance sheet, management
structure and interlock variables which were not affected by the liability regime choice. Table 12
summarises the new baseline model in Model 18. Model 19, which includes all the variables from
Model 18, relates to the liability regime choices made by banks, captured by a dummy variable
which equals one if and only if there is equity capital left unpaid. Model 21 focuses on the portion of
equity capital left unpaid.
We find that banks which chose to extend the liability of their shareholders beyond their paid
proportion were more prone to experience distress; this may be explained by reflecting that banks
which could call on their shareholders to pay an additional portion of the equity capital had easy
access to new financing, an effect which could range between two and nine per cent. Most
interestingly, we find that banks which had a higher percentage of their equity capital left unpaid
were less likely to experience distress during the crisis, where an increase of unpaid capital by one
per cent resulted in a lower probability of distress, with about 32 per cent at the median. This result
seems to contradict the previous effect. We can reconcile the two results as follows. First, banks
which already had all their equity capital paid up had less of an equity buffer to protect them and
thus had less capital available to weather a crisis. Second, banks which had higher portions of their
equity capital left unpaid may have been more closely monitored by their shareholders, as they stood
to lose more of their capital if the bank called on their remaining portions of equity.�This finding is in
line with Esty (1998) and Grossman & Imai (2013), who find that banks with extended liability
regimes tend to take less risk because shareholders have an incentive to monitor the board.
25
In Models 20 and 22 we run a horse race between the liability variables and the bank
characteristics that are influenced by the regime choice, in order to measure whether the initial
regime choice or the potentially consequential policy choices drive the distress likelihood. We find
that the regime effects turn insignificant. This finding is consistent with a notion of path dependency
where liability regimes shape bank policies and these policies determine survival chances.
5.6 Additional results and robustness analyses
In this section we report a number of additional results and analyses to determine whether our
findings are robust to alternative model specifications and sample selection bias. We develop models
which focus on: (1) banks which report executive compensation metrics; (2) banks for which
sufficient data are available to calculate annual growth over 1917; (3) a sub-sample of banks
excluding non-mortgage banks, which constitute a large portion of our sample and tend to be
relatively small and specialised and make up a large portion of our sample; (4) excluding very old
banks, as their characteristics might introduce a bias to our estimation, since none of the failing
banks were older than 17 years; (5) using an alternative age specification, focusing not on the date of
first business but on the date of first incorporation rather than first business; (6) interlocking
directorates with the influential private banks Mees & Zoonen, Ooyens & Co., Hope & Co. and
Eeghen & Co., since the partners of these private banks were jointly liable with their private capital,
giving these banks a strong incentive to pick other banks which were more liquid and less risky; (7)
all relationships excluding the variable board size, since it can be argued that banks with bigger
boards are more dependent on linkages with other banks; and (8) using a stronger definition of bank
distress which excludes reorganisations and mergers and includes only exit from the market through
liquidation.
We find that banks which paid their directors more tended to be more likely to experience
distress during the 1920s, a result that is closely aligned to theoretical and empirical predications. For
26
example Fahlenbrach & Stulz, (2011) find that banks with directors whose incentives were better
aligned with the interests of shareholders performed worse. Our proxy for incentive alignment,
however, is rather crude because the public disclosure of payment to executives was voluntary and
our measure of executive payment (tantièmes) is imperfectly correlated with total executive pay (see
footnote 10). While we find that asset growth does not have a statistically significant impact on the
probability of experiencing distress during the 1920s, we argue that the economic magnitude is
relevant, because a one per cent increase in growth induces a spike increase in distress probability
(11 per cent). This suggests that the banks which benefited most from the short post-war boom
suffered most in the ensuing crisis.
With respect to the alternative sub-samples, we find that banks which had interlocking
directorates with DNB had a significantly higher probability of failure if they were non-mortgage
banks, or young banks. With respect to the alternative age definition, we find no significant
differences. With respect to interlocking directorates with large private banks we find results
consistent with the idea that sharing a director with one of these banks is reassuring. We argue that
these private banks chose their interlocking directorates according to the characteristics of the public
banks, in particular: (1) their liquidity, for which the coefficient in Model 30 becomes significantly
higher than Model 17, the private bank variable picking up part of the liquidity aspect; (2) having a
stock listing, where, once we control for interlocking directorates with these private banks, it reduces
risk to have a stock listing – banks appear to benefit from the additional liquidity and access to
financing.
The variables capturing bank size, liquidity and stock listing are significantly affected by the
size of a bank’s board. However, our primary results hold good with respect to interlocking
directorates and the appropriate characteristics. When using our narrower definition of distress, we
find that the results for interlocking directorates and the appropriate characteristics are only
strengthened. In summary, we find that our results are robust to these alternative specifications; our
27
main results on banks’ balance sheet characteristics, management structure and interlocking
directorates hold in all robustness exercises carried out.
6. Predicting the past
The regression models of the previous section help in understanding the consequences for banks of
the 1920s deflation, or more specifically, how bank characteristics set before the crisis period
influenced their ensuing fate. What these analyses fail to do is discriminate between models, to
identify which better explains the crisis. Given what we know through hindsight, which group of
variables is more useful when predicting the past? On which indicators should contemporaries have
based their investment decisions?
A way of assessing the fit of binomial regression models popular in medical analysis is to
ascertain what proportion of true positives it classifies as being positive (called the “sensitivity” of
the model) and what proportion of true negatives it classifies as being negative (called its
“specificity”).23 As a crude measure, a model’s sensitivity and specificity can be calculated for a
probability threshold. Such an exercise would provide a cross-tabulation of observed and predicted
outcomes if the probability is, say, 0.5 or more, and a false outcome otherwise. As such a threshold is
rather arbitrary, a better idea is to measure the sensitivity and specificity of all possible
combinations. We can then plot the true positive fraction (sensitivity) against the false positive
fraction (1 – specificity) for key models in our regression analysis. The curve in such a graph is
called the receiver operating characteristic (ROC). The bottom left corner of the plot space
corresponds to a combination of zero per cent sensitivity and 100 per cent specificity; the top right
corner represents the reverse. The best possible combination can be found in the top left corner, with
100 per cent sensitivity and specificity, or a perfect prediction. Any model that traces an ROC curve
23 Metz (1978) describes the method used here in the context of medical statistics. A variant is used in Taylor (2012)
as a means of assessing the predictive ability of his models of global financial crises.
28
above the 45-degree line has a better predictive ability than tossing an unbiased coin. The larger the
area under the ROC curve (abbreviated to AUC), the better the predictive ability of the model.
Figure 3 plots the ROC curves of our key regression models; Table 14 reports the AUC
values for these models. The analysis suggests that: (1) the addition of region and bank type fixed
effects improves the power of our distress prediction; (2) the characteristics of interlocked banks
appear to be more important than the characteristics of interlocked non-financial firms in predicting
which banks suffer in the crisis; and (3) the overall liability regime choice appears to be more
important than the portion of shareholder capital which remains unpaid in the prediction, but only by
a very small amount. Overall, the best group of models with which to predict the past appear to be
those that include information about the managerial structure and the characteristics of interlocked
firms; an AUC value above 0.8 signifies a good model fit.
7. Conclusion
We find that balance sheet characteristics, bank management structure and interlocking directorates
have had a significant impact on the probability of a bank’s survival during the 1920s banking crisis
in the Netherlands. In particular, we find that the characteristics of the financial firms with which a
bank shares managerial ties have a high predictive power. We argue that banks should take the
following measures to increase their ability to survive a crisis: (1) limit the size of their operations, as
larger banks carry more risk on their balance sheet because it is more difficult for them to maintain a
diversified portfolio; (2) limit their leverage, as banks which are more leveraged bear more risk,
either from the terms attached to the short-term credits, or from their dependence on immediately-
callable deposits; and (3) carefully monitor the sources of their profit, as a bank’s cash flow can be
used as a predictor of crisis-cycles. Additionally, we argue that a bank should benefit from the
experience added by augmenting its board, increasing the dominance of financial firms over industry
and increased interbank relationships.
29
However, risks are inherent in these policies and a bank should: (1) limit the concentration of
its inter-connectedness with other banks, big banks in particular; (2) limit its concentration on banks
which are extremely profitable, because cash flows in the financial sector are highly correlated; (3)
dilute the dominance of the financial sector over the industrial sector, as banks which focus their
dominance on larger industrial firms are more at risk; and (4) avoid fragmenting their dominance
across different industrial sectors. Moreover, we argue that a bank should be free to use extended
liability regimes to incentivise ex ante good behaviour, using large portions of its equity capital to
limit risk and increase shareholder monitoring. These findings not only improve our understanding of
this particular crisis, but also provide evidence for financial economists and regulators interested in
the efficacy of corporate governance structures and practices when formal banking regulation is
absent.
Data appendix
This appendix describes with the aid of an example how the accounting and governance data
collected from Van Oss were standardised and converted to consistent categories across all firms: we
use Marx & Co.’s Bank, probably the most high-profile casualty in the early part of the 1920s crisis.
Table 1, Panel A shows the 1918 balance sheet of Marx & Co.’s Bank, as published at the
time. The bank’s assets are noted on the left-hand panel and are divided into: Aand. in portef.
(unplaced equity); Kassa (cash held in the firm); Wiss., coupons en spec (short-term loans); Bankiers
(cash held at banks); Effecten (investments in financial assets); Fondsen af te leveren (deliverable
funds); Voorschot. in rek.-crt. tegen effecten en beleeningen op effecten (advances against financial
assets and/or accounts payable); Voorschot. tegen goed., hyp of borgst. (advances against goods,
mortgages or bail); Saldo’s rek.-crt (net accounts receivable); Gebouwen en safes (building and
safes); and Meubilair (furniture). The bank’s liability structure is listed in the right-hand panel and is
divided into: Kapitaal (nominal equity capital); Reserve (equity reserves); Personeelfonds (funds
30
available for employees); Bankiers (cash stored by other banks); Effecten in beleening gegeven
(invested funds under management from third parties); Saldo’s r.crt. en dep. (net accounts payable
and deposits); Id. v. rek. v. derden (net payable accounts from third parties); Accepten en traites
(accepted short term loans); Dividend (dividends); and Onverdeeld (retained profits).
Table 1, Panel B depicts the same balance sheet converted to standardised categories which
are consistent across all the sampled banks. Assets are divided into: fixed assets, financial assets and
current assets; and the equity and liability structure consists of equity capital, provisions and long-
and short-term liabilities. The difference between equity reserves and provisions is the nature of the
reservation. Cases in which the purpose of a reserve was clearly stated have been classified as a
provision. In some cases, the item aandeelhouders (shareholders) was found on the left-hand side of
the balance sheet. This signalled there is unpaid equity capital, which the bank could call upon in
times of need. This item was subtracted from the balance sheet and the nominal equity capital was
subsequently lowered. The same procedure was followed for all 143 banks in our sample and the 234
non-financial firms that were used in the calculation of the interlock characteristics.
For the governance data, we compiled a list of all directors and supervisors on the boards of
all banks and non-financial corporations at the start of 1918. This yielded 1,269 individuals sitting on
the boards of 143 banks and 1,625 individuals sitting on the boards of 234 non-financial
corporations. Subsequently, we cross-referenced each individual and found that each bank had on
average seven interlocks with other banks and non-financial corporations. We count multiple
interlocks with one bank (or non-financial) as only one interlock.
31
References
Acharya, V., Philippon, T., Richardson, M. & Roubini, N. (2009). The financial crisis of 2007–2009: Causes and
remedies. Financial Markets, Institutions and Instruments 18(2), 89-137.
Altman, E.I. (1968). Financial ratios, discriminant analysis and the prediction of corporate bankruptcy. The Journal of
Finance 23(4), 589-609.
Altman, E.I., Haldeman, R.G. & Narayanan, P. (1977). ZETATM analysis: A new model to identify bankruptcy risk of
corporations. Journal of Banking & Finance 1(1), 29-54.
Acharya, V.V. & Richardson, M. (2009). Causes of the Financial Crisis. Critical Review 21(2-3), 195-210.
Bernanke, B. & James, H. (1991). The gold standard, deflation and financial crisis in the Great Depression: An
international comparison. In R.G. Hubbard (Ed.), Financial markets and financial crises (33-68). University of
Chicago Press, Chicago.
Campello, M., Graham, J.R., Harvey, C.R. (2010). The real effects of financial constraints: Evidence from a financial
crisis. Journal of Financial Economics 97(3), 470-487.
Cielen, A., Peeters, L. & Vanhoof, K. (2004). Bankruptcy prediction using a data envelopment analysis. European
Journal of Operational Research 154(2), 526-532.
Colvin, C.L. (2011). Religion, competition and liability: Dutch cooperative banking in crisis, 1919-1927. PhD
Dissertation, London School of Economics and Political Science.
Colvin, C.L. (2013). Interlocking directorates and conflicts of interest: The Rotterdamsche Bankvereeniging, Müller &
Co. and the Dutch financial crisis of the 1920s. Business History, forthcoming.
Cooper, E. & Uzun, H. (2010). Directors with a full plate: The impact of busy directors on bank risk. Journal of
Financial and Economic Practice 38(6), 571-586.
Crawford, A., Ezzell, J. & Miles, J. (1995). Bank CEO pay-performance relations and the effects of deregulation. Journal
of Business 68, 231-256.
De Jong, A. & Röell, A. (2005). Financing and control in the Netherlands. In R.K. Mork (Ed.), A history of corporate
governance around the world (467-506). University of Chicago Press, Chicago.
De Jong, H.J. (2005). Between the devil and the deep blue sea: The Dutch economy during World War I. In: S.N.
Broadberry & M. Harrison (Eds.), The economics of World War I (137–168). Cambridge University Press,
Cambridge.
Den Bakker, G., Huitker, T. A. & Van Bochove, C. A. (1990), The Dutch economy 1921- 39: Revised macroeconomic
data for the interwar period. Review of Income and Wealth 36(2), 187-206.
De Nederlandsche Bank (2000). Nederlandse financiële instellingen in de twintigste eeuw: balansreeksen en namenlijst
van handelsbanken. DNB Statistisch Cahier, No. 3. NIBE/SVV, Amsterdam.
De Vries, J. (1976). Een eeuw vol effecten: Historische schets van de Vereniging voor de Effectenhandel en de
Amsterdamse Effectenbeurs 1876-1976. Vereneging voor de Effectenhandel, Amsterdam.
De Vries, J. (1989). Geschiedenis van de Nederlandsche Bank: Visserings tijdvak 1914-1931. Vol. 5, Part 1, NIBE,
Amsterdam.
Esty, B.C. (1998). The impact of contingent liability on commercial bank risk taking. Journal of Financial Economics
47(2), 189-218
32
Euwe, J. (2010). Financing Germany: Amsterdam’s role as an international financial centre 1914-1931. In P. Babeau &
A. Ögren (Eds.), Convergence and divergence of national financial systems: Evidence from the gold standard,
1871-1971 (Chapter 12). Pickering & Chatto Publishers, London.
Fahlenbrach, R. & Stulz, R.M. (2011). Bank CEO incentives and the credit crisis. Journal of Financial Economics 99(1),
11-26.
Fama, E.F. & Jensen, M.C. (1983). Separation of ownership and control. Journal of Law and Economics 26(2), 301-325.
Ferris, S.P., Jagannathan, M. & Pritchard, C. (2003). Too busy to mind the business? Monitoring by directors with
multiple board appointments. The Journal of Finance 58(3), 1087-1112.
Fisher, I. (1933). The debt-deflation theory of great depressions. Econometrica 1(4), 337-338.
Fohlin, C. (1999). Universal banks in pre-World War I Germany: Model or myth? Explorations in Economic History
36(4), 305-343.
Grossman, R.S. & Imai, M. (2013), Contingent capital and bank risk-taking among British banks before the First World
War. The Economic History Review 66(1), 132-155.
Harvey, C.R. (1989). Forecasts of economic growth from the bond and stock markets. Financial Analyst Journal 45(5),
38-45.
Jonker, J. (1989). Waterdragers van het kapitalisme: Nevenfuncties van Nederlandse bankiers en de verhouding tussen
bankwezen en bedrijfsleven, 1910-1940. Jaarboek voor de Geschiedenis van Bedrijf en Techniek 6, 158-190.
Jonker, J. (1991). Sinecures or sinews of power? Interlocking directorship and bank-industry relations in the Netherlands,
1910-1940. Economic and Social History in the Netherlands 3, 119-132.
Jonker, J. (1995). Spoilt for choice? Banking concentration and the structure of the Dutch banking market, 1900-1940. In
Y. Cassis, G.D. Feldman & U. Olsson (Eds.), The evolution of financial institutions and markets in twentieth-
century Europe (18-208). Scholar Press, Aldershot.
Jonker, J. (1996). Between private responsibility and public duty. The origins of bank monitoring in the Netherlands,
1860-1930. Financial History Review, 3(2), 139-152.
Jonker, J. (2002). Competing in tandem: Securities markets and commercial banking patterns in Europe during the
nineteenth century. In D.J. Forsyth & D. Verdier (Eds.), The origins of national financial systems: Alexander
Gerschenkron reconsidered (64-86). Routledge, New York.
Jonker, J. & van Zanden, J.L. (1995). Method in the madness? Banking crises between the wars, an international
comparison. In C. H. Feinstein (ed.), Banking, currency and finance in Europe between the wars (77-93).
Clarendon Press, Oxford.
Jordan, D.J., Rice, D., Sanchez, J., Walker, C. & Wort, D.H. (2010). Predicting bank failures: Evidence from 2007 to
2010. Available at: http://papers.ssrn.com/sol3/papers.cfm?abstract_id=1652924.
Kaufman, G.G. (1990). Are some banks too large to fail? Myth and reality. Contemporary Economic Policy, 8(4), 1-14.
Klijnveld, P. (1921). Organisatie, administratie en controle van het bankbedrijf. In Het bankwezen.
Uitgeversmaatschappij v/h Delwel, Amsterdam.
Kolari, J., Glennon, D., Hwan, S. & Caputo, M. (2002). Predicting large US commercial bank failures. Journal of
Economics and Business, 54(4), 361-387.
Kroszner, R.S. & Strahan, P.E. (2001). Bankers on boards: Monitoring, conflicts of interest and lender liability. Journal
of Financial Economics 62(3), 415-452.
Kramer, H.A.E. (1928). Reorganisaties van Naamlooze Vennootschappen in Nederland 1920-1926. PhD Dissertation,
Nederlandsche Handelshoogeschool Rotterdam, Rotterdam.
33
Martin, D. (1977). Early warning of bank failure: A logit regression approach. Journal of Banking and Finance 1(3),
249-276.
Metz, C.E. (1978). Basic principles of ROC analysis. Seminars in Nuclear Medicine 8(4), 283-298.
Meyer, P.A. & Pifer, H.W. (1970). Prediction of bank failures. The Journal of Finance 25(4), 853-68.
Kalev, P., Pham, P. & Steen, A. (2003). Underpricing, stock allocation, ownership structure and post-listing liquidity of
newly listed firms. Journal of Banking and Finance 27(5), 919-947.
Pettway, R. & Sinkey, J. (1980). Establishing on-site bank examination priorities: An early warning system using
accounting and market information. The Journal of Finance 35(1), 137-150.
Ravi Kumar, P. & Ravi, V. (2007). Bankruptcy prediction in banks and firms via statistical and intelligent techniques – A
review. European Journal of Operational Research 180(1), 1-28.
Reinhart, C.M. & Rogoff, K.S. (2009). This time is different: Eight centuries of financial folly. Princeton University
Press, Princeton.
Shumway, T. (2001). Forecasting bankruptcy more accurately: A simple hazard model. The Journal of Business 74(1),
101-124.
Sternheim, A. (1924). Leerboek der accountancy: handleiding ten dienste van accountants en assistent-accountants,
directeuren en commissarissen van naamlooze vennootschappen, kooplieden, bankiers en industrieelen.
Uitgeversmaatschappij v/h Delwel, Amsterdam.
Taylor, A. (2012). External imbalances and financial crises. NBER Working Paper Series, No. 18606.
Thakor, A. (1996). Capital requirements, monetary policy, and aggregate bank lending: Theory and empirical evidence.
The Journal of Finance 51(1), 279-324.
Thakor, A. (2012). Success-driven skill inferences and financial crises. Mimeo, Olin Business School, Washington
University.
Thomson, J.B. (1991). Predicting bank failures in the 1980s. Federal Reserve Bank of Cleveland Economic Review Q(I),
9-20.
Verrijn Stuart, G.M. (1921). Bankpolitiek. In Het bankwezen. Uitgeversmaatschappij v/h Delwel, Amsterdam.
Westerman, W.M. (1920). De concentratie in het bankwezen: Een bijdrage tot de kennis der economische ontwikkeling
van onzen tijd. Martinus Nijhoff, The Hague.
Wheelock, D.C. & Wilson, P.W. (2000). Why do banks disappear? The determinants of U.S. bank failures and
acquisitions. Review of Economics and Statistics 82(1), 127-138.
Woodward, S. (1985). Limited liability and the theory of the firm. Journal of Institutional and Theoretical Economics
141(4), 601-611.
Van der Bie, R.J. (1995). Een doorlopende groote roes: De economische ontwikkeling van Nederland 1913/1921.
Tinbergen Institute Research Series Vol. 98, Thesis Publishers, Amsterdam.
Van der Bie, R.J & Smits, J.-P. (2001). Tweehonderd jaar statistiek in tijdreeksen, 1800-1999. Centraal Bureau voor de
Statistiek, Voorburg/Heerlen.
Van Zanden, J.L. (1997). Old rules, new conditions, 1914-1940. In M. ’t Hart, J. Jonker & J.L. van Zanden (Eds.), A
financial history of the Netherlands (124-151). Cambridge University Press, Cambridge.
Zmijewski, M.E. (1984). Methodological issues related to the estimation of financial distress prediction models. Journal
of Accounting Research 22(S), 59-82.
Wibaut, F.M. (1913). De nieuwste ontwikkeling van het kapitalisme. Scheltema & Holkema’s Boekhandel, Amsterdam.
34
About the authors
Christopher L. Colvin ([email protected]) is a Lecturer in Business Economics at Queen’s
University Management School, Queen’s University Belfast, where he is also a member of Queen’s
University Centre for Economic History.
Abe de Jong ([email protected]) is a Professor of Corporate Finance and Corporate Governance at the
Rotterdam School of Management, Erasmus University, where he also co-directs Erasmus
University’s Centre for Business History.
Philip T. Fliers ([email protected]) is a PhD Candidate in Finance at the Rotterdam School of
Management, Erasmus University, where he also teaches in the Department of Finance.
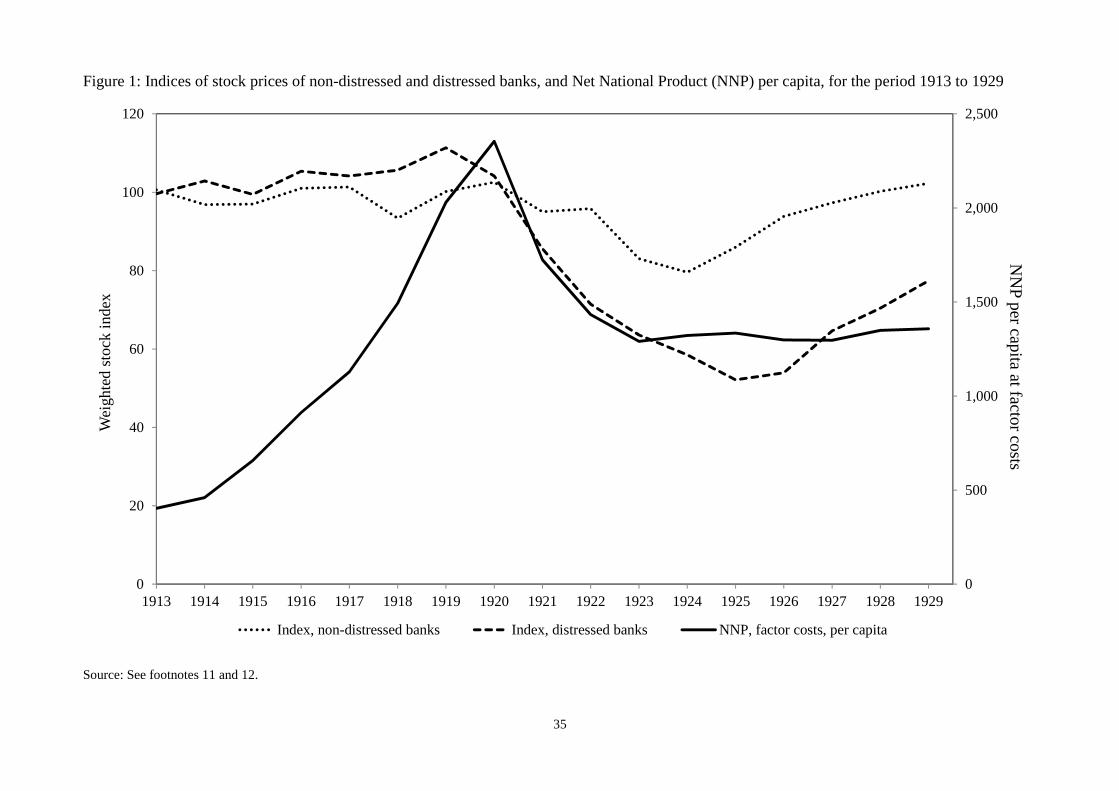
35
Figure 1: Indices of stock prices of non-distressed and distressed banks, and Net National Product (NNP) per capita, for the period 1913 to 1929
Source: See footnotes 11 and 12.
0
500
1,000
1,500
2,000
2,500
0
20
40
60
80
100
120
1913 1914 1915 1916 1917 1918 1919 1920 1921 1922 1923 1924 1925 1926 1927 1928 1929
NN
P per capita at factor costsW
eigh
ted
stoc
k in
dex
Index, non-distressed banks Index, distressed banks NNP, factor costs, per capita
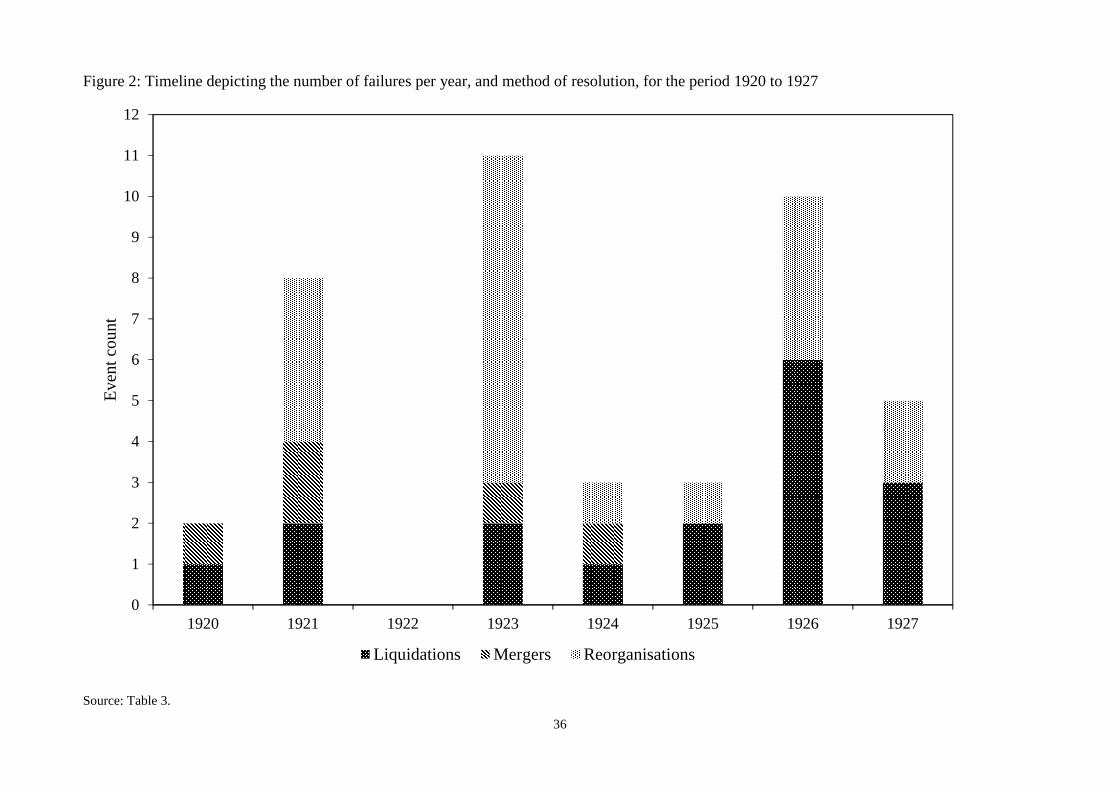
36
Figure 2: Timeline depicting the number of failures per year, and method of resolution, for the period 1920 to 1927
Source: Table 3.
0
1
2
3
4
5
6
7
8
9
10
11
12
1920 1921 1922 1923 1924 1925 1926 1927
Eve
nt c
ount
Liquidations Mergers Reorganisations
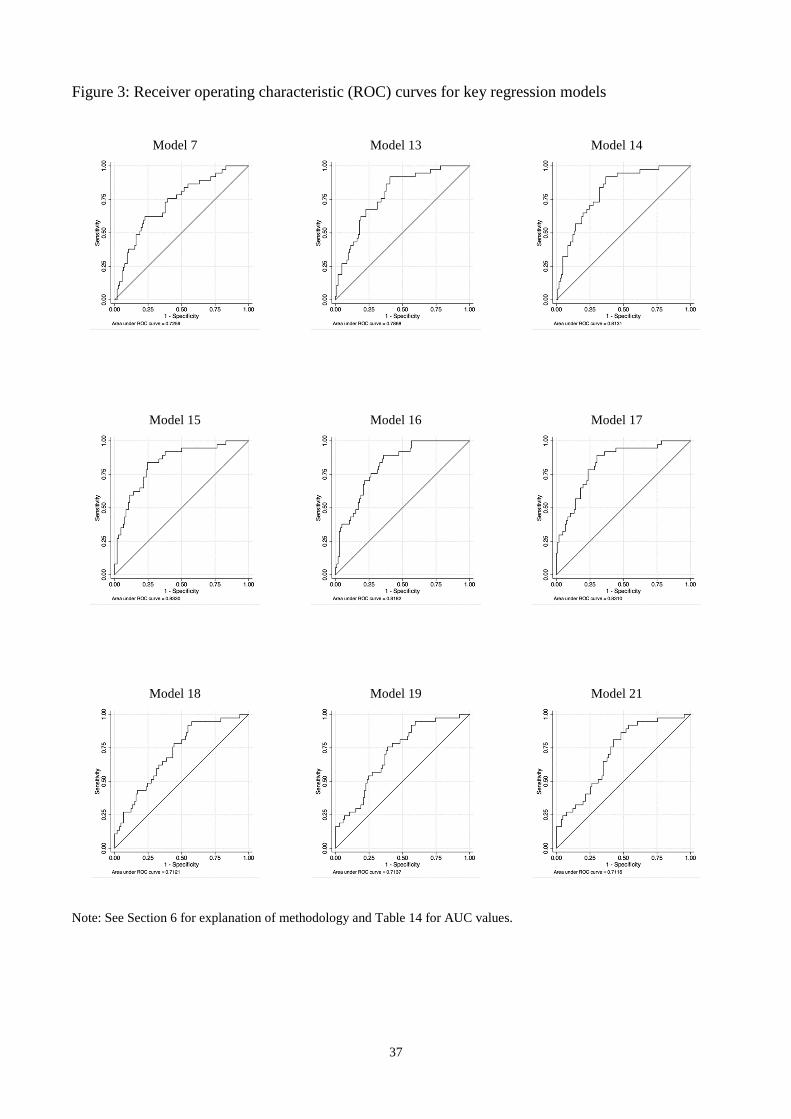
37
Figure 3: Receiver operating characteristic (ROC) curves for key regression models
Model 7
Model 13
Model 14
Model 15
Model 16
Model 17
Model 18
Model 19
Model 21
Note: See Section 6 for explanation of methodology and Table 14 for AUC values.
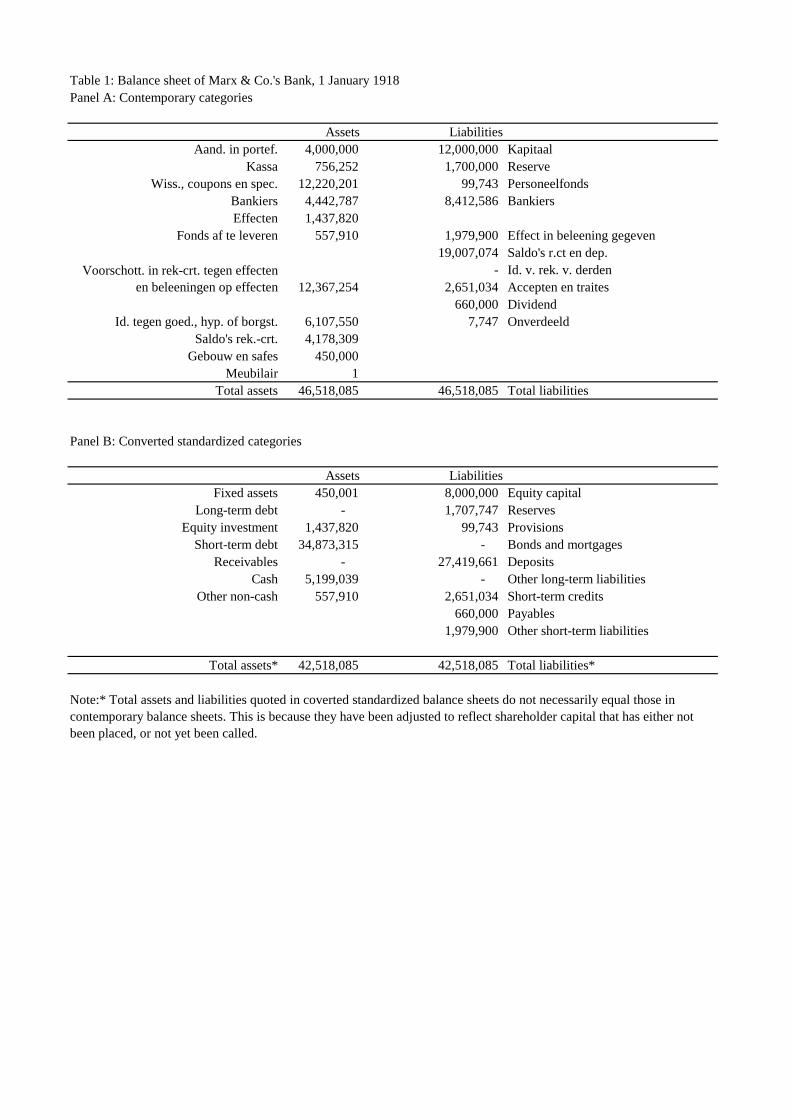
Table 1: Balance sheet of Marx & Co.'s Bank, 1 January 1918
Assets Liabilities4,000,000 12,000,000
756,252 1,700,000 12,220,201 99,743 4,442,787 8,412,586 1,437,820
557,910 1,979,900 19,007,074
-12,367,254 2,651,034
660,000 6,107,550 7,747 4,178,309
450,000 1
46,518,085 46,518,085
Liabilities450,001 8,000,000
- 1,707,747 1,437,820 99,743
34,873,315 - - 27,419,661
5,199,039 - 557,910 2,651,034
660,000 Payables1,979,900 Other short-term liabilities
42,518,085 42,518,085
Note:* Total assets and liabilities quoted in coverted standardized balance sheets do not necessarily equal those in contemporary balance sheets. This is because they have been adjusted to reflect shareholder capital that has either not been placed, or not yet been called.
Voorschott. in rek-crt. tegen effecten en beleeningen op effecten
Saldo's r.ct en dep.Id. v. rek. v. derdenAccepten en traites
Total assets Total liabilities
Id. tegen goed., hyp. of borgst.DividendOnverdeeld
Saldo's rek.-crt.Gebouw en safes
Meubilair
Short-term debt Bonds and mortgages
Aand. in portef. KapitaalKassa Reserve
Wiss., coupons en spec. Personeelfonds
Short-term credits
Bankiers BankiersEffecten
Effect in beleening gegevenFonds af te leveren
Panel A: Contemporary categories
Panel B: Converted standardized categories
Total assets* Total liabilities*
Equity investment Provisions
Assets Fixed assets Equity capital
Long-term debt Reserves
Receivables DepositsCash Other long-term liabilities
Other non-cash
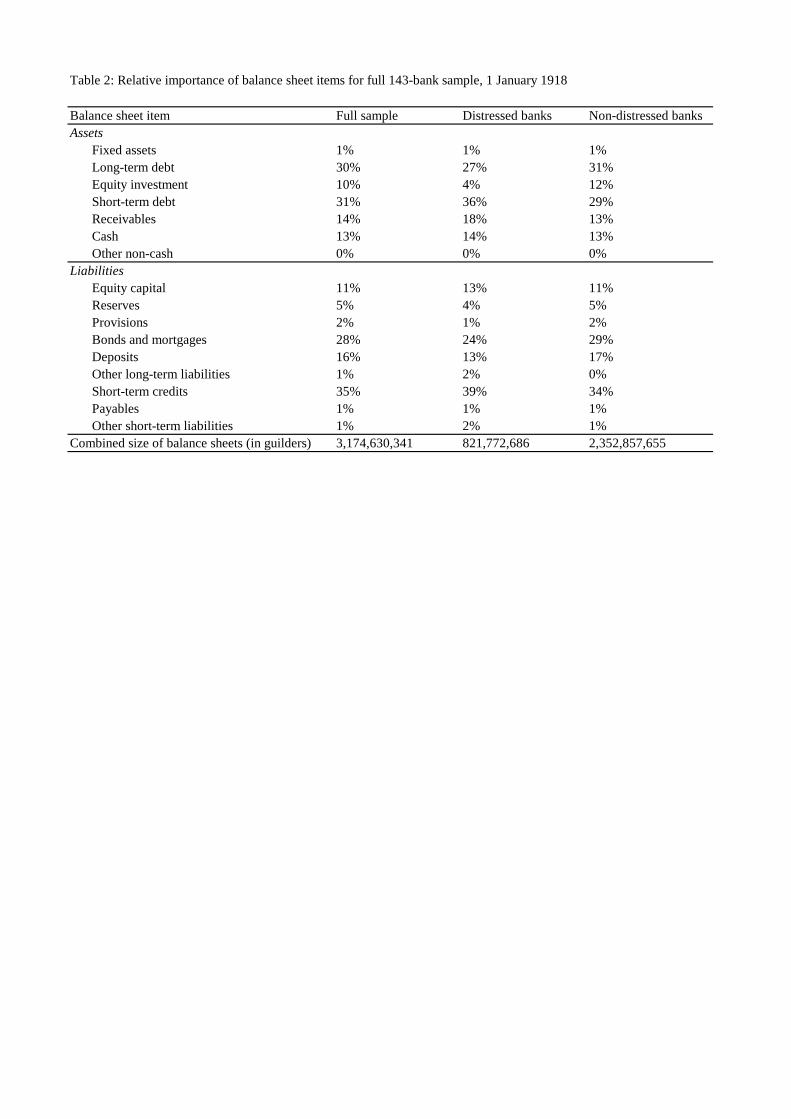
Full sample Distressed banks Non-distressed banksAssets
Fixed assets 1% 1% 1%Long-term debt 30% 27% 31%Equity investment 10% 4% 12%Short-term debt 31% 36% 29%Receivables 14% 18% 13%Cash 13% 14% 13%Other non-cash 0% 0% 0%
LiabilitiesEquity capital 11% 13% 11%Reserves 5% 4% 5%Provisions 2% 1% 2%Bonds and mortgages 28% 24% 29%Deposits 16% 13% 17%Other long-term liabilities 1% 2% 0%Short-term credits 35% 39% 34%Payables 1% 1% 1%Other short-term liabilities 1% 2% 1%
Combined size of balance sheets (in guilders) 3,174,630,341 821,772,686 2,352,857,655
Table 2: Relative importance of balance sheet items for full 143-bank sample, 1 January 1918
Balance sheet item
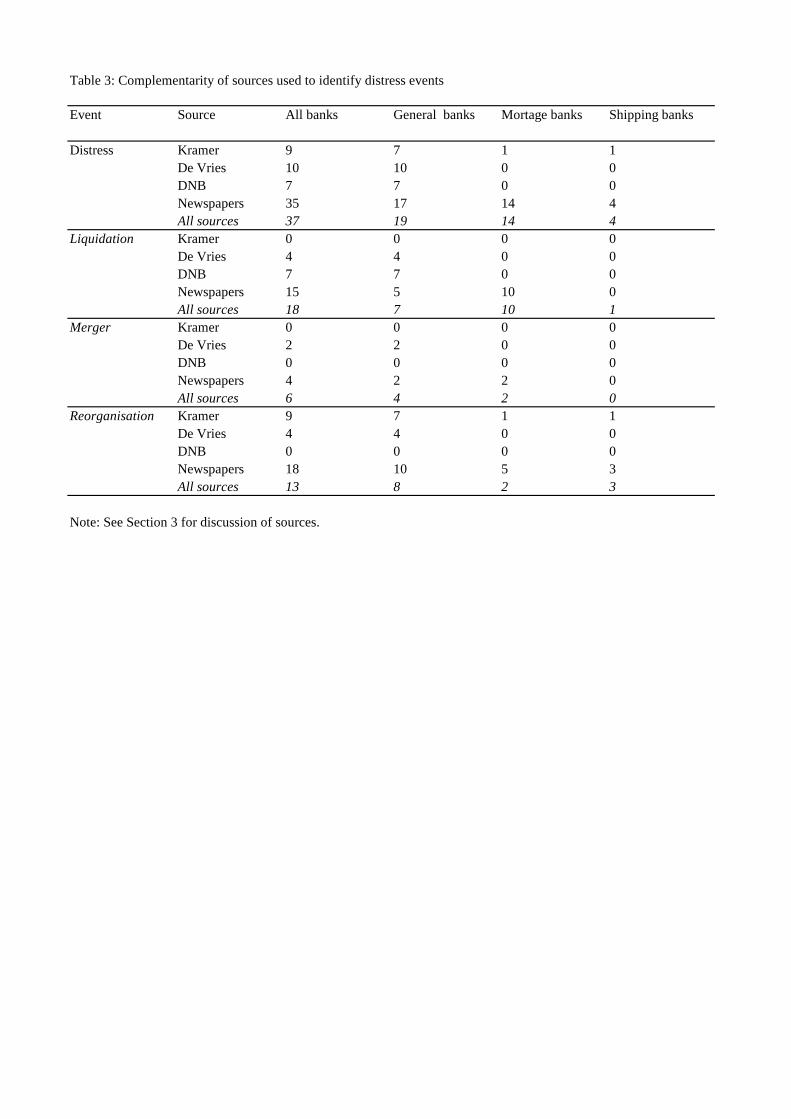
Event Source All banks General banks Mortage banks Shipping banks
Kramer 9 7 1 1De Vries 10 10 0 0DNB 7 7 0 0Newspapers 35 17 14 4All sources 37 19 14 4Kramer 0 0 0 0De Vries 4 4 0 0DNB 7 7 0 0Newspapers 15 5 10 0All sources 18 7 10 1Kramer 0 0 0 0De Vries 2 2 0 0DNB 0 0 0 0Newspapers 4 2 2 0All sources 6 4 2 0Kramer 9 7 1 1De Vries 4 4 0 0DNB 0 0 0 0Newspapers 18 10 5 3All sources 13 8 2 3
Note: See Section 3 for discussion of sources.
Reorganisation
Table 3: Complementarity of sources used to identify distress events
Distress
Liquidation
Merger
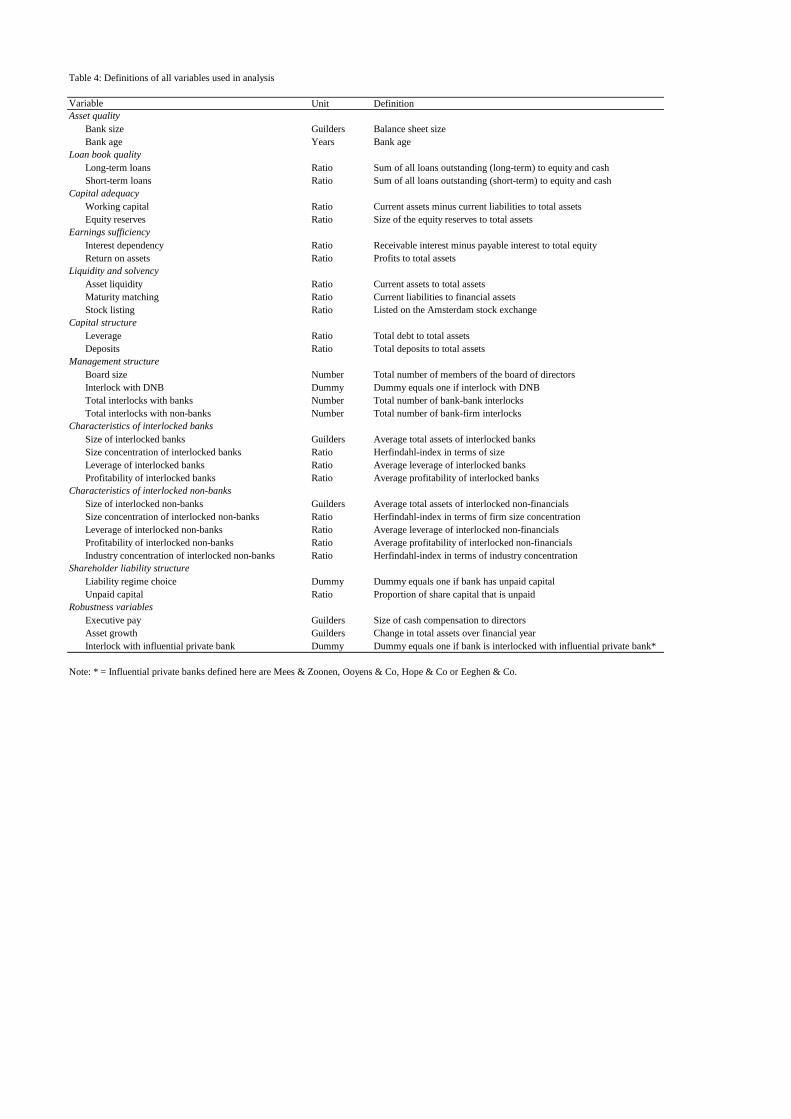
Unit Definition
Bank size Guilders Balance sheet sizeBank age Years Bank age
Long-term loans Ratio Sum of all loans outstanding (long-term) to equity and cashShort-term loans Ratio Sum of all loans outstanding (short-term) to equity and cash
Working capital Ratio Current assets minus current liabilities to total assetsEquity reserves Ratio Size of the equity reserves to total assets
Interest dependency Ratio Receivable interest minus payable interest to total equityReturn on assets Ratio Profits to total assets
Asset liquidity Ratio Current assets to total assetsMaturity matching Ratio Current liabilities to financial assetsStock listing Ratio Listed on the Amsterdam stock exchange
Leverage Ratio Total debt to total assetsDeposits Ratio Total deposits to total assets
Board size Number Total number of members of the board of directorsInterlock with DNB Dummy Dummy equals one if interlock with DNBTotal interlocks with banks Number Total number of bank-bank interlocksTotal interlocks with non-banks Number Total number of bank-firm interlocks
Size of interlocked banks Guilders Average total assets of interlocked banksSize concentration of interlocked banks Ratio Herfindahl-index in terms of sizeLeverage of interlocked banks Ratio Average leverage of interlocked banksProfitability of interlocked banks Ratio Average profitability of interlocked banks
Size of interlocked non-banks Guilders Average total assets of interlocked non-financialsSize concentration of interlocked non-banks Ratio Herfindahl-index in terms of firm size concentrationLeverage of interlocked non-banks Ratio Average leverage of interlocked non-financialsProfitability of interlocked non-banks Ratio Average profitability of interlocked non-financialsIndustry concentration of interlocked non-banks Ratio Herfindahl-index in terms of industry concentration
Liability regime choice Dummy Dummy equals one if bank has unpaid capitalUnpaid capital Ratio Proportion of share capital that is unpaid
Executive pay Guilders Size of cash compensation to directorsAsset growth Guilders Change in total assets over financial yearInterlock with influential private bank Dummy Dummy equals one if bank is interlocked with influential private bank*
Note: * = Influential private banks defined here are Mees & Zoonen, Ooyens & Co, Hope & Co or Eeghen & Co.
Table 4: Definitions of all variables used in analysis
Shareholder liability structure
Robustness variables
VariableAsset quality
Loan book quality
Capital adequacy
Earnings sufficiency
Liquidity and solvency
Capital structure
Management structure
Characteristics of interlocked banks
Characteristics of interlocked non-banks
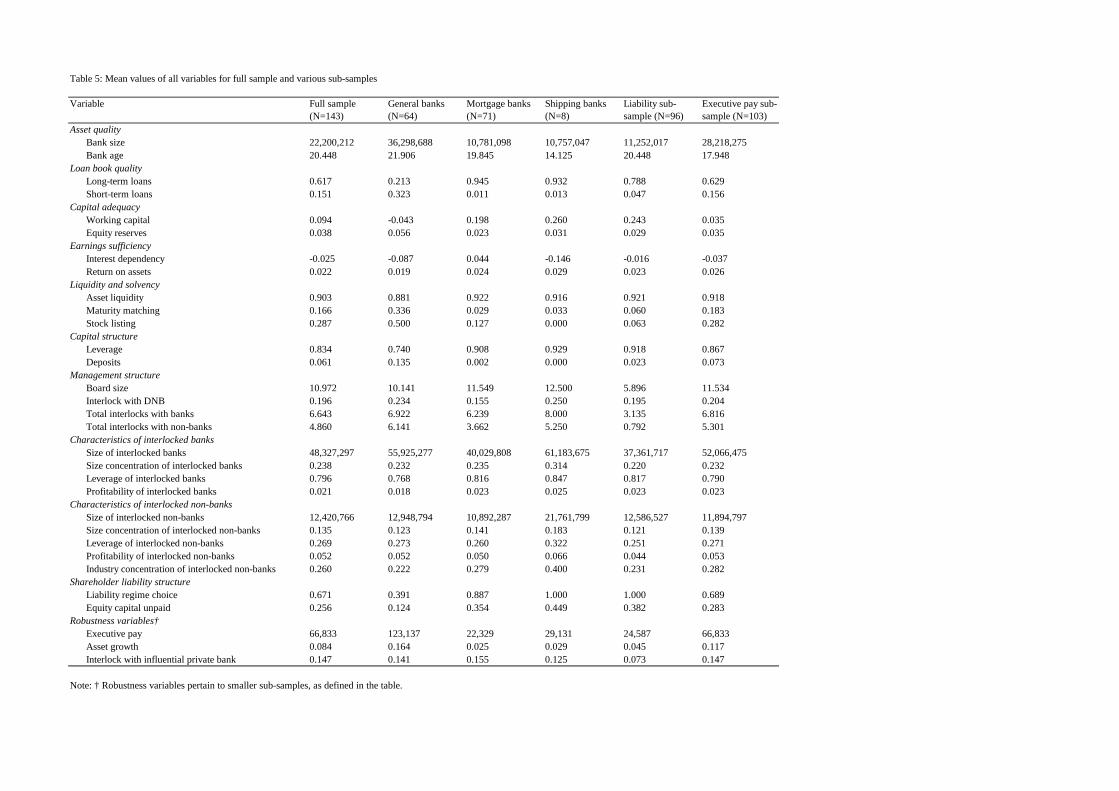
Full sample (N=143)
General banks (N=64)
Mortgage banks (N=71)
Shipping banks (N=8)
Liability sub-sample (N=96)
Executive pay sub-sample (N=103)
Asset qualityBank size 22,200,212 36,298,688 10,781,098 10,757,047 11,252,017 28,218,275Bank age 20.448 21.906 19.845 14.125 20.448 17.948
Loan book qualityLong-term loans 0.617 0.213 0.945 0.932 0.788 0.629Short-term loans 0.151 0.323 0.011 0.013 0.047 0.156
Capital adequacyWorking capital 0.094 -0.043 0.198 0.260 0.243 0.035Equity reserves 0.038 0.056 0.023 0.031 0.029 0.035
Earnings sufficiencyInterest dependency -0.025 -0.087 0.044 -0.146 -0.016 -0.037Return on assets 0.022 0.019 0.024 0.029 0.023 0.026
Liquidity and solvencyAsset liquidity 0.903 0.881 0.922 0.916 0.921 0.918Maturity matching 0.166 0.336 0.029 0.033 0.060 0.183Stock listing 0.287 0.500 0.127 0.000 0.063 0.282
Capital structureLeverage 0.834 0.740 0.908 0.929 0.918 0.867Deposits 0.061 0.135 0.002 0.000 0.023 0.073
Management structureBoard size 10.972 10.141 11.549 12.500 5.896 11.534Interlock with DNB 0.196 0.234 0.155 0.250 0.195 0.204Total interlocks with banks 6.643 6.922 6.239 8.000 3.135 6.816Total interlocks with non-banks 4.860 6.141 3.662 5.250 0.792 5.301
Characteristics of interlocked banksSize of interlocked banks 48,327,297 55,925,277 40,029,808 61,183,675 37,361,717 52,066,475Size concentration of interlocked banks 0.238 0.232 0.235 0.314 0.220 0.232Leverage of interlocked banks 0.796 0.768 0.816 0.847 0.817 0.790Profitability of interlocked banks 0.021 0.018 0.023 0.025 0.023 0.023
Characteristics of interlocked non-banksSize of interlocked non-banks 12,420,766 12,948,794 10,892,287 21,761,799 12,586,527 11,894,797Size concentration of interlocked non-banks 0.135 0.123 0.141 0.183 0.121 0.139Leverage of interlocked non-banks 0.269 0.273 0.260 0.322 0.251 0.271Profitability of interlocked non-banks 0.052 0.052 0.050 0.066 0.044 0.053Industry concentration of interlocked non-banks 0.260 0.222 0.279 0.400 0.231 0.282
Shareholder liability structureLiability regime choice 0.671 0.391 0.887 1.000 1.000 0.689Equity capital unpaid 0.256 0.124 0.354 0.449 0.382 0.283
Robustness variables†Executive pay 66,833 123,137 22,329 29,131 24,587 66,833Asset growth 0.084 0.164 0.025 0.029 0.045 0.117Interlock with influential private bank 0.147 0.141 0.155 0.125 0.073 0.147
Variable
Note: † Robustness variables pertain to smaller sub-samples, as defined in the table.
Table 5: Mean values of all variables for full sample and various sub-samples
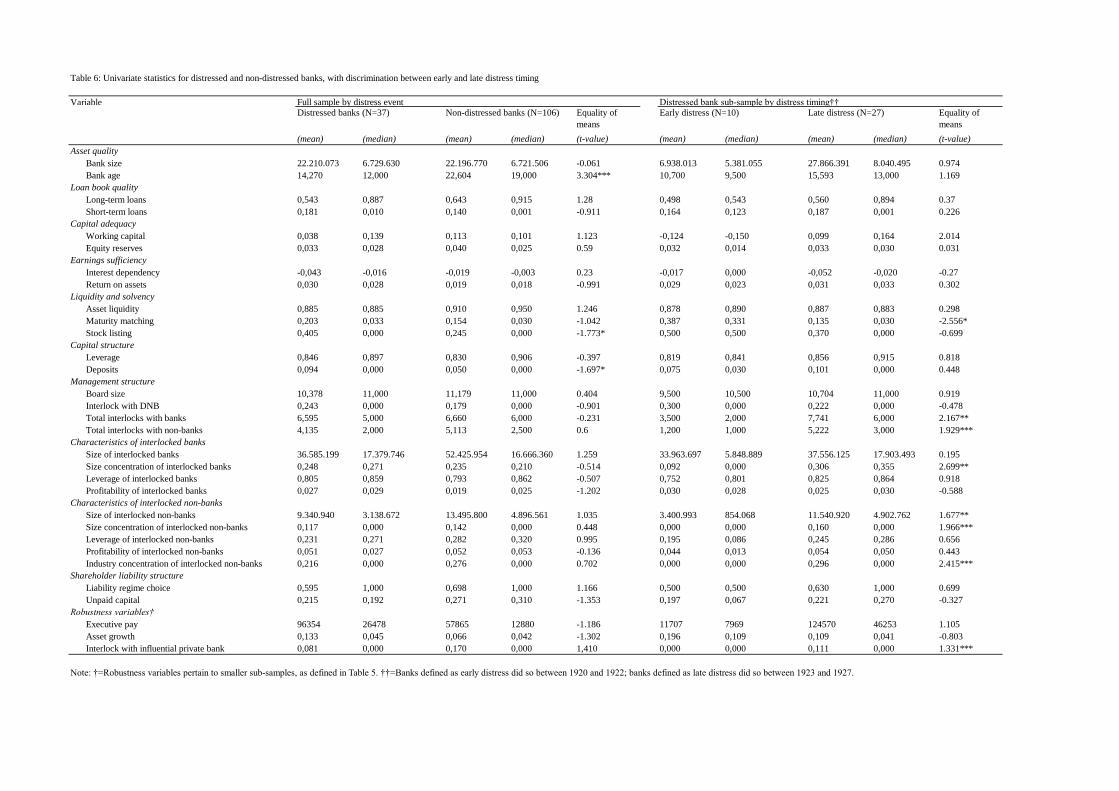
VariableEquality of
means
Equality of
means
(mean) (median) (mean) (median) (t-value) (mean) (median) (mean) (median) (t-value)
Asset quality
Bank size 22.210.073 6.729.630 22.196.770 6.721.506 -0.061 6.938.013 5.381.055 27.866.391 8.040.495 0.974
Bank age 14,270 12,000 22,604 19,000 3.304*** 10,700 9,500 15,593 13,000 1.169
Loan book quality
Long-term loans 0,543 0,887 0,643 0,915 1.28 0,498 0,543 0,560 0,894 0.37
Short-term loans 0,181 0,010 0,140 0,001 -0.911 0,164 0,123 0,187 0,001 0.226
Capital adequacy
Working capital 0,038 0,139 0,113 0,101 1.123 -0,124 -0,150 0,099 0,164 2.014
Equity reserves 0,033 0,028 0,040 0,025 0.59 0,032 0,014 0,033 0,030 0.031
Earnings sufficiency
Interest dependency -0,043 -0,016 -0,019 -0,003 0.23 -0,017 0,000 -0,052 -0,020 -0.27
Return on assets 0,030 0,028 0,019 0,018 -0.991 0,029 0,023 0,031 0,033 0.302
Liquidity and solvency
Asset liquidity 0,885 0,885 0,910 0,950 1.246 0,878 0,890 0,887 0,883 0.298
Maturity matching 0,203 0,033 0,154 0,030 -1.042 0,387 0,331 0,135 0,030 -2.556*
Stock listing 0,405 0,000 0,245 0,000 -1.773* 0,500 0,500 0,370 0,000 -0.699
Capital structure
Leverage 0,846 0,897 0,830 0,906 -0.397 0,819 0,841 0,856 0,915 0.818
Deposits 0,094 0,000 0,050 0,000 -1.697* 0,075 0,030 0,101 0,000 0.448
Management structure
Board size 10,378 11,000 11,179 11,000 0.404 9,500 10,500 10,704 11,000 0.919
Interlock with DNB 0,243 0,000 0,179 0,000 -0.901 0,300 0,000 0,222 0,000 -0.478
Total interlocks with banks 6,595 5,000 6,660 6,000 -0.231 3,500 2,000 7,741 6,000 2.167**
Total interlocks with non-banks 4,135 2,000 5,113 2,500 0.6 1,200 1,000 5,222 3,000 1.929***
Characteristics of interlocked banks
Size of interlocked banks 36.585.199 17.379.746 52.425.954 16.666.360 1.259 33.963.697 5.848.889 37.556.125 17.903.493 0.195
Size concentration of interlocked banks 0,248 0,271 0,235 0,210 -0.514 0,092 0,000 0,306 0,355 2.699**
Leverage of interlocked banks 0,805 0,859 0,793 0,862 -0.507 0,752 0,801 0,825 0,864 0.918
Profitability of interlocked banks 0,027 0,029 0,019 0,025 -1.202 0,030 0,028 0,025 0,030 -0.588
Characteristics of interlocked non-banks
Size of interlocked non-banks 9.340.940 3.138.672 13.495.800 4.896.561 1.035 3.400.993 854.068 11.540.920 4.902.762 1.677**
Size concentration of interlocked non-banks 0,117 0,000 0,142 0,000 0.448 0,000 0,000 0,160 0,000 1.966***
Leverage of interlocked non-banks 0,231 0,271 0,282 0,320 0.995 0,195 0,086 0,245 0,286 0.656
Profitability of interlocked non-banks 0,051 0,027 0,052 0,053 -0.136 0,044 0,013 0,054 0,050 0.443
Industry concentration of interlocked non-banks 0,216 0,000 0,276 0,000 0.702 0,000 0,000 0,296 0,000 2.415***
Shareholder liability structure
Liability regime choice 0,595 1,000 0,698 1,000 1.166 0,500 0,500 0,630 1,000 0.699
Unpaid capital 0,215 0,192 0,271 0,310 -1.353 0,197 0,067 0,221 0,270 -0.327
Robustness variables†
Executive pay 96354 26478 57865 12880 -1.186 11707 7969 124570 46253 1.105
Asset growth 0,133 0,045 0,066 0,042 -1.302 0,196 0,109 0,109 0,041 -0.803
Interlock with influential private bank 0,081 0,000 0,170 0,000 1,410 0,000 0,000 0,111 0,000 1.331***
Table 6: Univariate statistics for distressed and non-distressed banks, with discrimination between early and late distress timing
Note: †=Robustness variables pertain to smaller sub-samples, as defined in Table 5. ††=Banks defined as early distress did so between 1920 and 1922; banks defined as late distress did so between 1923 and 1927.
Full sample by distress event Distressed bank sub-sample by distress timing††
Late distress (N=27)Early distress (N=10)Distressed banks (N=37) Non-distressed banks (N=106)
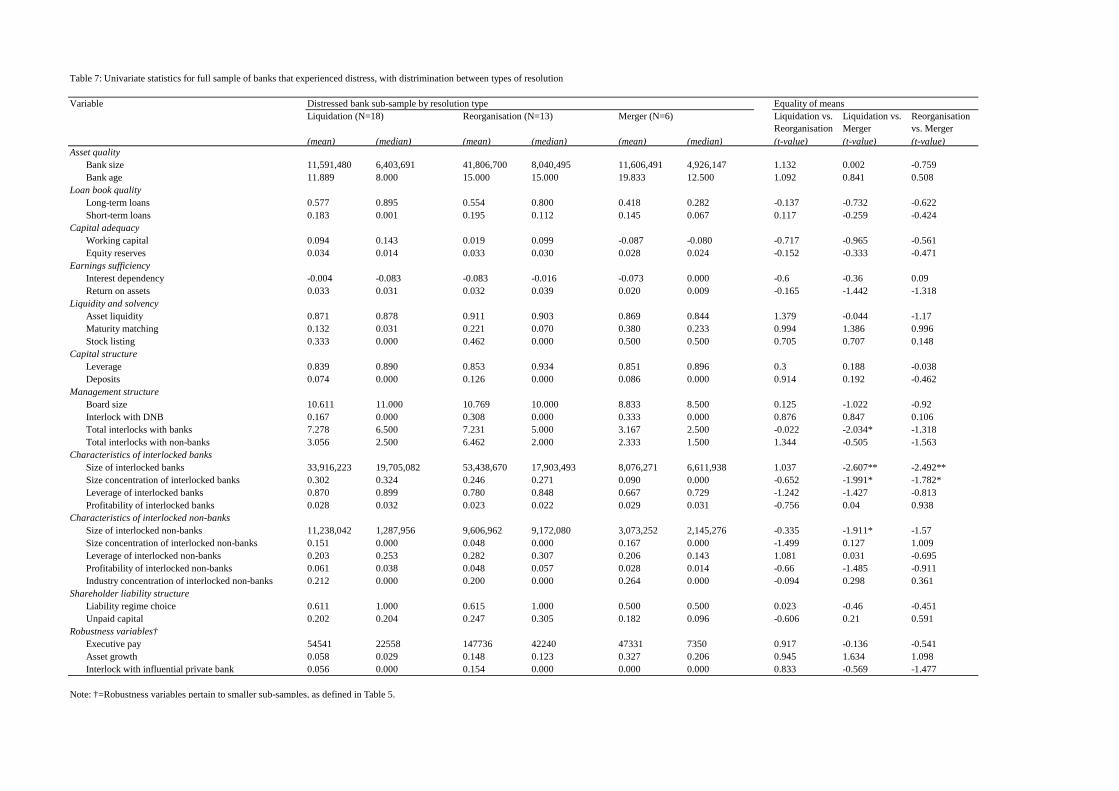
VariableLiquidation vs. Reorganisation
Liquidation vs. Merger
Reorganisation vs. Merger
(mean) (median) (mean) (median) (mean) (median) (t-value) (t-value) (t-value)Asset quality
Bank size 11,591,480 6,403,691 41,806,700 8,040,495 11,606,491 4,926,147 1.132 0.002 -0.759Bank age 11.889 8.000 15.000 15.000 19.833 12.500 1.092 0.841 0.508
Loan book qualityLong-term loans 0.577 0.895 0.554 0.800 0.418 0.282 -0.137 -0.732 -0.622Short-term loans 0.183 0.001 0.195 0.112 0.145 0.067 0.117 -0.259 -0.424
Capital adequacyWorking capital 0.094 0.143 0.019 0.099 -0.087 -0.080 -0.717 -0.965 -0.561Equity reserves 0.034 0.014 0.033 0.030 0.028 0.024 -0.152 -0.333 -0.471
Earnings sufficiencyInterest dependency -0.004 -0.083 -0.083 -0.016 -0.073 0.000 -0.6 -0.36 0.09Return on assets 0.033 0.031 0.032 0.039 0.020 0.009 -0.165 -1.442 -1.318
Liquidity and solvencyAsset liquidity 0.871 0.878 0.911 0.903 0.869 0.844 1.379 -0.044 -1.17Maturity matching 0.132 0.031 0.221 0.070 0.380 0.233 0.994 1.386 0.996Stock listing 0.333 0.000 0.462 0.000 0.500 0.500 0.705 0.707 0.148
Capital structureLeverage 0.839 0.890 0.853 0.934 0.851 0.896 0.3 0.188 -0.038Deposits 0.074 0.000 0.126 0.000 0.086 0.000 0.914 0.192 -0.462
Management structureBoard size 10.611 11.000 10.769 10.000 8.833 8.500 0.125 -1.022 -0.92Interlock with DNB 0.167 0.000 0.308 0.000 0.333 0.000 0.876 0.847 0.106Total interlocks with banks 7.278 6.500 7.231 5.000 3.167 2.500 -0.022 -2.034* -1.318Total interlocks with non-banks 3.056 2.500 6.462 2.000 2.333 1.500 1.344 -0.505 -1.563
Characteristics of interlocked banksSize of interlocked banks 33,916,223 19,705,082 53,438,670 17,903,493 8,076,271 6,611,938 1.037 -2.607** -2.492**Size concentration of interlocked banks 0.302 0.324 0.246 0.271 0.090 0.000 -0.652 -1.991* -1.782*Leverage of interlocked banks 0.870 0.899 0.780 0.848 0.667 0.729 -1.242 -1.427 -0.813Profitability of interlocked banks 0.028 0.032 0.023 0.022 0.029 0.031 -0.756 0.04 0.938
Characteristics of interlocked non-banksSize of interlocked non-banks 11,238,042 1,287,956 9,606,962 9,172,080 3,073,252 2,145,276 -0.335 -1.911* -1.57Size concentration of interlocked non-banks 0.151 0.000 0.048 0.000 0.167 0.000 -1.499 0.127 1.009Leverage of interlocked non-banks 0.203 0.253 0.282 0.307 0.206 0.143 1.081 0.031 -0.695Profitability of interlocked non-banks 0.061 0.038 0.048 0.057 0.028 0.014 -0.66 -1.485 -0.911Industry concentration of interlocked non-banks 0.212 0.000 0.200 0.000 0.264 0.000 -0.094 0.298 0.361
Shareholder liability structureLiability regime choice 0.611 1.000 0.615 1.000 0.500 0.500 0.023 -0.46 -0.451Unpaid capital 0.202 0.204 0.247 0.305 0.182 0.096 -0.606 0.21 0.591
Robustness variables†Executive pay 54541 22558 147736 42240 47331 7350 0.917 -0.136 -0.541Asset growth 0.058 0.029 0.148 0.123 0.327 0.206 0.945 1.634 1.098Interlock with influential private bank 0.056 0.000 0.154 0.000 0.000 0.000 0.833 -0.569 -1.477
Note: †=Robustness variables pertain to smaller sub-samples, as defined in Table 5.
Table 7: Univariate statistics for full sample of banks that experienced distress, with distrimination between types of resolution
Equality of meansLiquidation (N=18) Reorganisation (N=13) Merger (N=6)Distressed bank sub-sample by resolution type
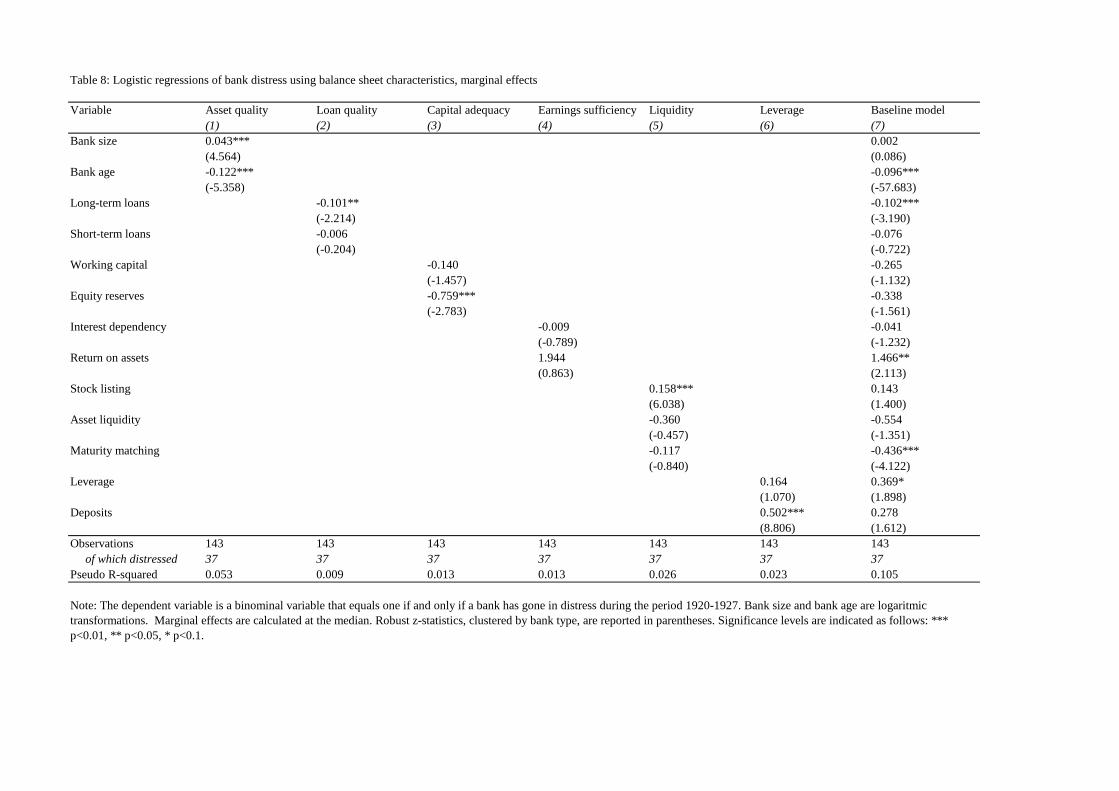
Variable Asset quality Loan quality Capital adequacy Earnings sufficiency Liquidity Leverage Baseline model(1) (2) (3) (4) (5) (6) (7)
Bank size 0.043*** 0.002(4.564) (0.086)
Bank age -0.122*** -0.096***(-5.358) (-57.683)
Long-term loans -0.101** -0.102***(-2.214) (-3.190)
Short-term loans -0.006 -0.076(-0.204) (-0.722)
Working capital -0.140 -0.265(-1.457) (-1.132)
Equity reserves -0.759*** -0.338(-2.783) (-1.561)
Interest dependency -0.009 -0.041(-0.789) (-1.232)
Return on assets 1.944 1.466**(0.863) (2.113)
Stock listing 0.158*** 0.143(6.038) (1.400)
Asset liquidity -0.360 -0.554(-0.457) (-1.351)
Maturity matching -0.117 -0.436***(-0.840) (-4.122)
Leverage 0.164 0.369*(1.070) (1.898)
Deposits 0.502*** 0.278(8.806) (1.612)
Observations 143 143 143 143 143 143 143 of which distressed 37 37 37 37 37 37 37Pseudo R-squared 0.053 0.009 0.013 0.013 0.026 0.023 0.105
Table 8: Logistic regressions of bank distress using balance sheet characteristics, marginal effects
Note: The dependent variable is a binominal variable that equals one if and only if a bank has gone in distress during the period 1920-1927. Bank size and bank age are logaritmic transformations. Marginal effects are calculated at the median. Robust z-statistics, clustered by bank type, are reported in parentheses. Significance levels are indicated as follows: *** p<0.01, ** p<0.05, * p<0.1.
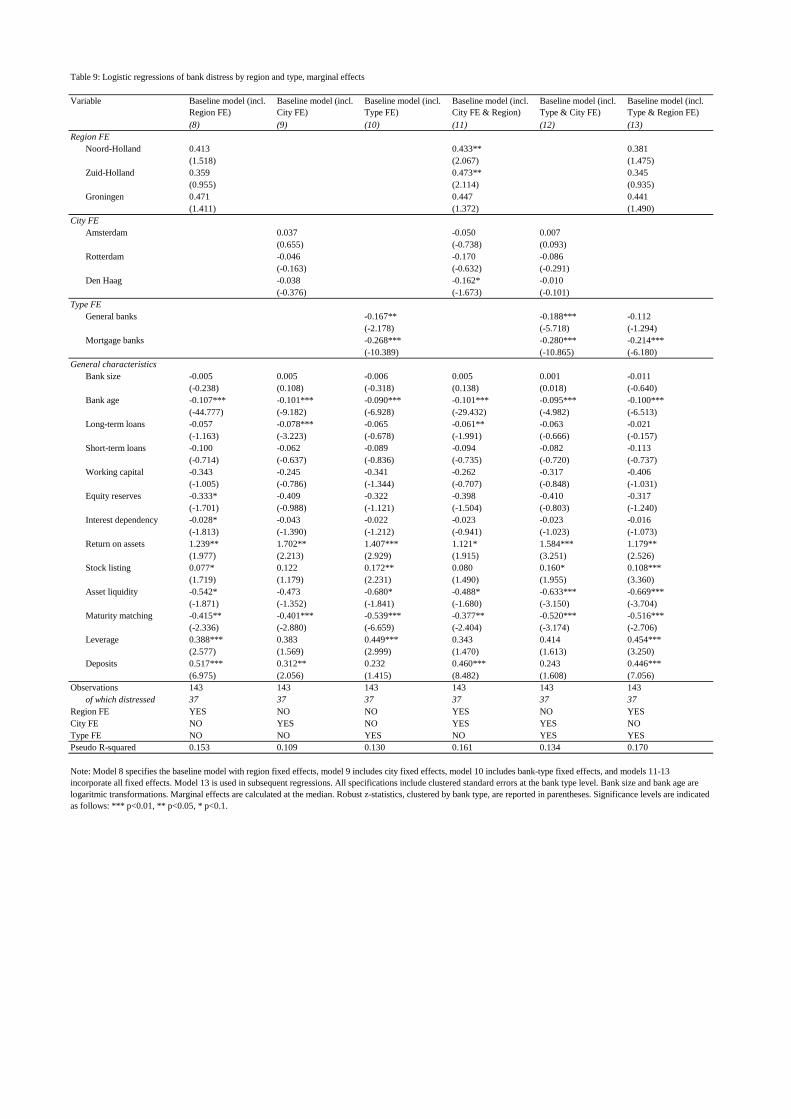
Baseline model (incl.
Region FE)
Baseline model (incl.
City FE)
Baseline model (incl.
Type FE)
Baseline model (incl.
City FE & Region)
Baseline model (incl.
Type & City FE)
Baseline model (incl.
Type & Region FE)
(8) (9) (10) (11) (12) (13)
Region FE
Noord-Holland 0.413 0.433** 0.381
(1.518) (2.067) (1.475)
Zuid-Holland 0.359 0.473** 0.345
(0.955) (2.114) (0.935)
Groningen 0.471 0.447 0.441
(1.411) (1.372) (1.490)
City FE
Amsterdam 0.037 -0.050 0.007
(0.655) (-0.738) (0.093)
Rotterdam -0.046 -0.170 -0.086
(-0.163) (-0.632) (-0.291)
Den Haag -0.038 -0.162* -0.010
(-0.376) (-1.673) (-0.101)
Type FE
General banks -0.167** -0.188*** -0.112
(-2.178) (-5.718) (-1.294)
Mortgage banks -0.268*** -0.280*** -0.214***
(-10.389) (-10.865) (-6.180)
Bank size -0.005 0.005 -0.006 0.005 0.001 -0.011
(-0.238) (0.108) (-0.318) (0.138) (0.018) (-0.640)
Bank age -0.107*** -0.101*** -0.090*** -0.101*** -0.095*** -0.100***
(-44.777) (-9.182) (-6.928) (-29.432) (-4.982) (-6.513)
Long-term loans -0.057 -0.078*** -0.065 -0.061** -0.063 -0.021
(-1.163) (-3.223) (-0.678) (-1.991) (-0.666) (-0.157)
Short-term loans -0.100 -0.062 -0.089 -0.094 -0.082 -0.113
(-0.714) (-0.637) (-0.836) (-0.735) (-0.720) (-0.737)
Working capital -0.343 -0.245 -0.341 -0.262 -0.317 -0.406
(-1.005) (-0.786) (-1.344) (-0.707) (-0.848) (-1.031)
Equity reserves -0.333* -0.409 -0.322 -0.398 -0.410 -0.317
(-1.701) (-0.988) (-1.121) (-1.504) (-0.803) (-1.240)
Interest dependency -0.028* -0.043 -0.022 -0.023 -0.023 -0.016
(-1.813) (-1.390) (-1.212) (-0.941) (-1.023) (-1.073)
Return on assets 1.239** 1.702** 1.407*** 1.121* 1.584*** 1.179**
(1.977) (2.213) (2.929) (1.915) (3.251) (2.526)
Stock listing 0.077* 0.122 0.172** 0.080 0.160* 0.108***
(1.719) (1.179) (2.231) (1.490) (1.955) (3.360)
Asset liquidity -0.542* -0.473 -0.680* -0.488* -0.633*** -0.669***
(-1.871) (-1.352) (-1.841) (-1.680) (-3.150) (-3.704)
Maturity matching -0.415** -0.401*** -0.539*** -0.377** -0.520*** -0.516***
(-2.336) (-2.880) (-6.659) (-2.404) (-3.174) (-2.706)
Leverage 0.388*** 0.383 0.449*** 0.343 0.414 0.454***
(2.577) (1.569) (2.999) (1.470) (1.613) (3.250)
Deposits 0.517*** 0.312** 0.232 0.460*** 0.243 0.446***
(6.975) (2.056) (1.415) (8.482) (1.608) (7.056)
Observations 143 143 143 143 143 143
of which distressed 37 37 37 37 37 37
Region FE YES NO NO YES NO YES
City FE NO YES NO YES YES NO
Type FE NO NO YES NO YES YES
Pseudo R-squared 0.153 0.109 0.130 0.161 0.134 0.170
Note: Model 8 specifies the baseline model with region fixed effects, model 9 includes city fixed effects, model 10 includes bank-type fixed effects, and models 11-13
incorporate all fixed effects. Model 13 is used in subsequent regressions. All specifications include clustered standard errors at the bank type level. Bank size and bank age are
logaritmic transformations. Marginal effects are calculated at the median. Robust z-statistics, clustered by bank type, are reported in parentheses. Significance levels are indicated
as follows: *** p<0.01, ** p<0.05, * p<0.1.
General characteristics
Table 9: Logistic regressions of bank distress by region and type, marginal effects
Variable
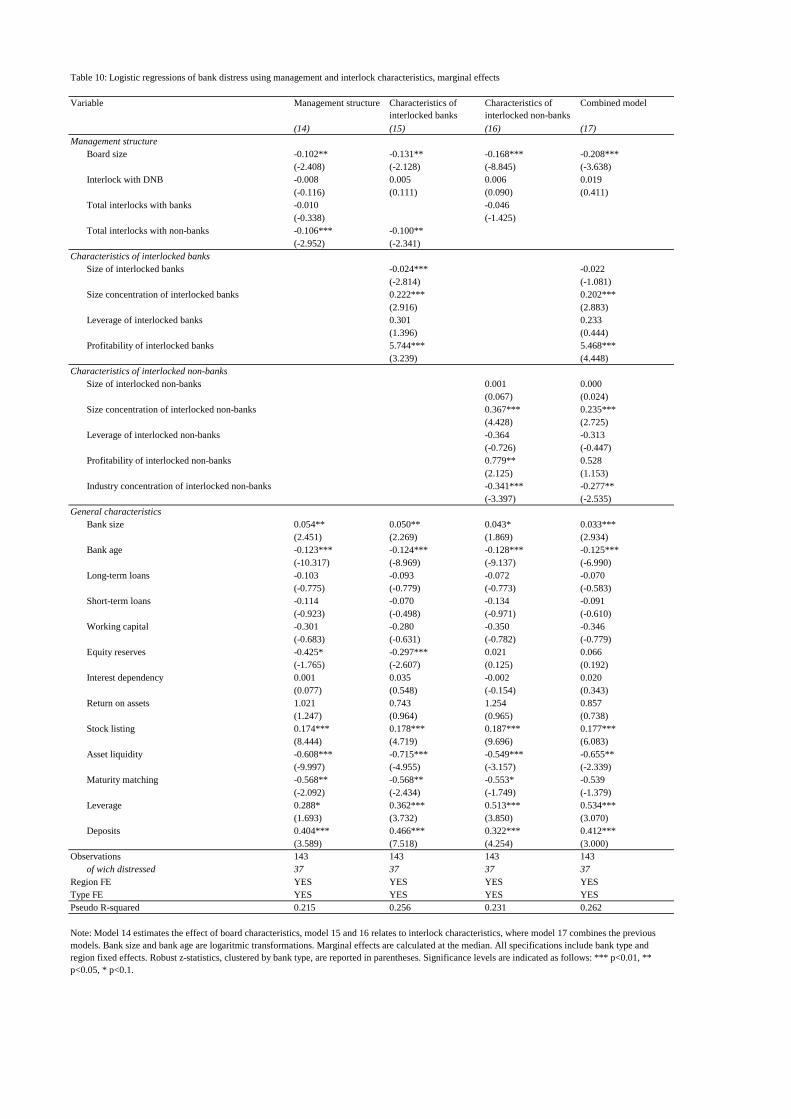
Variable Management structure Characteristics of
interlocked banks
Characteristics of
interlocked non-banks
Combined model
(14) (15) (16) (17)
Management structure
Board size -0.102** -0.131** -0.168*** -0.208***
(-2.408) (-2.128) (-8.845) (-3.638)
Interlock with DNB -0.008 0.005 0.006 0.019
(-0.116) (0.111) (0.090) (0.411)
Total interlocks with banks -0.010 -0.046
(-0.338) (-1.425)
Total interlocks with non-banks -0.106*** -0.100**
(-2.952) (-2.341)
Characteristics of interlocked banks
Size of interlocked banks -0.024*** -0.022
(-2.814) (-1.081)
Size concentration of interlocked banks 0.222*** 0.202***
(2.916) (2.883)
Leverage of interlocked banks 0.301 0.233
(1.396) (0.444)
Profitability of interlocked banks 5.744*** 5.468***
(3.239) (4.448)
Characteristics of interlocked non-banks
Size of interlocked non-banks 0.001 0.000
(0.067) (0.024)
Size concentration of interlocked non-banks 0.367*** 0.235***
(4.428) (2.725)
Leverage of interlocked non-banks -0.364 -0.313
(-0.726) (-0.447)
Profitability of interlocked non-banks 0.779** 0.528
(2.125) (1.153)
Industry concentration of interlocked non-banks -0.341*** -0.277**
(-3.397) (-2.535)
Bank size 0.054** 0.050** 0.043* 0.033***
(2.451) (2.269) (1.869) (2.934)
Bank age -0.123*** -0.124*** -0.128*** -0.125***
(-10.317) (-8.969) (-9.137) (-6.990)
Long-term loans -0.103 -0.093 -0.072 -0.070
(-0.775) (-0.779) (-0.773) (-0.583)
Short-term loans -0.114 -0.070 -0.134 -0.091
(-0.923) (-0.498) (-0.971) (-0.610)
Working capital -0.301 -0.280 -0.350 -0.346
(-0.683) (-0.631) (-0.782) (-0.779)
Equity reserves -0.425* -0.297*** 0.021 0.066
(-1.765) (-2.607) (0.125) (0.192)
Interest dependency 0.001 0.035 -0.002 0.020
(0.077) (0.548) (-0.154) (0.343)
Return on assets 1.021 0.743 1.254 0.857
(1.247) (0.964) (0.965) (0.738)
Stock listing 0.174*** 0.178*** 0.187*** 0.177***
(8.444) (4.719) (9.696) (6.083)
Asset liquidity -0.608*** -0.715*** -0.549*** -0.655**
(-9.997) (-4.955) (-3.157) (-2.339)
Maturity matching -0.568** -0.568** -0.553* -0.539
(-2.092) (-2.434) (-1.749) (-1.379)
Leverage 0.288* 0.362*** 0.513*** 0.534***
(1.693) (3.732) (3.850) (3.070)
Deposits 0.404*** 0.466*** 0.322*** 0.412***
(3.589) (7.518) (4.254) (3.000)
Observations 143 143 143 143
of wich distressed 37 37 37 37
Region FE YES YES YES YES
Type FE YES YES YES YES
Pseudo R-squared 0.215 0.256 0.231 0.262
Table 10: Logistic regressions of bank distress using management and interlock characteristics, marginal effects
Note: Model 14 estimates the effect of board characteristics, model 15 and 16 relates to interlock characteristics, where model 17 combines the previous
models. Bank size and bank age are logaritmic transformations. Marginal effects are calculated at the median. All specifications include bank type and
region fixed effects. Robust z-statistics, clustered by bank type, are reported in parentheses. Significance levels are indicated as follows: *** p<0.01, **
p<0.05, * p<0.1.
General characteristics
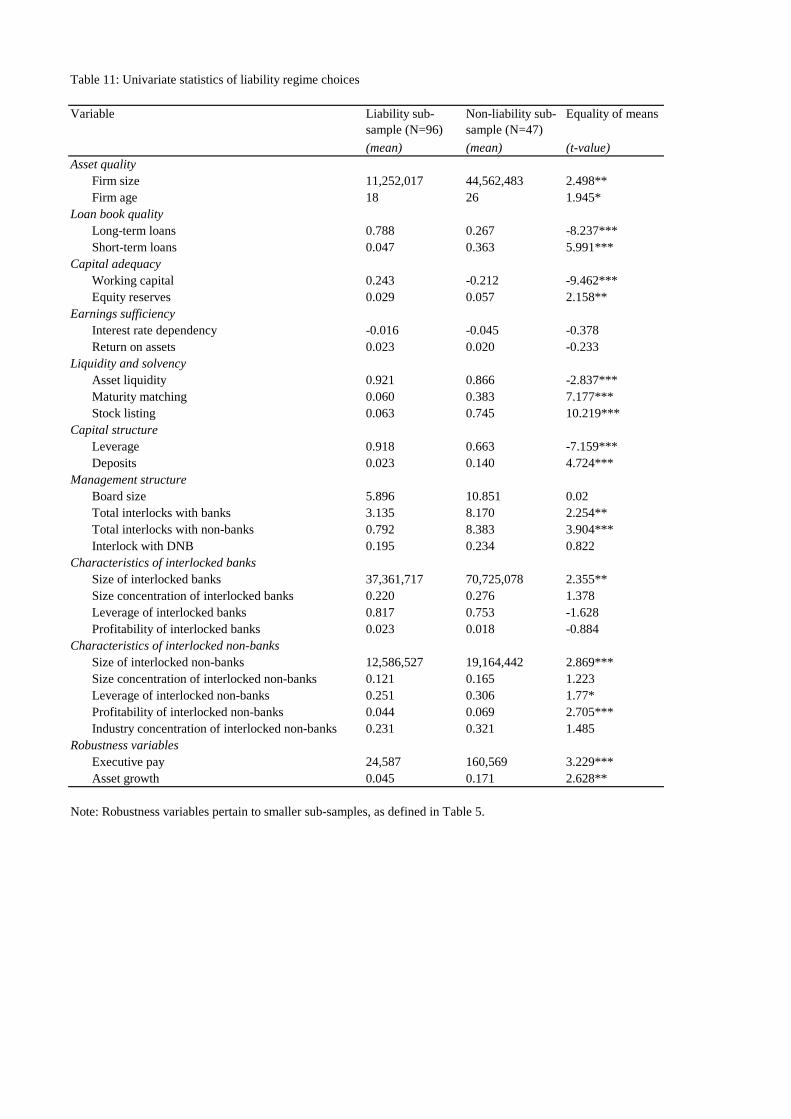
Variable Liability sub-sample (N=96)
Non-liability sub-sample (N=47)
(mean) (mean) (t-value)Asset quality
Firm size 11,252,017 44,562,483 2.498**Firm age 18 26 1.945*
Loan book qualityLong-term loans 0.788 0.267 -8.237***Short-term loans 0.047 0.363 5.991***
Capital adequacyWorking capital 0.243 -0.212 -9.462***Equity reserves 0.029 0.057 2.158**
Earnings sufficiencyInterest rate dependency -0.016 -0.045 -0.378Return on assets 0.023 0.020 -0.233
Liquidity and solvencyAsset liquidity 0.921 0.866 -2.837***Maturity matching 0.060 0.383 7.177***Stock listing 0.063 0.745 10.219***
Capital structureLeverage 0.918 0.663 -7.159***Deposits 0.023 0.140 4.724***
Management structureBoard size 5.896 10.851 0.02Total interlocks with banks 3.135 8.170 2.254**Total interlocks with non-banks 0.792 8.383 3.904***Interlock with DNB 0.195 0.234 0.822
Characteristics of interlocked banksSize of interlocked banks 37,361,717 70,725,078 2.355**Size concentration of interlocked banks 0.220 0.276 1.378Leverage of interlocked banks 0.817 0.753 -1.628Profitability of interlocked banks 0.023 0.018 -0.884
Characteristics of interlocked non-banksSize of interlocked non-banks 12,586,527 19,164,442 2.869***Size concentration of interlocked non-banks 0.121 0.165 1.223Leverage of interlocked non-banks 0.251 0.306 1.77*Profitability of interlocked non-banks 0.044 0.069 2.705***Industry concentration of interlocked non-banks 0.231 0.321 1.485
Robustness variablesExecutive pay 24,587 160,569 3.229***Asset growth 0.045 0.171 2.628**
Note: Robustness variables pertain to smaller sub-samples, as defined in Table 5.
Equality of means
Table 11: Univariate statistics of liability regime choices
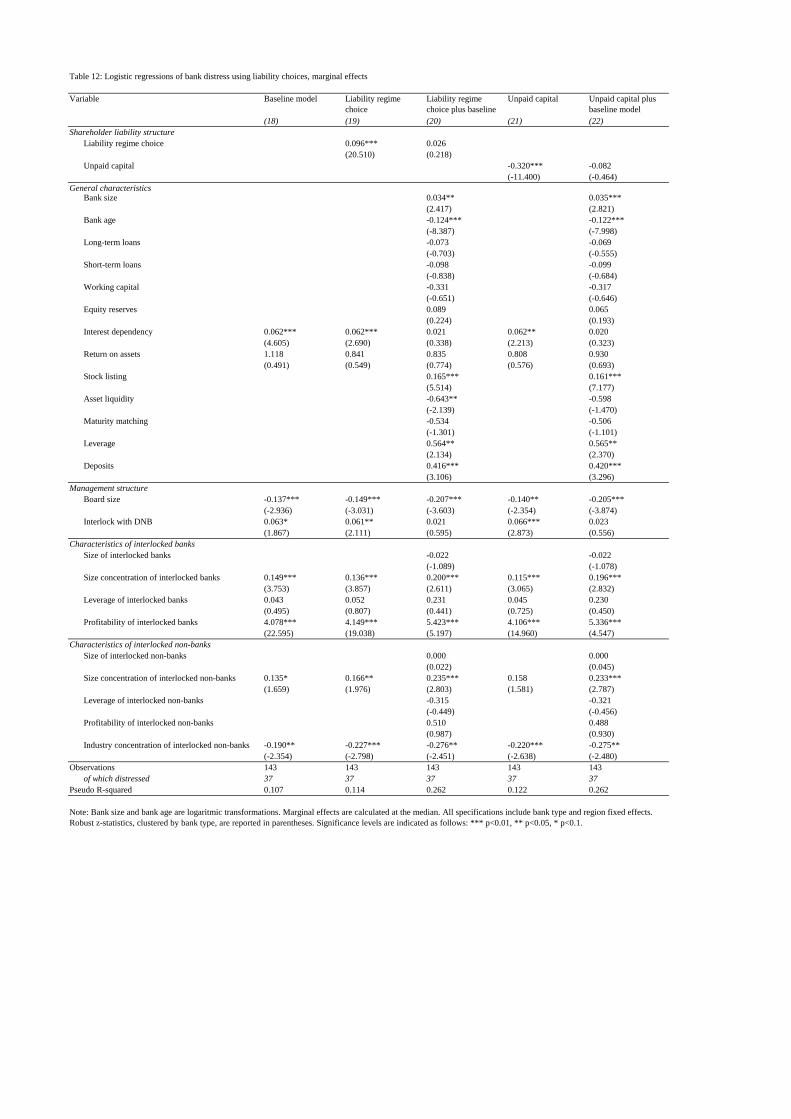
Variable Baseline model Liability regime choice
Liability regime choice plus baseline
Unpaid capital Unpaid capital plus baseline model
(18) (19) (20) (21) (22)Shareholder liability structure
Liability regime choice 0.096*** 0.026(20.510) (0.218)
Unpaid capital -0.320*** -0.082(-11.400) (-0.464)
Bank size 0.034** 0.035***(2.417) (2.821)
Bank age -0.124*** -0.122***(-8.387) (-7.998)
Long-term loans -0.073 -0.069(-0.703) (-0.555)
Short-term loans -0.098 -0.099(-0.838) (-0.684)
Working capital -0.331 -0.317(-0.651) (-0.646)
Equity reserves 0.089 0.065(0.224) (0.193)
Interest dependency 0.062*** 0.062*** 0.021 0.062** 0.020(4.605) (2.690) (0.338) (2.213) (0.323)
Return on assets 1.118 0.841 0.835 0.808 0.930(0.491) (0.549) (0.774) (0.576) (0.693)
Stock listing 0.165*** 0.161***(5.514) (7.177)
Asset liquidity -0.643** -0.598(-2.139) (-1.470)
Maturity matching -0.534 -0.506(-1.301) (-1.101)
Leverage 0.564** 0.565**(2.134) (2.370)
Deposits 0.416*** 0.420***(3.106) (3.296)
Management structureBoard size -0.137*** -0.149*** -0.207*** -0.140** -0.205***
(-2.936) (-3.031) (-3.603) (-2.354) (-3.874)Interlock with DNB 0.063* 0.061** 0.021 0.066*** 0.023
(1.867) (2.111) (0.595) (2.873) (0.556)Characteristics of interlocked banks
Size of interlocked banks -0.022 -0.022(-1.089) (-1.078)
Size concentration of interlocked banks 0.149*** 0.136*** 0.200*** 0.115*** 0.196***(3.753) (3.857) (2.611) (3.065) (2.832)
Leverage of interlocked banks 0.043 0.052 0.231 0.045 0.230(0.495) (0.807) (0.441) (0.725) (0.450)
Profitability of interlocked banks 4.078*** 4.149*** 5.423*** 4.106*** 5.336***(22.595) (19.038) (5.197) (14.960) (4.547)
Characteristics of interlocked non-banksSize of interlocked non-banks 0.000 0.000
(0.022) (0.045)Size concentration of interlocked non-banks 0.135* 0.166** 0.235*** 0.158 0.233***
(1.659) (1.976) (2.803) (1.581) (2.787)Leverage of interlocked non-banks -0.315 -0.321
(-0.449) (-0.456)Profitability of interlocked non-banks 0.510 0.488
(0.987) (0.930)Industry concentration of interlocked non-banks -0.190** -0.227*** -0.276** -0.220*** -0.275**
(-2.354) (-2.798) (-2.451) (-2.638) (-2.480)Observations 143 143 143 143 143
of which distressed 37 37 37 37 37Pseudo R-squared 0.107 0.114 0.262 0.122 0.262
Note: Bank size and bank age are logaritmic transformations. Marginal effects are calculated at the median. All specifications include bank type and region fixed effects. Robust z-statistics, clustered by bank type, are reported in parentheses. Significance levels are indicated as follows: *** p<0.01, ** p<0.05, * p<0.1.
General characteristics
Table 12: Logistic regressions of bank distress using liability choices, marginal effects
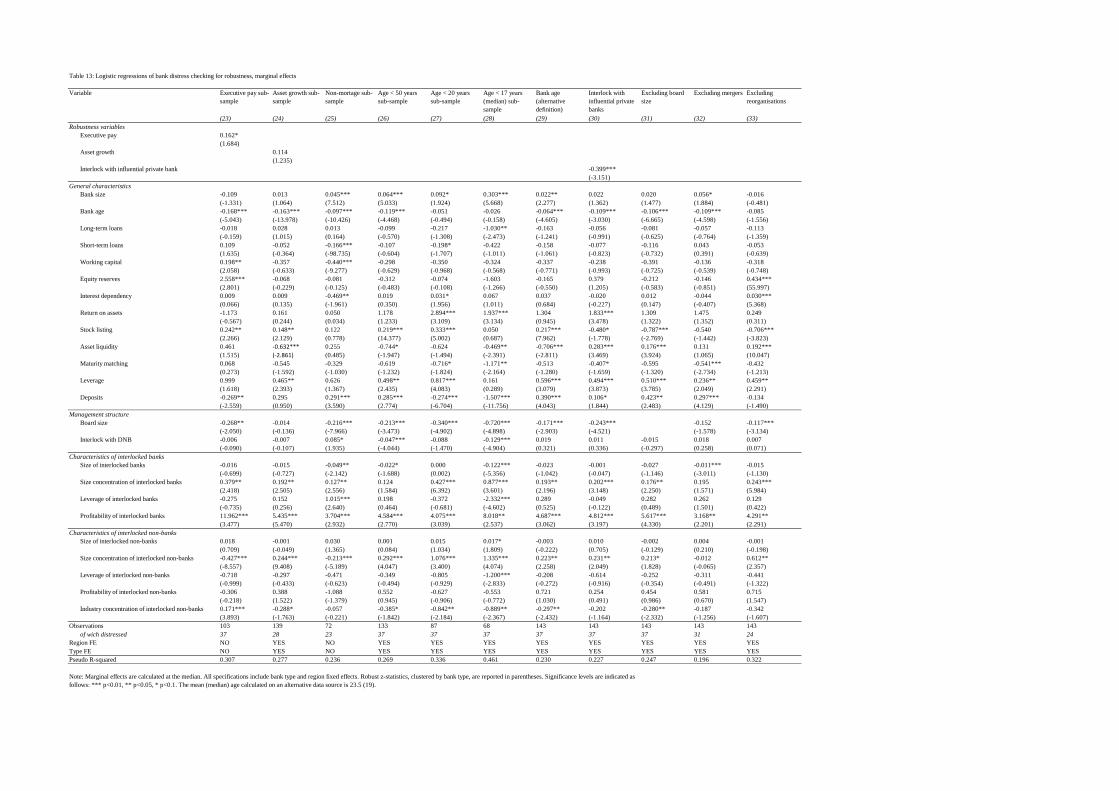
Variable Executive pay sub-sample
Asset growth sub-sample
Non-mortage sub-sample
Age < 50 years sub-sample
Age < 20 years sub-sample
Age < 17 years (median) sub- sample
Bank age (alternative definition)
Interlock with influential private banks
Excluding board size
Excluding mergers Excluding reorganisations
(23) (24) (25) (26) (27) (28) (29) (30) (31) (32) (33)Robustness variables
Executive pay 0.162*(1.684)
Asset growth 0.114(1.235)
Interlock with influential private bank -0.399***(-3.151)
Bank size -0.109 0.013 0.045*** 0.064*** 0.092* 0.303*** 0.022** 0.022 0.020 0.056* -0.016(-1.331) (1.064) (7.512) (5.033) (1.924) (5.668) (2.277) (1.362) (1.477) (1.884) (-0.481)
Bank age -0.168*** -0.163*** -0.097*** -0.119*** -0.051 -0.026 -0.064*** -0.109*** -0.106*** -0.109*** -0.085(-5.043) (-13.978) (-10.426) (-4.468) (-0.494) (-0.158) (-4.605) (-3.030) (-6.665) (-4.598) (-1.556)
Long-term loans -0.018 0.028 0.013 -0.099 -0.217 -1.030** -0.163 -0.056 -0.081 -0.057 -0.113(-0.159) (1.015) (0.164) (-0.570) (-1.308) (-2.473) (-1.241) (-0.991) (-0.625) (-0.764) (-1.359)
Short-term loans 0.109 -0.052 -0.166*** -0.107 -0.198* -0.422 -0.158 -0.077 -0.116 0.043 -0.053(1.635) (-0.364) (-98.735) (-0.604) (-1.707) (-1.011) (-1.061) (-0.823) (-0.732) (0.391) (-0.639)
Working capital 0.198** -0.357 -0.440*** -0.298 -0.350 -0.324 -0.337 -0.238 -0.391 -0.136 -0.318(2.058) (-0.633) (-9.277) (-0.629) (-0.968) (-0.568) (-0.771) (-0.993) (-0.725) (-0.539) (-0.748)
Equity reserves 2.558*** -0.068 -0.081 -0.312 -0.074 -1.603 -0.165 0.379 -0.212 -0.146 0.434***(2.801) (-0.229) (-0.125) (-0.483) (-0.108) (-1.266) (-0.550) (1.205) (-0.583) (-0.851) (55.997)
Interest dependency 0.009 0.009 -0.469** 0.019 0.031* 0.067 0.037 -0.020 0.012 -0.044 0.030***(0.066) (0.135) (-1.961) (0.350) (1.956) (1.011) (0.684) (-0.227) (0.147) (-0.407) (5.368)
Return on assets -1.173 0.161 0.050 1.178 2.894*** 1.937*** 1.304 1.833*** 1.309 1.475 0.249(-0.567) (0.244) (0.034) (1.233) (3.109) (3.134) (0.945) (3.478) (1.322) (1.352) (0.311)
Stock listing 0.242** 0.148** 0.122 0.219*** 0.333*** 0.050 0.217*** -0.480* -0.787*** -0.540 -0.706***(2.266) (2.129) (0.778) (14.377) (5.002) (0.687) (7.962) (-1.778) (-2.769) (-1.442) (-3.823)
Asset liquidity 0.461 -0.632*** 0.255 -0.744* -0.624 -0.469** -0.706*** 0.283*** 0.176*** 0.131 0.192***(1.515) (-2.861) (0.485) (-1.947) (-1.494) (-2.391) (-2.811) (3.469) (3.924) (1.065) (10.047)
Maturity matching 0.068 -0.545 -0.329 -0.619 -0.716* -1.171** -0.513 -0.407* -0.595 -0.541*** -0.432(0.273) (-1.592) (-1.030) (-1.232) (-1.824) (-2.164) (-1.280) (-1.659) (-1.320) (-2.734) (-1.213)
Leverage 0.999 0.465** 0.626 0.498** 0.817*** 0.161 0.596*** 0.494*** 0.510*** 0.236** 0.459**(1.618) (2.393) (1.367) (2.435) (4.083) (0.289) (3.079) (3.873) (3.785) (2.049) (2.291)
Deposits -0.269** 0.295 0.291*** 0.285*** -0.274*** -1.507*** 0.390*** 0.106* 0.423** 0.297*** -0.134(-2.559) (0.950) (3.590) (2.774) (-6.704) (-11.756) (4.043) (1.844) (2.483) (4.129) (-1.490)
Management structureBoard size -0.268** -0.014 -0.216*** -0.213*** -0.340*** -0.720*** -0.171*** -0.243*** -0.152 -0.117***
(-2.050) (-0.136) (-7.966) (-3.473) (-4.902) (-4.898) (-2.903) (-4.521) (-1.578) (-3.134)Interlock with DNB -0.006 -0.007 0.085* -0.047*** -0.088 -0.129*** 0.019 0.011 -0.015 0.018 0.007
(-0.090) (-0.107) (1.935) (-4.044) (-1.470) (-4.904) (0.321) (0.336) (-0.297) (0.258) (0.071)Characteristics of interlocked banks
Size of interlocked banks -0.016 -0.015 -0.049** -0.022* 0.000 -0.122*** -0.023 -0.001 -0.027 -0.011*** -0.015(-0.699) (-0.727) (-2.142) (-1.688) (0.002) (-5.356) (-1.042) (-0.047) (-1.146) (-3.011) (-1.130)
Size concentration of interlocked banks 0.379** 0.192** 0.127** 0.124 0.427*** 0.877*** 0.193** 0.202*** 0.176** 0.195 0.243***(2.418) (2.505) (2.556) (1.584) (6.392) (3.601) (2.196) (3.148) (2.250) (1.571) (5.984)
Leverage of interlocked banks -0.275 0.152 1.015*** 0.198 -0.372 -2.332*** 0.289 -0.049 0.282 0.262 0.129(-0.735) (0.256) (2.640) (0.464) (-0.681) (-4.602) (0.525) (-0.122) (0.489) (1.501) (0.422)
Profitability of interlocked banks 11.962*** 5.435*** 3.704*** 4.584*** 4.075*** 8.018** 4.687*** 4.812*** 5.617*** 3.168** 4.291**(3.477) (5.470) (2.932) (2.770) (3.039) (2.537) (3.062) (3.197) (4.330) (2.201) (2.291)
Characteristics of interlocked non-banksSize of interlocked non-banks 0.018 -0.001 0.030 0.001 0.015 0.017* -0.003 0.010 -0.002 0.004 -0.001
(0.709) (-0.049) (1.365) (0.084) (1.034) (1.809) (-0.222) (0.705) (-0.129) (0.210) (-0.198)Size concentration of interlocked non-banks -0.427*** 0.244*** -0.213*** 0.292*** 1.076*** 1.335*** 0.223** 0.231** 0.213* -0.012 0.612**
(-8.557) (9.408) (-5.189) (4.047) (3.400) (4.074) (2.258) (2.049) (1.828) (-0.065) (2.357)Leverage of interlocked non-banks -0.718 -0.297 -0.471 -0.349 -0.805 -1.200*** -0.208 -0.614 -0.252 -0.311 -0.441
(-0.999) (-0.433) (-0.623) (-0.494) (-0.929) (-2.833) (-0.272) (-0.916) (-0.354) (-0.491) (-1.322)Profitability of interlocked non-banks -0.306 0.388 -1.088 0.552 -0.627 -0.553 0.721 0.254 0.454 0.581 0.715
(-0.218) (1.522) (-1.379) (0.945) (-0.906) (-0.772) (1.030) (0.491) (0.986) (0.670) (1.547)Industry concentration of interlocked non-banks 0.171*** -0.288* -0.057 -0.385* -0.842** -0.889** -0.297** -0.202 -0.280** -0.187 -0.342
(3.893) (-1.763) (-0.221) (-1.842) (-2.184) (-2.367) (-2.432) (-1.164) (-2.332) (-1.256) (-1.607)Observations 103 139 72 133 87 68 143 143 143 143 143
of wich distressed 37 28 23 37 37 37 37 37 37 31 24Region FE NO YES NO YES YES YES YES YES YES YES YESType FE NO YES NO YES YES YES YES YES YES YES YESPseudo R-squared 0.307 0.277 0.236 0.269 0.336 0.461 0.230 0.227 0.247 0.196 0.322
General characteristics
Note: Marginal effects are calculated at the median. All specifications include bank type and region fixed effects. Robust z-statistics, clustered by bank type, are reported in parentheses. Significance levels are indicated as follows: *** p<0.01, ** p<0.05, * p<0.1. The mean (median) age calculated on an alternative data source is 23.5 (19).
Table 13: Logistic regressions of bank distress checking for robustness, marginal effects
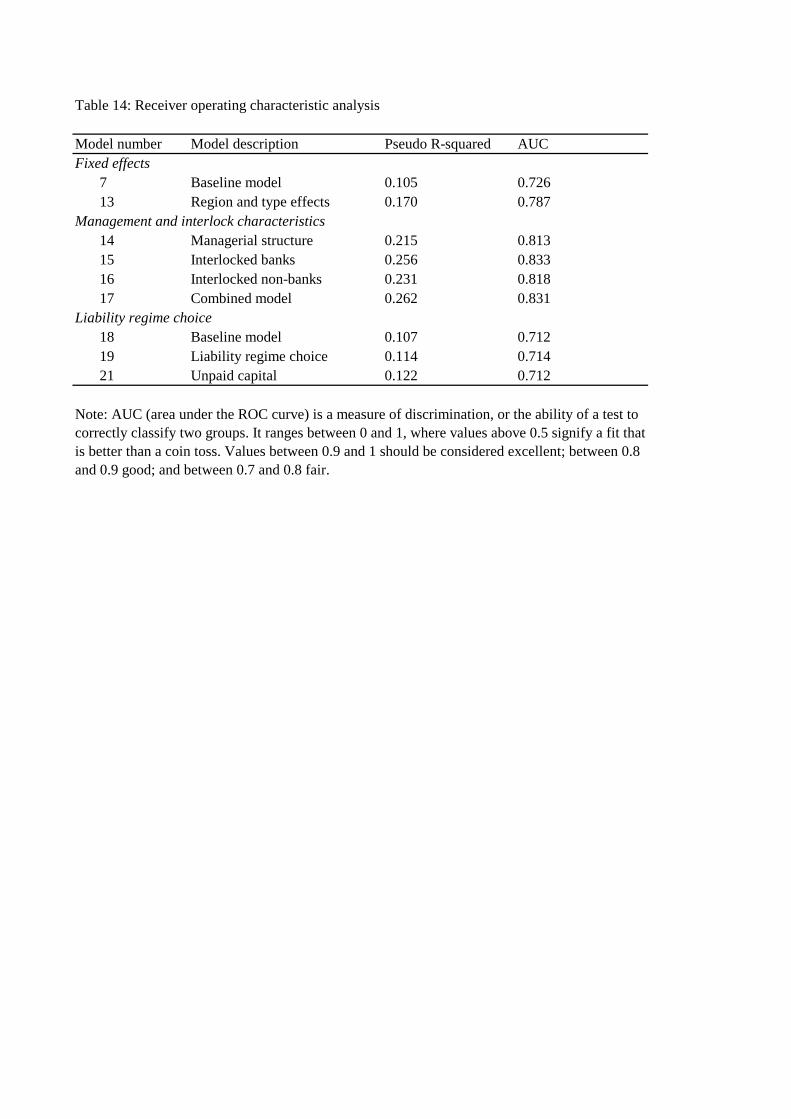
Model number Model description Pseudo R-squared AUCFixed effects
7 Baseline model 0.105 0.72613 Region and type effects 0.170 0.787
Management and interlock characteristics14 Managerial structure 0.215 0.81315 Interlocked banks 0.256 0.83316 Interlocked non-banks 0.231 0.81817 Combined model 0.262 0.831
Liability regime choice18 Baseline model 0.107 0.71219 Liability regime choice 0.114 0.71421 Unpaid capital 0.122 0.712
Note: AUC (area under the ROC curve) is a measure of discrimination, or the ability of a test to correctly classify two groups. It ranges between 0 and 1, where values above 0.5 signify a fit that is better than a coin toss. Values between 0.9 and 1 should be considered excellent; between 0.8 and 0.9 good; and between 0.7 and 0.8 fair.
Table 14: Receiver operating characteristic analysis
European
Historical
Economics
Society
EHES Working Paper Series
Recent EHES Working Papers
2013
EHES.34
2012
World Human Development: 1870-2007
Leandro Prados de la Escosura
EHES.33 Farmer Families at the Heart of the Educational Revolution: Which Occupational
Group Inherited Human Capital in the Early Modern Era?
Franziska Tollnek and Joerg Baten
EHES.32
Monetary policy without interest rates. Evidence from France’s Golden Age
(1948-1973) using a narrative approach.
Eric Monnet
EHES.31
EHES.30
EHES.29
EHES.28
EHES.27
Rearmament to the Rescue?
New Estimates of the Impact of ‘Keynesian’ Policies in 1930s’ Britain
Nicholas Crafts and Terence C. Mills
Housing Markets during the Rural-Urban Transition: Evidence from early 20th
Century Spain
Juan Carmona, Markus Lampe and Joan Ramón Rosés
Coping with Regional Inequality in Sweden: Structural Change, Migrations and
Policy, 1860-2000
Kerstin Enflo and Joan Ramón Rosés
Peasant Agriculture and Economic Growth: The Case of Southeast Europe c.
1870-1940 reinterpreted
Michael Kopsidis
The Rise of the Swiss tax haven in the Interwar period: An international
comparison.
Christoph Farquet
All papers may be downloaded free of charge from: www.ehes.org The European Historical Economics Society is concerned with advancing education in European economic
history through study of European economies and economic history. The society is registered with the
Charity Commissioners of England and Wales number: 1052680


![Understanding Past, and Predicting Future, Niche ... · Topical Review Understanding Past, and Predicting Future, Niche Transitions based on Grass Flowering Time Variation1[OPEN]](https://img.pdfslide.us/doc/110x75/6002b5faa5114260b448f6d6/understanding-past-and-predicting-future-niche-topical-review-understanding.jpg)