Embed Size (px)
Citation preview

Developments in Social Science MethodologyAnuška Ferligoj and Andrej Mrvar (Editors)Metodološki zvezki, 18, Ljubljana: FDV, 2002
Predicting Overall Service Quality.A Structural Equation Modelling Approach.
Carme Saurina and Germà Coenders1
Abstract
In this article, the results of a modified SERVQUAL questionnaire(Parasuraman et al., 1991) are reported. The modifications consisted insubstituting questionnaire items particularly suited to a specific service(banking) and context (county of Girona, Spain) for the original rathergeneral and abstract items. These modifications led to more interpretablefactors which accounted for a higher percentage of item variance.
The data were submitted to various structural equation models whichmade it possible to conclude that the questionnaire contains items with ahigh measurement quality with respect to five identified dimensions ofservice quality which differ from those specified by Parasuraman et al. andare specific to the banking service. The two dimensions relating to thebehaviour of employees have the greatest predictive power on overallquality and satisfaction ratings, which enables managers to use a low-costreduced version of the questionnaire to monitor quality on a regular basis. Itwas also found that satisfaction and overall quality were perfectlycorrelated thus showing that customers do not perceive these concepts asbeing distinct.
1 Introduction
Measurement of a complex concept makes it necessary to design appropriateinstruments, which involves the conceptual definition of the concept, theidentification and operationalization of the relevant dimensions of the concept, thedevelopment of batteries of valid questionnaire items to measure each of thedimensions and the assignment of appropriate weights for each dimension.
1 Department of Economics, University of Girona. Faculty of Economics and Management.
Campus of Montilivi. 17071 Girona, Spain. E-mail: [email protected].

218 Carme Saurina and Germà Coenders
These steps have been followed for service quality measurement during the lasttwo decades. The conceptual definition usually links service quality to thecustomer perceptions of the level of excellence of the service provided (Zeithaml,1986). Parasuraman et al. (1985, 1988, 1991) define perceived quality as a gapbetween consumers’ expectations and consumers perceptions regarding theservice. This definition can be related to the multiple discrepancies theorydeveloped in the field of social psychology to define satisfaction with life(Michalos, 1985). Quality and satisfaction are distinctly defined though obviouslyrelated. Perceived quality is a form of attitude, and results from comparingexpectations with perceptions of performance (Parasuraman et al., 1988).According to Oliver (1981, page 42), “Attitude is the consumer’s relativelyenduring affective orientation for a product, store, or process (e.g., customerservice) while satisfaction is the emotional reaction following a disconfirmationexperience which acts on the base attitude level and is consumption-specific”.Michalos’ multiple discrepancies theory defines life satisfaction as a function ofseven gaps (with what others have, what one feels to deserve, what one needs,what one wants, what one had and expected to have 3 years ago, what one expectsto have 5 years in the future, and the best one has ever had in the past). These gapscan be established for all relevant dimensions or domains of life which, accordingto Michalos, are health, financial security, family relations, employment,friendship, housing, neighbourhood, recreation, religion, self-esteem,transportation and education. Michalos suggested asking respondents to evaluategaps directly.
Parasuraman et al. (1985) define a set of gaps occurring at different stages ofthe service design and provision, which altogether result into the ultimatelyrelevant gap between consumers’ expectations prior to the service delivery andconsumer perceptions during the service delivery. This gap was first defined for 11dimensions or domains of the service provision (access, competence,responsiveness, reliability, courtesy, communication, credibility, security,understanding and knowing the customers, and tangible), which were later reducedto five (responsiveness, reliability, assurance, empathy and tangible) byParasuraman et al. (1985). The authors reported that these domains consistentlyemerged in services of different nature, which, according to them, argues for theirgeneralizability. The questionnaire designed by Parasuraman et al. (SERVQUAL)asked respondents separately about expectations and perceptions in comparablescales so that gaps can be simply obtained by subtracting perceptions fromexpectations.
The SERVQUAL model has been widely used (Buttle, 1996) but has also beenseriously criticised so that no consensus has been reached about a number ofrelevant questions:
1. Are the suggested domains consistent? Many empirical applications fail torecover the five dimensions and suggest to modify them (Babakus &Boller, 1992; Carman, 1990; Cronin & Taylor, 1992; Parasuraman et al.,1994a)
2. How are gaps best measured? When using a direct question as suggested byMichalos (1985) it is questionable whether the middle point of the response

Predicting Overall Service Quality… 219
scale precisely represents the absence of a gap. When using subtraction assuggested by Parasuraman, it is still questionable what expectations meanand whether perceptions have already an implicit comparative nature andcan be used as measures of gap on their own (Cronin & Taylor, 1994;Saurina, 1997a). Besides, the convenience of asking about expectations andperceptions in a single interview session has also been questioned (Carman,1990).
3. Are the concepts of satisfaction and quality really different? If so, what isthe relationship among them? According to Anderson et al. (1994), Croninand Taylor (1992), Llorens (1996) and Reidenbach and Sandifer-Smallwood (1990) quality precedes satisfaction. According to Bitner(1990), Bolton and Drew (1991), Carman (1990), Parasuraman et al. (1985)and Teas (1993), satisfaction precedes quality. According to Oliver (1981),satisfaction is an intervening variable that mediates the formation of newquality perceptions from previous ones. According to McAlexander et al.(1994) and Saurina, (1997a, 1997b) there may fail to be enough empiricalevidence in favour of any of the aforementioned views.
4. Is the SERVQUAL questionnaire useful for any service? Many versions ofthe questionnaire have been suggested. For instance, Parasuraman et al.(1988, 1991) used a 22-item version for banks, credit card companies,repair and maintenance companies and telephone companies. Carman(1990) used a 16-item questionnaire for a dental clinic, a 32-item one for aplacement centre, a 21-item one for a tyre store and a 26-item one for ahospital.
5. Are domains stable in time and consistent across cultures? Varying degreesof fit of the factor analysis model (overall percentages of explainedvariance ranging from 56% to 71%) were reported (Parasuraman et al.,1988, 1991).
Saurina (1997a, 1997b) first applied the SERVQUAL instrument to evaluatethe quality of banking services in the county of Girona (Spain). The SERVQUALquestionnaire as in Parasuraman et al. (1991) was independently translated into theCatalan language several times, and translated back into English to ensurefunctional equivalence of the translated and original questionnaire items (Nord &Sparrow, 1991). As opposed to what is common practice, the questionnaire wasnot administered to customers of a particular bank but to an n=430 representativesample of the population in the area, obtained by simple random sampling,stratified by town and using the census as sampling frame (see for instance Kish,1965). The data were collected by personal interviews in the respondent’s homes,which is generally considered superior to self-administered questionnaires forperceptual and attitudinal surveys of general populations when low socialdesirability bias is to be expected (Groves, 1989).
The main conclusions drawn from this study were:
1. The translated SERVQUAL questionnaire failed to reveal five dimensionsaccounting for a large percentage of variance of the questionnaire items(explained variances were 52%, 51% and 45% for perceptions, expectations

220 Carme Saurina and Germà Coenders
and gaps respectively). In addition, none of the common factor rotationmethods led to factor patterns from which the dimensions suggested byParasuraman et al. (1991) could be interpreted. This was so for perceptions,expectations and gaps. These results suggest that the questionnaire maylack relevant items and that the five dimensions may need to be redefined.
2. The five extracted perception factors accounted for a higher percentage ofvariance of direct overall quality and overall satisfaction ratings (45% and48%) than the five extracted gap factors (34% and 36%), thus suggestingthat perceptions constitute better predictors of quality. Unless theconceptual link between gaps, quality and satisfaction is questioned, thisresult suggests that perceptions are comparative rather than absolute, sothat no other measure of gap is needed. These findings constitute true depthcharges to the whole SERVQUAL model.
These conclusions argue for the need of a second survey of the samepopulation (county of Girona) and of the same service (Banking) using a deeplyadapted version of the questionnaire, which departs from the SERVQUAL designbut which is much better suited for the particular service and cultural setting. Suchan adapted questionnaire should enable us to:
1. use only perception items.2. redefine a number of perception domains in such a way that they better
reflect the situation of the particular service and they better predictcriterion variables such as overall satisfaction ratings and a behaviouralintention which can be related to customer fidelity.
3. redraw the batteries of perception items, which are used to measure eachdomain and evaluate the measurement quality of each item.
4. rank the importance or weight of domains for predicting the criterionvariables.
5. suggest a low-cost reduced version of the questionnaire made up with thebest perception items of the most relevant domains which can be used byfirms to monitor the evolution of quality on a regular basis.
6. shed new pieces of evidence regarding the relationship between overallquality and overall satisfaction ratings.
2 Methodology
2.1 Questionnaire
The questionnaire used in Saurina (1997a, 1997b) has been modified in order tobetter account for the aspects of the service which are relevant to bankingaccording to the usual business practices in the county of Girona. In the whole ofCatalonia, where Girona is located, there is a particular tradition of personalbanking, in which small saving banks that can provide a direct and friendly contact

Predicting Overall Service Quality… 221
have the largest market share. This banking style is also influenced by the fact thatthe largest town in the county has less than 100,000 inhabitants.
The level of generality and abstraction of the SERVQUAL is no longernecessary if only one service and one context lies within the researchers’ interest.This enabled us to word the questionnaire items in particular rather than generaland concrete rather than abstract terms, which made them more easilyunderstandable to respondents of the general population. In-depth interviews withbanking agency directors were conducted with this purpose. Other changesintroduced to the questionnaire were to:
1. introduce a weak no-opinion filter by offering a “don’t know” option to theperception items. Such no opinion filters are strongly recommended in thesurvey literature whenever it can be expected that a significant proportionof the population does not hold strong opinions on the topic of interest(Zaller, 1992).
2. word items in a language as close as possible to colloquial.3. shorten or split lengthy and double-barrelled items.
The questionnaire was pilot tested on an n=30 sample which washeterogeneous enough in terms of age, educational level, occupation and townsize. A battery of debriefing questions was added at the end of the questionnaire toelicit the understanding of the meaning of the perception items. The pilot testsuggested to introduce a number of further modifications into the questionnaire,such as to:
1. further shorten and clarify complex or confused items.2. drop three items which were perceived as redundant with other items.3. drop one item which was too general and ambiguous.4. drop one item which was associated to bad quality by a considerable part of
the respondents.5. substituting a concrete item for an abstract one.
The 19 perception items used in Saurina (1997a) were a subset of the 22 itemsin Parasuraman (1991) and are shown in the appendix together with the 18 itemsof the final adapted questionnaire. All items had nine-point Likert-type responsescales. The extreme categories were labelled “completely disagree” and“completely agree”. A descriptive report of the data, including a marketsegmentation, is to be found in Saurina et al. (2001).
2.2 Sample and data collection
The questionnaire was not administered to customers of a particular bank but to ann=312 representative sample of the population in the area, obtained by systematicsampling, stratified by town and using the telephone directory as sampling frame,after dropping numbers which could be clearly attributed to businesses or publicoffices. The original sample size was larger in order to compensate for vacant

222 Carme Saurina and Germà Coenders
homes due to death, changes of residence or to the fact that a considerable numberof housing units in the county of Girona belong to non-residents and are only usedduring the summer holidays. The data were collected by personal interviews in therespondent’s homes. Kish’s table (Kish, 1965) was used to randomly select theperson to be interviewed among the adults living in the household. One recall wasmade when the house was empty or the selected person was not in.
The item-level data missingness averaged 9.5% and was treated by means ofregression imputation. 11 extreme outliers were identified by means of theMahalanobis distance and appeared as single-case groups in a preliminary clusteranalysis. Thus, a n=301 complete data set was produced and could be submitted tothe analysis.
2.3 Structural equation modelling
Structural equation models with latent variables (SEM) are more and more oftenused to analyse relationships among variables in marketing and consumer research(see for instance Bollen, 1989; Schumacker & Lomax, 1996, or Batista-Foguet &Coenders, 2000, for an introduction and Bagozzi, 1994 for applications tomarketing research). Some reasons for the widespread use of these models aretheir parsimony (they belong to the family of linear models), their ability to modelcomplex systems (where simultaneous and reciprocal relationships may be present,such as the relationship between quality and satisfaction), and their ability tomodel relationships among non-observable variables (such as the domains in theSERVQUAL model) while taking measurement errors into account (which areusually sizeable in questionnaire data and can result in biased estimates ifignored).
As is usually recommended, a confirmatory factor analysis (CFA) model isfirst specified to account for the measurement relationships from latent toobservable variables. In our case, the latent variables are the five perceptiondimensions and the observed variables the 18 perception items. The relationshipsamong latent variables cannot be tested until a well-fitting CFA model has beenreached. In our case, the relationships among overall quality, overall satisfaction, areported behavioural intention and the perception dimensions are of interest. Thismodelling sequence stresses the importance of the goodness of fit assessment andof the re-specification of bad-fitting models.
According to the usual procedures, the goodness of fit is assessed by checkingthe statistical and substantive validity of estimates (i.e. that no estimates lie out ofthe admissible range, as the case is for negative variances or correlations largerthan one, and that no estimates lack a theoretical interpretation, as the case is forestimates of unexpected sign), the convergence of the estimation procedure, theempirical identification of the model, the statistical significance of the parameters,and the goodness of fit to the covariance matrix. Since complex models areinevitably misspecified to a certain extent, the standard χ2 test of the hypothesis ofperfect fit to the population covariance matrix is given less importance thanmeasures of the degree of approximation between the model and the populationcovariance matrix. The root mean squared error of approximation (RMSEA) is

Predicting Overall Service Quality… 223
selected as such a measure. Values equal to 0,05 or lower are generally consideredto be acceptable (Browne & Cudeck, 1993). The sampling distribution for theRMSEA can be derived, which makes it possible to compute confidence intervals.These intervals allow researchers to test for close fit and not only for exact fit, asthe χ2 statistic does. If both extremes of the confidence interval are below 0.05,then the hypothesis of close fit is rejected in favour of the hypothesis of better thanclose fit. If both extremes of the confidence interval are above 0.05, then thehypothesis of close fit is rejected in favour of the hypothesis of bad fit. The re-specification of bad-fitting models is done by:
1. dropping loadings which are not substantively interpretable.2. adding loadings which are both interpretable and statistically significant.3. splitting dimensions for which interpretable clusters of positive residual
correlations appear.4. adding error correlations which are both interpretable and statistically
significant.5. dropping items which would load on nearly all dimensions.6. merging dimensions whose correlation is close to unity.7. dropping non-significant regression coefficients among latent variables.
In order to account for measurement errors, one must either provide at leasttwo indicators for each latent variable or know or assume the reliability coefficientof the indicator in advance, so that the non-identified factor loading and errorvariance of the item can be appropriately constrained. The latter holds for overallquality, overall satisfaction, and the reported behavioural intention. In order thatthe constraints on the loadings of these variables be realistic, we predict thereliability coefficient from the meta-analysis of measurement quality in personalinterviews carried out in Austria by Költringer (1995). According to this meta-analysis, the average reliability coefficient is 0,88. To predict reliability of aparticular questionnaire item, this average should be modified according to thecharacteristics of the questionnaire, the data collection and the nature of thevariable of interest (see Költringer, 1995, for details). In our case we must:
1. add 0.01 as the response scales have 9 or more scale points.2. add 0.04 as the texts of the questions and the introductions to the questions
are short.3. add 0.01 as the questions’ contents are attitudinal but unlikely to be
sensitive to social desirability.4. subtract 0.02 as the questions belong to a battery of similar items.5. subtract 0.03 as the questions are not among the first in the questionnaire.6. subtract 0.01 as non-professional interviewers administered the
questionnaire.
The predicted reliability coefficient is thus 0,88. This estimate is of course notcompletely accurate, as it only constitutes a prediction and is based on dataobtained in a different country. However, it is likely more reasonable than the
224 Carme Saurina and Germà Coenders
customary estimate of 1, which is implicitly used whenever fitting models whichdo not take measurement errors into account.
The models were estimated by normal theory maximum likelihood using theLISREL8.3 program (Jöreskog & Sörbom, 1989, 1993; Jöreskog et al. 1999) takingthe covariance matrix as input. The robustness maximum likelihood pointestimates to non-continuous measurement (such as those obtained with nine-pointLikert items) is well documented for models which include measurement errorterms such as those considered in this article (Coenders et al., 1997; Homer andO’Brien, 1988; Johnson & Creech, 1983). However, non-continuous data dodeviate from the normality assumption, which does affect the quality of inferences.The computation of the χ2 statistic and the RMSEA have been based on the meanscaling corrections developed in Satorra and Bentler (1994) that render themrobust to non-normality. These corrected statistics are available in LISREL8.3(Jöreskog et al., 1999).
Likelihood ratio tests among nested models can be computed as χ2 differences.Unfortunately, the difference between two mean-scaled χ2 statistics is not χ2
distributed, though some easy adjustments can be made by hand (Satorra & Bentler,1999). Let T*
0 and T*1 be the mean-scaled χ2 statistics, c0 and c1 the scaling constants
obtained as c0 =T0/T*0 and c1 =T1/T
*1, and d0 and d1 the degrees of freedom for two nested
models, of which Model 0 is more restrictive. The robust χ2 difference can be computed as:
)( 10
1100
102
dd
cdcdTT
differenceRobust
−−−=χ
3 Results
3.1 CFA model
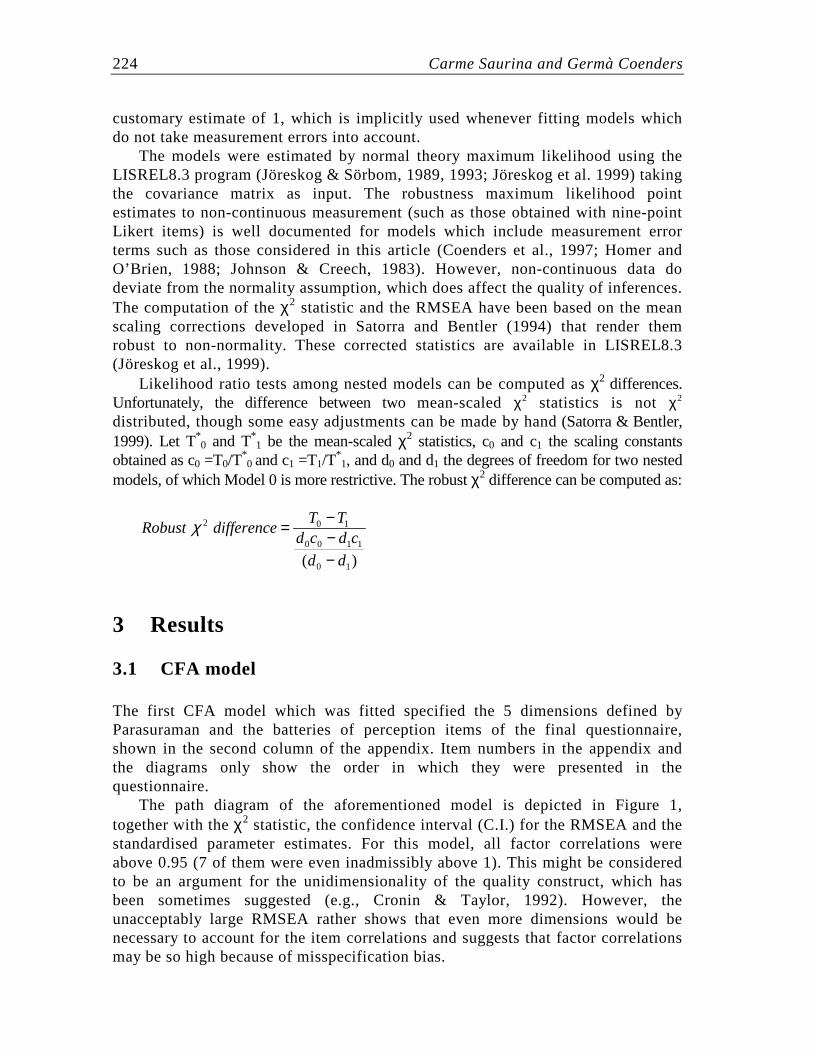
The first CFA model which was fitted specified the 5 dimensions defined byParasuraman and the batteries of perception items of the final questionnaire,shown in the second column of the appendix. Item numbers in the appendix andthe diagrams only show the order in which they were presented in thequestionnaire.
The path diagram of the aforementioned model is depicted in Figure 1,together with the χ2 statistic, the confidence interval (C.I.) for the RMSEA and thestandardised parameter estimates. For this model, all factor correlations wereabove 0.95 (7 of them were even inadmissibly above 1). This might be consideredto be an argument for the unidimensionality of the quality construct, which hasbeen sometimes suggested (e.g., Cronin & Taylor, 1992). However, theunacceptably large RMSEA rather shows that even more dimensions would benecessary to account for the item correlations and suggests that factor correlationsmay be so high because of misspecification bias.

Predicting Overall Service Quality… 225
χ2=596.94, d.f.=125, p-value=0.000 90% CI for RMSEA: (0.10, 0.12)
Figure 1: CFA model of the dimensions defined by Parasuraman.Standardised estimates.

226 Carme Saurina and Germà Coenders
χ2=348.83, d.f.=129,p-value=0.000 90% CI for RMSEA: (0.066, 0.085)
Figure 2: Starting CFA model. Standardised estimates.

Predicting Overall Service Quality… 227
χ2=119.96, d.f.=84, p-value=0.006 90% CI for RMSEA: (0.021, 0.052)
Figure 3: Modified CFA model. Standardised estimates.

228 Carme Saurina and Germà Coenders
We considered the model in Figure 1 to be too poor as a starting point for aspecification search process. Therefore we carried out a four-factor principal axisexploratory factor analysis with varimax rotation and specified a new CFA modelrelating each item to the factor with highest loading in the exploratory factoranalysis model. This model is depicted in Figure 2, fitted considerably better thanthe original model and yielded a maximum factor correlation of 0.87. The fit couldbe further improved by following the model modification guidelines described inthe foregoing section, which lead to the model in Figure 3. The goodness of fit isnow acceptable, the upper limit of the C.I. for the RMSEA being only slightlyabove 0.05. All factor loading and error covariance estimates are statisticallysignificant. In addition, all factor correlations are significantly different fromunity, thus showing that none of the five dimensions can be merged to another.Nevertheless, all factor correlations are rather high, (between 0.63 and 0.89) aswas to be expected since all factors are related to the common construct of servicequality.
The new factor pattern in Figure 3 shows important differences with respect tothat in Figure 1. 5 dimensions are now present, which we have labelledcompetence, information, employee1, employee2 and tangible. If we compare bothpatterns we see that:
1. items p12 “XYZ’s Employees inform you of major topics related tofinancial operations such as deadlines, taxes, commissions” and p15 “XYZhas operating hours convenient to you” would load on nearly all 5dimensions and were dropped from the model.
2. the competence dimension is related to two items formerly related to thereliability dimension, namely p10 “XYZ’s fulfils agreed deadlinesregarding maturity of mortgages and loans and credit card debits” and p16“XYZ does not make mistakes such as incorrect debits or overdrafts”. Thenew dimension also integrates other general quality and reliability aspectswhich are particularly relevant in the banking sector, such as p1 “XYZ hastechnologically up-to date equipment”, p2 “XYZ timely sends bankstatements” and p11 “employees of XYZ have the knowledge to answeryour questions”. To a lesser extent, the dimension is also related to twoitems which load on the information dimension as well, namely p6 “XYZoffers you the product which best suits you” and p13 “XYZ’s pamphletsand statements are clear and well explained” .
3. the original dimensions responsiveness, assurance and empathy turn intothe three new dimensions information, employee1, and employee2. Thedimension employee1 is related to two of the items which formerly loadedon the assurance dimension: p9 “employees of XYZ are consistentlycourteous with you” and p7 “the behaviour of employees of XYZ instilsconfidence in customers” : In addition, it is related to p5 “When you havean unpredictable problem, XYZ shows a sincere interest in solving it” andto a lesser extent to p8 “ XYZ’s employees are neat appearing” which alsoloads on the tangible dimension. This dimension can be interpreted as thepart of the interaction with employees which tends to give customersassurance and trust in the company.

Predicting Overall Service Quality… 229
4. the dimension employee2 is related to p3 “XYZ’s employees prevent longwaiting lines” and to p18 “XYZ’s employees recognise you and call you byyour name”. To a lesser extent, the dimension is also related to an itemwhich loads on the competence dimension as well: p11“employees of XYZhave the knowledge to answer your questions”. This dimension can beinterpreted as the personal part of the interaction with employees.
5. the information dimension is measured by p14 “XYZ provides appropriatefinancial and tax information” and p17 “XYZ’s advertising of financialproducts and services reflects reality” which formerly loaded in a ratheruninterpretable manner on assurance and reliability respectively. To alesser extent, the dimension is also related to two items which load on thecompetence dimension as well, namely p6 ”XYZ offers you the productwhich best suits you” and p13 “XYZ’s pamphlets and statements are clearand well explained”.
6. the tangible dimension is reduced to two items of the former tangibledimensions which can be associated to the most physically visible aspectsof the service: p4 “XYZ’s premises are visually appealing” and p8 “XYZ’semployees are neat appearing.
7. some error covariance parameters have been introduced to account forcommunalities among items which go beyond the common factors, andwhich are of too little theoretical relevance to lead to the specification ofadditional factors. The error covariance between items p2 and p3 can berelated to the speed of the service delivery. The covariance between itemsp1 and p2 can be related to the same idea, since technology plays animportant role when it comes to quickly accessing information orprocessing financial operations. Similarly, employee knowledge eveneliminates the need to access information and can have an impact onservice speed, which may explain the error covariance between p3 and p11.Items p17 and p13 both refer to printed advertising and informationmaterial. Items p18 and p9 both refer to courtesy of employees. The errorcovariance between items p17 and p18 has been introduced only with theaim of improving the fit of the model.
3.2 Relationships among latent variables
In this section, we specify a SEM for predicting overall quality ratings, overallsatisfaction ratings, and a reported behavioural intention which can be understoodas a form of customer fidelity. The dimensions identified in the previous sectionplay the role of explanatory variables.

230 Carme Saurina and Germà Coenders
χ2=167.94, d.f.=117,p-value=0.001 90% CI for RMSEA: (0.024, 0.050)
Figure 4: SEM for predicting overall quality assuming perfect measurement.Standardised estimates.
The first model we specify is a completely recursive model assuming that thecausal order flows from the perception dimensions to perceived quality (quality inthe path diagram in Figure 4) to satisfaction (satisfac) and to customer fidelity(fidelity). This first model customarily assumes that these last three variables aremeasured without error by one 9-point rating item each:
1. qual_rat: “the global assessment of the quality of your bank is ...” in a“very bad” to “very good” scale.
2. sat_rat: “with respect to the service provided by your bank you are...” in a“very dissatisfied” to “very satisfied” scale.
3. recom: “would you recommend your bank to your friends and family?” in a“not at all” to “enthusiastically” scale.
The path diagram in Figure 4 shows the standardised regression coefficientsand the percentages of unexplained variances (as arrows pointing to the dependentlatent variables). Note that all models in Figure 4 to Figure 6 still include thecorrelations among perception dimensions and the factor loadings and errorvariances and covariances of their indicators, which are omitted from the diagramsfor the sake of simplicity. The RMSEA of the model is even slightly better thanthat of the model in Figure 3, the upper limit for the C. I. for the RMSEA nowbeing just 0.05. The coefficients from the five quality dimensions on the three

Predicting Overall Service Quality… 231
dependent variables are sometimes of unexpected signs, which we attribute tocollinearity problems and which requires simplifying the model. The percentagesof unexplained variance are large for quality and fidelity and still sizeable forsatisfaction. It is known that measurement errors introduce an upward bias inunexplained variances. Thus, we next specify a model which assumes thereliability of the three indicators of the dependent variables to be equal to theprediction obtained from Költringer (1995).
χ2=174.64, d.f.=123, p-value=0.002 90% CI for RMSEA: (0.023, 0.049)
Figure 5: SEM for predicting overall quality assuming measurement error.Standardised estimates
The estimates of this second model are shown Figure 5. The fit of the model isabout as good as that of the model in Figure 4. Note that the loadings of qual_rat,sat_rat and recom are no longer equal to one. In this model, perceived qualityalone accounts for all the variance of satisfaction (the unexplained variance is evennegative though not significantly different from 0). Thus, all paths from the fiveexplanatory dimensions to satisfaction are unnecessary and have been droppedfrom the model. This model shows no evidence that satisfaction and quality bedistinct concepts. Only the misspecification in the model in Figure 4 stemming

232 Carme Saurina and Germà Coenders
from the unrealistic assumption of perfect measurement did provide an apparentdistinction between quality and satisfaction.
This model was respecified by assuming that qual_rat and sat_rat constituteindicators of the same quality-satisfaction dimension. The good fit is consistentwith this assumption, with a χ2 statistic of 172.91, with 122, d.f., a p-value of=0.002 and a 90% CI for RMSEA equal to (0.023 , 0.050). The factor loadingsand error variances of qual_rat and sat_rat become identified parameters, thusrendering Költringer’s (1995) results unnecessary except for the recom indicator.
Next, the non-significant predictors of quality and fidelity were dropped oneby one. When no unsignificant relationships remained, a robust likelihood ratio χ2
change test was performed on the dropped coefficients, yielding a robust χ2
difference equal to 3.90 with 8 d.f. and a p-value of 0.87, and thus confirming theappropriateness of dropping these coefficients.
χ2=178.16, d.f.=130, p-value=0.003 90% CI for RMSEA: (0.021, 0.047)
Figure 6: Final SEM for predicting overall quality. Standardised estimates.
The finally specified model is depicted in Figure 6. The RMSEA of the modelis slightly better than that of the model in Figure 5 and the upper limit of the C.I.is now 0.047. The employee1 and employee2 dimensions jointly explain 46% ofthe quality-satisfaction dimension. The fact that the remaining three dimensionsadd no additional explanatory power, likely because of collinearity, enablesmanagers to make reasonable predictions of perceived quality based on a relativelyshort list of questionnaire items. The quality-satisfaction dimension accounts for42% of the variance of consumer fidelity as measured by recommendation tofriends and family. The effect of the five explanatory dimensions on fidelity isonly indirect through the quality-satisfaction dimension.
Predicting Overall Service Quality… 233
4 Discussion
A first major finding arising from our empirical research is that the relevantdomains are service specific and maybe even specific to each cultural environmentand business practice. The results of the last CFA model fitted suggest thatperceptions are not necessarily structured around conceptual domains which maybe meaningful to the consumer research theoretician, but around broad categorieswhich are particularly relevant to the particular service (information received andgeneral competence of the company) and around clearly distinguishable processesin the service provision (e.g., interaction with the employees). These broadcategories only need to be homogeneous enough so that consumers have consistentperceptions, but may or may not coincide with definitional boundaries set bytheoreticians and may vary from one service to another (Carman, 1990). Thedomains suggested in SERVQUAL scale and the SERVQUAL questionnaire, evenwith later refinements (Parasuraman et al., 1994b) can at most constitute avaluable starting point for model and item development. For each particularservice it is necessary to do a considerable amount of qualitative research in orderto better identify the domains which are specifically relevant.
The empirical results also suggest that satisfaction and quality are the sameconstruct in the context of banking services in the county of Girona. Customersseem not to perceive the minor differences between the conceptual definition ofboth concepts as given by marketing theoreticians. In this respect, the discussionregarding whether satisfaction precedes quality or the other way around seems tobe meaningless.
The practical usefulness of service quality questionnaires is only attained fromtheir regular administration and analysis. In order that the SERVQUAL beemployed by firms to monitor service quality on a regular basis, the costs ofadministering the questionnaire and thus the questionnaire lengths should be cut toa minimum. An important result of the article is that it reveals that certaindimensions of quality, namely those related to employees, are the most relevant inthe banking sector in the Girona area, and constitute the best predictors of fidelityand satisfaction. In fact, the in-depth interviews with banking agency directorsrevealed a general managerial awareness of the paramount importance of thesedimensions, which is also understandable in the light of the particular bankingpractices in the area. It remains an open question whether this finding could begeneralised to other places, but we believe it could only be so to regions withoutvery large cities and with a similar tradition of direct and personal contact to thecustomer.
Besides, not all items of these dimensions must necessarily be used. A subsetof them may be selected by giving priority to those with a higher factor loadingand those that present no loadings on other factors, which are a sign of complexityor multidimensionality of the item.
The best items of the employee1 and employee2 dimensions are:
1. p5 “When you have an unpredictable problem, XYZ shows a sincereinterest in solving it”

234 Carme Saurina and Germà Coenders
2. p7 “The behaviour of employees of XYZ instils confidence in customers”3. p9 “ Employees of XYZ are consistently courteous with you”4. p3 “XYZ’s employees prevent long waiting lines”5. p18 “XYZ’s employees recognise you and call you by your name”
If the remaining dimensions are also to be measured, the best items would be:
1. p10 and p16 for the competence dimension. p1 or p2 could also be added.There would be little to be gained from adding both simultaneously as theirerror covariance makes them somewhat redundant.
2. p4 for the tangible dimension3. p14 and p17 for the information dimension.
The final model presented in this article has been selected after a longspecification search process. Even if this process has been driven both bygoodness-of-fit and substantive considerations, it is not free of undesirablestatistical consequences, which are usually grouped under the heading ofcapitalisation on chance, whereby a word of caution must be raised. Luijben(1989) summarises these consequences as an inflation of estimates and t-values, asthe process has only considered the addition of those parameters which aresignificant for the actual data set. The use of statistics such as the expectedcrossvalidation index (Browne & Cudeck, 1989) does not completely solve theseproblems (MacCallum et al., 1992). The only way to detect biases due tocapitalisation on chance is a crossvalidation of the model by re-estimating ad re-diagnosing it on a fresh sample (MacCallum, 1986). This cross-validation is in ourcurrent research agenda.
The individuals’ preferences may also change in time, and so will the relevantdimensions of service quality. Every 4 to 6 years a complete study of thesedimensions should be carried out starting with the preliminary qualitative research.In the banking sector it is clear that in the future more attention will have to bedevoted to information-technology based services.
Acknowledgements
This work was supported by the grant Isidre Bonshoms 1997 offered by theGirona Savings Bank (Caixa de Girona).
References
[1] Anderson, E.W., Fornell, C., and Lehmann, D.R. (1994): Customersatisfaction, market share, and profitability: findings from Sweden. Journal ofMarketing, 58, 53-66.

Predicting Overall Service Quality… 235
[2] Babakus, E. and Boller, G.W. (1992): An empirical assessment of theSERVQUAL scale. Journal of Business Research, 24, 253-268.
[3] Bagozzi, R.P. (1994): Structural equation models in marketing research: basicprinciples. In R.P. Bagozzi (Ed.): Principles of Marketing Research.Cambridge: Basil Blackwell, 317-385.
[4] Batista-Foguet, J.M. and Coenders, G. (2000): Modelos de EcuacionesEstructurales [Structural Equation Models] . Madrid, Spain: La Muralla.
[5] Bitner, M.J. (1990): Evaluating service encounters: the effects of physicalsurroundings and employee responses. Journal of Marketing, 54, 69-82.
[6] Bollen, K.A. (1989): Structural Equations with Latent Variables. New York:Wiley.
[7] Bolton, R.N. and Drew, J.H. (1991): A multistage model of customer’sassessments of service quality and value. Journal of Consumer Research, 17,375-384.
[8] Browne, M.W. and Cudeck, R. (1989): Single cross validation indices forcovariance structures. Multivariate Behavioral Research, 24, 445-455.
[9] Browne, M.W. and Cudeck, R. (1993): Alternative ways of assessing modelfit. In K.A. Bollen and J.S. Long (Eds.): Testing Structural Equation Models.Thousand Oaks: Sage, 136-162.
[10] Buttle, F. (1996): SERVQUAL: review, critique, research agenda. EuropeanJournal of Marketing, 30, 8-32.
[11] Carman, J.M. (1990): Consumer perceptions of service quality: an assessmentof the SERVQUAL dimensions. Journal of Retailing, 66, 33-55.
[12] Coenders, G., Satorra, A. and Saris, W.E. (1997): Alternative approaches to structuralmodeling of ordinal data: a Monte Carlo study. Structural Equation Modeling, 4,261-282.
[13] Cronin, J.J. Jr. and Taylor, S.A. (1992): Measuring service quality: Areexamination and extension. Journal of Marketing, 56, 55-68.
[14] Cronin, J.J. Jr. and Taylor, S.A (1994): SERVPERF versus SERVQUAL:reconciling performance-based and perceptions-minus-expectationsmeasurement of service quality. Journal of Marketing, 56, 125-131.
[15] Groves, R.M. (1989): Survey Errors and Survey Costs. New York: Wiley.
[16] Homer, P. and O'Brien, R.M. (1988): Using LISREL models with crude rank categorymeasures. Quality and Quantity, 22, 191-201.
[17] Johnson, D.R. and Creech, J.C. (1983): Ordinal measures in multiple indicatormodels: a simulation study of categorization error. American Sociological Review, 48,398-407.
[18] Jöreskog, K.G. and Sörbom, D. (1989): LISREL 7, a Guide to the Programand Applications. Chicago: SPSS Publications.

236 Carme Saurina and Germà Coenders
[19] Jöreskog, K.G. and Sörbom, D. (1993): New Features in LISREL 8. Chicago:Scientific Software International.
[20] Jöreskog, K.G., Sörbom, D., du Toit, S., and du Toit, M. (1999): LISREL 8: NewStatistical Features. Chicago: Scientific Software International.
[21] Kish, L. (1965): Survey Sampling. New York: Wiley.
[22] Költringer, R. (1995): Measurement quality in Austrian personal interviewsurveys. In W.E. Saris and Á. Münnich (Eds.): The Multitrait-multimethodApproach to Evaluate Measurement Instruments. Budapest: Eötvös UniversityPress, 207-224.
[23] Llorens, F.J. (1996): Una evaluación de la relación entre calidad y servicio,satisfacción y actitudes del cliente [Relationship between quality and service,satisfaction and customer attitudes]. ESIC MARKET, 3 , 121-132.
[24] Luijben, T. (1989): Statistical Guidance for Model Modification in CovarianceStructure Analysis. Amsterdam: Sociometric Research Foundation.
[25] MacCallum, R.C. (1986): Specification searches in covariance structuremodeling. Psychological Bulletin, 100, 107-120.
[26] MacCallum, R.C., Roznowski, M., and Necowitz, L.B. (1992): Modelmodification in covariance structure analysis: the problem of capitalization onchance. Psychological Bulletin, 111, 490-504.
[27] McAlexander, J.H., Kaldenburg, D.O., and Koening, H.F. (1994): Servicequality measurement. Journal of Health Care Marketing, 14, 34-40.
[28] Michalos, A.C. (1985): Multiple discrepancies theory (MDT). SocialIndicators Research, 16, 347-413.
[29] Nord, C. and Sparrow, P. (1991): Text Analysis in Translation. Amsterdam:Rodopi.
[30] Oliver, R.L. (1981): Measurement and evaluation of satisfaction processes inretail settings. Journal of Retailing, 57, 25-48.
[31] Parasuraman, A., Berry, L.L., and Zeithaml, V.A. (1991): Refinement andreassessment of the SERVQUAL scale. Journal of Retailing, 67, 420-450.
[32] Parasuraman, A., Zeithaml, V.A. and Berry, L.L. (1985): A conceptual modelof service quality and its implications for future research. Journal ofMarketing, 49, 41-50.
[33] Parasuraman, A., Zeithaml, V.A., and Berry, L.L. (1988): SERVQUAL: Amultiple-item scale for measuring consumer perceptions of service quality.Journal of Retailing, 64, 41-50.
[34] Parasuraman, A., Zeithaml, V.A., and Berry, L.L.(1994a): Alternative scalesfor measuring service quality: a comparative assessment based onpsychometric and diagnostic criteria. Journal of Retailing, 70, 201-230.

Predicting Overall Service Quality… 237
[35] Parasuraman, A., Zeithaml, V.A., and Berry, L.L. (1994b): Reassessment ofexpectations as a comparison standard in measuring service quality.Implications for future research. Journal of Marketing, 58, 111-124.
[36] Reidenbach, R.E. and Sandifer-Smallwood, B. (1990): Exploring perceptionsof hospital operations by a modified SERVQUAL approach. Journal ofHealth Care Marketing, 10, 47-55.
[37] Satorra, A. and Bentler, P.M. (1994): Corrections to test statistics and standard errorsin covariance structure analysis. In A. von Eye and C. Clogg (Eds.): LatentVariables Analysis: Applications to Developmental Research. Thousand Oaks: Sage,399-419.
[38] Satorra, A. and Bentler, P.M. (1999): A scaled difference chi-square test statistic frommoment structure analysis. Technical report. University of California, Los Angeles.
[39] Saurina, C. (1997a): Mesura de la Qualitat en el Sector Serveis[Measurement of Quality in the Service Sector] , Doctoral dissertation,University of Girona, Spain.
[40] Saurina, C. (1997b): Evaluación de un modelo de medida de la calidad en elsector servicios. Las entidades financieras en las comarcas de Girona[Assessment of a measurement model for service quality. Banking in thecounty of Girona]. Estadística Española, 39, 219-248.
[41] Saurina, C., Coenders, G., and Saez, M. (2001): La Qualitat Percebuda delSector Financer a les Comarques Gironines [Perceived Quality in theBanking Sector of the Girona Area] . Girona, Spain: Fundació Gaixa deGirona.
[42] Schumacker, R.E. and Lomax, R.G. (1996): A Beginner’s guide to structuralequation modeling. Mahwah: Lawrence Erlbaum.
[43] Teas, K.R. (1993): Expectations, performance evaluation and consumer’sperceptions of quality. Journal of Marketing, 57, 18-24.
[44] Zaller, J. R. (1992): The Nature and Origins of Mass Opinion. Cambridge:Cambridge University Press.
[45] Zeithaml, V.A. (1986): Defining and relating price, perceived quality, andperceived value. Working Paper, Duke University.

238 Carme Saurina and Germà Coenders
Appendix
Translated questionnaire(Saurina, 1997a):
Final adapted questionnaireused in this article:
TANGIBLESXYZ has modern-looking equipment.XYZ’s physical facilities are visually
appealing.XYZ’s employees are neat-appearing.Materials associated with the service (such as
pamphlets or statements) are visuallyappealing at XYZ.
TANGIBLESXYZ has technologically up-to-date
equipment. (p1)XYZ’s premises are visually appealing. (p4)XYZ’s employees are neat-appearing. (p8)XYZ’s pamphlets and statements are clear and
well explained. (p13)
RELIABILITYWhen you have a problem, XYZ shows a
sincere interest in solving it.XYZ performs the service right the first time.XYZ provides its services at the time it
promises to do so.XYZ insists on error-free records.
RELIABILITYWhen you have an unpredictable problem,
XYZ shows a sincere interest in solving it.(p5)
XYZ’s fulfils agreed deadlines regardingmaturity of mortgages and loans and creditcards debits.(p10)
XYZ does not make mistakes such as incorrectdebits or overdrafts.(p16)
XYZ’s advertising of financial products andservices reflects reality. (p17)
RESPONSIVENESSEmployees of XYZ tell you exactly when
services will be performed.Employees of XYZ give you prompt service.Employees of XYZ are always willing to help
you.
RESPONSIVENESSXYZ timely sends bank statements. (p2)XYZ’s employees prevent long waiting lines.
(p3)
ASSURANCEThe behaviour of employees of XYZ instils
confidence in customers.You feel safe in your transactions with XYZ.Employees of XYZ are consistently courteous
with you.Employees of XYZ have the knowledge toanswer your questions
ASSURANCEThe behaviour of employees of XYZ instils
confidence in customers. (p7)XYZ’s Employees inform you of major topics
related to financial operations such asdeadlines, taxes, commissions.(p12)
Employees of XYZ are consistently courteouswith you. (p9)
Employees of XYZ have the knowledge toanswer your questions. (p11)
XYZ provides appropriate financial and taxinformation. (p14)
EMPATHYXYZ has operating hours convenient to all its
customers.XYZ has employees who give you personal
attention.XYZ has your best interests at heart.Employees of XYZ understand your specificneeds.
EMPATHYXYZ has operating hours convenient to you.
(p15)XYZ’s employees recognise you and call you
by your name. (p18)XYZ offers you the product which best suits
you. (p6)