Embed Size (px)
Citation preview
Ž .Social Networks 22 2000 173–186www.elsevier.comrlocatersocnet
Some analyses of Erdos collaboration graph˝
Vladimir Batagelj), Andrej MrvarDepartment of Mathematics, FMF, UniÕersity of Ljubljana, Jadranska 19, 1000 Ljubljana, SloÕenia
Abstract
Ž . Ž .Patrick Ion Mathematical Reviews and Jerry Grossman Oakland University maintain a collection ofdata on Paul Erdos, his co-authors and their co-authors. These data can be represented by a graph, also called˝the Erdos collaboration graph.˝
ŽIn this paper, some techniques for analysis of large networks different approaches to identify ‘interesting’individuals and groups, analysis of internal structure of the main core using pre-specified blockmodeling and
.hierarchical clustering and visualizations of their parts, are presented on the case of Erdos collaboration graph,˝using the program PPPPPaaaaajjjjjeeeeekkkkk. q 2000 Elsevier Science B.V. All rights reserved.
1. Introduction
The current level of development of computer technology allows us to deal with largeŽ .having thousands to several hundreds of thousands of lines — arcs andror edgesnetworks already on PCs. The basic problem is that such networks cannot be grasped ina single view — we have to either produce a global viewrcharacteristics omitting thedetails, or make a detailed inspection of some selected part of the network of moderate
Ž .size some tens of vertices , or something in between. The Erdos collaboration graph is˝an example of a large network on which we can present some techniques that can beused for analysis of large networks. The obtained results are of their own interest forgraph theory community.
Paul Erdos was one of the most prolific mathematicians in history, with more than˝1500 papers to his name. He was born on March 26, 1913 in Budapest, Hungary anddied September 20, 1996 in Warsaw, Poland. Paul Erdos won many prizes including˝
) Corresponding author.Ž .E-mail address: [email protected] V. Batagelj .
0378-8733r00r$ - see front matter q 2000 Elsevier Science B.V. All rights reserved.Ž .PII: S0378-8733 00 00023-X
( )V. Batagelj, A. MrÕarrSocial Networks 22 2000 173–186174
Cole Prize of the American Mathematical Society in 1951 and the Wolf Prize in 1983.He is also known as a promoter of collaboration and as a mathematician with the largestnumber of different co-authors. This was a motivation for the introduction of the Erdos˝number.
2. Erdos collaboration graph˝
The Erdos number n of an author is defined as follows: Paul Erdos himself has˝ ˝E
n s0; people who have written a joint paper with Paul Erdos have n s1; and their˝E E
co-authors, with Erdos number not yet defined, have n s2; etc.˝ E
Often on the home pages of people interested in or related to combinatorics we findthe statement:
My Erdos number is . . .˝
Ž . Ž .Patrick Ion Mathematical Reviews and Jerry Grossman Oakland University col-Ž .lected the related data Grossman and Ion, 1995; Grossman, 1996 and made them
available at the URL: http:rrwww.oakland.edur;grossmanrerdoshp.html.These data can be represented as a graph called the Erdos collaboration graph —˝Ž .EEs V, E . The set of its vertices V consists of known authors with n F2, and itsE
edges connect two authors, if they wrote a joint paper, and at least one of them has� 4 Ž .n g 0,1 — the data about collaboration among authors with n s2 are not yet?E E
available.The data are updated annually. Table 1 shows the ‘growth’ of the Erdos collaboration˝
graph.By removing Paul Erdos himself and connections to him from the graph EE we get˝
the truncated Erdos collaboration graph EEX. The last, 1999 edition of this graph˝
contains 6100 vertices and 9939 edges.The names of authors with n s1 are written in all capital letters and the names ofE
authors with n s2 are only capitalized.E
We used program PPPPPaaaaajjjjjeeeeekkkkk to make some analyses and get layouts of selected parts ofErdos collaboration graph. PPPPPaaaaajjjjjeeeeekkkkk is a program, for Windows, for analysis and˝
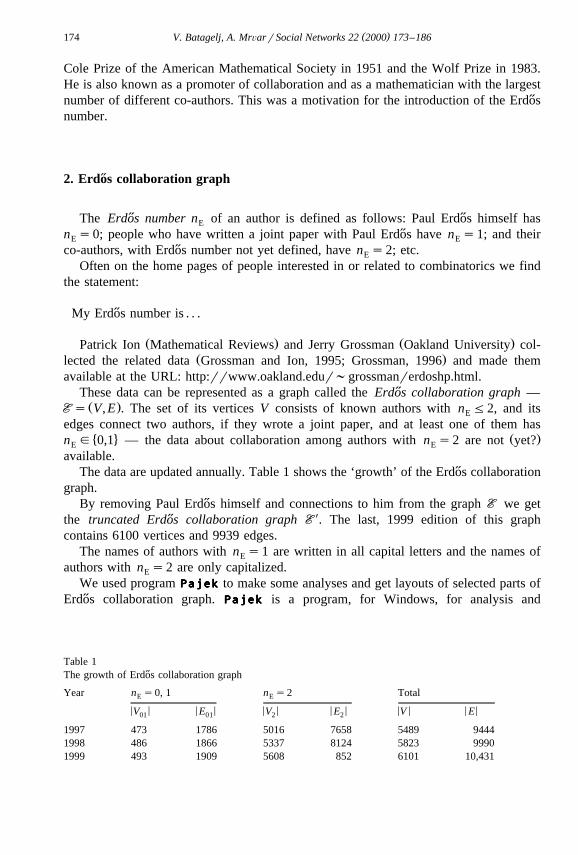
Table 1The growth of Erdos collaboration graph˝Year n s0, 1 n s2 TotalE E
< < < < < < < < < < < <V E V E V E01 01 2 2
1997 473 1786 5016 7658 5489 94441998 486 1866 5337 8124 5823 99901999 493 1909 5608 852 6101 10,431
( )V. Batagelj, A. MrÕarrSocial Networks 22 2000 173–186 175
Table 2Basic statistics on degrees in Erdos collaboration graph˝
� 4n s1 n g 0, 1 n s2E E E
Minimum 1 1 1Median 18 18 1Average degree 24.08 25.03 1.52Maximum 277 492 18Maximizer Harary Erdos Lesniak˝
Ž .visualization of large networks Batagelj and Mrvar, 1998 . It is freely available fornoncommercial use at: http:rrvlado.fmf.uni-lj.sirpubrnetworksrpajekr.
3. Some basic analyses
In Table 2, some basic statistics about the number of co-authors — vertex degrees inErdos collaboration graph EE are presented.˝
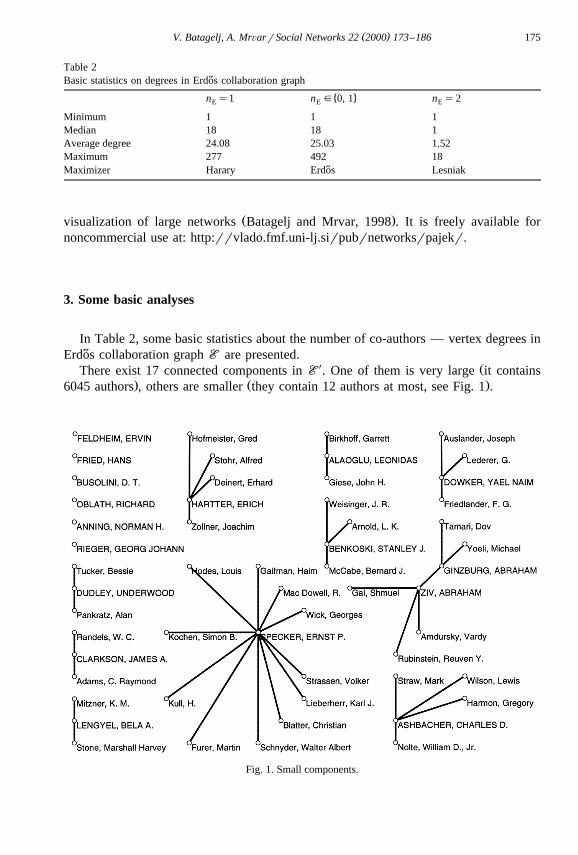
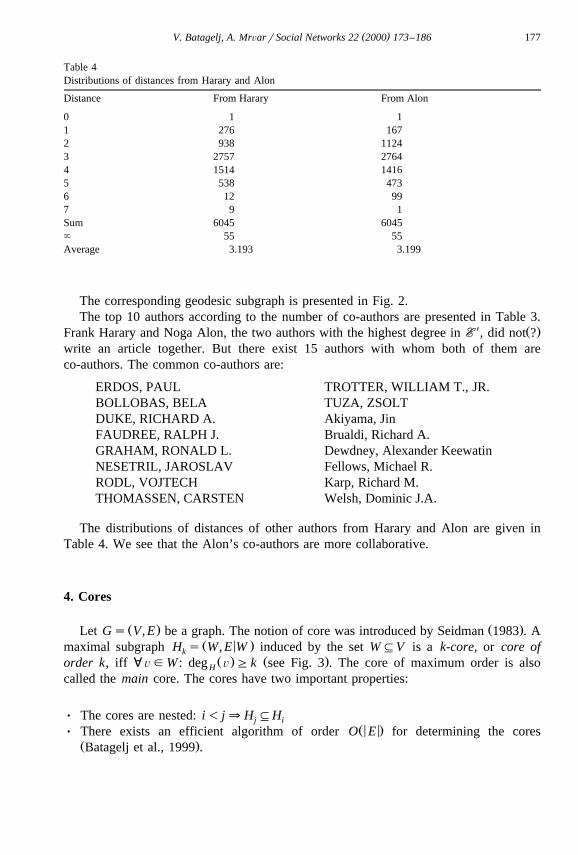
X ŽThere exist 17 connected components in EE . One of them is very large it contains. Ž .6045 authors , others are smaller they contain 12 authors at most, see Fig. 1 .
Fig. 1. Small components.
( )V. Batagelj, A. MrÕarrSocial Networks 22 2000 173–186176
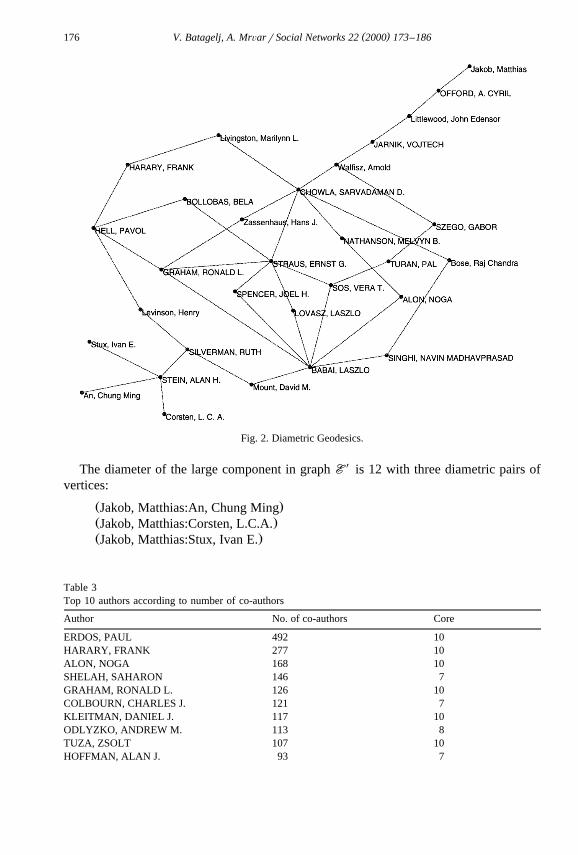
Fig. 2. Diametric Geodesics.
The diameter of the large component in graph EEX is 12 with three diametric pairs of
vertices:
Ž .Jakob, Matthias:An, Chung MingŽ .Jakob, Matthias:Corsten, L.C.A.Ž .Jakob, Matthias:Stux, Ivan E.
Table 3Top 10 authors according to number of co-authors
Author No. of co-authors Core
ERDOS, PAUL 492 10HARARY, FRANK 277 10ALON, NOGA 168 10SHELAH, SAHARON 146 7GRAHAM, RONALD L. 126 10COLBOURN, CHARLES J. 121 7KLEITMAN, DANIEL J. 117 10ODLYZKO, ANDREW M. 113 8TUZA, ZSOLT 107 10HOFFMAN, ALAN J. 93 7
( )V. Batagelj, A. MrÕarrSocial Networks 22 2000 173–186 177
Table 4Distributions of distances from Harary and Alon
Distance From Harary From Alon
0 1 11 276 1672 938 11243 2757 27644 1514 14165 538 4736 12 997 9 1Sum 6045 6045` 55 55Average 3.193 3.199
The corresponding geodesic subgraph is presented in Fig. 2.The top 10 authors according to the number of co-authors are presented in Table 3.
X Ž .Frank Harary and Noga Alon, the two authors with the highest degree in EE , did not ?write an article together. But there exist 15 authors with whom both of them areco-authors. The common co-authors are:
ERDOS, PAUL TROTTER, WILLIAM T., JR.BOLLOBAS, BELA TUZA, ZSOLTDUKE, RICHARD A. Akiyama, JinFAUDREE, RALPH J. Brualdi, Richard A.GRAHAM, RONALD L. Dewdney, Alexander KeewatinNESETRIL, JAROSLAV Fellows, Michael R.RODL, VOJTECH Karp, Richard M.THOMASSEN, CARSTEN Welsh, Dominic J.A.
The distributions of distances of other authors from Harary and Alon are given inTable 4. We see that the Alon’s co-authors are more collaborative.
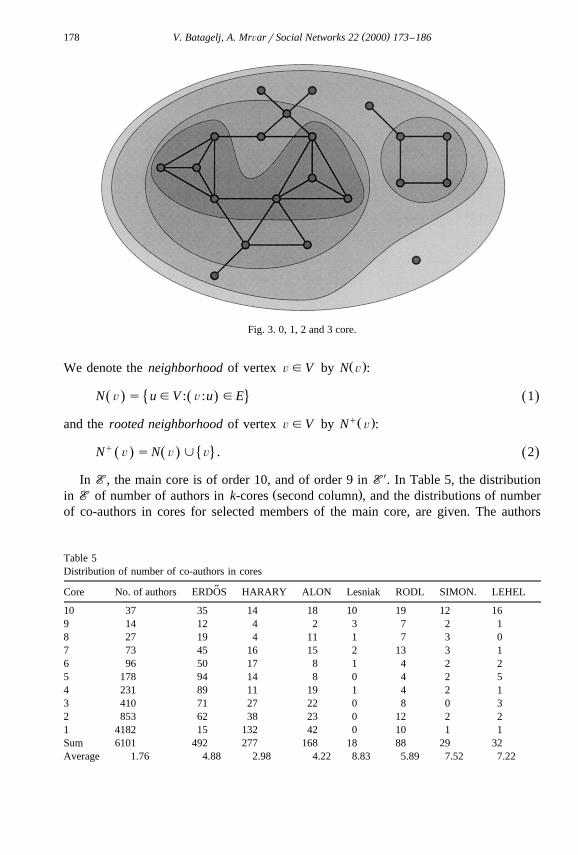
4. Cores
Ž . Ž .Let Gs V, E be a graph. The notion of core was introduced by Seidman 1983 . AŽ < .maximal subgraph H s W, E W induced by the set W:V is a k-core, or core ofk
Ž . Ž .order k, iff ; ÕgW: deg Õ Gk see Fig. 3 . The core of maximum order is alsoH
called the main core. The cores have two important properties:
Ø The cores are nested: i- j´H :Hj iŽ < <.Ø There exists an efficient algorithm of order O E for determining the cores
Ž .Batagelj et al., 1999 .
( )V. Batagelj, A. MrÕarrSocial Networks 22 2000 173–186178
Fig. 3. 0, 1, 2 and 3 core.
Ž .We denote the neighborhood of vertex ÕgV by N Õ :
N Õ s ugV : Õ :u gE 1� 4Ž . Ž . Ž .qŽ .and the rooted neighborhood of vertex ÕgV by N Õ :
q � 4N Õ sN Õ j Õ . 2Ž . Ž . Ž .
In EE, the main core is of order 10, and of order 9 in EEX. In Table 5, the distribution
Ž .in EE of number of authors in k-cores second column , and the distributions of numberof co-authors in cores for selected members of the main core, are given. The authors
Table 5Distribution of number of co-authors in cores
˝Core No. of authors ERDOS HARARY ALON Lesniak RODL SIMON. LEHEL
10 37 35 14 18 10 19 12 169 14 12 4 2 3 7 2 18 27 19 4 11 1 7 3 07 73 45 16 15 2 13 3 16 96 50 17 8 1 4 2 25 178 94 14 8 0 4 2 54 231 89 11 19 1 4 2 13 410 71 27 22 0 8 0 32 853 62 38 23 0 12 2 21 4182 15 132 42 0 10 1 1Sum 6101 492 277 168 18 88 29 32Average 1.76 4.88 2.98 4.22 8.83 5.89 7.52 7.22
( )V. Batagelj, A. MrÕarrSocial Networks 22 2000 173–186 179
Table 6Authors and number of their co-authors in the main core, total number of co-authors, average core and averagedegree of all their co-authors, and their collaborativenessThe authors with the highest values of deg and core are indicated by an asterisk.
Author Co-authors All co-authors core deg coll)ERDOS PAUL 35 492 4.88 24.08 2.05
FAUDREE, RALPH J. 19 51 6.33 38.63 1.58GRAHAM, RONALD L. 19 126 4.94 26.64 2.03RODL, VOJTECH 19 88 5.89 32.53 1.70
) )ALON, NOGA 18 168 4.22 17.63 2.37GYARFAS, ANDRAS 18 41 6.90 40.85 1.45JACOBSON, MICHAEL S. 17 55 5.87 30.60 1.70
)TUZA, ZSOLT 17 107 4.21 22.73 2.38CHUNG, FAN RONG K. 16 81 5.12 30.79 1.95GOULD, RONALD J. 16 37 6.73 35.00 1.49FUREDI, ZOLTAN 16 65 5.95 36.45 1.68
)LEHEL, JENO 16 32 7.22 42.69 1.39SCHELP, RICHARD H. 16 42 6.21 33.12 1.61SPENCER, JOEL H. 16 67 6.10 38.99 1.64
)BURR, STEFAN ANDRUS 15 29 7.14 58.58 1.40SZEMEREDI, ENDRE 15 68 5.87 30.13 1.70
) )HARARY, FRANK 14 277 2.98 9.62 3.36)WEST, DOUGLAS B. 14 81 4.14 20.10 2.42
CHARTRAND, GARY 13 81 5.27 23.33 1.90LOVASZ, LASZLO 13 91 4.74 23.30 2.11NESETRIL, JAROSLAV 13 65 5.31 33.12 1.88PACH, JANOS 13 78 4.88 25.33 2.05BABAI, LASZLO 12 75 4.99 27.32 2.01FRANKL, PETER 12 64 5.41 33.67 1.85
) )SIMONOVITS, MIKLOS 12 29 7.52 50.76 1.33TROTTER, WILLIAM T., JR. 12 54 5.48 39.15 1.82OELLERMANN, ORTRUD R. 11 40 6.63 38.45 1.51SOS, VERA T. 11 37 6.84 47.00 1.46BOLLOBAS, BELA 10 78 4.92 30.10 2.03CHEN, GUANTAO 10 29 5.76 33.83 1.74GODDARD, WAYNE D. 10 48 6.10 29.56 1.64HAJNAL, ANDRAS 10 50 5.74 36.66 1.74
)KLEITMAN, DANIEL J. 10 117 4.03 18.11 2.48)KUBICKA, EWA MARIE 10 19 7.11 64.95 1.41)KUBICKI, GRZEGORZ 10 25 7.08 50.68 1.41
)Lesniak, Linda M. 10 18 8.83 34.89 1.13ROUSSEAU, CECIL CLYDE 10 31 5.10 34.68 1.96
belonging to the main core and some of their characteristics are presented in Table 6,where deg is the average degree of all co-authors.
œ° 0 N Õ s0Ž .~ 1deg Õ s 3Ž . Ž .deg u otherwiseŽ .Ý¢< <N ÕŽ . Ž .ugN Õ
( )V. Batagelj, A. MrÕarrSocial Networks 22 2000 173–186180
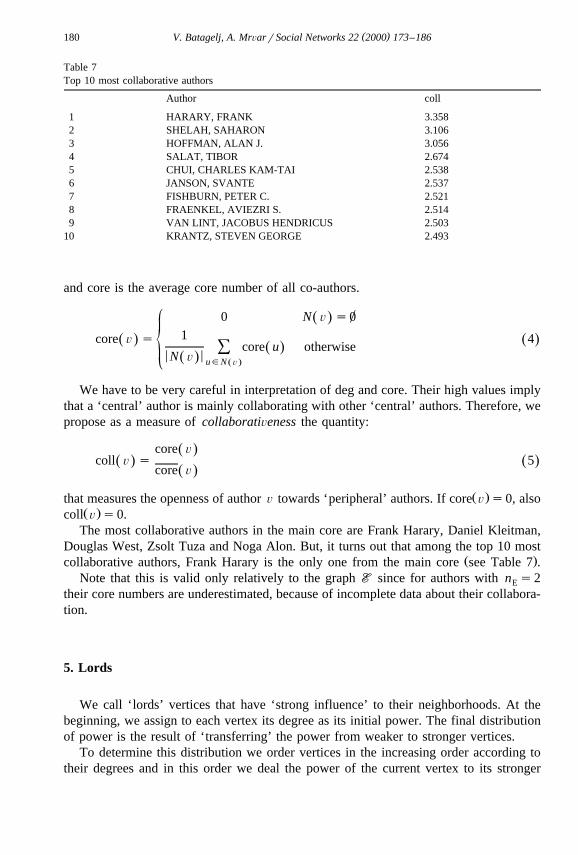
Table 7Top 10 most collaborative authors
Author coll
1 HARARY, FRANK 3.3582 SHELAH, SAHARON 3.1063 HOFFMAN, ALAN J. 3.0564 SALAT, TIBOR 2.6745 CHUI, CHARLES KAM-TAI 2.5386 JANSON, SVANTE 2.5377 FISHBURN, PETER C. 2.5218 FRAENKEL, AVIEZRI S. 2.5149 VAN LINT, JACOBUS HENDRICUS 2.503
10 KRANTZ, STEVEN GEORGE 2.493
and core is the average core number of all co-authors.
œ° 0 N Õ s0Ž .~ 1core Õ s 4Ž . Ž .
core u otherwiseŽ .Ý¢< <N ÕŽ . Ž .ugN Õ
We have to be very careful in interpretation of deg and core. Their high values implythat a ‘central’ author is mainly collaborating with other ‘central’ authors. Therefore, wepropose as a measure of collaboratiÕeness the quantity:
core ÕŽ .coll Õ s 5Ž . Ž .
core ÕŽ .
Ž .that measures the openness of author Õ towards ‘peripheral’ authors. If core Õ s0, alsoŽ .coll Õ s0.
The most collaborative authors in the main core are Frank Harary, Daniel Kleitman,Douglas West, Zsolt Tuza and Noga Alon. But, it turns out that among the top 10 most
Ž .collaborative authors, Frank Harary is the only one from the main core see Table 7 .Note that this is valid only relatively to the graph EE since for authors with n s2E
their core numbers are underestimated, because of incomplete data about their collabora-tion.
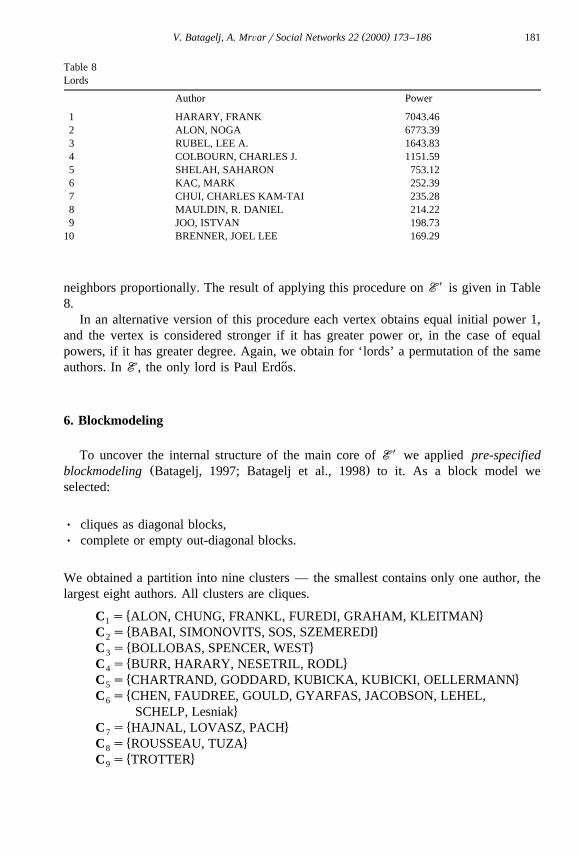
5. Lords
We call ‘lords’ vertices that have ‘strong influence’ to their neighborhoods. At thebeginning, we assign to each vertex its degree as its initial power. The final distributionof power is the result of ‘transferring’ the power from weaker to stronger vertices.
To determine this distribution we order vertices in the increasing order according totheir degrees and in this order we deal the power of the current vertex to its stronger
( )V. Batagelj, A. MrÕarrSocial Networks 22 2000 173–186 181
Table 8Lords
Author Power
1 HARARY, FRANK 7043.462 ALON, NOGA 6773.393 RUBEL, LEE A. 1643.834 COLBOURN, CHARLES J. 1151.595 SHELAH, SAHARON 753.126 KAC, MARK 252.397 CHUI, CHARLES KAM-TAI 235.288 MAULDIN, R. DANIEL 214.229 JOO, ISTVAN 198.73
10 BRENNER, JOEL LEE 169.29
neighbors proportionally. The result of applying this procedure on EEX is given in Table
8.In an alternative version of this procedure each vertex obtains equal initial power 1,
and the vertex is considered stronger if it has greater power or, in the case of equalpowers, if it has greater degree. Again, we obtain for ‘lords’ a permutation of the sameauthors. In EE, the only lord is Paul Erdos.˝
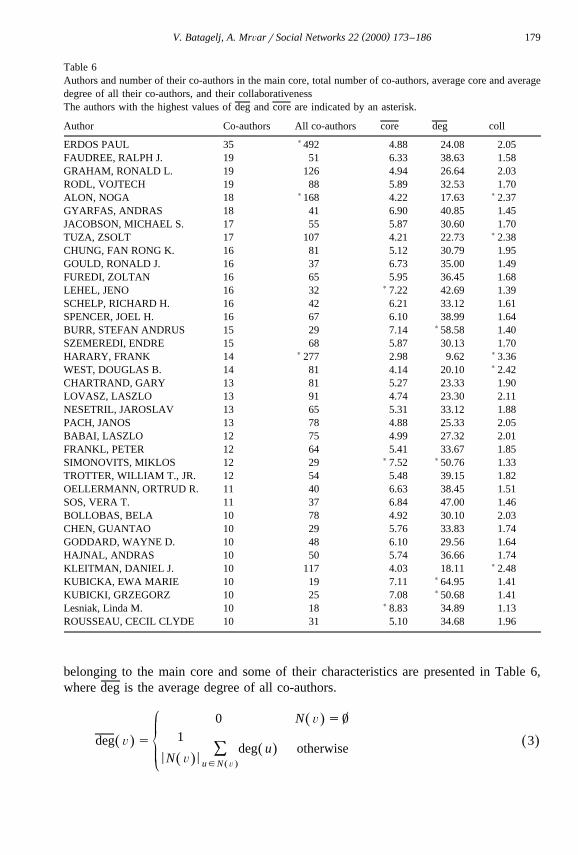
6. Blockmodeling
To uncover the internal structure of the main core of EEX we applied pre-specified
Ž .blockmodeling Batagelj, 1997; Batagelj et al., 1998 to it. As a block model weselected:
Ø cliques as diagonal blocks,Ø complete or empty out-diagonal blocks.
We obtained a partition into nine clusters — the smallest contains only one author, thelargest eight authors. All clusters are cliques.
� 4C s ALON, CHUNG, FRANKL, FUREDI, GRAHAM, KLEITMAN1� 4C s BABAI, SIMONOVITS, SOS, SZEMEREDI2� 4C s BOLLOBAS, SPENCER, WEST3� 4C s BURR, HARARY, NESETRIL, RODL4� 4C s CHARTRAND, GODDARD, KUBICKA, KUBICKI, OELLERMANN5�C s CHEN, FAUDREE, GOULD, GYARFAS, JACOBSON, LEHEL,6
4SCHELP, Lesniak� 4C s HAJNAL, LOVASZ, PACH7� 4C s ROUSSEAU, TUZA8� 4C s TROTTER9
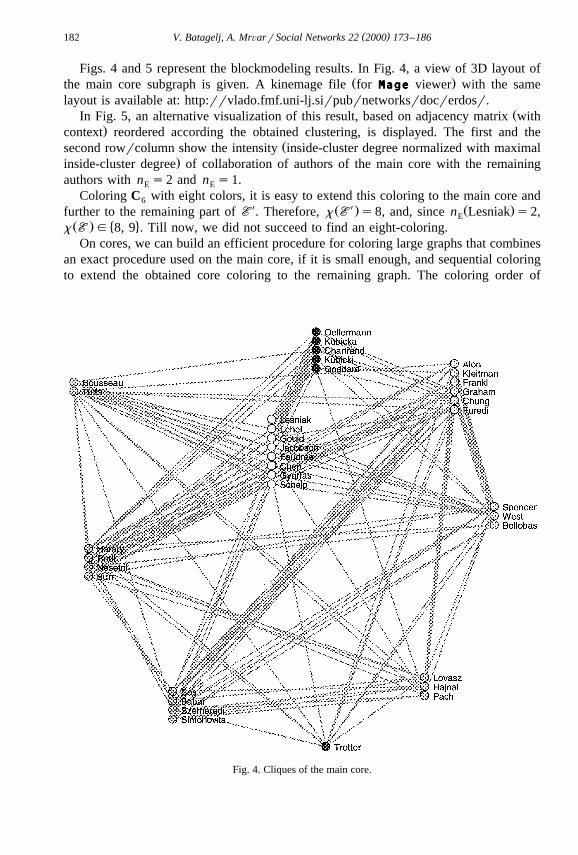
( )V. Batagelj, A. MrÕarrSocial Networks 22 2000 173–186182
Figs. 4 and 5 represent the blockmodeling results. In Fig. 4, a view of 3D layout ofŽ .the main core subgraph is given. A kinemage file for MMMMMaaaaagggggeeeee viewer with the same
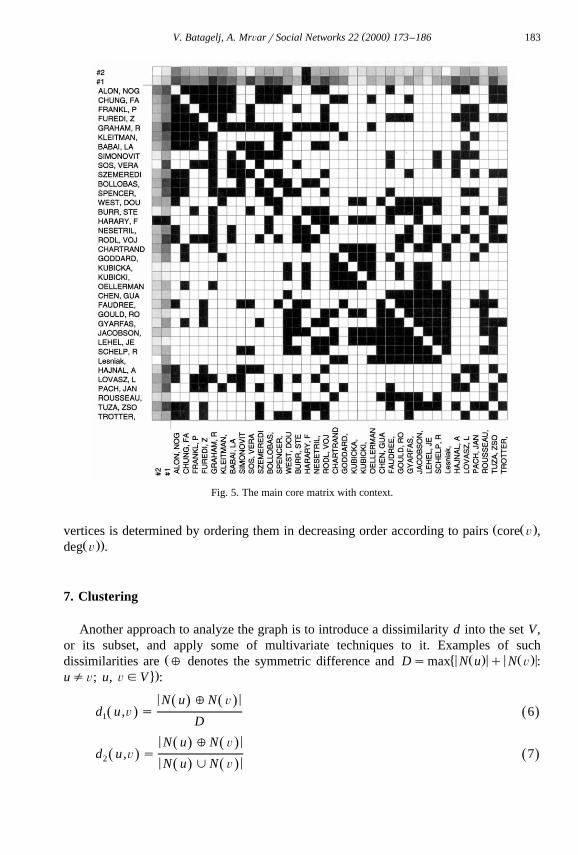
layout is available at: http:rrvlado.fmf.uni-lj.sirpubrnetworksrdocrerdosr.ŽIn Fig. 5, an alternative visualization of this result, based on adjacency matrix with
.context reordered according the obtained clustering, is displayed. The first and theŽsecond rowrcolumn show the intensity inside-cluster degree normalized with maximal
.inside-cluster degree of collaboration of authors of the main core with the remainingauthors with n s2 and n s1.E E
Coloring C with eight colors, it is easy to extend this coloring to the main core and6X Ž X . Ž .further to the remaining part of EE . Therefore, x EE s8, and, since n Lesniak s2,E
Ž . � 4x EE g 8, 9 . Till now, we did not succeed to find an eight-coloring.On cores, we can build an efficient procedure for coloring large graphs that combines
an exact procedure used on the main core, if it is small enough, and sequential coloringto extend the obtained core coloring to the remaining graph. The coloring order of
Fig. 4. Cliques of the main core.
( )V. Batagelj, A. MrÕarrSocial Networks 22 2000 173–186 183
Fig. 5. The main core matrix with context.
Ž Ž .vertices is determined by ordering them in decreasing order according to pairs core Õ ,Ž ..deg Õ .
7. Clustering
Another approach to analyze the graph is to introduce a dissimilarity d into the set V,or its subset, and apply some of multivariate techniques to it. Examples of such
Ž � < Ž . < < Ž . <dissimilarities are [ denotes the symmetric difference and Dsmax N u q N Õ :4.u/Õ; u, ÕgV :
< <N u [N ÕŽ . Ž .d u ,Õ s 6Ž . Ž .1 D
< <N u [N ÕŽ . Ž .d u ,Õ s 7Ž . Ž .2 < <N u jN ÕŽ . Ž .
( )V. Batagelj, A. MrÕarrSocial Networks 22 2000 173–186184
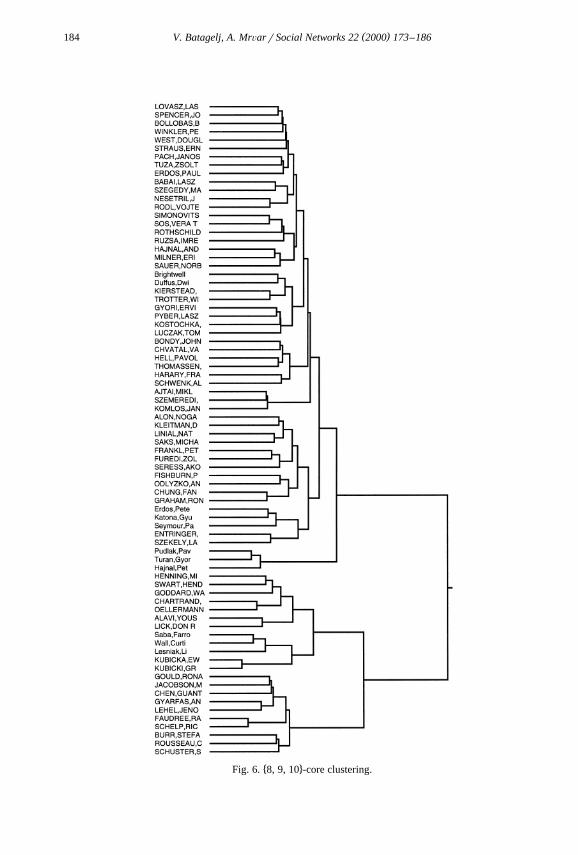
� 4Fig. 6. 8, 9, 10 -core clustering.
( )V. Batagelj, A. MrÕarrSocial Networks 22 2000 173–186 185
< <N u [N ÕŽ . Ž .d u ,Õ s 8Ž . Ž .3 < < < <N u q N ÕŽ . Ž .
< < < <max N u _ N Õ , N Õ _ N uŽ . Ž . Ž . Ž .Ž .d u ,Õ s . 9Ž . Ž .4 < < < <max N u , N ÕŽ . Ž .Ž .
Ž . ŽThese dissimilaries are in fact semi distances known in data analysis some after.transformation ds1ys from similarity s into dissimilarity d as dissimilarities of: d1
— Hamming, Kendall, Sokal-Michner; d — Jaccard; d — Dice, Czekanowski; d —2 3 4Ž .Braun–Blanquet Batagelj and Bren, 1995 .Ž . Ž . Ž .In the case N u sN Õ sØ we set for all four dissimilarities d u,Õ s1. We obtain
a parallel set of dissimilarities dq, dq, dq and dq by replacing in the above definitions1 2 3 4
neigborhoods N with rooted neighborhoods Nq.Groupsrclusters of similar units can be obtained by methods of cluster analysis
Ž . q � 4Gordon, 1981 . We determined d on 8,9,10 -core considering all authors from EE2
and applied hierarchical clustering, Ward’s method to it. Again, because of incompletedata for authors with n s2, their dissimilarities are relative to EE. The obtainedE
Ž .dendrogram clustering tree is given in Fig. 6.
8. Final remarks
In this paper, we presented some possible approaches to analysis of large networksand applied them to the Erdos collaboration graph. Because of incomplete data for˝authors with n s2, the results are valid only for authors with n s1, or they should beE E
interpreted for each group separately.For better interpretation of the obtained results and for further analyses, additional
Žinformation about authors year of birth, subjects of interest, geographic location,. Žnationality, . . . and papers connecting them number of papers, list of MR.categories, . . . would be needed.
Ž .The truncated Erdos collaboration graph in PPPPPaaaaajjjjjeeeeekkkkk format and some files with˝results are available at URL: http:rrvlado.fmf.uni-lj.sirpubrnetworksrdocrerdosr.
This paper is an elaborated version of the talk presented at the Fourth SloveneInternational Conference in Graph Theory, June 28–July 2, 1999, Bled, Slovenia.
Acknowledgements
This work was supported by the Ministry of Science and Technology of Slovenia,Project J1-8532.
References
Batagelj, V., 1997. Notes on blockmodeling. Soc. Networks 19, 143–155.Ž .Batagelj, V., Bren, M., 1995. Comparing resemblance measures. J. Classif. 12 1 , 73–90.
Ž .Batagelj, V., Mrvar, A., 1998. Pajek — a program for large network analysis. Connections 21 2 , 47–57.
( )V. Batagelj, A. MrÕarrSocial Networks 22 2000 173–186186
Batagelj, V., Ferligoj, A., Doreian, P., 1998. Fitting pre-specified blockmodels. In: Hayashi, C., Ohsumi, N.,Ž .Yajima, K., Tanaka, Y., Bock, H., Baba, Y. Eds. , Data Science, Classification, and Related Methods.
Springer-Verlag, Tokyo, pp. 199–206.Batagelj, V., Mrvar, A., Zaversnik, M., 1999. Partitioning approach to visualization of large networks. In:ˇ
Ž .Kratochvil, J. Ed. , GD‘99, LNCS 1731, To appear in Proceedings of Graph Drawing ’99, LNCS 1731,.Springer-Verlag, Berlin, Heidleberg, pp. 90–97.
Gordon, A.D., 1981. Classification. Chapman & Hall, London.Grossman, J.W., 1996. The Erdos Number Project. http:rrwww.oakland.edur;grossmanrerdoshp.html.˝Grossman, J.W., Ion, P.D.F., 1995. On a portion of the well-known collaboration graph. In: Proc. 26th
Ž .Southeastern Inter. Conf. on Combinatorics, Graph Theory and Computing Boca Raton, FL, 1995 . Congr.Numer. vol. 108pp. 129–131.
Seidman, S.B., 1983. Network structure and minimum degree. Soc. Networks 5, 269–287.