Embed Size (px)
Citation preview
Genetic Epidemiology 35 : 85–92 (2011)
Predicting Multiallelic Genes Using Unphased and Flanking SingleNucleotide Polymorphisms
Shuying S. Li,1 Hongwei Wang,1 Anajane Smith,2 Bo Zhang,1 Xinyi (Cindy) Zhang,1 Gary Schoch,2
Daniel Geraghty,2 John A. Hansen,2,3 and Lue Ping Zhao1�
1Division of Public Health Sciences, Fred Hutchinson Cancer Research Center, Seattle, Washington2Division of Clinical Research, Fred Hutchinson Cancer Research Center, Seattle, Washington
3School of Medicine, University of Washington, Seattle, Washington
Recent advances in genotyping technologies have enabled genomewide association studies (GWAS) of many complex traitsincluding autoimmune disease, infectious disease, cancer and heart disease. To facilitate interpretations and establishbiological basis, it could be advantageous to identify alleles of functional genes, beyond just single nucleotidepolymorphisms (SNPs) within or nearby genes. Leslie et al. ([2008] Am J Hum Genet 82:48–56) have proposed anIdentity-by-Decent method (IBD-based) for predicting human leukocyte antigen (HLA) alleles (multiallelic and highlypolymorphic) with SNP data, and predictions have achieved a satisfactory accuracy on the order of 97%. Building upontheir success, we introduce a complementary method for predicting highly polymorphic alleles using unphased SNP data asthe training data set. Due to its generality and flexibility, the new method is readily applicable to large population studies.Applying it to HLA genes in a cohort of 630 healthy individuals as a training set, we constructed predictive models forHLA-A, B, C, DRB1 and DQB1. Then, we performed a validation study with another cohort of 630 healthy individuals, andthe predictive models achieved predictive accuracies for HLA alleles defined at intermediate or high resolution ranging ashigh as (100%, 97%) for HLA-A, (98%, 96%) for B, (98%, 98%) for C, (97%, 96%) for DRB1 and (98%, 95%) for DQB1,respectively. These preliminary results suggest the feasibility of predicting other polymorphic genetic alleles, since HLA lociare almost certainly among most polymorphic genes. Genet. Epidemiol. 35:85–92, 2011. r 2010 Wiley-Liss, Inc.
Key words: GWAS; HCT; HLA; MHC; microsatellite; gene prediction; SNPs
Additional Supporting Information may be found in the online version of this article.Contract grant sponsor: NIH; Contract grant numbers: NIH/NHLBI R01HL087690; NIH/NIMH R01MH084621; NIH/NCI R01CA106320;NIH/NCI R01CA119225.�Correspondence to: Lue Ping Zhao, 1100 Fairview Avenue North, M2-B500, Seattle, WA 98109-1024. E-mail: [email protected] 23 July 2010; Accepted 11 October 2010Published online 31 December 2010 in Wiley Online Library (wileyonlinelibrary.com).DOI: 10.1002/gepi.20549
INTRODUCTION
Recent advances in array-based single nucleotide poly-morphisms (SNPs) genotyping technologies are transform-ing the landscape of genetic research. It becomesincreasingly cost-efficient to genotype hundreds of thou-sands of SNPs for the whole genome in large populationstudies. To an extent, multiple SNPs cover or flank manyfunctionally significant genes, such as human leukocyteantigens (HLAs) within the human major histocompat-ibility complex (MHC). Unlike biallelic SNPs, a typicalHLA locus has multiple alleles and is extremely poly-morphic with many alleles. To minimize the terminologyconfusion, we refer to such a gene locus as a multi-allelicgene (MAG), to differentiate it from bi-allelic SNPs.Through decades of research, many of these HLA allelesare known to have specific immunological functions.Hence, linking SNPs with HLA alleles would enable usto gain further insight into positive discovery with SNPswith supporting evidence for functional validation.
Toward this goal, Leslie et al. [2008] recently developeda statistical method for predicting HLA alleles from SNPs,
based upon an Identity-by-Decent (IBD-based) geneticmodel using phase-resolved genotype data, i.e., fullyphased haplotype data with multiple SNPs [Leslie et al.,2008]. To illustrate their method, they used approximately300 chromosomes as a training set, and built predictivemodels for HLA alleles, HLA-A, B, C, DRB1 and DQB1using SNP data from the Affymetrix 500K GeneChip andthe Illumina human NS-12 nonsynonymous SNP genotyp-ing beadchip. Validation results on an independent set ofsamples ranged from 83 to 97%, a remarkable success (seeDiscussion). Their results have an important implication toongoing genetic studies. For example, several recentgenomewide association studies (GWAS), focusing onimmune-mediated diseases, have found very strongassociations with the MHC region [2007; Asano et al.,2009; Hirschfield et al., 2009; Larsen and Alper, 2004;Reveille et al., 2010; Sabeti et al., 2007; Stefansson et al.,2009; Tse et al., 2009]. To assist with the interpretation ofSNP associations and also to pinpoint specific antigens, itwould be of great importance to infer the correspondingHLA alleles and to establish their disease associations.
Realizing the potential value of predicting MAG allelesfrom SNP data, we have developed a complementary method
r 2010 Wiley-Liss, Inc.
for building predictive models, using unphased SNP data asthe training data set. Thus, one can readily gather a muchlarger number of samples, covering many less common MAGalleles. To illustrate the method, we build predictive modelsfor HLA-A, B, C, DRB1 and DQB1 alleles, with a training dataset of 630 healthy unrelated individuals, and then validate thepredictive model on a separate set of 630 healthy unrelatedindividuals. Further, we compare prediction accuracies of ourpredictive models with those of IBD-based method. Weconclude by discussing the strengths and limitations of theproposed method, as well as future improvements.
MATERIALS AND METHODS
STUDY POPULATION
We have recently assembled a cohort of �1,500 patient-donor pairs for a GWAS of hematopoietic cell transplant(HCT) outcome. The normal healthy donor set includes1,260 Caucasians. The entire GWAS cohort was genotypedusing Affymetrix 5.0 human GeneChip.
MHC SNPS AND HLA GENOTYPING
The Affymetrix 5.0 array includes 1,273 SNPs locatedwithin the extended human MHC region spanning approxi-mately 6 MB from position 28 to 34 MB on chromosome 6p[de Bakker et al., 2006]. The intra-MHC region is boundedby the HLA-A locus at the telomeric end and the HLA-DPlocus at the centromeric end, and includes the class IHLA-A, B, C genes, and the class II DRB1 and DQB1 genes[de Bakker et al., 2006]. Historically, HLA antigens were typedby serology. The introduction of DNA-based HLA typing,however, revealed that serology was capable of only anintermediate level of resolution. The majority of the classicalHLA antigens, e.g., HLA-A2, represent distinct families ofalleles that share one or more serologically defined epitopes.The classification and identification of HLA alleles in thisstudy follows the recently published guidelines of the WHOHLA Nomenclature Committee (http://hla.alleles.org/).
Genotyping for the class I HLA-A, B and C genes wasperformed by sequencing exon 2 and 3, and genotypingfor the class II DRB1 and DQB1 genes was performed by acombination of SSOP typing and sequencing of exon 2.
A LIKELIHOOD MODEL
Consider a random sample of N subjects. On eachsubject, we genotype an HLA gene, denoted by hi ¼
_hi€hi,
where the subscript ið¼ 1; 2; . . . ;NÞ denotes the ith subject,each _hi or €hi is an HLA allele, taking one of the categoricalvalues, such as HLA-A�01, A�02, A�03, A�11, etc. (seeSupplementary Table S1 for more alleles at the intermedi-ate resolution) or HLA-A�0101, A�0201, A�0202, etc. (seeSupplementary Table S1 for more alleles at the highresolution). Suppose that on each ith subject, we have mflanking SNPs gi ¼ ð_gi1 €gi1; _gi2 €gi2; . . . ; _gim €gimÞ, where each_gij or €gij takes one of two values as a single SNP allele atthe jth locus. Given the expected local LD among the HLAgene and all SNPs, one naturally depicts their jointdistribution via the following probability function:
fðhi; giÞ ¼ fð_hi€hi; _gi1 €gi1; _gi2 €gi2; . . . ; _gim €gimÞ¼
XOðhi ;giÞ
fð_hi_GiÞfð€hi
€GiÞ;
ð1Þ
where the set Oðhi; giÞ represents all haplotype pairs whosegenotypes are consistent with those observed genotypes(hi,gi), the summation is over all possible haplotypes giventhe observed genotypes (hi,gi), _h _Gi and €hi
€Gi are twoextended haplotypes of HLA gene and SNPs under theHardy-Weinberg equilibrium (HWE), ð _Gi; €GiÞ representstwo haplotypes of observed SNP alleles, and, finally, fð_h _GiÞ
represents the probability of observing the haplotype _h _Gi.Without imposing any additional assumption, the haplo-type probability distribution can be represented by amultinomial distribution, which may be written as:
fð_hi_GiÞ ¼
YhG
PrðhGÞIð_hi_Gi¼hGÞ; ð2Þ
where PrðhGÞ is the haplotype frequency for observing hG,and the indicator function Ið_hi
_Gi ¼ hGÞ equals one if theinside equality is true.
Estimating the haplotype frequency PrðhGÞ is of primaryinterest. To do so, we employ the likelihood method, viamaximizing the following log likelihood function:
l ¼X
i
logX
Oðhi ;giÞ
YhG
PrðhGÞIð_hi_Gi¼hGÞ1Ið€hi
€Gi¼hGÞ
0@
1A; ð3Þ
where the first summation is over all N independentsubjects. Given the double summations, one commonlyused approach to maximize this log likelihood function (3)is via expectation-maximization (EM) algorithm EM[Excoffier and Slatkin, 1995; Hawley and Kidd, 1995].However, when the number of possible haplotypesbecomes fairly large, such as this case, the computationalburden could be prohibitive.
To overcome the computational challenge, we adopt anestimating equation approach, which has been used by usand detailed elsewhere [Li et al., 2003]. Briefly, we used theabove log likelihood function to derive its score estimatingequation by the first derivative with respect to haplotypeprobabilities. Within the score estimating equation, weidentified a covariance matrix component, which requiresa substantial computation, following the likelihood calcu-lation. However, this component could be modified, tosimplify the computational burden, and such a modifica-tion does not invalidate the consistency of estimatedhaplotype probabilities nor negatively impacts the effi-ciency of the estimates. Thus, modifying the scoreestimating equation leads to the formation of the estimat-ing equation which gives rise to valid and efficientestimates of haplotype probabilities [Li et al., 2007].
A PREDICTIVE MODEL
Our goal is to predict HLA alleles, given unphased SNPgenotypes (_g1
€g1; _g2€g2; . . . ; _gm €gm). Using the Bayes’ theorem,
we constructed the following probability calculation:
Prð_h€hj_g1 €g1; _g2 €g2; . . . ; _gm €gmÞ ¼fð_h€h; gÞP_H €H fð _H €H; gÞ
¼
POðh;gÞ
QhG PrðhGÞIð
_h _G¼hGÞ1Ið€h €G¼hGÞ
P_H €H
POðH;gÞ
QhG PrðhGÞIð
_H _G¼hGÞ1Ið €H €G¼hGÞð4Þ
86 Li et al.
Genet. Epidemiol.
where the first summation in the denominator is over allpossible genotypes at the HLA locus ( _H €H), the secondsummation is over all possible haplotype pairs that areconsistent to observed genotype data and Pr(hG) is thehaplotype frequency that is estimated from the abovelikelihood function on the training data set.
The above predictive probability takes value from 0 to 1,for all possible HLA allelic pairs under prediction. Thereare two predictive strategies in using the above predictiveprobability (4). The first strategy is to compute predictiveprobabilities for all possible HLA genotypes. The pre-dicted HLA genotype is chosen to be the one that has thehighest predictive probability, regardless of its value. Thisstrategy would always lead to a HLA genotype prediction,i.e., the call rate is 100%. One potential downside to thisstrategy is that best predictive probability may still take avery small value, given a large number of alleles at HLAloci. An alternative predictive strategy is to require the bestprobability to exceed call threshold, say CT 5 0.5 or 0.9.For those predictions with unacceptable predictive prob-abilities, HLA genotype is left as an ambiguous prediction,i.e., the call rate may be less than 100%.
SNP SELECTIONS
To build a successful predictive model for a target gene,it is essential to select informative SNPs, while minimizingredundant SNPs in close proximity and also in highlinkage-disequilibrium with each other. Second, one maywant to include certain distant flanking SNPs that shareancestry haplotypes with certain HLA alleles. Third, it isalso important to realize that different SNP haplotypebackgrounds may carry the same HLA alleles, as HLAgenes may undergo faster evolutionary selections [Walshet al., 2003]. Finally, following the parsimonious principle,the predictive model should have the fewest predictiveSNPs possible, without sacrificing predictive accuracy. Totake into account all these considerations, we constructedan objective function, based upon the Akaki criterion(AIC) [Koehler and Murphree, 1988], i.e., penalizing on thenumber of additional haplotype parameters to be esti-mated, when adding each SNP to the predictive model.The resulting objective function may be written as:
Q ¼ �X
i
log
POðhi ;giÞ
QhG PrðhGÞIð
_hi_Gi¼hGÞ1Ið€hi
€Gi¼hGÞ
P_H €H
POðH;giÞ
QhG PrðhGÞIð
_H _Gi¼hGÞ1Ið €H €Gi¼hGÞ
0@
1A
1ðm� kÞ ð5Þ
where the first logarithmic term in the above equation isthe negative log likelihood of predictive probabilities givenall SNP genotype data in the training set, and the secondterm equals the difference of the number of haplotypes ofSNP-HLA and the number of HLA alleles (k). Note that thefirst term of the objective function is monotonicallydecreasing with ever increasing number of haplotypeparameters to be estimated due to increasing numbers ofSNPs. This function is penalized by the increasing numberof haplotype parameters to be estimated.
As noted above, given the current chip design, weexpect to include all available SNPs within genes as well asthose SNPs in flanking regions. Since LDs of SNPs andtheir haplotypes with HLA alleles decrease with increas-ing distance, we propose to use a combined forward
selection and backward elimination scheme, starting fromthe HLA locus and gradually adding one SNP at a time.Our selection scheme is summarized as follows:
1. Include all SNPs (S) within HLA locus (if there are noSNPs genotyped within the HLA locus, include threeflanking SNPs on each side). Calculate the objectivefunction in (5) and denote as Q0.
2. Perform a forward selection by adding the next adjacentSNP to S from the left and calculating the objectivefunction, which is denoted as Q. If QoQ0, add thisSNP to the set of SNPs. Set Q0 5 Q.
3. Perform a backward elimination: if a new SNP addedinto S in step 2, calculate the objective function Q(s)by removing each SNP in S. If min(Q(s)) �Q0, removethe SNP s with the minimum Q(s) from S and resetQ0 5 min(Q(s)).
4. Repeat steps 2 and 3 for the next adjacent SNP to S fromthe right side of HLA locus.
5. Repeat steps 2–4 until the pre-set boundary on bothsides is reached.
6. Determine the boundary via evaluating the objectivefunctions with varying sizes of the flanking region,from 5 to 400 kB, and choose the boundary size suchthat the objective function approaches a ‘‘minimum’’value in the objective function.
MISSING SNP GENOTYPE DATA
Despite the ever-improving genotyping technologies,SNP genotype data may still be untyped for a proportionof individuals. When the percentage of missing data islarge, say, over 5% across all samples per SNP or 5% acrossall SNPs per individual, the corresponding SNP or sampleis best to be excluded from the training/validation sets,due to the quality concern. For the remaining SNPs orsamples, we propose to generalize the likelihood method(3) and (5) by allowing missing genotype data. Themissing mechanism is assumed to be missing at random[Efron, 1994]. Under such an assumption, we can addanother level summation over missing genotype, when-ever a SNP genotype is missing.
PREDICTIVE MODEL VALIDATION
Upon the completion of the model training process, wecan assemble a list of selected SNPs for each HLA gene,together with their haplotypes (hG) and frequenciesPr(hG) as the estimated haplotype distributions for thetarget population. Now to predict HLA allele pairs (_h€h)given an array of any genotypes at selected SNP loci(_g1€g1; _g2
€g2; . . . ; _gm €gm), one can compute the predictiveprobability via Equation (4). Once an HLA genotype ispredicted, one can thus compare the predicted HLAgenotype (_h
p €hp) with the observed HLA genotype (_h
o €ho).
We propose an ‘‘accuracy’’ index to measure the number ofalleles that are correctly predicted, i.e., for an individual,the accuracy takes a value of 0, 0.5 and 1.0, for completelywrong prediction, correctly predicting one allele, andcorrectly predicting both alleles, respectively.
RESULTS
We used 630 individuals in the training set to build HLApredictive models, and an independent set of 630
87Predicting Multiallelic Genes with SNPs
Genet. Epidemiol.
individuals for validating predictive models for the HLA-A,B, C, DRB1 and DQB1 genes. In the training set, high-resolution allele level data for HLA-A, B, C and DRB1 isavailable for all 630 individuals and 622 individuals havehigh-resolution data available for DQB1. In the validationset, high-resolution allele level data for HLA-A, B, C andDRB1 is available for all 630 individuals and 578 indivi-duals have high-resolution allele level data available forDQB1. When building predictive models for intermediatelevel resolution, we collapsed the high-resolution allelenomenclature to the intermediate resolution, i.e., antigenequivalency. Allelic frequencies for HLA-A, B, C, DRB1 andDQB1, in training and validation sets, are listed in thesupplementary tables (intermediate resolution in Table S1and high resolution in Table S2).
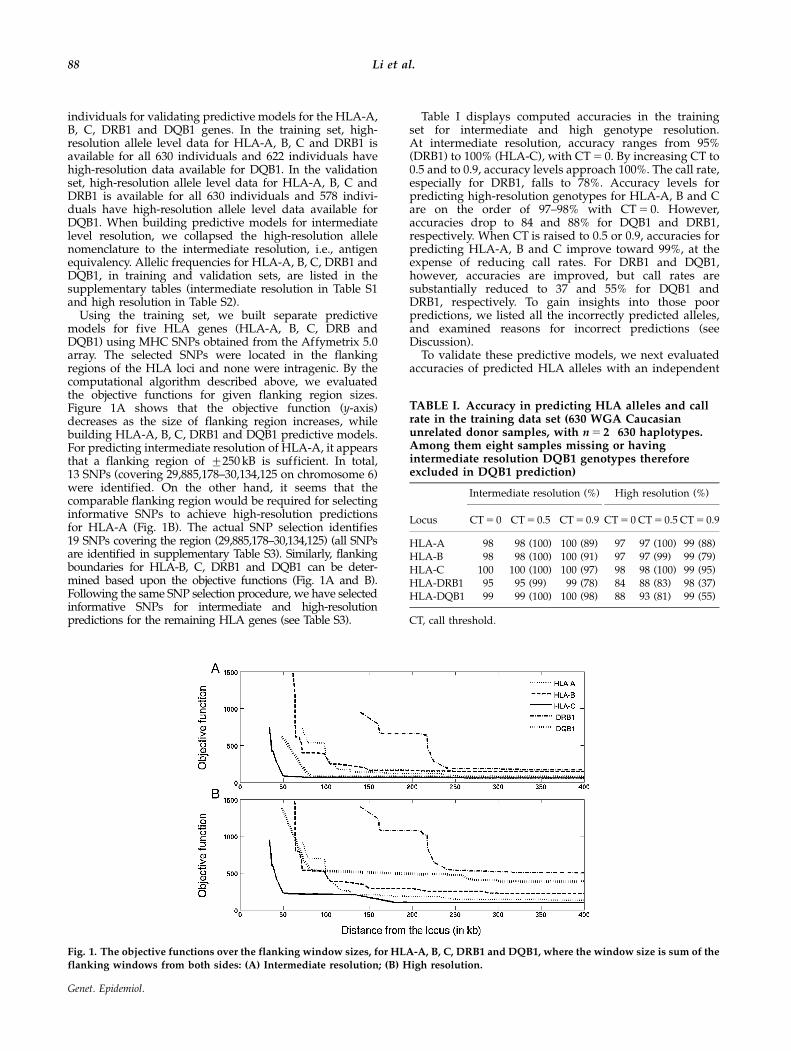
Using the training set, we built separate predictivemodels for five HLA genes (HLA-A, B, C, DRB andDQB1) using MHC SNPs obtained from the Affymetrix 5.0array. The selected SNPs were located in the flankingregions of the HLA loci and none were intragenic. By thecomputational algorithm described above, we evaluatedthe objective functions for given flanking region sizes.Figure 1A shows that the objective function (y-axis)decreases as the size of flanking region increases, whilebuilding HLA-A, B, C, DRB1 and DQB1 predictive models.For predicting intermediate resolution of HLA-A, it appearsthat a flanking region of 7250 kB is sufficient. In total,13 SNPs (covering 29,885,178–30,134,125 on chromosome 6)were identified. On the other hand, it seems that thecomparable flanking region would be required for selectinginformative SNPs to achieve high-resolution predictionsfor HLA-A (Fig. 1B). The actual SNP selection identifies19 SNPs covering the region (29,885,178–30,134,125) (all SNPsare identified in supplementary Table S3). Similarly, flankingboundaries for HLA-B, C, DRB1 and DQB1 can be deter-mined based upon the objective functions (Fig. 1A and B).Following the same SNP selection procedure, we have selectedinformative SNPs for intermediate and high-resolutionpredictions for the remaining HLA genes (see Table S3).
Table I displays computed accuracies in the trainingset for intermediate and high genotype resolution.At intermediate resolution, accuracy ranges from 95%(DRB1) to 100% (HLA-C), with CT 5 0. By increasing CT to0.5 and to 0.9, accuracy levels approach 100%. The call rate,especially for DRB1, falls to 78%. Accuracy levels forpredicting high-resolution genotypes for HLA-A, B and Care on the order of 97–98% with CT 5 0. However,accuracies drop to 84 and 88% for DQB1 and DRB1,respectively. When CT is raised to 0.5 or 0.9, accuracies forpredicting HLA-A, B and C improve toward 99%, at theexpense of reducing call rates. For DRB1 and DQB1,however, accuracies are improved, but call rates aresubstantially reduced to 37 and 55% for DQB1 andDRB1, respectively. To gain insights into those poorpredictions, we listed all the incorrectly predicted alleles,and examined reasons for incorrect predictions (seeDiscussion).
To validate these predictive models, we next evaluatedaccuracies of predicted HLA alleles with an independent
Fig. 1. The objective functions over the flanking window sizes, for HLA-A, B, C, DRB1 and DQB1, where the window size is sum of the
flanking windows from both sides: (A) Intermediate resolution; (B) High resolution.
TABLE I. Accuracy in predicting HLA alleles and callrate in the training data set (630 WGA Caucasianunrelated donor samples, with n 5 2�630 haplotypes.Among them eight samples missing or havingintermediate resolution DQB1 genotypes thereforeexcluded in DQB1 prediction)
Intermediate resolution (%) High resolution (%)
Locus CT 5 0 CT 5 0.5 CT 5 0.9 CT 5 0 CT 5 0.5 CT 5 0.9
HLA-A 98 98 (100) 100 (89) 97 97 (100) 99 (88)HLA-B 98 98 (100) 100 (91) 97 97 (99) 99 (79)HLA-C 100 100 (100) 100 (97) 98 98 (100) 99 (95)HLA-DRB1 95 95 (99) 99 (78) 84 88 (83) 98 (37)HLA-DQB1 99 99 (100) 100 (98) 88 93 (81) 99 (55)
CT, call threshold.
88 Li et al.
Genet. Epidemiol.
validation data set. For predicting genotypes at intermedi-ate resolution, accuracies range from 93 to 98%, withCT 5 0 (Table II). By raising CT to 0.5 or 0.9, accuracies areuniformly increased, at the expense of reduced and callrate, resulting in accuracies ranging from 97% (HLA-C) to100% (HLA-A). In contrast, with high-resolution calls,patterns of accuracies largely remain, with minor drops inaccuracies. Notably, accuracies for HLA-DRB1 and HLA-DQB1 are particularly problematic, with accuracies of 79and 83%. Accuracies improve to 96 and 95%, once the CTis raised to 0.9.
DISCUSSION
In this manuscript, we have described a generalmethodology for building predictive models for MAGalleles with multiple flanking SNP genotypes. The keyidea underlying this methodology is to build extendedhaplotype structures of SNPs and target genes in thetraining set, and then select a minimal but informative setof SNPs for the polymorphic alleles of the gene. Basedupon these results, one can compute predictive probabil-ities for all possible MAG alleles, given SNP genotypedata. We have illustrated the model building exercise forpredicting HLA alleles, and resulted predictive modelshave very respectable accuracies in the validation study.
As noted above, our intent of developing this methodol-ogy goes beyond its valuable application to predictingHLA genes. An immediate application is to predictmicrosatellite (MS) marker genotypes, from SNP geno-types. MS markers are traditionally used in geneticresearch, from linkage to association analysis. In compar-ison with SNPs, MS markers have multiple alleles, whichare typically fewer than HLA genes, and are thus moreinformative for many genetic analyses. However, genotyp-ing cost of MS markers is much higher than genotypingSNPs per locus. One possibility is to build a SNP-MSconversion table, so that SNP genotype data may beinterpretable via MS markers. Another application of thismethodology is to predict full sequence variants fromSNPs. Despite the advances in sequencing technologies,the cost of sequencing genes or genetic regions onhundreds or thousands of subjects remains high for thenext few years. One strategy moving forward is to utilizewell-categorized sequence data, such as those from the1000 Genome Project (http://www.1000genomes.org), asthe training set, and to code pertinent sequence variants
(nucleotide variants, insertions/deletions, structural var-iants) as different alleles. Based upon SNP data fromHapMap project (http://hapmap.ncbi.nlm.nih.gov), onecan train predictive models of interest.
Despite achieving prediction accuracies ranging be-tween 95 and 98%, these predictions are not perfect. Herewe discuss three factors that may contribute to theseimperfect predictions. The first factor is associated withthe uninformative prediction with more than one HLAallele on a SNP single haplotype, as noted above. Forexample, for HLA-A allele ‘‘25’’ (intermediate resolution),its 22 predictions are incorrect, since the predicted allele isthe allele ‘‘26’’ (Table S1). Further investigation suggestedthat the haplotype of selected SNPs carries both allele ‘‘25’’and ‘‘26’’. Since the allele ‘‘26’’ has higher allelic frequency(n 5 42) than allele ‘‘25’’ (n 5 22) in the training set(Table S1), the predictive probability always favors theallele ‘‘26’’ (64%) as oppose to the allele ‘‘25’’ (36%).In HLA literature [Madrigal et al., 1993], HLA-A25 andA26 share a common serological epitope designatedHLA-A10. Prior phylogenetic analyses of the HLA-A locusbased on allele sequence shows that A10 is one of the majorbranches of the HLA-A family tree. A10 is ‘‘old’’, while A25and A26 are ‘‘young’’. Therefore, unless such ‘‘young SNPs’’are included in our training set, it is unrealistic to expectcorrect predictions of less frequent allele ‘‘HLA-A�25’’.In the absence of such ‘‘young SNPs’’ for practice, one maycombine these two alleles into a composite allele (25/26).If such composite allele were introduced, the predictiveaccuracy would be noticeably improved by a couple ofpercentage points. Similar observations and remedies can bemade for several other alleles in HLA genes. To improve theresolution for those ambiguous alleles, it is prudent tointroduce additional SNPs, especially those within genes.
The second factor that may contribute to imperfectpredictions is the stringency in making the prediction.Consider the high-resolution HLA-B predictions (Table II).In the training set, the accuracy equals 97, 97 and 99%,with CT 5 0, 0.5 and 0.9, respectively. By raising CT, theprediction accuracy improves. It becomes more obviousfor the validation data set, where the accuracy improvesfrom 93%, to 94% and to 96% with the increasing CT.
The third factor contributing to imperfect prediction isthat some HLA alleles are rare, being observed less thanthree times in the training set. For example, for HLA-Alocus, the allele ‘‘69’’ is completely absent in the trainingset, and is present twice in the validation data set. Giventhe rarity, it is probably unrealistic to expect accuratepredictions in such cases, as noted as the second limitwithin the current prediction model (probably true formost prediction models). Again, if incorrect predictions onsuch alleles were excluded, the resulting accuracies of ourpredictions would be improved further.
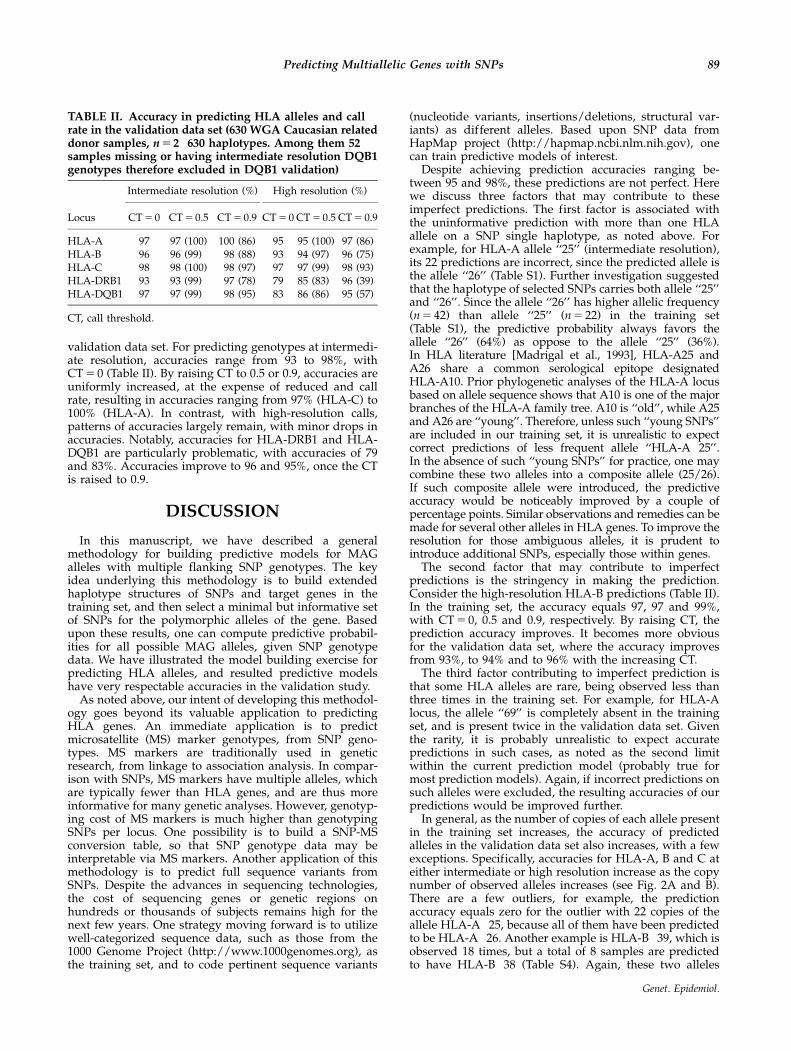
In general, as the number of copies of each allele presentin the training set increases, the accuracy of predictedalleles in the validation data set also increases, with a fewexceptions. Specifically, accuracies for HLA-A, B and C ateither intermediate or high resolution increase as the copynumber of observed alleles increases (see Fig. 2A and B).There are a few outliers, for example, the predictionaccuracy equals zero for the outlier with 22 copies of theallele HLA-A�25, because all of them have been predictedto be HLA-A�26. Another example is HLA-B�39, which isobserved 18 times, but a total of 8 samples are predictedto have HLA-B�38 (Table S4). Again, these two alleles
TABLE II. Accuracy in predicting HLA alleles and callrate in the validation data set (630 WGA Caucasian relateddonor samples, n 5 2�630 haplotypes. Among them 52samples missing or having intermediate resolution DQB1genotypes therefore excluded in DQB1 validation)
Intermediate resolution (%) High resolution (%)
Locus CT 5 0 CT 5 0.5 CT 5 0.9 CT 5 0 CT 5 0.5 CT 5 0.9
HLA-A 97 97 (100) 100 (86) 95 95 (100) 97 (86)HLA-B 96 96 (99) 98 (88) 93 94 (97) 96 (75)HLA-C 98 98 (100) 98 (97) 97 97 (99) 98 (93)HLA-DRB1 93 93 (99) 97 (78) 79 85 (83) 96 (39)HLA-DQB1 97 97 (99) 98 (95) 83 86 (86) 95 (57)
CT, call threshold.
89Predicting Multiallelic Genes with SNPs
Genet. Epidemiol.
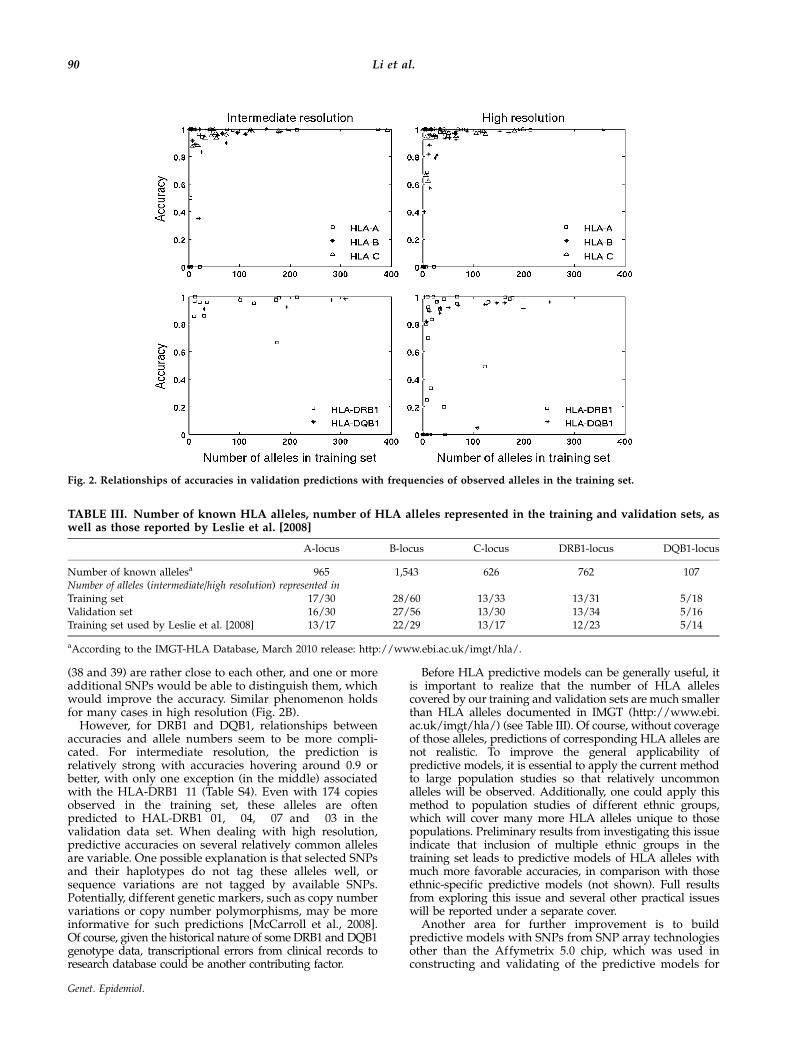
(38 and 39) are rather close to each other, and one or moreadditional SNPs would be able to distinguish them, whichwould improve the accuracy. Similar phenomenon holdsfor many cases in high resolution (Fig. 2B).
However, for DRB1 and DQB1, relationships betweenaccuracies and allele numbers seem to be more compli-cated. For intermediate resolution, the prediction isrelatively strong with accuracies hovering around 0.9 orbetter, with only one exception (in the middle) associatedwith the HLA-DRB1�11 (Table S4). Even with 174 copiesobserved in the training set, these alleles are oftenpredicted to HAL-DRB1�01, �04, �07 and �03 in thevalidation data set. When dealing with high resolution,predictive accuracies on several relatively common allelesare variable. One possible explanation is that selected SNPsand their haplotypes do not tag these alleles well, orsequence variations are not tagged by available SNPs.Potentially, different genetic markers, such as copy numbervariations or copy number polymorphisms, may be moreinformative for such predictions [McCarroll et al., 2008].Of course, given the historical nature of some DRB1 and DQB1genotype data, transcriptional errors from clinical records toresearch database could be another contributing factor.
Before HLA predictive models can be generally useful, itis important to realize that the number of HLA allelescovered by our training and validation sets are much smallerthan HLA alleles documented in IMGT (http://www.ebi.ac.uk/imgt/hla/) (see Table III). Of course, without coverageof those alleles, predictions of corresponding HLA alleles arenot realistic. To improve the general applicability ofpredictive models, it is essential to apply the current methodto large population studies so that relatively uncommonalleles will be observed. Additionally, one could apply thismethod to population studies of different ethnic groups,which will cover many more HLA alleles unique to thosepopulations. Preliminary results from investigating this issueindicate that inclusion of multiple ethnic groups in thetraining set leads to predictive models of HLA alleles withmuch more favorable accuracies, in comparison with thoseethnic-specific predictive models (not shown). Full resultsfrom exploring this issue and several other practical issueswill be reported under a separate cover.
Another area for further improvement is to buildpredictive models with SNPs from SNP array technologiesother than the Affymetrix 5.0 chip, which was used inconstructing and validating of the predictive models for
Fig. 2. Relationships of accuracies in validation predictions with frequencies of observed alleles in the training set.
TABLE III. Number of known HLA alleles, number of HLA alleles represented in the training and validation sets, aswell as those reported by Leslie et al. [2008]
A-locus B-locus C-locus DRB1-locus DQB1-locus
Number of known allelesa 965 1,543 626 762 107Number of alleles (intermediate/high resolution) represented inTraining set 17/30 28/60 13/33 13/31 5/18Validation set 16/30 27/56 13/30 13/34 5/16Training set used by Leslie et al. [2008] 13/17 22/29 13/17 12/23 5/14
aAccording to the IMGT-HLA Database, March 2010 release: http://www.ebi.ac.uk/imgt/hla/.
90 Li et al.
Genet. Epidemiol.
alleles encoded by five HLA genes. Affymetrix hasproduced several new chips, including SNP array 6.0and Axiom (http://www.affymetrix.com). Illumina, onthe other hand, has 660 W, Omni1, 1 M and customizedMHC chips (http://www.illumina.com/). All these chipshave many more SNPs covering MHC, e.g., Axiom arrayincludes 7,391 SNPs to cover MHC region.
Despite its generality, this method can be furtherextended to incorporate the partially phased genotypedata informed by family data, such as trios, if such data areavailable. When working with highly polymorphicgenes, one often has a collection of family data, so thatrare variants can be unambiguously determined withinfamilies. With family data in place, one typically canobtain partial phase information between SNPs and targetgenes. In such cases, one could incorporate the partialphase information by modifying the log-likelihood func-tion (3) and the objective function (5), to re-write the log-likelihood function to incorporate the family structures, inthe same manner as in our earlier works [Zhao et al., 2007].
We have implemented this new method in MATLAB,and a compiled version is available upon request. Also, tofacilitate predictions of HLA genes from SNPs (for thoseusing Affymetrix 5.0), we have combined the training andvalidation data sets, to select the ‘‘most informative SNPs’’for five HLA genes from our cohort. Figure S1 showsthe objective function with the window sizes, leading tothe choice of flanking regions. Interestingly, the patternsof the objective functions closely resemble those in thetraining set (Fig. 1), which indicates the relative robustnessof choosing the flanking window sizes. Following thesame selection procedure, we obtain a revised list of SNPsfor HLA predictions (Table S6).
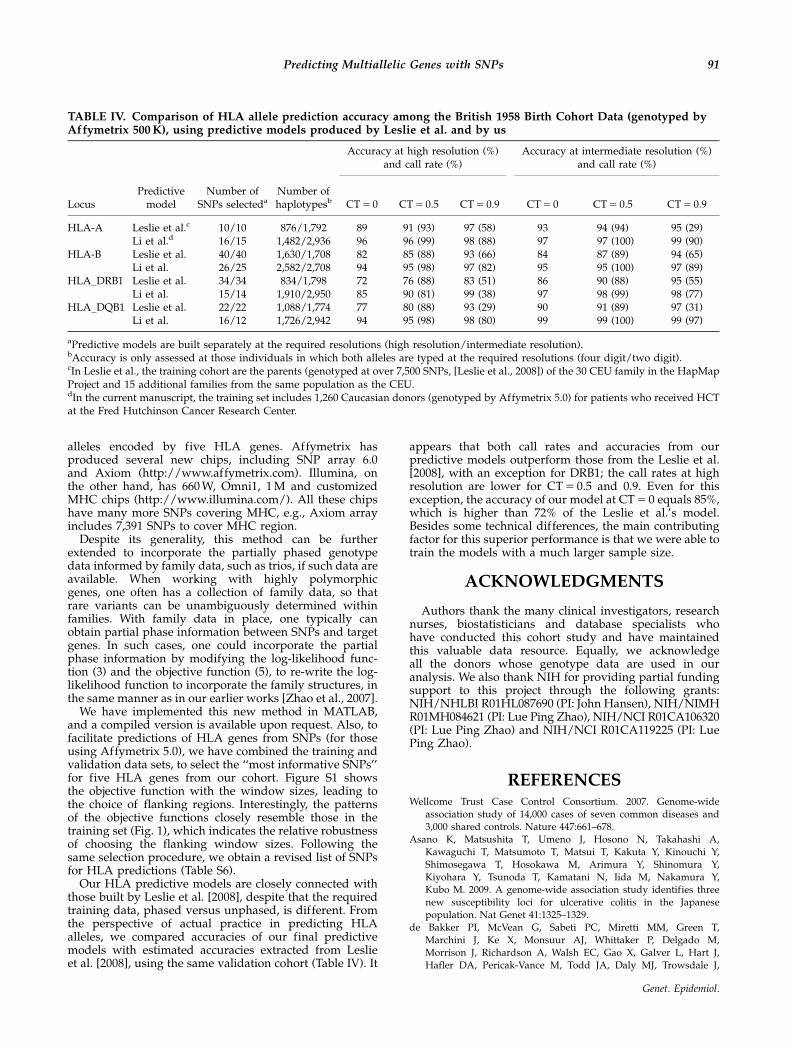
Our HLA predictive models are closely connected withthose built by Leslie et al. [2008], despite that the requiredtraining data, phased versus unphased, is different. Fromthe perspective of actual practice in predicting HLAalleles, we compared accuracies of our final predictivemodels with estimated accuracies extracted from Leslieet al. [2008], using the same validation cohort (Table IV). It
appears that both call rates and accuracies from ourpredictive models outperform those from the Leslie et al.[2008], with an exception for DRB1; the call rates at highresolution are lower for CT 5 0.5 and 0.9. Even for thisexception, the accuracy of our model at CT 5 0 equals 85%,which is higher than 72% of the Leslie et al.’s model.Besides some technical differences, the main contributingfactor for this superior performance is that we were able totrain the models with a much larger sample size.
ACKNOWLEDGMENTS
Authors thank the many clinical investigators, researchnurses, biostatisticians and database specialists whohave conducted this cohort study and have maintainedthis valuable data resource. Equally, we acknowledgeall the donors whose genotype data are used in ouranalysis. We also thank NIH for providing partial fundingsupport to this project through the following grants:NIH/NHLBI R01HL087690 (PI: John Hansen), NIH/NIMHR01MH084621 (PI: Lue Ping Zhao), NIH/NCI R01CA106320(PI: Lue Ping Zhao) and NIH/NCI R01CA119225 (PI: LuePing Zhao).
REFERENCESWellcome Trust Case Control Consortium. 2007. Genome-wide
association study of 14,000 cases of seven common diseases and
3,000 shared controls. Nature 447:661–678.
Asano K, Matsushita T, Umeno J, Hosono N, Takahashi A,
Kawaguchi T, Matsumoto T, Matsui T, Kakuta Y, Kinouchi Y,
Shimosegawa T, Hosokawa M, Arimura Y, Shinomura Y,
Kiyohara Y, Tsunoda T, Kamatani N, Iida M, Nakamura Y,Kubo M. 2009. A genome-wide association study identifies three
new susceptibility loci for ulcerative colitis in the Japanese
population. Nat Genet 41:1325–1329.
de Bakker PI, McVean G, Sabeti PC, Miretti MM, Green T,
Marchini J, Ke X, Monsuur AJ, Whittaker P, Delgado M,
Morrison J, Richardson A, Walsh EC, Gao X, Galver L, Hart J,
Hafler DA, Pericak-Vance M, Todd JA, Daly MJ, Trowsdale J,
TABLE IV. Comparison of HLA allele prediction accuracy among the British 1958 Birth Cohort Data (genotyped byAffymetrix 500 K), using predictive models produced by Leslie et al. and by us
Accuracy at high resolution (%)and call rate (%)
Accuracy at intermediate resolution (%)and call rate (%)
LocusPredictive
modelNumber of
SNPs selectedaNumber ofhaplotypesb CT 5 0 CT 5 0.5 CT 5 0.9 CT 5 0 CT 5 0.5 CT 5 0.9
HLA-A Leslie et al.c 10/10 876/1,792 89 91 (93) 97 (58) 93 94 (94) 95 (29)Li et al.d 16/15 1,482/2,936 96 96 (99) 98 (88) 97 97 (100) 99 (90)
HLA-B Leslie et al. 40/40 1,630/1,708 82 85 (88) 93 (66) 84 87 (89) 94 (65)Li et al. 26/25 2,582/2,708 94 95 (98) 97 (82) 95 95 (100) 97 (89)
HLA_DRB1 Leslie et al. 34/34 834/1,798 72 76 (88) 83 (51) 86 90 (88) 95 (55)Li et al. 15/14 1,910/2,950 85 90 (81) 99 (38) 97 98 (99) 98 (77)
HLA_DQB1 Leslie et al. 22/22 1,088/1,774 77 80 (88) 93 (29) 90 91 (89) 97 (31)Li et al. 16/12 1,726/2,942 94 95 (98) 98 (80) 99 99 (100) 99 (97)
aPredictive models are built separately at the required resolutions (high resolution/intermediate resolution).bAccuracy is only assessed at those individuals in which both alleles are typed at the required resolutions (four digit/two digit).cIn Leslie et al., the training cohort are the parents (genotyped at over 7,500 SNPs, [Leslie et al., 2008]) of the 30 CEU family in the HapMapProject and 15 additional families from the same population as the CEU.dIn the current manuscript, the training set includes 1,260 Caucasian donors (genotyped by Affymetrix 5.0) for patients who received HCTat the Fred Hutchinson Cancer Research Center.
91Predicting Multiallelic Genes with SNPs
Genet. Epidemiol.
Wijmenga C, Vyse TJ, Beck S, Murray SS, Carrington M, Gregory S,
Deloukas P, Rioux JD. 2006. A high-resolution HLA and SNP
haplotype map for disease association studies in the extended
human MHC. Nat Genet 38:1166–1172.
Efron B. 1994. Missing data, imputation, and the bootstrap. J Am Stat
Assoc 89:463–475.
Excoffier L, Slatkin M. 1995. Maximum-likelihood estimation of
molecular haplotype frequencies in a diploid population. Mol Biol
Evol 12:921–927.
Hawley ME, Kidd KK. 1995. HAPLO: a program using the EM
algorithm to estimate the frequencies of multi-site haplotypes.
J Hered 86:409–411.
Hirschfield GM, Liu X, Xu C, Lu Y, Xie G, Gu X, Walker EJ, Jing K,
Juran BD, Mason AL, Myers RP, Peltekian KM, Ghent CN,Coltescu C, Atkinson EJ, Heathcole EJ, Lazaridis KN, Amos CI,
Siminovitch KA. 2009. Primary biliary cirrhosis associated with
HLA, IL12A, and IL12RB2 variants. N Engl J Med 360:2544–2555.
Koehler AB, Murphree ES. 1988. A comparison of the Akaike and
Schwarz criteria for selectin model order. Appl Stat 37:187–195.
Larsen CE, Alper CA. 2004. The genetics of HLA-associated disease.
Curr Opin Immunol 16:660–667.
Leslie S, Donnelly P, McVean G. 2008. A statistical method for predicting
classical HLA alleles from SNP data. Am J Hum Genet 82:48–56.
Li S, Khalid N, Carlson C, Zhao LP. 2003. Estimating haplotype
frequencies and standard errors for multiple single nucleotide
polymorphisms. Biostatistics 4:513–522.
Li SS, Cheng JJ, Zhao LP. 2007. Empirical vs Bayesian approach for
estimating haplotypes from genotypes of unrelated individuals.
BMC Genet 8:2.
Madrigal JA, Hildebrand WH, Belich MP, Benjamin RJ, Little AM,
Zemmour J, Ennis PD, Ward FE, Petzl-Erler ML, du Toit ED,
Parham P. 1993. Structural diversity in the HLA-A10 family ofalleles: correlations with serology. Tissue Antigens 41:72–80.
McCarroll SA, Kuruvilla FG, Korn JM, Cawley S, Nemesh J,
Wysoker A, Shapero MH, de Bakker PI, Maller JB, Kirby A,
Elliott AL, Parkin M, Hubbell E, Webster T, Mei R, Veitch J,
Collins PJ, Handsaker R, Lincoln S, Nizzari M, Blume J, Jones KW,
Rava R, Daly MJ, Gabriel SB, Altshuler D. 2008. Integrated
detection and population-genetic analysis of SNPs and copy
number variation. Nat Genet 40:1166–1174.
Australo-Angio-American Spondyloarthritis Consortium (TASC),
Reveille JD, Sims AM, Danoy P, Evans DM, Leo P, Pointon JJ,
Jin R, Zhou X, Bradbury LA, Appleton LH, Davis JC, Diekman L,
Doan T, Dowling A, Duan R, Duncan EL, Farrar C, Hadler J,
Harvey D, Karaderi T, Mogg R, Pomeroy E, Pryce K, Taylor J,
Savage L, Deloukas P, Kumanduri V, Peltonen L, Ring SM,
Whittaker P, Glazov E, Thomas GP, Maksymowych WP, I
nman RD, Ward MM, Stone MA, Weisman MH, Wordsworth BP,
Brown MA. 2010. Genome-wide association study of ankylosing
spondylitis identifies non-MHC susceptibility loci. Nat Genet42:123–127.
Sabeti PC, Varilly P, Fry B, Lohmueller J, Hostetter E, Cotsapas C,
Xie X, Byrne EH, McCarroll SA, Gaudet R, Schaffner SF,
Lander ES; International HapMap Consortium, Frazer KA,
Ballinger DG, Cox DR, Hinds DA, Stuve LL, Gibbs RA,
Belmont JW, Boudreau A, Hardenbol P, Leal SM, Pasternak S,
Wheeler DA, Willis TD, Yu F, Yang H, Zeng C, Gao Y, Hu H, Hu W,
Li C, Lin W, Liu S, Pan H, Tang X, Wang J, Wang W, Yu J, Zhang B,
Zhang Q, Zhao H, Zhao H, Zhou J, Gabriel SB, Barry R,
Blumenstiel B, Camargo A, Defelice M, Faggart M, Goyette M,
Gupta S, Moore J, Nguyen H, Onofrio RC, Parkin M, Roy J, Stahl E,
Winchester E, Ziaugra L, Altshuler D, Shen Y, Yao Z, Huang W,
Chu X, He Y, Jin L, Liu Y, Shen Y, Sun W, Wang H, Wang Y, Wang Y,
Xiong X, Xu L, Waye MM, Tsui SK, Xue H, Wong JT, Galver LM,
Fan JB, Gunderson K, Murray SS, Oliphant AR, Chee MS,
Montpetit A, Chagnon F, Ferretti V, Leboeuf M, Olivier JF,
Phillips MS, Roumy S, Sallee C, Verner A, Hudson TJ,
Kwok PY, Cai D, Koboldt DC, Miller RD, Pawlikowska L,
Taillon-Miller P, Xiao M, Tsui LC, Mak W, Song YQ, Tam PK,
Nakamura Y, Kawaguchi T, Kitamoto T, Morizono T,
Nagashima A, Ohnishi Y, Sekine A, Tanaka T, Tsunoda T,
Deloukas P, Bird CP, Delgado M, Dermitzakis ET, Gwilliam R,
Hunt S, Morrison J, Powell D, Stranger BE, Whittaker P,
Bentley DR, Daly MJ, de Bakker PI, Barrett J, Chretien YR,
Maller J, McCarroll S, Patterson N, Pe’er I, Price A, Purcell S,
Richter DJ, Sabeti P, Saxena R, Schaffner SF, Sham PC, Varilly P,
Altshuler D, Stein LD, Krishnan L, Smith AV, Tello-Ruiz MK,
Thorisson GA, Chakravarti A, Chen PE, Cutler DJ, Kashuk CS,
Lin S, Abecasis GR, Guan W, Li Y, Munro MM, Qin ZS, Thomas DJ,
McVean G, Auton A, Bottolo L, Cardin N, Eyheramendy S,
Freeman C, Marchini J, Myers S, Spencer C, Stephens M,
Donnelly P, Cardon LR, Clarke G, Evans DM, Morris AP,Weir BS, Tsunoda T, Johnson TA, Mullikin JC, Sherry ST,
Feolo M, Skol A, Zhang H, Zeng C, Zhao H, Matsuda I,
Fukushima Y, Macer DR, Suda E, Rotimi CN, Adebamowo CA,
Ajayi I, Aniagwu T, Marshall PA, Nkwodimmah C, Royal CD,
Leppert MF, Dixon M, Peiffer A, Qiu R, Kent A, Kato K,
Niikawa N, Adewole IF, Knoppers BM, Foster MW, Clayton EW,
Watkin J, Gibbs RA, Belmont JW, Muzny D, Nazareth L,
Sodergren E, Weinstock GM, Wheeler DA, Yakub I, Gabriel SB,
Onofrio RC, Richter DJ, Ziaugra L, Birren BW, Daly MJ,
Altshuler D, Wilson RK, Fulton LL, Rogers J, Burton J,
Carter NP, Clee CM, Griffiths M, Jones MC, McLay K,
Plumb RW, Ross MT, Sims SK, Willey DL, Chen Z, Han H,
Kang L, Godbout M, Wallenburg JC, L’Archeveque P, Bellemare G,
Saeki K, Wang H, An D, Fu H, Li Q, Wang Z, Wang R, Holden AL,
Brooks LD, McEwen JE, Guyer MS, Wang VO, Peterson JL, Shi M,
Spiegel L, Sung LM, Zacharia LF, Collins FS, Kennedy K,
Jamieson R, Stewart J. 2007. Genome-wide detection and char-
acterization of positive selection in human populations. Nature449:913–918.
Stefansson H, Ophoff RA, Steinberg S, Andreassen OA, Cichon S,
Rujescu D, Werge T, Pietilainen OP, Mors O, Mortensen PB,
Sigurdsson E, Gustafsson O, Nyegaard M, Tuulio-Henriksson A,
Ingason A, Hansen T, Suvisaari J, Lonnqvist J, Paunio T,
Børglum AD, Hartmann A, Fink-Jensen A, Nordentoft M,
Hougaard D, Norgaard-Pedersen B, Bottcher Y, Olesen J,
Breuer R, Moller HJ, Giegling I, Rasmussen HB, Timm S,
Mattheisen M, Bitter I, Rethelyi JM, Magnusdottir BB,
Sigmundsson T, Olason P, Masson G, Gulcher JR, Haraldsson M,
Fossdal R, Thorgeirsson TE, Thorsteinsdottir U, Ruggeri M,
Tosato S, Franke B, Strengman E, Kiemeney LA; Genetic Risk
and Outcome in Psychosis (GROUP), Melle I, Djurovic S,
Abramova L, Kaleda V, Sanjuan J, de Frutos R, Bramon E,
Vassos E, Fraser G, Ettinger U, Picchioni M, Walker N,
Toulopoulou T, Need AC, Ge D, Yoon JL, Shianna KV,
Freimer NB, Cantor RM, Murray R, Kong A, Golimbet V,
Carracedo A, Arango C, Costas J, Jonsson EG, Terenius L,Agartz I, Petursson H, Nothen MM, Rietschel M, Matthews PM,
Muglia P, Peltonen L, St Clair D, Goldstein DB, Stefansson K,
Collier DA. 2009. Common variants conferring risk of schizo-
phrenia. Nature 460:744–747.
Tse KP, Su WH, Chang KP, Tsang NM, Yu CJ, Tang P, See LC, Hsueh C,
Yang ML, Hao SP, Li HY, Wang MH, Liao LP, Chen LC, Lin SR,
Jorgensen TJ, Chang YS, Shugart YY. 2009. Genome-wide associa-
tion study reveals multiple nasopharyngeal carcinoma-associated
loci within the HLA region at chromosome 6p21.3. Am J Hum
Genet 85:194–203.
Walsh EC, Mather KA, Schaffner SF, Farwell L, Daly MJ, Patterson N,
Cullen M, Carrington M, Bugawan TL, Erlich H, Campbell J,
Barrett J, Miller K, Thomson G, Lander ES, Rioux JD. 2003. An
integrated haplotype map of the human major histocompatibility
complex. Am J Hum Genet 73:580–590.
Zhao LP, Li SS, Shen F. 2007. A haplotype-linkage analysis method for
estimating recombination rates using dense SNP trio data. Genet
Epidemiol 31:154–172.
92 Li et al.
Genet. Epidemiol.