Embed Size (px)
Citation preview
com
ment
reviews
reports
deposited research
refereed researchinteractio
nsinfo
rmatio
n
Open Access2006Guimarãeset al.Volume 7, Issue 11, Article R104MethodPredicting domain-domain interactions using a parsimony approachKatia S Guimarães*†, Raja Jothi*, Elena Zotenko*‡ and Teresa M Przytycka*
Addresses: *National Center for Biotechnology Information, National Library of Medicine, National Institutes of Health, Bethesda, MD 20894, USA. †Center of Informatics, Federal University of Pernambuco, Recife, PE 50732, Brazil. ‡Department of Computer Science, University of Maryland, College Park, MD 20742, USA.
Correspondence: Teresa M Przytycka. Email: [email protected]
© 2006 Guimarães et al; licensee BioMed Central Ltd. This is an open access article distributed under the terms of the Creative Commons Attribution License (http://creativecommons.org/licenses/by/2.0), which permits unrestricted use, distribution, and reproduction in any medium, provided the original work is properly cited.Domain-domain interactions prediction<p>A new parsimony approach for the prediction of domain-domain interactions is presented and demonstrated to provide improvement in prediction coverage and accuracy.</p>
Abstract
We propose a novel approach to predict domain-domain interactions from a protein-proteininteraction network. In our method we apply a parsimony-driven explanation of the network,where the domain interactions are inferred using linear programming optimization, and falsepositives in the protein network are handled by a probabilistic construction. This methodoutperforms previous approaches by a considerable margin. The results indicate that theparsimony principle provides a correct approach for detecting domain-domain contacts.
BackgroundKnowledge about protein interactions helps provide deeperinsights into the functioning of cells. Protein interaction dataare collected from various studies on individual biologicalsystems, and, more recently, through high-throughput exper-iments, such as yeast two-hybrid and tandem affinity purifi-cation followed by mass spectrometry [1-8]. This rapidlygrowing collection of protein-protein interaction data pro-vides a rich, but quite noisy, source of information [9-12], andis being analyzed with increasingly sophisticated computa-tional methods.
Proteins typically contain two or more domains. About two-thirds of proteins in prokaryotes and four-fifths in eukaryotesare multidomain proteins [13]. Interaction between two pro-teins typically involves binding between specific domains,and identifying interacting domain pairs is an important steptowards understanding protein interactions and the evolu-tion of protein-protein interaction networks. Many groupshave contributed computational methods aimed at discover-
ing interacting domain pairs [14-23]. With the exception of[23], they all rely on protein-protein interaction networks.
Many domain-domain interaction prediction methods tie thegoal of predicting domain interactions to the seeminglyrelated goal of predicting protein-protein interactions. Forexample, the Association method [15] scores each domainpair by the ratio of the number of occurrences of a given pairin interacting proteins to the number of independent occur-rences of those domains. This score can be interpreted as theprobability of interaction between the two domains. Severalrelated methods have also been proposed [18,19]. Deng andcolleagues [16] extended this idea further and applied a max-imum likelihood estimation approach to define the probabil-ity of domain-domain interactions. Their expectationmaximization algorithm (EM) computes domain interactionprobabilities that maximize the expectation of observing agiven protein-protein interaction network. Other groups pro-posed alternative methods for this task: linear programming[20], support vector machines [14], and probabilistic networkmodeling [17].
Published: 9 November 2006
Genome Biology 2006, 7:R104 (doi:10.1186/gb-2006-7-11-r104)
Received: 26 June 2006Revised: 29 September 2006Accepted: 9 November 2006
The electronic version of this article is the complete one and can be found online at http://genomebiology.com/2006/7/11/R104
Genome Biology 2006, 7:R104
R104.2 Genome Biology 2006, Volume 7, Issue 11, Article R104 Guimarães et al. http://genomebiology.com/2006/7/11/R104
Nye and colleagues [21] evaluated the correctness of thosedomain-domain interactions predicted by the Associationmethod, the EM method, and their own lowest p valuemethod. For this, they used interacting protein pairs withcrystal structure evidence to test the correctness of the pre-dicted domain interactions. They divided the test set of inter-acting pairs of proteins into groups depending on the numberof potential candidate domain pairs. Interestingly, for thelargest group of protein pairs all methods were outperformedby a Random method, exposing their shortcomings.
More recently, Riley and colleagues [22] introduced a newmethod, called the Domain Pair Exclusion Analysis (DPEA),to predict domain-domain interactions. DPEA is based oncomputing an E-value, which measures the extent of thereduction in the likelihood of the protein-protein interactionsnetwork, caused by disallowing a given domain-domain inter-action. This is assessed by comparing the results of executingan expectation maximization protocol under the assumptionthat all but the given pair of domains can interact. DPEA out-performs the Association and EM methods by a significantmargin in the number of recovered domain-domain interac-tions confirmed by Protein Databank (PDB) [24] crystalstructures.
In this work, we explore an alternative model for predictingdomain-domain interactions. In our approach, we completelydecouple domain-domain interaction prediction from pro-tein-protein interaction prediction. We hypothesize thatinteractions between proteins evolved in a parsimonious wayand that the set of correct domain-domain interactions is wellapproximated by the minimal set of domain interactions nec-essary to justify a given protein-protein interaction network.We refer to our approach as the 'Parsimonious Explanation'(PE) method. We formulate PE as a linear programming opti-mization problem, where each potential domain-domain con-tact is a variable that can receive a value (called the 'linearprogram (LP)-score'), ranging between 0 and 1, and each edgeof the protein-protein interaction network corresponds to onelinear constraint. This formulation allows for a novel way ofhandling the noise (false positives) in the protein interactiondata. Namely, we construct a set of linear programminginstances in a probabilistic fashion, in which the probabilityof including an LP constraint equals the probability withwhich the corresponding protein-protein interaction isassumed to be correct, and average the results to get the LP-score for each pair.
To control for possible over-prediction of interactionsbetween frequently occurring domain pairs, we assign a pro-miscuity versus witnesses (pw)-score to every predicteddomain-domain interaction. The pw-score, derived from twoobservations, measures the confidence in the prediction.First, domain-domain interactions that have many witnesses(interacting pairs of single domain proteins that support it)are more likely to be correct than ones that have a few or no
witnesses. Second, there are promiscuous domain-domaininteractions that are scored high due to the frequency of theirappearance and not to the specific topology of the protein-protein interaction network. In view of these observations,the pw-score formulation rewards domain interactions thathave many witnesses and penalizes promiscuousinteractions.
We assess the performance of our method with two differenttypes of evaluations. Our first evaluation, which is very simi-lar to that done by Riley and colleagues [22], documents thefraction of predictions confirmed to interact (based on PDB[24] crystal structures, as inferred in iPfam [25]). We com-pare the performance of the PE and previous methods byplotting curves of prediction accuracy versus their coverage.This type of evaluation shows that PE outperforms othermethods. We also compare PE directly with DPEA, shown tobe the best among the currently available methods, using thenumber of confirmed interactions among the 3,000 top-scor-ing predictions, separating them into easy and difficult pre-dictions. In the easy category are domain pairs for whichthere is at least one witness. Interacting domain pairs that donot have such direct experimental evidence fall under the dif-ficult category, as they are hard to detect for any method. ThePE method recovers more experimentally confirmed interac-tions in both classes. In particular, in the difficult class, it out-performs DPEA by an order of magnitude.
Our second type of evaluation of the PE method involves find-ing whether or not the predicted domain pairs do, in fact,mediate interactions between specific protein pairs. In otherwords, given a protein-protein interaction, we are interestedin finding whether the highest scoring domain pair betweenthose proteins is, in fact, known to interact. If it does, then weconsider our prediction to be correct. In case of multiple high-est scoring pairs, each one of them is considered in the evalu-ation. This type of 'protein interaction specificity' evaluationhas been used before [21]. For this evaluation, we used onlythose protein-protein interactions containing multipledomain pairs, at least one of which is in the gold standard set.A pair of proteins, P and Q, is said to contain domain pair (x,y) if domain x is present in protein P and domain y is presentin protein Q, or vice versa. In this experiment, the PE methodreached estimated values of 75.3% for positive predictivevalue (PPV) and 76.9% for sensitivity, while DPEA presentedan estimated PPV of 42.5% and sensitivity of 36.9%.
Results and discussionWe applied the PE method on a protein-protein interactiondataset comprising 26,032 interactions underlying 11,403proteins from 69 organisms. This set was constructed by Rileyand colleagues [22] from the Database of Interacting Proteins(DIP) database [26]. Protein domains were annotated usingPfam hidden Markov model (HMM) profiles [27].
Genome Biology 2006, 7:R104
http://genomebiology.com/2006/7/11/R104 Genome Biology 2006, Volume 7, Issue 11, Article R104 Guimarães et al. R104.3
com
ment
reviews
reports
refereed researchdepo
sited researchinteractio
nsinfo
rmatio
n
The PE method assigns a LP-score and a pw-score to eachpotential domain-domain interaction. Intuitively, the LP-score estimates the potential of a given domain pair inexplaining protein interactions, based on the overall goal ofparsimony principle, while the pw-score factors in the influ-ence of the number of occurrences of a pair in the data set,and the number of witnesses present. Potential interactionswhose LP-scores are above a certain threshold and whose pw-scores are below another threshold are predicted to be puta-tive interactions. We model the experimental error (false pos-itives) in the protein-protein interaction network by aprobabilistic construction of the linear program, as describedin Materials and methods.
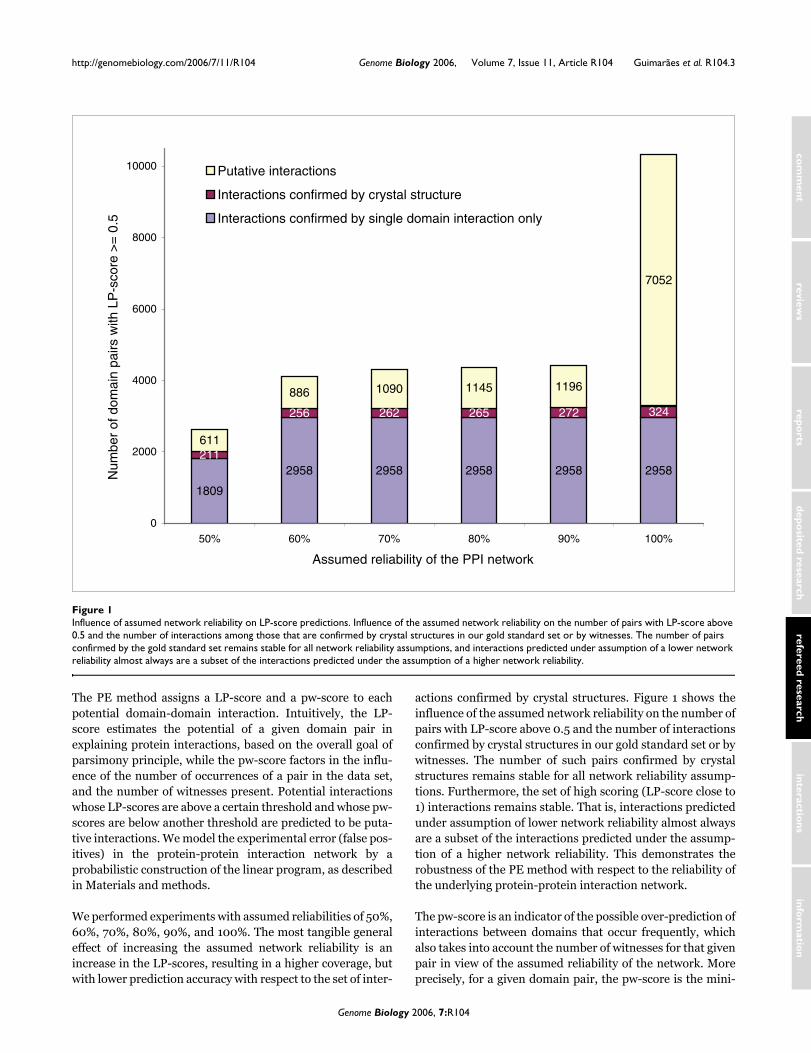
We performed experiments with assumed reliabilities of 50%,60%, 70%, 80%, 90%, and 100%. The most tangible generaleffect of increasing the assumed network reliability is anincrease in the LP-scores, resulting in a higher coverage, butwith lower prediction accuracy with respect to the set of inter-
actions confirmed by crystal structures. Figure 1 shows theinfluence of the assumed network reliability on the number ofpairs with LP-score above 0.5 and the number of interactionsconfirmed by crystal structures in our gold standard set or bywitnesses. The number of such pairs confirmed by crystalstructures remains stable for all network reliability assump-tions. Furthermore, the set of high scoring (LP-score close to1) interactions remains stable. That is, interactions predictedunder assumption of lower network reliability almost alwaysare a subset of the interactions predicted under the assump-tion of a higher network reliability. This demonstrates therobustness of the PE method with respect to the reliability ofthe underlying protein-protein interaction network.
The pw-score is an indicator of the possible over-prediction ofinteractions between domains that occur frequently, whichalso takes into account the number of witnesses for that givenpair in view of the assumed reliability of the network. Moreprecisely, for a given domain pair, the pw-score is the mini-
Influence of assumed network reliability on LP-score predictionsFigure 1Influence of assumed network reliability on LP-score predictions. Influence of the assumed network reliability on the number of pairs with LP-score above 0.5 and the number of interactions among those that are confirmed by crystal structures in our gold standard set or by witnesses. The number of pairs confirmed by the gold standard set remains stable for all network reliability assumptions, and interactions predicted under assumption of a lower network reliability almost always are a subset of the interactions predicted under the assumption of a higher network reliability.
1809
2958 2958 2958 2958 2958211
256 262 265 272 324
611
886 1090 1145 1196
7052
0
2000
4000
6000
8000
10000
50% 60% 70% 80% 90% 100%
Assumed reliability of the PPI network
Num
ber
of d
omai
n pa
irs w
ith L
P-s
core
>=
0.5
Putative interactions
Interactions confirmed by crystal structure
Interactions confirmed by single domain interaction only
Genome Biology 2006, 7:R104
R104.4 Genome Biology 2006, Volume 7, Issue 11, Article R104 Guimarães et al. http://genomebiology.com/2006/7/11/R104
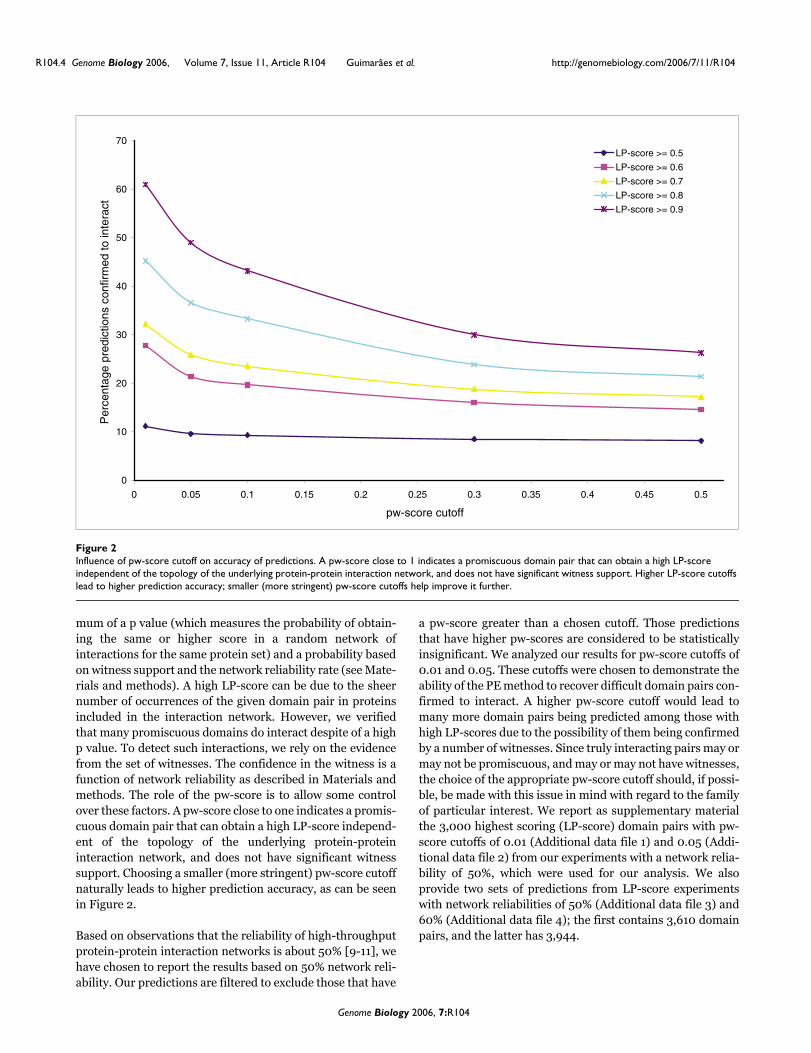
mum of a p value (which measures the probability of obtain-ing the same or higher score in a random network ofinteractions for the same protein set) and a probability basedon witness support and the network reliability rate (see Mate-rials and methods). A high LP-score can be due to the sheernumber of occurrences of the given domain pair in proteinsincluded in the interaction network. However, we verifiedthat many promiscuous domains do interact despite of a highp value. To detect such interactions, we rely on the evidencefrom the set of witnesses. The confidence in the witness is afunction of network reliability as described in Materials andmethods. The role of the pw-score is to allow some controlover these factors. A pw-score close to one indicates a promis-cuous domain pair that can obtain a high LP-score independ-ent of the topology of the underlying protein-proteininteraction network, and does not have significant witnesssupport. Choosing a smaller (more stringent) pw-score cutoffnaturally leads to higher prediction accuracy, as can be seenin Figure 2.
Based on observations that the reliability of high-throughputprotein-protein interaction networks is about 50% [9-11], wehave chosen to report the results based on 50% network reli-ability. Our predictions are filtered to exclude those that have
a pw-score greater than a chosen cutoff. Those predictionsthat have higher pw-scores are considered to be statisticallyinsignificant. We analyzed our results for pw-score cutoffs of0.01 and 0.05. These cutoffs were chosen to demonstrate theability of the PE method to recover difficult domain pairs con-firmed to interact. A higher pw-score cutoff would lead tomany more domain pairs being predicted among those withhigh LP-scores due to the possibility of them being confirmedby a number of witnesses. Since truly interacting pairs may ormay not be promiscuous, and may or may not have witnesses,the choice of the appropriate pw-score cutoff should, if possi-ble, be made with this issue in mind with regard to the familyof particular interest. We report as supplementary materialthe 3,000 highest scoring (LP-score) domain pairs with pw-score cutoffs of 0.01 (Additional data file 1) and 0.05 (Addi-tional data file 2) from our experiments with a network relia-bility of 50%, which were used for our analysis. We alsoprovide two sets of predictions from LP-score experimentswith network reliabilities of 50% (Additional data file 3) and60% (Additional data file 4); the first contains 3,610 domainpairs, and the latter has 3,944.
Influence of pw-score cutoff on accuracy of predictionsFigure 2Influence of pw-score cutoff on accuracy of predictions. A pw-score close to 1 indicates a promiscuous domain pair that can obtain a high LP-score independent of the topology of the underlying protein-protein interaction network, and does not have significant witness support. Higher LP-score cutoffs lead to higher prediction accuracy; smaller (more stringent) pw-score cutoffs help improve it further.
0
10
20
30
40
50
60
70
0 0.05 0.1 0.15 0.2 0.25 0.3 0.35 0.4 0.45 0.5
pw-score cutoff
Per
cent
age
pred
ictio
ns c
onfir
med
to in
tera
ct
LP-score >= 0.5
LP-score >= 0.6
LP-score >= 0.7
LP-score >= 0.8
LP-score >= 0.9
Genome Biology 2006, 7:R104
http://genomebiology.com/2006/7/11/R104 Genome Biology 2006, Volume 7, Issue 11, Article R104 Guimarães et al. R104.5
com
ment
reviews
reports
refereed researchdepo
sited researchinteractio
nsinfo
rmatio
n
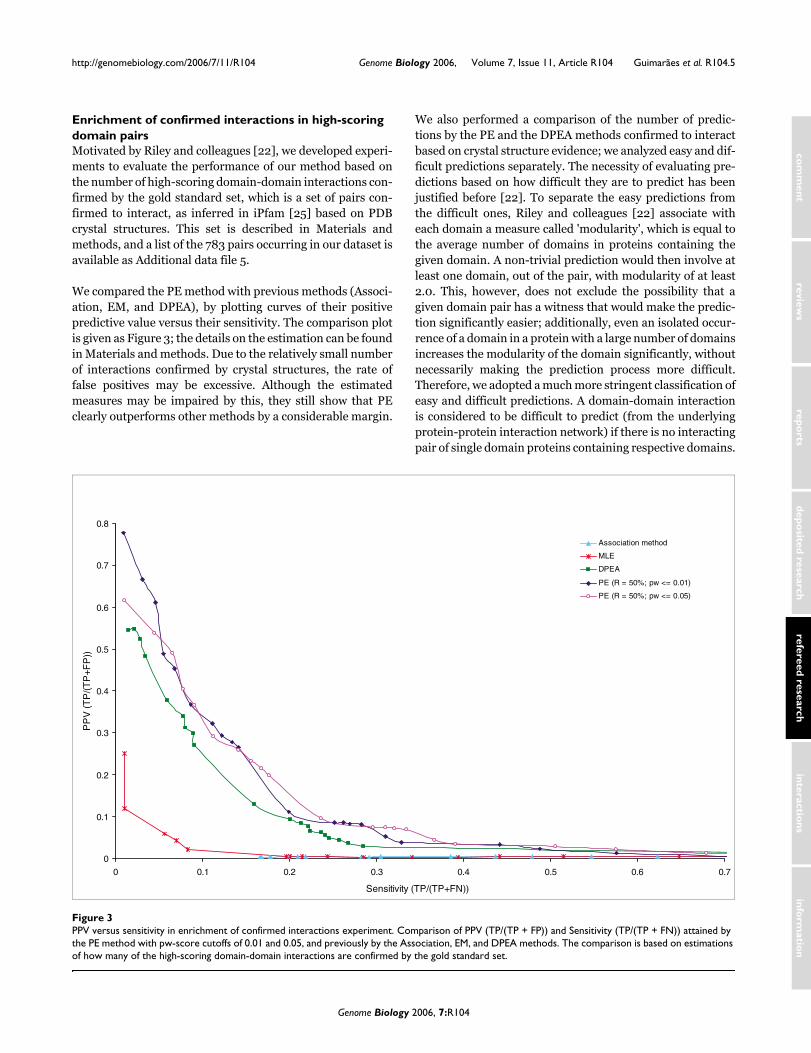
Enrichment of confirmed interactions in high-scoring domain pairsMotivated by Riley and colleagues [22], we developed experi-ments to evaluate the performance of our method based onthe number of high-scoring domain-domain interactions con-firmed by the gold standard set, which is a set of pairs con-firmed to interact, as inferred in iPfam [25] based on PDBcrystal structures. This set is described in Materials andmethods, and a list of the 783 pairs occurring in our dataset isavailable as Additional data file 5.
We compared the PE method with previous methods (Associ-ation, EM, and DPEA), by plotting curves of their positivepredictive value versus their sensitivity. The comparison plotis given as Figure 3; the details on the estimation can be foundin Materials and methods. Due to the relatively small numberof interactions confirmed by crystal structures, the rate offalse positives may be excessive. Although the estimatedmeasures may be impaired by this, they still show that PEclearly outperforms other methods by a considerable margin.
We also performed a comparison of the number of predic-tions by the PE and the DPEA methods confirmed to interactbased on crystal structure evidence; we analyzed easy and dif-ficult predictions separately. The necessity of evaluating pre-dictions based on how difficult they are to predict has beenjustified before [22]. To separate the easy predictions fromthe difficult ones, Riley and colleagues [22] associate witheach domain a measure called 'modularity', which is equal tothe average number of domains in proteins containing thegiven domain. A non-trivial prediction would then involve atleast one domain, out of the pair, with modularity of at least2.0. This, however, does not exclude the possibility that agiven domain pair has a witness that would make the predic-tion significantly easier; additionally, even an isolated occur-rence of a domain in a protein with a large number of domainsincreases the modularity of the domain significantly, withoutnecessarily making the prediction process more difficult.Therefore, we adopted a much more stringent classification ofeasy and difficult predictions. A domain-domain interactionis considered to be difficult to predict (from the underlyingprotein-protein interaction network) if there is no interactingpair of single domain proteins containing respective domains.
PPV versus sensitivity in enrichment of confirmed interactions experimentFigure 3PPV versus sensitivity in enrichment of confirmed interactions experiment. Comparison of PPV (TP/(TP + FP)) and Sensitivity (TP/(TP + FN)) attained by the PE method with pw-score cutoffs of 0.01 and 0.05, and previously by the Association, EM, and DPEA methods. The comparison is based on estimations of how many of the high-scoring domain-domain interactions are confirmed by the gold standard set.
0
0.1
0.2
0.3
0.4
0.5
0.6
0.7
0.8
0 0.1 0.2 0.3 0.4 0.5 0.6 0.7
Sensitivity (TP/(TP+FN))
PP
V (T
P/(T
P+F
P))
Association method
MLE
DPEA
PE (R = 50%; pw <= 0.01)
PE (R = 50%; pw <= 0.05)
Genome Biology 2006, 7:R104
R104.6 Genome Biology 2006, Volume 7, Issue 11, Article R104 Guimarães et al. http://genomebiology.com/2006/7/11/R104
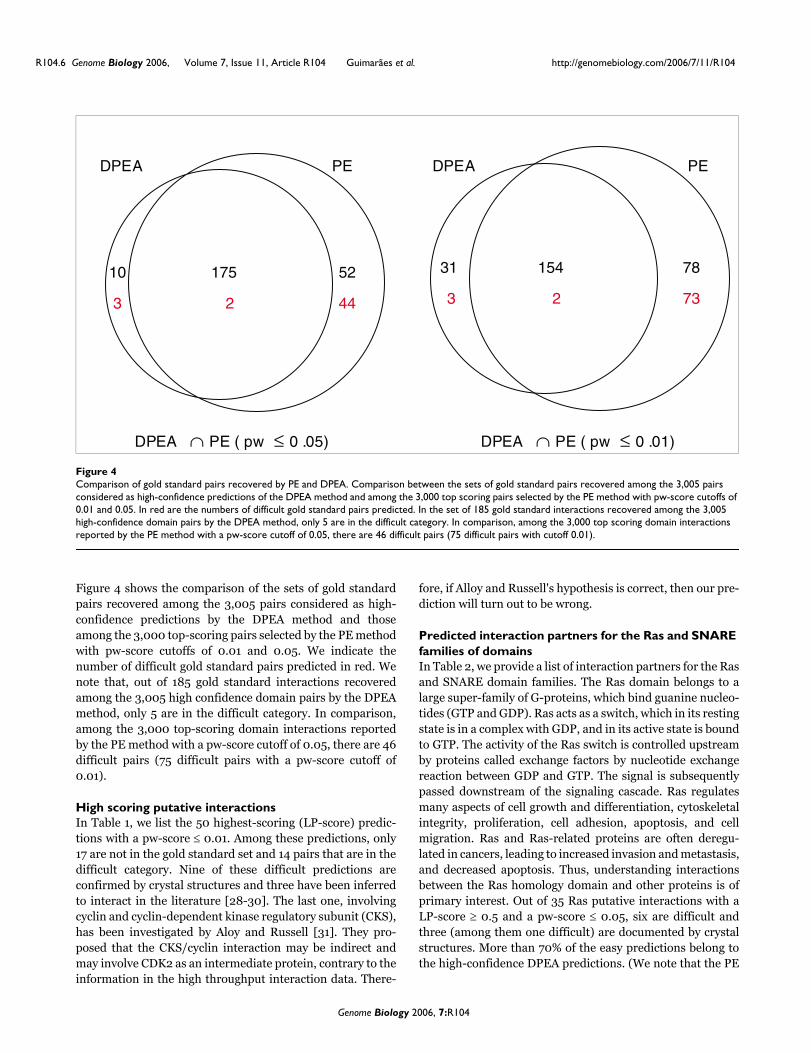
Figure 4 shows the comparison of the sets of gold standardpairs recovered among the 3,005 pairs considered as high-confidence predictions by the DPEA method and thoseamong the 3,000 top-scoring pairs selected by the PE methodwith pw-score cutoffs of 0.01 and 0.05. We indicate thenumber of difficult gold standard pairs predicted in red. Wenote that, out of 185 gold standard interactions recoveredamong the 3,005 high confidence domain pairs by the DPEAmethod, only 5 are in the difficult category. In comparison,among the 3,000 top-scoring domain interactions reportedby the PE method with a pw-score cutoff of 0.05, there are 46difficult pairs (75 difficult pairs with a pw-score cutoff of0.01).
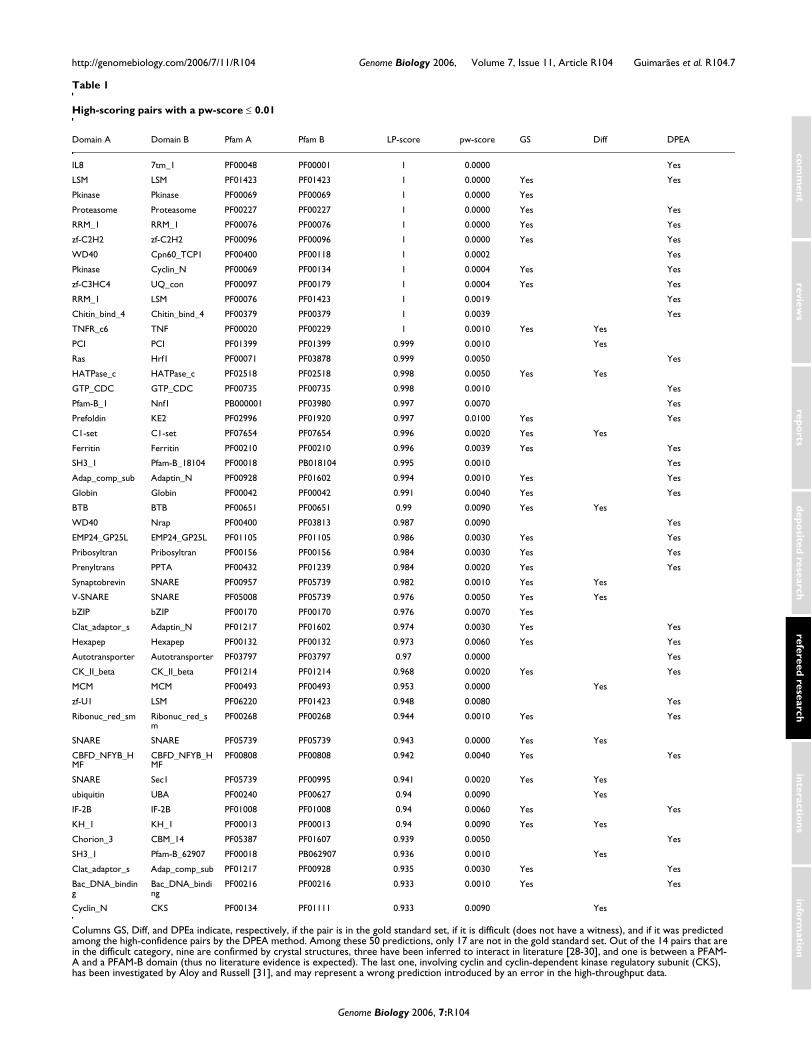
High scoring putative interactionsIn Table 1, we list the 50 highest-scoring (LP-score) predic-tions with a pw-score ≤ 0.01. Among these predictions, only17 are not in the gold standard set and 14 pairs that are in thedifficult category. Nine of these difficult predictions areconfirmed by crystal structures and three have been inferredto interact in the literature [28-30]. The last one, involvingcyclin and cyclin-dependent kinase regulatory subunit (CKS),has been investigated by Aloy and Russell [31]. They pro-posed that the CKS/cyclin interaction may be indirect andmay involve CDK2 as an intermediate protein, contrary to theinformation in the high throughput interaction data. There-
fore, if Alloy and Russell's hypothesis is correct, then our pre-diction will turn out to be wrong.
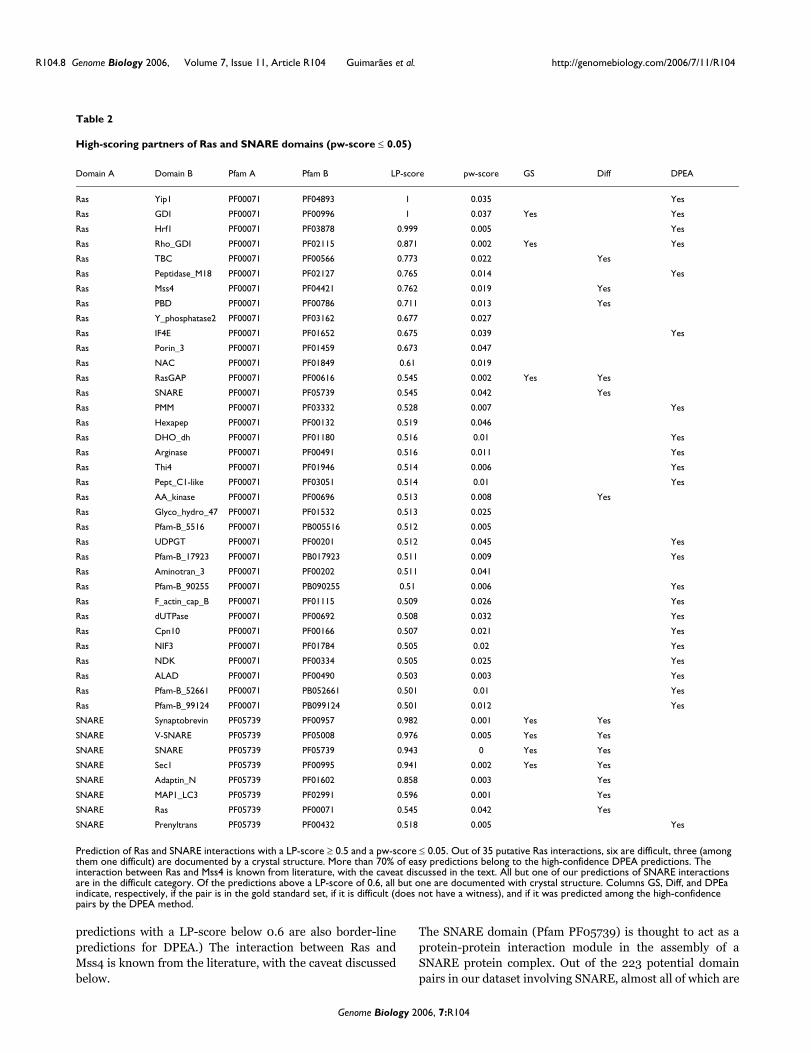
Predicted interaction partners for the Ras and SNARE families of domainsIn Table 2, we provide a list of interaction partners for the Rasand SNARE domain families. The Ras domain belongs to alarge super-family of G-proteins, which bind guanine nucleo-tides (GTP and GDP). Ras acts as a switch, which in its restingstate is in a complex with GDP, and in its active state is boundto GTP. The activity of the Ras switch is controlled upstreamby proteins called exchange factors by nucleotide exchangereaction between GDP and GTP. The signal is subsequentlypassed downstream of the signaling cascade. Ras regulatesmany aspects of cell growth and differentiation, cytoskeletalintegrity, proliferation, cell adhesion, apoptosis, and cellmigration. Ras and Ras-related proteins are often deregu-lated in cancers, leading to increased invasion and metastasis,and decreased apoptosis. Thus, understanding interactionsbetween the Ras homology domain and other proteins is ofprimary interest. Out of 35 Ras putative interactions with aLP-score ≥ 0.5 and a pw-score ≤ 0.05, six are difficult andthree (among them one difficult) are documented by crystalstructures. More than 70% of the easy predictions belong tothe high-confidence DPEA predictions. (We note that the PE
Comparison of gold standard pairs recovered by PE and DPEAFigure 4Comparison of gold standard pairs recovered by PE and DPEA. Comparison between the sets of gold standard pairs recovered among the 3,005 pairs considered as high-confidence predictions of the DPEA method and among the 3,000 top scoring pairs selected by the PE method with pw-score cutoffs of 0.01 and 0.05. In red are the numbers of difficult gold standard pairs predicted. In the set of 185 gold standard interactions recovered among the 3,005 high-confidence domain pairs by the DPEA method, only 5 are in the difficult category. In comparison, among the 3,000 top scoring domain interactions reported by the PE method with a pw-score cutoff of 0.05, there are 46 difficult pairs (75 difficult pairs with cutoff 0.01).
DPEA PEPEDPEA
175
2
10
3
52
44
DPEA ∩ PE ( pw ≤ 0 .05)
154
2
31
3
78
73
DPEA ∩ PE ( pw ≤ 0 .01)
Genome Biology 2006, 7:R104
http://genomebiology.com/2006/7/11/R104 Genome Biology 2006, Volume 7, Issue 11, Article R104 Guimarães et al. R104.7
com
ment
reviews
reports
refereed researchdepo
sited researchinteractio
nsinfo
rmatio
n
Table 1
High-scoring pairs with a pw-score ≤ 0.01
Domain A Domain B Pfam A Pfam B LP-score pw-score GS Diff DPEA
IL8 7tm_1 PF00048 PF00001 1 0.0000 Yes
LSM LSM PF01423 PF01423 1 0.0000 Yes Yes
Pkinase Pkinase PF00069 PF00069 1 0.0000 Yes
Proteasome Proteasome PF00227 PF00227 1 0.0000 Yes Yes
RRM_1 RRM_1 PF00076 PF00076 1 0.0000 Yes Yes
zf-C2H2 zf-C2H2 PF00096 PF00096 1 0.0000 Yes Yes
WD40 Cpn60_TCP1 PF00400 PF00118 1 0.0002 Yes
Pkinase Cyclin_N PF00069 PF00134 1 0.0004 Yes Yes
zf-C3HC4 UQ_con PF00097 PF00179 1 0.0004 Yes Yes
RRM_1 LSM PF00076 PF01423 1 0.0019 Yes
Chitin_bind_4 Chitin_bind_4 PF00379 PF00379 1 0.0039 Yes
TNFR_c6 TNF PF00020 PF00229 1 0.0010 Yes Yes
PCI PCI PF01399 PF01399 0.999 0.0010 Yes
Ras Hrf1 PF00071 PF03878 0.999 0.0050 Yes
HATPase_c HATPase_c PF02518 PF02518 0.998 0.0050 Yes Yes
GTP_CDC GTP_CDC PF00735 PF00735 0.998 0.0010 Yes
Pfam-B_1 Nnf1 PB000001 PF03980 0.997 0.0070 Yes
Prefoldin KE2 PF02996 PF01920 0.997 0.0100 Yes Yes
C1-set C1-set PF07654 PF07654 0.996 0.0020 Yes Yes
Ferritin Ferritin PF00210 PF00210 0.996 0.0039 Yes Yes
SH3_1 Pfam-B_18104 PF00018 PB018104 0.995 0.0010 Yes
Adap_comp_sub Adaptin_N PF00928 PF01602 0.994 0.0010 Yes Yes
Globin Globin PF00042 PF00042 0.991 0.0040 Yes Yes
BTB BTB PF00651 PF00651 0.99 0.0090 Yes Yes
WD40 Nrap PF00400 PF03813 0.987 0.0090 Yes
EMP24_GP25L EMP24_GP25L PF01105 PF01105 0.986 0.0030 Yes Yes
Pribosyltran Pribosyltran PF00156 PF00156 0.984 0.0030 Yes Yes
Prenyltrans PPTA PF00432 PF01239 0.984 0.0020 Yes Yes
Synaptobrevin SNARE PF00957 PF05739 0.982 0.0010 Yes Yes
V-SNARE SNARE PF05008 PF05739 0.976 0.0050 Yes Yes
bZIP bZIP PF00170 PF00170 0.976 0.0070 Yes
Clat_adaptor_s Adaptin_N PF01217 PF01602 0.974 0.0030 Yes Yes
Hexapep Hexapep PF00132 PF00132 0.973 0.0060 Yes Yes
Autotransporter Autotransporter PF03797 PF03797 0.97 0.0000 Yes
CK_II_beta CK_II_beta PF01214 PF01214 0.968 0.0020 Yes Yes
MCM MCM PF00493 PF00493 0.953 0.0000 Yes
zf-U1 LSM PF06220 PF01423 0.948 0.0080 Yes
Ribonuc_red_sm Ribonuc_red_sm
PF00268 PF00268 0.944 0.0010 Yes Yes
SNARE SNARE PF05739 PF05739 0.943 0.0000 Yes Yes
CBFD_NFYB_HMF
CBFD_NFYB_HMF
PF00808 PF00808 0.942 0.0040 Yes Yes
SNARE Sec1 PF05739 PF00995 0.941 0.0020 Yes Yes
ubiquitin UBA PF00240 PF00627 0.94 0.0090 Yes
IF-2B IF-2B PF01008 PF01008 0.94 0.0060 Yes Yes
KH_1 KH_1 PF00013 PF00013 0.94 0.0090 Yes Yes
Chorion_3 CBM_14 PF05387 PF01607 0.939 0.0050 Yes
SH3_1 Pfam-B_62907 PF00018 PB062907 0.936 0.0010 Yes
Clat_adaptor_s Adap_comp_sub PF01217 PF00928 0.935 0.0030 Yes Yes
Bac_DNA_binding
Bac_DNA_binding
PF00216 PF00216 0.933 0.0010 Yes Yes
Cyclin_N CKS PF00134 PF01111 0.933 0.0090 Yes
Columns GS, Diff, and DPEa indicate, respectively, if the pair is in the gold standard set, if it is difficult (does not have a witness), and if it was predicted among the high-confidence pairs by the DPEA method. Among these 50 predictions, only 17 are not in the gold standard set. Out of the 14 pairs that are in the difficult category, nine are confirmed by crystal structures, three have been inferred to interact in literature [28-30], and one is between a PFAM-A and a PFAM-B domain (thus no literature evidence is expected). The last one, involving cyclin and cyclin-dependent kinase regulatory subunit (CKS), has been investigated by Aloy and Russell [31], and may represent a wrong prediction introduced by an error in the high-throughput data.
Genome Biology 2006, 7:R104
R104.8 Genome Biology 2006, Volume 7, Issue 11, Article R104 Guimarães et al. http://genomebiology.com/2006/7/11/R104
predictions with a LP-score below 0.6 are also border-linepredictions for DPEA.) The interaction between Ras andMss4 is known from the literature, with the caveat discussedbelow.
The SNARE domain (Pfam PF05739) is thought to act as aprotein-protein interaction module in the assembly of aSNARE protein complex. Out of the 223 potential domainpairs in our dataset involving SNARE, almost all of which are
Table 2
High-scoring partners of Ras and SNARE domains (pw-score ≤ 0.05)
Domain A Domain B Pfam A Pfam B LP-score pw-score GS Diff DPEA
Ras Yip1 PF00071 PF04893 1 0.035 Yes
Ras GDI PF00071 PF00996 1 0.037 Yes Yes
Ras Hrf1 PF00071 PF03878 0.999 0.005 Yes
Ras Rho_GDI PF00071 PF02115 0.871 0.002 Yes Yes
Ras TBC PF00071 PF00566 0.773 0.022 Yes
Ras Peptidase_M18 PF00071 PF02127 0.765 0.014 Yes
Ras Mss4 PF00071 PF04421 0.762 0.019 Yes
Ras PBD PF00071 PF00786 0.711 0.013 Yes
Ras Y_phosphatase2 PF00071 PF03162 0.677 0.027
Ras IF4E PF00071 PF01652 0.675 0.039 Yes
Ras Porin_3 PF00071 PF01459 0.673 0.047
Ras NAC PF00071 PF01849 0.61 0.019
Ras RasGAP PF00071 PF00616 0.545 0.002 Yes Yes
Ras SNARE PF00071 PF05739 0.545 0.042 Yes
Ras PMM PF00071 PF03332 0.528 0.007 Yes
Ras Hexapep PF00071 PF00132 0.519 0.046
Ras DHO_dh PF00071 PF01180 0.516 0.01 Yes
Ras Arginase PF00071 PF00491 0.516 0.011 Yes
Ras Thi4 PF00071 PF01946 0.514 0.006 Yes
Ras Pept_C1-like PF00071 PF03051 0.514 0.01 Yes
Ras AA_kinase PF00071 PF00696 0.513 0.008 Yes
Ras Glyco_hydro_47 PF00071 PF01532 0.513 0.025
Ras Pfam-B_5516 PF00071 PB005516 0.512 0.005
Ras UDPGT PF00071 PF00201 0.512 0.045 Yes
Ras Pfam-B_17923 PF00071 PB017923 0.511 0.009 Yes
Ras Aminotran_3 PF00071 PF00202 0.511 0.041
Ras Pfam-B_90255 PF00071 PB090255 0.51 0.006 Yes
Ras F_actin_cap_B PF00071 PF01115 0.509 0.026 Yes
Ras dUTPase PF00071 PF00692 0.508 0.032 Yes
Ras Cpn10 PF00071 PF00166 0.507 0.021 Yes
Ras NIF3 PF00071 PF01784 0.505 0.02 Yes
Ras NDK PF00071 PF00334 0.505 0.025 Yes
Ras ALAD PF00071 PF00490 0.503 0.003 Yes
Ras Pfam-B_52661 PF00071 PB052661 0.501 0.01 Yes
Ras Pfam-B_99124 PF00071 PB099124 0.501 0.012 Yes
SNARE Synaptobrevin PF05739 PF00957 0.982 0.001 Yes Yes
SNARE V-SNARE PF05739 PF05008 0.976 0.005 Yes Yes
SNARE SNARE PF05739 PF05739 0.943 0 Yes Yes
SNARE Sec1 PF05739 PF00995 0.941 0.002 Yes Yes
SNARE Adaptin_N PF05739 PF01602 0.858 0.003 Yes
SNARE MAP1_LC3 PF05739 PF02991 0.596 0.001 Yes
SNARE Ras PF05739 PF00071 0.545 0.042 Yes
SNARE Prenyltrans PF05739 PF00432 0.518 0.005 Yes
Prediction of Ras and SNARE interactions with a LP-score ≥ 0.5 and a pw-score ≤ 0.05. Out of 35 putative Ras interactions, six are difficult, three (among them one difficult) are documented by a crystal structure. More than 70% of easy predictions belong to the high-confidence DPEA predictions. The interaction between Ras and Mss4 is known from literature, with the caveat discussed in the text. All but one of our predictions of SNARE interactions are in the difficult category. Of the predictions above a LP-score of 0.6, all but one are documented with crystal structure. Columns GS, Diff, and DPEa indicate, respectively, if the pair is in the gold standard set, if it is difficult (does not have a witness), and if it was predicted among the high-confidence pairs by the DPEA method.
Genome Biology 2006, 7:R104
http://genomebiology.com/2006/7/11/R104 Genome Biology 2006, Volume 7, Issue 11, Article R104 Guimarães et al. R104.9
com
ment
reviews
reports
refereed researchdepo
sited researchinteractio
nsinfo
rmatio
n
difficult, only 5 are in the gold standard set. All but one of thePE method's eight predictions of SNARE interactions are inthe difficult category, and four of them are documented bycrystal structures.
When interpreting the results for such families, one has tokeep in mind that the PE method predicts domain interac-tions based on the evidence found in the underlying proteininteraction dataset, that is, a predicted domain interaction isexpected to mediate at least one protein-protein interactionin the dataset. Large superfamilies like Ras contain severalrelated but yet different subfamilies, such as Ras, Rab, Rac,Ral, Ran, and so on. Since Pfam has classified all Ras-typefamilies into one big superfamily based on their sequencesimilarity, a prediction between Ras and Mss4 does not nec-essarily mean that all subfamilies interact with Mss4; it onlymeans that there is at least one subfamily in the Ras super-family that is predicted to interact with Mss4. Since Ras andSNARE are large domain families, to recover true interac-tions, many of which may have high pw-scores, we used a pw-score cutoff of 0.05 to construct Table 2. One needs to keep inmind that predicting interaction for promiscuous domainscould be difficult for the PE method, as a lower pw-score cut-off may not recover all true interactions while a higher pw-score cutoff may lead to spurious predictions, reducing theprediction accuracy.
Predicting interacting domain pair(s) within a given interacting protein pairGiven a pair of interacting proteins, predicting the domainpair(s) that mediate the interaction is a problem that has beenstudied before [21]. In order to assess and compare the per-formance of the PE and other domain interaction predictionmethods for this particular problem, we assumed that, if aninteracting protein pair contains domain pairs that are con-firmed to interact (by crystal structure evidence), then thisprotein-protein interaction is mediated by (possibly morethan one) such confirmed domain-domain interactions.Therefore, for this experiment, we restricted our attention toonly those interacting protein pairs that contain at least onegold standard domain pair that could mediate the interaction,and tested whether this pair(s) received the highest scoreamong all domain pairs that can potentially mediate a givenprotein interaction. In Material and methods we discussfurther the protein pairs selected for this experiment. The setof 1,780 interacting protein pairs used for this experiment isavailable as Additional data file 6.
We estimated the PPV and the sensitivity of the Association,EM, PE, and DPEA methods, and we also estimated the per-formance measures that could be expected by chance using aRandom method (for details, see Materials and methods).The results for PE with pw-score cutoffs of 0.01 and 0.05 werevery close, so we present only one set of numbers. The scoresfor the Association, EM, and the DPEA methods were takenfrom those generated by Riley and colleagues [22].
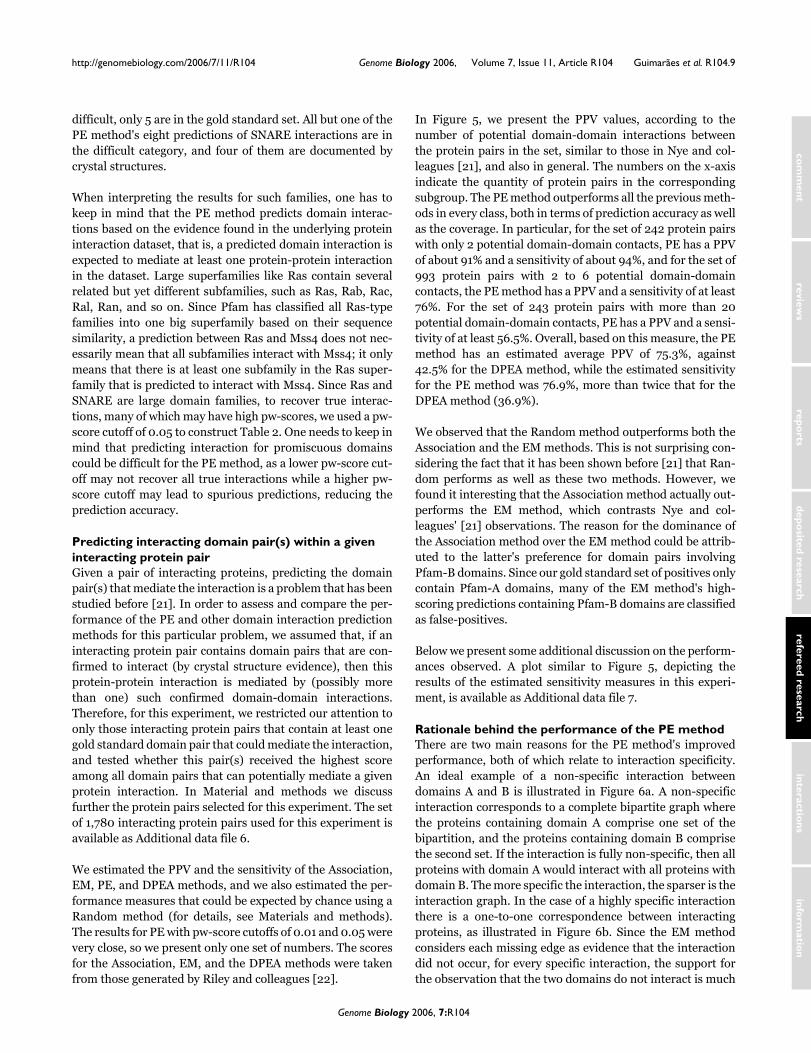
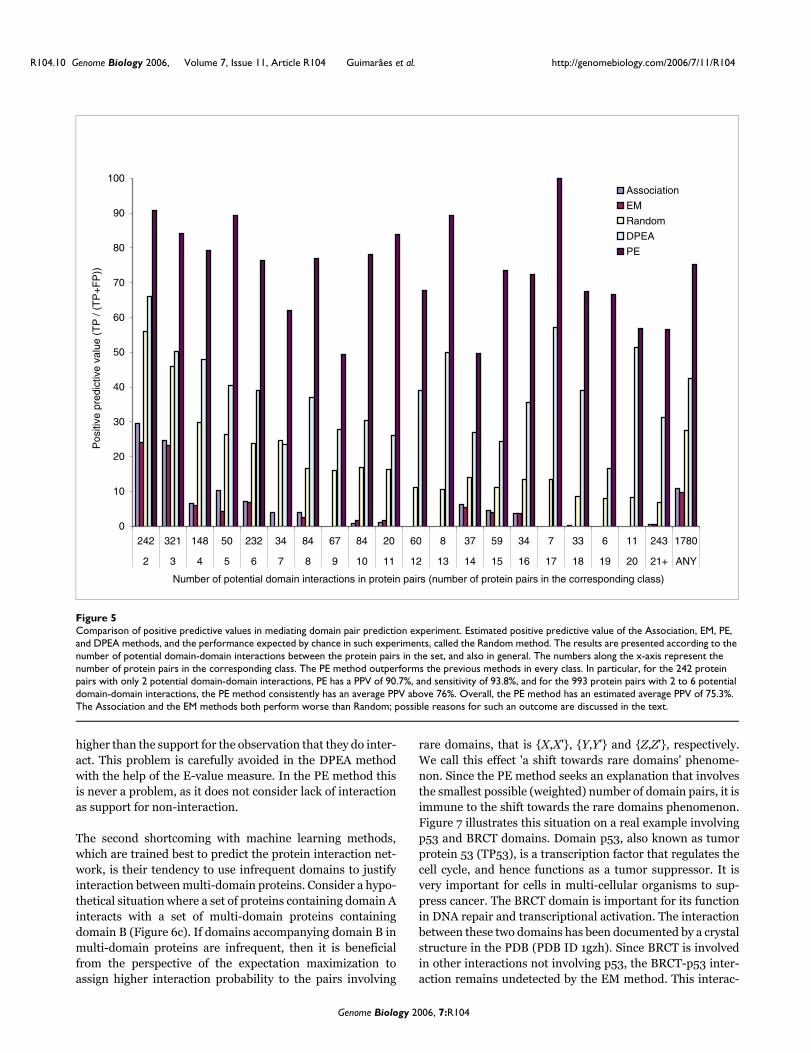
In Figure 5, we present the PPV values, according to thenumber of potential domain-domain interactions betweenthe protein pairs in the set, similar to those in Nye and col-leagues [21], and also in general. The numbers on the x-axisindicate the quantity of protein pairs in the correspondingsubgroup. The PE method outperforms all the previous meth-ods in every class, both in terms of prediction accuracy as wellas the coverage. In particular, for the set of 242 protein pairswith only 2 potential domain-domain contacts, PE has a PPVof about 91% and a sensitivity of about 94%, and for the set of993 protein pairs with 2 to 6 potential domain-domaincontacts, the PE method has a PPV and a sensitivity of at least76%. For the set of 243 protein pairs with more than 20potential domain-domain contacts, PE has a PPV and a sensi-tivity of at least 56.5%. Overall, based on this measure, the PEmethod has an estimated average PPV of 75.3%, against42.5% for the DPEA method, while the estimated sensitivityfor the PE method was 76.9%, more than twice that for theDPEA method (36.9%).
We observed that the Random method outperforms both theAssociation and the EM methods. This is not surprising con-sidering the fact that it has been shown before [21] that Ran-dom performs as well as these two methods. However, wefound it interesting that the Association method actually out-performs the EM method, which contrasts Nye and col-leagues' [21] observations. The reason for the dominance ofthe Association method over the EM method could be attrib-uted to the latter's preference for domain pairs involvingPfam-B domains. Since our gold standard set of positives onlycontain Pfam-A domains, many of the EM method's high-scoring predictions containing Pfam-B domains are classifiedas false-positives.
Below we present some additional discussion on the perform-ances observed. A plot similar to Figure 5, depicting theresults of the estimated sensitivity measures in this experi-ment, is available as Additional data file 7.
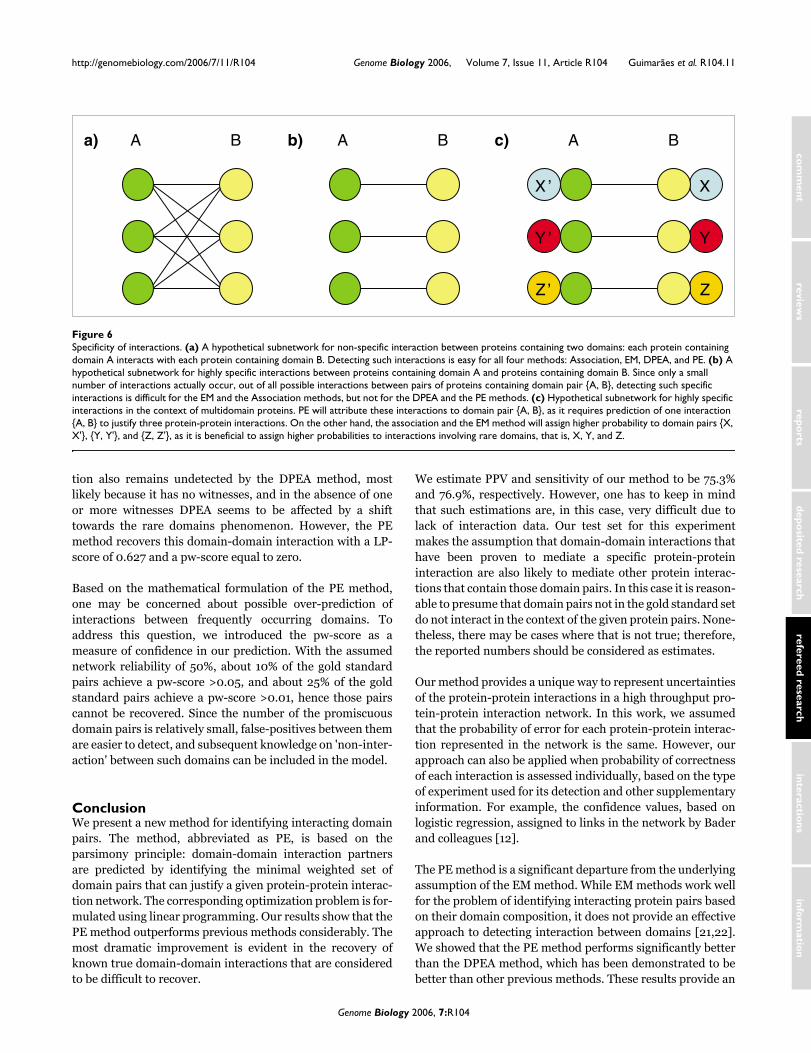
Rationale behind the performance of the PE methodThere are two main reasons for the PE method's improvedperformance, both of which relate to interaction specificity.An ideal example of a non-specific interaction betweendomains A and B is illustrated in Figure 6a. A non-specificinteraction corresponds to a complete bipartite graph wherethe proteins containing domain A comprise one set of thebipartition, and the proteins containing domain B comprisethe second set. If the interaction is fully non-specific, then allproteins with domain A would interact with all proteins withdomain B. The more specific the interaction, the sparser is theinteraction graph. In the case of a highly specific interactionthere is a one-to-one correspondence between interactingproteins, as illustrated in Figure 6b. Since the EM methodconsiders each missing edge as evidence that the interactiondid not occur, for every specific interaction, the support forthe observation that the two domains do not interact is much
Genome Biology 2006, 7:R104
R104.10 Genome Biology 2006, Volume 7, Issue 11, Article R104 Guimarães et al. http://genomebiology.com/2006/7/11/R104
higher than the support for the observation that they do inter-act. This problem is carefully avoided in the DPEA methodwith the help of the E-value measure. In the PE method thisis never a problem, as it does not consider lack of interactionas support for non-interaction.
The second shortcoming with machine learning methods,which are trained best to predict the protein interaction net-work, is their tendency to use infrequent domains to justifyinteraction between multi-domain proteins. Consider a hypo-thetical situation where a set of proteins containing domain Ainteracts with a set of multi-domain proteins containingdomain B (Figure 6c). If domains accompanying domain B inmulti-domain proteins are infrequent, then it is beneficialfrom the perspective of the expectation maximization toassign higher interaction probability to the pairs involving
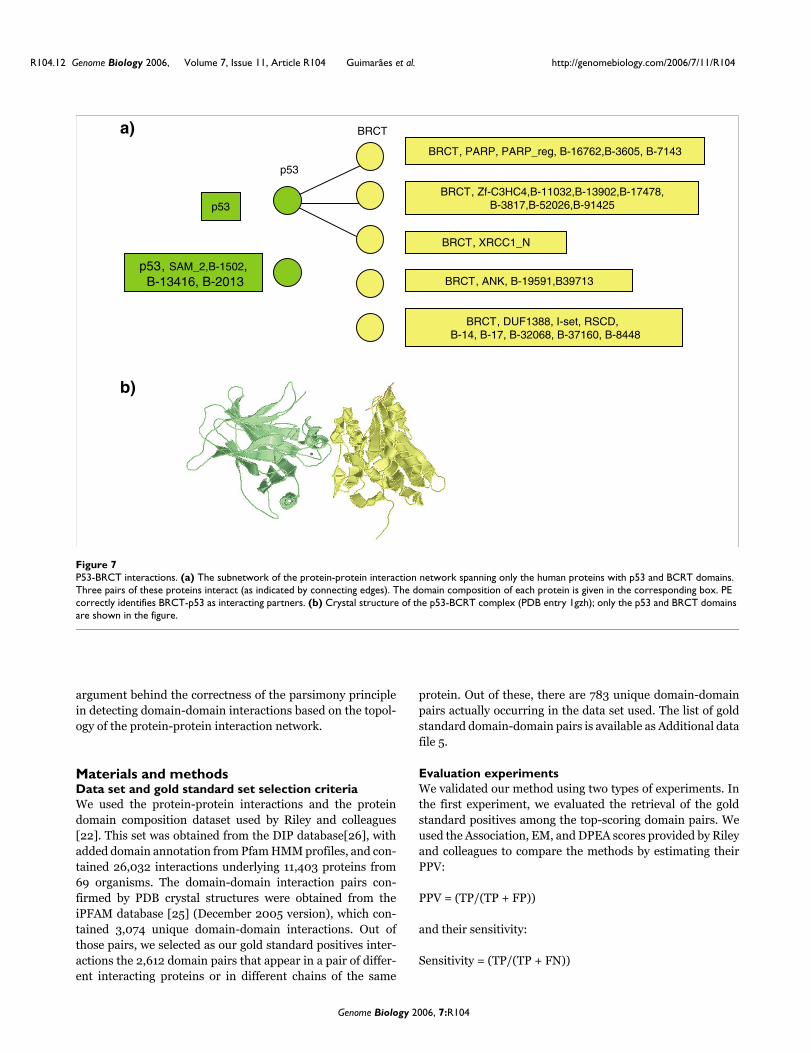
rare domains, that is {X,X'}, {Y,Y'} and {Z,Z'}, respectively.We call this effect 'a shift towards rare domains' phenome-non. Since the PE method seeks an explanation that involvesthe smallest possible (weighted) number of domain pairs, it isimmune to the shift towards the rare domains phenomenon.Figure 7 illustrates this situation on a real example involvingp53 and BRCT domains. Domain p53, also known as tumorprotein 53 (TP53), is a transcription factor that regulates thecell cycle, and hence functions as a tumor suppressor. It isvery important for cells in multi-cellular organisms to sup-press cancer. The BRCT domain is important for its functionin DNA repair and transcriptional activation. The interactionbetween these two domains has been documented by a crystalstructure in the PDB (PDB ID 1gzh). Since BRCT is involvedin other interactions not involving p53, the BRCT-p53 inter-action remains undetected by the EM method. This interac-
Comparison of positive predictive values in mediating domain pair prediction experimentFigure 5Comparison of positive predictive values in mediating domain pair prediction experiment. Estimated positive predictive value of the Association, EM, PE, and DPEA methods, and the performance expected by chance in such experiments, called the Random method. The results are presented according to the number of potential domain-domain interactions between the protein pairs in the set, and also in general. The numbers along the x-axis represent the number of protein pairs in the corresponding class. The PE method outperforms the previous methods in every class. In particular, for the 242 protein pairs with only 2 potential domain-domain interactions, PE has a PPV of 90.7%, and sensitivity of 93.8%, and for the 993 protein pairs with 2 to 6 potential domain-domain interactions, the PE method consistently has an average PPV above 76%. Overall, the PE method has an estimated average PPV of 75.3%. The Association and the EM methods both perform worse than Random; possible reasons for such an outcome are discussed in the text.
0
10
20
30
40
50
60
70
80
90
100
242 321 148 50 232 34 84 67 84 20 60 8 37 59 34 7 33 6 11 243 1780
2 3 4 5 6 7 8 9 10 11 12 13 14 15 16 17 18 19 20 21+ ANY
Number of potential domain interactions in protein pairs (number of protein pairs in the corresponding class)
Pos
itive
pre
dict
ive
valu
e (T
P /
(TP
+F
P))
Association
EM
Random
DPEA
PE
Genome Biology 2006, 7:R104
http://genomebiology.com/2006/7/11/R104 Genome Biology 2006, Volume 7, Issue 11, Article R104 Guimarães et al. R104.11
com
ment
reviews
reports
refereed researchdepo
sited researchinteractio
nsinfo
rmatio
n
tion also remains undetected by the DPEA method, mostlikely because it has no witnesses, and in the absence of oneor more witnesses DPEA seems to be affected by a shifttowards the rare domains phenomenon. However, the PEmethod recovers this domain-domain interaction with a LP-score of 0.627 and a pw-score equal to zero.
Based on the mathematical formulation of the PE method,one may be concerned about possible over-prediction ofinteractions between frequently occurring domains. Toaddress this question, we introduced the pw-score as ameasure of confidence in our prediction. With the assumednetwork reliability of 50%, about 10% of the gold standardpairs achieve a pw-score >0.05, and about 25% of the goldstandard pairs achieve a pw-score >0.01, hence those pairscannot be recovered. Since the number of the promiscuousdomain pairs is relatively small, false-positives between themare easier to detect, and subsequent knowledge on 'non-inter-action' between such domains can be included in the model.
ConclusionWe present a new method for identifying interacting domainpairs. The method, abbreviated as PE, is based on theparsimony principle: domain-domain interaction partnersare predicted by identifying the minimal weighted set ofdomain pairs that can justify a given protein-protein interac-tion network. The corresponding optimization problem is for-mulated using linear programming. Our results show that thePE method outperforms previous methods considerably. Themost dramatic improvement is evident in the recovery ofknown true domain-domain interactions that are consideredto be difficult to recover.
We estimate PPV and sensitivity of our method to be 75.3%and 76.9%, respectively. However, one has to keep in mindthat such estimations are, in this case, very difficult due tolack of interaction data. Our test set for this experimentmakes the assumption that domain-domain interactions thathave been proven to mediate a specific protein-proteininteraction are also likely to mediate other protein interac-tions that contain those domain pairs. In this case it is reason-able to presume that domain pairs not in the gold standard setdo not interact in the context of the given protein pairs. None-theless, there may be cases where that is not true; therefore,the reported numbers should be considered as estimates.
Our method provides a unique way to represent uncertaintiesof the protein-protein interactions in a high throughput pro-tein-protein interaction network. In this work, we assumedthat the probability of error for each protein-protein interac-tion represented in the network is the same. However, ourapproach can also be applied when probability of correctnessof each interaction is assessed individually, based on the typeof experiment used for its detection and other supplementaryinformation. For example, the confidence values, based onlogistic regression, assigned to links in the network by Baderand colleagues [12].
The PE method is a significant departure from the underlyingassumption of the EM method. While EM methods work wellfor the problem of identifying interacting protein pairs basedon their domain composition, it does not provide an effectiveapproach to detecting interaction between domains [21,22].We showed that the PE method performs significantly betterthan the DPEA method, which has been demonstrated to bebetter than other previous methods. These results provide an
Specificity of interactionsFigure 6Specificity of interactions. (a) A hypothetical subnetwork for non-specific interaction between proteins containing two domains: each protein containing domain A interacts with each protein containing domain B. Detecting such interactions is easy for all four methods: Association, EM, DPEA, and PE. (b) A hypothetical subnetwork for highly specific interactions between proteins containing domain A and proteins containing domain B. Since only a small number of interactions actually occur, out of all possible interactions between pairs of proteins containing domain pair {A, B}, detecting such specific interactions is difficult for the EM and the Association methods, but not for the DPEA and the PE methods. (c) Hypothetical subnetwork for highly specific interactions in the context of multidomain proteins. PE will attribute these interactions to domain pair {A, B}, as it requires prediction of one interaction {A, B} to justify three protein-protein interactions. On the other hand, the association and the EM method will assign higher probability to domain pairs {X, X'}, {Y, Y'}, and {Z, Z'}, as it is beneficial to assign higher probabilities to interactions involving rare domains, that is, X, Y, and Z.
X
Y
Z
X ’
Y ’
Z ’
b) BA c) BAa) BA
Genome Biology 2006, 7:R104
R104.12 Genome Biology 2006, Volume 7, Issue 11, Article R104 Guimarães et al. http://genomebiology.com/2006/7/11/R104
argument behind the correctness of the parsimony principlein detecting domain-domain interactions based on the topol-ogy of the protein-protein interaction network.
Materials and methodsData set and gold standard set selection criteriaWe used the protein-protein interactions and the proteindomain composition dataset used by Riley and colleagues[22]. This set was obtained from the DIP database[26], withadded domain annotation from Pfam HMM profiles, and con-tained 26,032 interactions underlying 11,403 proteins from69 organisms. The domain-domain interaction pairs con-firmed by PDB crystal structures were obtained from theiPFAM database [25] (December 2005 version), which con-tained 3,074 unique domain-domain interactions. Out ofthose pairs, we selected as our gold standard positives inter-actions the 2,612 domain pairs that appear in a pair of differ-ent interacting proteins or in different chains of the same
protein. Out of these, there are 783 unique domain-domainpairs actually occurring in the data set used. The list of goldstandard domain-domain pairs is available as Additional datafile 5.
Evaluation experimentsWe validated our method using two types of experiments. Inthe first experiment, we evaluated the retrieval of the goldstandard positives among the top-scoring domain pairs. Weused the Association, EM, and DPEA scores provided by Rileyand colleagues to compare the methods by estimating theirPPV:
PPV = (TP/(TP + FP))
and their sensitivity:
Sensitivity = (TP/(TP + FN))
P53-BRCT interactionsFigure 7P53-BRCT interactions. (a) The subnetwork of the protein-protein interaction network spanning only the human proteins with p53 and BCRT domains. Three pairs of these proteins interact (as indicated by connecting edges). The domain composition of each protein is given in the corresponding box. PE correctly identifies BRCT-p53 as interacting partners. (b) Crystal structure of the p53-BCRT complex (PDB entry 1gzh); only the p53 and BRCT domains are shown in the figure.
a)
b)
BRCT, Zf-C3HC4,B-11032,B-13902,B-17478,B-3817,B-52026,B-91425
BRCT, PARP, PARP_reg, B-16762,B-3605, B-7143
p53
BRCT
p53
BRCT, XRCC1_N
BRCT, DUF1388, I-set, RSCD, B-14, B-17, B-32068, B-37160, B-8448
BRCT, ANK, B-19591,B39713p53, SAM_2,B-1502,
B-13416, B-2013
Genome Biology 2006, 7:R104
http://genomebiology.com/2006/7/11/R104 Genome Biology 2006, Volume 7, Issue 11, Article R104 Guimarães et al. R104.13
com
ment
reviews
reports
refereed researchdepo
sited researchinteractio
nsinfo
rmatio
n
where the number of true positives (TP), false positives (FP),and false negatives (FN) were estimated with respect to thegold standard set. One should keep in mind that, in thisexperiment, the set of negatives includes all potential domainpairs occurring in the dataset that are not in the gold standardset and, thus, it is most likely to contain interacting domainsthat have not yet been documented by crystal structures.
In the second experiment, we focused on whether the meth-ods correctly identify domain interaction(s) mediating agiven protein-protein interaction. For this part of the experi-ment, we selected only the set of interacting protein pairs thathad at least one of the gold standard domain pairs amongtheir potential domain contacts. To avoid distortions imposedby protein pairs with exactly one potential domain contact,only protein pairs with at least two potential contacts wereconsidered. The set of 1,780 protein pairs used for this exper-iment is available as Additional data file 6; it contains a totalof 2,641 occurrences of gold standard pairs.
We considered as gold standard negatives all potentialdomain-domain interactions that are in some protein-proteininteraction of that selected set of protein pairs and do notmeet the gold standard positive criteria. It is important tokeep in mind that, while the gold standard set that we used iswidely accepted, selection of gold standard negatives is diffi-cult as there is no proof of non-interaction of domains.
Linear programming formulationInformally, we consider the problem of predicting interacting
domain pairs as an optimization problem, in which the objec-
tive is to minimize the number of domain-domain interac-
tions necessary to justify the underlying protein-protein
interaction network. We formulate this problem using linear
programming, in which a pair of domains i and j has a varia-
ble xij if and only if the interaction data contains an interact-
ing protein pair Pn and Pm containing domains i and j,
respectively. Variable xij represents the score of the potential
interaction between domains i and j. The goal is to minimize
the objective function ∑ij xij subject to the set of constraints,
which require that . Intuitively, we want to
justify each protein-protein interaction, using a minimum
number of domain-domain interactions possible overall.
Formally, given a protein-protein interaction network I = (P,E), where P = P1, P2,...,PN is the set of proteins in the networkand E is the set of protein interactions, and a set of unorderedpairs denoting all possible domain-domain interactions D ={{i, j}|i ∈ Pn, j ∈ Pm, and Pn and Pm interact}, solve the linearprogram (LP):
Minimize
Subject to: ,
for all interacting pairs of proteins {Pm, Pn}.
The variables (potential domain-domain interactions) andthe constraints (interacting protein pairs to be explained)were coded into a sparse matrix, and the system was solvedusing an optimization toolbox in Matlab® (The MathWorksInc., Natick, MA, USA). Our LP had 177,233 variables and26,032 constraints.
The noise in the protein-protein interaction data is modeledby randomizing the set of constraints. Namely, if we assumethat the interactions are reliable with probability r, weinclude the corresponding constraint with probability r. Weperformed experiments setting the reliability at differentrates. For each rate, the experiment was performed 1,000times, with different numbers of constraints for each run, andthe values obtained were averaged to generate the reportedLP-score.
Statistic measuresThe pw-score for a given domain-domain interaction inte-grates two factors: the number of witnesses for the interactionand its 'promiscuity'. Let w(i,j) be the number of witnesses fora given domain pair (i,j) and let r be the assumed reliability ofthe network, that is, the probability that the interaction rep-resented by an edge actually exists. The quantity (1 - r)w(i,j) isthe probability that all edges in the network that correspondto an interaction's witnesses are false positives. We computethe pw-score by taking the minimum between (1 - r)w(i,j) andp value(i,j), an estimation of the influence of the frequency ofappearance of the domain pair in its LP-score, computed as:
pw-score(i,j) = min(p value(i,j), (1 - r)w(i,j))
The p values are computed in a separate randomizationexperiment. We create a set of 1,000 random networksassuming the same set of proteins with the same domaincompositions, but selecting edges at random. The number ofedges is kept the same but no other topological information ispreserved. For each random network, we solve the corre-sponding LP formulation. For each domain pair, the p valueis computed as a frequency of random network experimentsthat returned the LP-score at least equal to the LP-scoreobtained by the average of values in the 1,000 runs describedabove.
Additional data filesThe following additional data are available with the onlineversion of this paper. Additional data file 1 is a list of the3,000 top scoring domain pairs with a pw-score cutoff of 0.01(network reliability 50%). Additional data file 2 is a list of the3,000 top scoring domain pairs with a pw-score cutoff of 0.05
xiji P j Pn m≥∈ ∈∑ 1
xiji j D{ , }∈∑
xiji j P Pm n
≥∈∑ 1
( , ) ( , )
Genome Biology 2006, 7:R104
R104.14 Genome Biology 2006, Volume 7, Issue 11, Article R104 Guimarães et al. http://genomebiology.com/2006/7/11/R104
(network reliability 50%). Additional data file 3 is a list of the3,610 domain pairs with a LP-score ≥ 0.4 and a pw-score ≤ 0.1(network reliability 50%). Additional data file 4 is a list of the3,944 domain pairs with a LP-score ≥ 0.4 and a pw-score ≤ 0.1(network reliability 60%). Additional data file 5 is a list of the783 gold standard domain pairs occurring in our dataset.Additional data file 6 is a list of the 1,780 interacting proteinpairs used in the mediating domain pair prediction experi-ment. Additional data file 7 is a plot depicting the estimatedsensitivity measures for the mediating domain pair predic-tion experiment.Additional data file 1The 3,000 top scoring domain pairs with a pw-score cutoff of 0.01 (network reliability 50%)The 3,000 top scoring domain pairs with a pw-score cutoff of 0.01 (network reliability 50%).Click here for fileAdditional data file 2The 3,000 top scoring domain pairs with a pw-score cutoff of 0.05 (network reliability 50%)The 3,000 top scoring domain pairs with a pw-score cutoff of 0.05 (network reliability 50%).Click here for fileAdditional data file 3The 3,610 domain pairs with a LP-score ≥ 0.4 and a pw-score ≤ 0.1 (network reliability 50%)The 3,610 domain pairs with a LP-score ≥ 0.4 and a pw-score ≤ 0.1 (network reliability 50%).Click here for fileAdditional data file 4The 3,944 domain pairs with a LP-score ≥ 0.4 and a pw-score ≤ 0.1 (network reliability 60%)The 3,944 domain pairs with a LP-score ≥ 0.4 and a pw-score ≤ 0.1 (network reliability 60%).Click here for fileAdditional data file 5The 783 gold standard domain pairs occurring in our datasetThe 783 gold standard domain pairs occurring in our dataset.Click here for fileAdditional data file 6The 1,780 interacting protein pairs used in the mediating domain pair prediction experimentThe 1,780 interacting protein pairs used in the mediating domain pair prediction experiment.Click here for fileAdditional data file 7The estimated sensitivity measures for the mediating domain pair prediction experimentThe estimated sensitivity measures for the mediating domain pair prediction experiment.Click here for file
AcknowledgementsThis work was supported by the Intramural Research Program of theNational Institutes of Health, National Library of Medicine, and used thehigh-performance computational capabilities of the Biowulf PC/Linux clus-ter at the National Institutes of Health, Bethesda, MD, USA. The authorsare thankful to the anonymous referees whose comments and suggestionsgreatly improved the presentation of the results, and to the authors of Rileyand colleagues [22] for providing their scores for the complete set of177,233 potential contacts.
References1. Uetz P, Giot L, Cagney G, Mansfield T, Judson R, Knight J, Lockshon
D, Narayan V, Srinivasan M, Pochart P: A comprehensive analysisof protein-protein interactions in Saccharomyces cerevisiae.Nature 2000, 403:623-627.
2. Ito T, Chiba T, Ozawa R, Yoshida M, Hattori M, Sakaki Y: A compre-hensive two-hybrid analysis to explore the yeastproteininteractome. Proc Natl Acad Sci USA 2001, 98:4569-4574.
3. Gavin A, Bosche M, Krause R, Grandi P, Marzioch M, Bauer A, SchultzJ, Rick J, Michon A, Cruciat C: Functional organization of theyeast proteome by systematic analysis of protein complexes.Nature 2002, 415:141-147.
4. Ho Y, Gruhler A, Heilbut A, Bader G, Moore L, Adams S, Millar A,Taylor P, Bennett K, Boutilier K: Systematic identification of pro-tein complexes in Saccharomyces cerevisiae by massspectrometry. Nature 2002, 415:180-183.
5. Giot L, Bader J, Brouwer C, Chaudhuri A, Kuang B, Li Y, Hao Y, OoiC, Godwin B, Vitols E, et al.: A protein interaction map of Dro-sophila melanogaster. Science 2003, 302:1727-1736.
6. Li S, Armstrong C, Bertin N, Ge H, Milstein S, Boxem M, Vidalain P,Han J, Chesneau A, Hao T, et al.: A map of the interactome net-work of the metazoan C. elegans. Science 2004, 303:540-543.
7. Butland G, Peregrin-Alvarez J, Li J, Yang W, Yang X, Canadien V, Star-ostine A, Richards D, Beattie B, Krogan N, et al.: Interactionnetwork containing conserved and essential protein com-plexes in Escherichia coli. Nature 2005, 433:531-537.
8. Krogan NJ, Cagney G, Yu H, Zhong G, Guo X, Ignatchenko A, Li J, PuS, Datta N, Tikuisis A, et al.: Global landscape of protein com-plexes in the yeast Saccharomyces cerevisiae. Nature 2006,440:637-643.
9. Mrowka R, Patzak A, Herzel H: Is there a bias in proteomeresearch? Genome Res 2001, 11:1971-1973.
10. Deane C, Salwinski L, Xenarios I, Eisenberg D: Protein interac-tions: two methods for assessment of the reliability of highthroughput observations. Mol Cell Proteomics 2002, 1:349-356.
11. von Mering C, Krause R, Snel B, Cornell M, Oliver S, Fields S, Bork P:Comparative assessment of large-scale data sets of protein-protein interactions. Nature 2002, 417:399-403.
12. Bader J, Chaudhuri A, Rothberg J, Chant J: Gaining confidence inhigh-throughput protein interaction networks. Nat Biotechnol2004, 22:78-85.
13. Apic G, Gough J, Teichmann SA: Domain combinations inarchaeal, eubacterial and eukaryotic proteomes. J Mol Biol2001, 310:311-325.
14. Bock JR, Gough DA: Predicting protein-protein interactionsfrom primary structure. Bioinformatics 2001, 17:455-460.
15. Sprinzak E, Margalit H: Correlated sequence-signatures as
markers of protein-protein interaction. J Mol Biol 2001,311:681-692.
16. Deng M, Mehta S, Sun F, Chen T: Inferring domain-domain inter-actions from protein-protein interactions. Genome Res 2002,12:1540-1548.
17. Gomez S, Rzhetsky A: Towards the prediction of complete pro-tein-protein interaction networks. Pac Symp Biocomput 2002,7:413-424.
18. Kim W, Park J, Suh J: Large scale statistical prediction of pro-tein-protein interaction by potentially interacting domain(PID) pair. Genome Inform 2002, 13:42-50.
19. Ng S, Zhang Z, Tan S, Lin K: InterDom: a database of putativeinteracting protein domains for validating predicted proteininteractions and complexes. Nucleic Acids Res 2003, 31:251-254.
20. Hayashida M, Ueda N, Akutsu T: A simple method for inferringstrengths of protein-protein interactions. Genome Inform 2004,15:56-68.
21. Nye TM, Berzuini C, Gilks WR, Babu MM, Teichmann SA: Statisticalanalysis of domains in interacting protein pairs. Bioinformatics2005, 21:993-1001.
22. Riley R, Lee C, Sabatti C, Eisenberg D: Inferring protein domaininteractions from databases of interacting proteins. GenomeBiol 2005, 6:R89.
23. Jothi R, Cherukuri P, Tasneem A, Przytycka T: Co-evolutionaryanalysis of domains in interacting proteins reveals insightsinto domain-domain interactions mediating protein-proteininteractions. J Mol Biol 2006, 362:861-875.
24. Berman HM, Westbrook J, Feng Z, Gilliland G, Bhat T, Weissig H,Shindyalov I, Bourne P: The Protein Data Bank. Nucleic Acids Res2000, 28:235-242.
25. Finn R, Marshall M, Bateman A: iPfam: visualization of protein-protein interactions in PDB at domain and amino acidresolutions. Bioinformatics 2005, 21:410-412.
26. Salwinski L, Miller C, Smith A, Pettit F, Bowie J, Eisenberg D: TheDatabase of Interacting Proteins: 2004 update. Nucleic AcidsRes 2004, 32:D449-D451.
27. Bateman A, Coin L, Durbin R, Finn R, Hollich V, Griffiths-Jones S,Khanna A, Marshall M, Moxon S, Sonnhammer E, et al.: The Pfamprotein families database. Nucleic Acids Res 2004, 32:D138-D141.
28. vander Voorn L, Ploegh HL: The WD-40 repeat. FEBS Letters 1992,307:131-134.
29. Lei M, Kawasaki Y, Tye B: Physical interactions among Mcmproteins and effects of Mcm dosage on DNA replication inSaccharomyces cerevisiae. Mol Cell Biol 1996, 16:5081-5090.
30. Scheel H, Hofmann K: Prediction of a common structural scaf-fold for proteasome lid, COP9-signalosome and eIF3complexes. BMC Bioinformatics 2005, 6:71.
31. Aloy P, Russell RB: Interrogating protein interaction networksthrough structural biology. Proc Natl Acad Sci USA 2002,99:5896-5901.
Genome Biology 2006, 7:R104