Embed Size (px)
Citation preview

Predicting Boiler Trips with Machine Learning
Advanced Automation in Mining with MATLAB19 August 2021

Introduction
John Atherfold
Data Science Specialist at Opti-Num Solutions
Smart Mining and Manufacturing
Christopher Van den Berg
Cyber Physical Systems Engineer at John Thompson within the industrial watertube boilers division
Copyright 2021 Opti-Num Solutions (Pty) Ltd 2

Contents
• Background
• General Solution Workflow
• Detailed Solution Workflow using Mathworks Tools
• Results
• Summary and Conclusions
Copyright 2021 Opti-Num Solutions (Pty) Ltd 3

BackgroundJohn Thompson
• John Thompson
– Firmly focused on serving our global customer base, John Thompson offers the following products and services: Boilers, Environmental Solutions (including Air Pollution Control), Engineering, Energy Management, Manufacturing, Spares, Maintenance and Training.
– John Thompson is a division of ACTOM (Pty) Ltd.
• ACTOM (Pty) Ltd
– The largest manufacturer, solution provider, repairer, maintainer and distributor of electro-mechanical equipment in Africa.
– Also a major local supplier of electrical equipment, services and balance of plant to the renewable energy projects.
Copyright 2021 Opti-Num Solutions (Pty) Ltd 4

BackgroundOpti-Num – Smart Mining and Manufacturing
• Founded in 1992 as sole distributor of MathWorks tools in Southern Africa
• Business evolved strong services approach in 2015
• Level 4 BBBEE Contributor
• Our clients include many of the JSE Top 40
Copyright 2021 Opti-Num Solutions (Pty) Ltd 5
• Unlocking profitable insights and solutions to real-world problems using process data– Advanced data visualisation
– Smart monitoring and maintenance
– Intelligent control

BackgroundIndustrial Watertube Boilers
Copyright 2021 Opti-Num Solutions (Pty) Ltd 6
• Sugar Refinery
– First application of the boiler trip advisor
– Commonly uses bagasse fueled boilers
• Bagasse
– Plant fiber left behind after the crushing of sugar cane
– Used as a biofuel in boilers: 5,000 to 8,000 Btuh/lb (11630 to 18608 kJ/kg)
(2780 to 4447 kCal/kg)
• Steam uses in a sugar refinery
– Processing steam: cooking and drying of sugar cane
– Superheated steam: fuels turbines to produce electricity and/or machinery

BackgroundIndustrial Watertube Boilers
Copyright 2021 Opti-Num Solutions (Pty) Ltd 7
The site had two Industrial water tube bagasse boilers
• B1 – 80 t/h
• B2 – 50 t/h
The testing ground for boiler trip prediction

BackgroundBoiler Trip Types
Copyright 2021 Opti-Num Solutions (Pty) Ltd 8
• Excess motor current
– Likely caused by a blockage flue gas flow
– Protects furnace pressure and exceeding excessive heat
• Water level switch
– Triggers to protect tubes of economiser and main bank when water level in the steam drum is too low
– Triggers to protect turbine when water level in the steam drum is too high. Saturated steam can be bypassed by using the let-down valve

BackgroundBoiler Trip Types
Copyright 2021 Opti-Num Solutions (Pty) Ltd 9
High water levels in the steam drum can cause water to enter the turbine. This results in corrosion.
Low water levels in the steam drum can cause water dry out tubes. This results in a temperature build up in the tubes.

BackgroundProject Background
• The Challenge
– Boilers are process-critical equipment
– Boiler trips result in unplanned downtime for the production process
– Significant loss of production on the Mill. Reduced overall throughput
• What We Did
– Implemented an early trip detection system using tags upstream of the boiler
– Detection system warns the operators of impending trips with enough lead time such that trips may be prevented
• The Result
– Fewer trips on average per month
– Increase of plant production
Copyright 2021 Opti-Num Solutions (Pty) Ltd 10

.exe
Final Solution Workflow
Copyright 2021 Opti-Num Solutions (Pty) Ltd 11
Sensor Data Historian$
Analyse Results over Time
Data AccessData
Preprocessing
Run Live Data Through ML
Model
VisualiseResults in GUI
Server

Data Access (via OPC)
• What is OPC?– Open Platform Communications
– Interoperability standard for the secure and reliable exchange of data in the industrial automation space and other industries
• Why OPC?– Industry standard
– Allows for access to live data and historical data through any historian
– MATLAB’s OPC Toolbox
• For this project– Integrating with OSI PI Historian
– Integrated using Historical Data Access server
– Also able to integrate via Data Access server, and
Universal Access server
12
Data AccessData
Preprocessing
Run Live Data Through ML
Model
VisualiseResults in GUI
Copyright 2021 Opti-Num Solutions (Pty) Ltd

OPC Toolbox in MATLAB
Copyright 2021 Opti-Num Solutions (Pty) Ltd 13
Data AccessData
Preprocessing
Run Live Data Through ML
Model
VisualiseResults in GUI
Locate OPC Server
Create OPC Client Object
Connect to the Server
Create OPC Group
Browse Item Name Space
Add Items to Group
Read Data into MATLAB

Data Preprocessing
Copyright 2021 Opti-Num Solutions (Pty) Ltd 14
Data AccessData
Preprocessing
Run Live Data Through ML
Model
VisualiseResults in GUI
Raw Data read in from HDA server
Sort, Fill, and Retime data into Timetable object
Feature Engineering

Data PreprocessingSorting, Filling, Resampling
Copyright 2021 Opti-Num Solutions (Pty) Ltd 15
Data AccessData
Preprocessing
Run Live Data Through ML
Model
VisualiseResults in GUI
• Basic data preprocessing made easy with MATLAB’s built-in functions
– Sort data into chronological order
– Finding and removing repeated times
– Filling in any missing values
– Resampling to a regular sample rate

Data PreprocessingFeature Engineering
Copyright 2021 Opti-Num Solutions (Pty) Ltd 16
Data AccessData
Preprocessing
Run Live Data Through ML
Model
VisualiseResults in GUI
• Define the Reference Table
– Table containing plant data from when the plant was stable and operating normally
• Define the Query Table
– Table containing the most recent plant data. This is compared to normal operation.
• Consisted of several transformations to the data
– Difference table – gives indication of instantaneous rate of change
– Detect trip in data chunk (if a trip occurred) using an indicator tag
– Centre and Scale the data appropriately

Data PreprocessingFeature Engineering
Copyright 2021 Opti-Num Solutions (Pty) Ltd 17
Data AccessData
Preprocessing
Run Live Data Through ML
Model
VisualiseResults in GUI
• Consisted of several transformations to the data– Run Principal Component Analysis (PCA) on both
training and testing sets – Reduce dimensionality
– Get Mahalanobis distances of training set and testing projection – Quantify deviation from normal
– In a similar manner, various other statistical parameters are extracted from the features, including:
• Median, IQR, rates of change of various parameters, KL Divergence, skewness, etc.
– These features ultimately describe various properties of the normal operation data set, the incoming query data set, and the differences between them

ML ModelProblem Formulation
• Initial plan was to build a regression model able to predict Time Until Trip (TUT), similar to Remaining Useful Life (RUL) prediction
• The end-product was a classification model that classified chunks of input data into one of five classes:
– TUT > 40min → Chunk of data is Healthy
– 30min < TUT < 40min
– 20min < TUT < 30min
– 10min < TUT < 20min
– TUT < 10min → Chunk of data is Unhealthy. Trip imminent.
• Each of these classes has a probability associated with it
• The probability distribution associated with each chunk of data is rolled up into a single health value for that chunk
Copyright 2021 Opti-Num Solutions (Pty) Ltd 18
Data AccessData
Preprocessing
Run Live Data Through ML
Model
VisualiseResults in GUI

ML ModelModel Type
• Final Machine Learning Model was a Boosted Forest
– Consists of a series of Decision Trees
Copyright 2021 Opti-Num Solutions (Pty) Ltd 19
Data AccessData
Preprocessing
Run Live Data Through ML
Model
VisualiseResults in GUI
Full Dataset
Class 1 Class 2
Full Dataset
Adjusted Dataset 1
Adjusted Dataset 2
Adjusted Dataset 3
Class 1 Class 2
Decision Tree Boosted Forest

ML ModelModel Type
• Final Machine Learning Model was a Boosted Forest
>> mdl = fitcensemble(trainingTripTbl,'healthIndicator’)
• Hyperparameters of the model were tuned by a process of Leave One Out (LOO) cross-validation
>> cv = cvpartition(length(trainAndValidTrips),'LeaveOut’)
• Subsequent hyperparameter sets were chosen using Bayesian optimisation
>> results = bayesopt(lossFun,[method,numLearningCycles,...
learnRate,maxSplits,minLeafSize,splitCriterion],...
'AcquisitionFunctionName','expected-improvement-plus’)
Copyright 2021 Opti-Num Solutions (Pty) Ltd 20
Data AccessData
Preprocessing
Run Live Data Through ML
Model
VisualiseResults in GUI
ML ModelModel Type
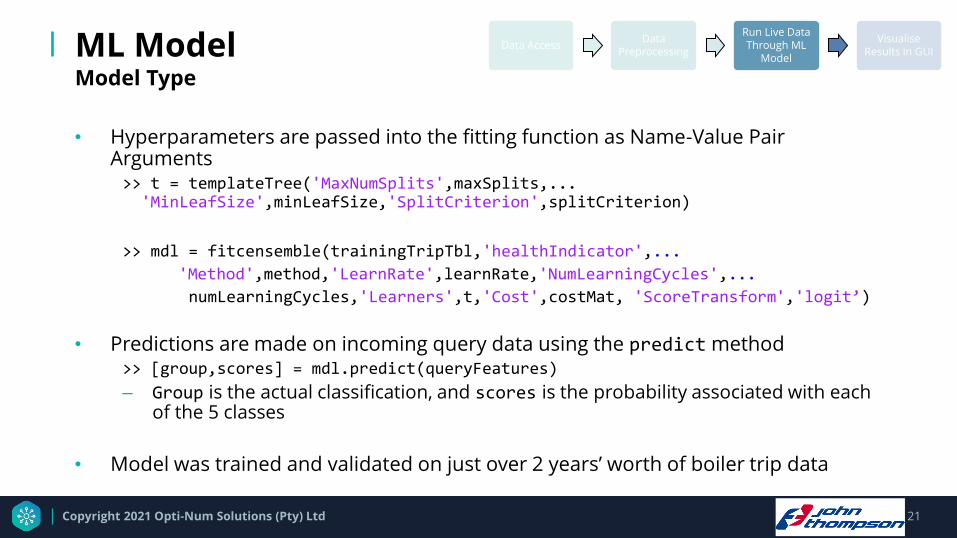
• Hyperparameters are passed into the fitting function as Name-Value Pair Arguments>> t = templateTree('MaxNumSplits',maxSplits,... 'MinLeafSize',minLeafSize,'SplitCriterion',splitCriterion)
>> mdl = fitcensemble(trainingTripTbl,'healthIndicator',...
'Method',method,'LearnRate',learnRate,'NumLearningCycles',...
numLearningCycles,'Learners',t,'Cost',costMat, 'ScoreTransform','logit’)
• Predictions are made on incoming query data using the predict method>> [group,scores] = mdl.predict(queryFeatures)
– Group is the actual classification, and scores is the probability associated with each of the 5 classes
• Model was trained and validated on just over 2 years’ worth of boiler trip data
Copyright 2021 Opti-Num Solutions (Pty) Ltd 21
Data AccessData
Preprocessing
Run Live Data Through ML
Model
VisualiseResults in GUI

Development of GUI
• Built in MATLAB using Object Oriented Programming and App Designer
• Deployed to an edge device (as an exe) using MATLAB Compiler
• Followed a variation of the Model-View-Controller (MVC) framework– Controller Class – Co-ordinates all other aspects of
the framework, including Data Manager Class– Model Class – Contains the ML Model and some of
the feature engineering required– View Class – Displays information to the User
• Provides information to operators, informing them of potential trips so they can take action and prevent downtime
• Refinements of the workflow involve integrating directly with existing HMIs
Copyright 2021 Opti-Num Solutions (Pty) Ltd 22
Data AccessData
Preprocessing
Run Live Data Through ML
Model
VisualiseResults in GUI
Model
View
User
Controller
Uses
ManipulatesUpdates
Displays

Development of GUI
Copyright 2021 Opti-Num Solutions (Pty) Ltd 23
Data AccessData
Preprocessing
Run Live Data Through ML
Model
VisualiseResults in GUI
BTA status
OPC serverdetails
Data packets from the last 10 minutes

Development of GUI
Copyright 2021 Opti-Num Solutions (Pty) Ltd 24
Data AccessData
Preprocessing
Run Live Data Through ML
Model
VisualiseResults in GUI
Tags with greatest health value impact
Trip Prediction
Health value trends

Development of GUI
Copyright 2021 Opti-Num Solutions (Pty) Ltd 25
Data AccessData
Preprocessing
Run Live Data Through ML
Model
VisualiseResults in GUI
Tags with greatest health value impact
Health value trends
Detailed trip and data packet timings

Results
Copyright 2021 Opti-Num Solutions (Pty) Ltd 26
• The BTA has been on a trial for 3 weeks
• From the data the following events were of note:
– 2 case of a successful prediction of a boiler trip
– 4 cases of a successful prediction of let-down event
– 3 cases of an undetected event or trip (false negative)
– 14 cases of “false” prediction of events (false positives)
• May have been prevented by operator intervention

Results – Week 1
Copyright 2021 Opti-Num Solutions (Pty) Ltd 27
Event No. BTA Event BTA Time Trip Event Let-down Event BTA Prediction
1 Health < 0.5 15/07 02:30 – 03:35 N/A N/A False positive
2 Health < 0.5 16/07 00:25 – 00:50 N/A 16/07 01:51 – 03:00 Successful - let-down
3 Health < 0.5 17/07 03:40 – 11:50 N/A 17/07 01:50 – 11:34 Successful - let-down
4 Health < 0.5 20/07 04:20 – 04:25 N/A N/A False positive
5 Health < 0.5 20/07 16:45 – 17:50 N/A N/A False positive
6 Health < 0.5 20/07 19:25 – 20:00 N/A N/A False positive
7 Health < 0.5 23/07 09:35 – 10:40 N/A 23/07 10:20 – 11:00Successful - let-down
event
8 Health < 0.5 (intermittent) 23/07 13:25 – 23:55 N/A N/A False positive
Boiler 1: Valid Time – 14/07 23:55 – 23/07 23:55

Results – Week 1
Copyright 2021 Opti-Num Solutions (Pty) Ltd 28
• This graph corresponds to event 7
• Blue line represents the health value. The orange line represents the let-down valve position
• The health value trends downwards before the let-down event occurs. This is an indication that the algorithm detected the deterioration in boiler health 45 minutes before the event occurred.

Results – Week 2
Copyright 2021 Opti-Num Solutions (Pty) Ltd 29
Event No. BTA Event BTA Time Trip Event Let-down Event BTA Prediction
1 Health < 0.5 15/07 00:00 – 01:00 N/A N/A False positive
2 Health < 0.5 15/07 03:55 – 04:20 N/A N/A False positive
3 Health < 0.5 15/07 05:25 – 06:50 N/A N/A False positive
4 Health < 0.5 15/07 07:55 – 09:00 N/A N/A False positive
5 Health < 0.5 15/07 11:55 – 12:50 N/A N/A False positive
6 N/A N/A N/A 16/07 01:52 – 02:53 False negative
7 Health < 0.5 16/07 14:30 – 15:35 N/A16/07 14:33 – 15:00 (Sharp
decrease)Successful - let-down event
8 N/A N/A N/A 16/07 22:09 – 22:47 False negative
9 N/A N/A 17/07 03:25 – 03:31 N/A False negative
10 Health < 0.5 17/07 03:40 – 07:35 17/07 03:44 – 07:21 N/A Successful – trip event
11 Health < 0.5 17/07 23:00 – 00:00 N/A N/A False positive
Boiler 2: Valid Time – 14/07 23:55 – 19/07 19:20

Results – Week 2
Copyright 2021 Opti-Num Solutions (Pty) Ltd 30
• This graph corresponds to event 10
• Blue line represents the health value. The orange line represents the trip state where 1 = normal, 0 = trip.
• The series of trips that occurred between 03:44 and 07:21 were indicated by a low health value.
• The boiler health increased again at 07:35, when the trip events had passed.

Results – Week 3
Copyright 2021 Opti-Num Solutions (Pty) Ltd 31
Event No. BTA Event BTA Time Trip Event Let-down Event BTA Prediction
1 Health < 0.5 02/09 11:40 – 11:40 N/A N/A False positive
2 Health < 0.5 02/09 19:40 – 19:40 N/A N/A False positive
3 Health < 0.5 03/09 00:00 – 00:10 N/A N/A False positive
4 Health < 0.5 03/09 01:05 – 02:10 03/09 01:12 – 01:19 N/ASuccessful – trip
event
Boiler 1: Valid Time – 01/09 23:55 – 04/09 23:55

Results – Week 3
Copyright 2021 Opti-Num Solutions (Pty) Ltd 32
• This graph corresponds to events 3 and 4.
• Blue line represents the health value. The orange line represents the trip state where 1 = normal, 0 = trip.
• Appears that the false positive at event 3 could’ve been an early warning for event 4.

Results
Copyright 2021 Opti-Num Solutions (Pty) Ltd 33
• Results look promising
– Successful predictions were made within 40min prior to the trip
– Distinction was made between regular trip and a let-down event
• Improvements on false positives and false negatives
• From analysis it was identified that BTA requires a better definition of the boiler’s “healthy” state
– This will give a better baseline to establish an accurate health value
– All that is required is to identify critical tags and the healthy ranges of their value
– Since the BTA has already successfully predicted a trip this should improve the prediction capabilities of the BTA

Summary and Conclusions
• End-to-end solution was built in MATLAB
– Prototyping the algorithm
– Data Access
– Data Pre-processing
– Machine Learning Model
– Deployed to executable
• Live deployment showed some promising results, but there is room for refinement
• The solution approach was general, and could be applied to a variety of applications, and not just the detection of boiler trips
• Tangible results with relatively small investment
Copyright 2021 Opti-Num Solutions (Pty) Ltd 34

Thank you!
• Opti-Num Solutions
– Webinar Queries: [email protected]
– Sales Queries: [email protected]
• John Thompson
– Webinar Queries: [email protected]
– Sales Queries: [email protected]
Copyright 2021 Opti-Num Solutions (Pty) Ltd 35