Embed Size (px)
Citation preview

1
Gabrielov, A. ([email protected])Purdue U.
Keilis-Borok, V. ([email protected])UCLA & MITPAN, Moscow
Soloviev, A. ([email protected])MITPAN, Moscow & ICTP, Trieste
Vinberg, F. ([email protected])MITPAN, Moscow
Predictability of extreme events
with applications
to surges of mass violence and terrorism

2
Intermittent collaboration with disaster management organizations in
Russia, Italy, US, and reinsurance companies in Russia, Switzerland, and
Spain.
Collaboration of scientists and technical experts from:
� The Abdus Salam International Centre for
Theoretical Physics, Trieste
� University of Trieste
� University of Rome (La Sapienza)
� EU Int. School for Public Policy Studies,
Luxembourg
� Institut de Physique du Globe de Paris
� Ecole Normale Supérieure (Paris)
� Observatoire de la Côte d'Azur
� Geophysical Institute of Israel
� University of Tel Aviv
� Council for Disaster Preparedness, Govt. of
Israel
� Natl. Center for Physics, Islamabad
� Natl. Institute of Geophysics, Hyderabad
� IIEPT, Moscow
�Moscow State University
� Institute of Mathematics &
Mechanics, Russian Ac. Sci.
(Ekaterinburg)
� Vernadsky State Geological
Museum, Russian Ac. Sci.
� UCLA
�MIT
� UC Davis
� Purdue University
� USGS
� LA Dept of Water and Power
� Los Alamos Natl. Laboratory
� LA Police Department

3
Coping with the lack of fundamental equations
“It became clear for me that it is unrealistic to have a hope for
the creation of a pure theory [of the turbulent flows of fluids
and gases] closed in itself.
Due to the absence of such a theory we have to rely upon the
hypotheses obtained by processing of the experimental data.“
A. Kolmogorov.
4
SCHEME OF DATA ANALYSIS
Prediction is targeted at extreme events.
Vertical lines show the point process, where precursors are looked for; continuous
processes might be considered as well. Fk are the its integral characteristics,
capturing hypothetical precursors. The set of precursors is used for pattern
recognition of alarms.
Alarm Alarm
Extreme Events
F1
F2
Fn
....

5
Premonitory transformation of complex processes (found in modeling
and data analysis).
Clustering
Range ofcorrelation
in space
Non-precursorystate
Precursorystate
Intensity
Magnitude-
frequencyrelation
lgN
m
lgN
m

6
90 E°
90 E°
100 E°
100 E°
110 E°
110 E°
120 E°
120 E°
10°S10°S
0°0°
10°N10°N
04 June 2000, M8.0 Sumatera earthquakeand its aftershocks
South Sumatera, 2000/06/04, M=8.0
75 80 85 90 95 00
Distance, km
75 80 85 90 95 00
N1
N2
L1
L2
Z1
Z2
B
Time
-667
0
667

7
COMPARING SCALING CLOSE TO AND FAR FROM
EXTREME EVENTS
• Time is divided into periods of three kinds:
D - preceding a critical transition; X - following it; N – other time
intervals
• Scaling relation is function N(m) - the number of events of the size ≥ M; its useful normalization is N(M) = Ň P(M) where Ň is the total number of events.
• We determine N(M) separately for periods D and N. Their difference demonstrates premonitory pattern considered. Its predictive power
requires further analysis.
Critical transitions
Time
DD NX X

8
A POINT OF DEPARTURE – EARTHQUAKES
Courtesy of Z. Liu and H. Wong4 5 6 7
0.001
0.01
0.1
1
D-periods
N-periods
P(M)
M
0.01 0.1 1 10
0.01
0.1
1
D-periods
N-periods
P(M)
M0.001 0.01 0.1 1
0.01
0.1
1
D-periods
N-periods
P(M)
M
b c
aa
SOUTHERN CALIFORNIA, 1954 – 2006 (a), CALIFORNIA, 1968 – 2005(b, c)....
Critical transitions (prediction targets) are the earthquakes with M ≥ 6.4 (a) and
the main shocks with M ≥ 6.4 (b, c).
Probabilities P(M) are estimated for magnitudes of individual earthquakes (a), M is
the logarithmic measure of energy released by an earthquake, and for clusters of
aftershocks formed around individual earthquakes. P(M) is estimate of probability
that the magnitude of an earthquake ≥ M (a) or that cluster’s size ≥ M (b, c).
Cluster’s size is measured in number of aftershocks not weighted (b) or weighted (c)
by their magnitudes.

9
http://www.igpp.ucla.edu/predict
ion/ref/Pre-recession.pdf Current alarm is placed on prediction
website of the Anderson’s school of
management, UCLA.
http://www.uclaforecast.com
http://www.igpp.ucla.edu/prediction
/ref/Unemployment.pdf
http://www.igpp.ucla.edu/prediction/
ref/Homicide.pdf
US ECONOMIC RECESSIONS (a), SURGES OF UNEMPLOYMENT, US, 1961 - 2005 (b), SURGE OF HOMICIDES, LOS ANGELES, 1975 – 1993 (c)....
Critical transitions (prediction targets) are the start of a recession (a), the starting point of a
fast and lasting acceleration of unemployment rate (b), and the starting point of a lasting surge
of homicide rate (c).
Probabilities P(M) are estimated for the drop M of industrial production’s trend (a and b) and
for the monthly rates of lesser crimes – assaults with firearms (c). P(M) is estimate of
probability that the drop of industrial production’s trend (a and b) or of the monthly rate of lesser
crime (c) has the absolute size ≥ M. Refs: links given in the figures.
a b c
Socio-economic crises
0.01 0.1 1 10
0.01
0.1
1
M
P(M
)
D-periods
N-periods
0.01 0.1 1
0.01
0.1
1
M
P(M
)
D-periods
N-periods
1 10 100
0.01
0.1
1
M
P(M
)
D-periods
N-periods

10
Israel, deaths & injuries per year, monthly indicators,
international (black dots) & domestic (blue dots), 1996.01-2006.07.
Extreme events: 2002.03 (Gaza) and 2006.07(Lebanon)
1996 1998 2000 2002 2004 2006 200810
0
101
102
103
110 0.5 1 1.5 2 2.5
0
0.1
0.2
0.3
0.4
0.5
0.6
0.7
0.8
0.9
1
M
P(M
)
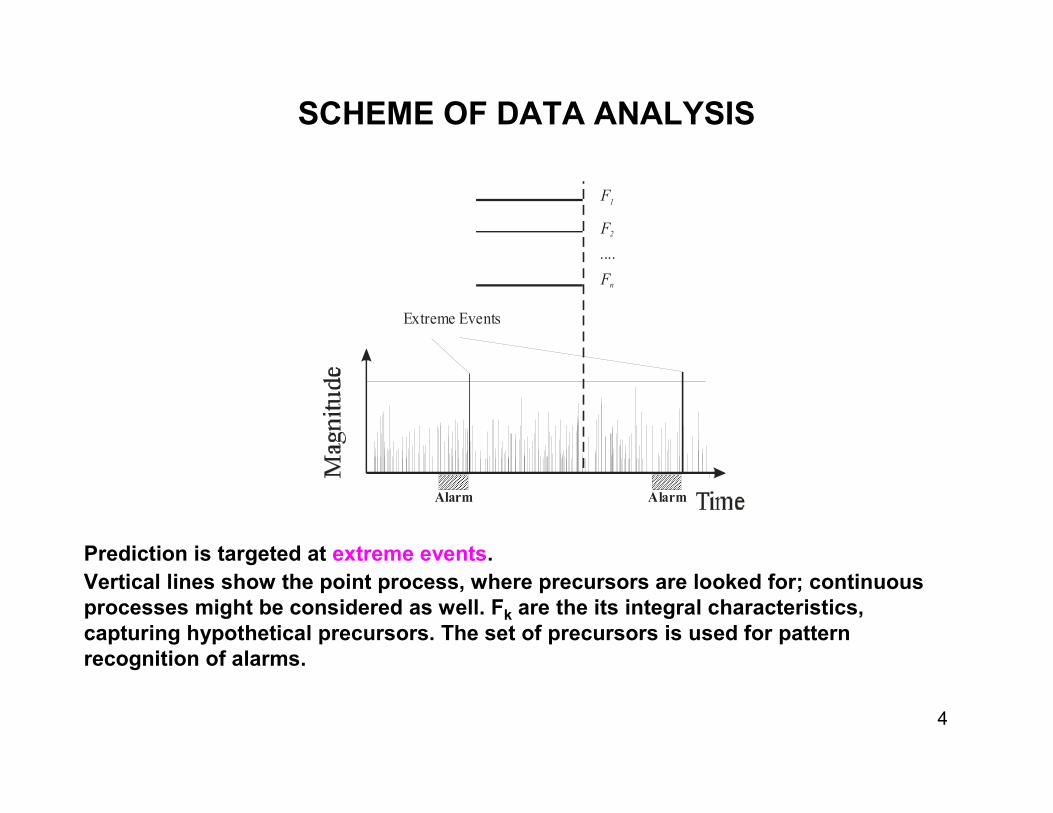
Israel, deaths & injuries per year, international,
1996.01-2002.03 (first extreme event).
D = 14.8 months, N = 59.2 months , NDtot = 13, NN
tot = 20.
Magnitude distributions for interval D (red) and N (blue).

12
1
10
100
1000
Jan-
01
Jul-0
1
Jan-
02
Jul-0
2
Jan-
03
Jul-0
3
Jan-
04
Jul-0
4
Jan-
05
Jul-0
5
Jan-
06
Jul-0
6 al-Aqsa Martyrs Brigades
al-Fatah
Democratic Front for the Liberation of Palestine (DFLP)
Hamas
Palestinian Islamic Jihad (PIJ)
Israel, deaths & injuries by groups, international, 2001.01-2006.07.
Extreme events: 2002.03 (Gaza) and 2006.07(Lebanon).

13
1
10
100
Jan-
01
Jul-0
1
Jan-
02
Jul-0
2
Jan-
03
Jul-0
3
Jan-
04
Jul-0
4
Jan-
05
Jul-0
5
Jan-
06
Jul-0
6 al-Aqsa Martyrs Brigades
al-Fatah
Democratic Front for the Liberation of Palestine (DFLP)
Hamas
Palestinian Islamic Jihad (PIJ)
1.3d Israel, incidents by groups, domestic, 2001.01-2006.07.
Extreme events: 2002.03 (Gaza) and 2006.07(Lebanon).

14
2. Russia, deaths & injuries per year, monthly indicators,
international (black dots) & domestic (blue dots), 1993.01-2006.07.
Extreme events: 1999.09 (Moscow), 2002.10 (Moscow) and 2004.09 (Beslan)
1992 1994 1996 1998 2000 2002 2004 2006 200810
0
101
102
103
104

150 0.5 1 1.5 2 2.5
0
0.1
0.2
0.3
0.4
0.5
0.6
0.7
0.8
0.9
1
M
P(M
)
Russia, deaths & injuries per year, domestic,
2000.01-2004.09 (second extreme event).
D = 17.1 months, N = 39.9 months , NDtot = 15, NN
tot = 23.
Magnitude distributions for interval D (red) and N (blue).

16
3. Pakistan, deaths & injuries per year, monthly indicators,
international (red dots) & domestic (blue dots), 1970.01-2006.07.
[ Kashmir, domestic (green dots) ]
Extreme events: 1988.04 (Islamabad) and 2004.03(Quetta)
1970 1975 1980 1985 1990 1995 2000 2005 201010
0
101
102
103
104

170 0.5 1 1.5 2 2.5 3
0
0.1
0.2
0.3
0.4
0.5
0.6
0.7
0.8
0.9
1
M
P(M
)
Pakistan, deaths & injuries per year, international,
1970.01-1988.04 (first extreme event).
D = 21.6 months, N = 197.4 months , NDtot = 12, NN
tot = 15.
Magnitude distributions for interval D (red) and N (blue).

18
Possible outcomes of
prediction

19
SOCIO-ECONOMIC PREDICTIONS

20
* Analysed in error diagrams only
� Unlawful not forcible
entry
� Attempted forcible
entry*
� All*
� With firearms
� With knife or cutting
instrument
� With other dangerous
weapon*
� Aggravated injury
assaults*
� All
� With firearms
� With knife or cutting
instrument
� With other
dangerous weapon
� Strong-arm
robberies*
� All
BurglariesAssaultsRobberiesHomicide
Note that other potentially relevant data might also be used for prediction.
TYPES OF CRIMES (TIME SERIES) CONSIDERED

21
SCHEME OF PREMONITORY CHANGES IN CRIME STATISTICS
22
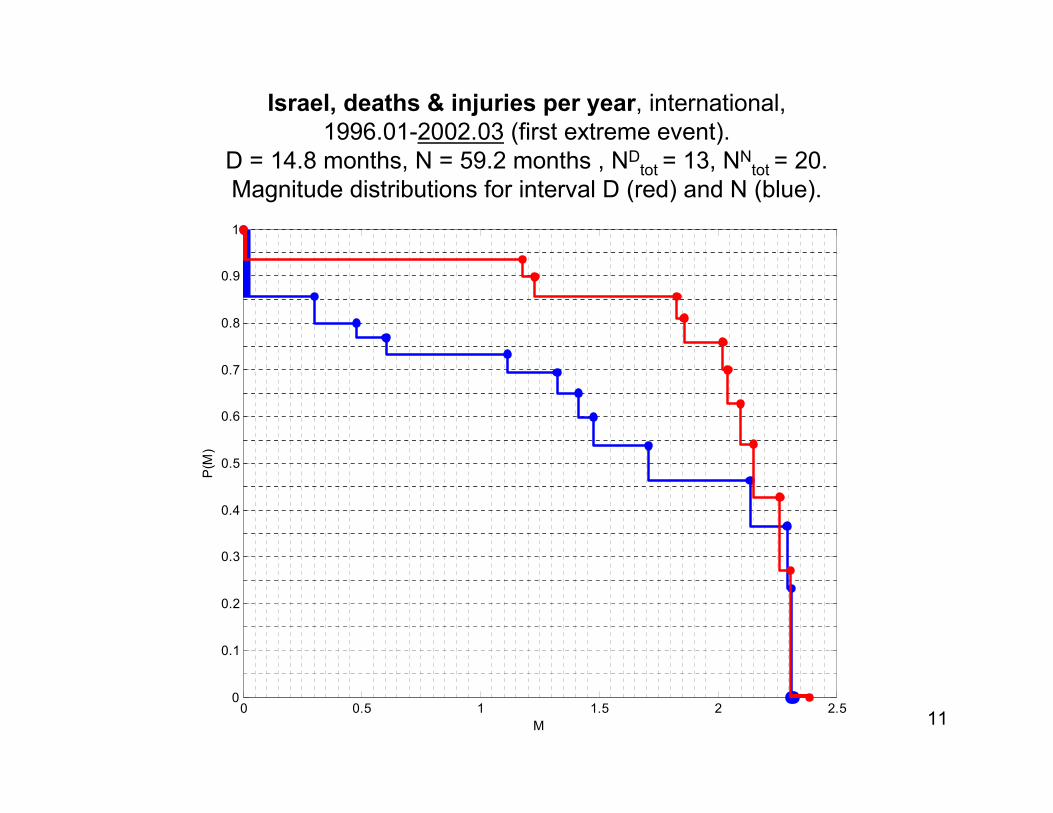
Algorithm M8. Prediction of Loma Prieta
ea-ke, 1989, M = 7.1
Subject of correspondence between M.Gorbachev and R. Reagan
in 1988
1988 1989
1985- 1987
1981- 1984

23
SCORINGSeveral algorithms are tested by prediction in advance
placed at the web site.
Ea-s with M≥8 Since 1885; Algorithm “M8” captured 8 out
of 10 earthquakes with occurred alarms altogether
occupy 1/3 of time-space.
Second strong ea-ke in a pair. Since 1989 Algorithm
“SSE” was applied since 1989. Out of 29 predictions
24 were correct and 5 wrong (2 failures-to-predict a and
3 false alarms).

24
WHAT IS THE PLACE OF SUCH PREDICTION IN THE
BROEAD FIELD OF PREDICTION RESEARCH?
This prediction is targeted at the rare extreme point events; predictor is
a discrete sequence of alarms.
Gelfand’s pattern recognition of rare events - natural framework for
Intergation modelling, theory, and data analysis
That approach is complementary to:
– classical Kolmogoroff-Wiener prediction, - extrapolation
of a whole process
– cause-and-effect analysis
– multi regression
The premonitory phenomena might be not perpetrators but
witnesses; and they might predict not an extreme event per se but
destabilization of the system, which makes is ripe for an extreme event.