Embed Size (px)
Citation preview

with Frank Ochoa
PRECISION SWING TRADINGAFTA SIG
MAY 25, 2013
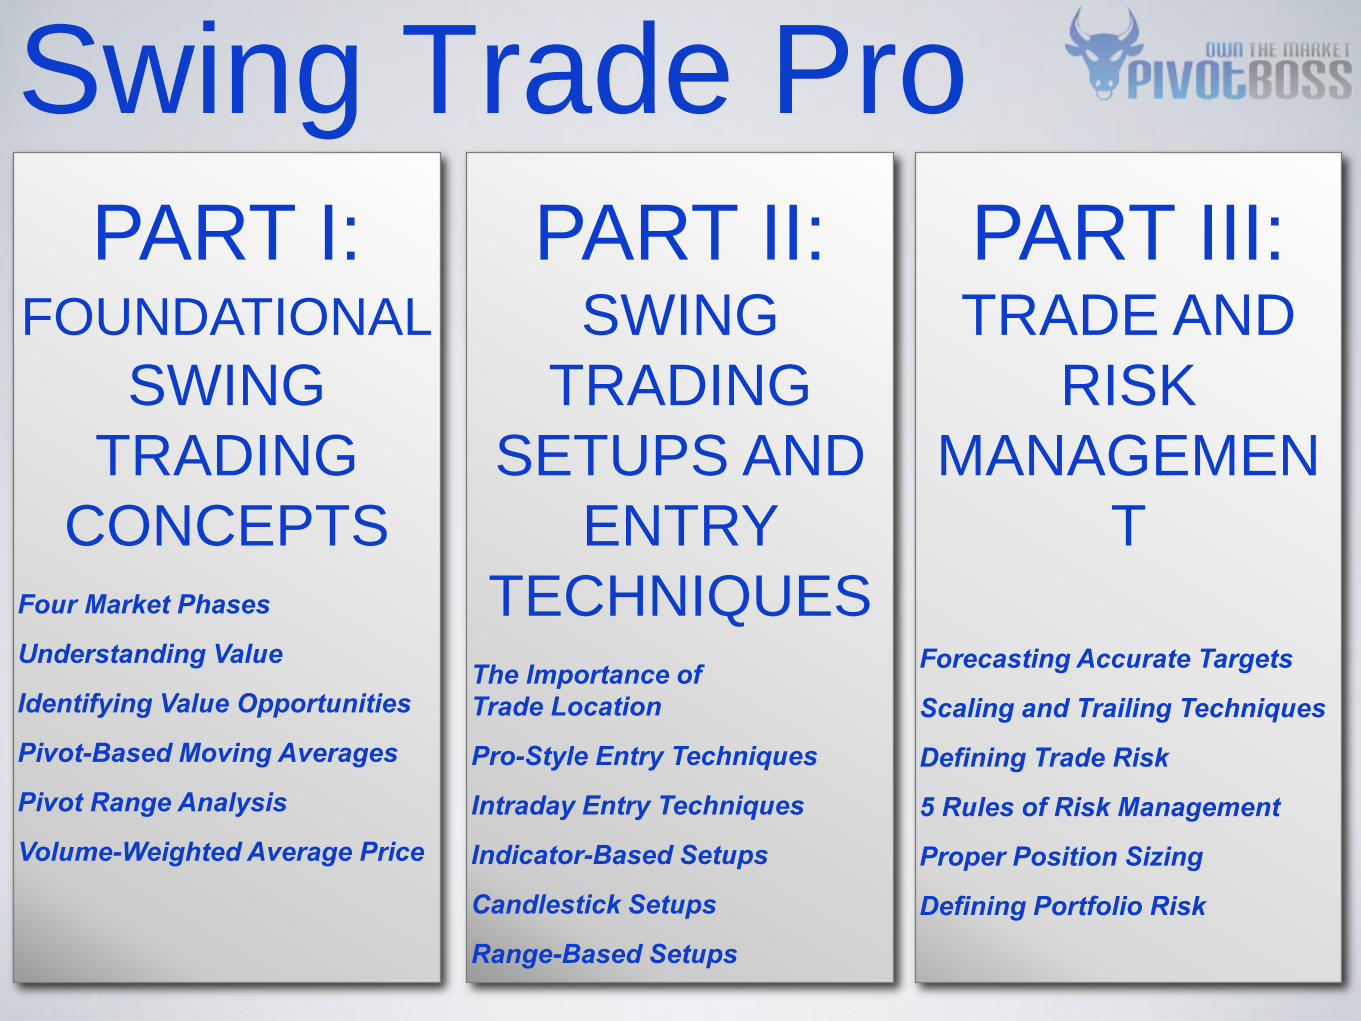
Swing Trade Pro
PART II: SWING
TRADING
SETUPS AND
ENTRY
TECHNIQUES
The Importance of
Trade Location
Pro-Style Entry Techniques
Intraday Entry Techniques
Indicator-Based Setups
Candlestick Setups
Range-Based Setups
PART III: TRADE AND
RISK
MANAGEMEN
T
Forecasting Accurate Targets
Scaling and Trailing Techniques
Defining Trade Risk
5 Rules of Risk Management
Proper Position Sizing
Defining Portfolio Risk
PART I: FOUNDATIONAL
SWING
TRADING
CONCEPTS
Four Market Phases
Understanding Value
Identifying Value Opportunities
Pivot-Based Moving Averages
Pivot Range Analysis
Volume-Weighted Average Price

the Four Market
Phases
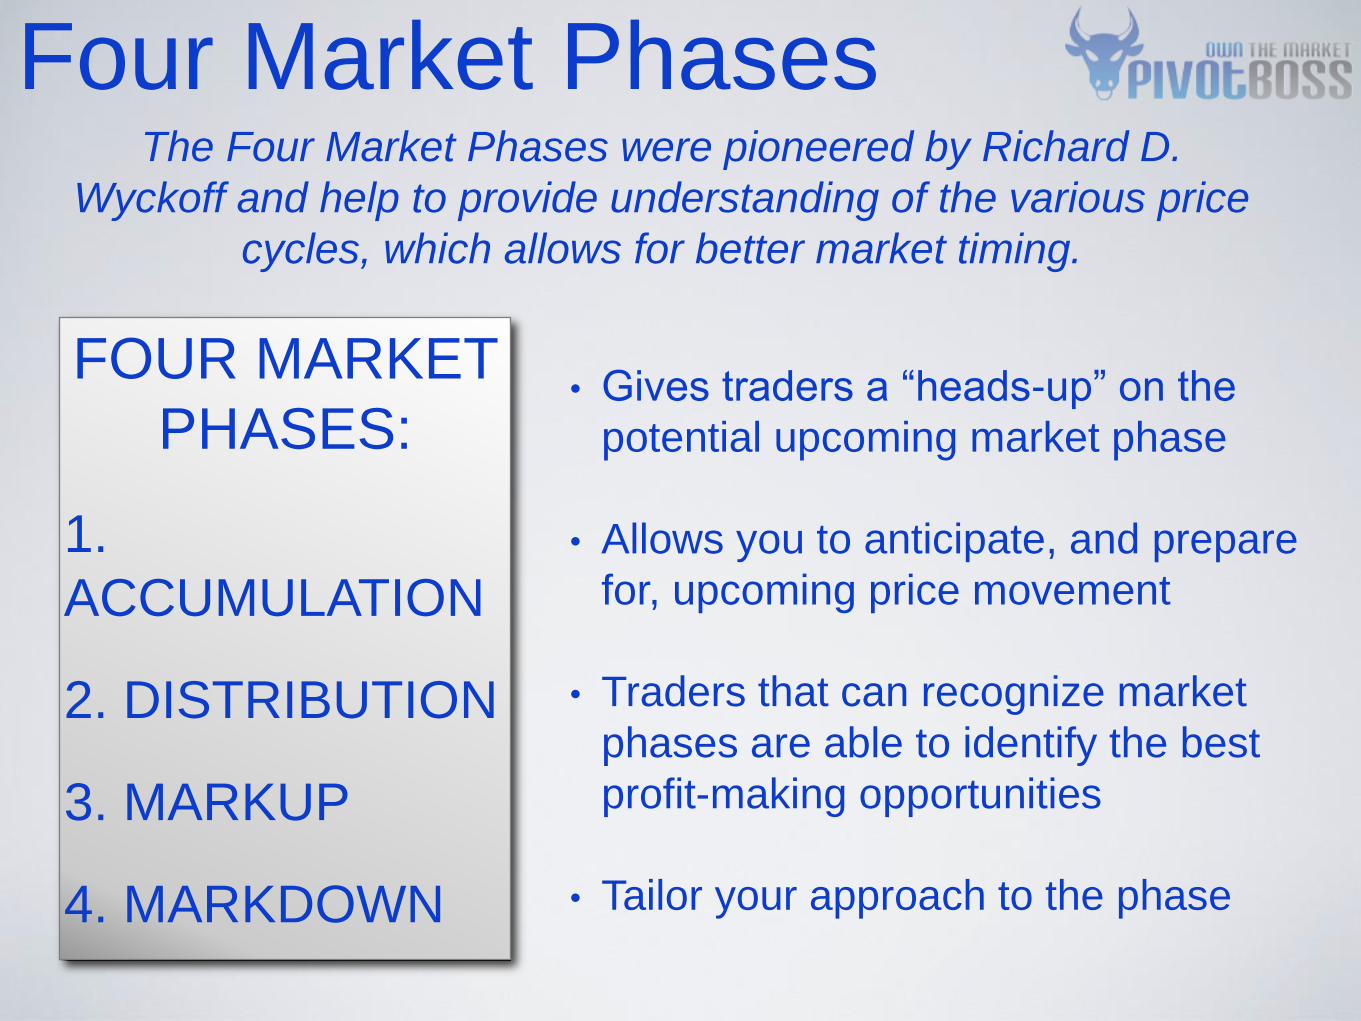
Four Market Phases
• Gives traders a “heads-up” on the
potential upcoming market phase
• Allows you to anticipate, and prepare
for, upcoming price movement
• Traders that can recognize market
phases are able to identify the best
profit-making opportunities
• Tailor your approach to the phase
The Four Market Phases were pioneered by Richard D.
Wyckoff and help to provide understanding of the various price
cycles, which allows for better market timing.
FOUR MARKET
PHASES:
1.
ACCUMULATION
2. DISTRIBUTION
3. MARKUP
4. MARKDOWN
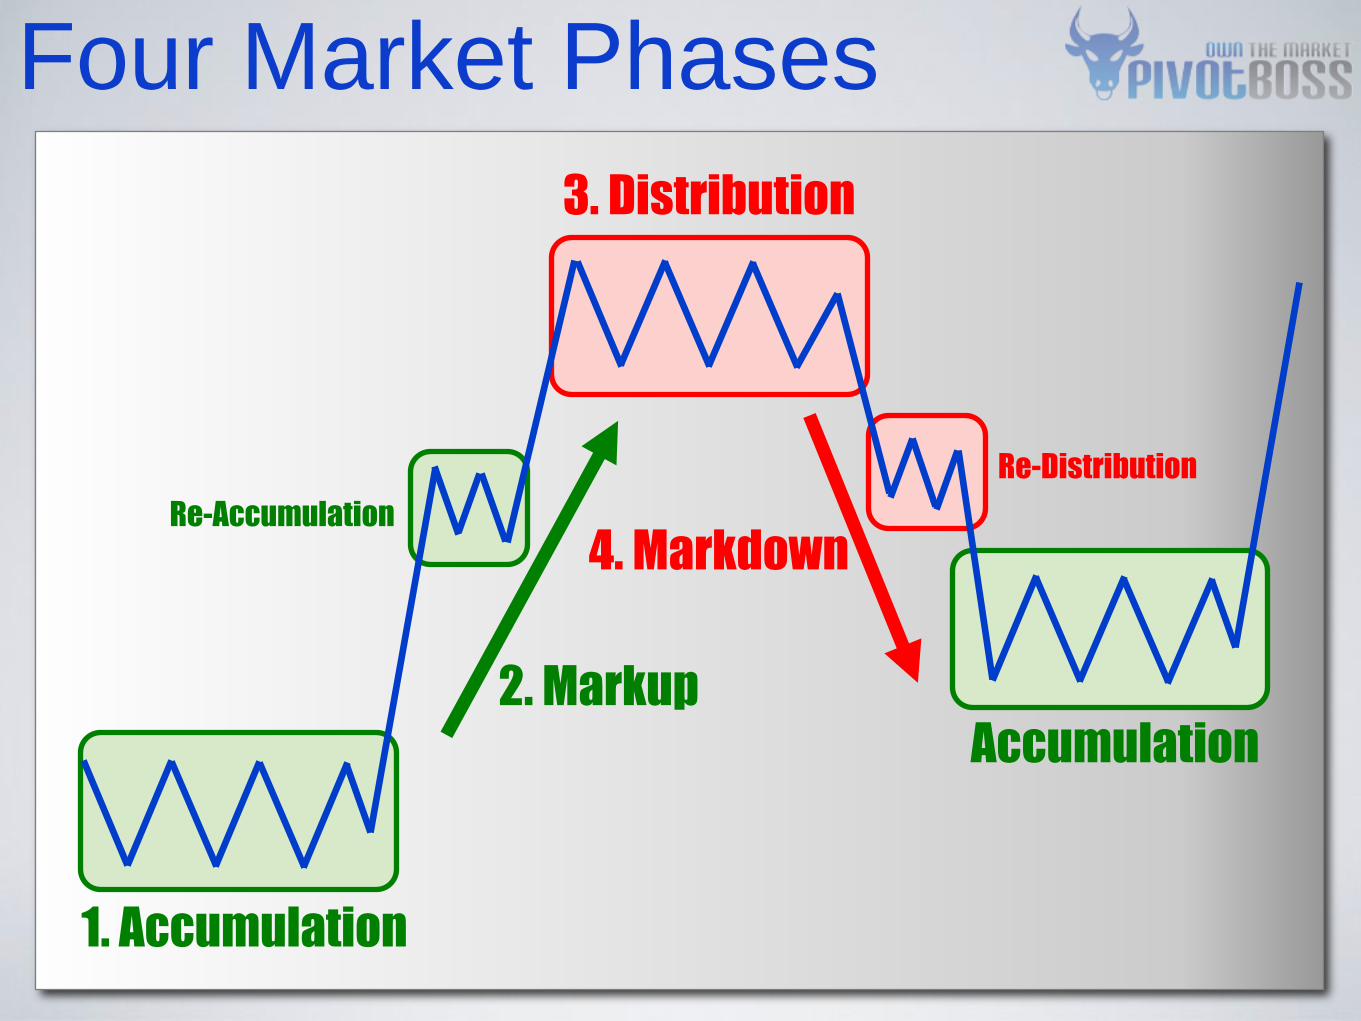
Four Market Phases
1. Accumulation
Accumulation
Re-Accumulation
3. Distribution
Re-Distribution
2. Markup
4. Markdown
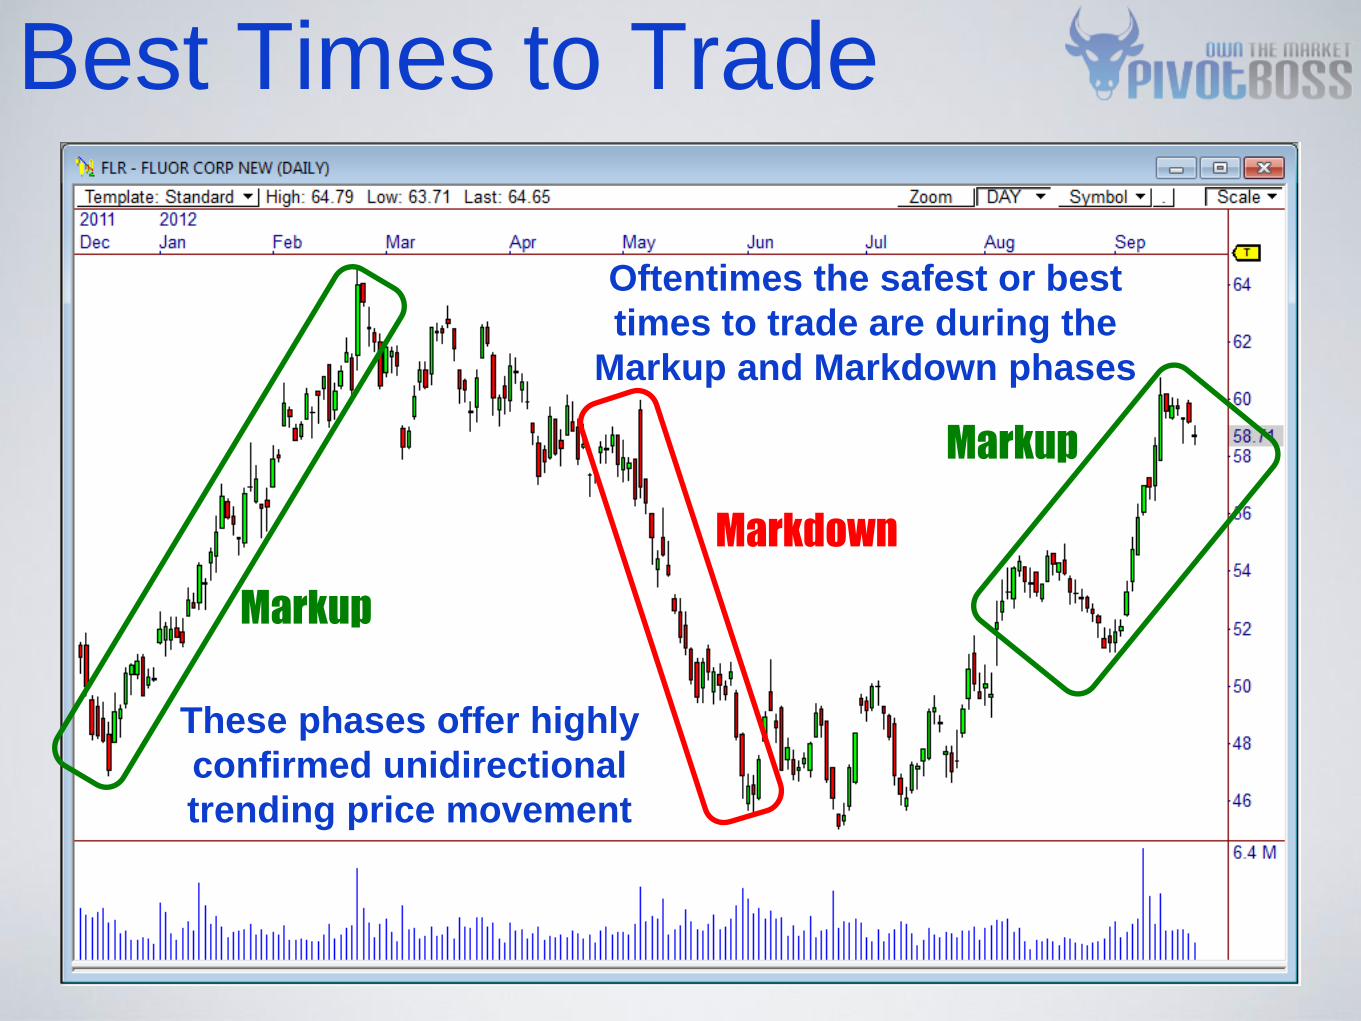
Best Times to Trade
Markup
Markdown
Markup
Oftentimes the safest or best
times to trade are during the
Markup and Markdown phases
These phases offer highly
confirmed unidirectional
trending price movement
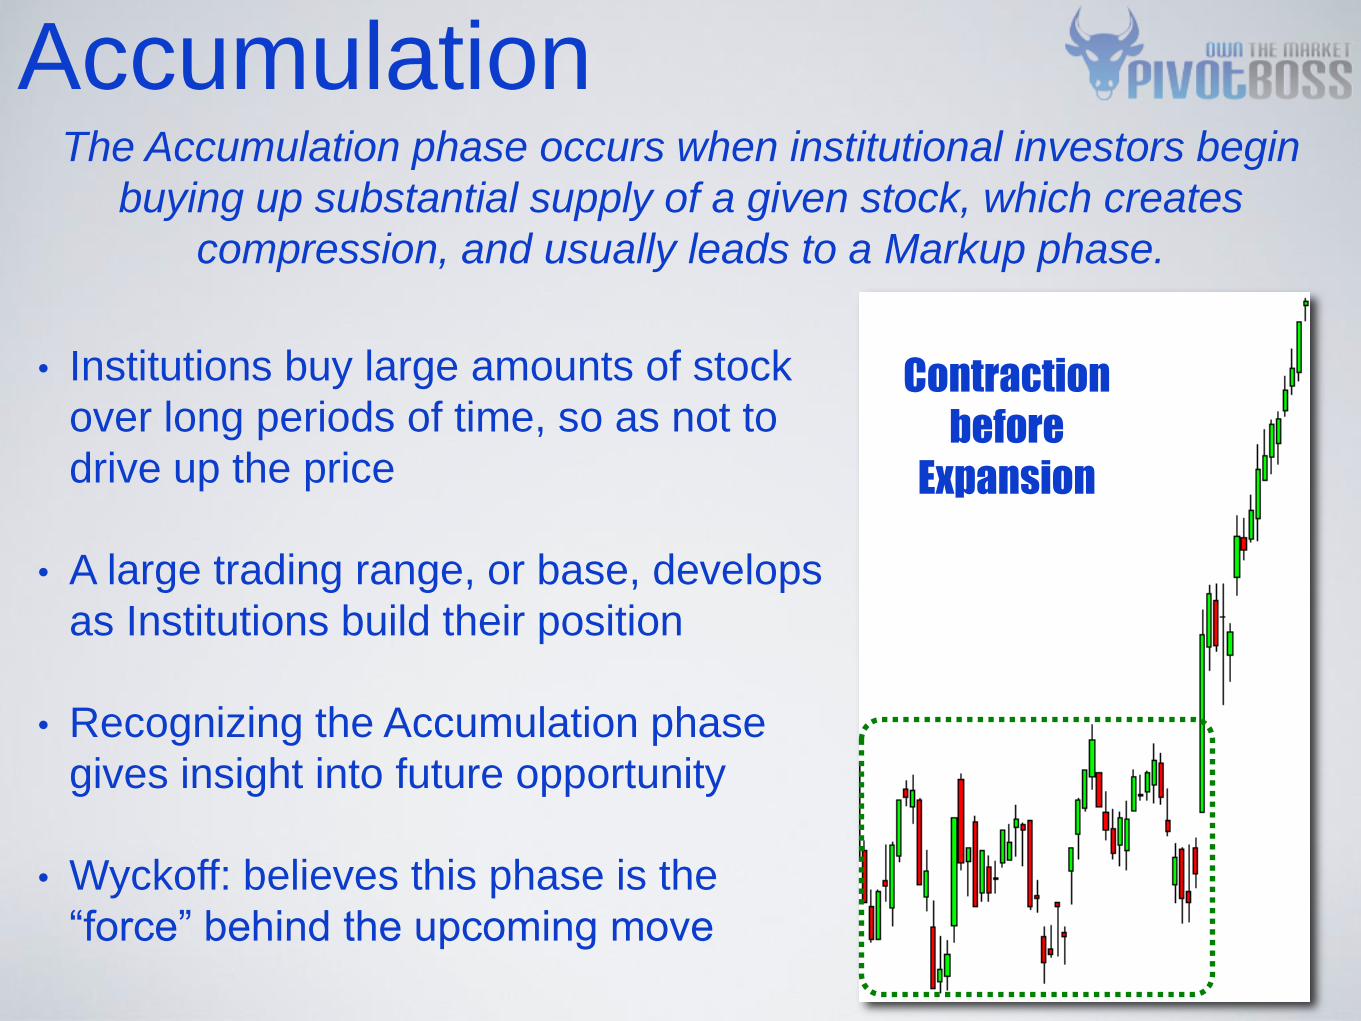
Accumulation
• Institutions buy large amounts of stock
over long periods of time, so as not to
drive up the price
• A large trading range, or base, develops
as Institutions build their position
• Recognizing the Accumulation phase
gives insight into future opportunity
• Wyckoff: believes this phase is the
“force” behind the upcoming move
The Accumulation phase occurs when institutional investors begin
buying up substantial supply of a given stock, which creates
compression, and usually leads to a Markup phase.
Contraction
before
Expansion
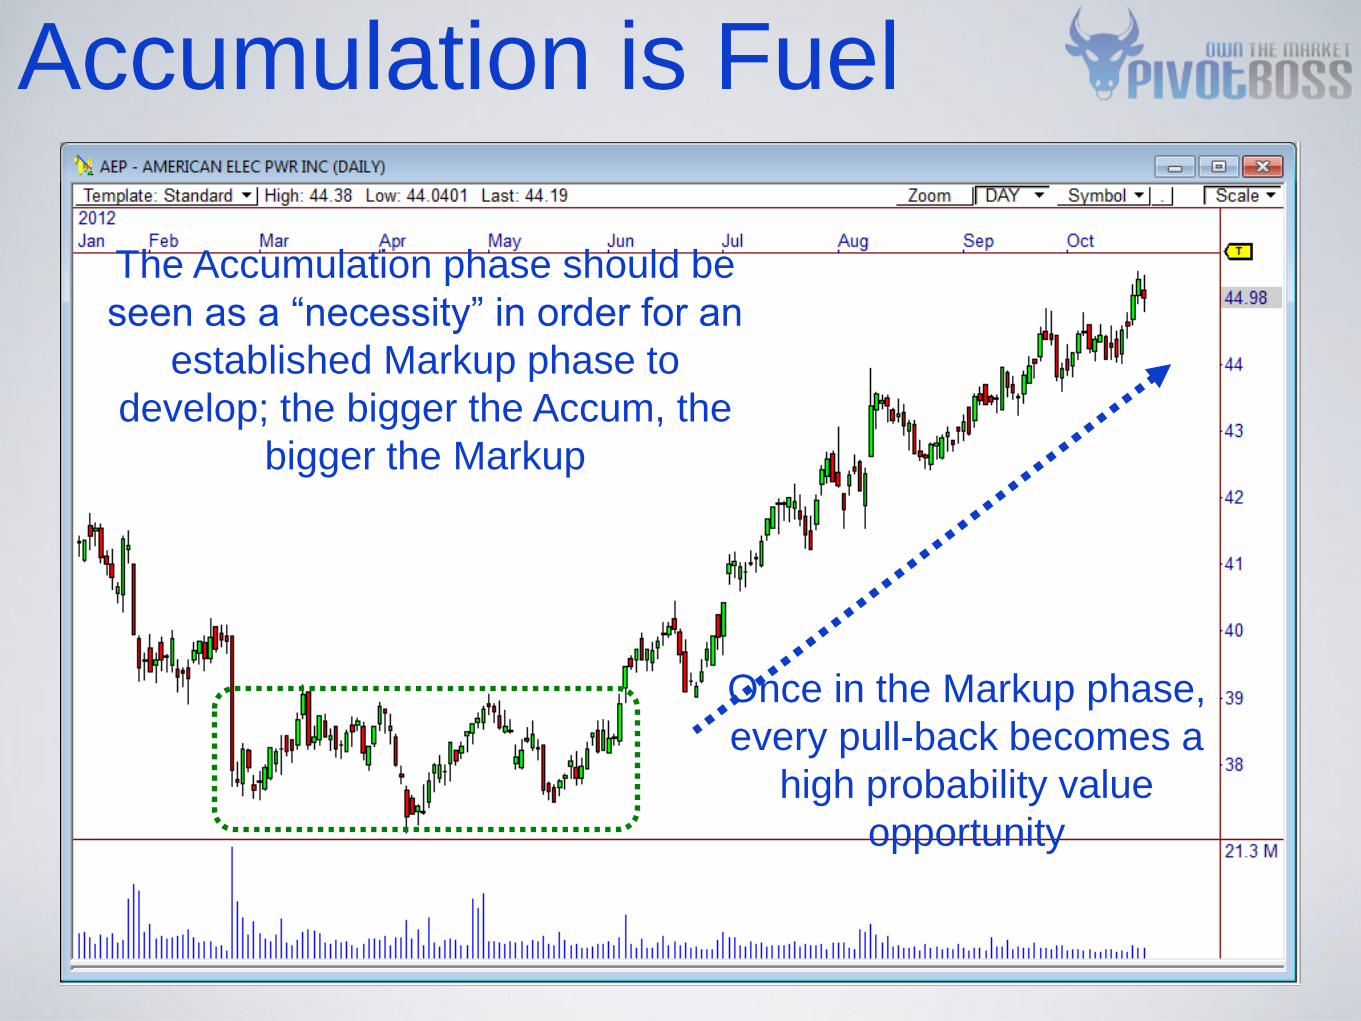
Accumulation is Fuel
The Accumulation phase should be
seen as a “necessity” in order for an
established Markup phase to
develop; the bigger the Accum, the
bigger the Markup
Once in the Markup phase,
every pull-back becomes a
high probability value
opportunity
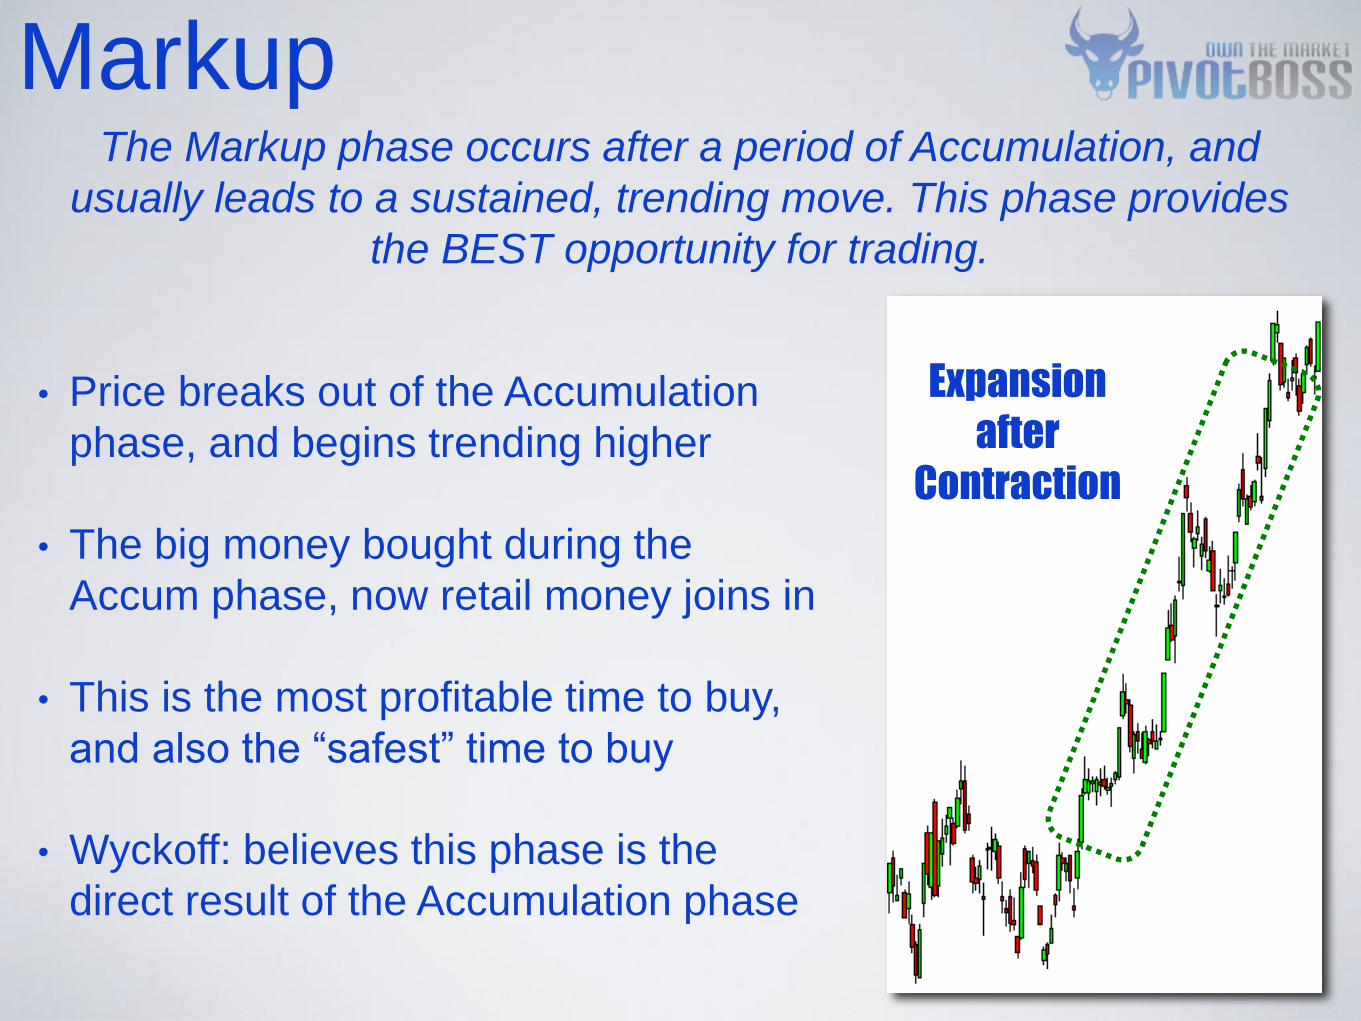
Markup The Markup phase occurs after a period of Accumulation, and
usually leads to a sustained, trending move. This phase provides
the BEST opportunity for trading.
• Price breaks out of the Accumulation
phase, and begins trending higher
• The big money bought during the
Accum phase, now retail money joins in
• This is the most profitable time to buy,
and also the “safest” time to buy
• Wyckoff: believes this phase is the
direct result of the Accumulation phase
Expansion
after
Contraction

Best Trading Opps
Many techniques and tools can be used to
identify pull-back opportunities, like moving
averages, VWAP, candlestick setups, and more!
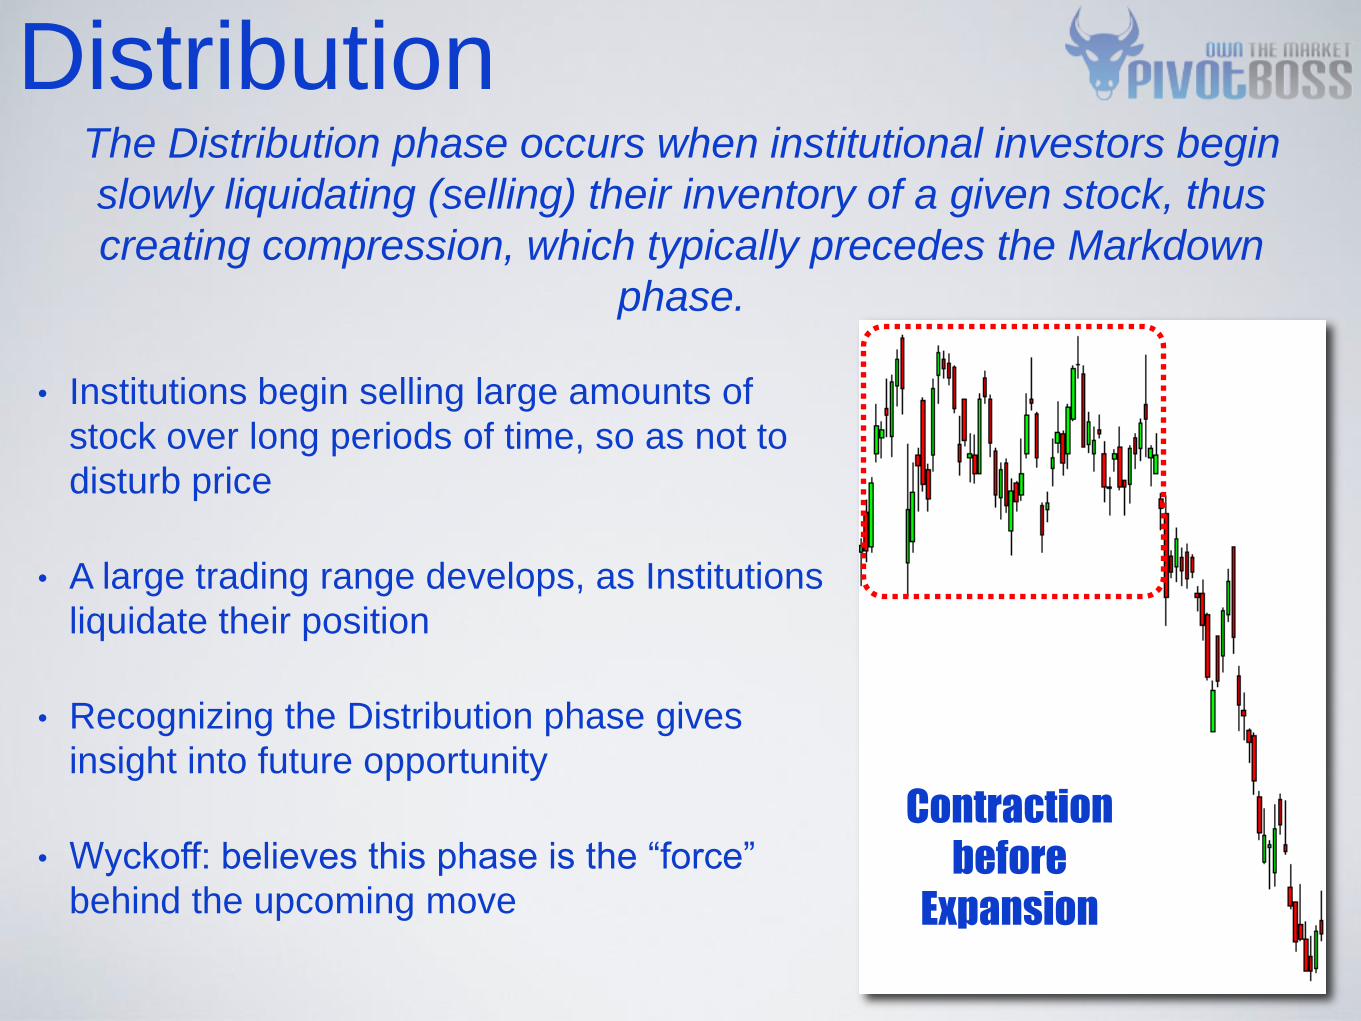
Distribution
• Institutions begin selling large amounts of
stock over long periods of time, so as not to
disturb price
• A large trading range develops, as Institutions
liquidate their position
• Recognizing the Distribution phase gives
insight into future opportunity
• Wyckoff: believes this phase is the “force”
behind the upcoming move
The Distribution phase occurs when institutional investors begin
slowly liquidating (selling) their inventory of a given stock, thus
creating compression, which typically precedes the Markdown
phase.
Contraction
before
Expansion
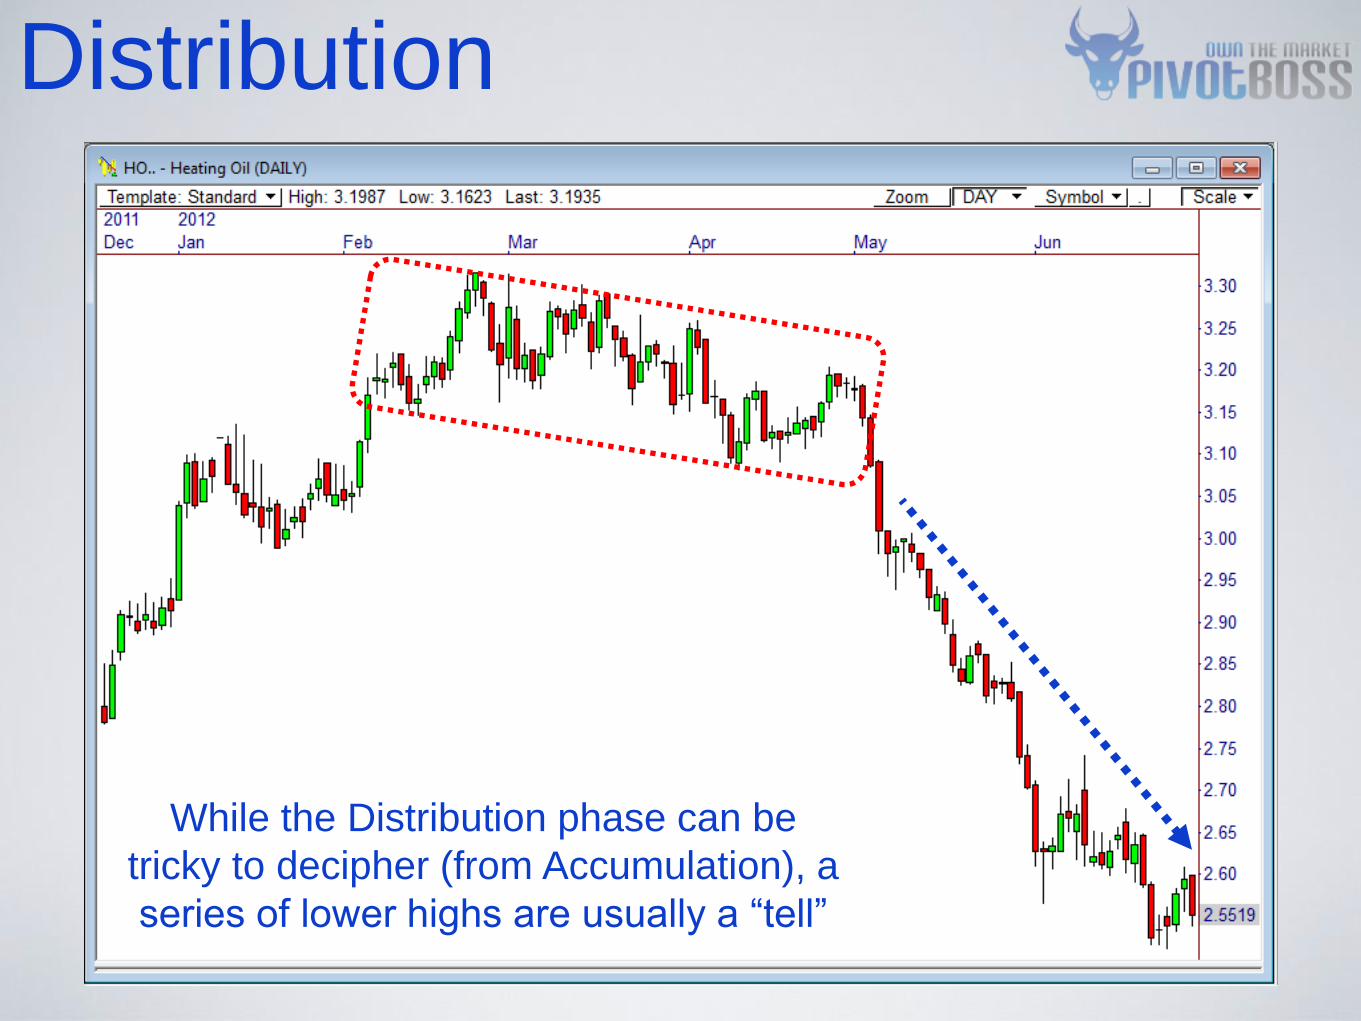
Distribution
While the Distribution phase can be
tricky to decipher (from Accumulation), a
series of lower highs are usually a “tell”
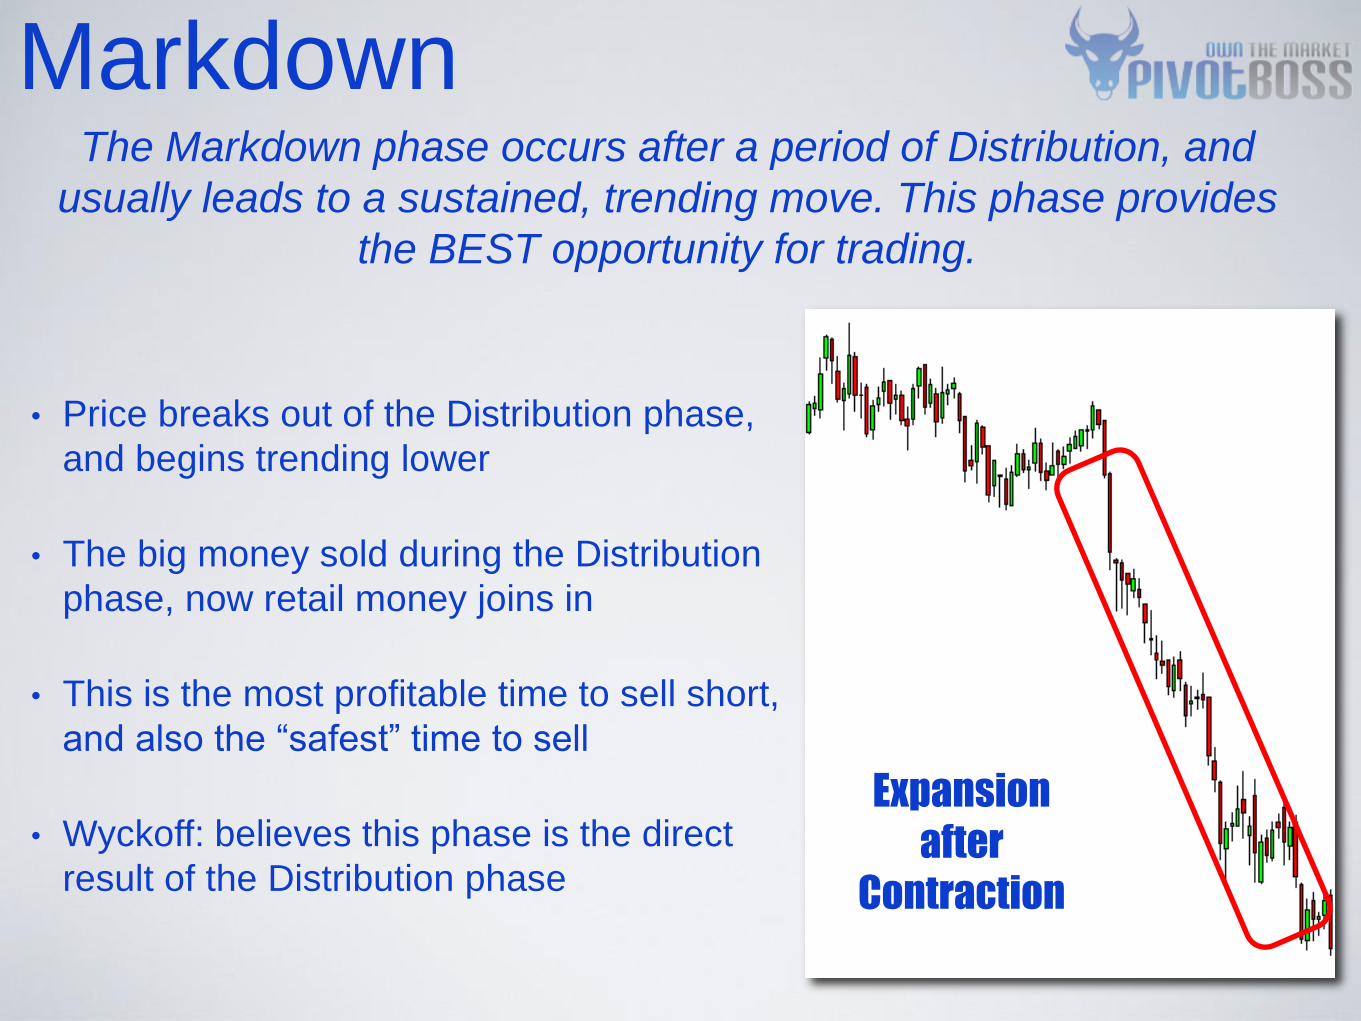
Markdown The Markdown phase occurs after a period of Distribution, and
usually leads to a sustained, trending move. This phase provides
the BEST opportunity for trading.
• Price breaks out of the Distribution phase,
and begins trending lower
• The big money sold during the Distribution
phase, now retail money joins in
• This is the most profitable time to sell short,
and also the “safest” time to sell
• Wyckoff: believes this phase is the direct
result of the Distribution phase
Expansion
after
Contraction

Markdown
Do you need a setup to trade this?
No, you just need an understanding
of market structure and value

Identifying value
opportunities

PROFESSIONALS
UNDERSTAND VALUE Professionals rely upon their ability to identify value opportunities, and
exercise discipline to only trade when good value is present.
• Quickly and accurately determining value
directly affects profitability
• Patience and discipline are the keys to
consistently trading value opportunities
• Requiring good value for EVERY trade
dramatically improves odds for success
• Trading value reduces risk and maximizes
the potential gain

TOOLS OF THE TRADE Identifying value opportunities can be quite easy,
especially when using the right tools in the right way.
PEMA
Pivot-Based Exponential
Moving Averages visually
reveal value
opportunities during
trending markets
•Simple; accessible
•Multiple moving
averages easily identify
the trend, and its value
opportunities
•“Stacked & sloped”
offers the best way to
use this method
PIVOT
RANGE
The Pivot Range reveals
a value area each month,
which is used to identify
value opportunities
•Simple, accessible
•Pivot range trend and
width analysis can help
identify great value and
breakout opportunities
•“Buy dips, and sell rips”
at the pivot range during
trending markets
VWAP
Volume-Weighted
Average Price is a
classic indicator that
clearly reveals a real-
time value line
•Simple, semi-accessible
•VWAP offers a real-time
view of value, and
over/undervalued price
levels are easily
identified
•“Buy dips, and sell rips”
at VWAP during a
trending market

TOOLS OF THE TRADE
Accumulation
During the Markup phase, every
pull-back to the 1st and 2nd levels
of the PEMAs offers great value
opportunities
MAs are stacked &
sloped, meaning they are
all trending higher in
unison
Premium
Discount
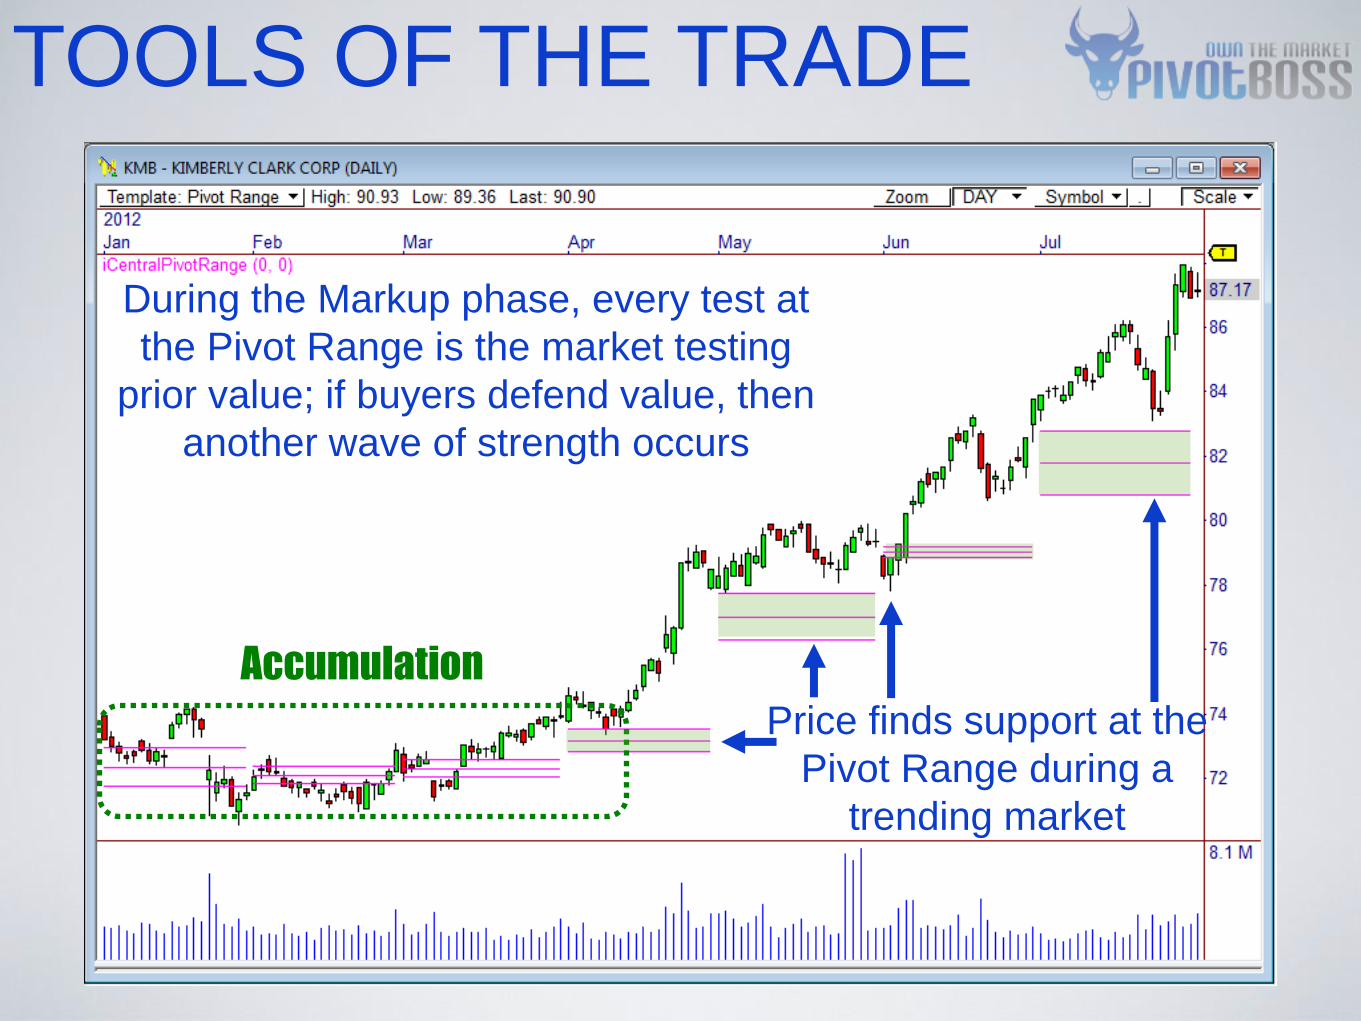
TOOLS OF THE TRADE
Accumulation
During the Markup phase, every test at
the Pivot Range is the market testing
prior value; if buyers defend value, then
another wave of strength occurs
Price finds support at the
Pivot Range during a
trending market
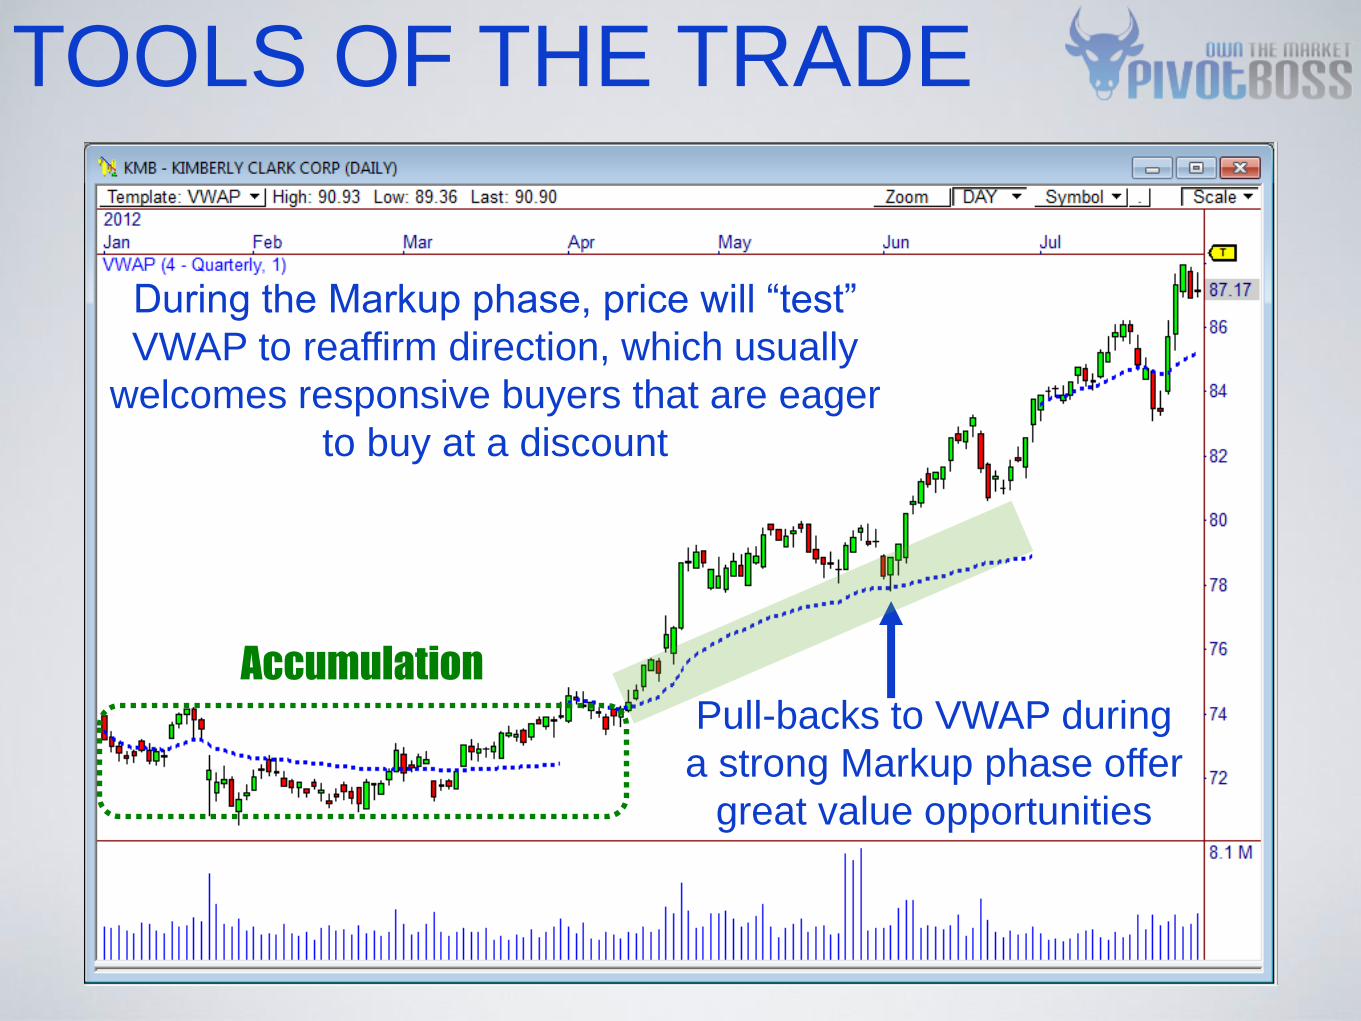
TOOLS OF THE TRADE
Accumulation
During the Markup phase, price will “test”
VWAP to reaffirm direction, which usually
welcomes responsive buyers that are eager
to buy at a discount
Pull-backs to VWAP during
a strong Markup phase offer
great value opportunities

setups

The PEMA Pull-Back setup is used to identify value opportunities
during trending markets using pivot-based moving averages.
PEMA PULL-BACK
PEMA
PULL-BACK
Finds value opportunities
during the Markup and
Markdown phases
•Value opportunity setup
•Trend-confirmed setup
•Only trade when moving
averages are “stacked and
sloped”
•Trade during Markup and
Markdown phases
Buy and Sell pull-backs only within
established Markup or Markdown phases
Can use all entry types:
OR Breakout, OR/VA Reversal,
Ambush, Retest, or Threshold
13
34
L: 13/34/55
M: 13/21/34
H: 8/13/21
55
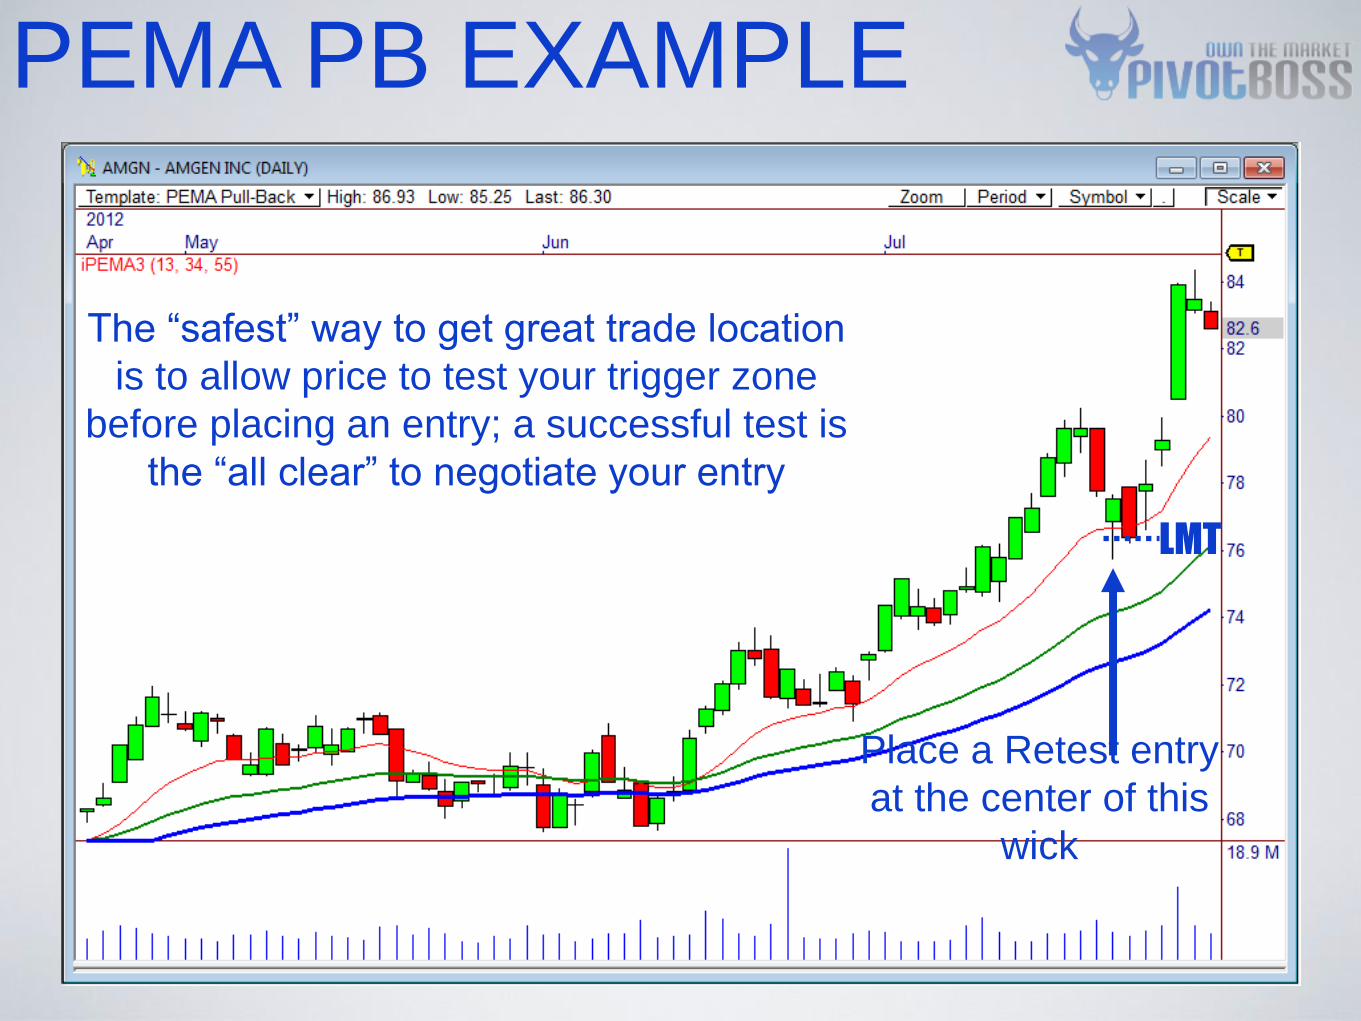
PEMA PB EXAMPLE
The “safest” way to get great trade location
is to allow price to test your trigger zone
before placing an entry; a successful test is
the “all clear” to negotiate your entry
Place a Retest entry
at the center of this
wick
LMT
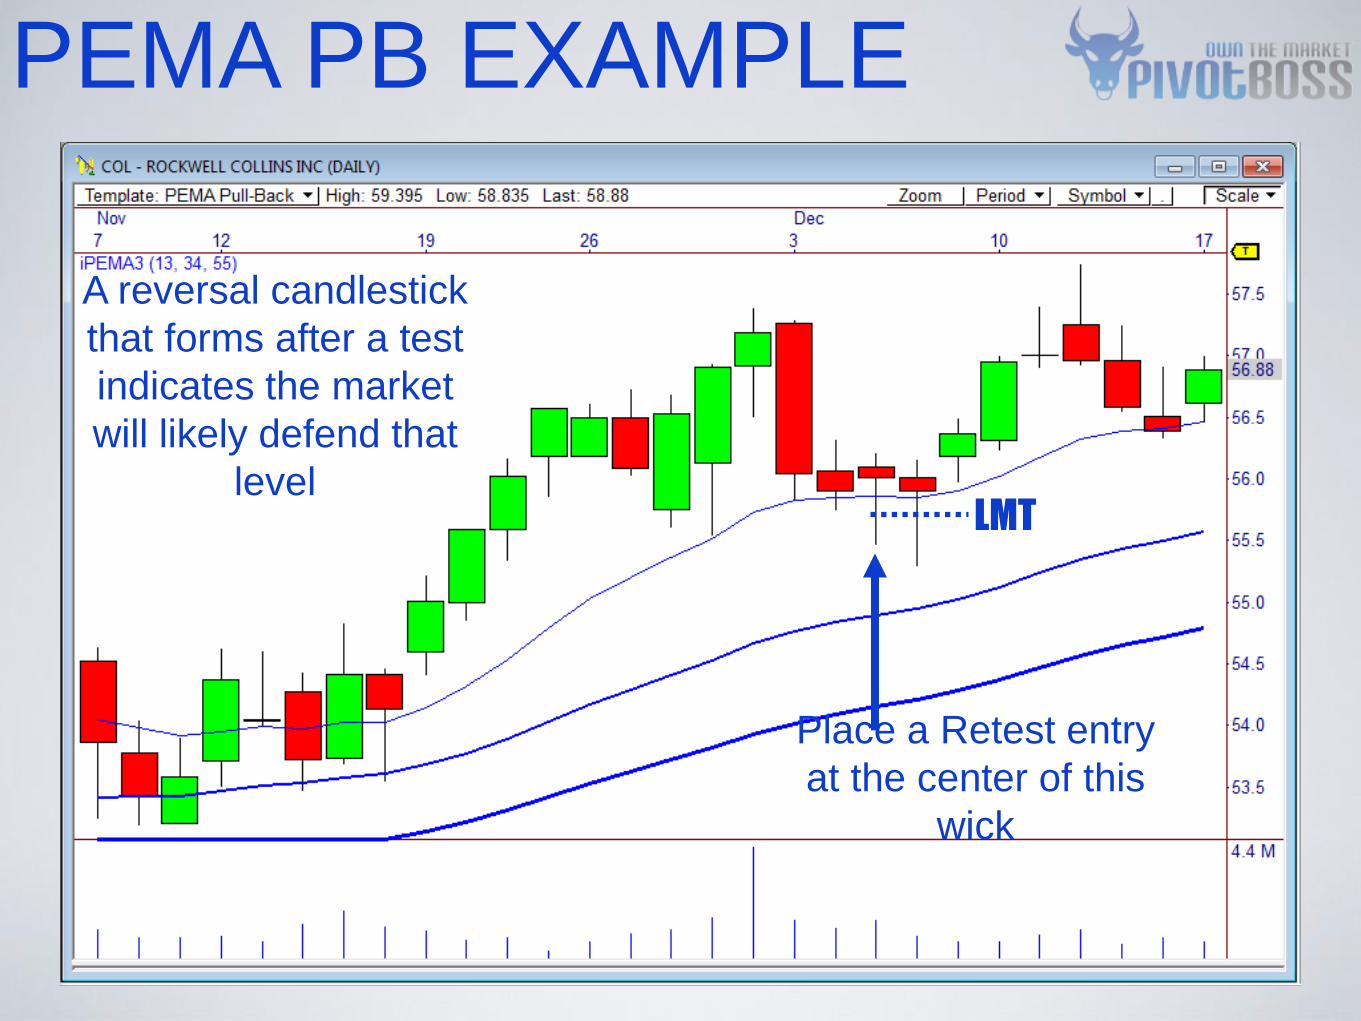
PEMA PB EXAMPLE
A reversal candlestick
that forms after a test
indicates the market
will likely defend that
level
Place a Retest entry
at the center of this
wick
LMT
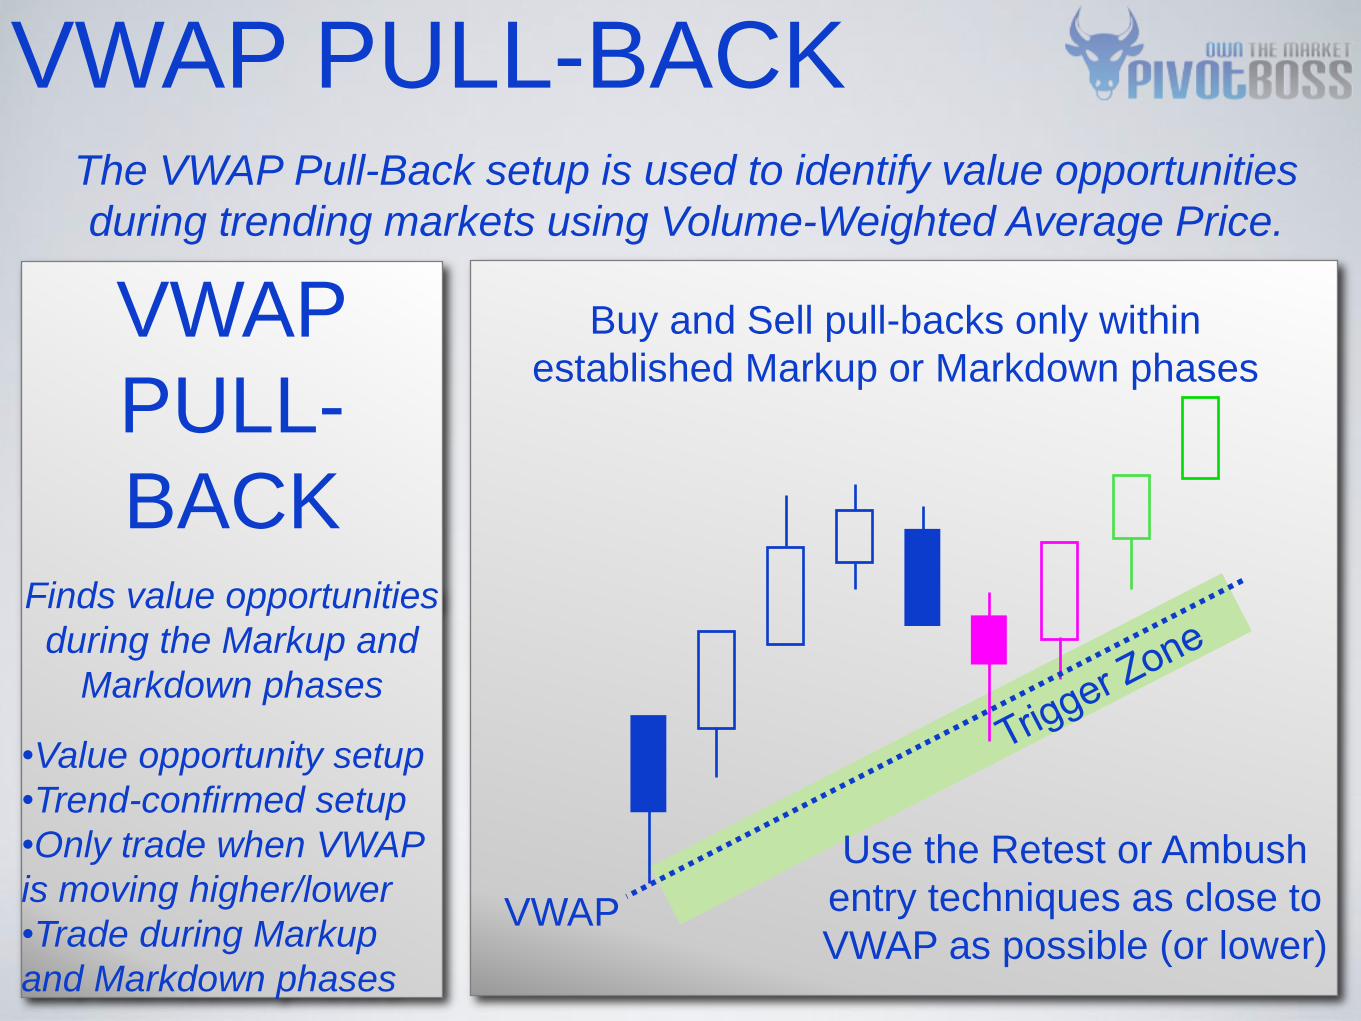
The VWAP Pull-Back setup is used to identify value opportunities
during trending markets using Volume-Weighted Average Price.
VWAP PULL-BACK
VWAP
PULL-
BACK
Finds value opportunities
during the Markup and
Markdown phases
•Value opportunity setup
•Trend-confirmed setup
•Only trade when VWAP
is moving higher/lower
•Trade during Markup
and Markdown phases
Buy and Sell pull-backs only within
established Markup or Markdown phases
Use the Retest or Ambush
entry techniques as close to
VWAP as possible (or lower) VWAP
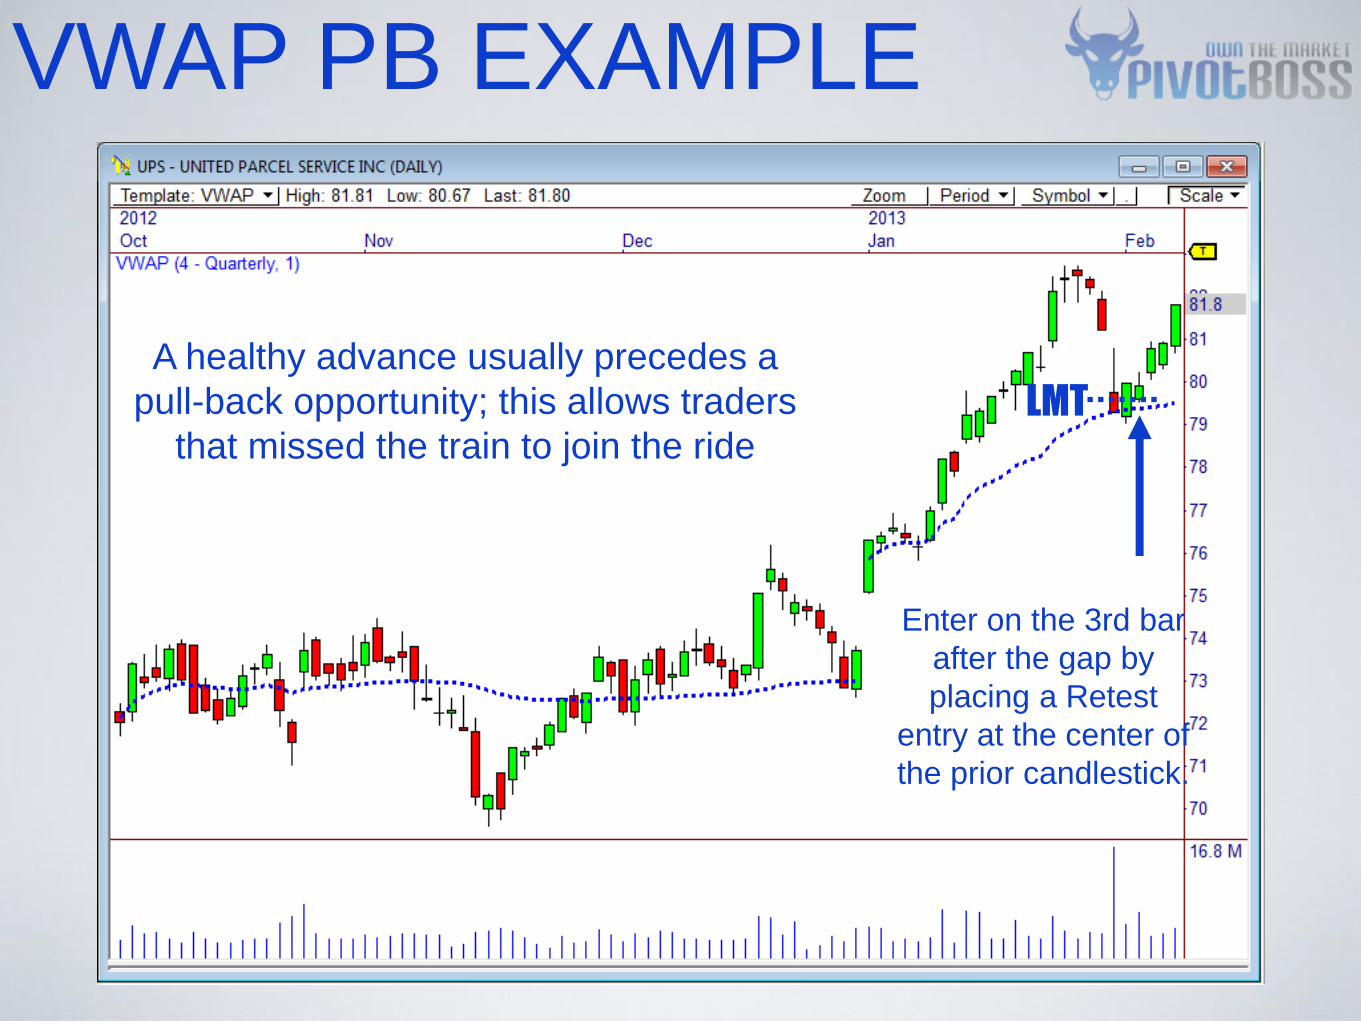
VWAP PB EXAMPLE
A healthy advance usually precedes a
pull-back opportunity; this allows traders
that missed the train to join the ride
Enter on the 3rd bar
after the gap by
placing a Retest
entry at the center of
the prior candlestick.
LMT

Best case scenario: a reversal
candlestick forms after testing VWAP;
place your Retest entry at the center of
the wick
VWAP PB EXAMPLE
You don’t have to be a hero placing
Ambush entries; instead, allow price to
test your trigger level, then place an
entry using the “test” info
LMT
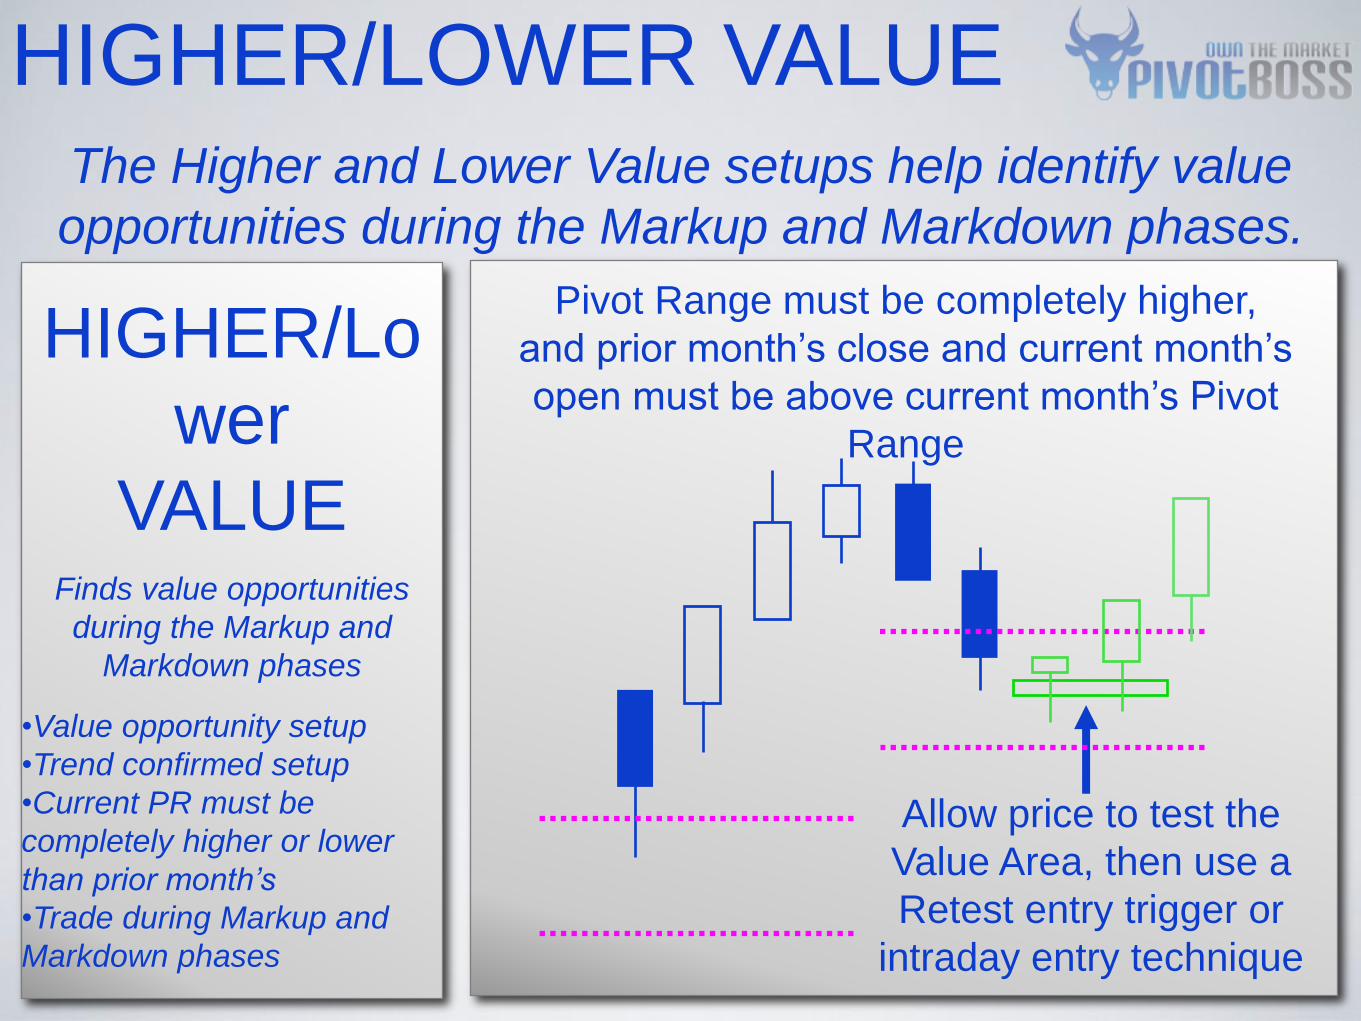
The Higher and Lower Value setups help identify value
opportunities during the Markup and Markdown phases.
HIGHER/LOWER VALUE
HIGHER/Lo
wer
VALUE
Finds value opportunities
during the Markup and
Markdown phases
•Value opportunity setup
•Trend confirmed setup
•Current PR must be
completely higher or lower
than prior month’s
•Trade during Markup and
Markdown phases
Allow price to test the
Value Area, then use a
Retest entry trigger or
intraday entry technique
Pivot Range must be completely higher,
and prior month’s close and current month’s
open must be above current month’s Pivot
Range
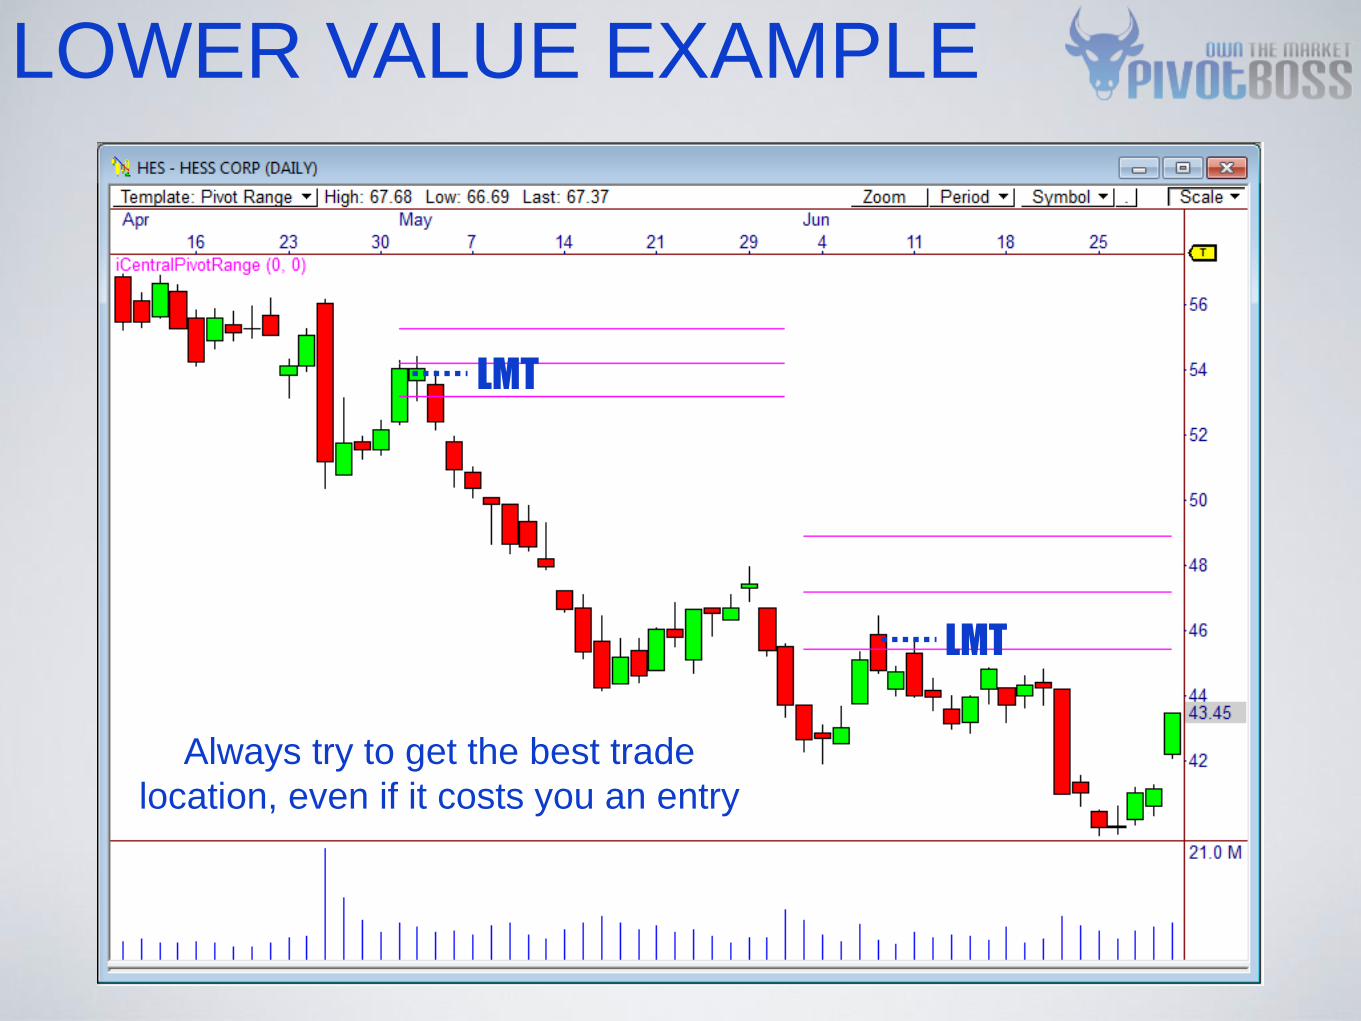
LOWER VALUE EXAMPLE
Always try to get the best trade
location, even if it costs you an entry
LMT
LMT
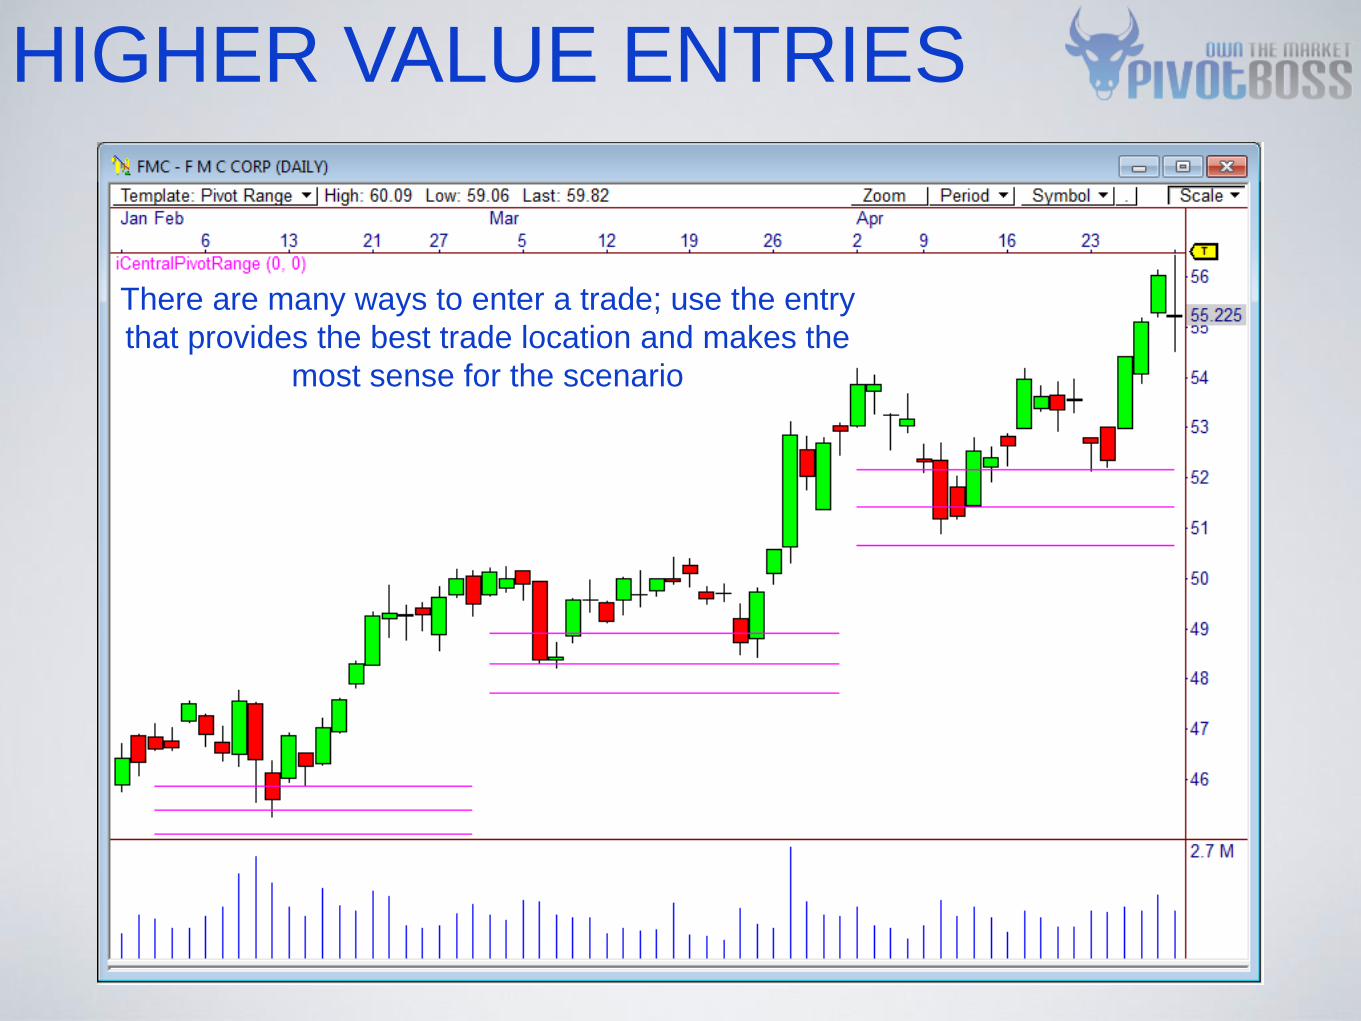
HIGHER VALUE ENTRIES
There are many ways to enter a trade; use the entry
that provides the best trade location and makes the
most sense for the scenario

importance of
trade location
While traders often call it “The Market”, many fail to realize that it is
indeed a market. Trading is a game of inches, and every tick counts.
• We’ve become accustomed to paying
“fixed” prices for our goods
• However, the Stock Market is a real
market, without fixed pricing
• Just as you would negotiate price at a
farmer’s market or artisan market, you
should negotiate your pricing in the Stock
Market, as well
• Every tick saved adds up over time,
thereby increasing your profitability
THE MARKET IS A MARKET
Negotiate your trade like you’re bidding at an auction. Be
picky, bid low and always try to get the best price possible.
• Novice traders routinely enter a trade and watch price go
immediately against them
• Instead, let price “go against you” before you enter the trade
• Never rush to enter a trade; sitting on your hands is an option
• Bid low, and patiently allow price to come to you
• Pro traders bid low, and aren’t always filled
• But when they are filled, they’re typically great entries
IT’S AN AUCTION
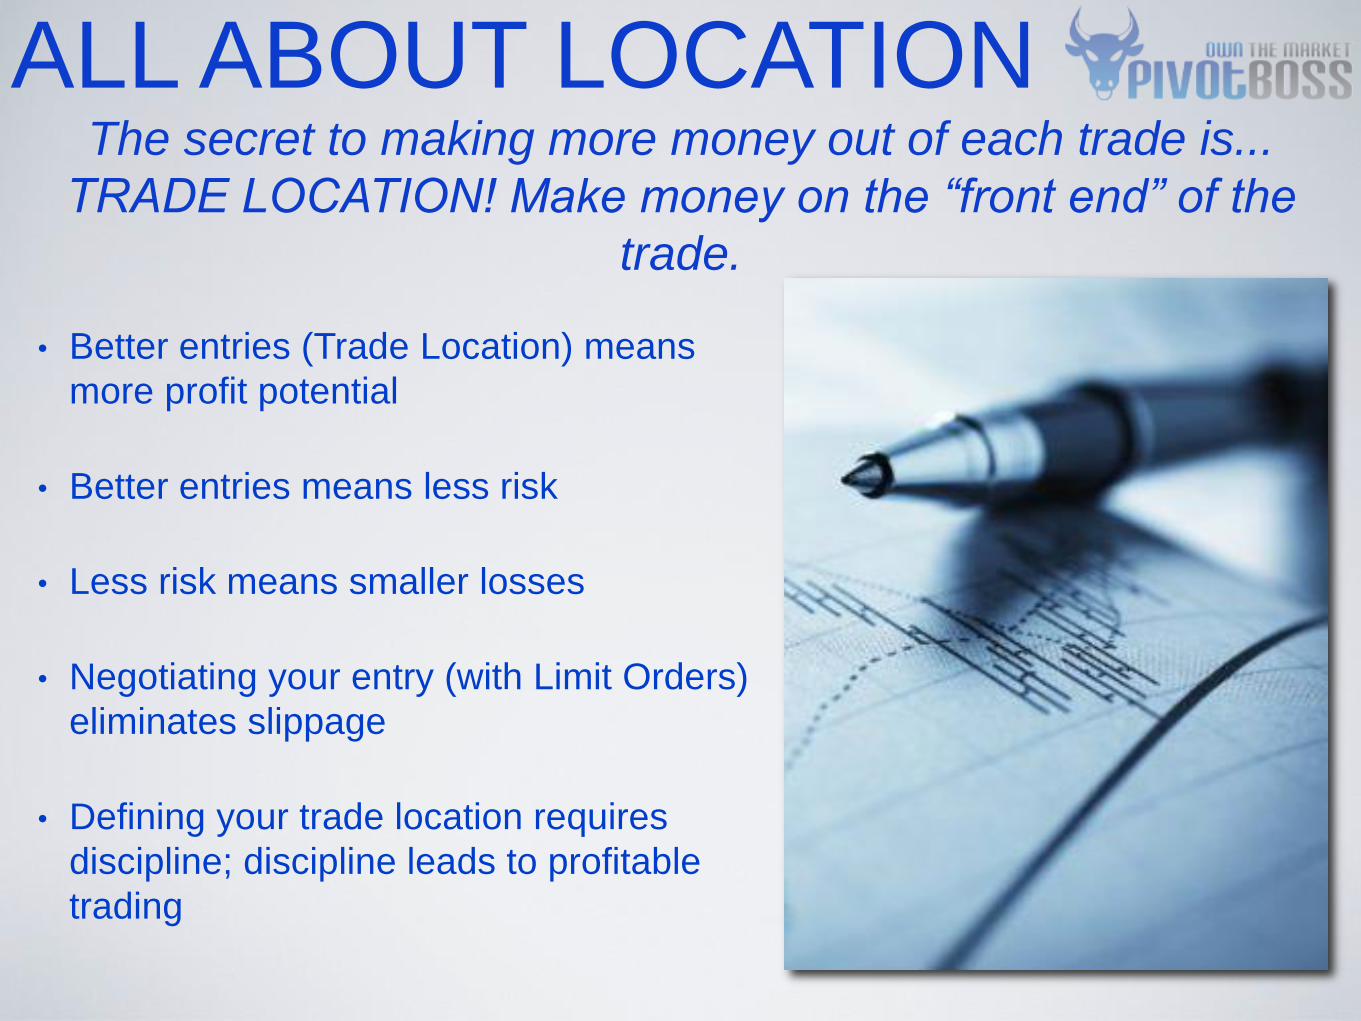
The secret to making more money out of each trade is...
TRADE LOCATION! Make money on the “front end” of the
trade.
• Better entries (Trade Location) means
more profit potential
• Better entries means less risk
• Less risk means smaller losses
• Negotiating your entry (with Limit Orders)
eliminates slippage
• Defining your trade location requires
discipline; discipline leads to profitable
trading
ALL ABOUT LOCATION
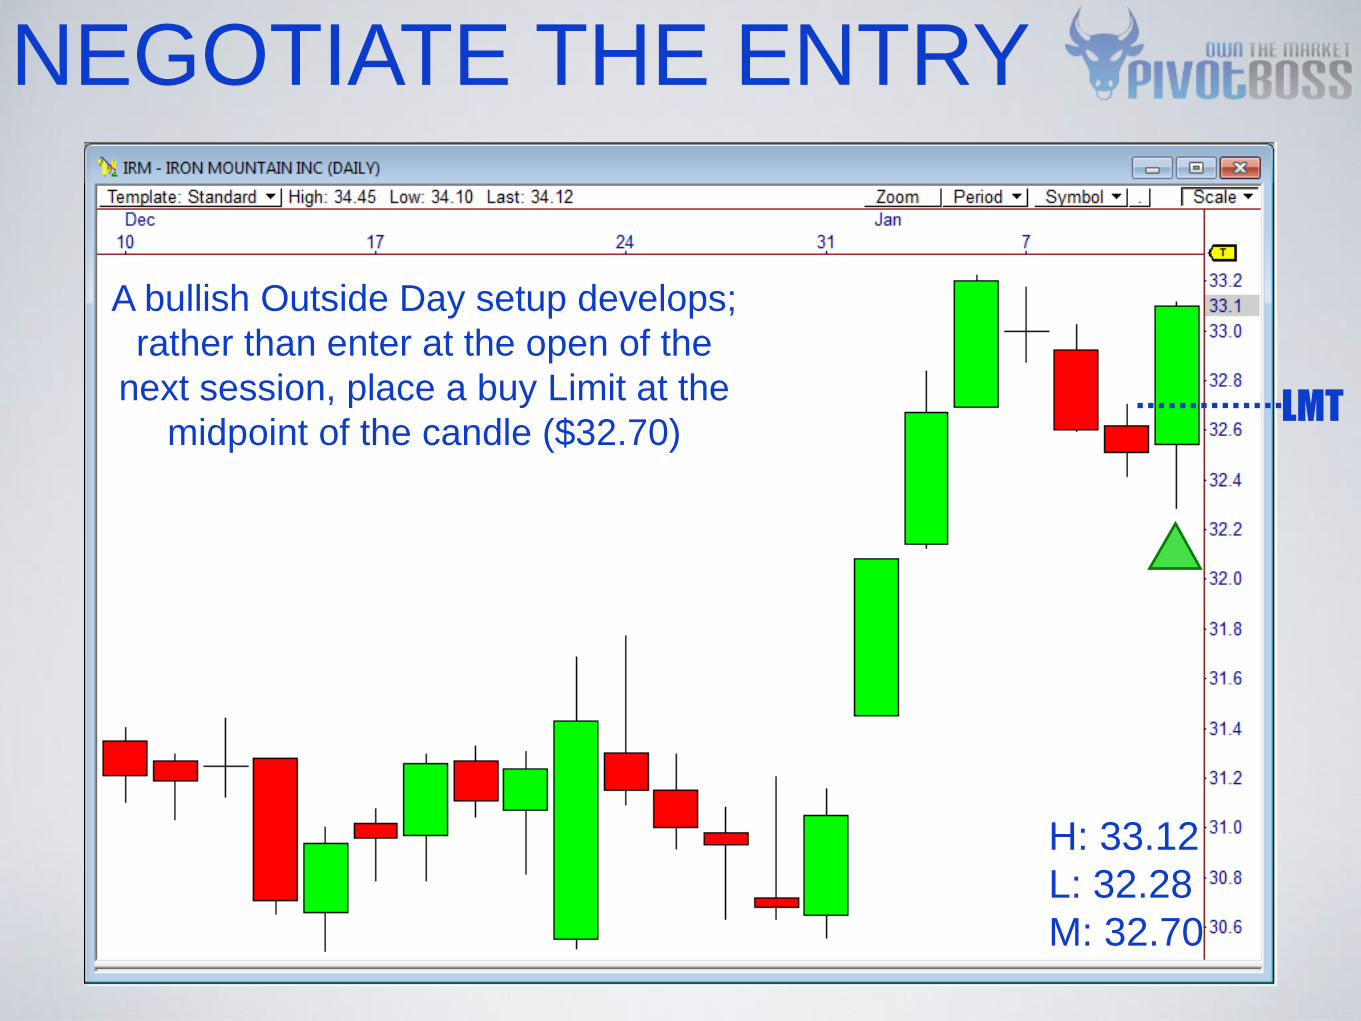
NEGOTIATE THE ENTRY
LMT
A bullish Outside Day setup develops;
rather than enter at the open of the
next session, place a buy Limit at the
midpoint of the candle ($32.70)
H: 33.12
L: 32.28
M: 32.70
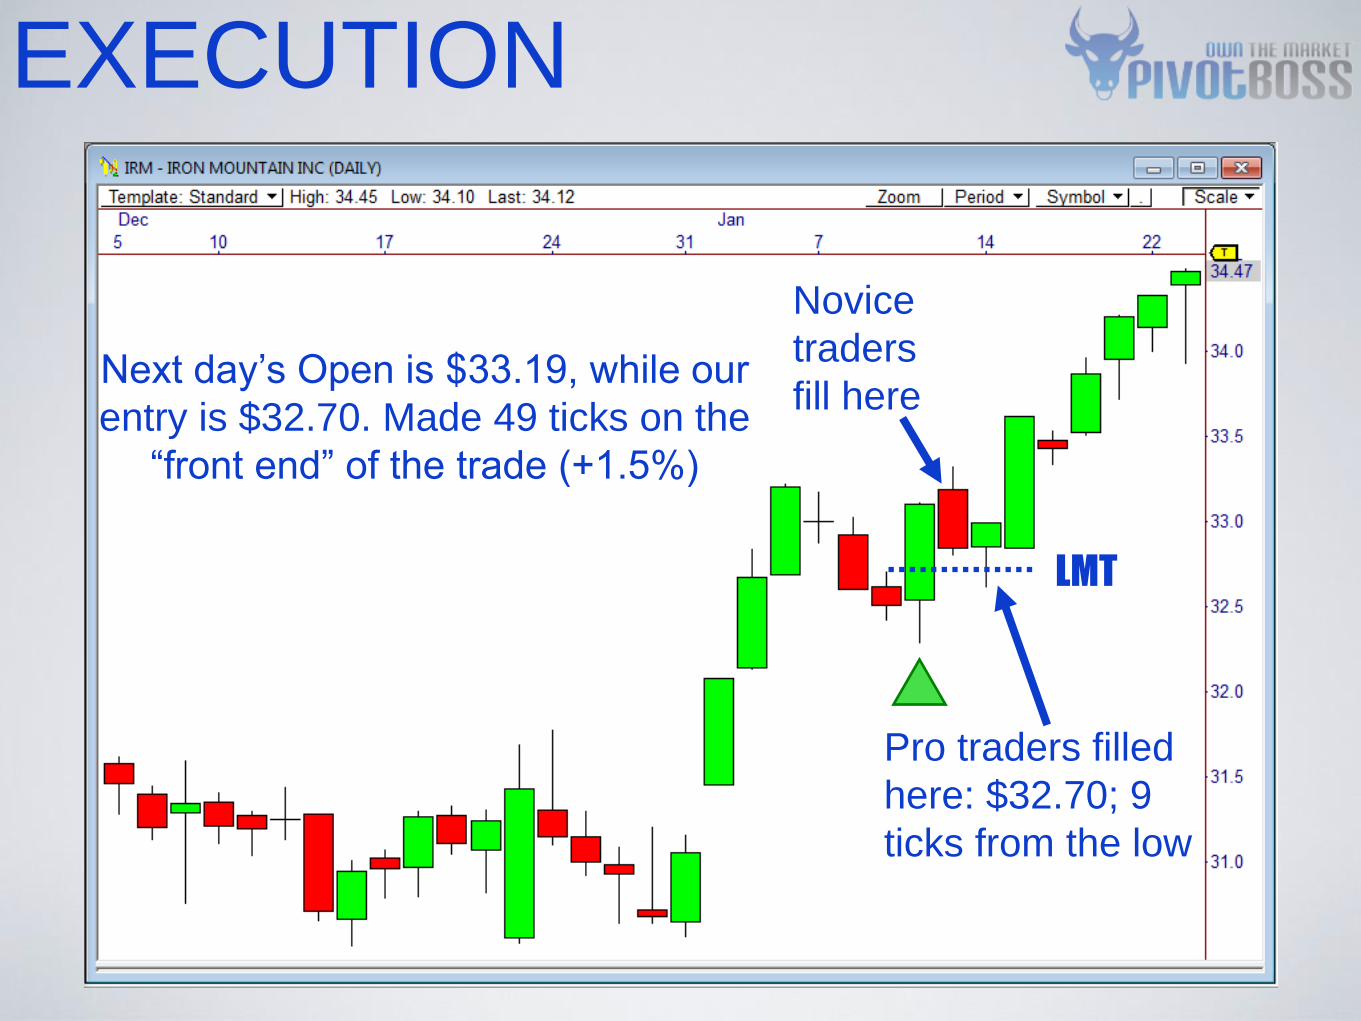
EXECUTION
LMT
Next day’s Open is $33.19, while our
entry is $32.70. Made 49 ticks on the
“front end” of the trade (+1.5%)
Pro traders filled
here: $32.70; 9
ticks from the low
Novice
traders
fill here
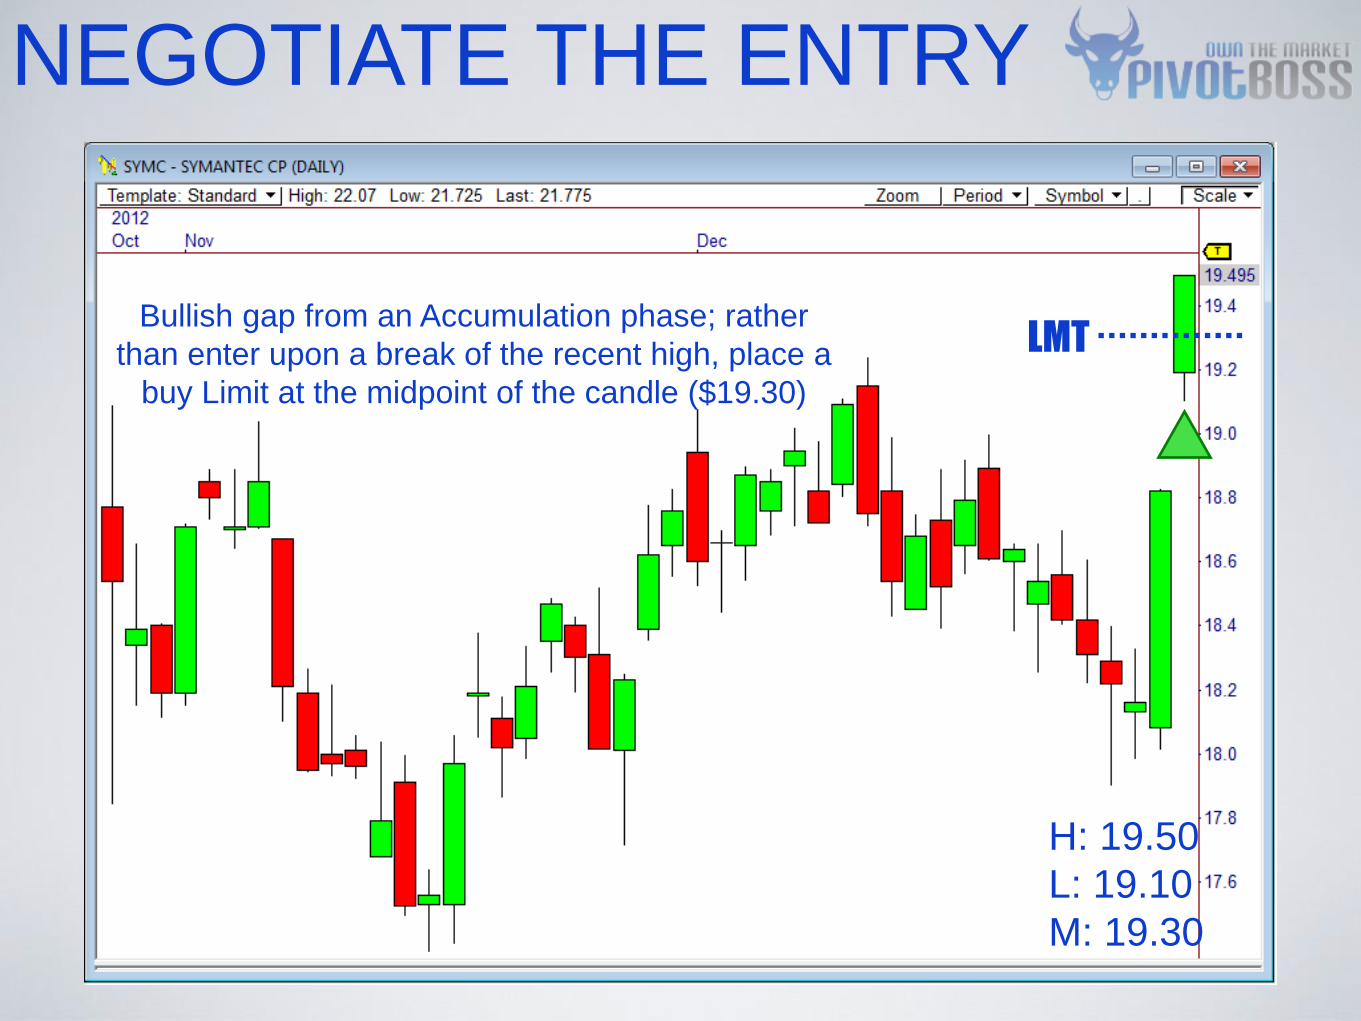
NEGOTIATE THE ENTRY
LMT Bullish gap from an Accumulation phase; rather
than enter upon a break of the recent high, place a
buy Limit at the midpoint of the candle ($19.30)
H: 19.50
L: 19.10
M: 19.30
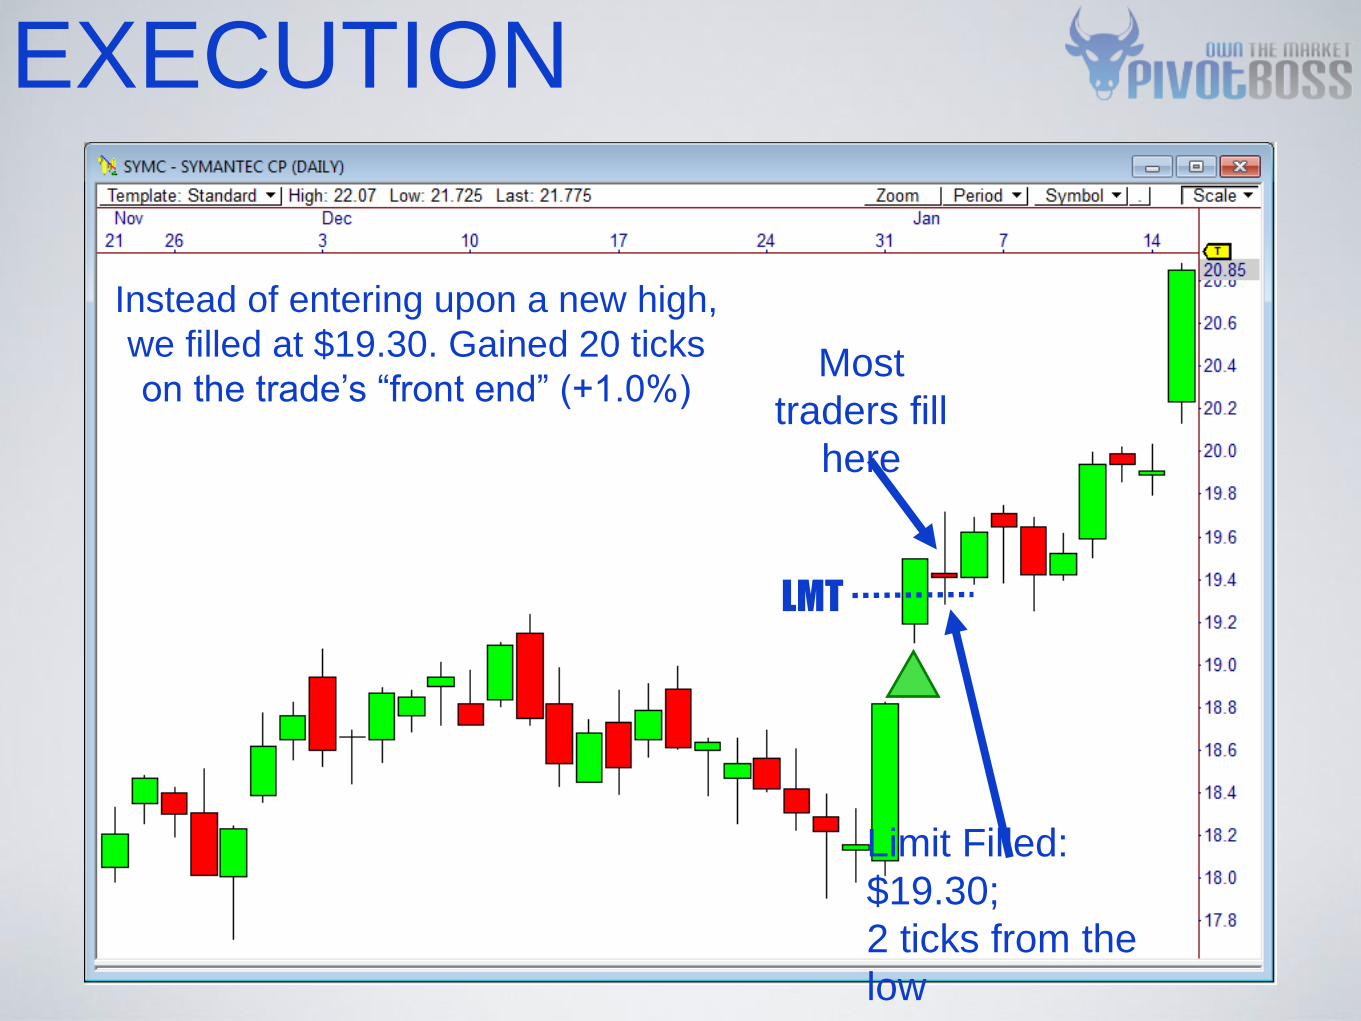
EXECUTION
LMT
Instead of entering upon a new high,
we filled at $19.30. Gained 20 ticks
on the trade’s “front end” (+1.0%)
Limit Filled:
$19.30;
2 ticks from the
low
Most
traders fill
here

pro-style entry
techniques
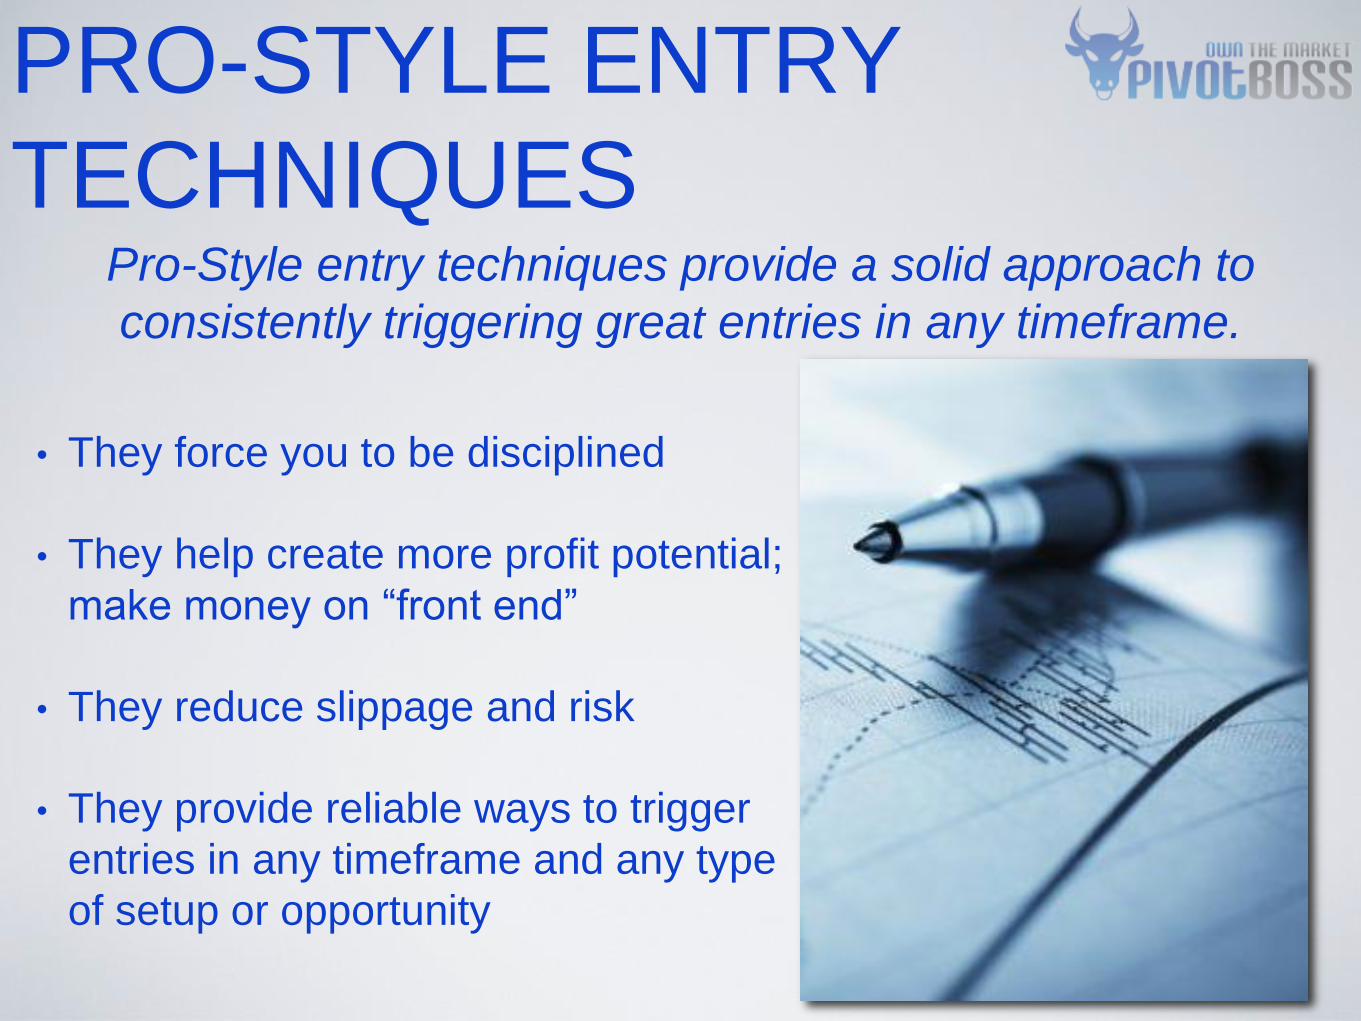
Pro-Style entry techniques provide a solid approach to
consistently triggering great entries in any timeframe.
• They force you to be disciplined
• They help create more profit potential;
make money on “front end”
• They reduce slippage and risk
• They provide reliable ways to trigger
entries in any timeframe and any type
of setup or opportunity
PRO-STYLE ENTRY
TECHNIQUES
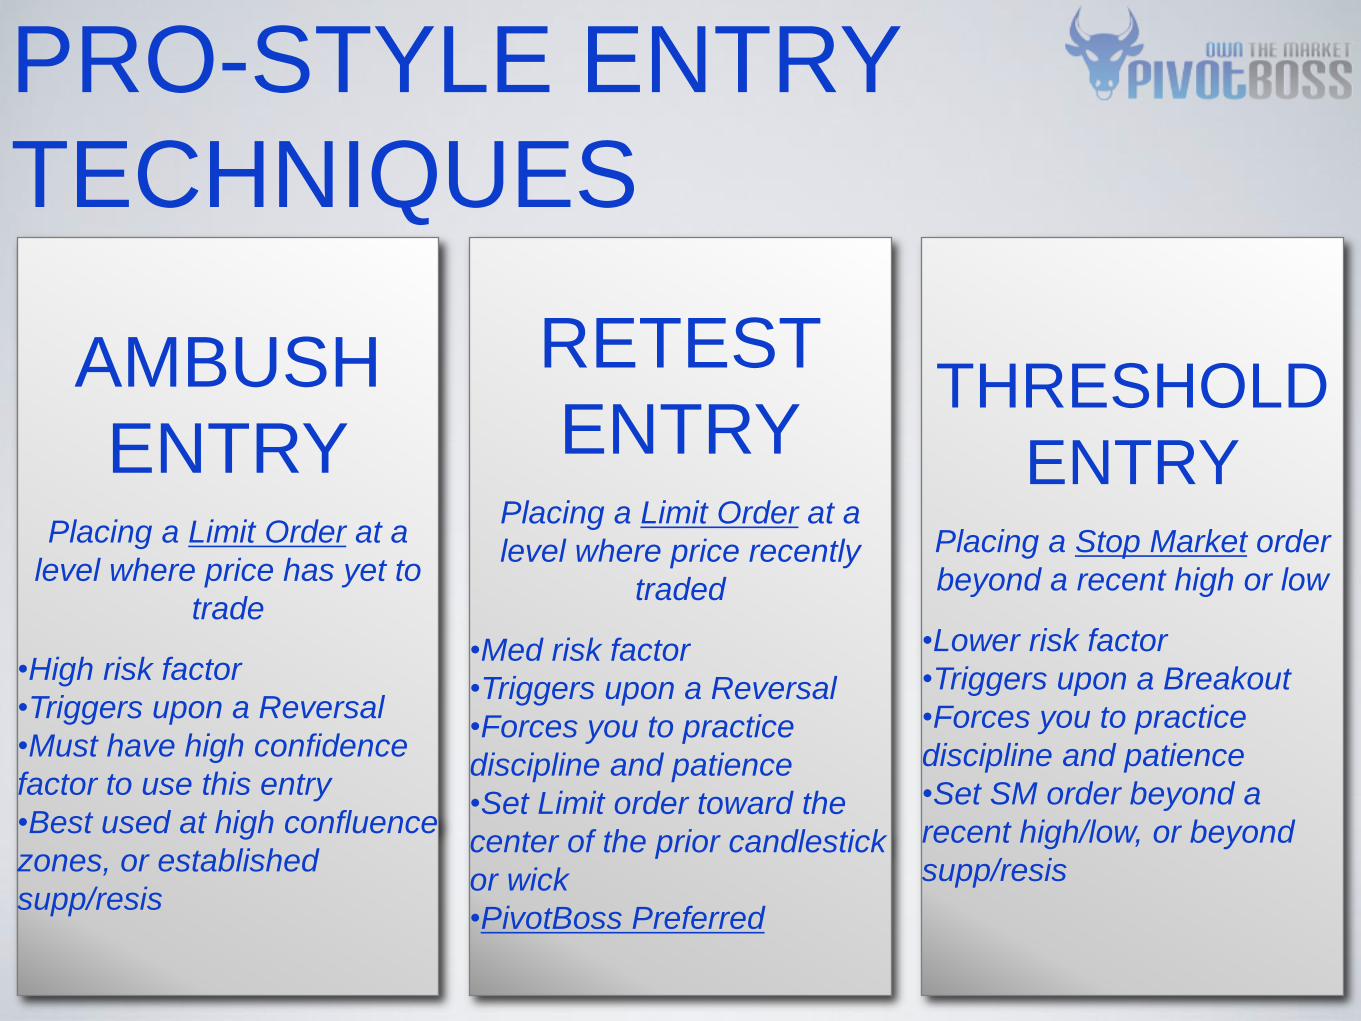
AMBUSH
ENTRY
Placing a Limit Order at a
level where price has yet to
trade
•High risk factor
•Triggers upon a Reversal
•Must have high confidence
factor to use this entry
•Best used at high confluence
zones, or established
supp/resis
PRO-STYLE ENTRY
TECHNIQUES
RETEST
ENTRY
Placing a Limit Order at a
level where price recently
traded
•Med risk factor
•Triggers upon a Reversal
•Forces you to practice
discipline and patience
•Set Limit order toward the
center of the prior candlestick
or wick
•PivotBoss Preferred
THRESHOLD
ENTRY
Placing a Stop Market order
beyond a recent high or low
•Lower risk factor
•Triggers upon a Breakout
•Forces you to practice
discipline and patience
•Set SM order beyond a
recent high/low, or beyond
supp/resis

Pros deploy the Retest Entry by placing a Limit Order at a
level where price has recently traded, in an effort to attain
better trade location.
THE RETEST ENTRY
RETEST
ENTRY
Placing a Limit Order at a
level where price recently
traded
•Med risk factor
•Triggers upon a Reversal
•Forces you to practice
discipline and patience
•Set Limit order toward the
center of the prior candlestick
or wick
•PivotBoss Preferred
Let price test an area of established
support or confluence, then place a
buy Limit order toward the center of
the “testing” candlestick or wick

RETEST EXAMPLE
LMT
Let the signal bar fully develop;
then set retest Buy Limit at the
center of the signal bar
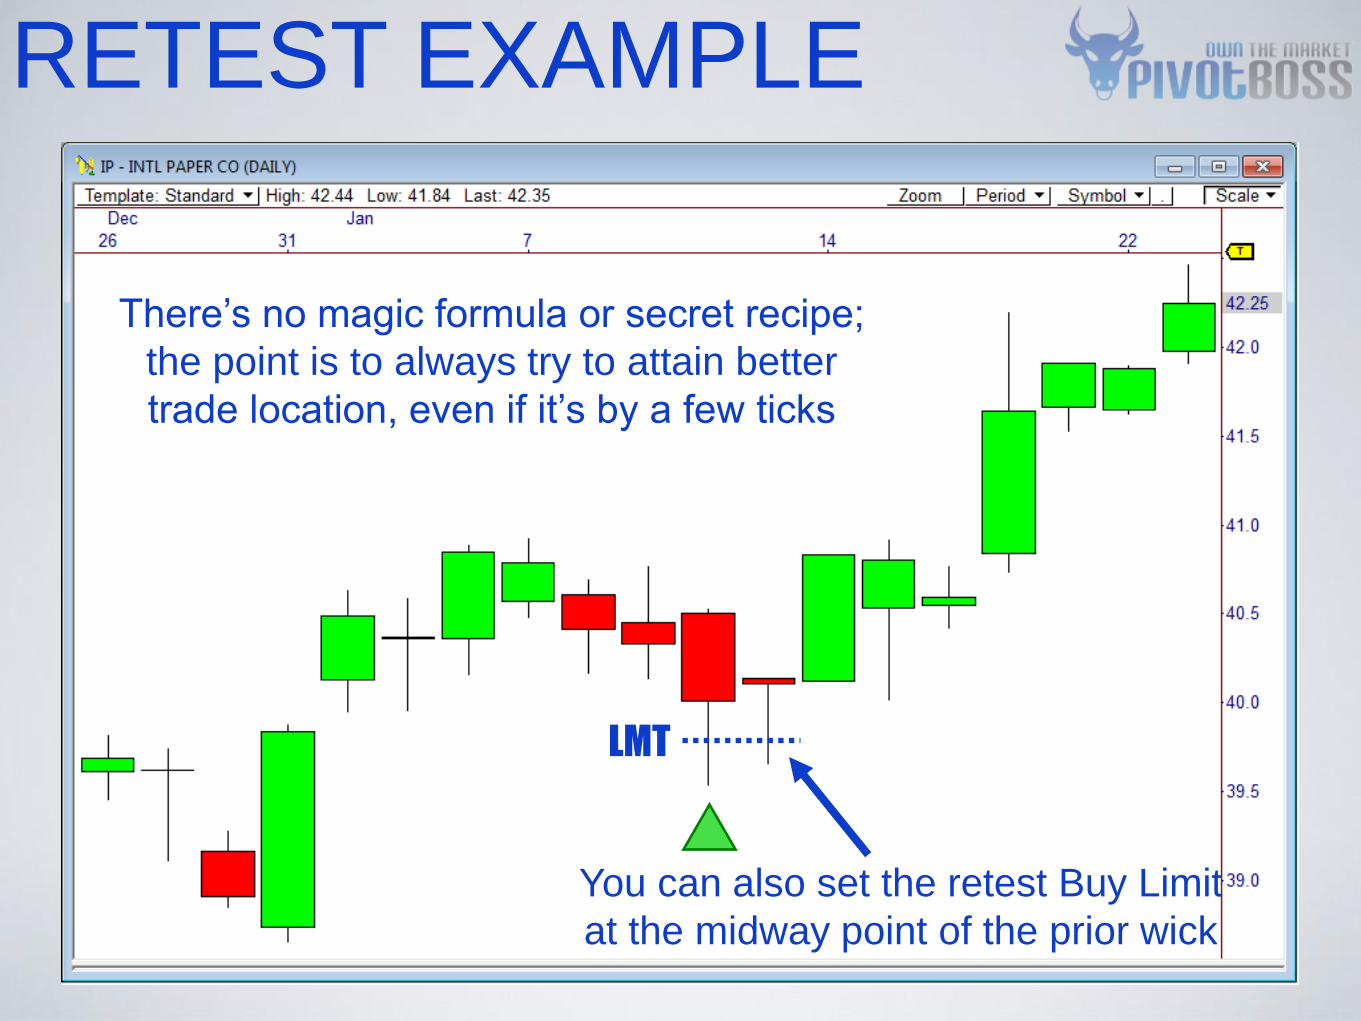
RETEST EXAMPLE
LMT
You can also set the retest Buy Limit
at the midway point of the prior wick
There’s no magic formula or secret recipe;
the point is to always try to attain better
trade location, even if it’s by a few ticks
Intraday entry techniques provide a systematic approach to entering
trades, regardless of which timeframe the setup originates.
• Allow for additional confirmation; provide
one last “step” before entry
• Can be used when an opportunity exists,
but direction remains unknown
• Provide a structured approach to entering
trades; consistency
• Can also be used as intraday “setups”;
setup within a setup
INTRADAY ENTRY
TECHNIQUES
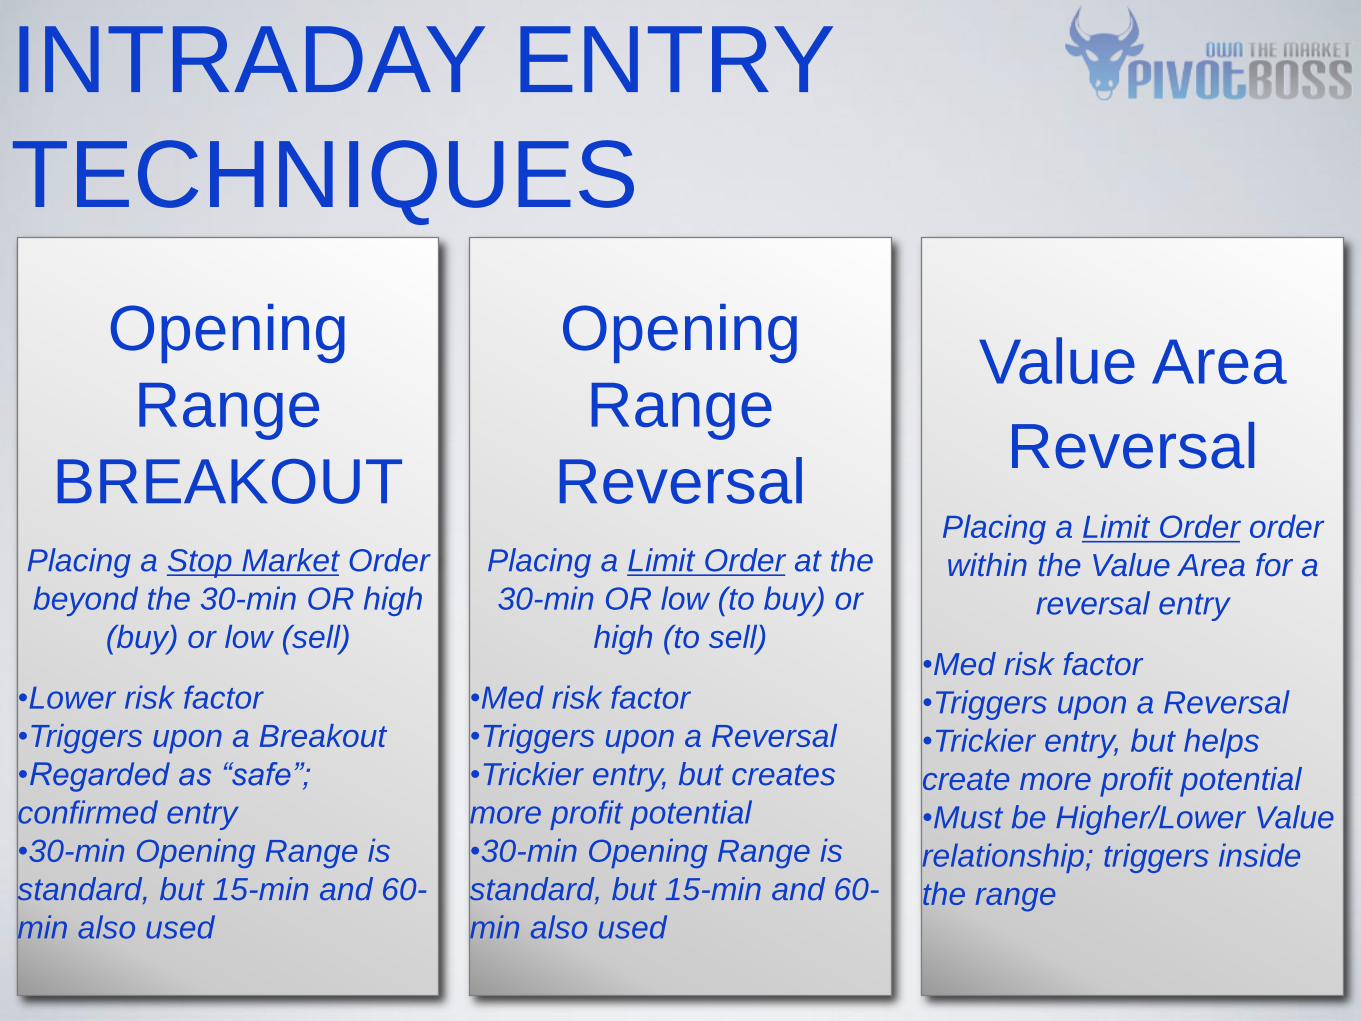
Opening
Range
BREAKOUT
Placing a Stop Market Order
beyond the 30-min OR high
(buy) or low (sell)
•Lower risk factor
•Triggers upon a Breakout
•Regarded as “safe”;
confirmed entry
•30-min Opening Range is
standard, but 15-min and 60-
min also used
INTRADAY ENTRY
TECHNIQUES
Opening
Range
Reversal
Placing a Limit Order at the
30-min OR low (to buy) or
high (to sell)
•Med risk factor
•Triggers upon a Reversal
•Trickier entry, but creates
more profit potential
•30-min Opening Range is
standard, but 15-min and 60-
min also used
Value Area
Reversal
Placing a Limit Order order
within the Value Area for a
reversal entry
•Med risk factor
•Triggers upon a Reversal
•Trickier entry, but helps
create more profit potential
•Must be Higher/Lower Value
relationship; triggers inside
the range

VA REVERSAL ENTRY Pros use the VA Reversal entry to time intraday entries for higher
timeframe trading opportunities, which offers better trade location.
Allow price to test the
day’s Value Area, then use
a Retest entry trigger
Pivot Range must be completely higher,
and prior day’s close and current day’s open
must be above current day’s Pivot Range Value Area
Reversal
Placing a Limit Order order
within the Value Area for a
reversal entry
•Med risk factor
•Triggers upon a Reversal
•Trickier entry, but helps
create more profit potential
•Must be Higher/Lower Value
relationship; triggers inside
the range
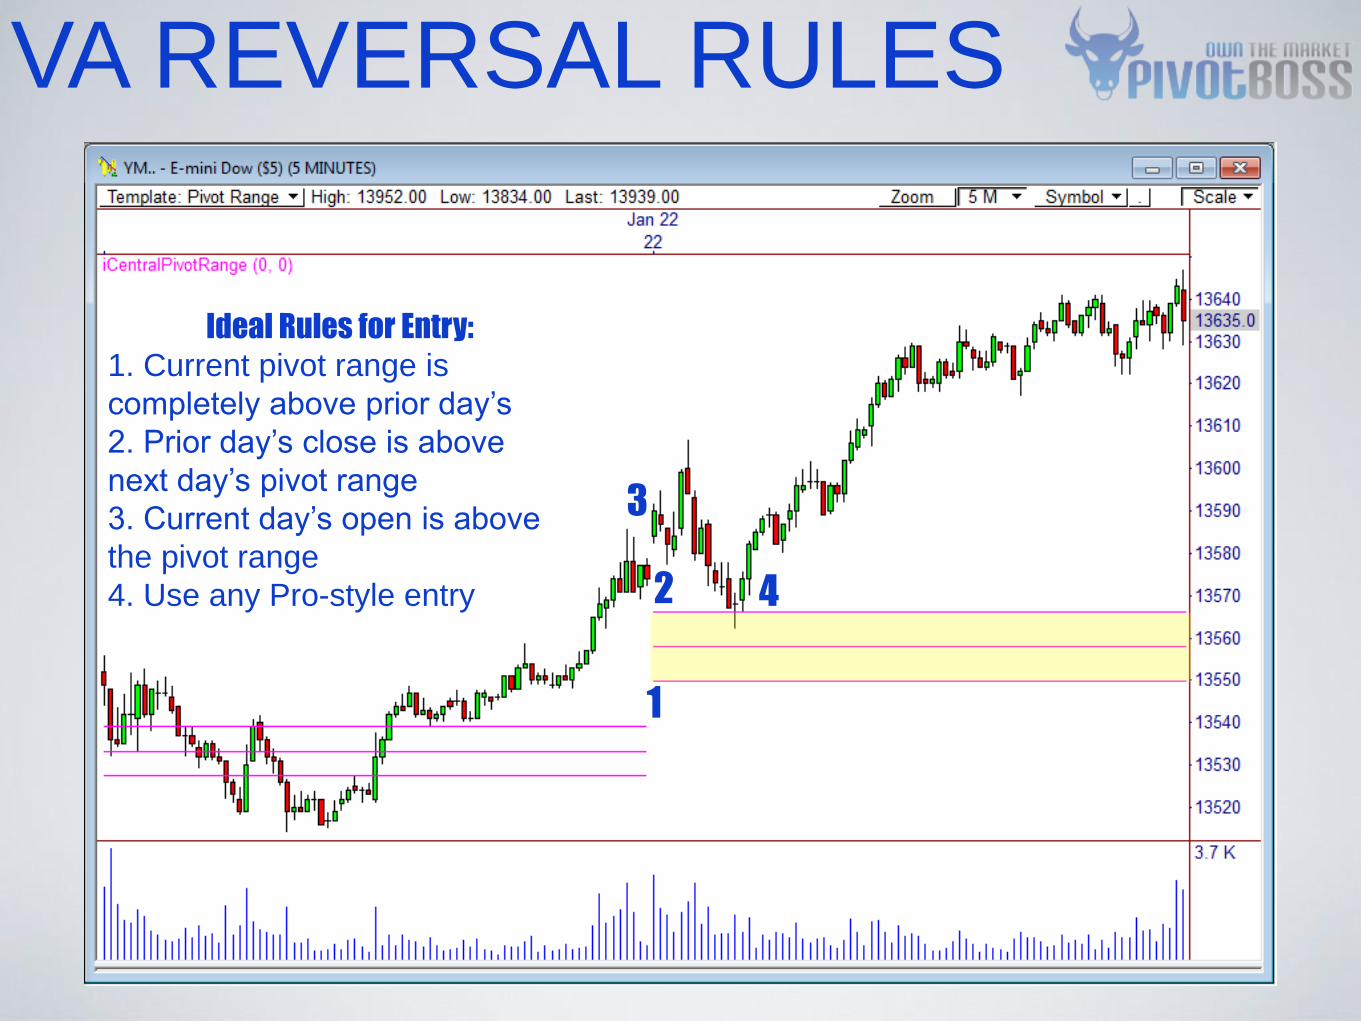
VA REVERSAL RULES
Ideal Rules for Entry:
1. Current pivot range is
completely above prior day’s
2. Prior day’s close is above
next day’s pivot range
3. Current day’s open is above
the pivot range
4. Use any Pro-style entry
1
2
3
4
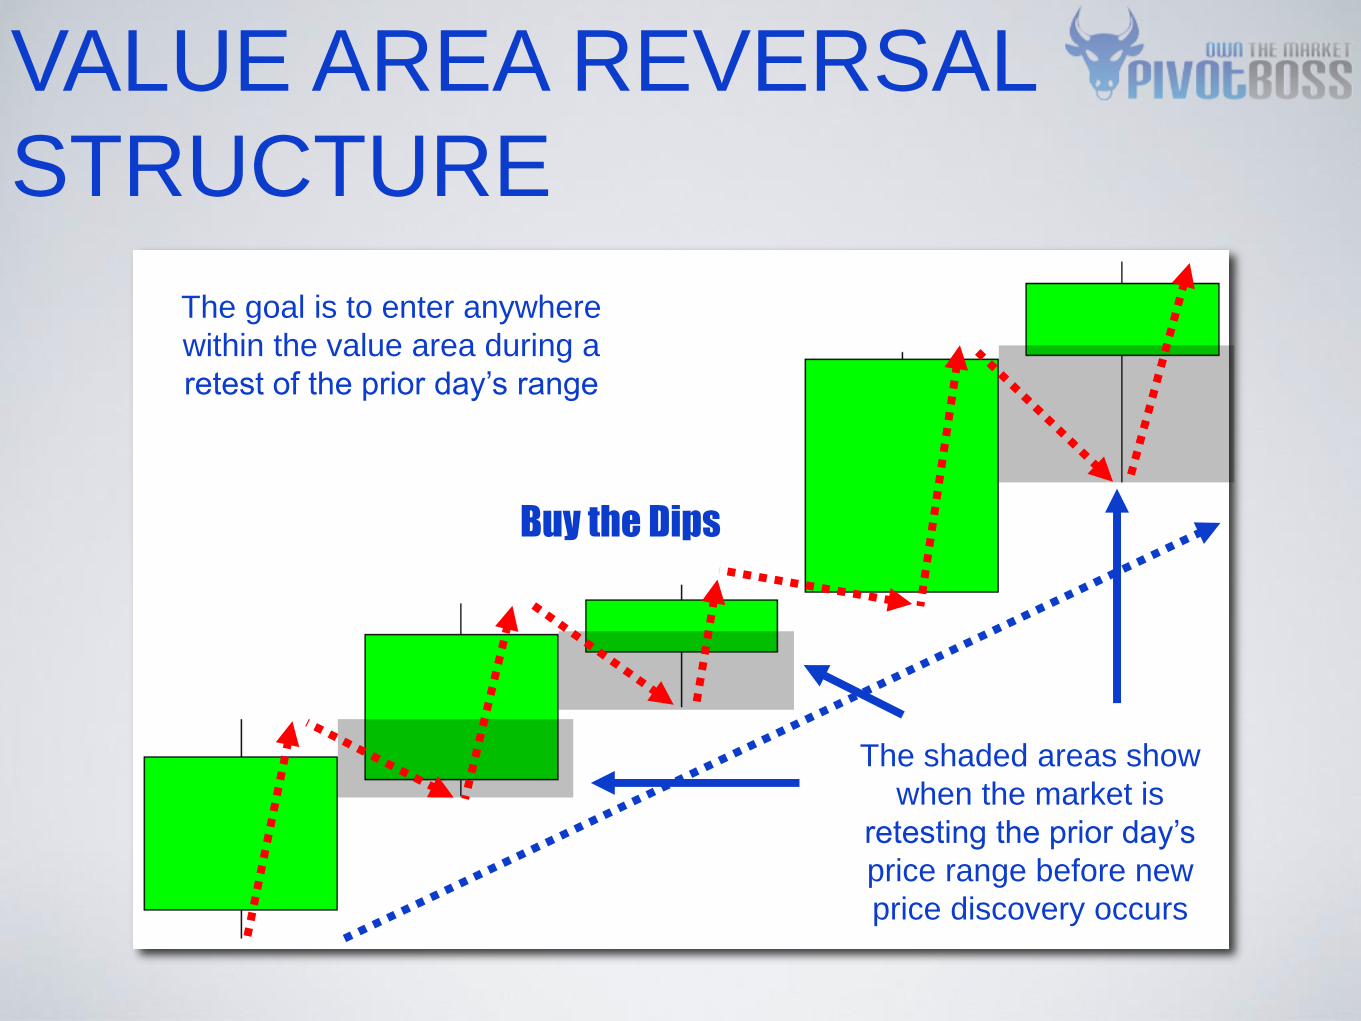
VALUE AREA REVERSAL
STRUCTURE
The goal is to enter anywhere
within the value area during a
retest of the prior day’s range
The shaded areas show
when the market is
retesting the prior day’s
price range before new
price discovery occurs
Buy the Dips

VALUE AREA REVERSAL
STRUCTURE
Visualize the intraday
movement within a daily bar
structure
Your goal is to buy
within the “wick” of the
upcoming day
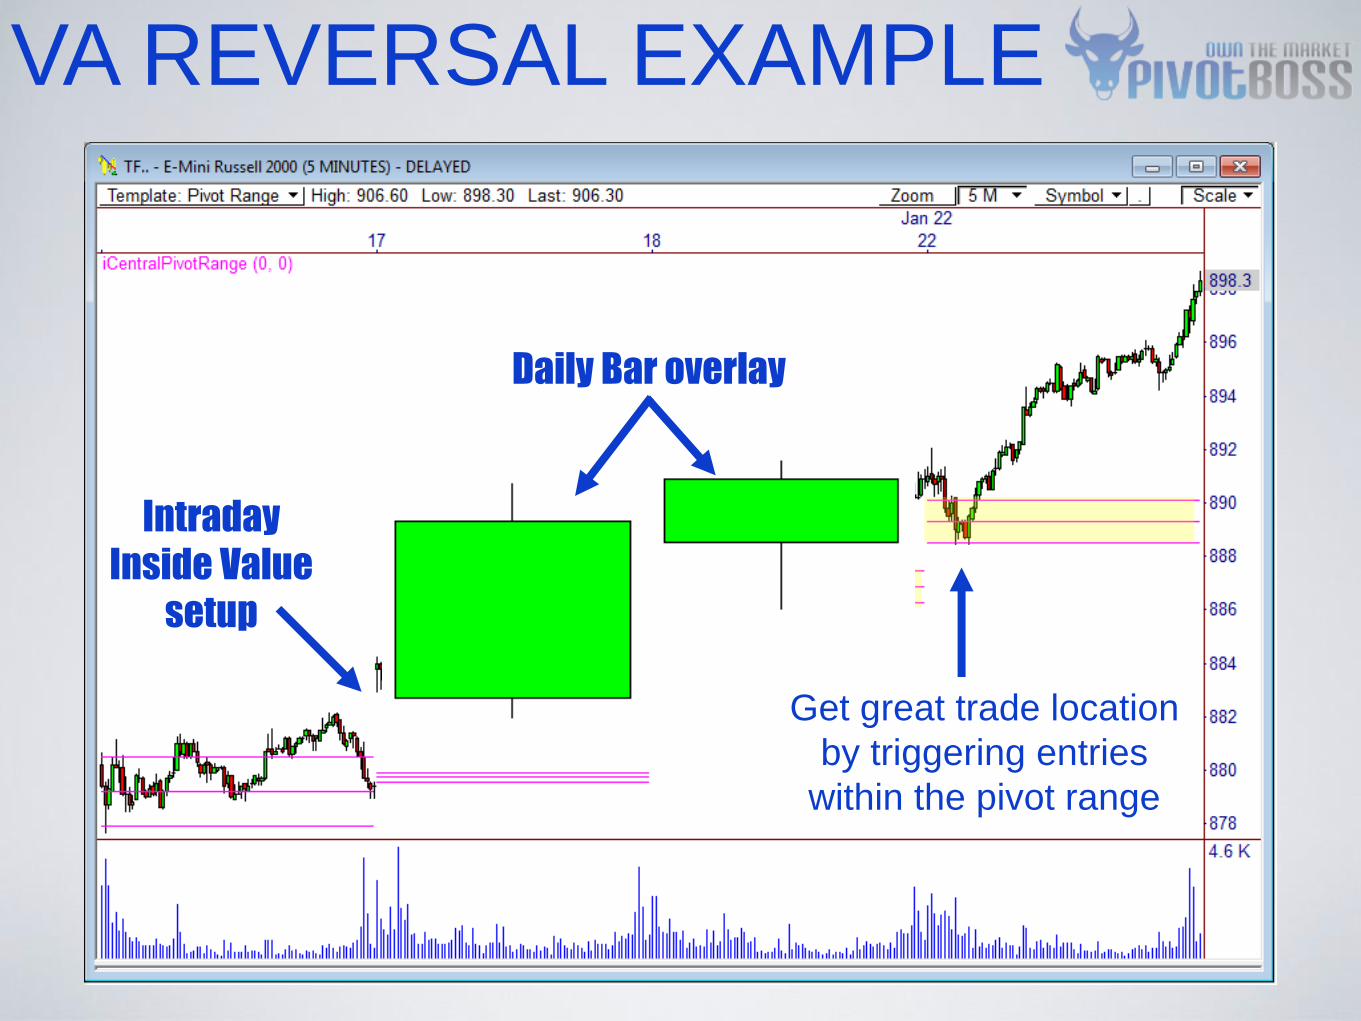
VA REVERSAL EXAMPLE
Intraday
Inside Value
setup
Daily Bar overlay
Get great trade location
by triggering entries
within the pivot range
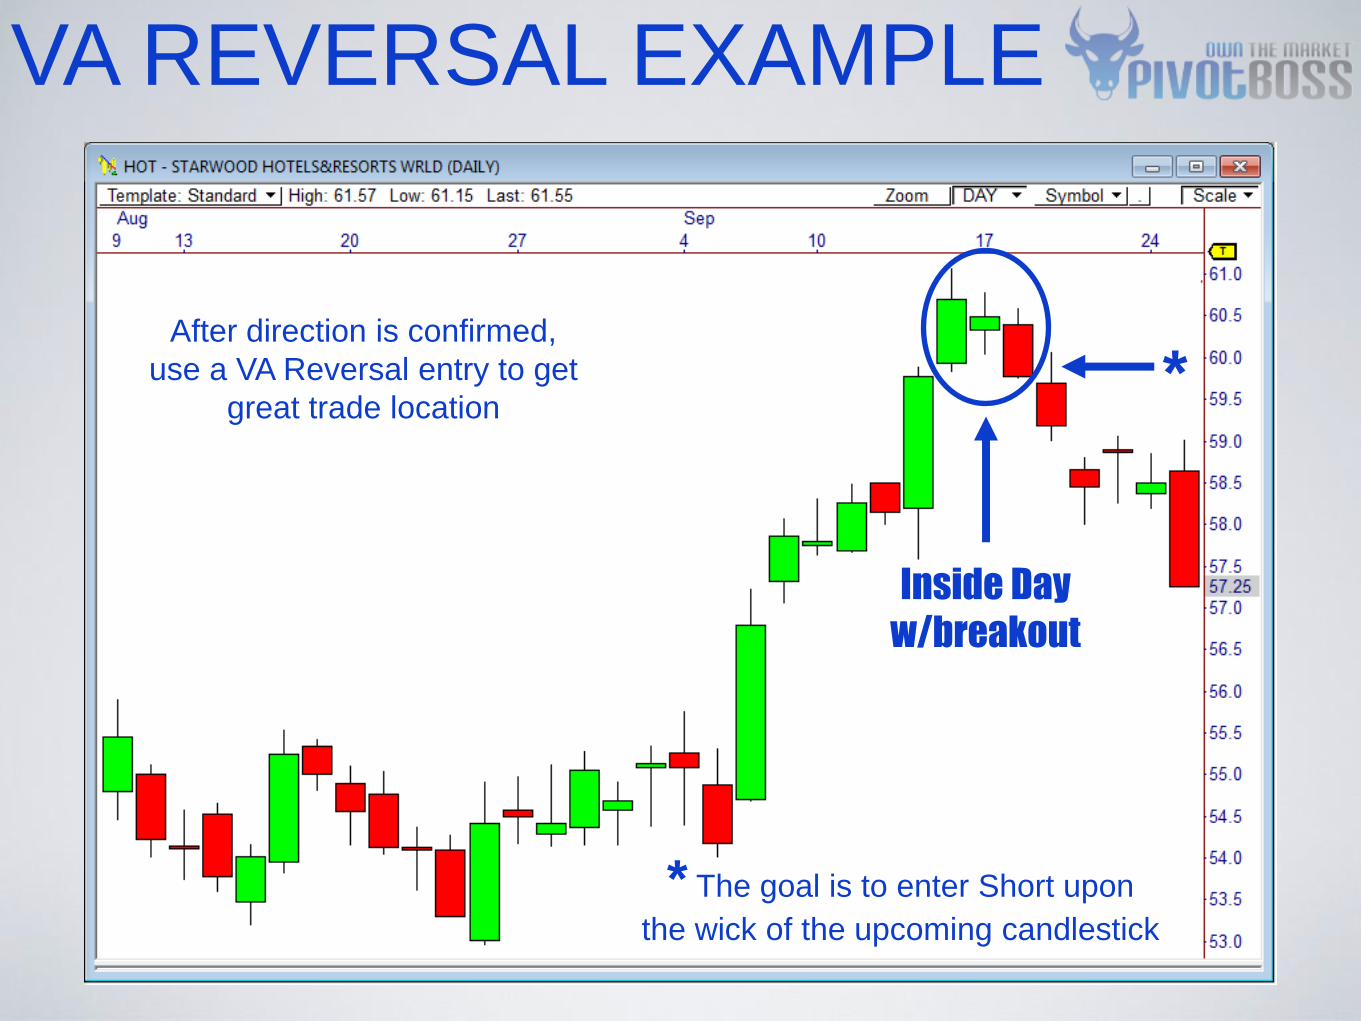
VA REVERSAL EXAMPLE
After direction is confirmed,
use a VA Reversal entry to get
great trade location
Inside Day
w/breakout
* The goal is to enter Short upon
the wick of the upcoming candlestick
*

VA REVERSAL EXAMPLE
Lower Value
The goal is to enter anywhere
within the value area
The Pivot Range visually represents value in the
chart; triggering within this zone offers great trade
location during a trending market
forecasting
accurate targets

• Average price movement provides a
price-based method to forecasting targets
• Trading to high-probability targets yields
consistent results
• Using profit targets allows you to more
easily incorporate risk management
measures
• Trading to profit targets is the PivotBoss
preferred approach
FORECASTING TARGETS
The PivotBoss approach to taking profits relies upon forecasting targets
based on average price movement and utilizing actual profit targets.
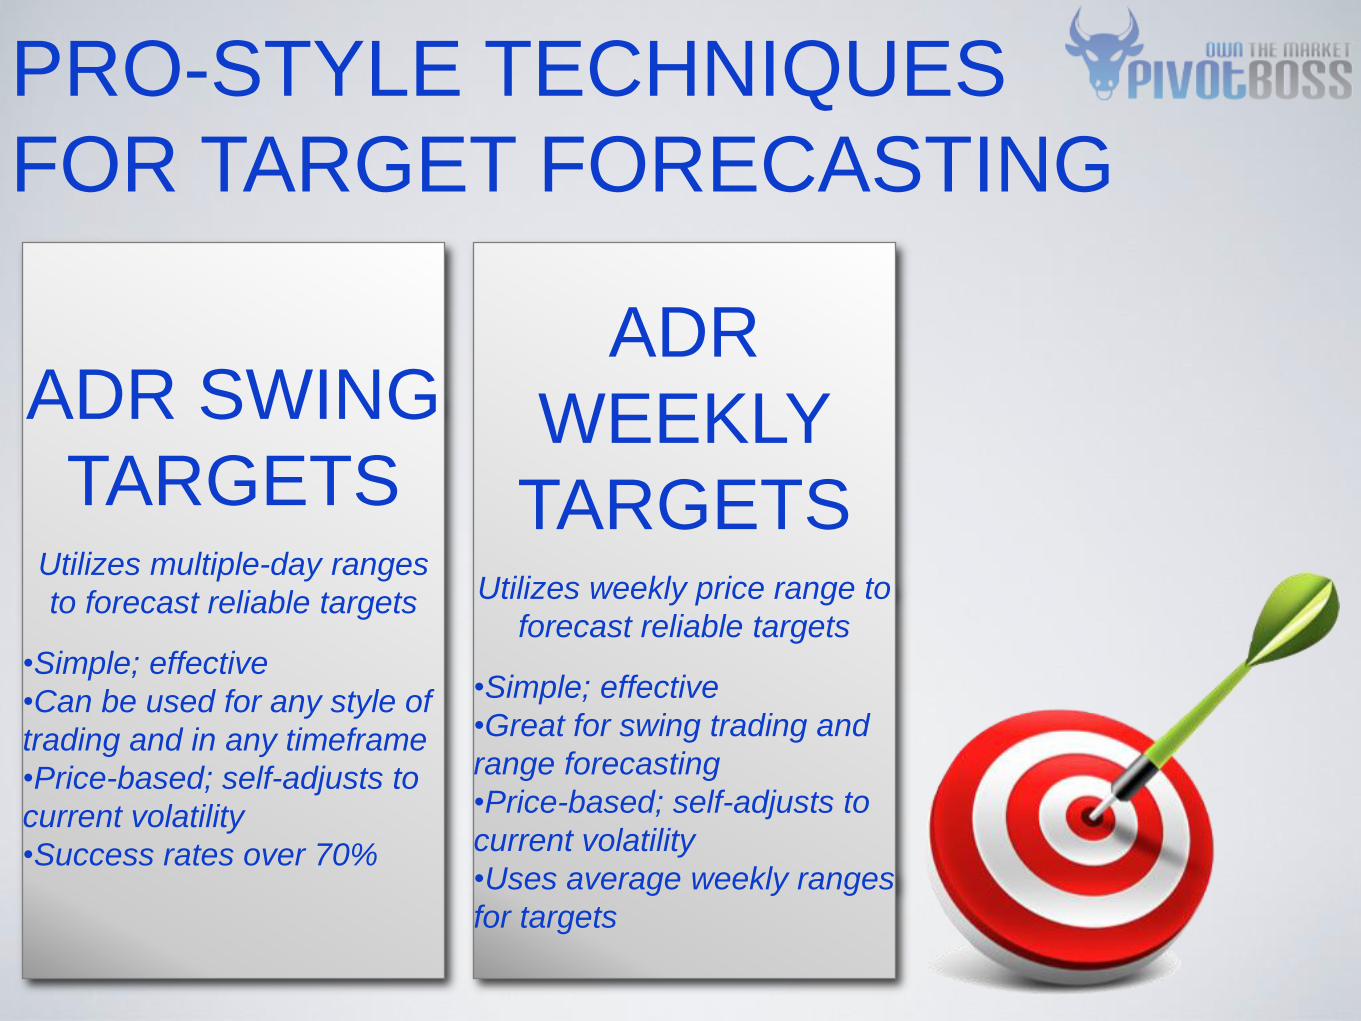
PRO-STYLE TECHNIQUES
FOR TARGET FORECASTING
ADR SWING
TARGETS
Utilizes multiple-day ranges
to forecast reliable targets
•Simple; effective
•Can be used for any style of
trading and in any timeframe
•Price-based; self-adjusts to
current volatility
•Success rates over 70%
ADR
WEEKLY
TARGETS
Utilizes weekly price range to
forecast reliable targets
•Simple; effective
•Great for swing trading and
range forecasting
•Price-based; self-adjusts to
current volatility
•Uses average weekly ranges
for targets

ADR SWING
TARGETS
Utilizes multiple-day ranges
to forecast reliable targets
•Simple; effective
•Can be used for any style of
trading and in any timeframe
•Price-based; self-adjusts to
current volatility
•Success rates over 70%
ADR Swing Targets use average price movement and multiple-day
ranges in order to forecast reliable and accurate targets.
ADR SWING TARGETS
ADR SWING TARGETS
FDL
+aMDR
TGT
• Helps you forecast targets with a high
degree of accuracy (>70%!)
• Auto-adjusts to current market volatility
and behavior
• Simple; effective - and it works!
• The Real-Time and Swing Editions of
The ADR Method teach the entire
methodology
The ADR Method is a simple, yet powerful, method used for forecasting
targets using average price range in any timeframe.
WHAT IS THE
ADR METHOD?
WHY SHOULD YOU
USE ADR TARGETS?
• Provides a simple, price-based approach that incorporates
recent price behavior
• Self-adjusts to current volatility
• Helps provide reasonable price range expectations for the
upcoming period of time
• Allows you to easily forecast bull and bear targets,
regardless of timeframe
• Allows you to anticipate market behavior, including
breakouts (expansion) and range markets (compression)
Average Daily Range has been used by professionals for years, because it
provides a price-based approach that relies on current price behavior.
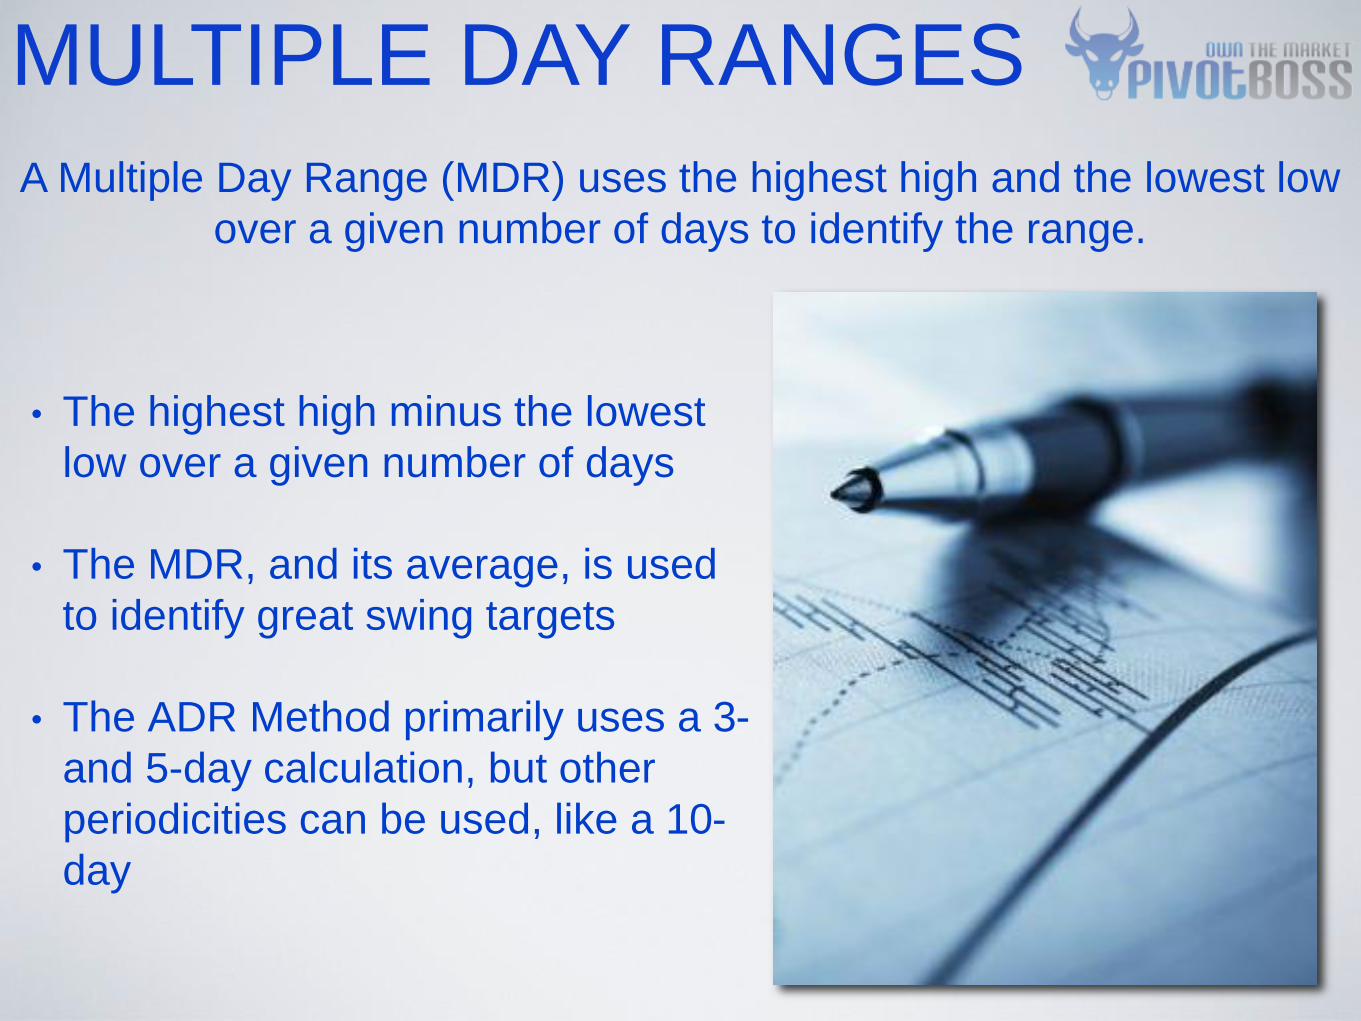
• The highest high minus the lowest
low over a given number of days
• The MDR, and its average, is used
to identify great swing targets
• The ADR Method primarily uses a 3-
and 5-day calculation, but other
periodicities can be used, like a 10-
day
A Multiple Day Range (MDR) uses the highest high and the lowest low
over a given number of days to identify the range.
MULTIPLE DAY RANGES
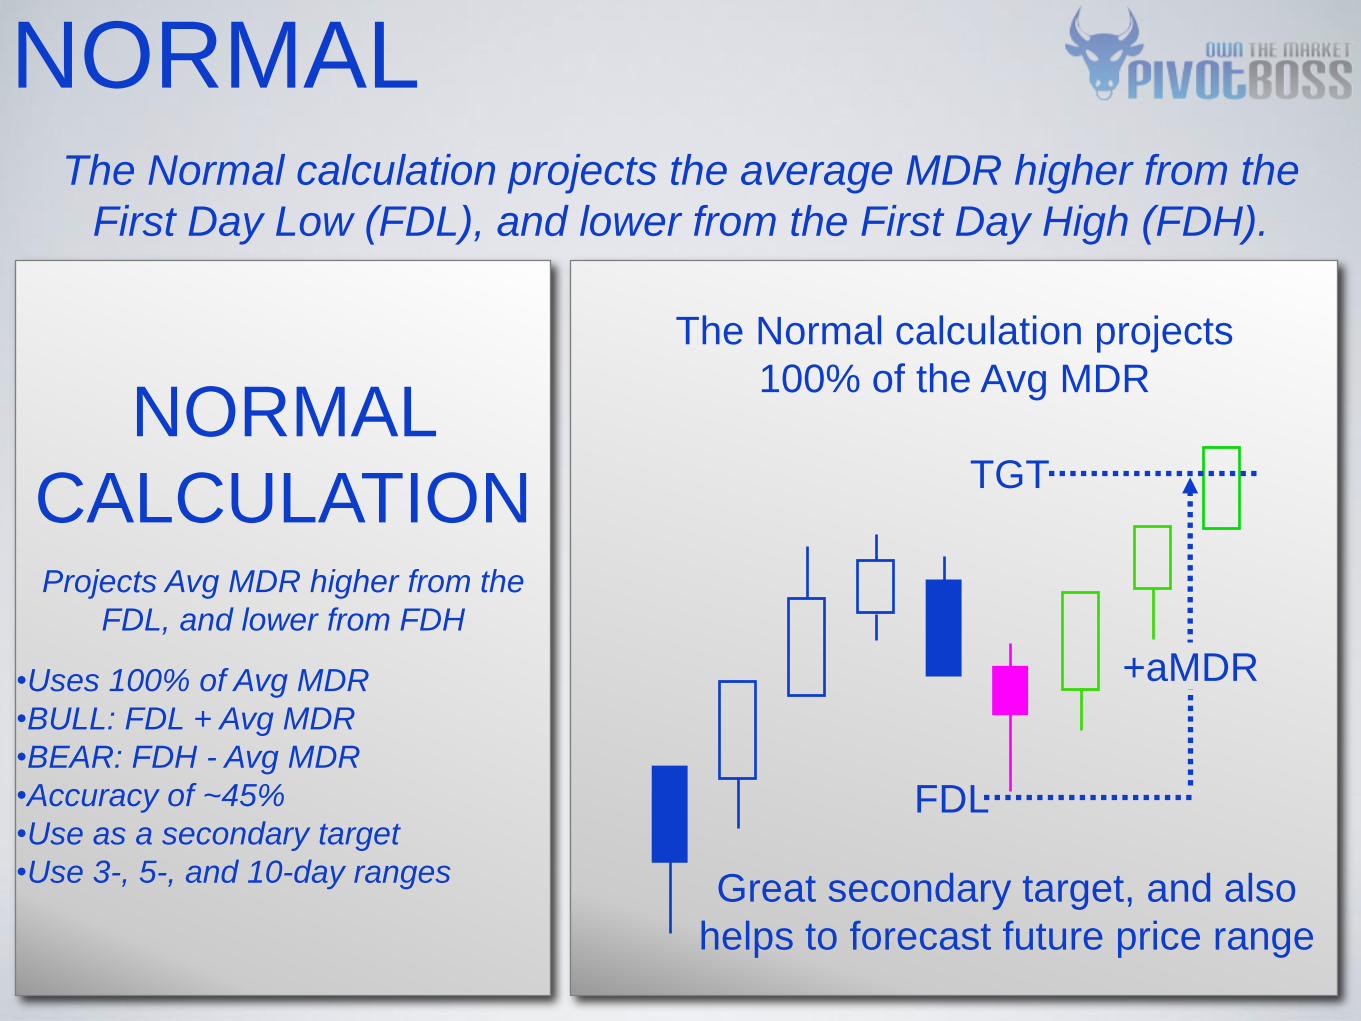
NORMAL
CALCULATION
Projects Avg MDR higher from the
FDL, and lower from FDH
•Uses 100% of Avg MDR
•BULL: FDL + Avg MDR
•BEAR: FDH - Avg MDR
•Accuracy of ~45%
•Use as a secondary target
•Use 3-, 5-, and 10-day ranges
The Normal calculation projects the average MDR higher from the
First Day Low (FDL), and lower from the First Day High (FDH).
NORMAL
The Normal calculation projects
100% of the Avg MDR
FDL
+aMDR
Great secondary target, and also
helps to forecast future price range
TGT

NORMAL APPLIED
Entry:
$32.36
10-day MDR =
1.63
L:
$32.17
Bull:
$33.80
Normal Bull: FDL + aMDR
Normal Bull: 32.17 + 1.63

NORMAL LITE
CALCULATION
Projects 75% of Avg MDR higher
from the FDL, and lower from FDH
•Uses 75% of Avg MDR
•BULL: FDL + (Avg MDR x .75)
•BEAR: FDH - (Avg MDR x .75)
•Accuracy of ~70%
•Use as the primary target
•Use 3-, 5-, and 10-day ranges
NORMAL LITE The Normal Lite calculation projects 75% of average MDR higher from
the First Day Low (FDL), and lower from the First Day High (FDH).
The Normal Lite calculation
projects 75% of the Avg MDR
+aMDR
x .75
Great primary target, with a success
rate of over 70%
FDL
TGT
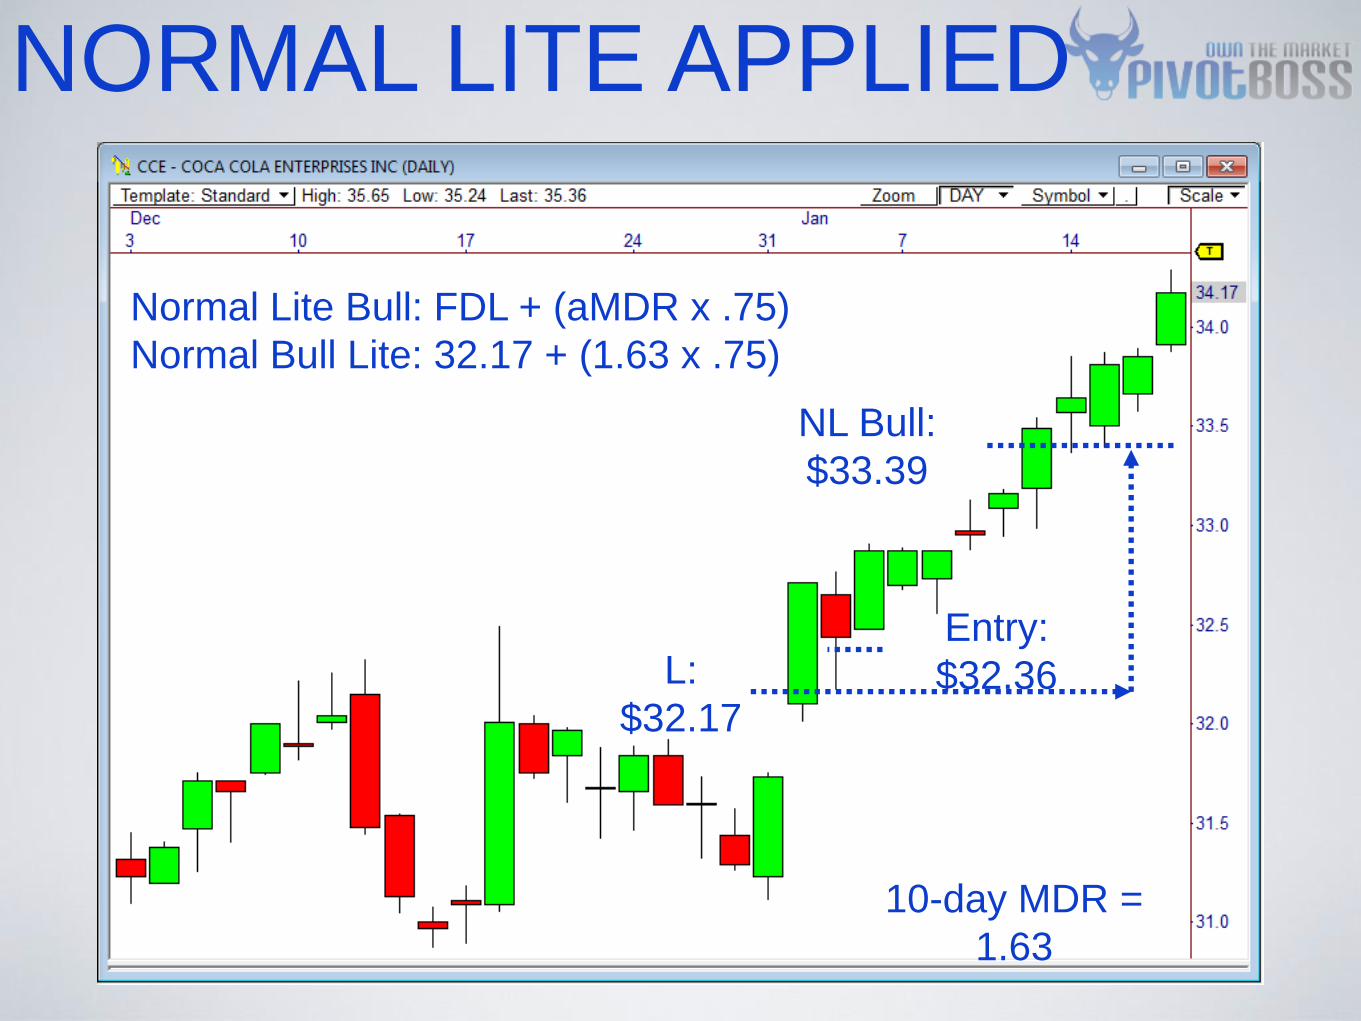
NORMAL LITE APPLIED
Entry:
$32.36
10-day MDR =
1.63
L:
$32.17
NL Bull:
$33.39
Normal Lite Bull: FDL + (aMDR x .75)
Normal Bull Lite: 32.17 + (1.63 x .75)
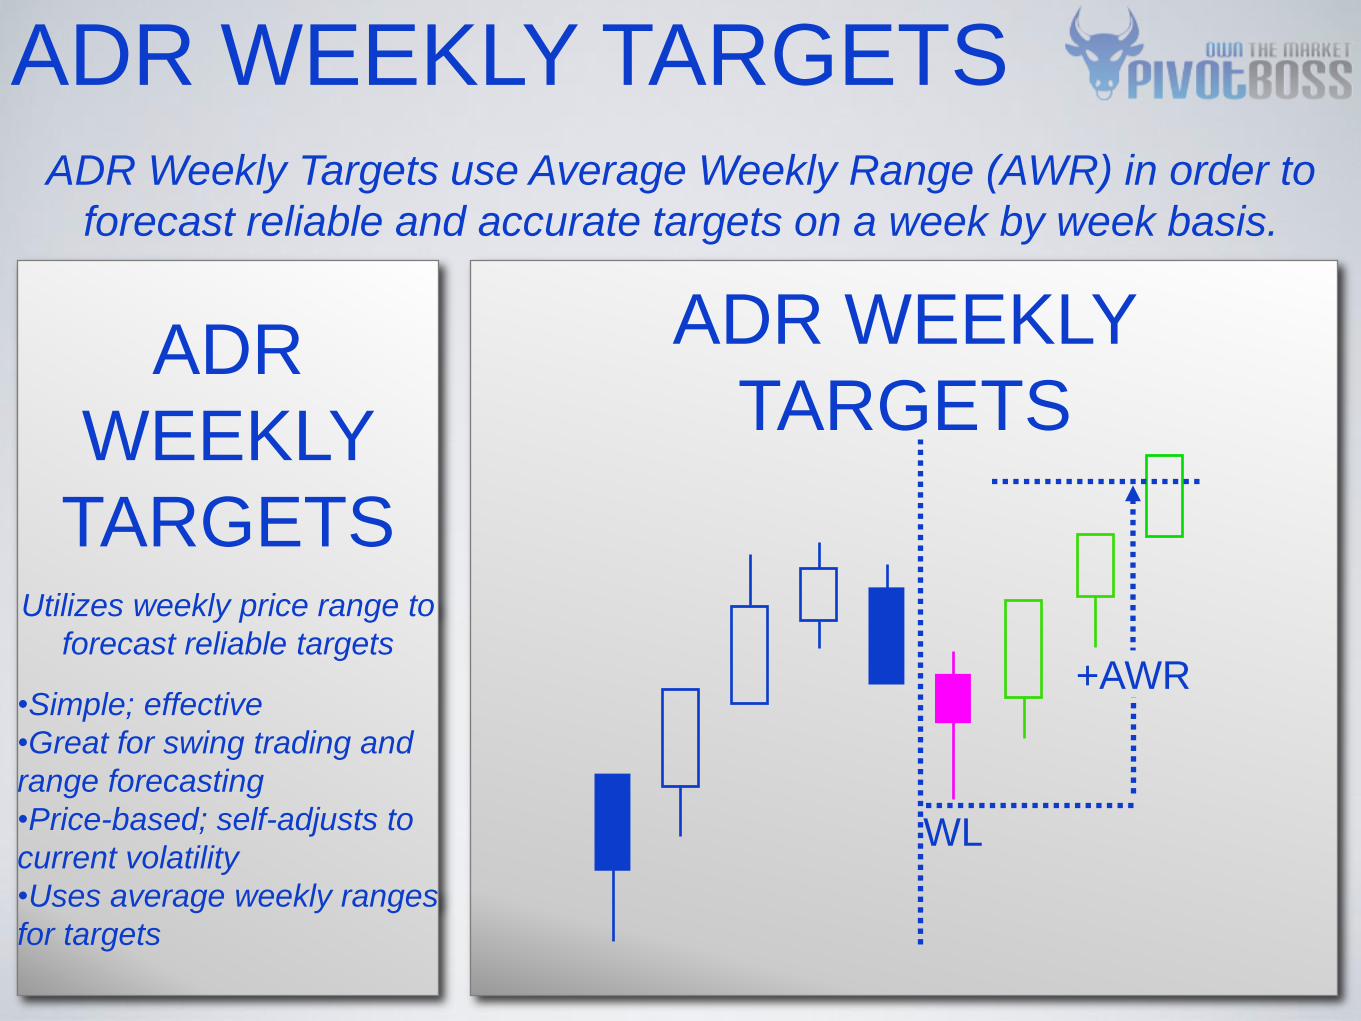
ADR
WEEKLY
TARGETS
Utilizes weekly price range to
forecast reliable targets
•Simple; effective
•Great for swing trading and
range forecasting
•Price-based; self-adjusts to
current volatility
•Uses average weekly ranges
for targets
ADR Weekly Targets use Average Weekly Range (AWR) in order to
forecast reliable and accurate targets on a week by week basis.
ADR WEEKLY TARGETS
ADR WEEKLY
TARGETS
WL
+AWR
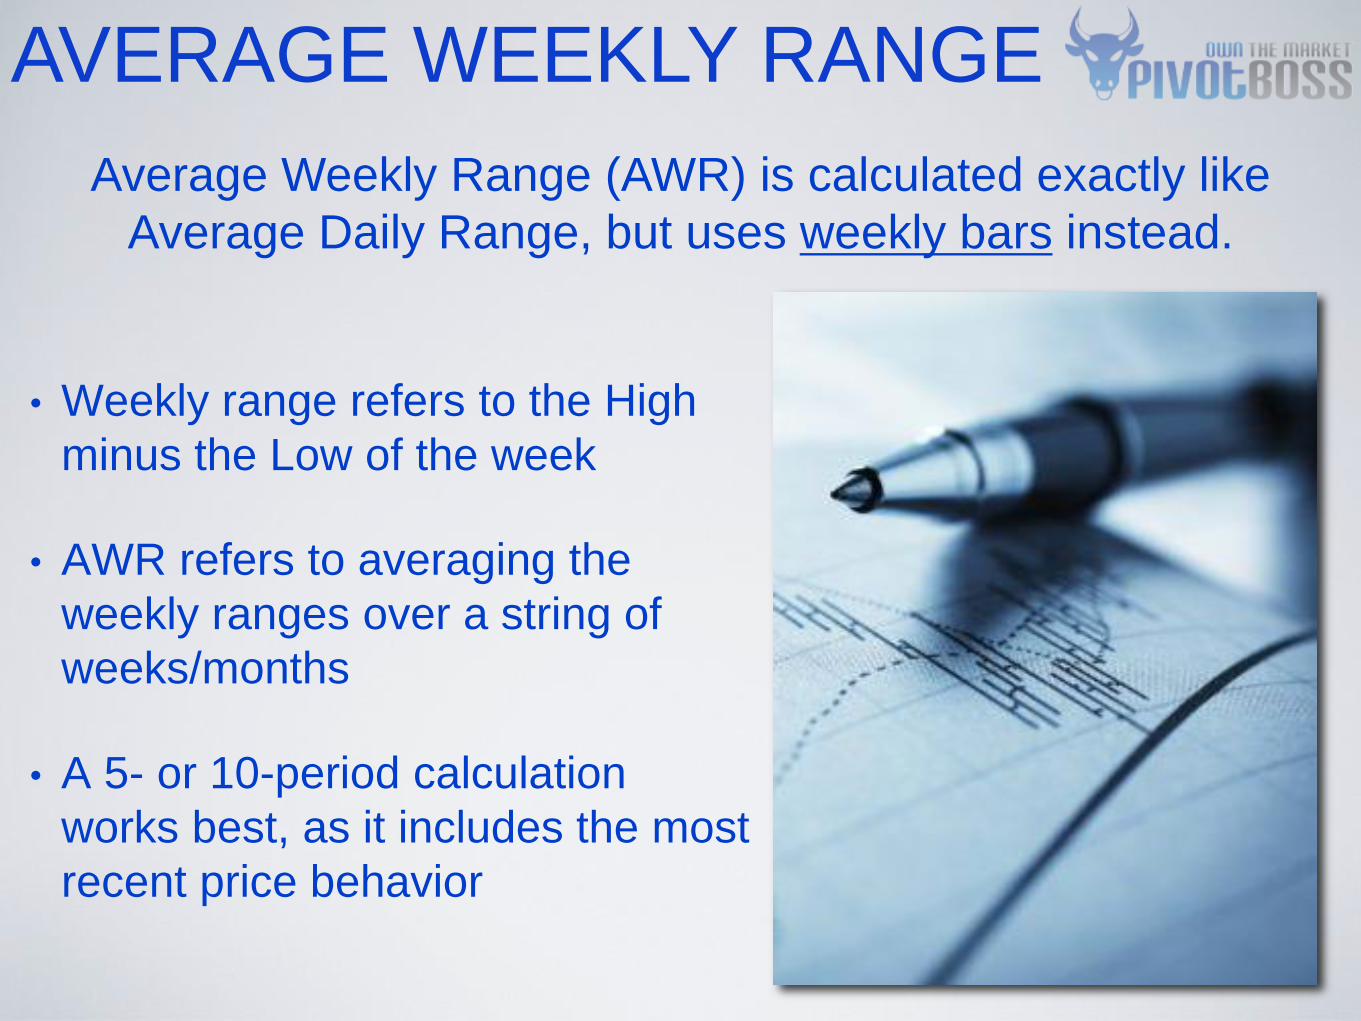
• Weekly range refers to the High
minus the Low of the week
• AWR refers to averaging the
weekly ranges over a string of
weeks/months
• A 5- or 10-period calculation
works best, as it includes the most
recent price behavior
Average Weekly Range (AWR) is calculated exactly like
Average Daily Range, but uses weekly bars instead.
AVERAGE WEEKLY RANGE
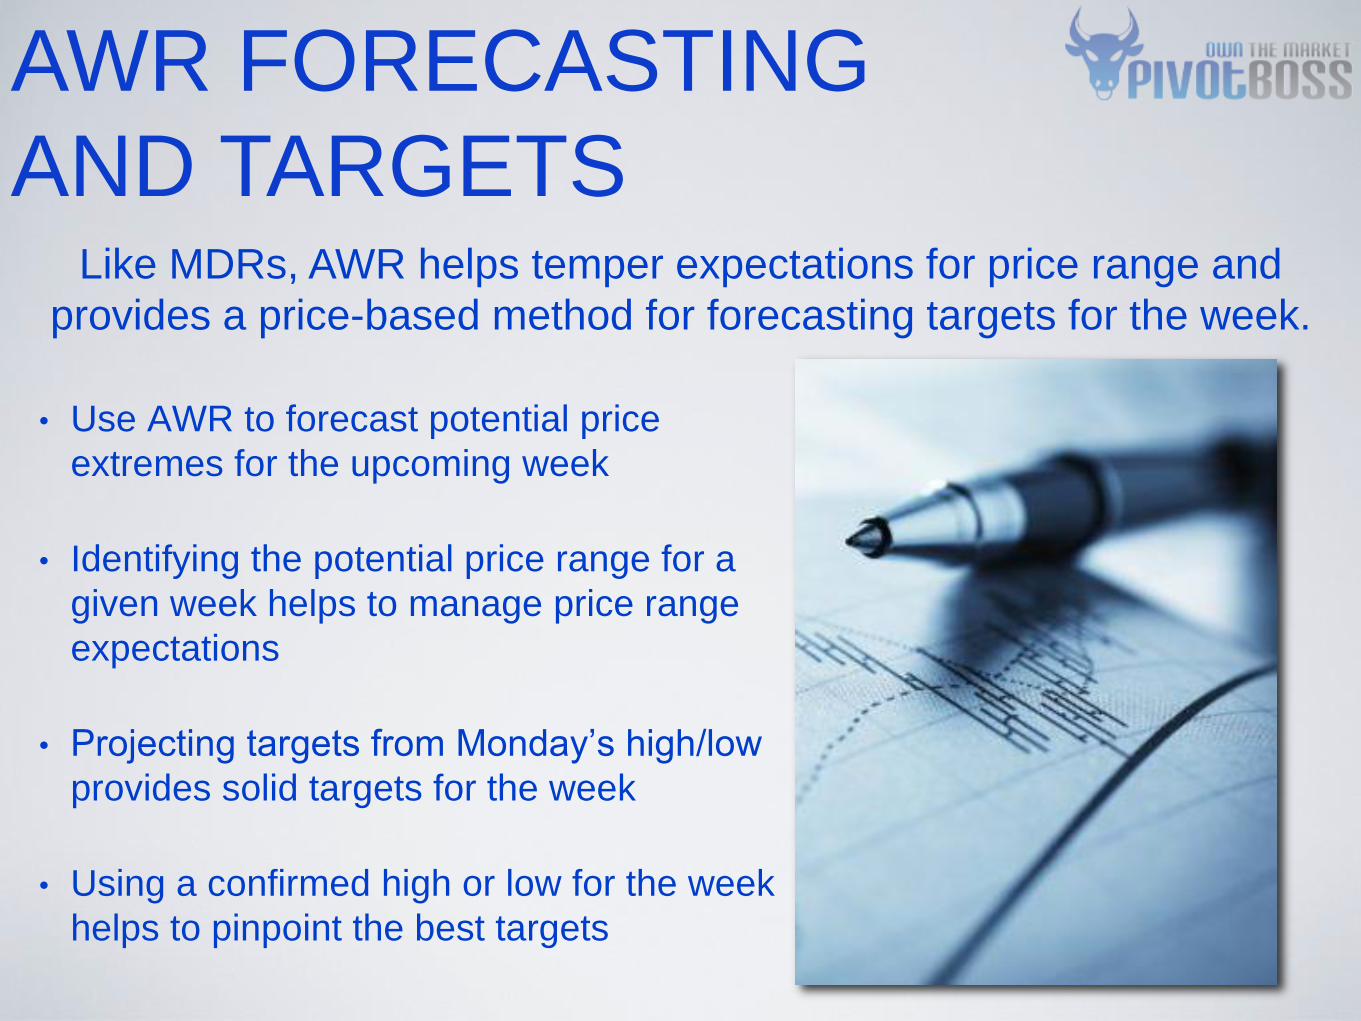
• Use AWR to forecast potential price
extremes for the upcoming week
• Identifying the potential price range for a
given week helps to manage price range
expectations
• Projecting targets from Monday’s high/low
provides solid targets for the week
• Using a confirmed high or low for the week
helps to pinpoint the best targets
Like MDRs, AWR helps temper expectations for price range and
provides a price-based method for forecasting targets for the week.
AWR FORECASTING
AND TARGETS
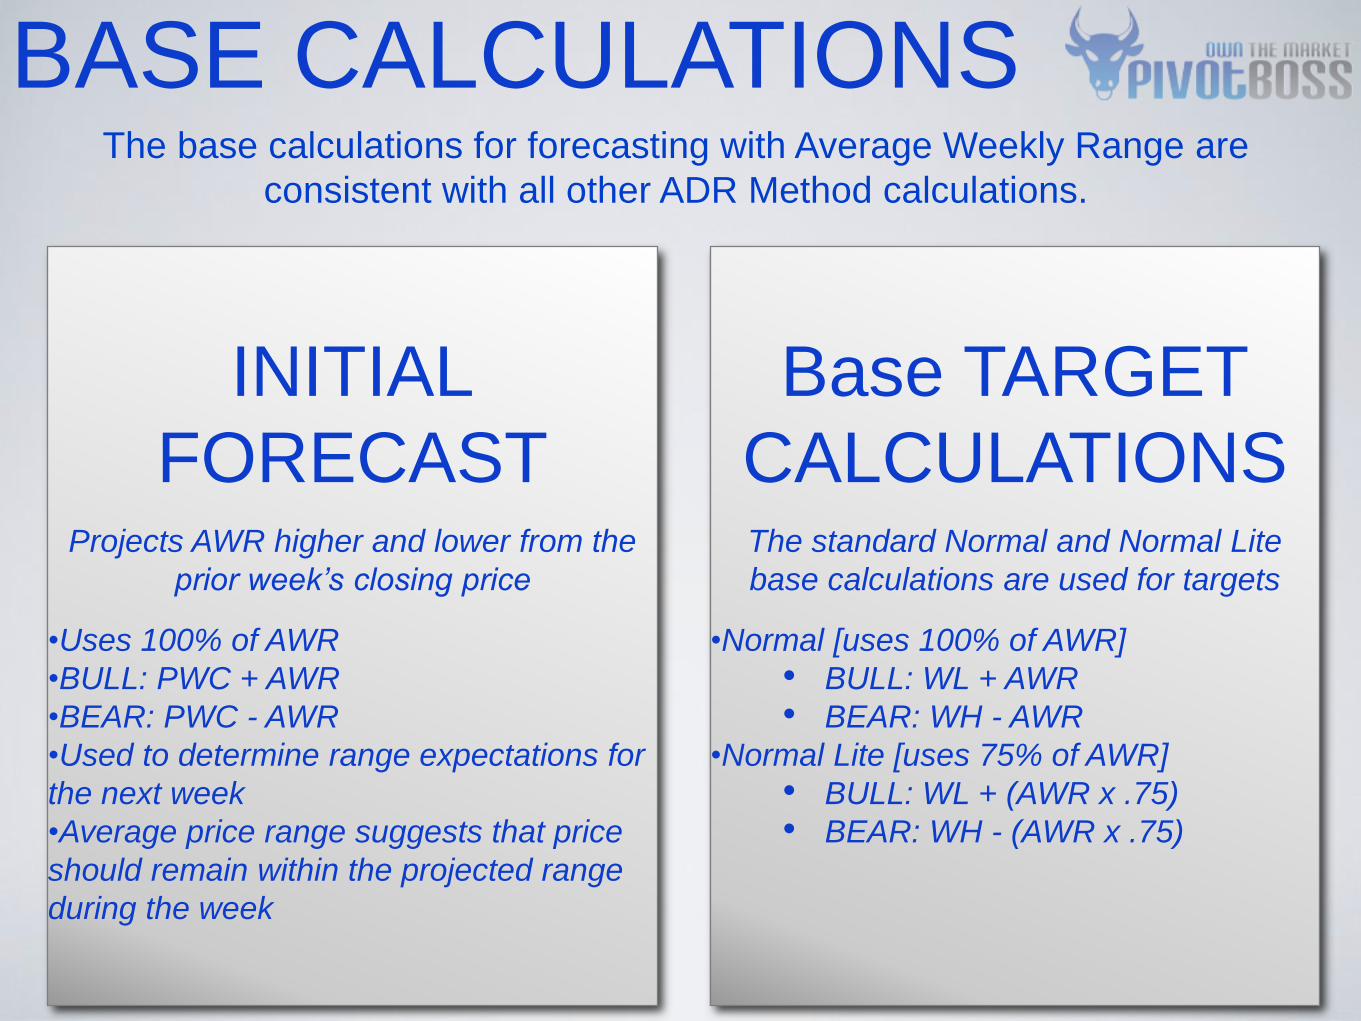
The base calculations for forecasting with Average Weekly Range are
consistent with all other ADR Method calculations.
BASE CALCULATIONS
INITIAL
FORECAST
Projects AWR higher and lower from the
prior week’s closing price
•Uses 100% of AWR
•BULL: PWC + AWR
•BEAR: PWC - AWR
•Used to determine range expectations for
the next week
•Average price range suggests that price
should remain within the projected range
during the week
Base TARGET
CALCULATIONS
The standard Normal and Normal Lite
base calculations are used for targets
•Normal [uses 100% of AWR]
• BULL: WL + AWR
• BEAR: WH - AWR
•Normal Lite [uses 75% of AWR]
• BULL: WL + (AWR x .75)
• BEAR: WH - (AWR x .75)
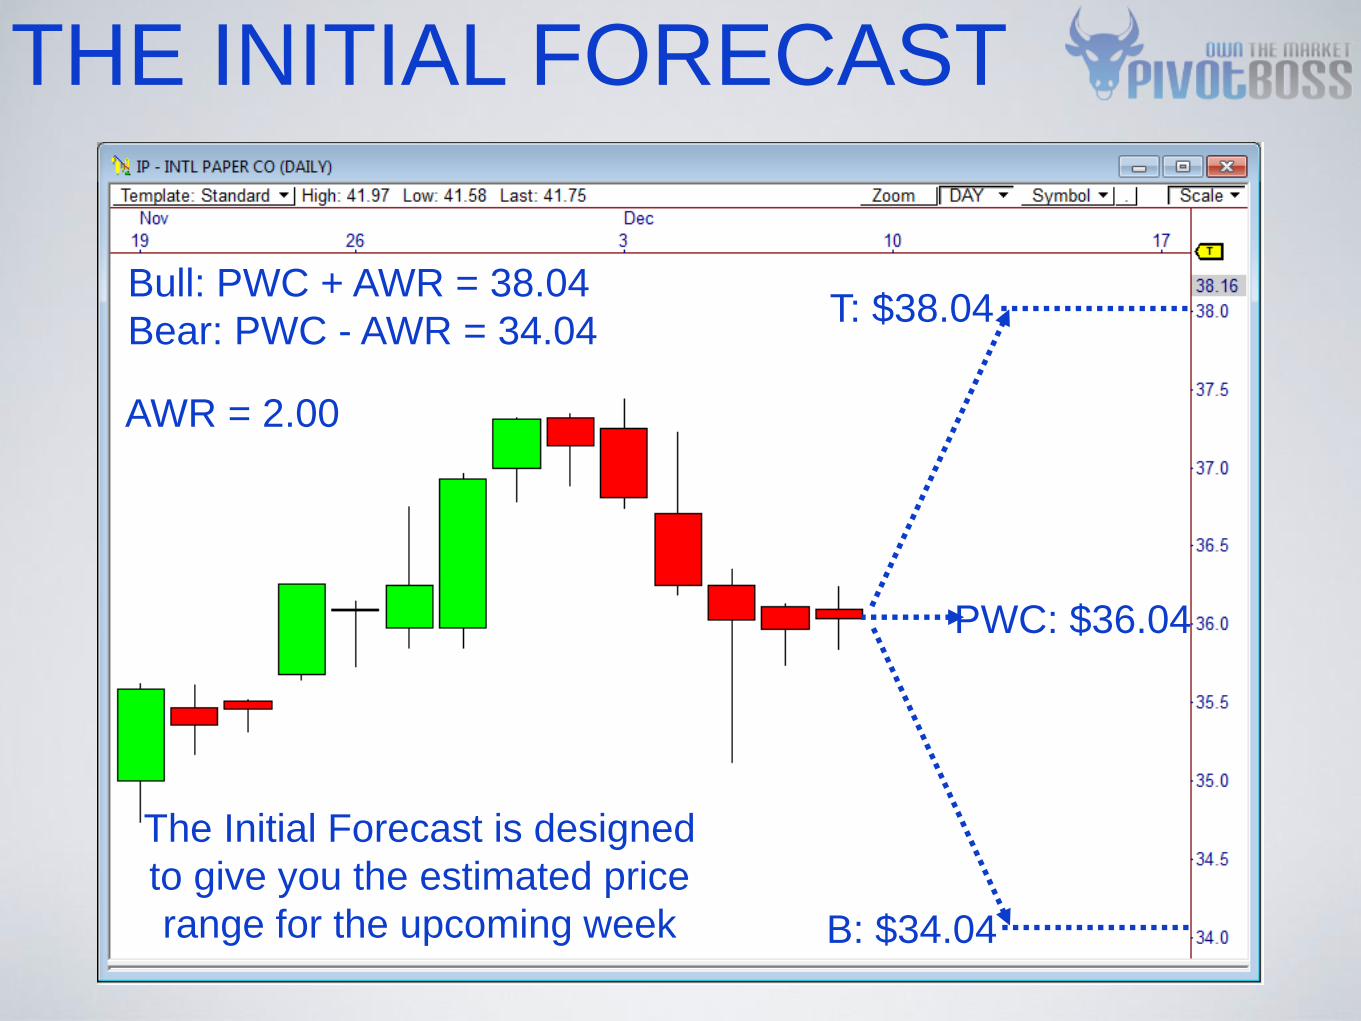
THE INITIAL FORECAST
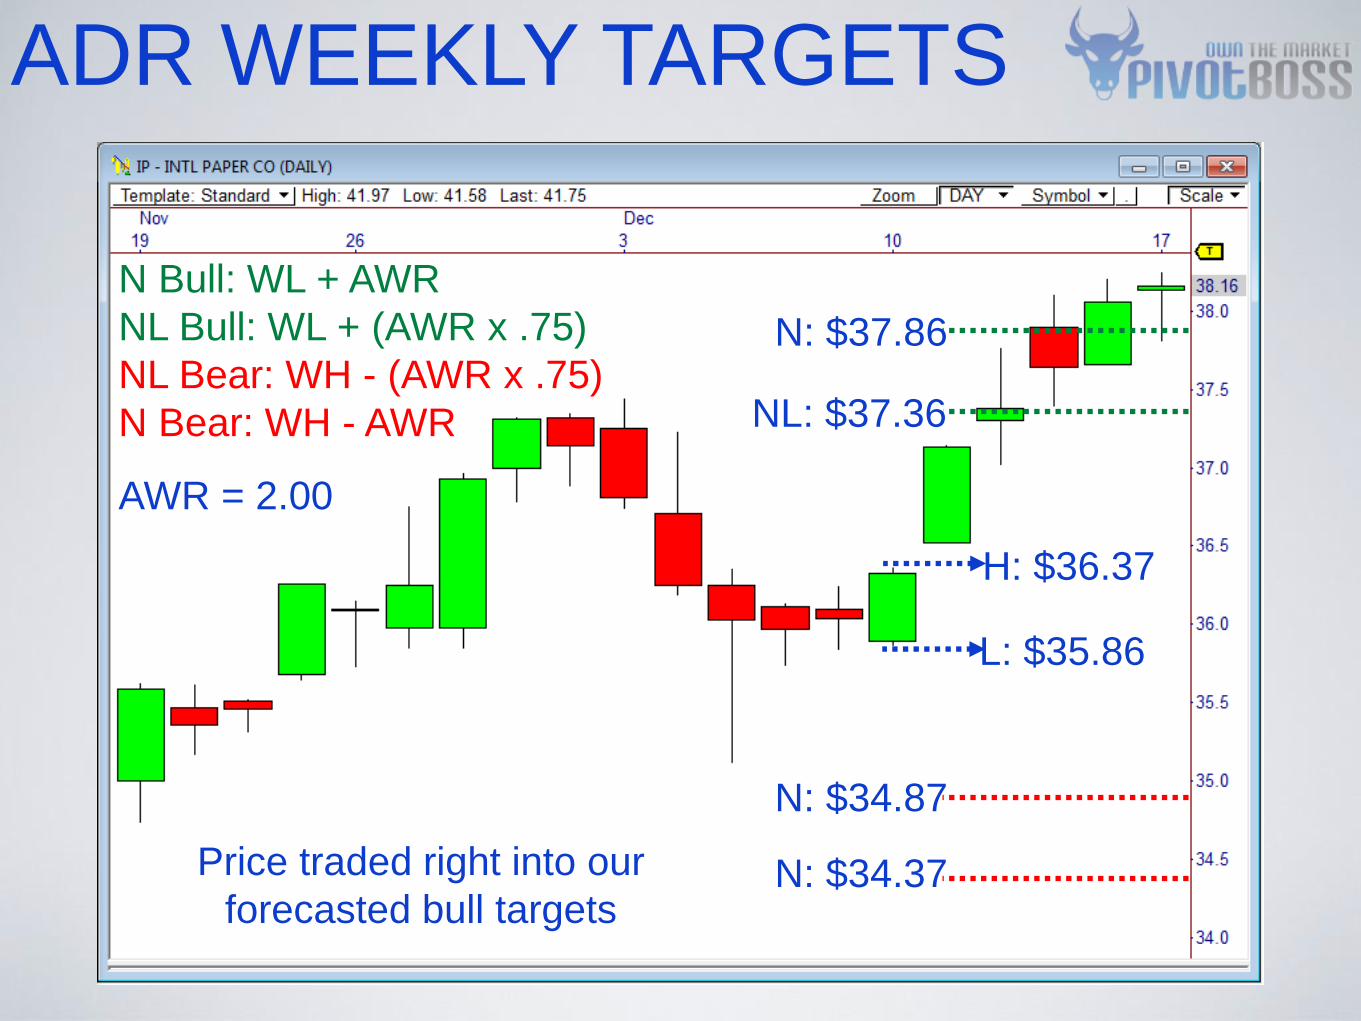
AWR = 2.00
PWC: $36.04
T: $38.04 Bull: PWC + AWR = 38.04
Bear: PWC - AWR = 34.04
B: $34.04
The Initial Forecast is designed
to give you the estimated price
range for the upcoming week
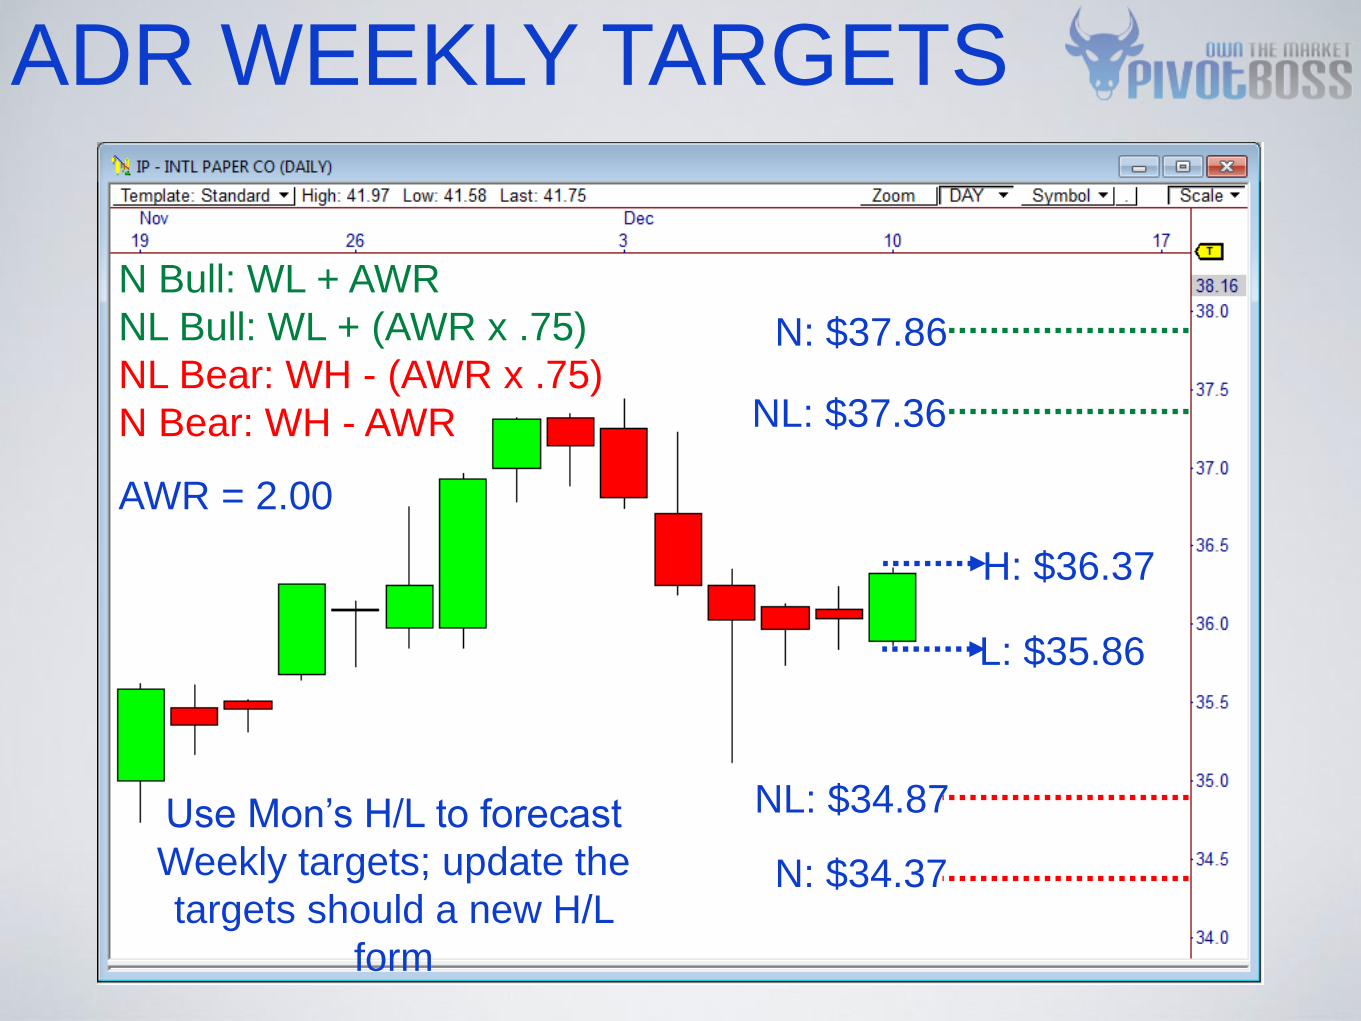
ADR WEEKLY TARGETS
AWR = 2.00
L: $35.86
N: $37.86
N Bull: WL + AWR
NL Bull: WL + (AWR x .75)
NL Bear: WH - (AWR x .75)
N Bear: WH - AWR
Use Mon’s H/L to forecast
Weekly targets; update the
targets should a new H/L
form
NL: $37.36
NL: $34.87
N: $34.37
H: $36.37
ADR WEEKLY TARGETS
AWR = 2.00
L: $35.86
N: $37.86
N Bull: WL + AWR
NL Bull: WL + (AWR x .75)
NL Bear: WH - (AWR x .75)
N Bear: WH - AWR
Price traded right into our
forecasted bull targets
NL: $37.36
N: $34.87
N: $34.37
H: $36.37

ADR WEEKLY TARGETS
N: $37.86
The Initial Forecast gave us a
great starting point for identifying
the week’s potential price range NL: $37.36
N: $34.87
N: $34.37

FREE TRADE TECHNIQUE
The Free Trade Technique is a 2-part scaling technique that allows you
to position yourself with a risk-free trade after an initial favorable move.
• A conservative 2-part scaling
technique; defensive approach
• Allows you to eliminate risk from
your trade after an initial favorable
move
• Allows you to “dip your toe” into the
trading waters
• Allows you to proceed with caution
during volatile markets
FREE TRADE
TECHNIQUE
An easy scaling technique that helps position
yourself for a risk-free trade
•Calculate your risk on the trade (Entry price -
Stop Loss price)
•Project this amount higher from your entry
price (Free Trade Zone)
•When price reaches your FTZ, sell half of
your position
•Leave your original stop for the last half of
your position
•You now have a free trade; you lose no
money if you are stopped out
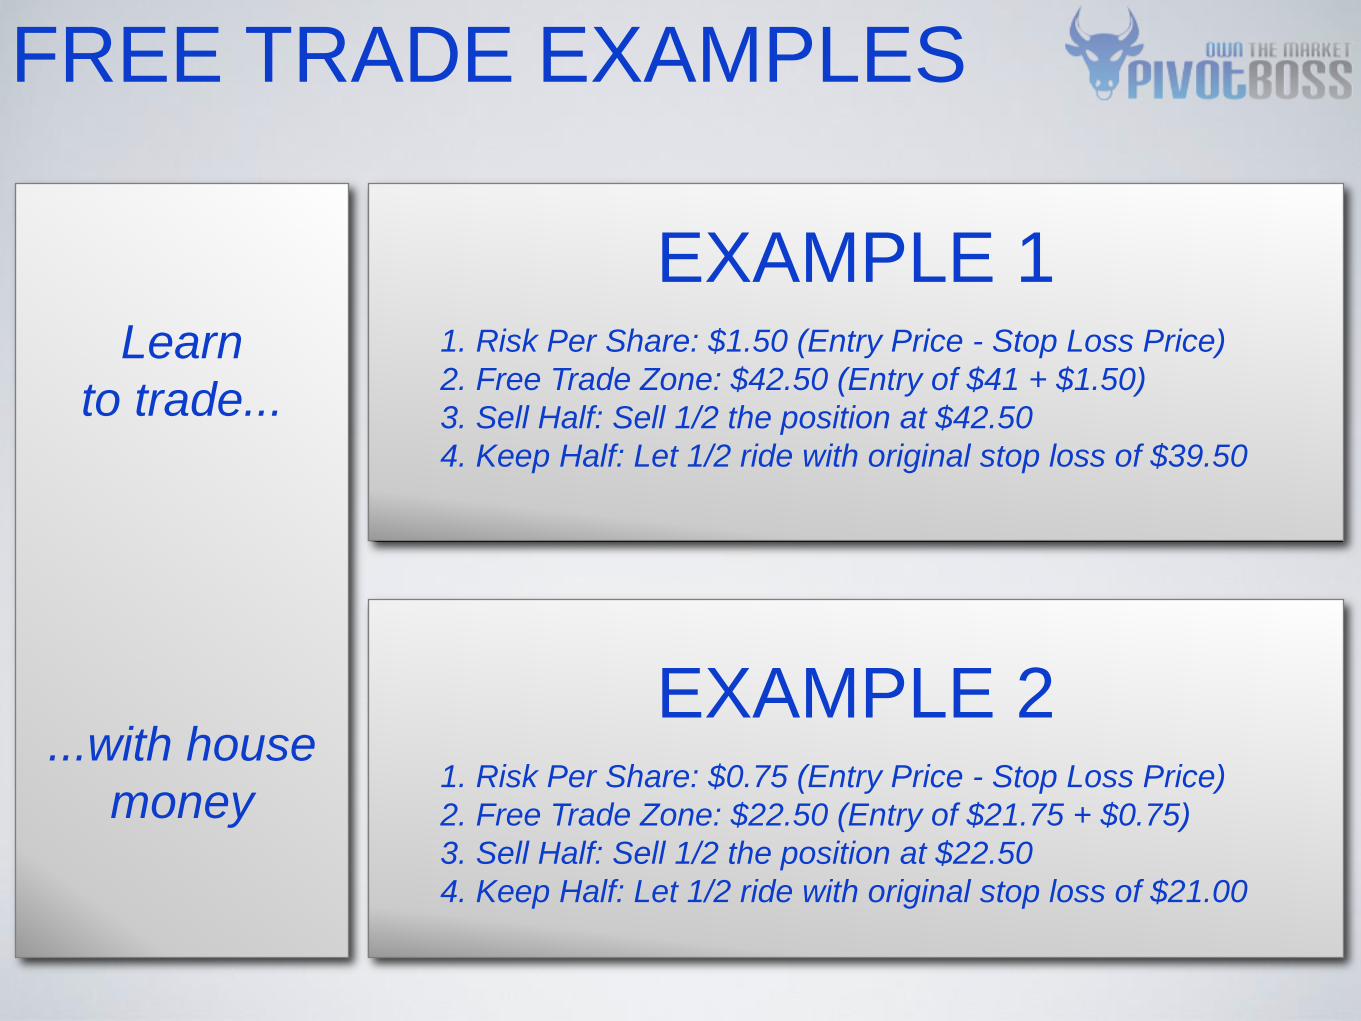
FREE TRADE EXAMPLES
EXAMPLE 1
1. Risk Per Share: $1.50 (Entry Price - Stop Loss Price)
2. Free Trade Zone: $42.50 (Entry of $41 + $1.50)
3. Sell Half: Sell 1/2 the position at $42.50
4. Keep Half: Let 1/2 ride with original stop loss of $39.50
EXAMPLE 2
1. Risk Per Share: $0.75 (Entry Price - Stop Loss Price)
2. Free Trade Zone: $22.50 (Entry of $21.75 + $0.75)
3. Sell Half: Sell 1/2 the position at $22.50
4. Keep Half: Let 1/2 ride with original stop loss of $21.00
Learn
to trade...
...with house
money
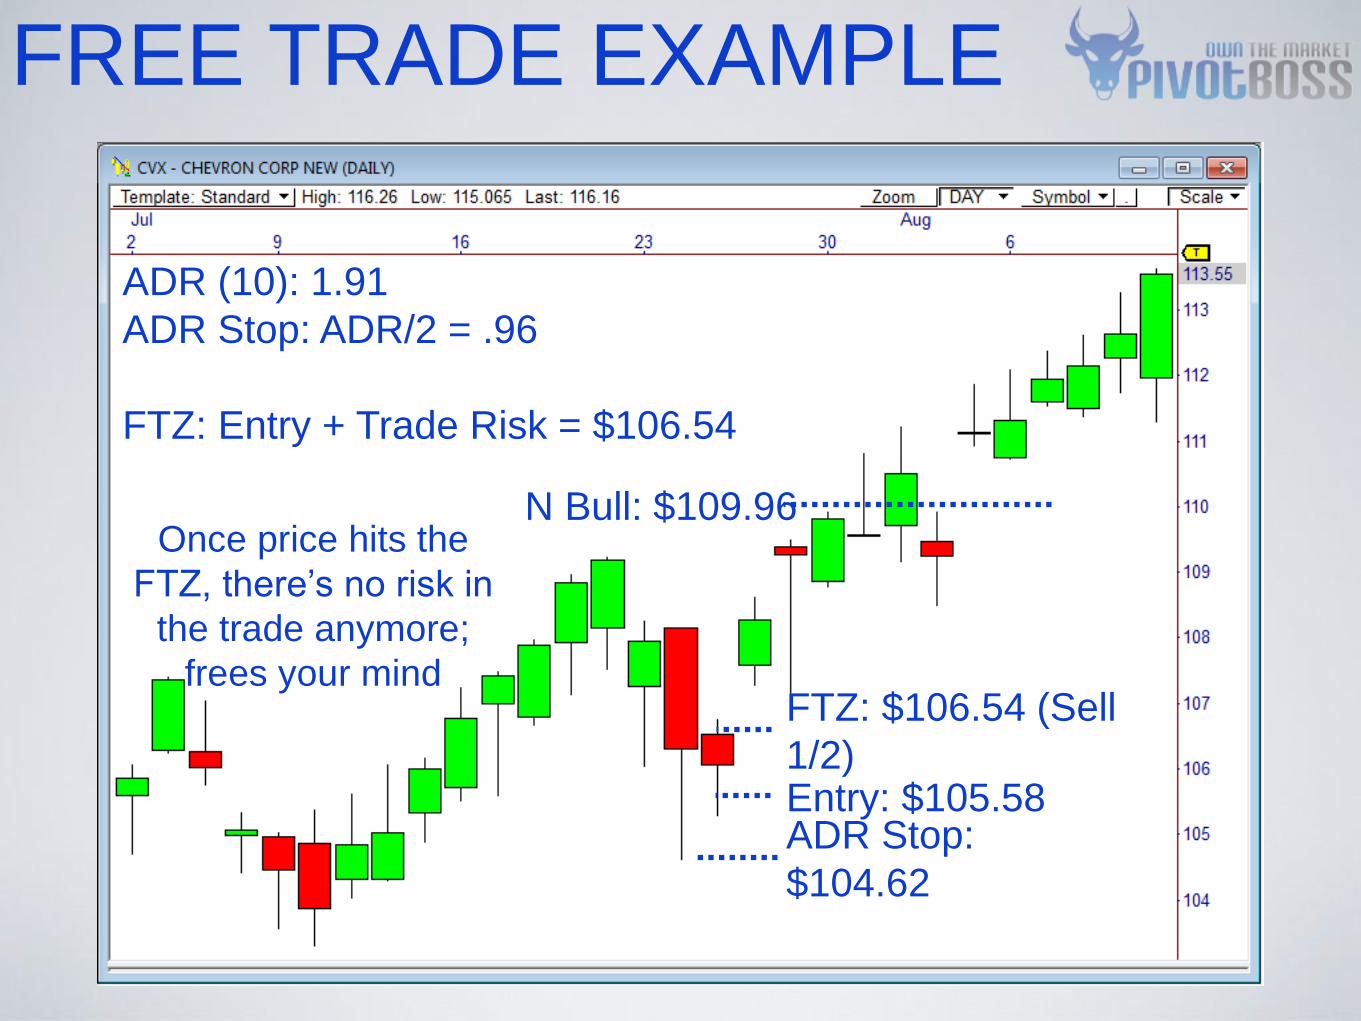
FREE TRADE EXAMPLE
ADR Stop:
$104.62
N Bull: $109.96
ADR (10): 1.91
ADR Stop: ADR/2 = .96
FTZ: Entry + Trade Risk = $106.54
Entry: $105.58
FTZ: $106.54 (Sell
1/2)
Once price hits the
FTZ, there’s no risk in
the trade anymore;
frees your mind
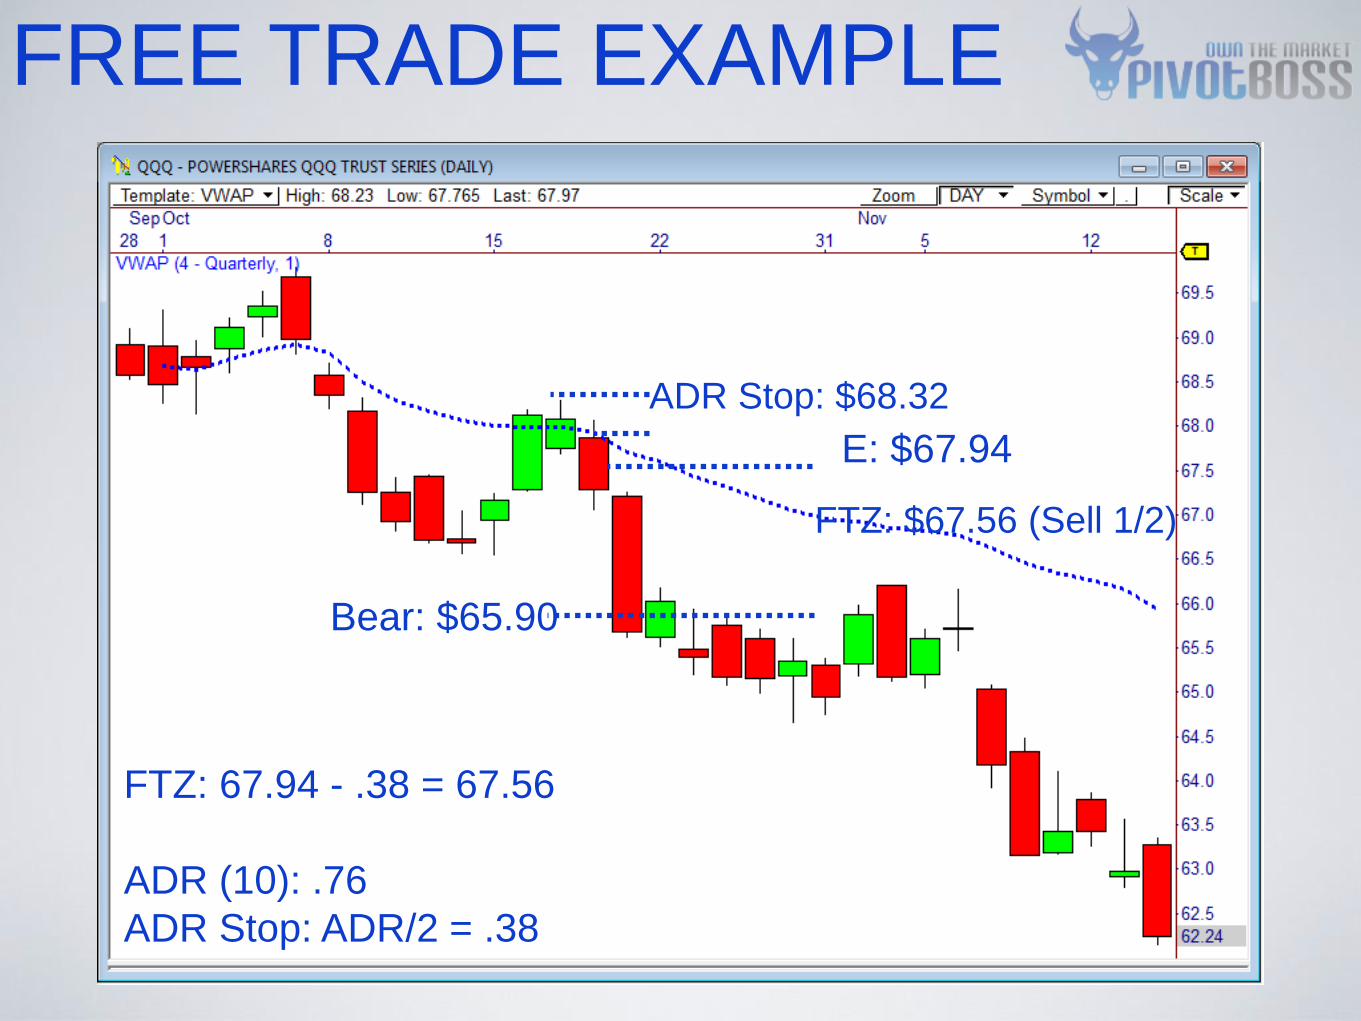
FREE TRADE EXAMPLE
Bear: $65.90
E: $67.94
ADR Stop: $68.32
FTZ: 67.94 - .38 = 67.56
ADR (10): .76
ADR Stop: ADR/2 = .38
FTZ: $67.56 (Sell 1/2)

Final Thoughts
• It’s all about Trade Location; remain
disciplined in requiring a great entry
• Know the types of Pro-Style entries,
and when to deploy them
• The setup doesn’t make the money;
knowing when to use it does
• Practice leads to confidence;
confidence is gained through
experience
Discipline, patience, and technique are the most important
aspects of executing successful swing trades.

CONTACT ME!
Frank Ochoa Author, Educator, Trader
www.pivotboss.com
Twitter: @PivotBoss
Shop: shop.pivotboss.com

with Frank Ochoa
SWING TRADE PROTRADE AND RISK MANAGEMENT