Embed Size (px)
Citation preview
1
The Effects of AFTA on Macroeconomic Variables and Poverty: Evidence of Laos
Phouphet Kyophilavong1; Richard Record2; Shinya Takamatsu2; Konesawang Nghardsaysone2; Inpaeng Sayvaya3
Abstract The ASEAN Free Trade Agreement (AFTA) plays an important role in regional economic development. However, whether AFTA contributes to issues of poverty is still not clear. Therefore, the main objective of this study is to assess the impact of AFTA on poverty using Laos as a case study. We applied a CGE model and micro-simulation for this study. The simulation from the CGE model shows that overall, Laos will gain from AFTA through increasing GDP and welfare gains, and improvements in terms of trade, but will also experience an increase in trade deficits. The gains from AFTA will mainly come from the improvement of trade facilitation and significant increase in FDI. The results of the micro-simulation confirm that Laos will increase in general measures of welfare from AFTA, especially among rural households. In addition, AFTA might also reduce income inequality at the national level. It indicates that AFTA will bring positive impacts to the Lao economy, poverty and income distribution. Keywords: ASEAN; Laos; CGE model; Micro simulation JEL Classification: F15; F17
1 Faculty of Economics and Business Management, National University of Laos, [email protected] 2 The World Bank. 3 Faculty of Economics and Management Champassak University, Laos.
2
1.0. INTRODUCTION The impact of trade liberalization on growth and poverty is of major interest to academics and policy makers. Empirical studies show that trade is important to stimulating economic growth and structural change, which can lead to higher incomes and the reallocation of production and consumption (Winter, 2004; Dollar, 1992; Frankel and Rose, 1999). However, there are still some questions as to whether or not trade liberalization is good for poor households. The Lao People’s Democratic Republic (hereafter Laos) is a Least Developed Country (LDC) in economic transition and there is a large development gap between Laos and other countries. The Government of Laos’ (GoL) national development goal is to graduate from LDC status by the year 2020, while balancing economic, social and environmental issues (GoL, 2004; 2006). The GoL is liberalizing trade in order to increase economic growth and reduce poverty. One of the most significant steps towards trade liberalization, Laos joined the ASEAN Free Trade Area (AFTA) in 1998. Laos has achieved economic growth in the past decade along with remarkable poverty reduction. However, Laos still faces various economic problems. First, Laos is facing budget and trade deficits. Second, despite reducing poverty gradually, poverty is still high, especially in rural areas, and inequality has increased. Therefore, there are some questions concerning whether trade liberalization such as AFTA will raise or alleviate poverty in Laos. The AFTA could have positive and negative impacts on poverty depending on changes in household income, factor markets, household and commodity markets. However, there are very few studies focused on the impact of AFTA on poverty in Laos. Most studies are descriptive analyses which do not use comprehensive economic models. Given the fact that research on these issues is so limited, the impact of AFTA on macroeconomic variables and poverty is still not clear. Therefore, we used the CGE model and micro-simulation to analyze the impact of AFTA on macroeconomic variables and poverty in Laos. This results of this study are vital to formulating appropriate policies for gaining the maximum benefits from AFTA. This study has three main contributions to the literature. Firstly, it is a pioneer study in linking the CGE model and micro-simulation to analyze the impacts of AFTA on poverty in Laos. Secondly, in order to capture dynamic trade liberalization impacts, we consider the FDI impact and trade facilitation improvement from AFTA. Third, in order to investigate in more detail the impacts of AFTA on poverty, the logit model is used to analyze the factors influencing the gainer and loser from AFTA. This paper is organized as follows. Section 2 overviews the current economic integration in Southeast Asia and opportunities and challenges of ASEAN. Section 3 overviews the current situation and issues of the Lao economy, poverty and characteristics of trade. Section 4 reviews key literature related to the subject of trade liberalization under ASEAN and poverty impacts. Section 5 describes the research methodology used in this study. Section 6 presents the results of study and discusses their interpretation and application in national and regional contexts. Section 7 provides conclusions and policy recommendations.
3
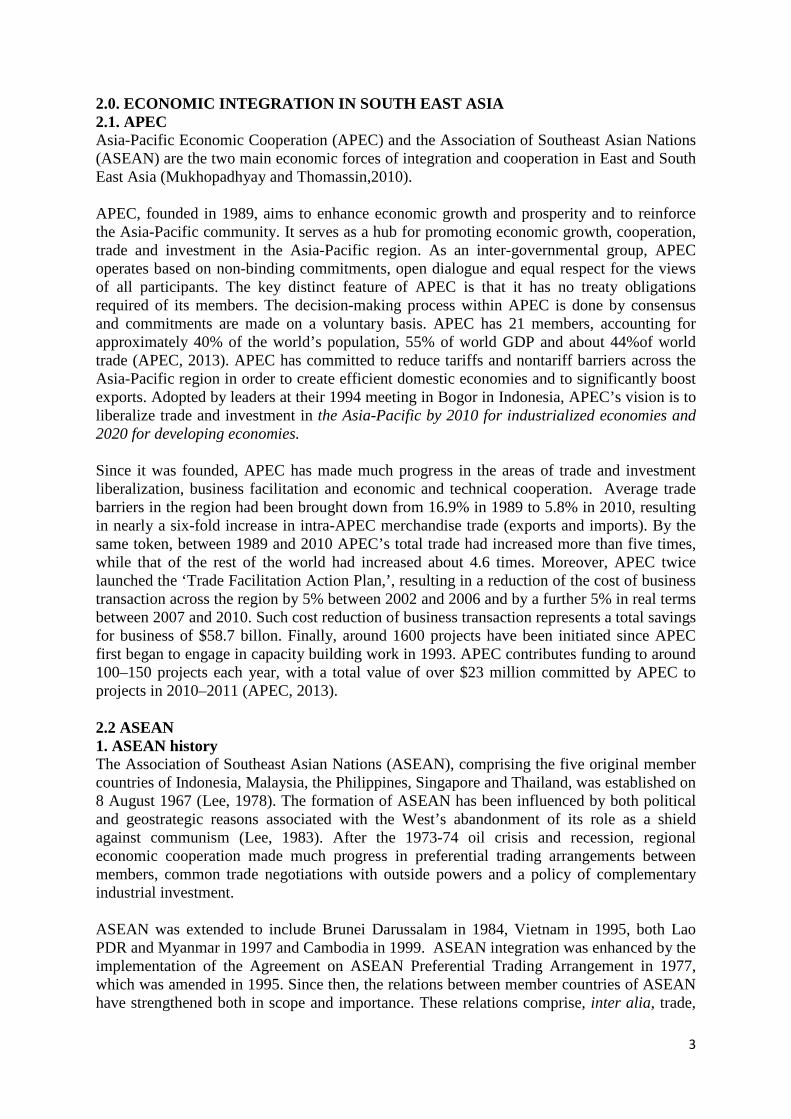
2.0. ECONOMIC INTEGRATION IN SOUTH EAST ASIA 2.1. APEC Asia-Pacific Economic Cooperation (APEC) and the Association of Southeast Asian Nations (ASEAN) are the two main economic forces of integration and cooperation in East and South East Asia (Mukhopadhyay and Thomassin,2010). APEC, founded in 1989, aims to enhance economic growth and prosperity and to reinforce the Asia-Pacific community. It serves as a hub for promoting economic growth, cooperation, trade and investment in the Asia-Pacific region. As an inter-governmental group, APEC operates based on non-binding commitments, open dialogue and equal respect for the views of all participants. The key distinct feature of APEC is that it has no treaty obligations required of its members. The decision-making process within APEC is done by consensus and commitments are made on a voluntary basis. APEC has 21 members, accounting for approximately 40% of the world’s population, 55% of world GDP and about 44%of world trade (APEC, 2013). APEC has committed to reduce tariffs and nontariff barriers across the Asia-Pacific region in order to create efficient domestic economies and to significantly boost exports. Adopted by leaders at their 1994 meeting in Bogor in Indonesia, APEC’s vision is to liberalize trade and investment in the Asia-Pacific by 2010 for industrialized economies and 2020 for developing economies. Since it was founded, APEC has made much progress in the areas of trade and investment liberalization, business facilitation and economic and technical cooperation. Average trade barriers in the region had been brought down from 16.9% in 1989 to 5.8% in 2010, resulting in nearly a six-fold increase in intra-APEC merchandise trade (exports and imports). By the same token, between 1989 and 2010 APEC’s total trade had increased more than five times, while that of the rest of the world had increased about 4.6 times. Moreover, APEC twice launched the ‘Trade Facilitation Action Plan,’, resulting in a reduction of the cost of business transaction across the region by 5% between 2002 and 2006 and by a further 5% in real terms between 2007 and 2010. Such cost reduction of business transaction represents a total savings for business of $58.7 billon. Finally, around 1600 projects have been initiated since APEC first began to engage in capacity building work in 1993. APEC contributes funding to around 100–150 projects each year, with a total value of over $23 million committed by APEC to projects in 2010–2011 (APEC, 2013). 2.2 ASEAN 1. ASEAN history The Association of Southeast Asian Nations (ASEAN), comprising the five original member countries of Indonesia, Malaysia, the Philippines, Singapore and Thailand, was established on 8 August 1967 (Lee, 1978). The formation of ASEAN has been influenced by both political and geostrategic reasons associated with the West’s abandonment of its role as a shield against communism (Lee, 1983). After the 1973-74 oil crisis and recession, regional economic cooperation made much progress in preferential trading arrangements between members, common trade negotiations with outside powers and a policy of complementary industrial investment. ASEAN was extended to include Brunei Darussalam in 1984, Vietnam in 1995, both Lao PDR and Myanmar in 1997 and Cambodia in 1999. ASEAN integration was enhanced by the implementation of the Agreement on ASEAN Preferential Trading Arrangement in 1977, which was amended in 1995. Since then, the relations between member countries of ASEAN have strengthened both in scope and importance. These relations comprise, inter alia, trade,
4
investment, customs, and intellectual property (European Commission, 2008). As of 2011, the ASEAN region hada population of approximately 605 million people (8.8% of the world’s population), a land area of 4.46 million km² (3% of the total land area of Earth), a combined nominal GDP of US$2,178 billion (3.1% of world GDP), and a total trade of about US$2,388 billion (6.5% of total world trade)(ASEAN Secretariat, 2012a). The primary purposes of ASEAN are (i) to accelerate economic growth, social progress and cultural development in the region through joint endeavours in the spirit of equality and partnership in order to strengthen the foundation for a prosperous and peaceful community of Southeast Asian Nations; and (ii) to promote regional peace and stability through abiding respect for justice and the rule of law in the relationship among countries of the region and adherence to the principles of the United Nations Charter (ASEAN Secretariat, 2012c). To further enhance intra-regional trade, the ASEAN leaders decided to build a new institution, known as the ASEAN Free Trade Area (AFTA), in 1992. AFTA was intended to reduce tariffs on all trade among members to under 5% within 15 years, albeit with the innumerable exclusions upon which each member nation insisted. Initially, the deadline for tariff reduction was set for 2008. But after ASEAN was enlarged to include Vietnam, Laos, Cambodia, and Myanmar, the deadline was moved forward to 2003, and later to 2000. In 2000, the Initiative on ASEAN Integration was launched, including unilateral and voluntary tariff reduction, especially by the older ASEAN members. The establishment of an ASEAN fund in excess of US$ 55 million played a crucial role in helping new members in areas such as infrastructure, human resource development, information and communications technology, and regional economic integration. In 2002, AFTA became operative but it appears not yet to have had a substantive impact. AFTA has been more of a preferential trade area with lower tariffs among its members compared to the rest of the world than a free trade area that eliminates tariffs and non-tariff barriers on goods produced by members for intra-AFTA trade (Angresano, 2004, p. 921).
2. AFTA The ASEAN Free Trade Area was established in 1993 by Brunei Darussalam, Indonesia, Malaysia, the Philippines, Singapore and Thailand. AFTA comprised a schedule of preferential tariff reductions, to be implemented progressively until 2010. Goods were divided in five categories: Inclusion List-Fast Track (IL-FT); Inclusion List-Normal (IL-N); Temporary Exclusion List (TEL); Sensitive List (SL); and General Exceptions (GE). The group titles reveal their meanings quite accurately. IL-FT goods were expected to have preferential tariffs reduced to 0-5% by 2000, while IL-N products had until 2003 to reach that level. TEL items were expected to be phased into the Inclusion List by 2000 for most manufactured products, and by 2003 for unprocessed agricultural products. SL goods corresponded mainly to unprocessed agricultural products that were granted a more flexible arrangement for phasing into the Inclusion List. Finally, GE products were permanently excluded from the agreement. In the second half of the 1990s, AFTA expanded to include four other countries in the region, namely, Cambodia, Laos, Myanmar, and Vietnam. They were incorporated into the existing scheme for preferential liberalization, although with more flexibility both with respect to the products added to the Inclusion List and with respect to the timing of liberalization. The formation of AFTA seems a clear means to eliminate tariff and nontariff barrier in ASEAN. This arrangement has significantly enhanced intra-ASEAN trade. With an average
5
annual growth rate of 13.4% over the period 2000–2011, intra-ASEAN trade rose from US$166.8 billion in 2000 to US$584.2 billion in 2011 (ASEAN Secretariat, 2012b). There are three main reasons for AFTA’s success in deepening economic integration in ASEAN. AFTA’s coverage is comprehensive, as over 90% of product classifications were in the Inclusion List from the outset of the liberalization program. The liberalization program is also very ambitious, ultimately requiring free/near-free trade within the area for almost all products. Finally, AFTA members have clear commitment to achieve free intra-bloc trade (Calvo-Pardo et al., 2009, p. 10). 3. ASEAN Vision 2020 In 1997, the ASEAN countries continued the process of economic integration by establishing a vision and outlook for the year 2020. Their vision is to have a Zone of Peace, Freedom, and Neutrality for the ASEAN countries. The pathway chosen to reach this vision is to expand the economic integration of member countries. It is hoped that by 2020 an ASEAN Economic Region can be established and be a free trade area for member countries.
4. ASEAN Community The ASEAN Leaders considered the importance of establishing an ASEAN Community at the 9th ASEAN Summit in 2003, and signed the Cebu Declaration on the Acceleration of the Establishment of an ASEAN Community by 2015 at the 12th ASEAN Summit in January 2007. The ASEAN Community is comprised of three pillars, namely the ASEAN Political-Security Community, ASEAN Economic Community (AEC) and ASEAN Socio-Cultural Community. Each pillar has its own Blueprint, and, together with the Initiative for ASEAN Integration (IAI) Strategic Framework and IAI Work Plan Phase II (2009–2015), they form the Roadmap for and ASEAN Community 2009–2015 (ASEAN Secretariat, 2012b). Among the three communities in ASEAN, AEC would transform ASEAN into a region in which goods, services, capital and skilled labour would flow freely. The establishment of AEC is (1) to generate a post-AFTA agenda that would be comprehensive; (2) to deepen economic integration in ASEAN in light of the new international commercial environment, especially the dominance of free trade areas (FTAs); (3) given (2), to prevent the possibility that bilateral FTAs could actually jeopardize ASEAN integration since all member-states were free to pursue their own commercial policy agenda; (4) to prevent the economic crises such as the one which occurred in 1997 through cooperation in the real and financial sectors and free flow of skilled labour (Plummer, 2006, p. 436). 2.3. ASEAN+3 ASEAN+3—including the ASEAN-10 countries, China, Japan, and the Republic of Korea— was initiated in the informal ASEAN Leader’s Meeting in December 1997 in the midst of the Asian financial crisis. The East Asia Vision Group, established in 1999, proposed the idea of forming an “East Asian Community.” In November 2004, the ASEAN+3 Leaders agreed to establish an “East Asian Community” as a long-term objective and regarded ASEAN+3 as the main engine for this eventual formation. Its main purposes in terms of economic, trade, and investment integration are the establishment of an EAFTA and trade liberalization well ahead of the Asia Pacific Economic Cooperation (APEC) Bogor Goal4; the enlargement of the Framework Agreement on an ASEAN Investment Area (AIA) to all of East Asia; the
4 The APEC Bogor goal was declared in 1994 to set the goal of zero tariffs by 2010 for developed countries and
by 2020 for developing countries.
6
advancement of development and technological cooperation among regional countries to provide assistance to less developed countries; and the realization of a knowledge-based economy and establishment of a future-oriented economic structure (Dean and Wignaraja, 2007). ASEAN and its ‘+3’ countries have made substantial progress in the areas of economic, monetary and financial cooperation. Total trade value between ASEAN and the +3 countries has been rising over time with an annual average growth rate of 14.6% over the period 2005–2011). It rose from US$315.2 billion (25.7% of total ASEAN trade) in 2005 to US$669.1billion(28% of total ASEAN trade) in 2011 (ASEAN Secretariat, 2012b). The main driving force behind this trade flow is the establishment of bilateral trading arrangements between ASEAN and its counterparts, namely, ASEAN-China, ASEAN-Japan, and ASEAN-Korea. These arrangements will serve as the building blocks for the possible establishment of an East Asian Free Trade Area (EAFTA). In terms of financial cooperation, a regional financing arrangement called the ‘Chiang Mai Initiative’ (CMI) has been put in place. The CMI comprises an expanded ASEAN Swap Arrangement (ASA) and a network of bilateral swap arrangements (BSAs) among ASEAN members. In addition, there has been significant progress in developing the Asian Bond Market Initiative (ABMI) for China, Japan and the Republic of Korea. ASEAN+3 countries are taking initiatives to alter existing regulations to help the issuance of and investment in local currency denominated bonds under the ABMI. 1. ASEAN+China The development of ASEAN-China trade and economic relations can roughly be divided into three stages (Jianglin, 2007). The first stage, covering 1967 to 1990, was an important moment to build mutual understanding and trust. The mutual understanding between ASEAN and China was gradually strengthened through bilateral activities in the late 1970s and early 1980s when China dramatically changed its foreign policy. China formally agreed to have diplomatic relations with all ASEAN members by 1991. The second stage, covering 1991 to 2001, was the rapid improvement of political and economic relations between China and ASEAN. In particular, in 1997, both sides issued a joint declaration on building a good-neighborly partnership oriented to the 21st century. The third stage, starting from 2002 to present, is to enhance the China-ASEAN Free Trade Area by 2010. In 2004, all ASEAN members unanimously recognized China’s full market economy status and signed the Agreement on Trade in Goods of the Framework Agreement on Comprehensive Economic Cooperation with China. In July 2005, the ‘early harvest trade in goods’ programme came into effect. In 2007, both sides signed the Agreement on Trade in Services. These arrangements have reinforced economic relationship between ASEAN and China. 2. ASEAN+Japan The bilateral trade relationship between ASEAN and Japan has been strengthened since the Joint Declaration made at the Japan-ASEAN Summit held on 5 November 2002 in Phnom Penh, Cambodia. This declaration signaled an intention to (1) implement measures for the realization of a Comprehensive Economic Partnership, including elements of a possible Free Trade Area to be completed as soon as possible within 10 years, and (2) to establish a Committee to consider and draft a framework for the realization of the Comprehensive Economic Partnership between Japan and ASEAN. In October 2003, the governments of Japan and of the ASEAN-10 signed a general framework for a bilateral free trade agreement. In November 2004, they agreed to initiate the negotiating process. The talks started in April
7
2005 and ended in November 2007, and the agreement came into force on 1 December 2008 (Ministry of Foreign Affairs of Japan, 2013). The Japan-ASEAN FTA is a comprehensive one, covering trade in goods, services, investments, rules of origin, dispute settlement, sanitary and phyto-sanitary regulations, technical barriers to trade, economic cooperation and, on Japan’s request, intellectual property rights. For groups in Southeast Asia, it is seen as formalizing ASEAN’s role as a regional manufacturing hub for Japanese corporations. It is now easier and cheaper for Japanese firms to move components of automobiles and electronics from one ASEAN country to another in a regional assembly line. 3. ASEAN +Korea The ASEAN-Korea FTA took effect on June 1, 2007 (ARIC, 2012). Due to concerns about agriculture, particularly the deal’s provisions on rice and livestock, Thailand negotiated separate arrangements with the Korean government to join the pact in early 2009. In November 2007, Korea and ASEAN signed the ASEAN-Korea FTA Trade in Services Agreement, which came into force in May 2009. Furthermore, in June 2009, Korea and ASEAN signed the ASEAN-Korea FTA Investment Agreement, which entered into force in September 2009. 2.5. Opportunities and Challenges of ASEAN 1. ASEAN There are both opportunities and challenges associated with the ambitious economic integration initiative among ASEAN nations. The deepening economic integration in ASEANthrough the implementation of AFTA in 1993 has generated trade flows among its members (Ariyasajjakornet al., 2009). However, intra-ASEAN trade is very low relative to that of other intra-regional trade blocs, namely, the European Union (EU) and the North American Free Trade Agreement (NAFTA) (Ozeki, 2008, p. 28). This indicates that there is still some room to boost intra-ASEAN trade, especially by strengthening the existing ASEAN production network and incorporating CLMV into such production network. Nonetheless, any policy to enhance intra-ASEAN trade should be carefully considered as it could generate trade diversion rather than having a trade creation effect. An empirical study by Hapsari and Mangunsung (2006) suggests that AFTA might be causing some trade diversion and shifting trade from countries outside the trade bloc to possibly less efficient countries inside the trade bloc. To go beyond AFTA, ASEAN leaders agreed to formthe ASEAN Economic Community (AEC) in 2015, which would improve the efficiency and competitiveness of ASEAN countries since this arrangement provides the benefit of scale economies and dynamic efficiency through the free movement of goods and services, investment, and skilled labor.While the diversity in ASEAN provides a great opportunity to exploit much comparative advantage, it is a great challenge as well. In particular, there is a large income gapbetween ASEAN-6 and CLMV. To address this issue, Menon (2012) suggests that there is a need to increase the pace and breadth of trade and investment policy reforms and to address labor mobility including skilled and non-skilled labor. Without such reforms, it is unlikely that CLMV would fully benefit from the formation of AEC. The rising economic integration in East Asia also brings about opportunities as well as challenges for ASEAN. Although ASEAN as a whole is large, it is still much smaller than the
8
combined market size of the three East Asian countries, namely, China, Japan, and the Republic of Korea. China andJapan are the world’s second and third largest economies, respectively, and theRepublic of Korea ranks among the world’s fifteen largest economies (Estrada et al., 2011, p. 3).Greater economic integration in East Asia would also include India, New Zealand, and Australia. The formation of ASEAN+6 FTA could generate the largest gains to East Asia among the plausible regional trade agreements (Kawai and Wignaraja, 2008).The ASEAN framework offers the possibility of pooling scarce capacity and resources in the region’s low-income economies, namely, Cambodia, Indonesia, Lao PDR, Philippines, and Vietnam. Nonetheless, the serious challenge facing individual ASEAN countries is the competition between domestic products and imported products from China. ASEAN will increasingly face intense competitive pressure from China, especially in labour-intensive products. 2. Laos Over the past 15 years, Laos seems to have gained from AFTA. First, as one of the least developed countries in ASEAN, Laos has weak institutional capacity, a lack of human and technical resources, and limited leverage to undertake FTA negotiations with the region’s larger economies. The countryhas relied on ASEAN for concluding FTAs with the region’s larger economies. Accessing the more than one billion people in China and increasing income per capita through an ASEAN-China FTA, for instance, is a great market opportunity for Laos. Second, reducing tariff rates to zero under AFTA can be an important step for Laos to prepare itself for WTO accession. Finally, further deepening of economic integration in ASEAN countries through AFTA and an AEC would enhance Laos’ trade competitiveness and attract more FDI inflows. The rising exports and FDI inflows coupled with other market reforms would constitute more rapid growth in Laos, and thereby reduce income differences between Laos and ASEAN-6 (Menon, 2012).Although the benefits of growth driven by trade and investment have gone disproportionately to the non-poor and inequality has increased, they can be a significant tool to fight poverty in Laos (Fane, 2006). However, there are many potential costs associated with joining AFTA and ASEAN-plus FTAs. The nascent industries in Laos would be severely affected. An evaluation of the impact of the ASEAN–China FTA on industries in Laos by Leebouapao et al. (2012) indicates that price competitiveness in three industries—namely, wood processing, cement, and motorcycle assembly—would fall substantially if tariffs are completely removed. Moreover, trade liberalization in ASEAN will stimulate the output of each country within the region according to their comparative advantage (Ariyasajjakorn et al., 2009). Given its small size and poor physical and human capital, Laos would seem to get fewer benefits compared to other member countries. In conclusion, the relationship between AFTA and economic development in Laos remains controversial among researchers. If trade liberalization and the ensuing increase in foreign trade do have merits in alleviating poverty as many contend, then what has happened in Laos during the past 15 years deserves a careful examination in the context of AFTA.
9
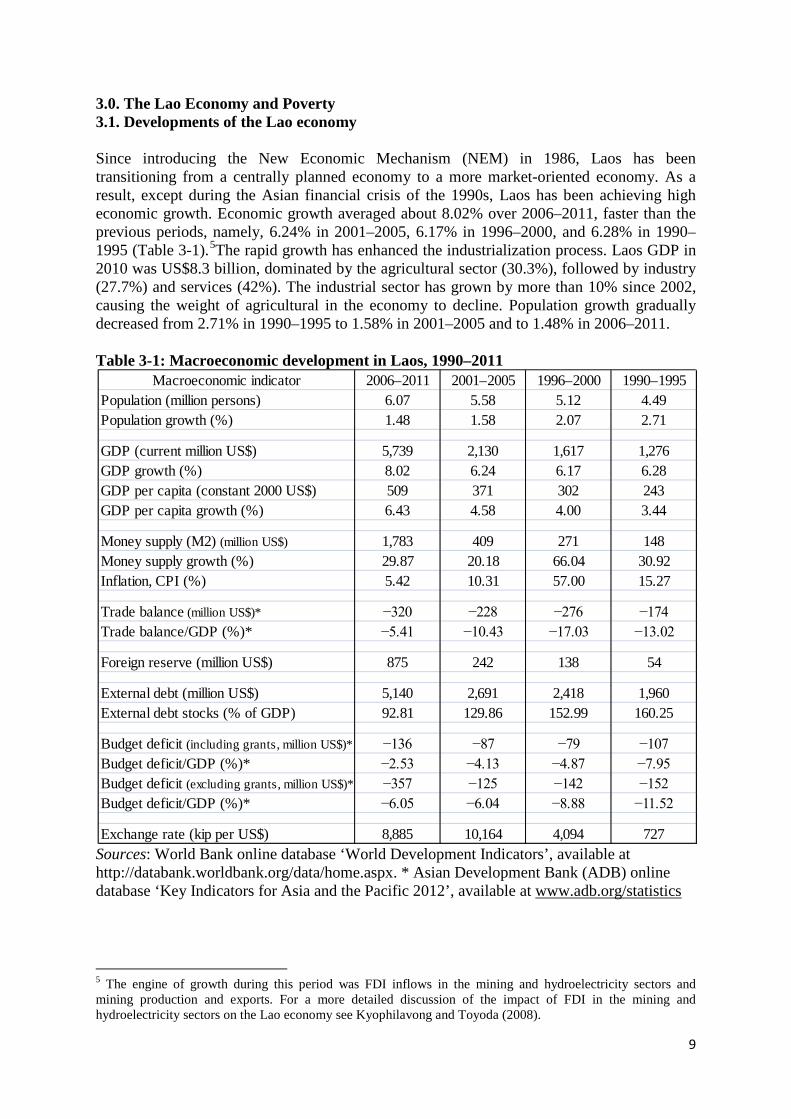
3.0. The Lao Economy and Poverty 3.1. Developments of the Lao economy Since introducing the New Economic Mechanism (NEM) in 1986, Laos has been transitioning from a centrally planned economy to a more market-oriented economy. As a result, except during the Asian financial crisis of the 1990s, Laos has been achieving high economic growth. Economic growth averaged about 8.02% over 2006–2011, faster than the previous periods, namely, 6.24% in 2001–2005, 6.17% in 1996–2000, and 6.28% in 1990–1995 (Table 3-1).5The rapid growth has enhanced the industrialization process. Laos GDP in 2010 was US$8.3 billion, dominated by the agricultural sector (30.3%), followed by industry (27.7%) and services (42%). The industrial sector has grown by more than 10% since 2002, causing the weight of agricultural in the economy to decline. Population growth gradually decreased from 2.71% in 1990–1995 to 1.58% in 2001–2005 and to 1.48% in 2006–2011. Table 3-1: Macroeconomic development in Laos, 1990–2011
Sources: World Bank online database ‘World Development Indicators’, available at http://databank.worldbank.org/data/home.aspx. * Asian Development Bank (ADB) online database ‘Key Indicators for Asia and the Pacific 2012’, available at www.adb.org/statistics
5 The engine of growth during this period was FDI inflows in the mining and hydroelectricity sectors and mining production and exports. For a more detailed discussion of the impact of FDI in the mining and hydroelectricity sectors on the Lao economy see Kyophilavong and Toyoda (2008).
Macroeconomic indicator 2006–2011 2001–2005 1996–2000 1990–1995Population (million persons) 6.07 5.58 5.12 4.49Population growth (%) 1.48 1.58 2.07 2.71
GDP (current million US$) 5,739 2,130 1,617 1,276GDP growth (%) 8.02 6.24 6.17 6.28GDP per capita (constant 2000 US$) 509 371 302 243GDP per capita growth (%) 6.43 4.58 4.00 3.44
Money supply (M2) (million US$) 1,783 409 271 148Money supply growth (%) 29.87 20.18 66.04 30.92Inflation, CPI (%) 5.42 10.31 57.00 15.27
Trade balance (million US$)* −320 −228 −276 −174Trade balance/GDP (%)* −5.41 −10.43 −17.03 −13.02
Foreign reserve (million US$) 875 242 138 54
External debt (million US$) 5,140 2,691 2,418 1,960External debt stocks (% of GDP) 92.81 129.86 152.99 160.25
Budget deficit (including grants, million US$)* −136 −87 −79 −107Budget deficit/GDP (%)* −2.53 −4.13 −4.87 −7.95Budget deficit (excluding grants, million US$)* −357 −125 −142 −152Budget deficit/GDP (%)* −6.05 −6.04 −8.88 −11.52
Exchange rate (kip per US$) 8,885 10,164 4,094 727
10
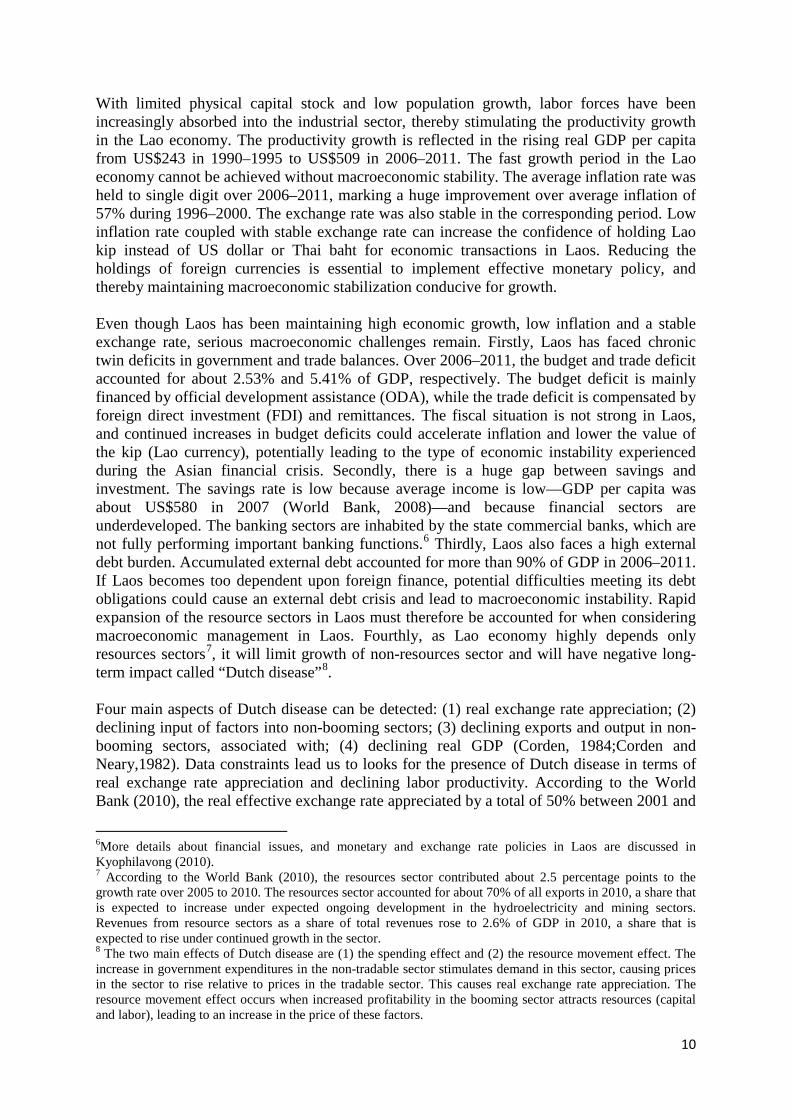
With limited physical capital stock and low population growth, labor forces have been increasingly absorbed into the industrial sector, thereby stimulating the productivity growth in the Lao economy. The productivity growth is reflected in the rising real GDP per capita from US$243 in 1990–1995 to US$509 in 2006–2011. The fast growth period in the Lao economy cannot be achieved without macroeconomic stability. The average inflation rate was held to single digit over 2006–2011, marking a huge improvement over average inflation of 57% during 1996–2000. The exchange rate was also stable in the corresponding period. Low inflation rate coupled with stable exchange rate can increase the confidence of holding Lao kip instead of US dollar or Thai baht for economic transactions in Laos. Reducing the holdings of foreign currencies is essential to implement effective monetary policy, and thereby maintaining macroeconomic stabilization conducive for growth. Even though Laos has been maintaining high economic growth, low inflation and a stable exchange rate, serious macroeconomic challenges remain. Firstly, Laos has faced chronic twin deficits in government and trade balances. Over 2006–2011, the budget and trade deficit accounted for about 2.53% and 5.41% of GDP, respectively. The budget deficit is mainly financed by official development assistance (ODA), while the trade deficit is compensated by foreign direct investment (FDI) and remittances. The fiscal situation is not strong in Laos, and continued increases in budget deficits could accelerate inflation and lower the value of the kip (Lao currency), potentially leading to the type of economic instability experienced during the Asian financial crisis. Secondly, there is a huge gap between savings and investment. The savings rate is low because average income is low—GDP per capita was about US$580 in 2007 (World Bank, 2008)—and because financial sectors are underdeveloped. The banking sectors are inhabited by the state commercial banks, which are not fully performing important banking functions.6 Thirdly, Laos also faces a high external debt burden. Accumulated external debt accounted for more than 90% of GDP in 2006–2011. If Laos becomes too dependent upon foreign finance, potential difficulties meeting its debt obligations could cause an external debt crisis and lead to macroeconomic instability. Rapid expansion of the resource sectors in Laos must therefore be accounted for when considering macroeconomic management in Laos. Fourthly, as Lao economy highly depends only resources sectors7, it will limit growth of non-resources sector and will have negative long-term impact called “Dutch disease”8. Four main aspects of Dutch disease can be detected: (1) real exchange rate appreciation; (2) declining input of factors into non-booming sectors; (3) declining exports and output in non-booming sectors, associated with; (4) declining real GDP (Corden, 1984;Corden and Neary,1982). Data constraints lead us to looks for the presence of Dutch disease in terms of real exchange rate appreciation and declining labor productivity. According to the World Bank (2010), the real effective exchange rate appreciated by a total of 50% between 2001 and
6More details about financial issues, and monetary and exchange rate policies in Laos are discussed in Kyophilavong (2010). 7 According to the World Bank (2010), the resources sector contributed about 2.5 percentage points to the growth rate over 2005 to 2010. The resources sector accounted for about 70% of all exports in 2010, a share that is expected to increase under expected ongoing development in the hydroelectricity and mining sectors. Revenues from resource sectors as a share of total revenues rose to 2.6% of GDP in 2010, a share that is expected to rise under continued growth in the sector. 8 The two main effects of Dutch disease are (1) the spending effect and (2) the resource movement effect. The increase in government expenditures in the non-tradable sector stimulates demand in this sector, causing prices in the sector to rise relative to prices in the tradable sector. This causes real exchange rate appreciation. The resource movement effect occurs when increased profitability in the booming sector attracts resources (capital and labor), leading to an increase in the price of these factors.
11
2009.9Labor productivity in Laos was stagnant between 2005 and 2006 relative to other countries in the same income group (World Bank, 2010). Manufacturing exporters are less profitable than non-exports because exporters face elastic world demand and have more difficulty adjusting to higher labor and trade costs. Real wages have been growing in both the private and public sectors in recent years. In this sense, the natural resources boom can be said to have negatively impacted labor productivity, especially among manufacturing exporters. The symptoms of Dutch disease will become much more prominent as revenues from the resource sector increase over the medium run. Given the potential setback of resource-based growth strategy in Laos, policies to enhance international trade and promote FDI inflows seem a clear means to boost the domestic production and integrate the country into the regional and global economy, and thereby remove Laos from of the list of less developed country. It is not enough that Laos opens its markets for foreign investors. What is more critical is to keep them in the country particularly if the intention is to attract export oriented foreign investment. Building the necessary infrastructure support for investment is still crucial. This involves credible efforts to provide an operating environment conducive for transnational operations and reduce high transaction costs associated with inefficiencies in infrastructure. In this regard, launching initiatives on public-private partnerships for infrastructure in Laos is encouraging. That is, the collaboration between public and private sectors with clear agreement on shared objectives for delivery of public infrastructure can serve as the key engine of facilitating trade and investment. By doing so, Laos will be able to enhance not only the competitiveness of domestic firms, but also to attract FDI seeking for the production base. As trade costs become lower, the small country size is no longer the FDI constraint because affiliate production by multinationals could be exported to foreign countries, especially ASEAN countries. Finally, it is widely recognized that the multinationals are physical capital and skilled labour intensive. This suggests that Laos needs to pursue the reform on legal environment relating to FDI and to invest more on human resource development. Further improvements in the legal environment can potentially make Laos a more attractive foreign investment destination. In particular, the Lao government should provide a long-term and consistent policy environment for foreign investors. That is, the favourable environment must be absolutely free from frequent changes. Formulating a single legal framework for regulating all forms of investments and removing discriminatory treatment could provide favourable business climate to prospective investors. Regarding the human capital development, training and re-training of the labour force should continue to be high on the agenda. A number of skilled workers must be trained with well qualified instructors coupled with modern training facilities, which might be done through the co-operation with domestic and foreign expertise. Therefore, improving legal environment and developing human resources are extremely important to reap the full benefits from inward FDI and pave the way for future industrialization of the country.
9 It is important to note that the recent exchange rate appreciation may have arisen from other factors such as a weak US dollar, a government policy of de-dollarization, increased growth and improved term of trade.
12
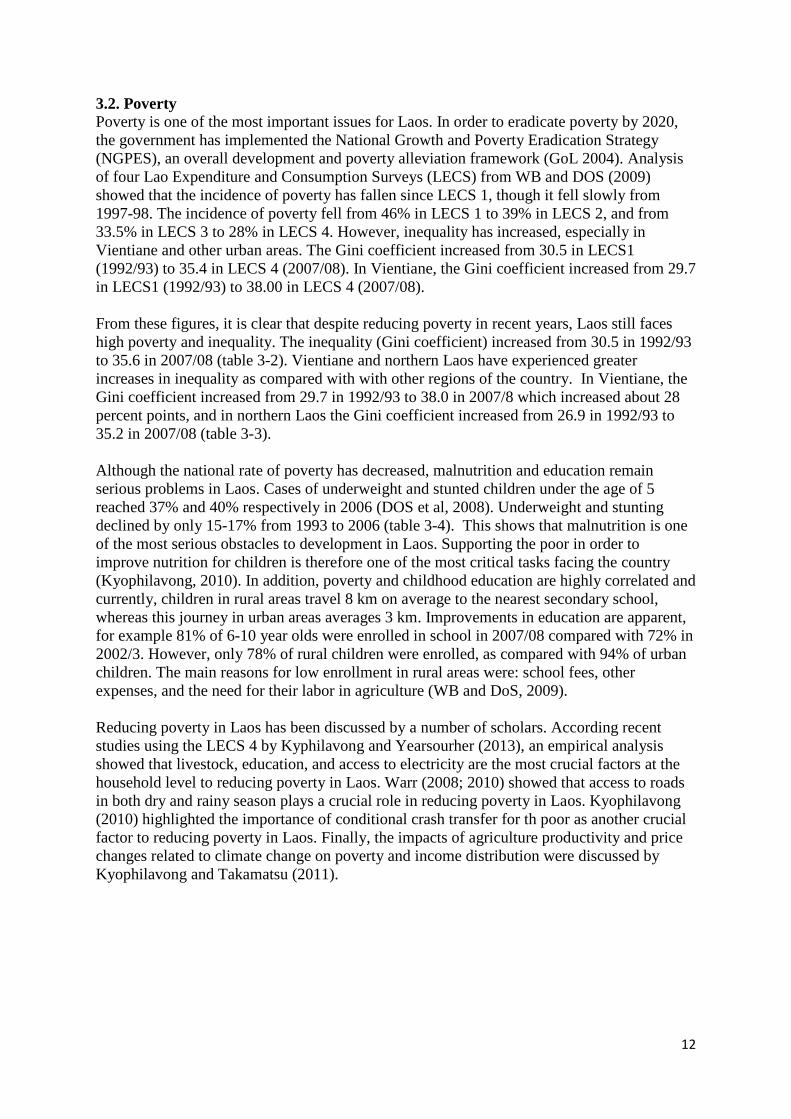
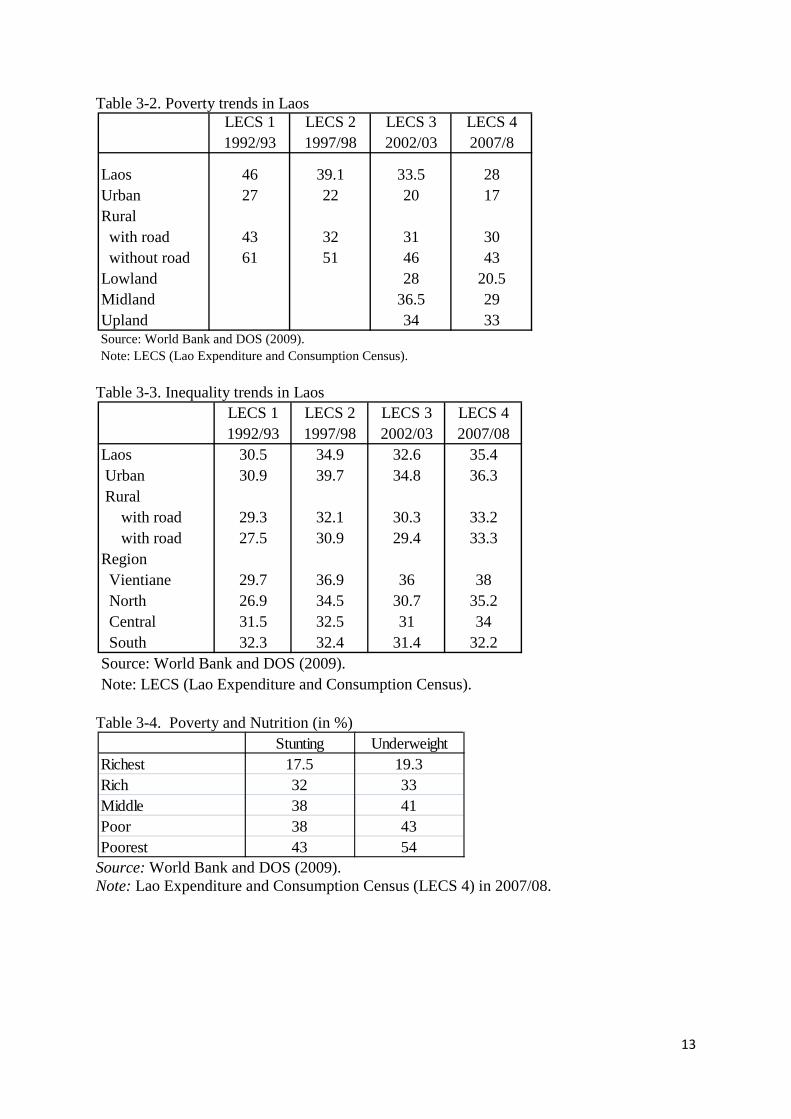
3.2. Poverty Poverty is one of the most important issues for Laos. In order to eradicate poverty by 2020, the government has implemented the National Growth and Poverty Eradication Strategy (NGPES), an overall development and poverty alleviation framework (GoL 2004). Analysis of four Lao Expenditure and Consumption Surveys (LECS) from WB and DOS (2009) showed that the incidence of poverty has fallen since LECS 1, though it fell slowly from 1997-98. The incidence of poverty fell from 46% in LECS 1 to 39% in LECS 2, and from 33.5% in LECS 3 to 28% in LECS 4. However, inequality has increased, especially in Vientiane and other urban areas. The Gini coefficient increased from 30.5 in LECS1 (1992/93) to 35.4 in LECS 4 (2007/08). In Vientiane, the Gini coefficient increased from 29.7 in LECS1 (1992/93) to 38.00 in LECS 4 (2007/08). From these figures, it is clear that despite reducing poverty in recent years, Laos still faces high poverty and inequality. The inequality (Gini coefficient) increased from 30.5 in 1992/93 to 35.6 in 2007/08 (table 3-2). Vientiane and northern Laos have experienced greater increases in inequality as compared with with other regions of the country. In Vientiane, the Gini coefficient increased from 29.7 in 1992/93 to 38.0 in 2007/8 which increased about 28 percent points, and in northern Laos the Gini coefficient increased from 26.9 in 1992/93 to 35.2 in 2007/08 (table 3-3). Although the national rate of poverty has decreased, malnutrition and education remain serious problems in Laos. Cases of underweight and stunted children under the age of 5 reached 37% and 40% respectively in 2006 (DOS et al, 2008). Underweight and stunting declined by only 15-17% from 1993 to 2006 (table 3-4). This shows that malnutrition is one of the most serious obstacles to development in Laos. Supporting the poor in order to improve nutrition for children is therefore one of the most critical tasks facing the country (Kyophilavong, 2010). In addition, poverty and childhood education are highly correlated and currently, children in rural areas travel 8 km on average to the nearest secondary school, whereas this journey in urban areas averages 3 km. Improvements in education are apparent, for example 81% of 6-10 year olds were enrolled in school in 2007/08 compared with 72% in 2002/3. However, only 78% of rural children were enrolled, as compared with 94% of urban children. The main reasons for low enrollment in rural areas were: school fees, other expenses, and the need for their labor in agriculture (WB and DoS, 2009). Reducing poverty in Laos has been discussed by a number of scholars. According recent studies using the LECS 4 by Kyphilavong and Yearsourher (2013), an empirical analysis showed that livestock, education, and access to electricity are the most crucial factors at the household level to reducing poverty in Laos. Warr (2008; 2010) showed that access to roads in both dry and rainy season plays a crucial role in reducing poverty in Laos. Kyophilavong (2010) highlighted the importance of conditional crash transfer for th poor as another crucial factor to reducing poverty in Laos. Finally, the impacts of agriculture productivity and price changes related to climate change on poverty and income distribution were discussed by Kyophilavong and Takamatsu (2011).
13
Table 3-2. Poverty trends in Laos
Table 3-3. Inequality trends in Laos
Table 3-4. Poverty and Nutrition (in %)
Source: World Bank and DOS (2009). Note: Lao Expenditure and Consumption Census (LECS 4) in 2007/08.
LECS 1 LECS 2 LECS 3 LECS 41992/93 1997/98 2002/03 2007/8
Laos 46 39.1 33.5 28Urban 27 22 20 17Rural with road 43 32 31 30 without road 61 51 46 43Lowland 28 20.5Midland 36.5 29Upland 34 33Source: World Bank and DOS (2009).Note: LECS (Lao Expenditure and Consumption Census).
LECS 1 LECS 2 LECS 3 LECS 41992/93 1997/98 2002/03 2007/08
Laos 30.5 34.9 32.6 35.4 Urban 30.9 39.7 34.8 36.3 Rural with road 29.3 32.1 30.3 33.2 with road 27.5 30.9 29.4 33.3Region Vientiane 29.7 36.9 36 38 North 26.9 34.5 30.7 35.2 Central 31.5 32.5 31 34 South 32.3 32.4 31.4 32.2Source: World Bank and DOS (2009).Note: LECS (Lao Expenditure and Consumption Census).
Stunting UnderweightRichest 17.5 19.3Rich 32 33Middle 38 41Poor 38 43Poorest 43 54
14
4.0. TRADE POLICY AND CHARACTERISTICS OF LAO TRADE 4. 1. Trade Policy in Laos Since trade policies are the core of the overall development strategy, their formulation and implementation generally synchronize with the stages of economic development in Laos. Evolution of the Lao economy and trade can roughly be divided into two phases: centrally-planned economy and trade control (1975–1985); and market-oriented economy and export promotion (1986–present) (Suvannaphakdy, 2013). Prior to 1986, the Lao government had controlled over foreign trade (Otani and Pham, 1996, p. 11). A battery of interventions, including foreign exchange controls, protective tariffs, and import restrictions, were employed to save foreign exchange. Both exports and imports were monopolized by the state, except trade made by joint public and private companies or a few state enterprises. Along with measures like deficit financing and selective credit allocation, these policies had significant impacts on Laos’ early economic development. However, as is usually the case, the state control of foreign trade had become increasingly complex and inefficient as the allocation of foreign exchange had to comply with the provisions of various bilateral trade and foreign assistance arrangements, leaving little room for flexibility. However, the external trade system was liberalized in 1987 following the major economic reform in 1986, resulting in the elimination of most of these restrictions on trade in 1988. To promote exports, two types of export promotion policies were implemented. The first type aimed at removing or neutralizing distortions resulting from protectionist policies enacted during the centrally-planned economic system. It included, inter alia, liberalization of the foreign exchange allocation system, substitution of tariff for nontariff protection, and rebates of import duties. The other type involved the provision of new incentives for exports, to which the establishment of export processing zones and tax incentives for exports belong. Together with the continued domestic liberalization, Laos has been integrating into the regional and global economy. Laos joined ASEAN in 1997 for geopolitical and economic development reasons and has gradually integrated into ASEAN over time. The agreement on the Common Effective Preferential Tariff (CEPT) scheme for ASEAN Free Trade Area (AFTA) required Laos to eliminate all of its import duties by 2015. By implementing the CEPT scheme for AFTA, ASEAN members have made significant progress in lowering intra-regional tariffs. However, the actual utilization by traders of AFTA preferential tariff rates is still limited as it accounts for only 5% of total trade (Manchin and Pelkmans-Balaoing, 2007, p.13). Nonetheless, participating in AFTA has significant impact on Laos’ trading patterns and trading volume (NSC and UNDP, 2006, p. 21). In addition, Laos plans to join the World Trade Organization in 2013 which can provide larger export market for Laos. The potential trade-increasing effects of allowing international trade expansion in Laos will provide a number of new opportunities and challenges. The opportunities include the access of a larger variety of intermediate products and capital equipment by many rural people, which enhances the productivity of their own resources; and the stimulation of cross-border learning of production methods, product design, organization methods, and market conditions. Unfortunately, not all of the effects of increases in trade would necessarily be positive. At present, Laos could gain limited benefit from AFTA as the country is characterized by small and medium size enterprises (SMEs) producing low value-added products. Therefore, integrating Laos’ SMEs into the regional production network is becoming a major challenge for reaping the full benefit from AFTA. Furthermore, since
15
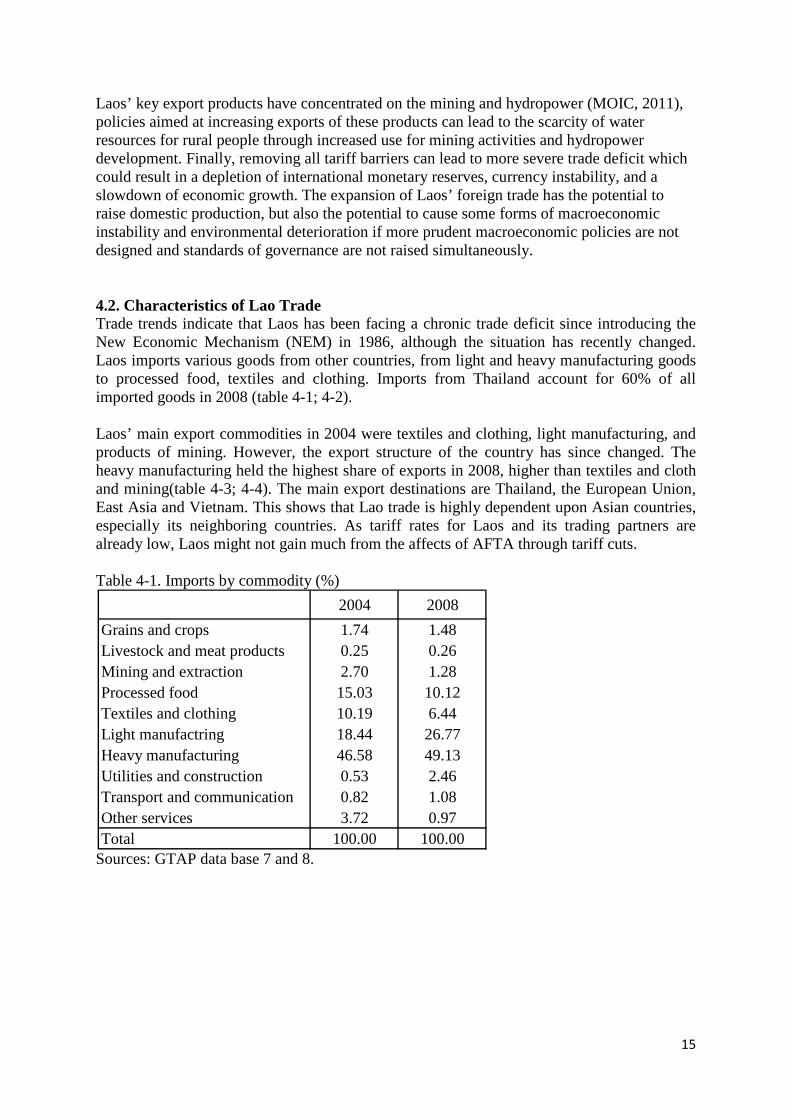
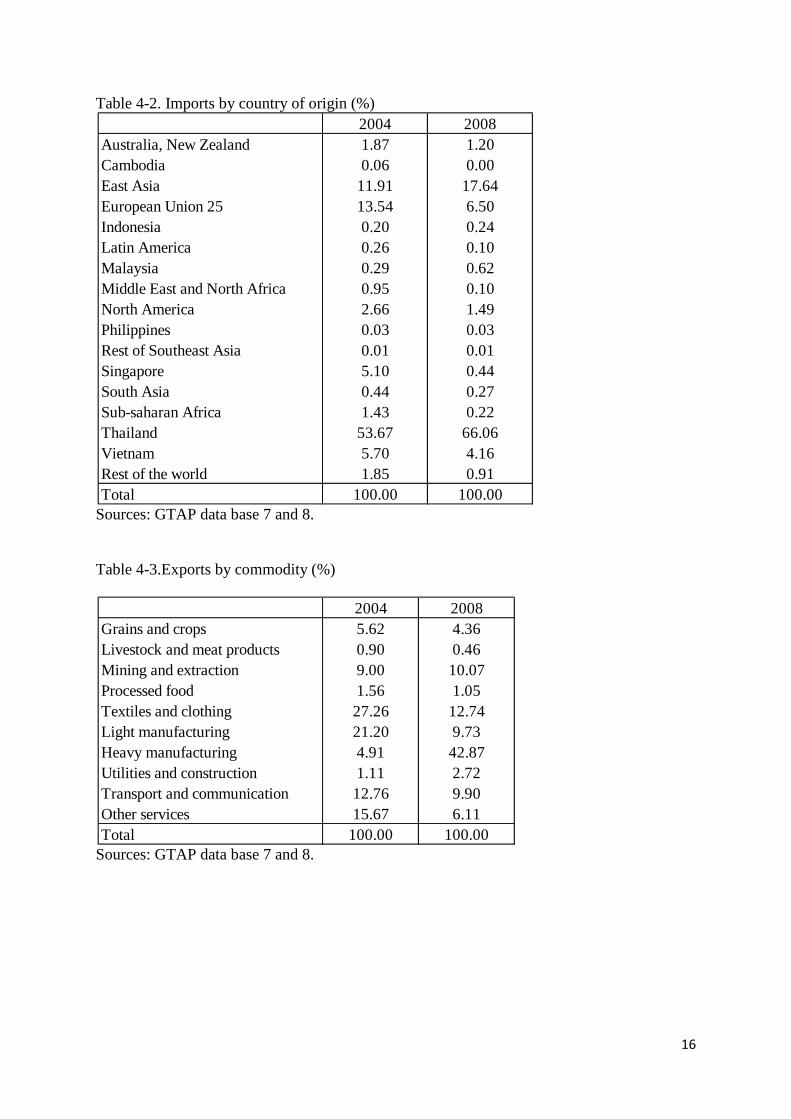
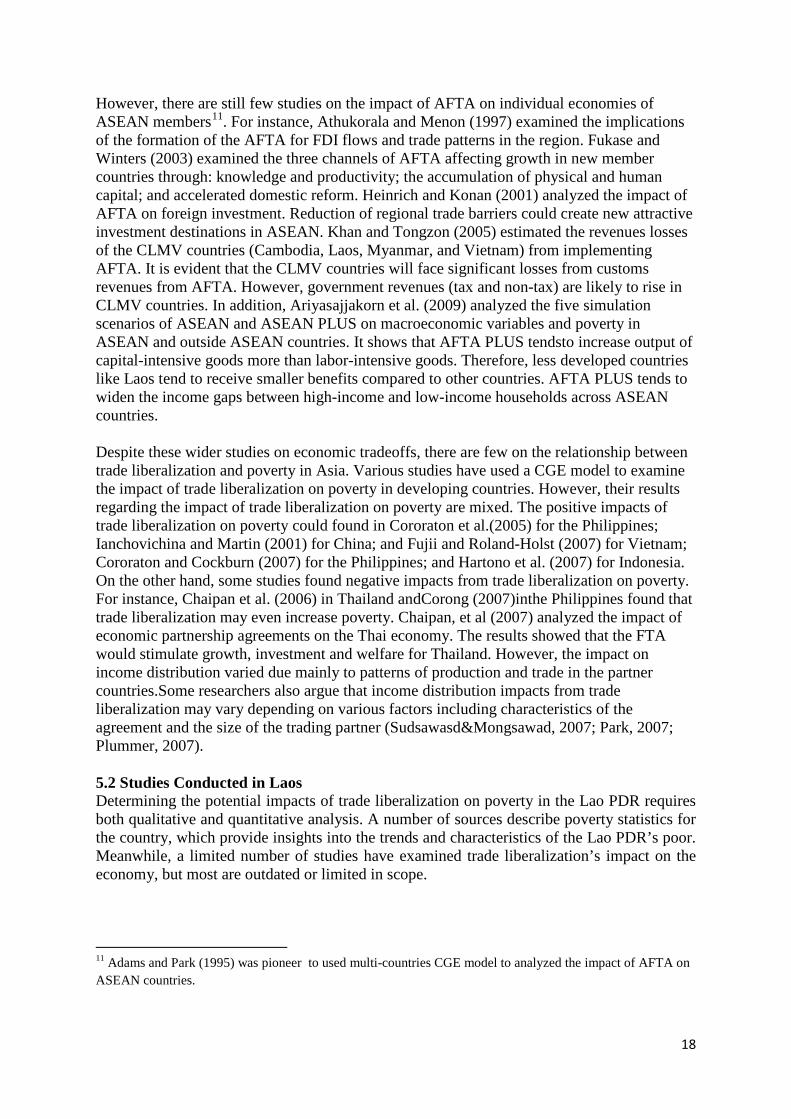
Laos’ key export products have concentrated on the mining and hydropower (MOIC, 2011), policies aimed at increasing exports of these products can lead to the scarcity of water resources for rural people through increased use for mining activities and hydropower development. Finally, removing all tariff barriers can lead to more severe trade deficit which could result in a depletion of international monetary reserves, currency instability, and a slowdown of economic growth. The expansion of Laos’ foreign trade has the potential to raise domestic production, but also the potential to cause some forms of macroeconomic instability and environmental deterioration if more prudent macroeconomic policies are not designed and standards of governance are not raised simultaneously. 4.2. Characteristics of Lao Trade Trade trends indicate that Laos has been facing a chronic trade deficit since introducing the New Economic Mechanism (NEM) in 1986, although the situation has recently changed. Laos imports various goods from other countries, from light and heavy manufacturing goods to processed food, textiles and clothing. Imports from Thailand account for 60% of all imported goods in 2008 (table 4-1; 4-2). Laos’ main export commodities in 2004 were textiles and clothing, light manufacturing, and products of mining. However, the export structure of the country has since changed. The heavy manufacturing held the highest share of exports in 2008, higher than textiles and cloth and mining(table 4-3; 4-4). The main export destinations are Thailand, the European Union, East Asia and Vietnam. This shows that Lao trade is highly dependent upon Asian countries, especially its neighboring countries. As tariff rates for Laos and its trading partners are already low, Laos might not gain much from the affects of AFTA through tariff cuts. Table 4-1. Imports by commodity (%)
Sources: GTAP data base 7 and 8.
2004 2008Grains and crops 1.74 1.48Livestock and meat products 0.25 0.26Mining and extraction 2.70 1.28Processed food 15.03 10.12Textiles and clothing 10.19 6.44Light manufactring 18.44 26.77Heavy manufacturing 46.58 49.13Utilities and construction 0.53 2.46Transport and communication 0.82 1.08Other services 3.72 0.97Total 100.00 100.00
16
Table 4-2. Imports by country of origin (%)
Sources: GTAP data base 7 and 8. Table 4-3.Exports by commodity (%)
Sources: GTAP data base 7 and 8.
2004 2008Australia, New Zealand 1.87 1.20Cambodia 0.06 0.00East Asia 11.91 17.64European Union 25 13.54 6.50Indonesia 0.20 0.24Latin America 0.26 0.10Malaysia 0.29 0.62Middle East and North Africa 0.95 0.10North America 2.66 1.49Philippines 0.03 0.03Rest of Southeast Asia 0.01 0.01Singapore 5.10 0.44South Asia 0.44 0.27Sub-saharan Africa 1.43 0.22Thailand 53.67 66.06Vietnam 5.70 4.16Rest of the world 1.85 0.91Total 100.00 100.00
2004 2008Grains and crops 5.62 4.36Livestock and meat products 0.90 0.46Mining and extraction 9.00 10.07Processed food 1.56 1.05Textiles and clothing 27.26 12.74Light manufacturing 21.20 9.73Heavy manufacturing 4.91 42.87Utilities and construction 1.11 2.72Transport and communication 12.76 9.90Other services 15.67 6.11Total 100.00 100.00
17
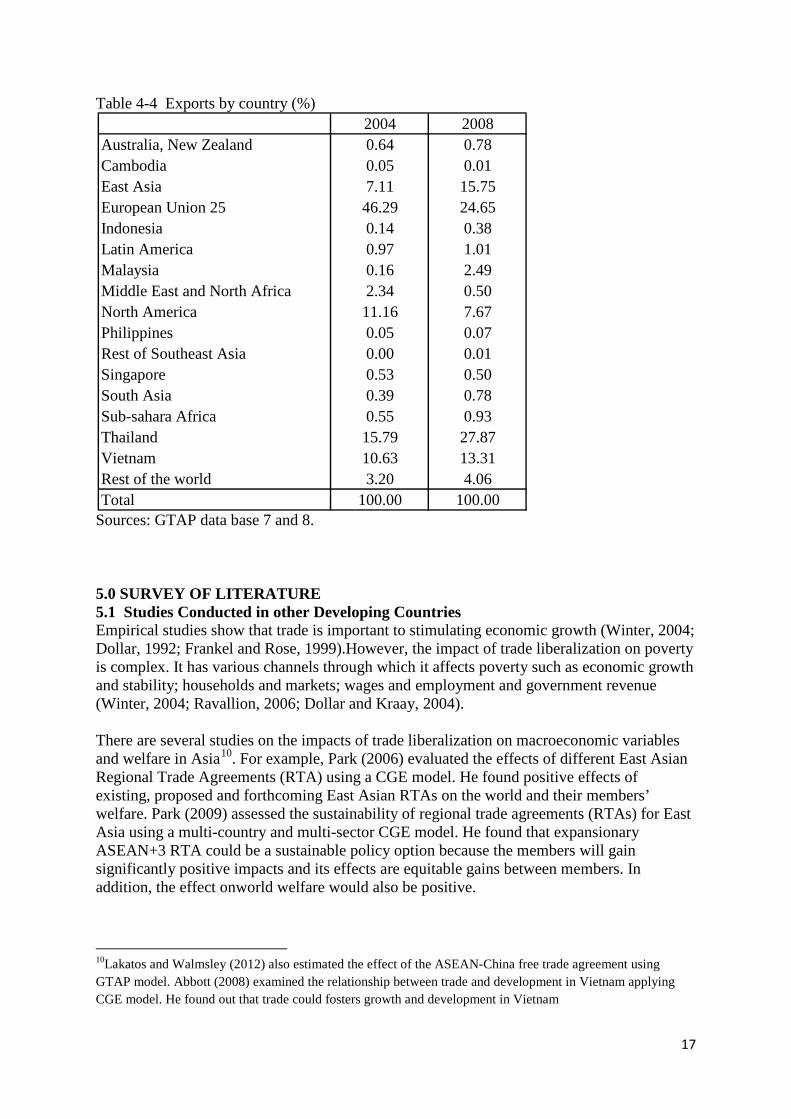
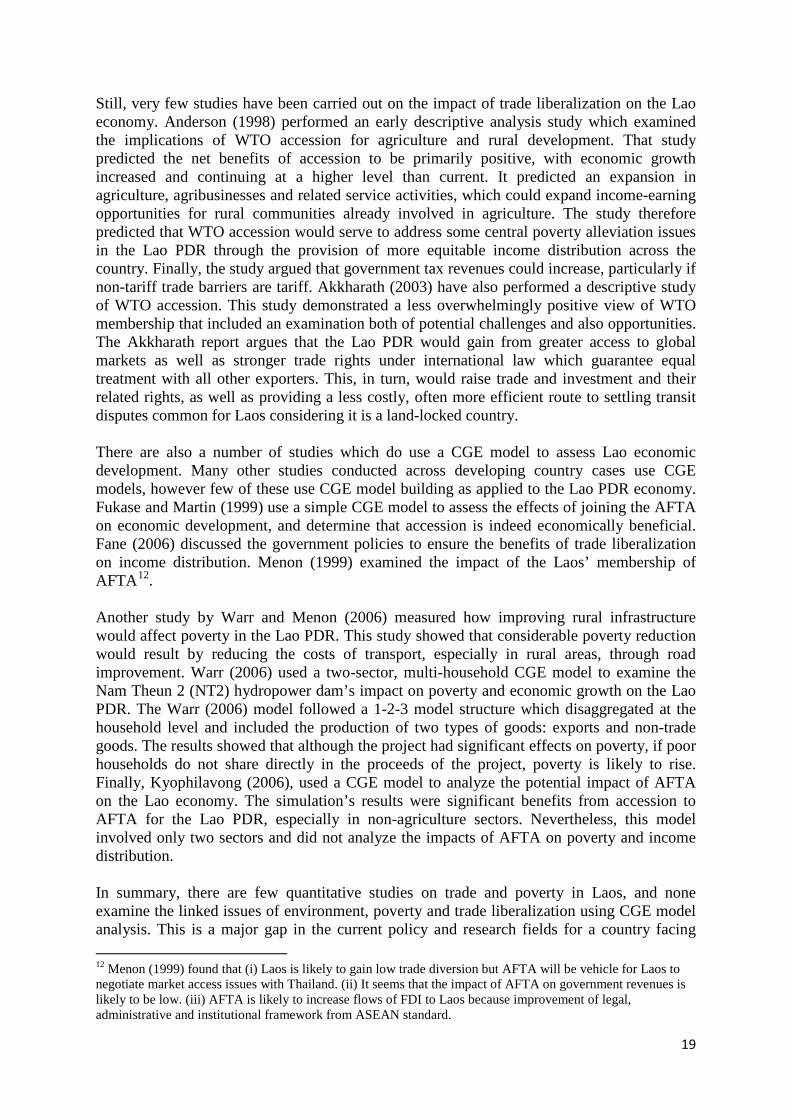
Table 4-4 Exports by country (%)
Sources: GTAP data base 7 and 8. 5.0 SURVEY OF LITERATURE 5.1 Studies Conducted in other Developing Countries Empirical studies show that trade is important to stimulating economic growth (Winter, 2004; Dollar, 1992; Frankel and Rose, 1999).However, the impact of trade liberalization on poverty is complex. It has various channels through which it affects poverty such as economic growth and stability; households and markets; wages and employment and government revenue (Winter, 2004; Ravallion, 2006; Dollar and Kraay, 2004). There are several studies on the impacts of trade liberalization on macroeconomic variables and welfare in Asia10. For example, Park (2006) evaluated the effects of different East Asian Regional Trade Agreements (RTA) using a CGE model. He found positive effects of existing, proposed and forthcoming East Asian RTAs on the world and their members’ welfare. Park (2009) assessed the sustainability of regional trade agreements (RTAs) for East Asia using a multi-country and multi-sector CGE model. He found that expansionary ASEAN+3 RTA could be a sustainable policy option because the members will gain significantly positive impacts and its effects are equitable gains between members. In addition, the effect onworld welfare would also be positive.
10Lakatos and Walmsley (2012) also estimated the effect of the ASEAN-China free trade agreement using GTAP model. Abbott (2008) examined the relationship between trade and development in Vietnam applying CGE model. He found out that trade could fosters growth and development in Vietnam
2004 2008Australia, New Zealand 0.64 0.78Cambodia 0.05 0.01East Asia 7.11 15.75European Union 25 46.29 24.65Indonesia 0.14 0.38Latin America 0.97 1.01Malaysia 0.16 2.49Middle East and North Africa 2.34 0.50North America 11.16 7.67Philippines 0.05 0.07Rest of Southeast Asia 0.00 0.01Singapore 0.53 0.50South Asia 0.39 0.78Sub-sahara Africa 0.55 0.93Thailand 15.79 27.87Vietnam 10.63 13.31Rest of the world 3.20 4.06Total 100.00 100.00
18
However, there are still few studies on the impact of AFTA on individual economies of ASEAN members11. For instance, Athukorala and Menon (1997) examined the implications of the formation of the AFTA for FDI flows and trade patterns in the region. Fukase and Winters (2003) examined the three channels of AFTA affecting growth in new member countries through: knowledge and productivity; the accumulation of physical and human capital; and accelerated domestic reform. Heinrich and Konan (2001) analyzed the impact of AFTA on foreign investment. Reduction of regional trade barriers could create new attractive investment destinations in ASEAN. Khan and Tongzon (2005) estimated the revenues losses of the CLMV countries (Cambodia, Laos, Myanmar, and Vietnam) from implementing AFTA. It is evident that the CLMV countries will face significant losses from customs revenues from AFTA. However, government revenues (tax and non-tax) are likely to rise in CLMV countries. In addition, Ariyasajjakorn et al. (2009) analyzed the five simulation scenarios of ASEAN and ASEAN PLUS on macroeconomic variables and poverty in ASEAN and outside ASEAN countries. It shows that AFTA PLUS tendsto increase output of capital-intensive goods more than labor-intensive goods. Therefore, less developed countries like Laos tend to receive smaller benefits compared to other countries. AFTA PLUS tends to widen the income gaps between high-income and low-income households across ASEAN countries. Despite these wider studies on economic tradeoffs, there are few on the relationship between trade liberalization and poverty in Asia. Various studies have used a CGE model to examine the impact of trade liberalization on poverty in developing countries. However, their results regarding the impact of trade liberalization on poverty are mixed. The positive impacts of trade liberalization on poverty could found in Cororaton et al.(2005) for the Philippines; Ianchovichina and Martin (2001) for China; and Fujii and Roland-Holst (2007) for Vietnam; Cororaton and Cockburn (2007) for the Philippines; and Hartono et al. (2007) for Indonesia. On the other hand, some studies found negative impacts from trade liberalization on poverty. For instance, Chaipan et al. (2006) in Thailand andCorong (2007)inthe Philippines found that trade liberalization may even increase poverty. Chaipan, et al (2007) analyzed the impact of economic partnership agreements on the Thai economy. The results showed that the FTA would stimulate growth, investment and welfare for Thailand. However, the impact on income distribution varied due mainly to patterns of production and trade in the partner countries.Some researchers also argue that income distribution impacts from trade liberalization may vary depending on various factors including characteristics of the agreement and the size of the trading partner (Sudsawasd&Mongsawad, 2007; Park, 2007; Plummer, 2007). 5.2 Studies Conducted in Laos Determining the potential impacts of trade liberalization on poverty in the Lao PDR requires both qualitative and quantitative analysis. A number of sources describe poverty statistics for the country, which provide insights into the trends and characteristics of the Lao PDR’s poor. Meanwhile, a limited number of studies have examined trade liberalization’s impact on the economy, but most are outdated or limited in scope.
11 Adams and Park (1995) was pioneer to used multi-countries CGE model to analyzed the impact of AFTA on ASEAN countries.
19
Still, very few studies have been carried out on the impact of trade liberalization on the Lao economy. Anderson (1998) performed an early descriptive analysis study which examined the implications of WTO accession for agriculture and rural development. That study predicted the net benefits of accession to be primarily positive, with economic growth increased and continuing at a higher level than current. It predicted an expansion in agriculture, agribusinesses and related service activities, which could expand income-earning opportunities for rural communities already involved in agriculture. The study therefore predicted that WTO accession would serve to address some central poverty alleviation issues in the Lao PDR through the provision of more equitable income distribution across the country. Finally, the study argued that government tax revenues could increase, particularly if non-tariff trade barriers are tariff. Akkharath (2003) have also performed a descriptive study of WTO accession. This study demonstrated a less overwhelmingly positive view of WTO membership that included an examination both of potential challenges and also opportunities. The Akkharath report argues that the Lao PDR would gain from greater access to global markets as well as stronger trade rights under international law which guarantee equal treatment with all other exporters. This, in turn, would raise trade and investment and their related rights, as well as providing a less costly, often more efficient route to settling transit disputes common for Laos considering it is a land-locked country. There are also a number of studies which do use a CGE model to assess Lao economic development. Many other studies conducted across developing country cases use CGE models, however few of these use CGE model building as applied to the Lao PDR economy. Fukase and Martin (1999) use a simple CGE model to assess the effects of joining the AFTA on economic development, and determine that accession is indeed economically beneficial. Fane (2006) discussed the government policies to ensure the benefits of trade liberalization on income distribution. Menon (1999) examined the impact of the Laos’ membership of AFTA12. Another study by Warr and Menon (2006) measured how improving rural infrastructure would affect poverty in the Lao PDR. This study showed that considerable poverty reduction would result by reducing the costs of transport, especially in rural areas, through road improvement. Warr (2006) used a two-sector, multi-household CGE model to examine the Nam Theun 2 (NT2) hydropower dam’s impact on poverty and economic growth on the Lao PDR. The Warr (2006) model followed a 1-2-3 model structure which disaggregated at the household level and included the production of two types of goods: exports and non-trade goods. The results showed that although the project had significant effects on poverty, if poor households do not share directly in the proceeds of the project, poverty is likely to rise. Finally, Kyophilavong (2006), used a CGE model to analyze the potential impact of AFTA on the Lao economy. The simulation’s results were significant benefits from accession to AFTA for the Lao PDR, especially in non-agriculture sectors. Nevertheless, this model involved only two sectors and did not analyze the impacts of AFTA on poverty and income distribution. In summary, there are few quantitative studies on trade and poverty in Laos, and none examine the linked issues of environment, poverty and trade liberalization using CGE model analysis. This is a major gap in the current policy and research fields for a country facing 12 Menon (1999) found that (i) Laos is likely to gain low trade diversion but AFTA will be vehicle for Laos to negotiate market access issues with Thailand. (ii) It seems that the impact of AFTA on government revenues is likely to be low. (iii) AFTA is likely to increase flows of FDI to Laos because improvement of legal, administrative and institutional framework from ASEAN standard.
20
great obstacles to development and recently joining the WTO. However, the newest version of the GTAP 7 database includes an input-output table for the Lao PDR which might provide a significant contribution to empirical studies of international trade (Narayann and Walsmsley, 2008).
21
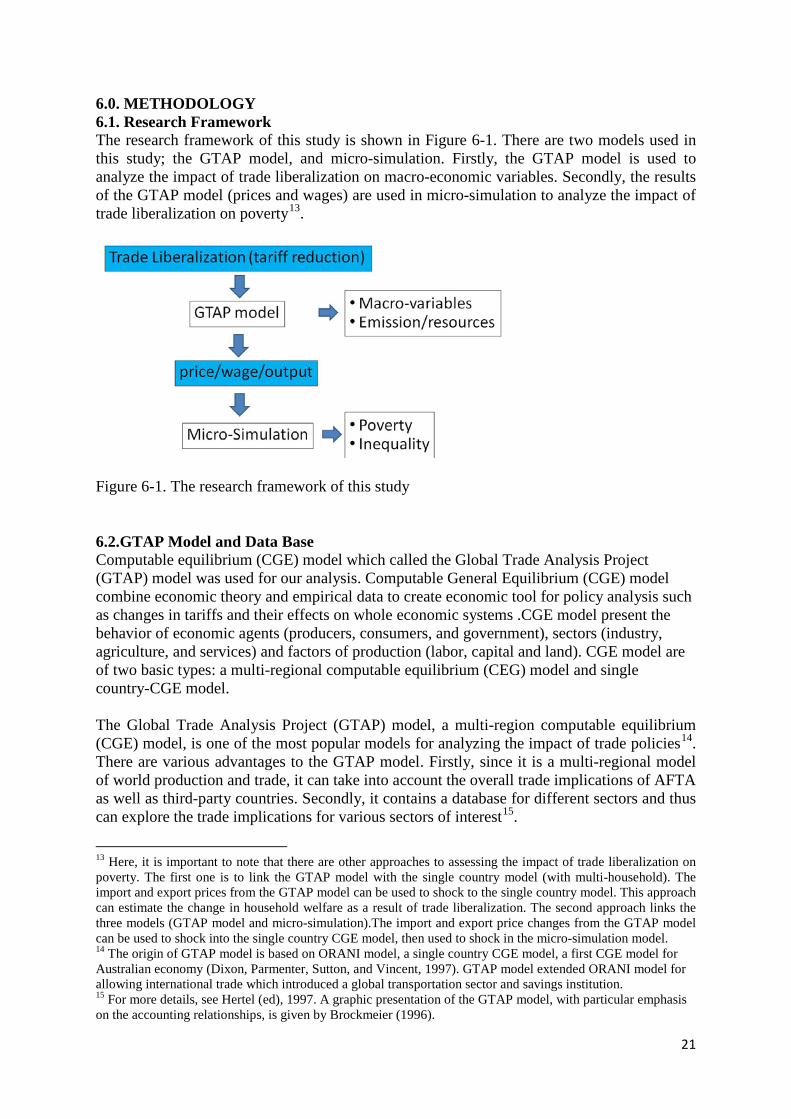
6.0. METHODOLOGY 6.1. Research Framework The research framework of this study is shown in Figure 6-1. There are two models used in this study; the GTAP model, and micro-simulation. Firstly, the GTAP model is used to analyze the impact of trade liberalization on macro-economic variables. Secondly, the results of the GTAP model (prices and wages) are used in micro-simulation to analyze the impact of trade liberalization on poverty13.
Figure 6-1. The research framework of this study 6.2.GTAP Model and Data Base Computable equilibrium (CGE) model which called the Global Trade Analysis Project (GTAP) model was used for our analysis. Computable General Equilibrium (CGE) model combine economic theory and empirical data to create economic tool for policy analysis such as changes in tariffs and their effects on whole economic systems .CGE model present the behavior of economic agents (producers, consumers, and government), sectors (industry, agriculture, and services) and factors of production (labor, capital and land). CGE model are of two basic types: a multi-regional computable equilibrium (CEG) model and single country-CGE model. The Global Trade Analysis Project (GTAP) model, a multi-region computable equilibrium (CGE) model, is one of the most popular models for analyzing the impact of trade policies14. There are various advantages to the GTAP model. Firstly, since it is a multi-regional model of world production and trade, it can take into account the overall trade implications of AFTA as well as third-party countries. Secondly, it contains a database for different sectors and thus can explore the trade implications for various sectors of interest15.
13 Here, it is important to note that there are other approaches to assessing the impact of trade liberalization on poverty. The first one is to link the GTAP model with the single country model (with multi-household). The import and export prices from the GTAP model can be used to shock to the single country model. This approach can estimate the change in household welfare as a result of trade liberalization. The second approach links the three models (GTAP model and micro-simulation).The import and export price changes from the GTAP model can be used to shock into the single country CGE model, then used to shock in the micro-simulation model. 14 The origin of GTAP model is based on ORANI model, a single country CGE model, a first CGE model for Australian economy (Dixon, Parmenter, Sutton, and Vincent, 1997). GTAP model extended ORANI model for allowing international trade which introduced a global transportation sector and savings institution. 15 For more details, see Hertel (ed), 1997. A graphic presentation of the GTAP model, with particular emphasis on the accounting relationships, is given by Brockmeier (1996).
22
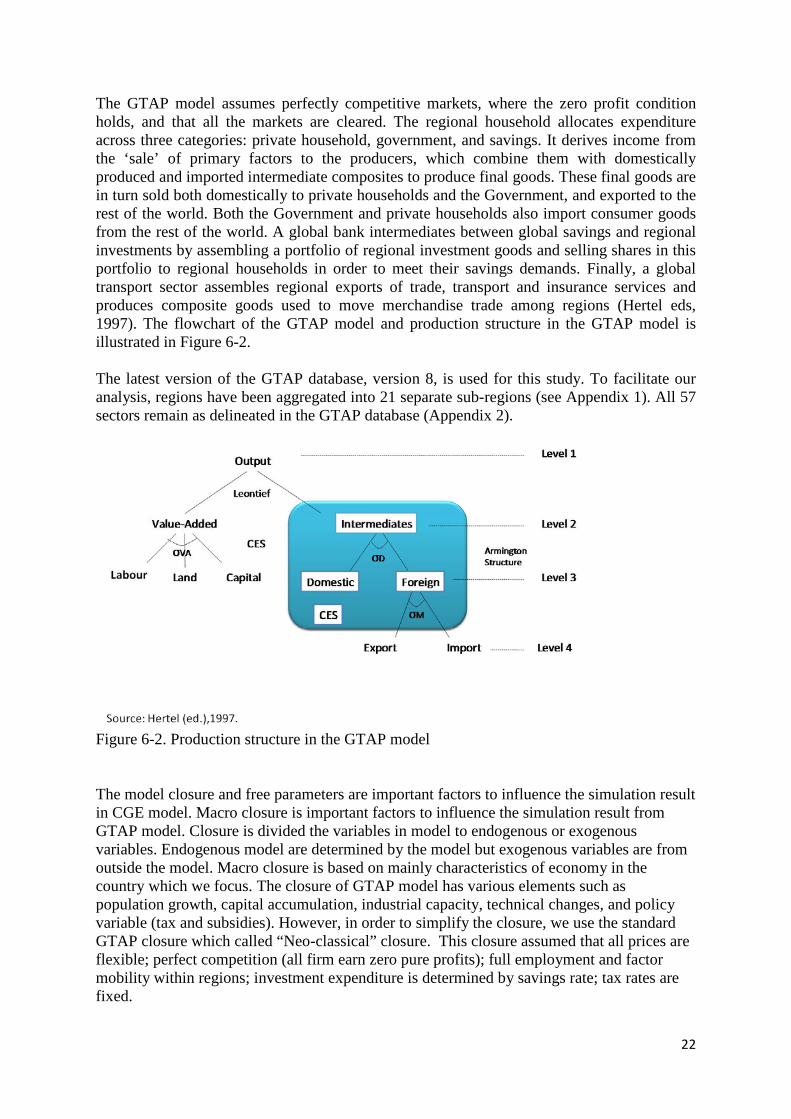
The GTAP model assumes perfectly competitive markets, where the zero profit condition holds, and that all the markets are cleared. The regional household allocates expenditure across three categories: private household, government, and savings. It derives income from the ‘sale’ of primary factors to the producers, which combine them with domestically produced and imported intermediate composites to produce final goods. These final goods are in turn sold both domestically to private households and the Government, and exported to the rest of the world. Both the Government and private households also import consumer goods from the rest of the world. A global bank intermediates between global savings and regional investments by assembling a portfolio of regional investment goods and selling shares in this portfolio to regional households in order to meet their savings demands. Finally, a global transport sector assembles regional exports of trade, transport and insurance services and produces composite goods used to move merchandise trade among regions (Hertel eds, 1997). The flowchart of the GTAP model and production structure in the GTAP model is illustrated in Figure 6-2. The latest version of the GTAP database, version 8, is used for this study. To facilitate our analysis, regions have been aggregated into 21 separate sub-regions (see Appendix 1). All 57 sectors remain as delineated in the GTAP database (Appendix 2).
Figure 6-2. Production structure in the GTAP model The model closure and free parameters are important factors to influence the simulation result in CGE model. Macro closure is important factors to influence the simulation result from GTAP model. Closure is divided the variables in model to endogenous or exogenous variables. Endogenous model are determined by the model but exogenous variables are from outside the model. Macro closure is based on mainly characteristics of economy in the country which we focus. The closure of GTAP model has various elements such as population growth, capital accumulation, industrial capacity, technical changes, and policy variable (tax and subsidies). However, in order to simplify the closure, we use the standard GTAP closure which called “Neo-classical” closure. This closure assumed that all prices are flexible; perfect competition (all firm earn zero pure profits); full employment and factor mobility within regions; investment expenditure is determined by savings rate; tax rates are fixed.
23
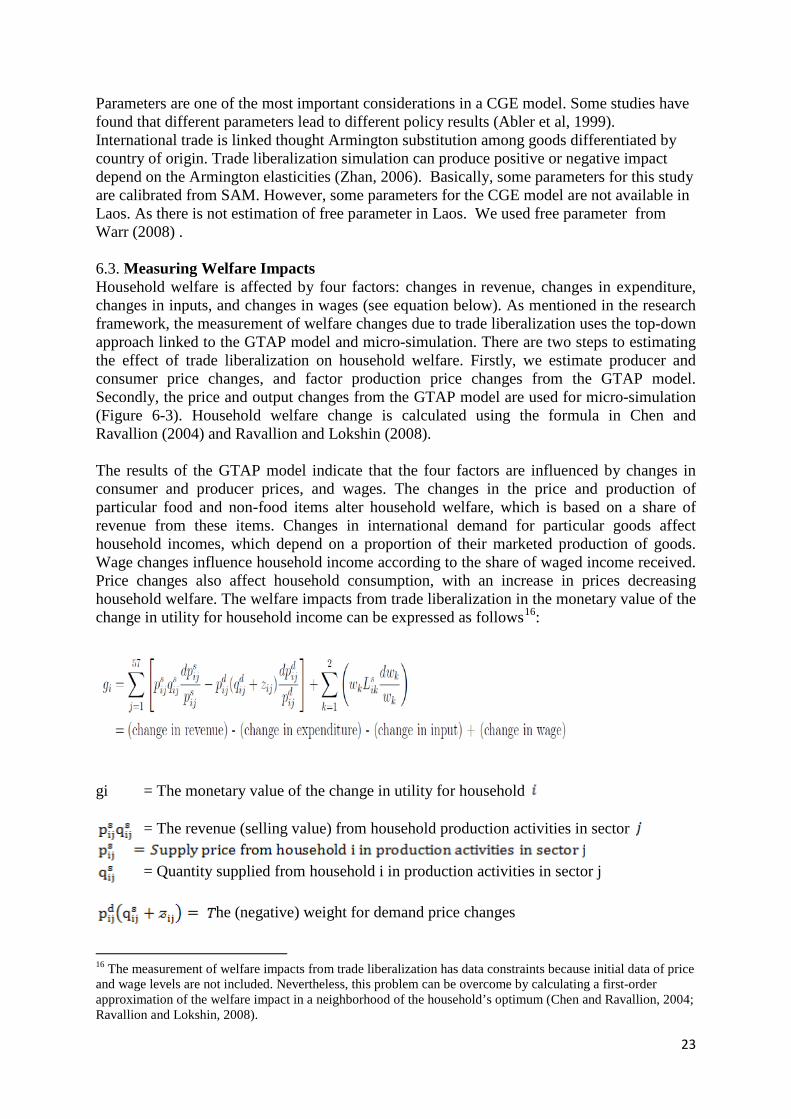
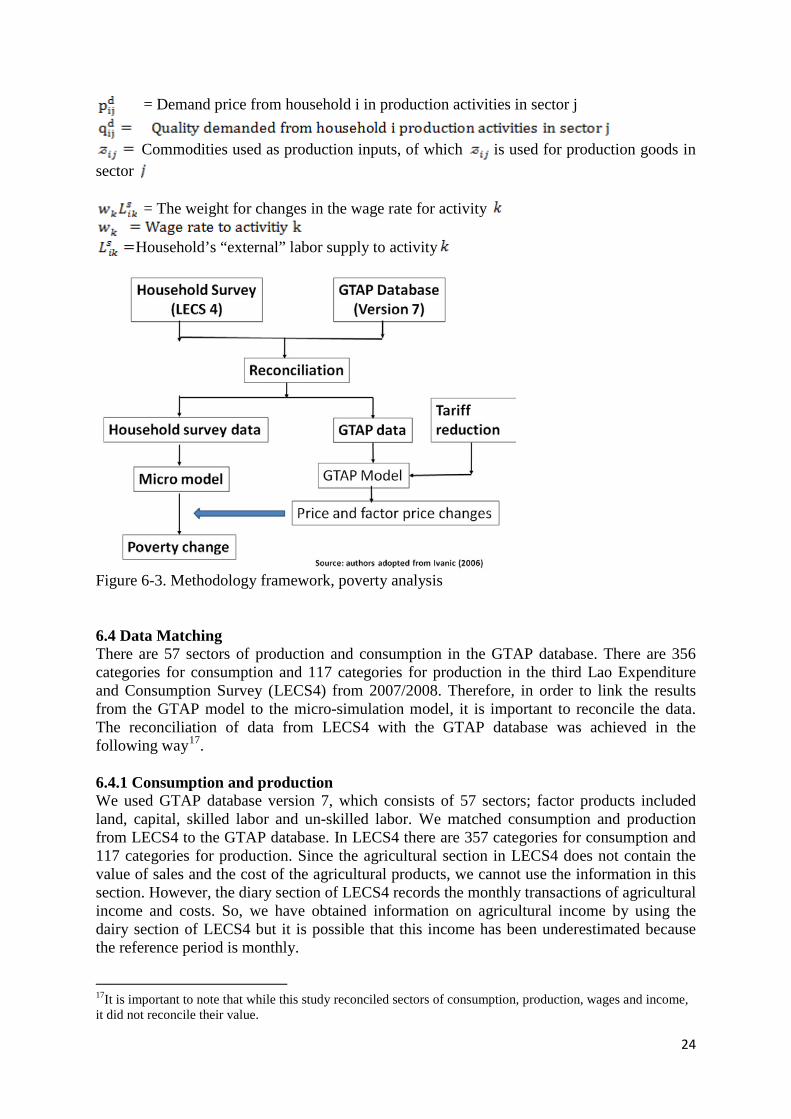
Parameters are one of the most important considerations in a CGE model. Some studies have found that different parameters lead to different policy results (Abler et al, 1999). International trade is linked thought Armington substitution among goods differentiated by country of origin. Trade liberalization simulation can produce positive or negative impact depend on the Armington elasticities (Zhan, 2006). Basically, some parameters for this study are calibrated from SAM. However, some parameters for the CGE model are not available in Laos. As there is not estimation of free parameter in Laos. We used free parameter from Warr (2008) . 6.3. Measuring Welfare Impacts Household welfare is affected by four factors: changes in revenue, changes in expenditure, changes in inputs, and changes in wages (see equation below). As mentioned in the research framework, the measurement of welfare changes due to trade liberalization uses the top-down approach linked to the GTAP model and micro-simulation. There are two steps to estimating the effect of trade liberalization on household welfare. Firstly, we estimate producer and consumer price changes, and factor production price changes from the GTAP model. Secondly, the price and output changes from the GTAP model are used for micro-simulation (Figure 6-3). Household welfare change is calculated using the formula in Chen and Ravallion (2004) and Ravallion and Lokshin (2008). The results of the GTAP model indicate that the four factors are influenced by changes in consumer and producer prices, and wages. The changes in the price and production of particular food and non-food items alter household welfare, which is based on a share of revenue from these items. Changes in international demand for particular goods affect household incomes, which depend on a proportion of their marketed production of goods. Wage changes influence household income according to the share of waged income received. Price changes also affect household consumption, with an increase in prices decreasing household welfare. The welfare impacts from trade liberalization in the monetary value of the change in utility for household income can be expressed as follows16:
gi = The monetary value of the change in utility for household
= The revenue (selling value) from household production activities in sector
= Quantity supplied from household i in production activities in sector j
he (negative) weight for demand price changes
16 The measurement of welfare impacts from trade liberalization has data constraints because initial data of price and wage levels are not included. Nevertheless, this problem can be overcome by calculating a first-order approximation of the welfare impact in a neighborhood of the household’s optimum (Chen and Ravallion, 2004; Ravallion and Lokshin, 2008).
24
= Demand price from household i in production activities in sector j
Commodities used as production inputs, of which is used for production goods in
sector
= The weight for changes in the wage rate for activity
Household’s “external” labor supply to activity
Figure 6-3. Methodology framework, poverty analysis 6.4 Data Matching There are 57 sectors of production and consumption in the GTAP database. There are 356 categories for consumption and 117 categories for production in the third Lao Expenditure and Consumption Survey (LECS4) from 2007/2008. Therefore, in order to link the results from the GTAP model to the micro-simulation model, it is important to reconcile the data. The reconciliation of data from LECS4 with the GTAP database was achieved in the following way17. 6.4.1 Consumption and production We used GTAP database version 7, which consists of 57 sectors; factor products included land, capital, skilled labor and un-skilled labor. We matched consumption and production from LECS4 to the GTAP database. In LECS4 there are 357 categories for consumption and 117 categories for production. Since the agricultural section in LECS4 does not contain the value of sales and the cost of the agricultural products, we cannot use the information in this section. However, the diary section of LECS4 records the monthly transactions of agricultural income and costs. So, we have obtained information on agricultural income by using the dairy section of LECS4 but it is possible that this income has been underestimated because the reference period is monthly.
17It is important to note that while this study reconciled sectors of consumption, production, wages and income, it did not reconcile their value.
25
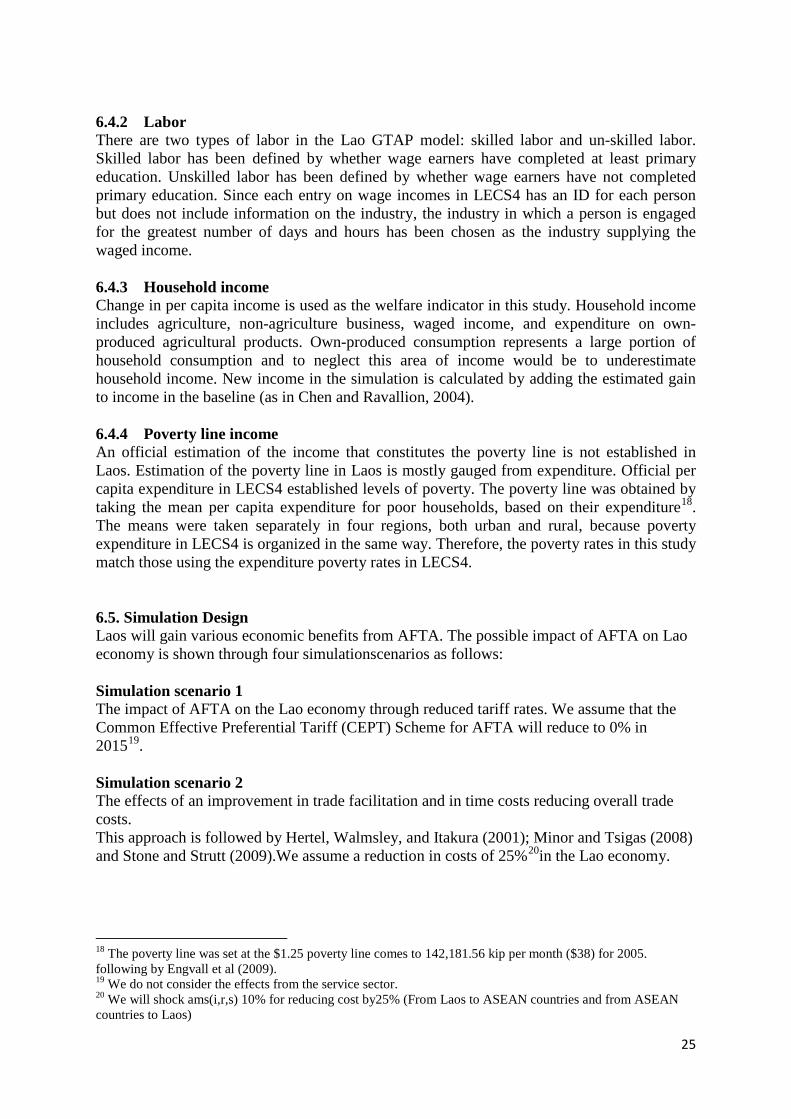
6.4.2 Labor There are two types of labor in the Lao GTAP model: skilled labor and un-skilled labor. Skilled labor has been defined by whether wage earners have completed at least primary education. Unskilled labor has been defined by whether wage earners have not completed primary education. Since each entry on wage incomes in LECS4 has an ID for each person but does not include information on the industry, the industry in which a person is engaged for the greatest number of days and hours has been chosen as the industry supplying the waged income. 6.4.3 Household income Change in per capita income is used as the welfare indicator in this study. Household income includes agriculture, non-agriculture business, waged income, and expenditure on own-produced agricultural products. Own-produced consumption represents a large portion of household consumption and to neglect this area of income would be to underestimate household income. New income in the simulation is calculated by adding the estimated gain to income in the baseline (as in Chen and Ravallion, 2004). 6.4.4 Poverty line income An official estimation of the income that constitutes the poverty line is not established in Laos. Estimation of the poverty line in Laos is mostly gauged from expenditure. Official per capita expenditure in LECS4 established levels of poverty. The poverty line was obtained by taking the mean per capita expenditure for poor households, based on their expenditure18. The means were taken separately in four regions, both urban and rural, because poverty expenditure in LECS4 is organized in the same way. Therefore, the poverty rates in this study match those using the expenditure poverty rates in LECS4. 6.5. Simulation Design Laos will gain various economic benefits from AFTA. The possible impact of AFTA on Lao economy is shown through four simulationscenarios as follows: Simulation scenario 1 The impact of AFTA on the Lao economy through reduced tariff rates. We assume that the Common Effective Preferential Tariff (CEPT) Scheme for AFTA will reduce to 0% in 201519. Simulation scenario 2 The effects of an improvement in trade facilitation and in time costs reducing overall trade costs. This approach is followed by Hertel, Walmsley, and Itakura (2001); Minor and Tsigas (2008) and Stone and Strutt (2009).We assume a reduction in costs of 25%20in the Lao economy.
18 The poverty line was set at the $1.25 poverty line comes to 142,181.56 kip per month ($38) for 2005. following by Engvall et al (2009). 19 We do not consider the effects from the service sector. 20 We will shock ams(i,r,s) 10% for reducing cost by25% (From Laos to ASEAN countries and from ASEAN countries to Laos)
26
Simulation scenario 3 Trade liberalization could promote Foreign Direct Investment (FDI) (Brown and Stern, 2001; NhuBinh and Haughton, 2002). By improving institutions and thusthe climate for doing business,AFTA may result in Laos in increased Foreign Direct Investment (FDI).We assume that the FDI inflow will increase by about 15%21. Simulation scenario 4 Simulation scenario 4combines simulations 1 through 3 as an overall simulation of the impacts of AFTA on the Lao economy.
21We will shock qo("Capital", REG) is the variable for capital endowment and it is set as exogenous under the standard GTAP model.
27
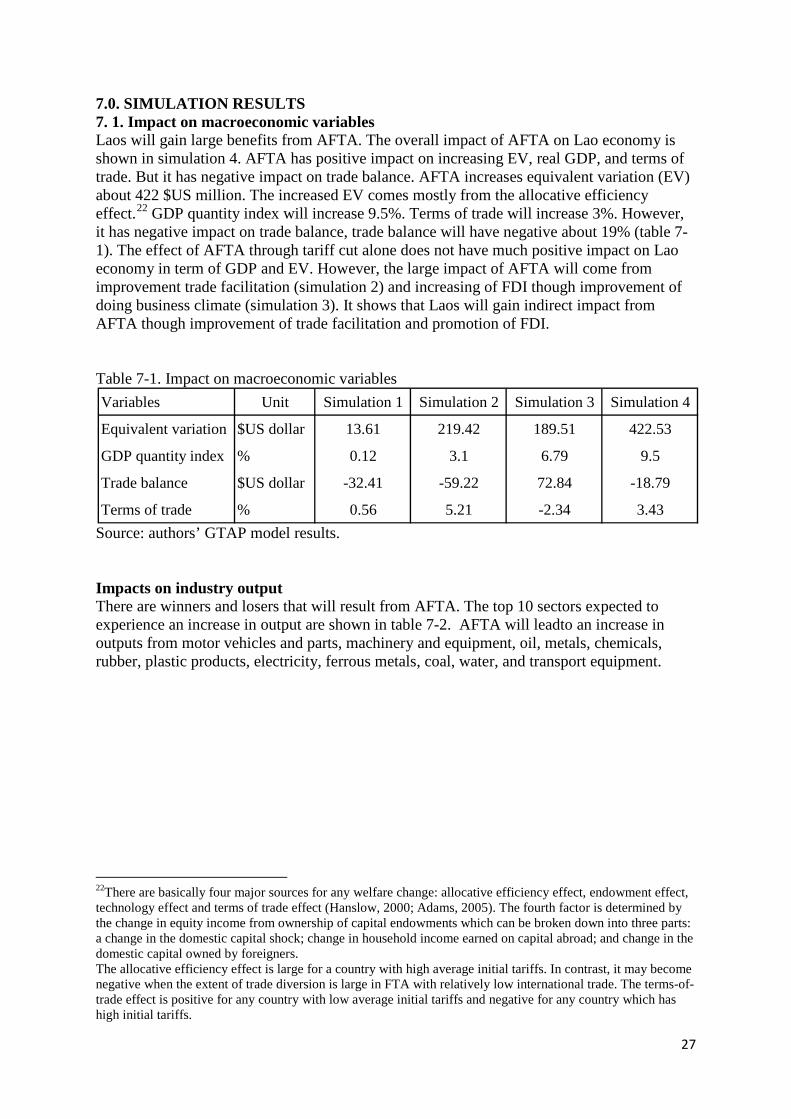
7.0. SIMULATION RESULTS 7. 1. Impact on macroeconomic variables Laos will gain large benefits from AFTA. The overall impact of AFTA on Lao economy is shown in simulation 4. AFTA has positive impact on increasing EV, real GDP, and terms of trade. But it has negative impact on trade balance. AFTA increases equivalent variation (EV) about 422 $US million. The increased EV comes mostly from the allocative efficiency effect.22 GDP quantity index will increase 9.5%. Terms of trade will increase 3%. However, it has negative impact on trade balance, trade balance will have negative about 19% (table 7-1). The effect of AFTA through tariff cut alone does not have much positive impact on Lao economy in term of GDP and EV. However, the large impact of AFTA will come from improvement trade facilitation (simulation 2) and increasing of FDI though improvement of doing business climate (simulation 3). It shows that Laos will gain indirect impact from AFTA though improvement of trade facilitation and promotion of FDI. Table 7-1. Impact on macroeconomic variables
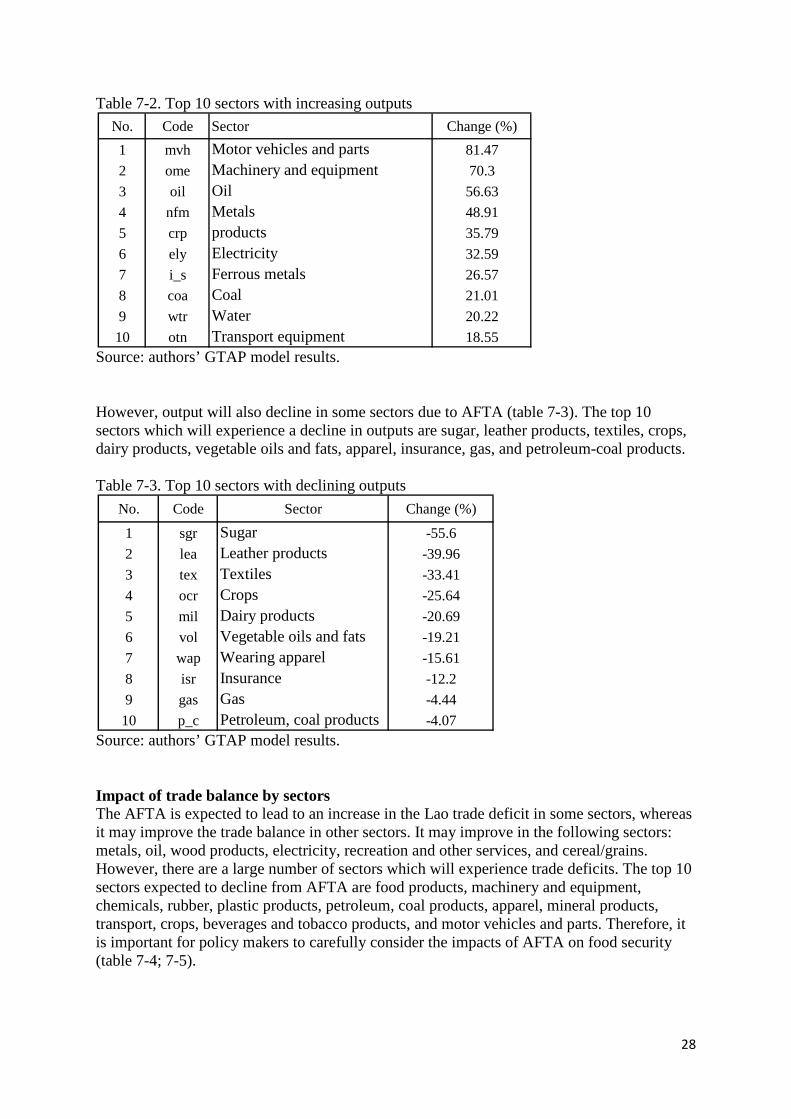
Source: authors’ GTAP model results. Impacts on industry output There are winners and losers that will result from AFTA. The top 10 sectors expected to experience an increase in output are shown in table 7-2. AFTA will leadto an increase in outputs from motor vehicles and parts, machinery and equipment, oil, metals, chemicals, rubber, plastic products, electricity, ferrous metals, coal, water, and transport equipment.
22There are basically four major sources for any welfare change: allocative efficiency effect, endowment effect, technology effect and terms of trade effect (Hanslow, 2000; Adams, 2005). The fourth factor is determined by the change in equity income from ownership of capital endowments which can be broken down into three parts: a change in the domestic capital shock; change in household income earned on capital abroad; and change in the domestic capital owned by foreigners. The allocative efficiency effect is large for a country with high average initial tariffs. In contrast, it may become negative when the extent of trade diversion is large in FTA with relatively low international trade. The terms-of-trade effect is positive for any country with low average initial tariffs and negative for any country which has high initial tariffs.
Variables Unit Simulation 1 Simulation 2 Simulation 3 Simulation 4
Equivalent variation $US dollar 13.61 219.42 189.51 422.53
GDP quantity index % 0.12 3.1 6.79 9.5
Trade balance $US dollar -32.41 -59.22 72.84 -18.79
Terms of trade % 0.56 5.21 -2.34 3.43
28
Table 7-2. Top 10 sectors with increasing outputs
Source: authors’ GTAP model results. However, output will also decline in some sectors due to AFTA (table 7-3). The top 10 sectors which will experience a decline in outputs are sugar, leather products, textiles, crops, dairy products, vegetable oils and fats, apparel, insurance, gas, and petroleum-coal products. Table 7-3. Top 10 sectors with declining outputs
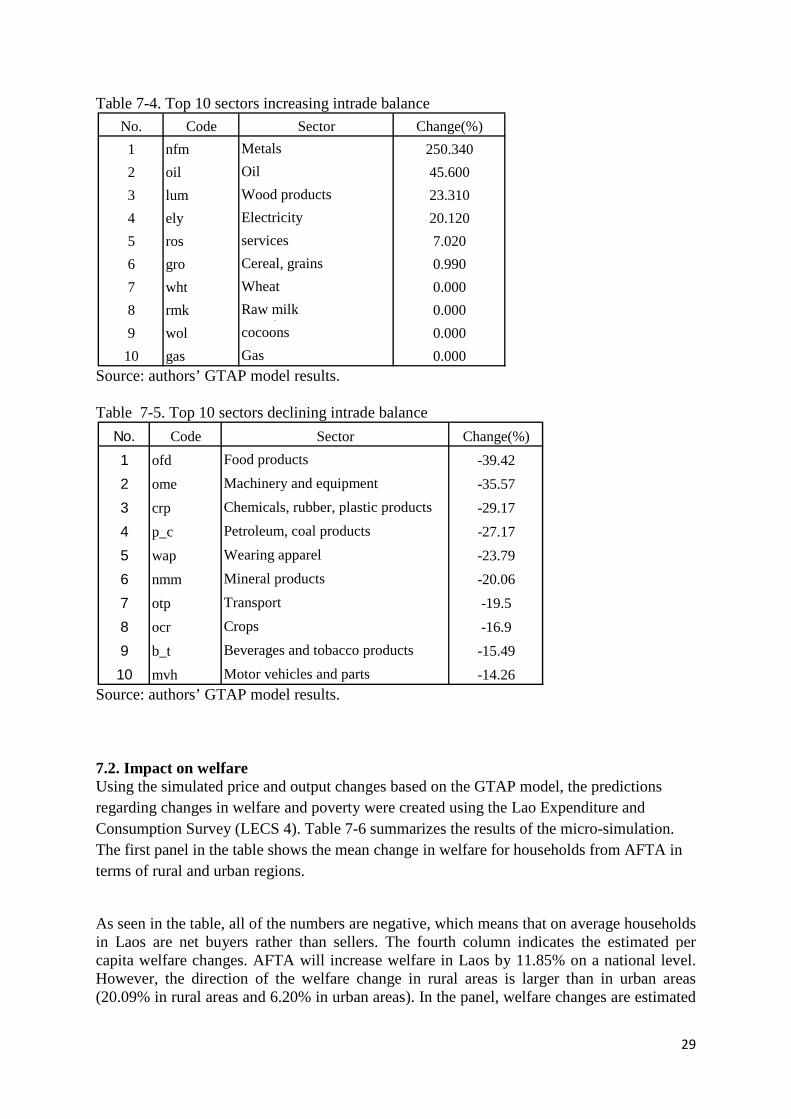
Source: authors’ GTAP model results. Impact of trade balance by sectors The AFTA is expected to lead to an increase in the Lao trade deficit in some sectors, whereas it may improve the trade balance in other sectors. It may improve in the following sectors: metals, oil, wood products, electricity, recreation and other services, and cereal/grains. However, there are a large number of sectors which will experience trade deficits. The top 10 sectors expected to decline from AFTA are food products, machinery and equipment, chemicals, rubber, plastic products, petroleum, coal products, apparel, mineral products, transport, crops, beverages and tobacco products, and motor vehicles and parts. Therefore, it is important for policy makers to carefully consider the impacts of AFTA on food security (table 7-4; 7-5).
No. Code Sector Change (%)1 mvh Motor vehicles and parts 81.472 ome Machinery and equipment 70.33 oil Oil 56.634 nfm Metals 48.915 crp
products 35.79
6 ely Electricity 32.597 i_s Ferrous metals 26.578 coa Coal 21.019 wtr Water 20.2210 otn Transport equipment 18.55
No. Code Sector Change (%)
1 sgr Sugar -55.62 lea Leather products -39.963 tex Textiles -33.414 ocr Crops -25.645 mil Dairy products -20.696 vol Vegetable oils and fats -19.217 wap Wearing apparel -15.618 isr Insurance -12.29 gas Gas -4.4410 p_c Petroleum, coal products -4.07
29
Table 7-4. Top 10 sectors increasing intrade balance
Source: authors’ GTAP model results. Table 7-5. Top 10 sectors declining intrade balance
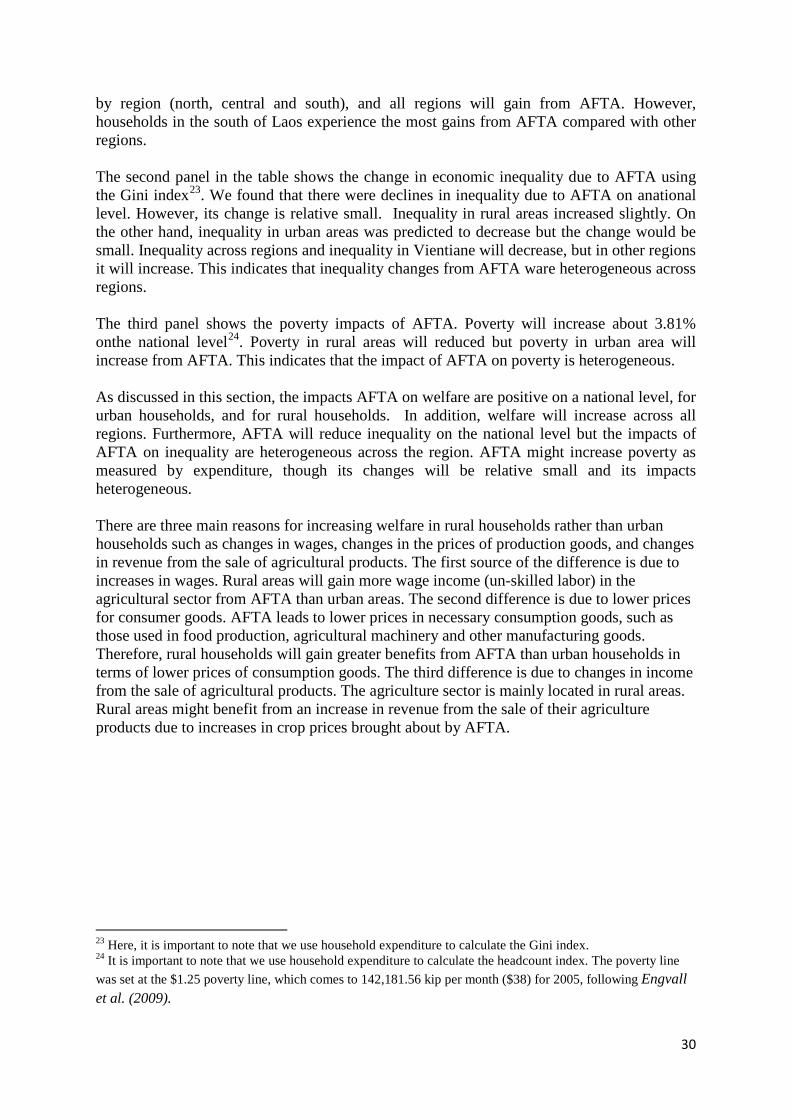
Source: authors’ GTAP model results. 7.2. Impact on welfare Using the simulated price and output changes based on the GTAP model, the predictions regarding changes in welfare and poverty were created using the Lao Expenditure and Consumption Survey (LECS 4). Table 7-6 summarizes the results of the micro-simulation. The first panel in the table shows the mean change in welfare for households from AFTA in terms of rural and urban regions.
As seen in the table, all of the numbers are negative, which means that on average households in Laos are net buyers rather than sellers. The fourth column indicates the estimated per capita welfare changes. AFTA will increase welfare in Laos by 11.85% on a national level. However, the direction of the welfare change in rural areas is larger than in urban areas (20.09% in rural areas and 6.20% in urban areas). In the panel, welfare changes are estimated
No. Code Sector Change(%)1 nfm Metals 250.3402 oil Oil 45.6003 lum Wood products 23.3104 ely Electricity 20.1205 ros
services 7.020
6 gro Cereal, grains 0.9907 wht Wheat 0.0008 rmk Raw milk 0.0009 wol
, cocoons 0.000
10 gas Gas 0.000
No. Code Sector Change(%)1 ofd Food products -39.422 ome Machinery and equipment -35.573 crp Chemicals, rubber, plastic products -29.174 p_c Petroleum, coal products -27.175 wap Wearing apparel -23.796 nmm Mineral products -20.067 otp Transport -19.58 ocr Crops -16.99 b_t Beverages and tobacco products -15.4910 mvh Motor vehicles and parts -14.26
30
by region (north, central and south), and all regions will gain from AFTA. However, households in the south of Laos experience the most gains from AFTA compared with other regions. The second panel in the table shows the change in economic inequality due to AFTA using the Gini index23. We found that there were declines in inequality due to AFTA on anational level. However, its change is relative small. Inequality in rural areas increased slightly. On the other hand, inequality in urban areas was predicted to decrease but the change would be small. Inequality across regions and inequality in Vientiane will decrease, but in other regions it will increase. This indicates that inequality changes from AFTA ware heterogeneous across regions. The third panel shows the poverty impacts of AFTA. Poverty will increase about 3.81% onthe national level24. Poverty in rural areas will reduced but poverty in urban area will increase from AFTA. This indicates that the impact of AFTA on poverty is heterogeneous. As discussed in this section, the impacts AFTA on welfare are positive on a national level, for urban households, and for rural households. In addition, welfare will increase across all regions. Furthermore, AFTA will reduce inequality on the national level but the impacts of AFTA on inequality are heterogeneous across the region. AFTA might increase poverty as measured by expenditure, though its changes will be relative small and its impacts heterogeneous. There are three main reasons for increasing welfare in rural households rather than urban households such as changes in wages, changes in the prices of production goods, and changes in revenue from the sale of agricultural products. The first source of the difference is due to increases in wages. Rural areas will gain more wage income (un-skilled labor) in the agricultural sector from AFTA than urban areas. The second difference is due to lower prices for consumer goods. AFTA leads to lower prices in necessary consumption goods, such as those used in food production, agricultural machinery and other manufacturing goods. Therefore, rural households will gain greater benefits from AFTA than urban households in terms of lower prices of consumption goods. The third difference is due to changes in income from the sale of agricultural products. The agriculture sector is mainly located in rural areas. Rural areas might benefit from an increase in revenue from the sale of their agriculture products due to increases in crop prices brought about by AFTA.
23 Here, it is important to note that we use household expenditure to calculate the Gini index. 24 It is important to note that we use household expenditure to calculate the headcount index. The poverty line was set at the $1.25 poverty line, which comes to 142,181.56 kip per month ($38) for 2005, following Engvall et al. (2009).
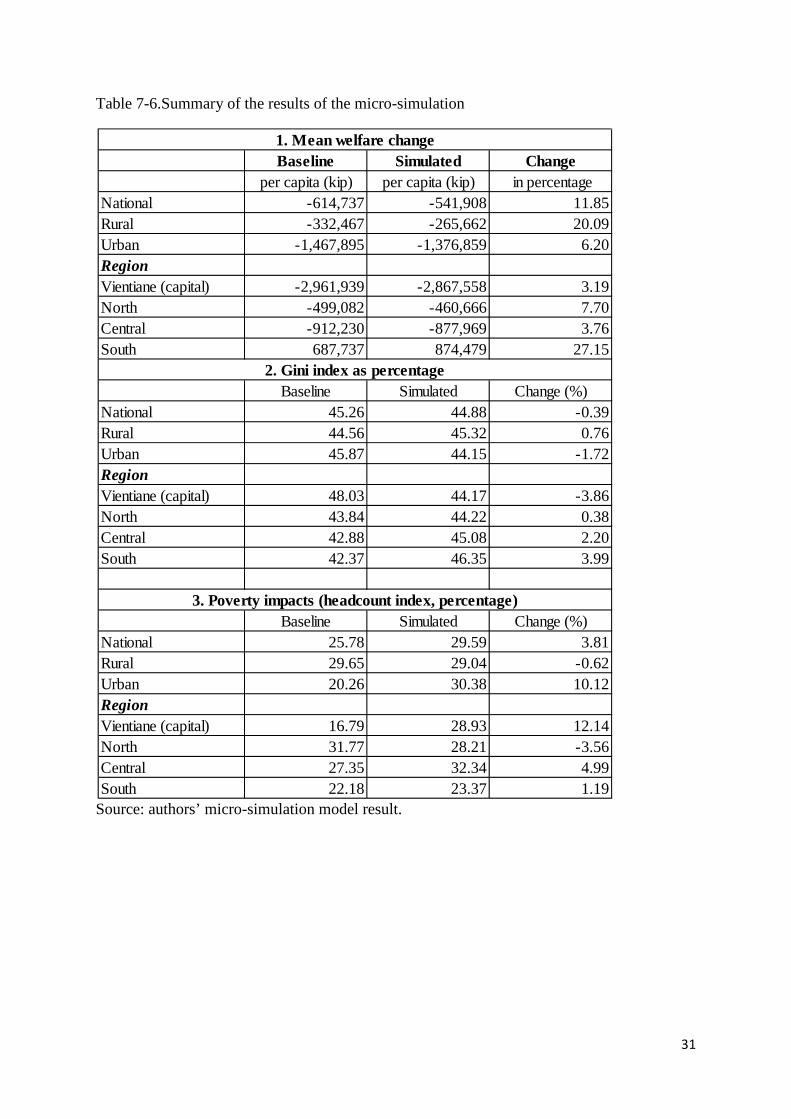
31
Table 7-6.Summary of the results of the micro-simulation
Source: authors’ micro-simulation model result.
Baseline Simulated Changeper capita (kip) per capita (kip) in percentage
National -614,737 -541,908 11.85Rural -332,467 -265,662 20.09Urban -1,467,895 -1,376,859 6.20RegionVientiane (capital) -2,961,939 -2,867,558 3.19North -499,082 -460,666 7.70Central -912,230 -877,969 3.76South 687,737 874,479 27.15
Baseline Simulated Change (%)National 45.26 44.88 -0.39Rural 44.56 45.32 0.76Urban 45.87 44.15 -1.72RegionVientiane (capital) 48.03 44.17 -3.86North 43.84 44.22 0.38Central 42.88 45.08 2.20South 42.37 46.35 3.99
Baseline Simulated Change (%)National 25.78 29.59 3.81Rural 29.65 29.04 -0.62Urban 20.26 30.38 10.12RegionVientiane (capital) 16.79 28.93 12.14North 31.77 28.21 -3.56Central 27.35 32.34 4.99South 22.18 23.37 1.19
3. Poverty impacts (headcount index, percentage)
1. Mean welfare change
2. Gini index as percentage
32
7.3. Determinants of Welfare Gains or Lose Despite increasing welfare from AFTA, the impacts of AFTA are heterogeneous. In order to analyze the detailed impacts of AFTA on households, we use the logit model to investigate the factors which influence absolute gains or losses of welfare (Gi). The dependent variable is welfare (Gi) which was calculated in the previous chapter. If a household gains from AFTA it is labeled 1 and if it loses is 0. The explanatory variables describe various attributes of different households (for more details see Table 1). Following the literature from Anderssson et al. (2005), Warr (2010) and Chen and Ravallion (2003), the explanatory variables can be divided into three categories: factors of production, household characteristics, and environmental factors. The multi-regression equation relationship between the probability to gain or lose in welfare and explanatory variables can be expressed as follows: Gi = 𝛼 + 𝛽𝑖𝑉𝑖 + 𝛾𝑖𝑊𝑖 + 𝛿𝑖𝑋𝑖 + ε………………………………………….. (1) 𝑃𝑟𝑜𝑏 (𝐺𝑖 = 1) = 1
1+𝑒−𝐺𝑖 …………………………………………………. (2)
Where: Prob = Probability of gains in household welfare (Gi) 𝑒−𝐺𝑖 = Irrational number to the power of Gi Gi = Welfare measured in previous session. Gi is equal one if
household gains in welfare from AFTA; otherwise equal to zero V = Vectors of factors of production. W = Household characteristics. X = Environmental factors.
ii γβα ,, and iδ are unknown parameters and ε is a normally distributed random error term.
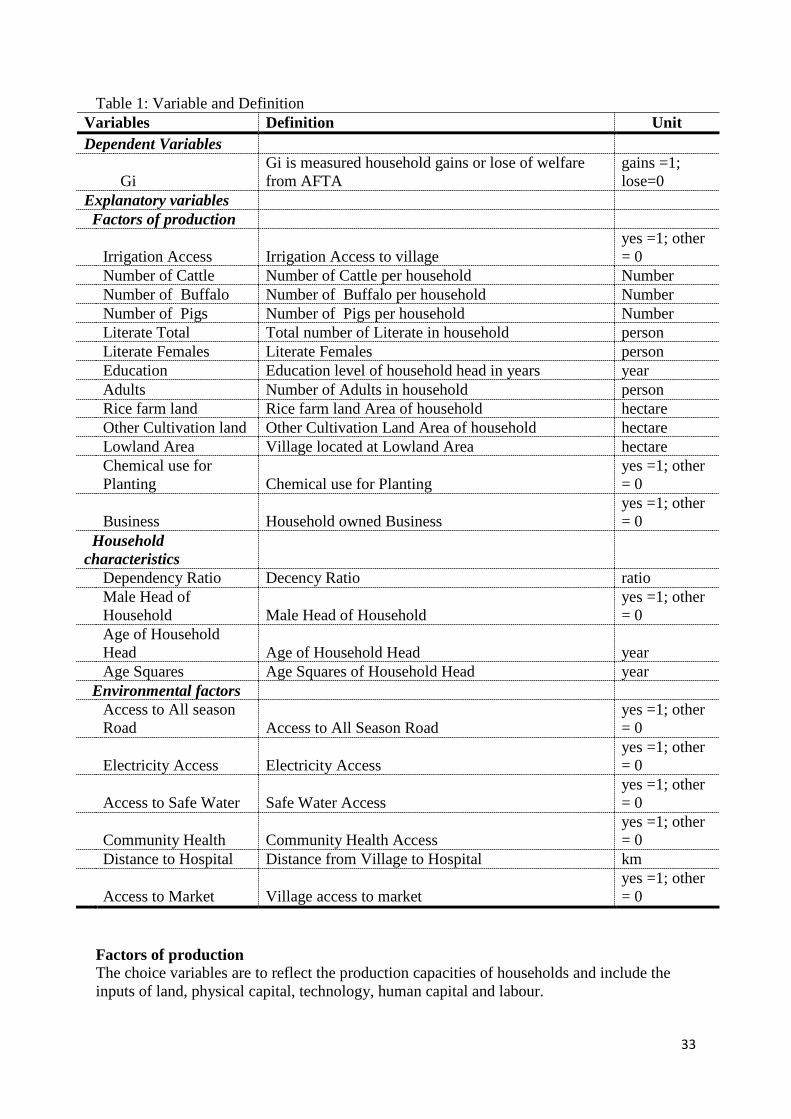
33
Table 1: Variable and Definition Variables Definition Unit Dependent Variables
Gi Gi is measured household gains or lose of welfare from AFTA
gains =1; lose=0
Explanatory variables Factors of production
Irrigation Access Irrigation Access to village
yes =1; other = 0
Number of Cattle Number of Cattle per household Number Number of Buffalo Number of Buffalo per household Number Number of Pigs Number of Pigs per household Number Literate Total Total number of Literate in household person Literate Females Literate Females person Education Education level of household head in years year Adults Number of Adults in household person Rice farm land Rice farm land Area of household hectare Other Cultivation land Other Cultivation Land Area of household hectare Lowland Area Village located at Lowland Area hectare
Chemical use for Planting Chemical use for Planting
yes =1; other = 0
Business Household owned Business yes =1; other = 0
Household characteristics Dependency Ratio Decency Ratio ratio
Male Head of Household Male Head of Household
yes =1; other = 0
Age of Household Head Age of Household Head year
Age Squares Age Squares of Household Head year Environmental factors
Access to All season Road Access to All Season Road
yes =1; other = 0
Electricity Access Electricity Access yes =1; other = 0
Access to Safe Water Safe Water Access yes =1; other = 0
Community Health Community Health Access yes =1; other = 0
Distance to Hospital Distance from Village to Hospital km
Access to Market Village access to market yes =1; other = 0
Factors of production The choice variables are to reflect the production capacities of households and include the inputs of land, physical capital, technology, human capital and labour.
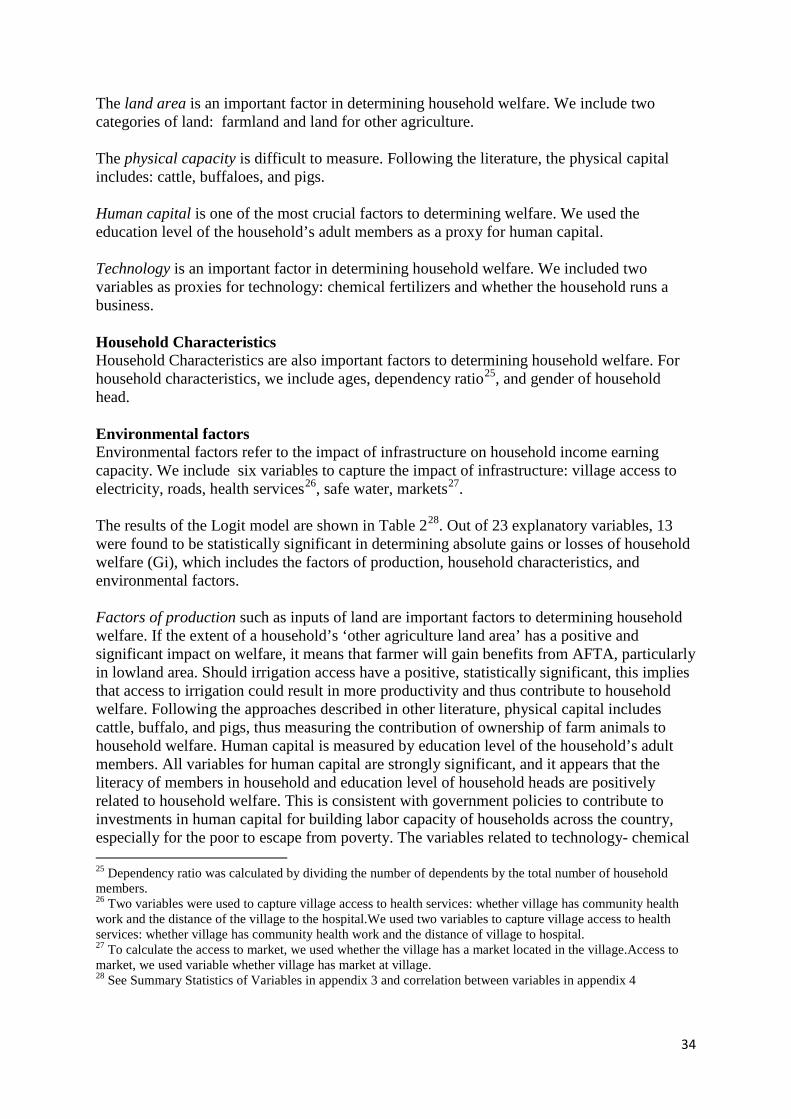
34
The land area is an important factor in determining household welfare. We include two categories of land: farmland and land for other agriculture. The physical capacity is difficult to measure. Following the literature, the physical capital includes: cattle, buffaloes, and pigs. Human capital is one of the most crucial factors to determining welfare. We used the education level of the household’s adult members as a proxy for human capital. Technology is an important factor in determining household welfare. We included two variables as proxies for technology: chemical fertilizers and whether the household runs a business. Household Characteristics Household Characteristics are also important factors to determining household welfare. For household characteristics, we include ages, dependency ratio25, and gender of household head. Environmental factors Environmental factors refer to the impact of infrastructure on household income earning capacity. We include six variables to capture the impact of infrastructure: village access to electricity, roads, health services26, safe water, markets27. The results of the Logit model are shown in Table 228. Out of 23 explanatory variables, 13 were found to be statistically significant in determining absolute gains or losses of household welfare (Gi), which includes the factors of production, household characteristics, and environmental factors. Factors of production such as inputs of land are important factors to determining household welfare. If the extent of a household’s ‘other agriculture land area’ has a positive and significant impact on welfare, it means that farmer will gain benefits from AFTA, particularly in lowland area. Should irrigation access have a positive, statistically significant, this implies that access to irrigation could result in more productivity and thus contribute to household welfare. Following the approaches described in other literature, physical capital includes cattle, buffalo, and pigs, thus measuring the contribution of ownership of farm animals to household welfare. Human capital is measured by education level of the household’s adult members. All variables for human capital are strongly significant, and it appears that the literacy of members in household and education level of household heads are positively related to household welfare. This is consistent with government policies to contribute to investments in human capital for building labor capacity of households across the country, especially for the poor to escape from poverty. The variables related to technology- chemical 25 Dependency ratio was calculated by dividing the number of dependents by the total number of household members. 26 Two variables were used to capture village access to health services: whether village has community health work and the distance of the village to the hospital.We used two variables to capture village access to health services: whether village has community health work and the distance of village to hospital. 27 To calculate the access to market, we used whether the village has a market located in the village.Access to market, we used variable whether village has market at village. 28 See Summary Statistics of Variables in appendix 3 and correlation between variables in appendix 4
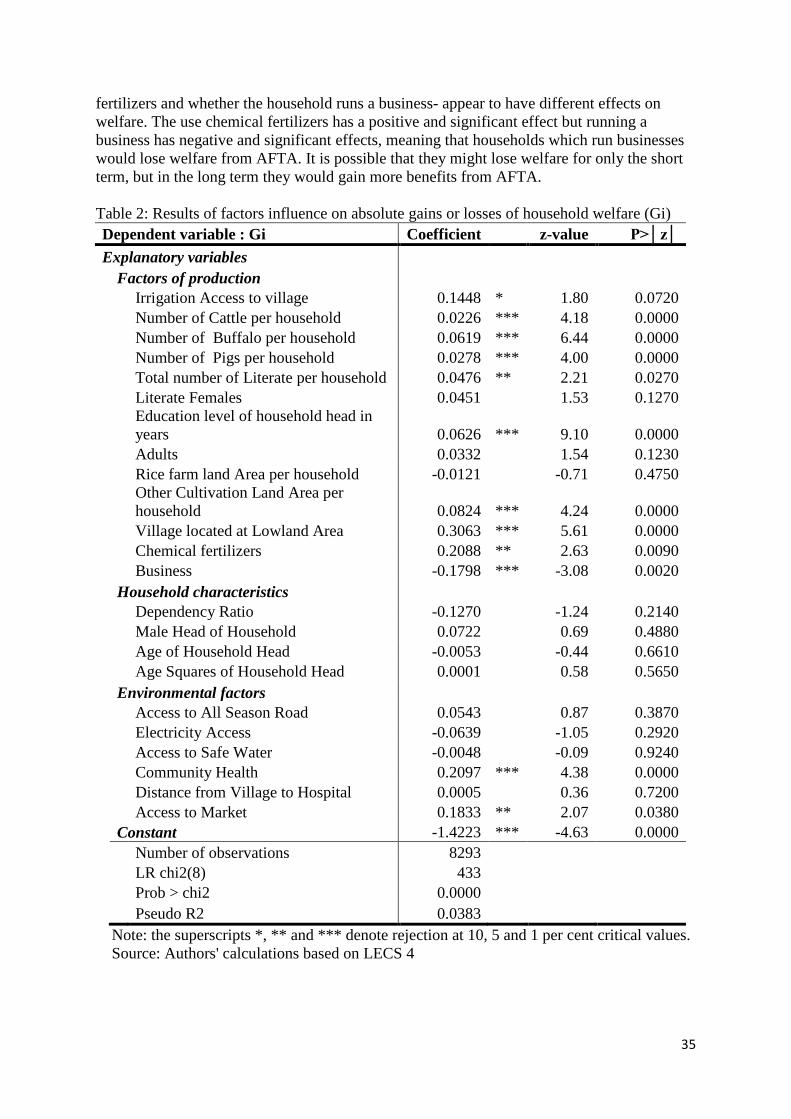
35
fertilizers and whether the household runs a business- appear to have different effects on welfare. The use chemical fertilizers has a positive and significant effect but running a business has negative and significant effects, meaning that households which run businesses would lose welfare from AFTA. It is possible that they might lose welfare for only the short term, but in the long term they would gain more benefits from AFTA. Table 2: Results of factors influence on absolute gains or losses of household welfare (Gi) Dependent variable : Gi Coefficient z-value P>│z│ Explanatory variables
Factors of production
Irrigation Access to village 0.1448 * 1.80 0.0720
Number of Cattle per household 0.0226 *** 4.18 0.0000
Number of Buffalo per household 0.0619 *** 6.44 0.0000
Number of Pigs per household 0.0278 *** 4.00 0.0000
Total number of Literate per household 0.0476 ** 2.21 0.0270
Literate Females 0.0451
1.53 0.1270
Education level of household head in years 0.0626 *** 9.10 0.0000
Adults 0.0332
1.54 0.1230
Rice farm land Area per household -0.0121
-0.71 0.4750
Other Cultivation Land Area per household 0.0824 *** 4.24 0.0000
Village located at Lowland Area 0.3063 *** 5.61 0.0000
Chemical fertilizers 0.2088 ** 2.63 0.0090
Business -0.1798 *** -3.08 0.0020
Household characteristics
Dependency Ratio -0.1270
-1.24 0.2140
Male Head of Household 0.0722
0.69 0.4880
Age of Household Head -0.0053
-0.44 0.6610
Age Squares of Household Head 0.0001
0.58 0.5650
Environmental factors
Access to All Season Road 0.0543
0.87 0.3870
Electricity Access -0.0639
-1.05 0.2920
Access to Safe Water -0.0048
-0.09 0.9240
Community Health 0.2097 *** 4.38 0.0000
Distance from Village to Hospital 0.0005
0.36 0.7200
Access to Market 0.1833 ** 2.07 0.0380
Constant -1.4223 *** -4.63 0.0000
Number of observations 8293
LR chi2(8) 433
Prob > chi2 0.0000
Pseudo R2 0.0383
Note: the superscripts *, ** and *** denote rejection at 10, 5 and 1 per cent critical values. Source: Authors' calculations based on LECS 4
36
Household characteristics in this study include age, dependency ratio29, and gender of household head. The results demonstrated that all variables of household characteristics have have insignificant impacts on household welfare, which means that household characteristics hold less influence over absolute gains or losses of household welfare. This is in contrast with the study of Anderssson, M., Engvall, A., and Kokko, A. (2005). Environmental factors refer to the impact of infrastructure on household income earning capacity. We include six variables to capture the impacts of infrastructure: village access to electricity, road access, health services30, safe water, and markets31. The results of the study indicated that there are only two of six proxies for environmental factors – village access to health services and markets – which are statistically significant and positively related to household welfare.
29 Dependency ratio was calculated by dividing the number of dependents by the total number of household members. 30 Two variables were used to capture village access to health services: whether village has community health work and the distance of the village to the hospital. 31 To calculate the access to market, we used whether the village has a market located in the village.
37
8.0 CONCLUSIONS The impact of trade liberalization on poverty is of major interest to academics and policy makers at local and international levels. There are some remaining questions as to whether or not trade liberalization is good for poor households. In Laos, the AFTA could have positive and negative impacts on poverty depending on various factors, including characteristics of households. There is therefore significant concern as to whether trade liberalization, especially the provisions which AFTA entails, will raise or alleviate poverty. However, there are very few studies focused on the impacts of AFTA on poverty in Laos. The main objective of this study is to assess the impacts of AFTA on poverty using a multi-region, multi-sector CGE model (GTAP) and micro-simulation. From the GTAP simulation results, we can conclude that direct impact of tariff cuts will be minimal. However, the indirect effects from AFTA, such as the improvement of trade facilitation and promotion of FDI, are expected to be much larger. The real GDP will increase by only about 9.5% and household welfare (EV) will increase by 422 million US$. However, Laos will experience the growth of a much more significant trade deficit from AFTA than it currently experiences – a deficit of an estimated 18 million US$. Most sectors when analysed are expected to experience a trade deficit, especially the food and crop sectors. Production outputs in industrial sectors such as motor vehicles and parts, machinery and equipment, oil, metals, chemicals, rubber, plastic products, electricity, ferrous metals, and coal will grow as a result of AFTA. On the other hand, some parts of the agriculture and light manufacturing sectors such as sugar, leather products, textiles, crops, dairy products, vegetable oils and fats, apparel, insurance, gas, and petroleum, coal products will lose from AFTA. In sum, AFTA will increase real GDP and welfare in Laos. However, it will also increase its trade deficit and create winners and losers in production outputs. AFTA will also contribute to poverty reduction in terms of increasing wages for both skilled and unskilled labor and it will not increase income inequality in Laos. From the results of the micro-simulation, the impacts of AFTA on welfare are positive on the national level, for urban households, and for rural households on the whole. In addition, welfare will increase across regions. AFTA will also reduce inequality at the national level but impacts of AFTA on inequality are predicted to be heterogeneous across the region. The Logit model indicates that the beneficiaries of AFTA are determined by whether households have access to irrigation; the number of livestock including cattle, buffalo, and pigs; the number of literate members of the household; the education of household head; the land area of the household; and access to community and market. However, this study is affected by several weaknesses in the GTAP simulation. First, it uses a static GTAP model, which does not reflect the real impact of AFTA. Second, due to lack of data, we do not consider the Non-trade barrier (NTB). Third, this study does not taken into account the gains from increase productivity from trade.
38
Reference Anderssson, M., Engvall, A., and Kokko, A. (2005). Determinants of poverty in Lao PDR, Country Economic Report 2005:10, Sida. Abbott, P. (2008) “Trade and development: Lessons from Vietnam’s past trade agreement.” World Development, 37:2, 341-353. Abler, D. G., Rodgiguez, A. G., and Shortle, J. S. (1999) “Parameter Uncertainty in CGE Model of Environmental Impact of Economic Policies.” Environmental and Resource Economics, 14, 75-94. Adams, P. D. (2005) “Interpretation of results from CGE models such as GTAP.” Journal of Policy Modeling, 27, 941-959. Adams, F. G., and Park, I. (1995) “Measuring the impact of AFTA: An application of a linked CGE system.” Journal of Policy Modeling, 17:4, 325-365. Angresano, J. (2004) "European union integration lessons for ASEAN+3: the importance of contextual specficity." Journal of Asian Economics, 14, 909-926. Ariyasajjakorn, D., Gander, J., Ratanakomut, S., and Reynolds, S. (2009) "ASEAN FTA, distribution of income, and globalization." Journal of Asian Economics, 20, 327–335. ASEAN Secretariat (2012a) "ASEAN Statistics Leaflet 2012." Statistical Publications. Jakarta, Indonesia: ASEAN Secretariat. ASEAN Secretariat (2012b) ASEANstats. Retrieved March 4, 2013, from ASEAN Secretariat web site: http://www.asean.org/resources/category/asean-statistics ASEAN Secretariat (2012c) Overview. Retrieved March 1, 2013, from Association of Southeast Asian Nations web site: http://www.asean.org/asean/about-asean/overview Asia Regional Integration Center [ARIC] (2012) Free Trade Agreement. Retrieved March 4, 2013, from Asia Regional Integration Center web site: http://aric.adb.org/fta.php Asia-Pacific Economic Cooperation [APEC] (2013) About APEC: What is Asia-Pacific Economic Cooperation? Retrieved February 28, 2013, from Asia-Pacific Economic Cooperation web site: http://www.apec.org/about-us/about-apec.aspx Akkharath, I. (2003) “The agricultural development policy and WTO accession of Lao PDR.” World Trade Organization. Athukorala, P. C., and Menon, J. (1997) “AFTA and the investment-trade nexus in ASEAN.” ASEAN Economic Bulletin, 159-157. Brockmeier, M. (1996) “A graphical exposition of the GTAP model.” GTAP technical paper. Purdue University: Center for Global Trade Analysis.
39
Calvo-Pardo, H., Freund, C., and Ornelas, E. (2009) "The ASEAN Free Trade Agreement: Impact on Trade Flows and External Trade Barriers." Policy Research Working Paper No.WPS4960. The World Bank. Chaipan, C., Hguen, T. D., and Ezaki, M. (2006) “Regional Economic Integration and its Impacts on Growth, Poverty and Income Distribution; The Case of Thailand.” Discussion Paper No.147, Graduate School of International Development. Japan: Nagoya University. Chaipan, C., Nguyen, T. D., and Ezaki, M. (2007) “Regional economic integration and its impacts on growth.” NIDA Development Journal, 47:4, 101-133. Chen, S., and Ravallion, M. (2004) “Welfare impacts of China’s access to the World Trade Organization.” The World Economic Review, 18:1, 29-57. Chen, S., and Ravallion, M. (2003). Household welfare impacts of China’s Access to the World Trade Orgnization, Policy Research Working Paper, WPS3040, The World Bank. Corden, W. M. (1984) “Booming Sector and Dutch Disease Economics: Survey and Consolidation.” Oxford Economic Paper, 36, 359-380. Corden, W. M., and Neary, J. P. (1982) “Booming Sector and De-industrialization in a Small Open Economy.” Economic Journal, 92, 825-848. Corong, E. L. (2007) “Tariff Reduction, Carbon Emissions and Poverty: An Economy-wide Assessment of The Philippines.” Research Report, The Economy and Environment Program for South East Asia (EEPSEA). Cororaton, C. B., and Cockburn, J. (2007) “Trade reform and poverty- lessons from the Philippines: A CGE-microsimulation analysis.” Journal of Policy Modeling, 29, 141-163. Cororaton, C., Cockburn, J., and Corong, E. (2005) “Doha Scenarios: Trade Reforms and Poverty in The Philippines: A CGE Analysis.” PEP-MPIA Working Paper No.03. Dean, M., and Wignaraja, G. (2007) "ASEAN+3 or ASEAN+6: Which Way Forward?" Paper presented at the Conference on Multilateralising Regionalism. Geneva. DOS, MOH, and UNICEF (2008) Lao PDR Multiple National Maternal and Child Nutrition Survey 2006. Department of Statistics, Ministry of Health, and UNICEF, Vientiane, Laos. Dollar, D., and Kraay, A. (2004) “Trade, growth, and poverty.” the Economic Journal, 114:493, 22-49. Dollar, D. (1992) “Outward-Oriented Developing Economies Really Do Grow More Rapidly: Evidence From 95 LDCs, 1976-1985.” Economic Development and Culture Change, 40:3, 523-544. Engvall, A., Fenton, N., Lindelow, M., and Souksavath, P. (2009) Poverty in Lao PDR 1992/3-2007/8. Word Bank and Department of Statistics, Ministry of Planning and Investment.
40
Estrada, G., Park, D., Park, I., and Park, S. (2011) "ASEAN’s Free Trade Agreements with the PRC, Japan, and the Republic of Korea: A Qualitative and Quantitative Analysis." ADB Working Paper Series on Regional Economic Integration, No.75. Manila: Asian Development Bank. European Commission (2008) "Trade sustainability impact assessment for the FTA between EU and ASEAN." Phase I global analysis report. The Nethelands: European Commission. Fane, G. (2006) "Trade Liberalization, Economic Reform and Poverty Reduction in Lao PDR." Journal of the Asia Pacific Economy, 11:2, 213–226. Frankel, J., and Rose, A.K. (1999) “Does Trade Cause Growth?” American Economic Review, 89:3, 379-399. Fujii, T., and Roland-Holst, D. (2007) “How Does Vietnam’s Accession to The World Trade Organization Change the Spatial Incidence of Poverty?” Research Paper No.12. World Institute for Development Economics Research. United Nations University. Fukase, E., and Winters, L. A. (2003) “Possible dynamic effects of AFTA for new member countries.” World Economy, 853-871. Fukase, E., and Martin, W. (1999) “Economic Effect of Joining The ASEAN Free Trade Area (AFTA): The Case of The Lao People’s Democratic Republic”, Washington DC, USA: World Bank. GoL (The Government of Laos) (2006) Sixth National Socio Economic Development Plan (NEDP) for 2006-2010, Vientiane, Lao PDR: Committee of Planning and Investment. GoL (The Government of Laos) (2004) “The National Growth and Poverty Eradication Strategy (NGPES)”, Vientiane, Lao PDR: Committee of Planning and Investment. Hanslow, K. J. (2000) “A General Welfare Decomposition for CGE Models.” GTAP Technical Paper No.19. Hartono, D., Priarsono, D. S., Nguyen, T. D., and Ezaki, M. (2007) “Regional economic integration and its impacts on growth, poverty, and income distribution: The case of Indonesia.” RURDS, 19:2, 138-153. Heinrich, J., and Konan, D. E. (2001) “Prospects for FDI in AFTA.” ASEAN Economic Bulletin, 18:2, 141-160. Hertel, T. W. (ed). (1997) “Global Trade Analysis: Modeling and Applications”, Cambridge University Press. Ianchovichina, E., and Martin,W. (2001) “Trade liberalization in China’s accession to the World Trade Organization.” Policy Research Working Paper No.2623, World Bank.
41
Jianglin, Z. (2007) "Recent Development of China-ASEAN Trade and Economic Relations: From Regional Perspective." Institute of Asia-Pacific Studies, CASS, International Conference on ASEAN-China Trade Relations: 15 Years Development and Prospects. Hanoi. Kawai, M., and Wignaraja, G. (2011) "Asian FTAs: Trends, Prospects and Challenges" Journal of Asian Economics, 22 , 1–22. Kawai, M., and Wignaraja G. (2008) "EAFTA or CEPEA: Which Way Forward?" ASEAN Economic Bulletin, 25:2, 113-139. Kawai, M. (2007) "Evolving Economic Architecture in East Asia." Kyoto Economic Review, 76:1, 9-52. Khan, H., and Tongzon, J. L. (2005) “The challenges of economic integration for transitional economies of Southeast Asia: Cope with revenue losses.” ASEAN Economic Bulletin, 22:3, 266-283. Kyophilavong,P., and Takamatsu,T. (2011) “Laos’ World Trade Organization Accession and Poverty Reduction, in Thirteen Annual Conference on Global Economic Analysis, Penang, Malaysia, June 9-11, 2010. Kyophilavong, P. (2010) “Lao PDR: Coping with Multiple Currencies.” in eds. G. Capannelli and J. Menon, Dealing with Multiple Currencies in Transitional Economies. Manila: Asian Development Bank. Kyophiavong, P., and Toyoda, T. (2008) “Impacts of Foreign Capital Inflows on the Lao Economy.” in Toyda eds., Empirical Research on Trade and Finance in East Asia. Hiroshima Shudo University. Kyophilavong, P. (2006) “Can Laos Gain Benefit by Joining AFTA? How Much? A CGE Model Approach.” Academic Journal of National Universityof Lao, 1:1. Lakatos, C., and Walmsley, T. (2012) “Investment creation and diversion effects of the ASEAN-China free trade agreement.” Economic Modelling, 29. Lee, Y. L. (1978) "Supranationalism in Southeast Asia." Journal of Tropical Geography, 46, 27-36. Lee, Y. L. (1983) "Economic aspects of supranationalism: the case of ASEAN." Political Geography Quarterly, 2:1, 21-30. Leebouapao, L., Insisienmay, S., and Nolintha, V. (2012) "ASEAN–China Free Trade Area and the Competitiveness of Local Industries: A Case Study of Major Industries in the Lao People’s Democratic Republic." ADB Working Paper Series on Regional Economic Integration, No.98, Manila: Asian Development Bank. Manchin, M., and Pelkmans–Balaoing, A. O. (2007) “Rules of Origin and the Web Of East Asian Free Trade Agreements.” World Bank Policy Research Working Paper No.4273.
42
Menon, J. (1999) “Transitional economies in free trade areas: Lao PDR in the ASEAN free trade area.” Journal of the Asia Pacific Economy, 4:2, 340-364. Menon, J. (2012) "Narrowing the Development Divide in ASEAN: The Role of Policy." ADB Working Paper Series on Regional Economic Integration, No.100, Manila: Asian Development Bank. Ministry of Foreign Affairs of Japan (2013) ASEAN-Japan Comprehensive Economic Partnership Agreement. Retrieved March 4, 2013, from Ministry of Foreign Affairs of Japan web site: http://www.mofa.go.jp/policy/economy/fta/asean.html MOIC (Ministry of Industry and Commerce) (2011) Statistics: Ministry of Industry and Commerce. Retrieved March 20, 2011, from Ministry of Commerce web site: http://www.moic.gov.la/statistic.asp Mukhopadhyay, K., and Thomassin, P. (2010) Economic and Environmental Impact of Free Trade Agreement in East and South East Asia. New York: Springer. Narayann, B.G., and Walsmsley, T. (2008) “Global Trade, Assistance, and Production: the GTAP 7 Database”, Department of Agricultural Economics, Purdue University: Center for Global Trade Analysis. NSC (National Statistics Centre) and UNDP (United Nations Development Programme) (2006) “International Trade and Human Development: Lao PDR 2006.” The Third Lao PDR National Human Development Report, Vientiane Capital, Lao PDR: NSC; UNDP. Otani, I., and Pham, C. D. (1996) “The Lao People’s Democratic Republic: Systemic Transformation and Adjustment.” Occasional Paper No.137, Washington DC: International Monetary Fund. Ozeki, H. (2008) "Development of De Facto Economic Integration in East Asian Trade. In H. Soesastro." Deepening Economic Integration - The ASEAN Economic Community and Beyond, 24-44. Park, I. (2009) “Regional trade agreements in East Asia: Will they be sustainable?” Asian Economic Journal, 23:2, 169-194. Park, I. (2006) “East Asian regional trade agreements: Do they promote global free trade?” Pacific Economic Review, 11:4, 547-568. Plummer, M. G. (2006) "ASEAN-EU economic relationship: integration and lessons for the ASEAN economic community." Journal of Asian Economics, 17, 427-447. Ravallion, M. (2006) “Looking beyond average in the trade and poverty debate” World Development, 34:8, 1374-1392. Ravallion, M., and Lokshin, M. (2008) “Winners and Losers from Trade Reform in Morocco. In The impact of Macroeconomic Policies on Poverty and Income Distribution: Macro-Micro Evaluation Techniques and Tools”, Bourguignon, Bussolo, and Silav, eds. Washington DC, USA: World Bank.
43
Stone, S., and Strutt, A. (2009) “Transportation Infrastructure and Trade Facilitation in the Greater Mekong Subregion.” ADBI Working Paper No.130, Tokyo: Asian Development Bank Suvannaphakdy, S. (2013) “An Empirical Study of Trade and Foreign Direct Investment in Laos.” Unpublished doctoral dissertation, Hiroshima: Hiroshima Shudo University. War, P. (2006) “The Gregory Thesis Visits the Tropics.” The Economic Record, 82:257, 177-194. Warr, P., and Menon, J. (2006) “Does Road Improvement Reduce Poverty? A General Equilibrium Analysis for Lao PDR.” ADB Working Paper (Draft), Asian Development Bank. Warr, P. (2010). “Road and poverty in rural Laos: An econometric analysis.” Pacific Economic Review, 15(1), 152-169. Winter, L.A. (2004) “Trade Liberalization and Economic Performance: an Overview.” The Economic Journal, 114. World Bank (2008) Lao PDR Economic Monitor. Vientiane, Lao PDR: World Bank. World Bank (2009) Lao PRD: Recent Economic Development. World Bank Vientiane Office. Laos World Bank and DOS (2009) Poverty in Lao PDR 1992/3-2007/8, World Bank, Washington DC and Department of Statistics, Vientiane, Laos. World Bank (2010). Development with a Rapidly Expanding Natural Resources Sector: Challenges and Policy Options for Laos, the World Bank.
Appendix
1. The regions in the model
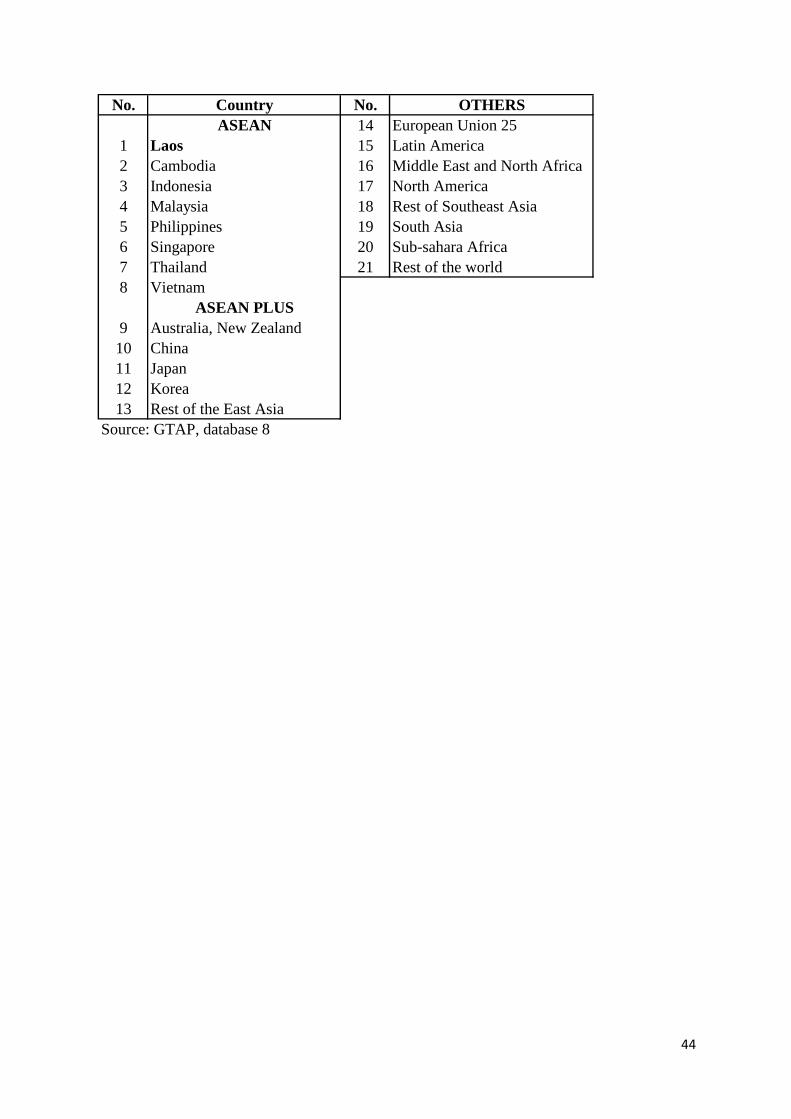
44
No. Country No. OTHERSASEAN 14 European Union 25
1 Laos 15 Latin America2 Cambodia 16 Middle East and North Africa3 Indonesia 17 North America4 Malaysia 18 Rest of Southeast Asia5 Philippines 19 South Asia6 Singapore 20 Sub-sahara Africa7 Thailand 21 Rest of the world8 Vietnam
ASEAN PLUS9 Australia, New Zealand
10 China11 Japan12 Korea13 Rest of the East Asia
Source: GTAP, database 8
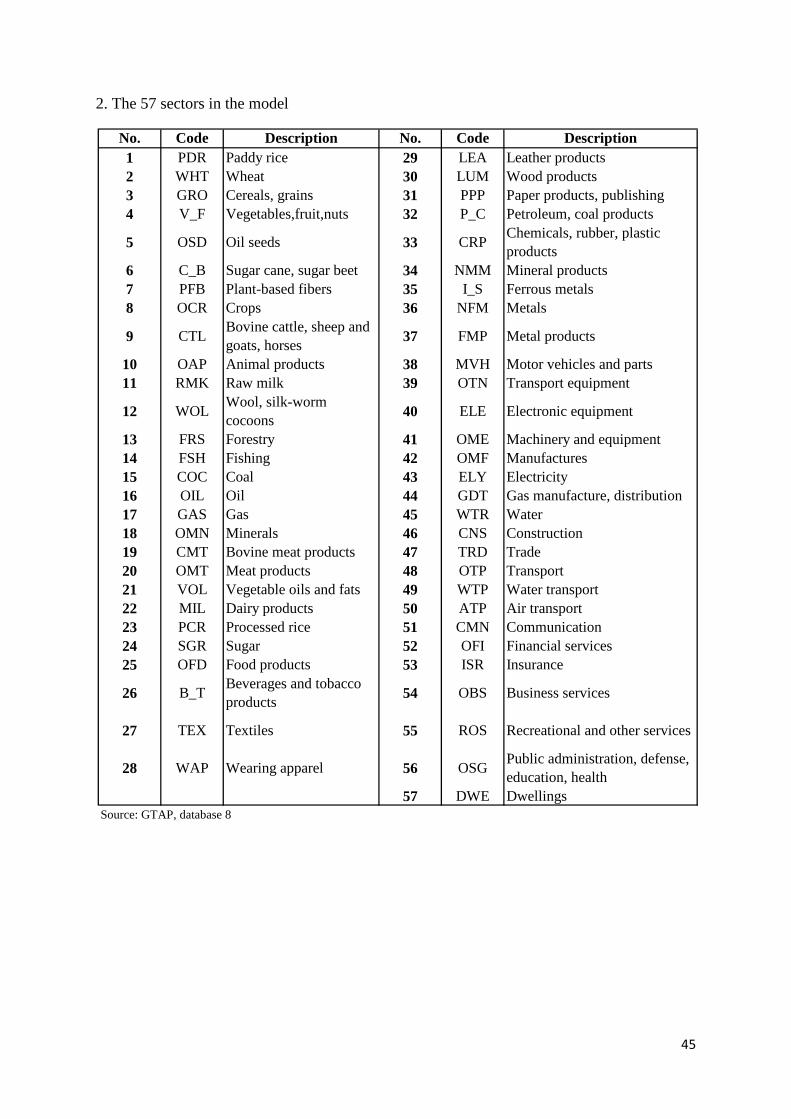
45
2. The 57 sectors in the model
No. Code Description No. Code Description1 PDR Paddy rice 29 LEA Leather products2 WHT Wheat 30 LUM Wood products3 GRO Cereals, grains 31 PPP Paper products, publishing4 V_F Vegetables,fruit,nuts 32 P_C Petroleum, coal products
5 OSD Oil seeds 33 CRP Chemicals, rubber, plastic products
6 C_B Sugar cane, sugar beet 34 NMM Mineral products7 PFB Plant-based fibers 35 I_S Ferrous metals8 OCR Crops 36 NFM Metals
9 CTL Bovine cattle, sheep and goats, horses 37 FMP Metal products
10 OAP Animal products 38 MVH Motor vehicles and parts11 RMK Raw milk 39 OTN Transport equipment
12 WOL Wool, silk-worm cocoons 40 ELE Electronic equipment
13 FRS Forestry 41 OME Machinery and equipment14 FSH Fishing 42 OMF Manufactures15 COC Coal 43 ELY Electricity16 OIL Oil 44 GDT Gas manufacture, distribution17 GAS Gas 45 WTR Water18 OMN Minerals 46 CNS Construction19 CMT Bovine meat products 47 TRD Trade20 OMT Meat products 48 OTP Transport21 VOL Vegetable oils and fats 49 WTP Water transport22 MIL Dairy products 50 ATP Air transport23 PCR Processed rice 51 CMN Communication24 SGR Sugar 52 OFI Financial services25 OFD Food products 53 ISR Insurance
26 B_T Beverages and tobacco products 54 OBS Business services
27 TEX Textiles 55 ROS Recreational and other services
28 WAP Wearing apparel 56 OSG Public administration, defense, education, health
57 DWE DwellingsSource: GTAP, database 8
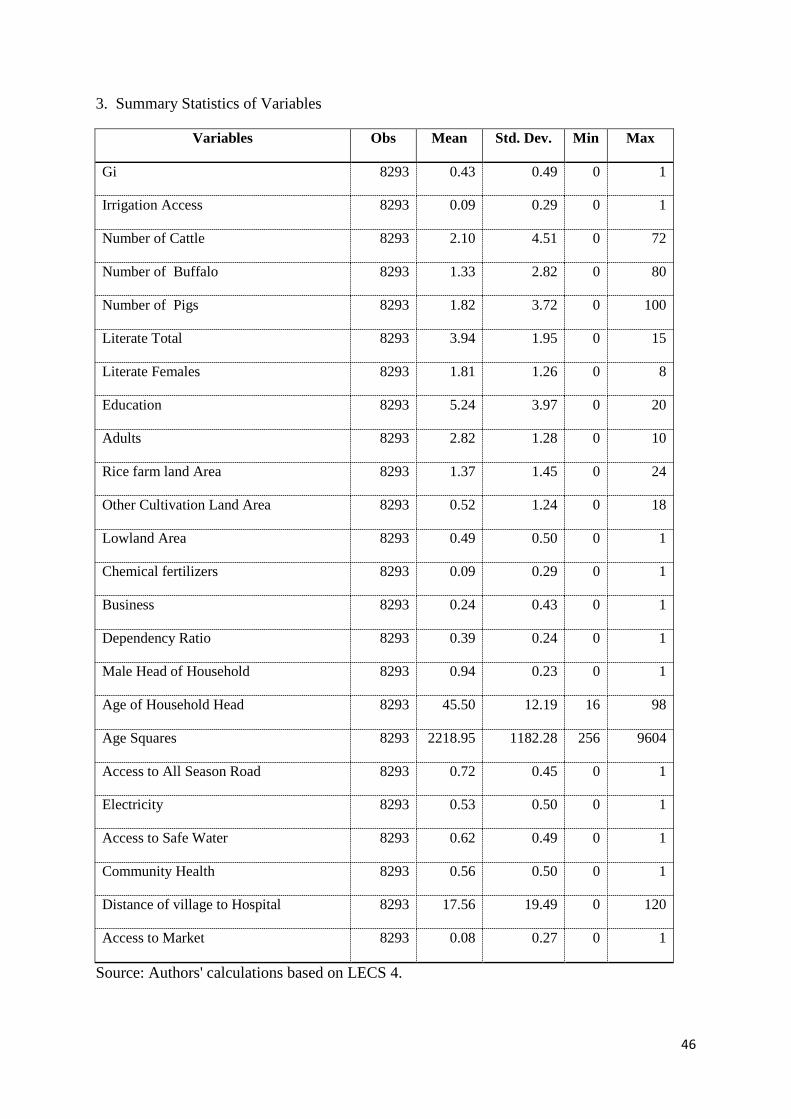
46
3. Summary Statistics of Variables
Variables Obs Mean Std. Dev. Min Max
Gi 8293 0.43 0.49 0 1
Irrigation Access 8293 0.09 0.29 0 1
Number of Cattle 8293 2.10 4.51 0 72
Number of Buffalo 8293 1.33 2.82 0 80
Number of Pigs 8293 1.82 3.72 0 100
Literate Total 8293 3.94 1.95 0 15
Literate Females 8293 1.81 1.26 0 8
Education 8293 5.24 3.97 0 20
Adults 8293 2.82 1.28 0 10
Rice farm land Area 8293 1.37 1.45 0 24
Other Cultivation Land Area 8293 0.52 1.24 0 18
Lowland Area 8293 0.49 0.50 0 1
Chemical fertilizers 8293 0.09 0.29 0 1
Business 8293 0.24 0.43 0 1
Dependency Ratio 8293 0.39 0.24 0 1
Male Head of Household 8293 0.94 0.23 0 1
Age of Household Head 8293 45.50 12.19 16 98
Age Squares 8293 2218.95 1182.28 256 9604
Access to All Season Road 8293 0.72 0.45 0 1
Electricity 8293 0.53 0.50 0 1
Access to Safe Water 8293 0.62 0.49 0 1
Community Health 8293 0.56 0.50 0 1
Distance of village to Hospital 8293 17.56 19.49 0 120
Access to Market 8293 0.08 0.27 0 1
Source: Authors' calculations based on LECS 4.
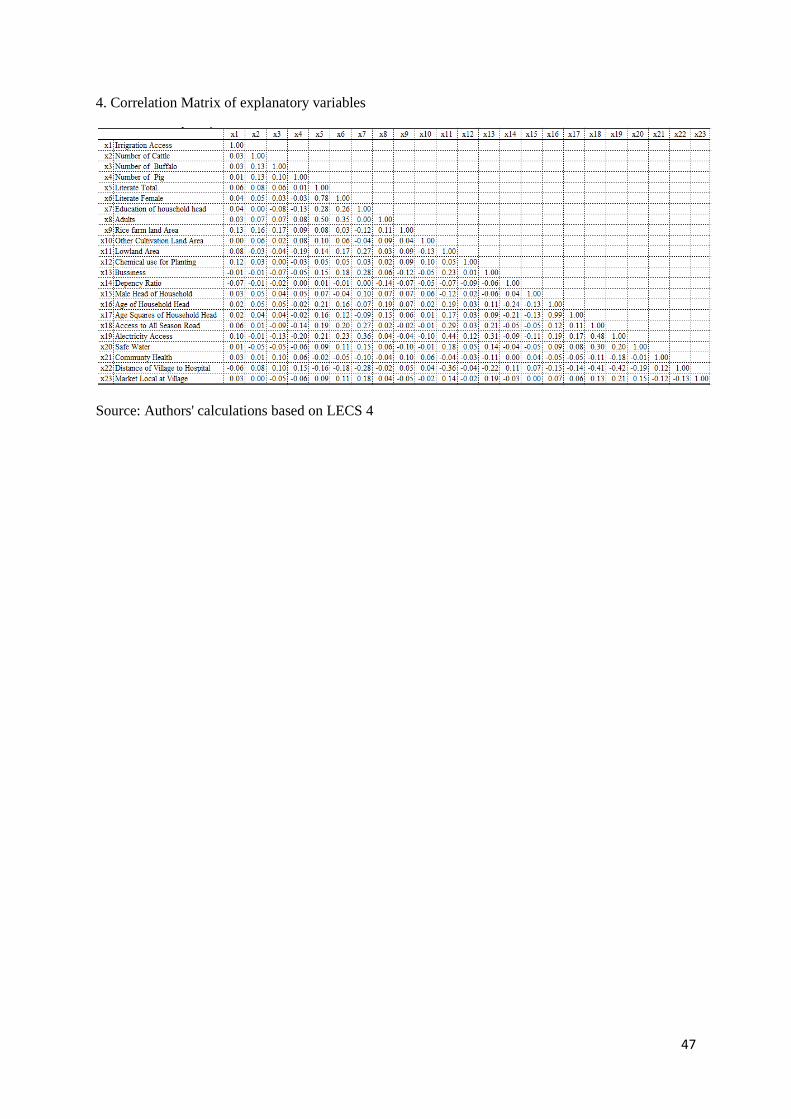
47
4. Correlation Matrix of explanatory variables
Source: Authors' calculations based on LECS 4