Embed Size (px)
Citation preview

INSPECTION FROM CAD MODEL USING 3D PROFILOMETRYMACHINED PARTS
Revised byJOCELYN ESPARZA
Author:DUANJIE LI, PhD

INTRODUCTIONThe demand for precision machining able to create complex geometries has been on the rise across a spectrum of industries. From aerospace, medical and automobile, to tech gears, machinery and musical instruments, the con�nuous innova�on and evolu�on push expecta�ons and accuracy standards to new heights. Consequently, we see the rise of the demand for rigorous inspec�on techniques and instruments to ensure the highest quality of the products.
IMPORTANCE OF 3D NON-CONTACT PROFILOMETRY FOR PARTS INSPECTION
Comparing proper�es of machined parts to their CAD models is essen�al to verify tolerances and adherence to produc�on standards. Inspec�on during the service �me is also crucial as wear and tear of the parts may call for their replacement. Iden�fica�on of any devia�ons from the required specifica�ons in a �mely manner will help avoid costly repairs, produc�on halts and tarnished reputa�on.
Unlike a touch probe technique, the NANOVEA Op�cal Profilers perform 3D surface scans with zero contact, allowing for quick, precise and non-destruc�ve measurements of complex shapes with the highest accuracy.

MEASUREMENT OBJECTIVEIn this application, we showcase NANOVEA HS2000, a 3D Non-Contact Profiler with a high-speed sensor, performing a comprehensive surface inspection of dimension, radius, and roughness.
All in under 40 seconds.
HS2000
CAD MODEL
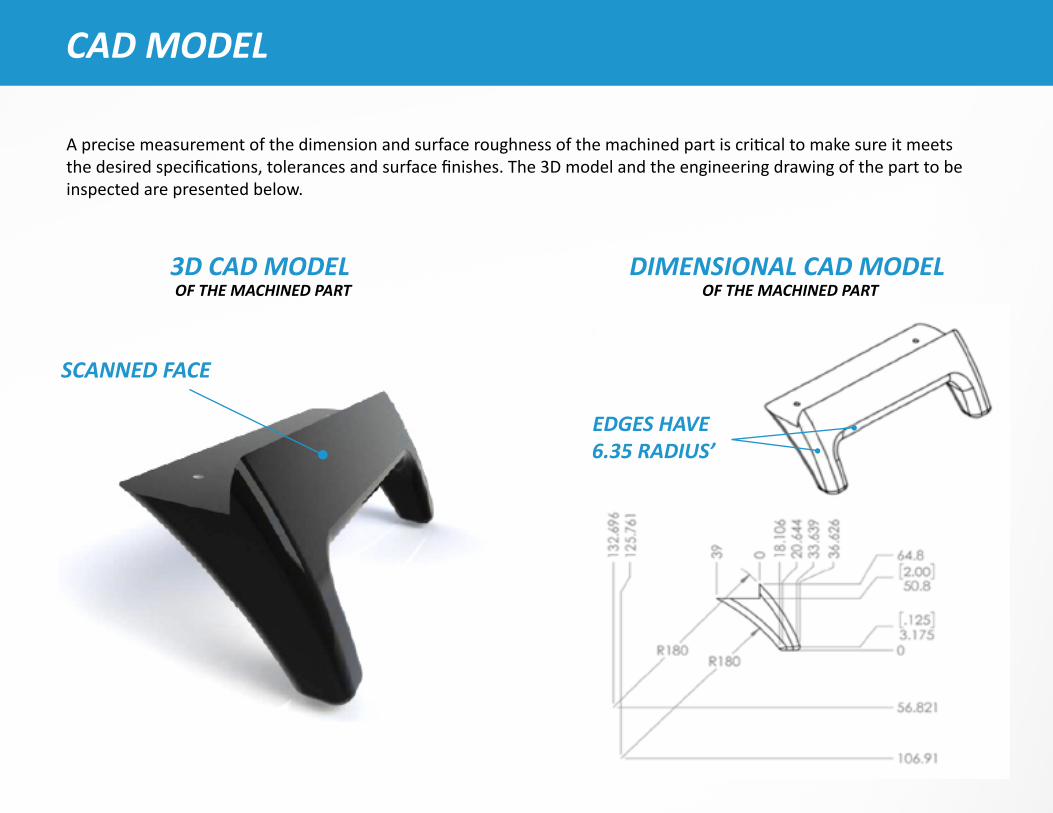
3D CAD MODEL OF THE MACHINED PART
A precise measurement of the dimension and surface roughness of the machined part is cri�cal to make sure it meets the desired specifica�ons, tolerances and surface finishes. The 3D model and the engineering drawing of the part to be inspected are presented below.
SCANNED FACE
DIMENSIONAL CAD MODEL OF THE MACHINED PART
EDGES HAVE 6.35 RADIUS’
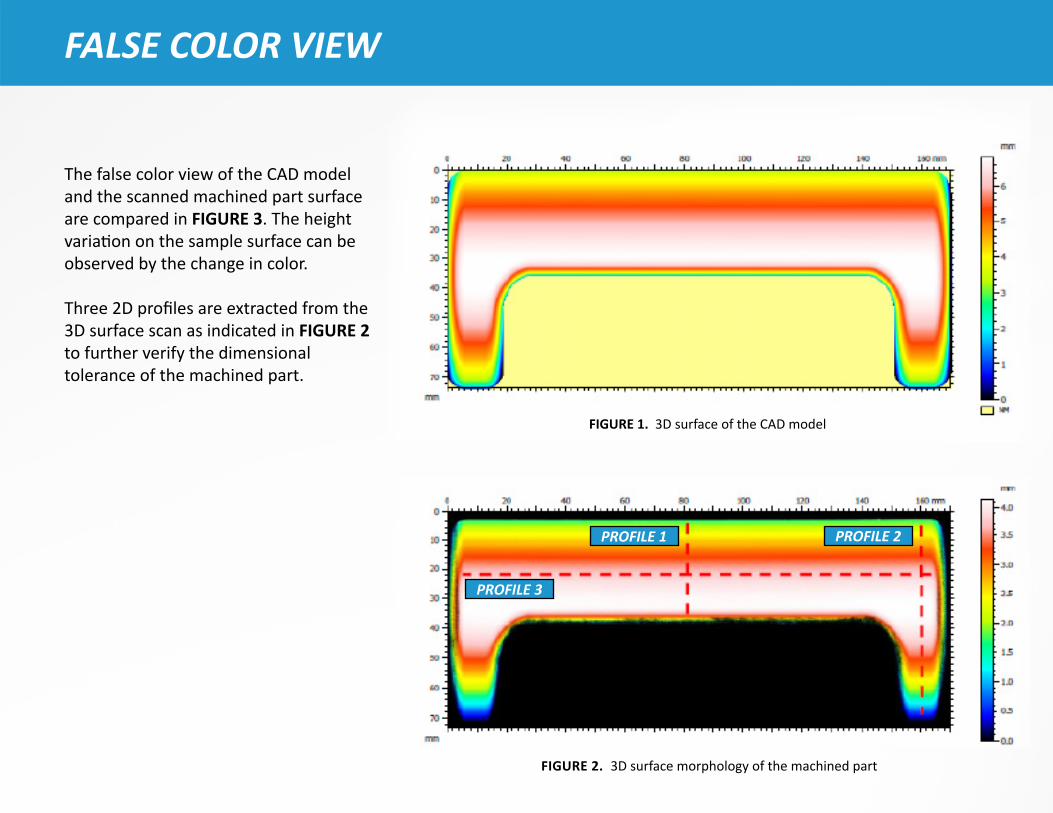
FALSE COLOR VIEW
The false color view of the CAD model and the scanned machined part surface are compared in FIGURE 3. The height varia�on on the sample surface can be observed by the change in color.
Three 2D profiles are extracted from the 3D surface scan as indicated in FIGURE 2 to further verify the dimensional tolerance of the machined part.
FIGURE 2. 3D surface morphology of the machined part
FIGURE 1. 3D surface of the CAD model
PROFILE 3
PROFILE 1 PROFILE 2
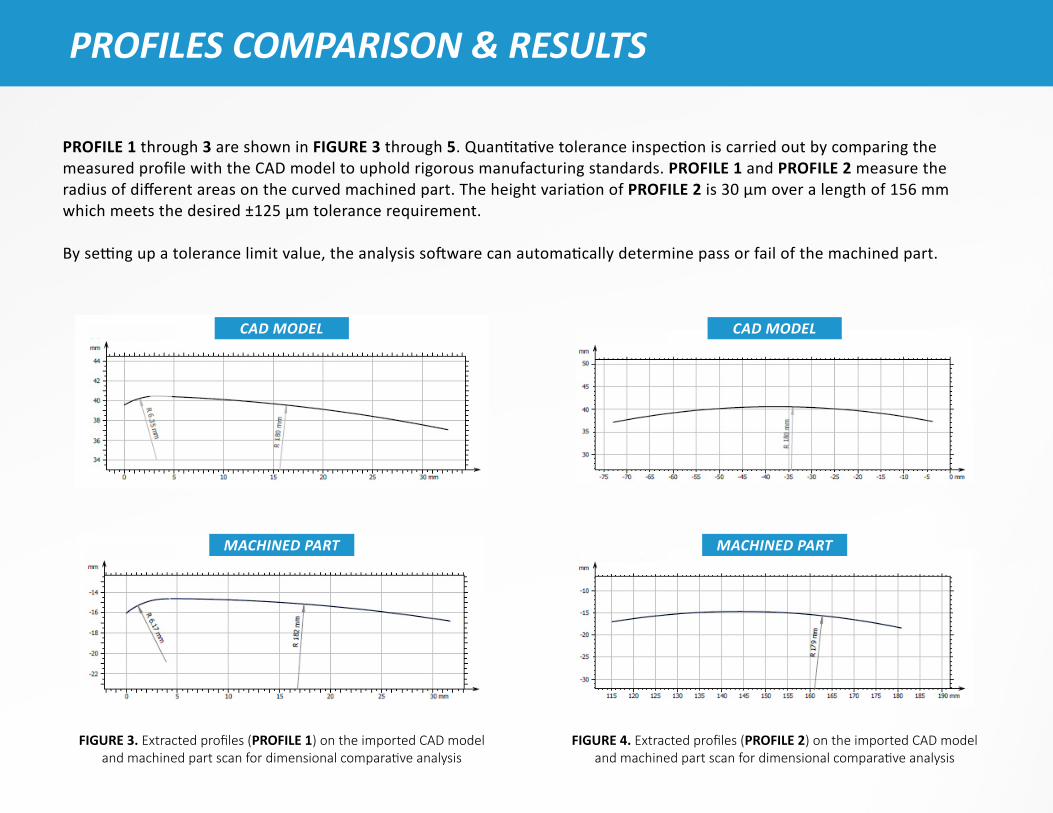
PROFILE 1 through 3 are shown in FIGURE 3 through 5. Quan�ta�ve tolerance inspec�on is carried out by comparing the measured profile with the CAD model to uphold rigorous manufacturing standards. PROFILE 1 and PROFILE 2 measure the radius of different areas on the curved machined part. The height varia�on of PROFILE 2 is 30 µm over a length of 156 mm which meets the desired ±125 µm tolerance requirement.
By se�ng up a tolerance limit value, the analysis so�ware can automa�cally determine pass or fail of the machined part.
PROFILES COMPARISON & RESULTS
FIGURE 4. Extracted profiles (PROFILE 2) on the imported CAD model and machined part scan for dimensional compara�ve analysis
FIGURE 3. Extracted profiles (PROFILE 1) on the imported CAD model and machined part scan for dimensional compara�ve analysis
CAD MODEL
MACHINED PART
CAD MODEL
MACHINED PART
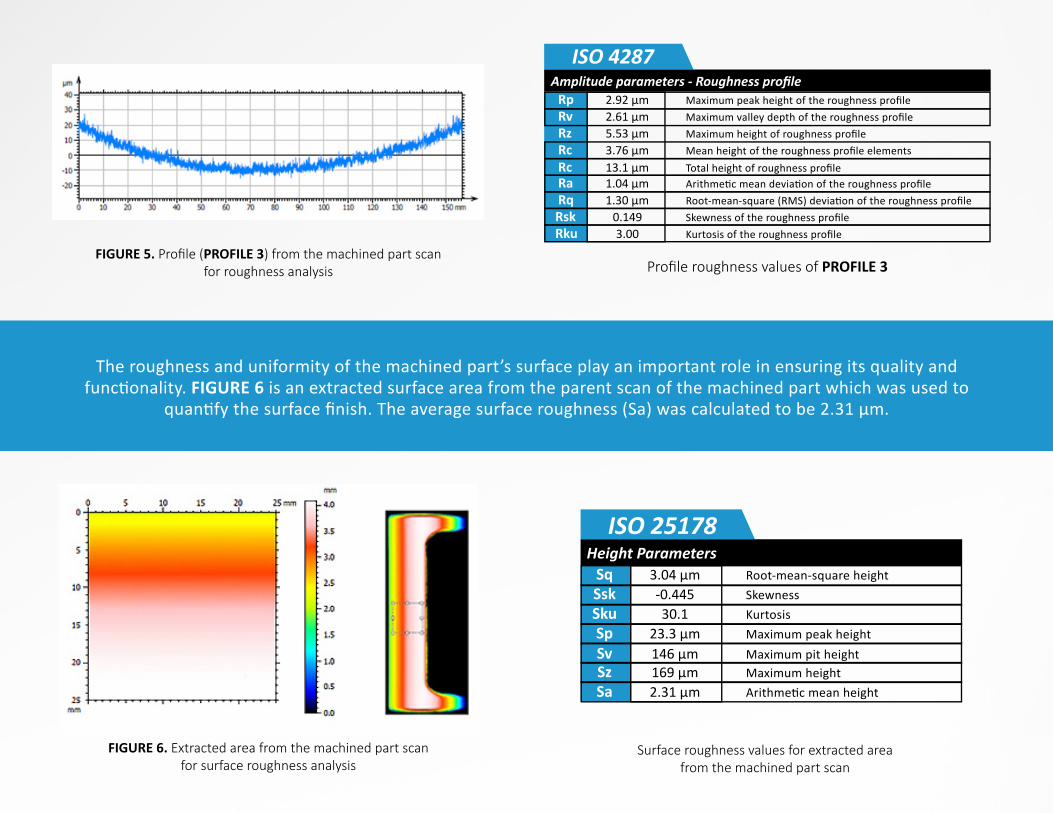
FIGURE 5. Profile (PROFILE 3) from the machined part scan for roughness analysis Profile roughness values of PROFILE 3
Surface roughness values for extracted area from the machined part scan
FIGURE 6. Extracted area from the machined part scanfor surface roughness analysis
ISO 4287Amplitude parameters - Roughness profile
Rp 2.92 µm Maximum peak height of the roughness profileRv 2.61 µm Maximum valley depth of the roughness profileRz 5.53 µm Maximum height of roughness profile
Rq 1.30 µm Root-mean-square (RMS) devia�on of the roughness profileRsk 0.149 Skewness of the roughness profileRku 3.00 Kurtosis of the roughness profile
Rc 3.76 µm Mean height of the roughness profile elementsRc 13.1 µm
1.04 µmRaTotal height of roughness profileArithme�c mean devia�on of the roughness profile
ISO 25178Height Parameters
Sq 3.04 µm Root-mean-square heightSsk -0.445 SkewnessSku 30.1 Kurtosis
Sa 2.31 µm Arithme�c mean height
Sp 23.3 µm Maximum peak heightSv 146 µm
169 µmSzMaximum pit heightMaximum height
The roughness and uniformity of the machined part’s surface play an important role in ensuring its quality and func�onality. FIGURE 6 is an extracted surface area from the parent scan of the machined part which was used to
quan�fy the surface finish. The average surface roughness (Sa) was calculated to be 2.31 µm.
In this study, we have showcased how the NANOVEA HS2000 Non-Contact Profiler equipped with a high speed sensor performs comprehensive surface inspec�on of dimensions and roughness.
High-resolu�on scans enable users to measure detailed morphology and surface features of machined parts and to quan�ta�vely compare them with their CAD models. The instrument is also capable of detec�ng any defects including scratches and cracks. The advanced contour analysis serves as an unparalleled tool not only to determine whether the machined parts sa�sfy the set specifica�ons, but also to evaluate the failure mechanisms of the worn components.
The data shown here represents only a por�on of the calcula�ons possible with the advanced analysis so�ware that comes equipped with every NANOVEA Op�cal Profiler.
CONCLUSION
NANOVEA.COM