Embed Size (px)
Citation preview

This document produced by the Punjab Board of Investment and Trade (PBIT) contains information from sources believed reliable; we do
not guarantee that the matter is accurate or complete. Our Transactions Team compiled this document based on opinions and judgments,
which may vary and be revised at any time without notice. This document is for information only and is not an offer to buy or sell, or
solicitation of any offer to buy or sell and is for information purposes only. It is published for the use of our clients and may not be
reproduced, distributed or published by any person for any purpose whatsoever. Action will be taken for unauthorized reproduction,
distribution or publication. The views expressed in this document are those of Transactions Team at PBIT and do not necessarily reflect
those of PBIT or its senior management.
PITCH BOOK
Pre- Feasibility of Hostel Management
Transaction Department
Punjab Board of Investment & Trade

Table of Content
• Project Brief
• Global Market
• Largest Players in Global Hostel Market
• Local Market Appetite
• Proposed Location
• Project Evaluation
• Annexure

Project Brief
1
Lahore is home to significant buildings including many high profile universities and schools, great pieces of historicalarchitecture and museums. Historically scripted, the Mughal city and its architecture is a badge in Lahore’s credit. It isalso the engineering hub of Pakistan with industries such as car manufacture, heavy machinery, steel, IT, chemicalsand computers are contributing to its 13.2% to Pakistan’s national economy. It is currently ranked 122nd largest in theworld for GDP with an average growth rate of nearly 6%. (Bureau of Statistics 2016)
The purpose of this prefeasibility is to facilitate the potential investors to build a state of the art hostel which couldfocus the working class and students looking for secure and healthy residence in the capital city of Punjab, Lahore.This document will provide them with a financial viability of the business which forms basis of any investmentdecision
According to Punjab developmental statistic, the total student enrollment in Lahore stands at 123,279 in 2016-17. Thebreakdown includes 46 degree colleges and 22 post graduate colleges with the total enrollment of 53,035 and 65,968students respectively in the year of 2016-17.
Number of Institutes, Enrolment and Teaching Staff in All Categories of Colleges in 2016
Division/ District
Intermediate Colleges Degree Colleges Post Graduate Colleges
Number of Institutes
Enrolment Teaching
Staff Number of Institutes
Enrolment Teaching Staff Number
of Institutes
Enrolment Teaching
Staff
The Punjab 932 56,582 1,334 670 503,494 13,149 240 375,222 9,271
Lahore Division 16 4,917 257 83 75,352 2,046 29 87,887 2,347
Lahore 13 4,276 257 46 53,035 1,477 22 65,968 1,995
Source: Bureau of statistics Punjab, Punjab Developmental Statistics
Approximately 4 kanal of land would be required for the establishment of the hostel. This project would havefour types of rooms 4 bed, 3 bed, 2 bed and 1 bed. The hostel holds a complete range of facilities includingfood mess, leisure area, café & barber shop and would be able to carter the 600 people in the hostel whichwould be open for visitors. Living in shared room would cost a person PKR 6,500 and single room will cost PKR12,000.
According to assumption derived in the pre-feasibility, the maximum room charge for a single student/one bedroom would not cost more than PKR 23,000 which includes mess charges of approximately PKR 7,000 to PKR9,000 and other services of approx. PKR 2,000 (barber, internet, leisure spending). This maximum room rentwill go down as number of bed per room increases and approaches PKR 17,500 minimum for a 4 bed room.
Beds Room Rent No. of Person
4 PKR – 6500 243
3 PKR –7500 186
2 PKR –9500 115
1 PKR –12000 54
Total 600
Global Market
2
Global MarketThere are more than 22,000 properties
registered at Hostel world, spread across more
than 2,600 cities in all the world.
Europe has almost 1,000 cities with hostels,
however it is in Asia, where the largest
presence of hostels is felt, with more than
7,750 hostels.
“There are 22,000 hostels at
Hostelworld”The governance structure in the hostel
industry is far less complex than in the hotel
industry. Most hostels are independently
owned and operated, and Portugal is no
exception to this rule.
(Source: Phocuswright, Colliers International)
Potential for growth
The integration in chains is scarce, with the major players accounting formerely 8% of the global hostel beds’ supplies (the top 5 hotel chains accountfor 20% of total room supply).
Top hostel chains account for more than 30% of the total revenue, while thetop 5 hotel chains account for around 15% of the global hotel industry revenue.(Source: Phocuswright, Colliers International)
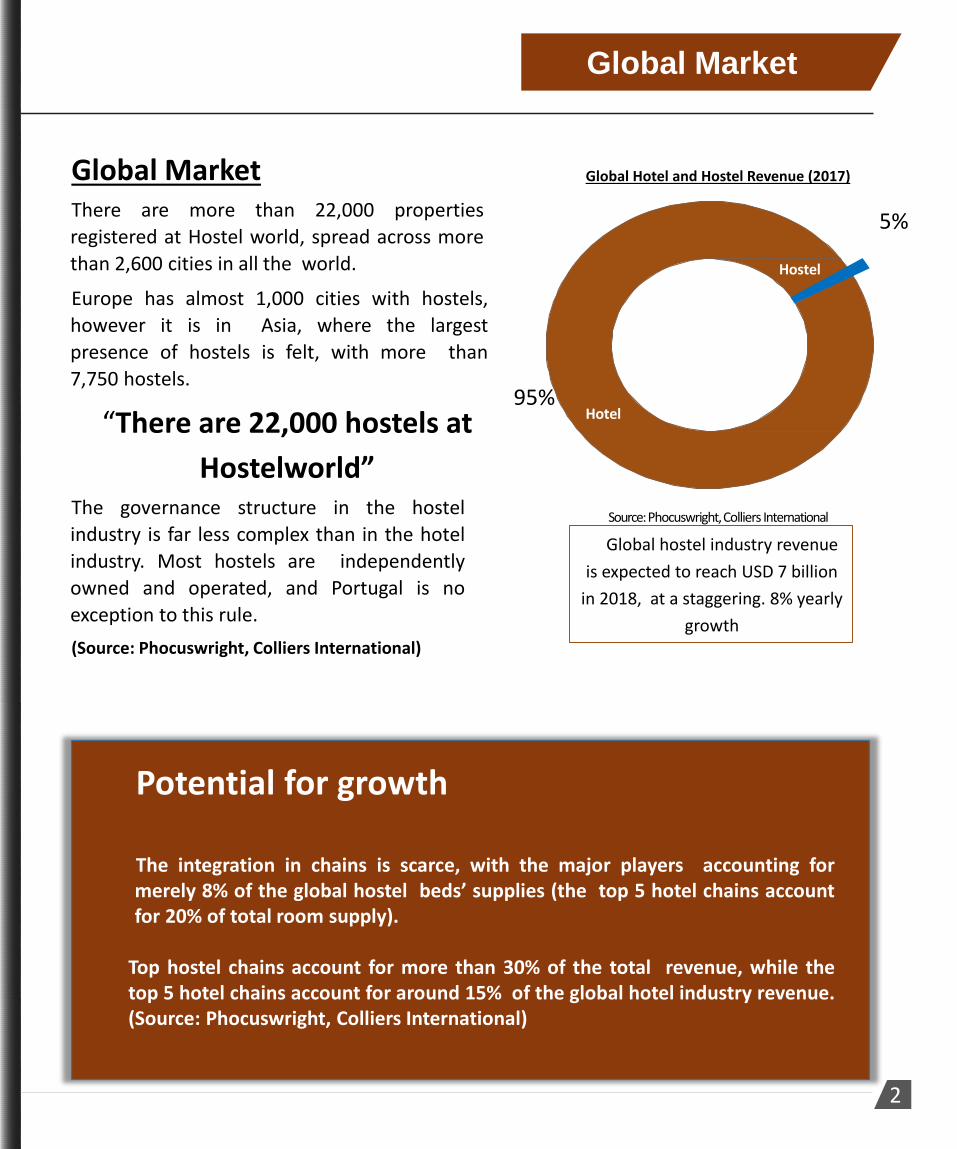
Global Hotel and Hostel Revenue (2017)
Source: Phocuswright, Colliers International
Hotel
Hostel
Global hostel industry revenue
is expected to reach USD 7 billion
in 2018, at a staggering. 8% yearly
growth
5%
95%
Largest Player in Global Market
3
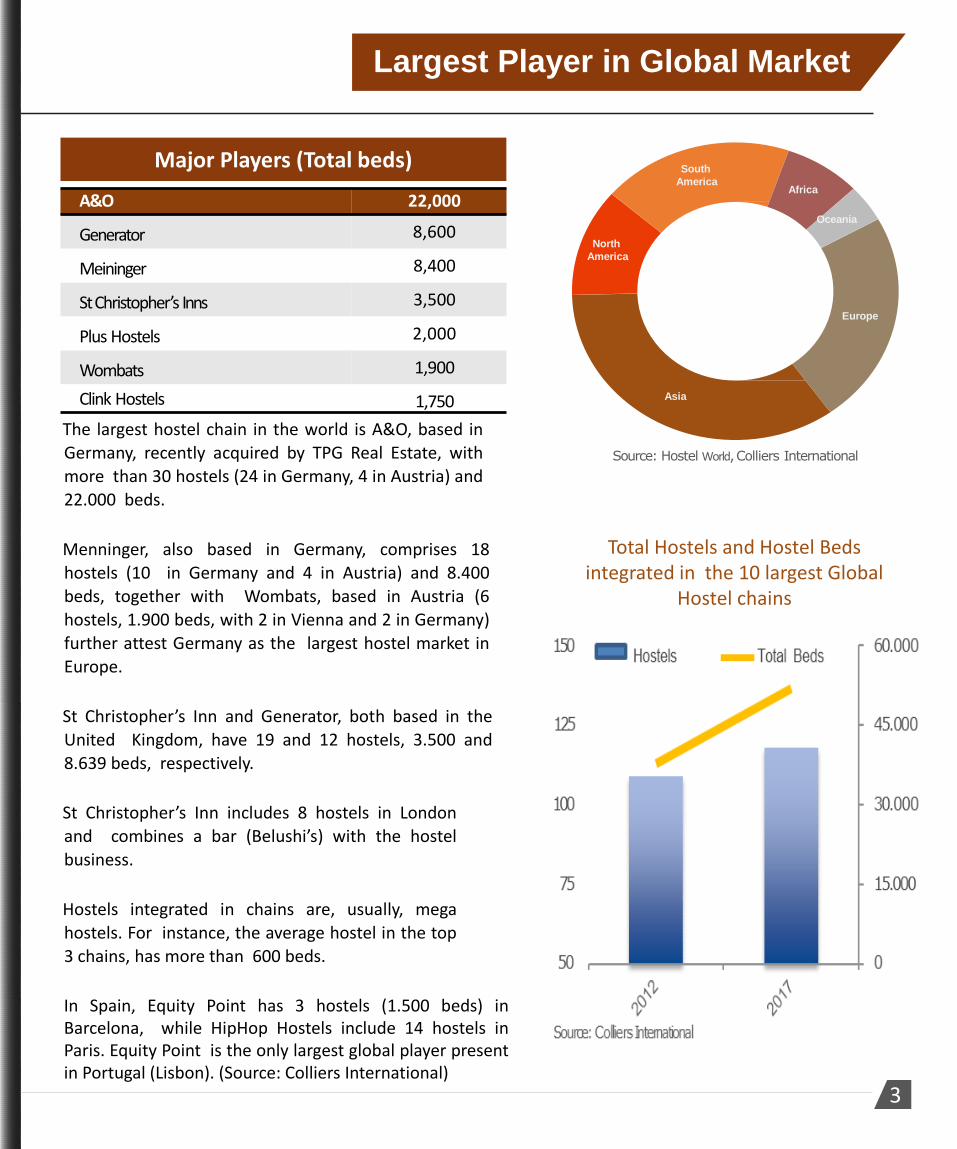
The largest hostel chain in the world is A&O, based in
Germany, recently acquired by TPG Real Estate, with
more than 30 hostels (24 in Germany, 4 in Austria) and
22.000 beds.
Menninger, also based in Germany, comprises 18
hostels (10 in Germany and 4 in Austria) and 8.400
beds, together with Wombats, based in Austria (6
hostels, 1.900 beds, with 2 in Vienna and 2 in Germany)
further attest Germany as the largest hostel market in
Europe.
St Christopher’s Inn and Generator, both based in the
United Kingdom, have 19 and 12 hostels, 3.500 and
8.639 beds, respectively.
St Christopher’s Inn includes 8 hostels in London
and combines a bar (Belushi’s) with the hostel
business.
Hostels integrated in chains are, usually, mega
hostels. For instance, the average hostel in the top
3 chains, has more than 600 beds.
In Spain, Equity Point has 3 hostels (1.500 beds) inBarcelona, while HipHop Hostels include 14 hostels inParis. Equity Point is the only largest global player presentin Portugal (Lisbon). (Source: Colliers International)
Source: Hostel World, Colliers International
Europe
Asia
North
America
South
AmericaAfrica
Oceania
Total Hostels and Hostel Beds integrated in the 10 largest Global
Hostel chains
Major Players (Total beds)
A&O 22,000
Generator 8,600
Meininger 8,400
St Christopher’s Inns 3,500
Plus Hostels 2,000
Wombats 1,900
Clink Hostels 1,750

REASONS WHY EXPATS LOVE LAHORE
• JOB OPPORTUNITY
• TOP UNIVERSITIES
• FOOD
• WOMEN EMPOWERMENT
• SHOPPING MALLS
• HISTORICAL SITES
• BEST HEALTHCARE
• WINTER WEATHER
• LIFE GOES ON

Local Market Appetite
4
Total Student Enrollments in 2016
Division/ District Enrolment Male Female Teaching Staff
The Punjab 935,298 81,031 87,125 23,754
Lahore Division 168,156 81,031 87,125 4,650
Lahore 123,279 57,473 65,806 3729
For the proposed project, we have targeted university students stationed at Lahore division and cityspecifically. The total enrolment in 2016 for all colleges and universities was recorded 123,279 in2016. We have targeted male students which have a strength of more than 50,000 in Lahore. Inmarket research, we have reached to conclusion that approximately 30% to 40% student enrolledare non native of Lahore and accommodated in either university as private guest / hostel. Thestudent accommodated in private hostel are looking for better facilities to which we consider ourtarget for the proposed business. On estimate, around 10,000 students are continuously looking forhostel near by there institutes. The following list of institutes/ universities are located near to ourproposed location. (refer next slide)
Perspective Clients
Universities 2015 2016 e 2017 e 2018 f
Total Male Female Male Female Male Female Male Female
University of health sciences 27,059 10,086 16,973 10,489 17,651 10,908 18,356 11,343 19,089
University of Lahore 13,793 10,292 3,501 11,885 4,044 13,522 4,600 15,206 5,173
University of Central Punjab 7,551 5,052 2,499 5,664 2,803 6,179 3,057 6,661 3,296
University of Education (Township Campus)
5,984 4,488 1,496 5,305 1,769 6,259 2,086 7,342 2,448
University of Management & Technology
7,326 5,335 1,991 5,675 2,119 5,998 2,239 6,264 2,337
The Minhaj University, Model Town, Lahore
3,948 2,394 1,554 2,442 1,585 2,492 1,617 2,541 1,650
University of South Asia 3,162 2,730 432 2,894 458 3,238 512 3,416 540
Preston University, Lahore Campus 1,883 1,597 286 1,678 300 1,762 316 1,851 332
Beaconhouse National University Lahore
1,907 1,063 844 1,095 869 1,128 895 1,161 922
Imperial College of Business studies, Lahore
1,281 1,176 105 1,234 110 1,295 116 1,360 121
Source: developmental Statistics of Punjab 2015-2016
Proposed Location
5
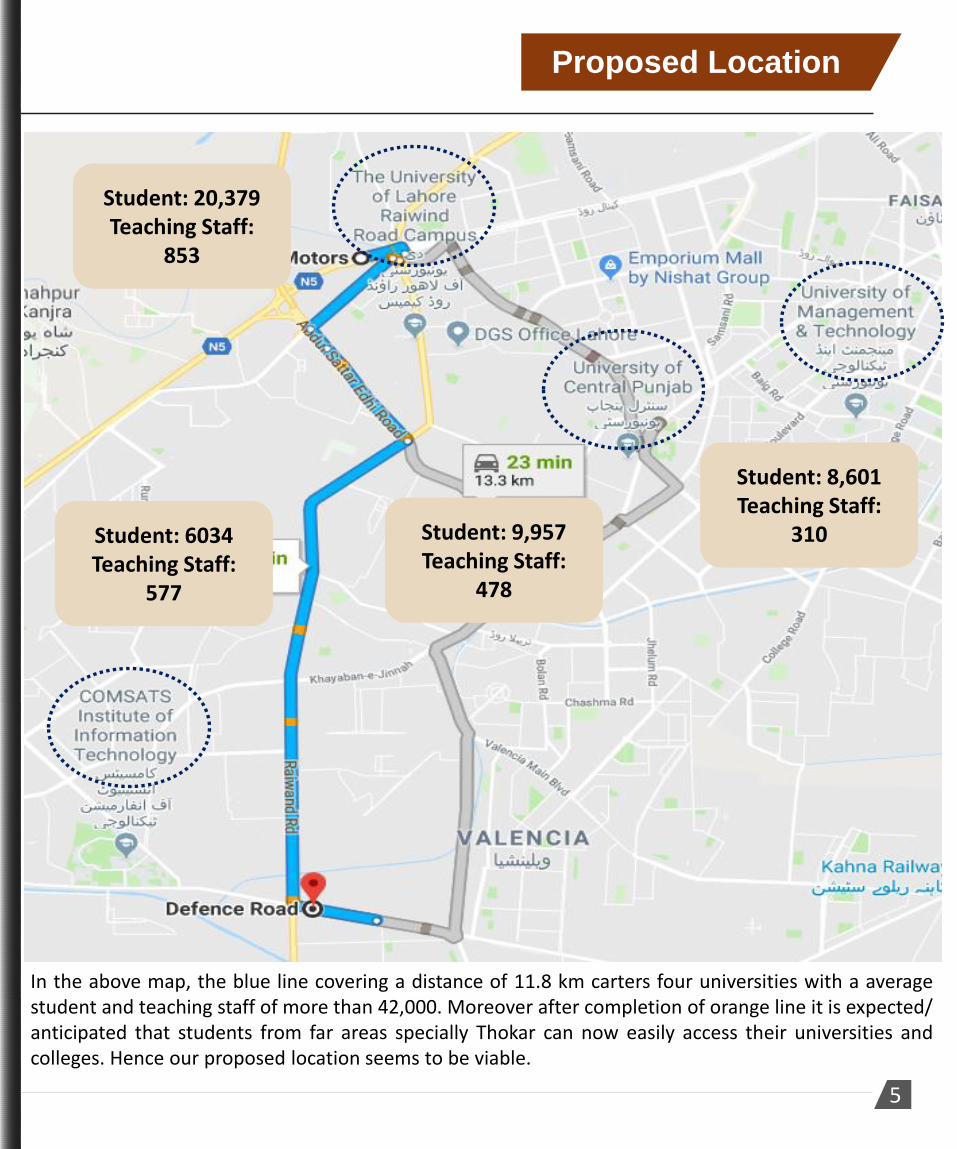
Student: 20,379 Teaching Staff:
853
Student: 8,601 Teaching Staff:
310Student: 9,957Teaching Staff:
478
Student: 6034Teaching Staff:
577
In the above map, the blue line covering a distance of 11.8 km carters four universities with a averagestudent and teaching staff of more than 42,000. Moreover after completion of orange line it is expected/anticipated that students from far areas specially Thokar can now easily access their universities andcolleges. Hence our proposed location seems to be viable.

Project Evaluation
6
Description Details Remarks
Total Equity (60%) PKR 149,106,675 Project Financing
Bank Loan (40%) PKR 99,404,450 Project Financing
Tenure of the loan 10 years
Cost of Debt/ Bank Loan (Kd)
14%Annual Markup (Long
Term Loan)
Cost of Equity (R) 9.75% + 5% = 14.75%
WACC/ Discount Rate 14.45%WACC= 60%(14.75%)+
40%(14%)
Project setup cost
To build a state of the art hostel, the project will require an estimated total cost of PKR 248 million ($ 2.1 million). This project cost includes the working capital of PKR 81 million.
Fixed Cost Cost Useful life
Land (A) PKR 100,000,000
Building and Infrastructure (B)
PKR 121,500,000 10 years
Office Equipment (C) PKR 19,000,000 05 years
Fixture & Fitting (D) PKR 8,011,125 05 years
Total – PKR PKR 248,511,125
General Assumption The Fixed assets require for this project are suggested above along with there useful life. There are three fixed assets which will be depreciated over their useful life.

Project Evaluation
7
Project Valuation
FCFF is the cash flow available to the suppliers ofcapital after all operating expenses are paid withworking and fixed capital investment are made.Considering the cash flow projection prepared aftertaking into account project setup cost, keyassumption and operating results, the project isexpected to generate IRR 26.5% and NPV of PKR184,520,012. The estimated payback period of theproject is 5 years.
PKR Terminal
Value
Terminal Growth Rate
5.71%GDP
Growthrate- FY 18
Terminal WACC
14.45% WACC
EstimatedTerminal Free cash flow
72,174,0052028-2029
Estimated Terminal Value
872,942,113 2028-2029
NPV of Terminal Value
259,085,5982028-2029
Growth of 10% in revenue of per room over the years
Years 2019-2020 2020 - 2021 2021-2022 2022- 2023 2023-2024 2024-2025 2025-2026 2026-2027 2027-2028 2028-2029
4 bed 6,500 7,150 7,865 8,652 9,517 10,468 11,515 12,667 13,933 15,327
3 bed 7,500 8,250 9,075 9,983 10,981 12,079 13,287 14,615 16,077 17,685
2 bed 9,563 10,519 11,571 12,728 14,000 15,401 16,941 18,635 20,498 22,548
1 bed 12,000 13,200 14,520 15,972 17,569 19,326 21,259 23,385 25,723 28,295
Based on the fixed & variable cost and after takenanalyzing the growth assumption (2019-2020 to2028-2029), the monthly room rent PKR – year onyear is calculated as under :-
Project Valuation
PKR
Free Cash Flow
2019-20 2020-2021 2021-2022 2022-2023 2023-2024 2024-2025 2025-2026 2026-2027 2027-2028 2028-2029 Terminal
Year
Net Income 707,864 4,369,034 14,130,665 19,170,410 24,741,141 36,197,237 42,909,569 50,355,586 58,619,435 67,795,288 -
Add- Depreciation 10,262,225 10,262,225 10,262,225 10,262,225 10,262,225 4,860,000 4,860,000 4,860,000 4,860,000 4,860,000 -
Less- WC Changes (8,420,000) (842,000) (926,200) (1,018,820) (1,120,702) (1,232,772) (1,356,049) (1,491,654) (1,640,820) (1,804,902) -
Add-Interest Expense 13,531,196 12,801,897 11,963,683 11,000,288 9,893,017 8,620,385 7,157,696 5,476,565 3,544,371 1,323,619 -
less- Capital Expenditure
(248,511,125) - - - - - - - - - -
Freecash flow (232,429,841) 26,591,155 35,430,372 39,414,103 43,775,682 48,444,850 53,571,215 59,200,497 65,382,986 72,174,005 872,942,113
NPV of Free Cash Flow (232,429,841) 23,233,862 27,048,558 26,290,827 25,513,482 24,669,971 23,836,183 23,015,201 22,209,479 21,420,945 259,085,598

Assumptions
8
(A) LandKanal per Sq. Feet per sq. ft. cost Cost
1 4500 5,556 PKR 25,000,000 4 18000 5,556 PKR 100,000,000
(B) Building and Infrastructure Description
Number of Floor 6
Total Area of Hostel per floor 18,000 sq. ft. 4 kanal
Covered Area 13,500 sq. ft. 75% covered area
Uncovered Area / vacant area 4,500 sq. ft. 25% vacant area
Total covered area 6 floors 81,000 sq. ft. (13,500/floor) *(6 floors)
Construction cost per sq. ft. PKR 1,500 Transaction team research
Total Infrastructure cost PKR
121,500,000 covered area * construction cost
(C) Office Equipment Description
Tables and office PKR 1,000,000 reception, computer room, cash room
Camera PKR 3,000,000 500,000/floor *6 floors
Lock System PKR 2,500,000 (10,000/room)*235 total rooms
AC PKR 12,500,000 1.5 ton: 123*70,000/ AC, 1 ton:
112*40,000/AC
Total O E PKR 19,000,000
According to Lahore Development Authority (LDA) covered area could be 75% of thetotal available land. Security is the most important determinant of successful hostel.Building 6 floors can accommodate approximately 600 people which is our baseassumption.

Assumptions
9
(D) Fixture and FittingNumber Cost Total Description
Fixture & Furniture
Beds 599 7,000 4,189,500 Transaction t Research
Mattress 599 4,000 2,394,000 Transaction t Research
Kitchen cost
Fridge 30 40,000 1,215,000 Transaction t Research
Microwave 30 7,000 212,625 Transaction t Research
Total F&F 8,011,125
Revenue Assumption: Number of Room
Units No. of Ppl. in a room
Total No. of Ppl. % occupied Total sq. feet= % occupied *
total sq. feetRoom size
Four bed 61 4 243 30% 24,300 400Three bed 62 3 186 23% 18,630 300Twin bed 58 2 115 16% 12,960 225Single 54 1 54 8% 6,480 120Kitchen 30 3% 2,430 80Vacant Area Lobby
20% 16,200
Total 234 598 100% 81,000
The total covered area of the hostel with 6 floors is estimated to 81,000 sq. ft. whichincludes a range of single bed to four bed room. The room size allocated represents20 ft*20 ft, 17.5*17.25 ft, 15*15 sq. ft, 12*10 sq ft for Four bed, three bed, twin bedand single bed respectively.
According to our in house research we have estimated 599 beds and mattress each,and 30 microwaves and 30 fridge for each kitchens (30 total).

Assumptions
10
Revenue Aug-Nov Dec-March Apr-July
Max No. of
capacity
O. Rate
Rent/ person
Revenue(000)
O. RateRent
/personRevenue
(000)O.
RateRent /person
Revenue (000)
Four bed
244 75% 6,500 1,189 100% 6,500 1,586 75% 6,500 1,189
Three bed
186 75% 7,500 1,046 100% 7,500 1,395 75% 7,500 1,046
Twin bed
116 75% 9,500 826 100% 9,500 1,102 75% 9,500 826.5
Single bed
54 75% 12,000 486 100% 12,000 648 75% 12,000 486
Total 600 3,548 4,731 3,548.5 Total Revenue for the year PKR 49,691
Other revenue year-1 Description
Branding 2,400,000 Market Research
Food Mess 2,859,813 No. of occupants (6,733) *food price (PKR 100) *
(50%) * (360 days)
Barber shop 4,779,750 No. of occupants (6,733) *cutting price (PKR 200) *
(50%) * (360 days)
Leisure 3,304,000 S. tables (6)* Play time available (840)* Revenue/
min (PKR 5) * (360 days)Total 13,343,563 10% growth (yrs. 2-10)
For the first two years, it is assumed that 75% occupancy rate will prevail for 8 months (April toNov), whereas full occupancy of 100% for the remaining 4 months Dec-March). From year 3onwards 100% occupancy rate is considered for 8 months (Aug- Mar) and 75% for the remaining 4months (April - July) which we assumed as vacation. Moreover, the rent per room would increase at10 % on year on year bases.
The branding revenue could be achieved by placing a LED screen on the top of the building. Otherthree revenue sources are directly related to the occupancy rate of the hostel so during calculationof there revenue we have assumed that 50% of the occupancy rate.

Assumptions
11
Staff Salary Description No. of employees Salary/ month Yearly Salary
Hostel Manager 2 100,000 2,400,000 Assistant Manager 2 60,000 1,440,000
Lower Staff 36 20,000 8,640,000
Security Guard 5 20,000 1,200,000
Total salaries 1,140,000 12,480,000 year 1 ( 10%
Growth YOY- 2-10
Electricity- consumption 5 months 7 months Description
Rate/ Unit 16 16 Commercial price/ unitAC (in units) - 142,320
Other (in units) 19,380 19,380 Fan + light + Fridge +
MicrowaveTotal PKR 310,080 PKR 2,587,200
Air Conditioner
Beds RoomsDaily unit consumed
Total
Single and Twin 112 16 1,792 Three & Four 123 24 2,952 Monthly Units consumed 142,320
For cleaning services we have allocated 6 cleaning and maintenance staff for eachfloor.
Commercial price of unit consumed is approx. 16 rps. Major consumer of electricity isAir conditioner we have proposed to install 112 units of 1 ton AC in Single and Twinbed and 123 units of 1.5 ton AC in three to four beds.According to assumptions 19,380 units are projected to during winters and 161,700units in the summer season where AC are operational. The bifurcation of unitsconsumed by AC during summer seasons is provided in the table above.

Assumptions
12
Finance Cost- Amortization Year 1 2 3 4 5
loan amount 98,833,400 93,949,984 88,337,269 81,886,340 74,472,016 Principle payments 4,883,416 5,612,715 6,450,929 7,414,324 8,521,594 Outstanding 93,949,984 88,337,269 81,886,340 74,472,016 65,950,422 Interest amount 13,531,196 12,801,897 11,963,683 11,000,288 9,893,017 long term loan 88,337,269 81,886,340 74,472,016 65,950,422 56,156,196
Current portion of loan
5,612,715 6,450,929 7,414,324 8,521,594 9,794,226
Depreciation
Cost Useful Life Depreciation for
the YearDescription
Building & Infrastructure
121,500,000 25 4,860,000 (121,500,000/25)
Fixture & Furniture 8,011,125 5 1,602,225 (8,011,125/5)Office Equipment 19,000,000 5 3,800,000 (19,000,000/5)
The financial cost for the loan is 14% for a period of 10 years so the monthly payments for thisloan would be PKR 1.534 million and would start after the completion of the infrastructurebuilding is completed.
Finance Cost- AmortizationYear 6 7 8 9 10
Loan Amount 65,950,422 56,156,196 44,899,280 31,961,233 17,090,993
Principle Payments 9,794,226 11,256,916 12,938,047 14,870,241 17,090,993
Outstanding 56,156,196 44,899,280 31,961,233 17,090,993 -
Interest Amount 8,620,385 7,157,696 5,476,565 3,544,371 1,323,619
Long Term Loan 44,899,280 31,961,233 17,090,993 - -
Current Portion of loan
11,256,916 12,938,047 14,870,241 17,090,993 -

Income Statement
13
Years
2019-20
2020-20
21202
1-2022
2022-20
23202
3-2024
2024-20
25202
5-2026
2026-20
27202
7-2028
2028-20
29
Rental R
evenue
47,263,5
00
51,989,8
50
62,907,7
19
69,198,4
90
76,118,3
39
83,730,1
73
92,103,1
91
101,313
,510
111,444
,861
122,589
,347
Other R
evenue
13,343,5
63
14,677,9
19
16,145,7
11
17,760,2
82
19,536,3
10
21,489,9
41
23,638,9
35
26,002,8
28
28,603,1
11
31,463,4
22
Total Re
venue
60,607,0
63
66,667,7
69
79,053,4
29
86,958,7
72
95,654,6
49
105,220
,114
115,742
,126
127,316
,338
140,047
,972
154,052
,769
Less: Exp
enses
staff sal
ary 13,6
80,000
15,0
48,000
16,5
52,800
18,2
08,080
20,0
28,888
22,0
31,777
24,2
34,954
26,6
58,450
29,3
24,295
32,2
56,724
Electrici
ty 19,6
60,800
21,6
26,880
23,7
89,568
26,1
68,525
28,7
85,377
31,6
63,915
34,8
30,307
38,3
13,337
42,1
44,671
46,3
59,138
Depreci
ation
10,262,2
25
10,262,2
25
10,262,2
25
10,262,2
25
10,262,2
25
4,860,00
0
4,860,00
0
4,860,00
0
4,860,00
0
4,860,00
0
Repair a
nd Maint
aince (2
%)2,76
4,978
2,559,73
4
2,354,48
9
2,149,24
5
1,944,00
0
1,846,80
0
1,749,60
0
1,652,40
0
1,555,20
0
1,458,00
0
Interest
13,531,1
96
12,801,8
97
11,963,6
83
11,000,2
88
9,893,01
7
8,620,38
5
7,157,69
6
5,476,56
5
3,544,37
1
1,323,61
9
Total Exp
enses
59,899,1
99
62,298,7
35
64,922,7
65
67,788,3
62
70,913,5
08
69,022,8
77
72,832,5
57
76,960,7
52
81,428,5
37
86,257,4
81
Profit
707,864
4,369,03
4
14,130,6
65
19,170,4
10
24,741,1
41
36,197,2
37
42,909,5
69
50,355,5
86
58,619,4
35
67,795,2
88

Balance Sheet
14
Year
s20
19-20
2020
-2021
2021
-2022
2022
-2023
2023
-2024
2024
-2025
2025
-2026
2026
-2027
2027
-2028
2028
-2029
Land
10
0,000
,000
10
0,000
,000
10
0,000
,000
10
0,000
,000
10
0,000
,000
10
0,000
,000
10
0,000
,000
10
0,000
,000
10
0,000
,000
10
0,000
,000
Build
ing &
Infra
struc
ture
11
6,640
,000
11
1,780
,000
10
6,920
,000
10
2,060
,000
97
,200,0
00
92
,340,0
00
87
,480,0
00
82
,620,0
00
77
,760,0
00
72
,900,0
00
Fixtu
re &
Furn
iture
6,408
,900
4,806
,675
3,204
,450
1,602
,225
-
Offic
e Equ
ipeme
nt
15,20
0,000
11,40
0,000
7,600
,000
3,800
,000
-
Total
23
8,248
,900
22
7,986
,675
21
7,724
,450
20
7,462
,225
19
7,200
,000
19
2,340
,000
18
7,480
,000
18
2,620
,000
17
7,760
,000
17
2,900
,000
Curre
nt As
sets
Cash
177,6
73
8,748
,079
26,67
3,662
48,19
7,384
74,13
5,108
104,7
99,66
6
140,6
54,02
1
182,2
07,43
3
230,0
20,08
7
284,7
08,18
8
Staff
Salar
y 3 M
onth
3,420
,000
3,762
,000
4,138
,200
4,552
,020
5,007
,222
5,507
,944
6,058
,739
6,664
,612
7,331
,074
8,064
,181
Utilit
ies
5,000
,000
5,500
,000
6,050
,000
6,655
,000
7,320
,500
8,052
,550
8,857
,805
9,743
,586
10,71
7,944
11,78
9,738
Total
Wor
king C
apita
l8,4
20,00
0
9,2
62,00
0
10
,188,2
00
11
,207,0
20
12
,327,7
22
13
,560,4
94
14
,916,5
44
16
,408,1
98
18
,049,0
18
19
,853,9
20
Curre
nt As
sets
8,597
,673
18,01
0,079
36,86
1,862
59,40
4,404
86,46
2,830
118,3
60,16
1
155,5
70,56
5
198,6
15,63
1
248,0
69,10
5
304,5
62,10
7
Total
Asse
ts 24
6,846
,573
24
5,996
,754
25
4,586
,312
26
6,866
,629
28
3,662
,830
31
0,700
,161
34
3,050
,565
38
1,235
,631
42
5,829
,105
47
7,462
,107
Liabil
ities+
Equit
y
Equit
y
Paid
up ca
pital
148,2
50,10
0
148,2
50,10
0
148,2
50,10
0
148,2
50,10
0
148,2
50,10
0
148,2
50,10
0
148,2
50,10
0
148,2
50,10
0
148,2
50,10
0
148,2
50,10
0
Retai
ned e
arning
70
7,864
5,0
76,89
7
19
,207,5
62
38
,377,9
72
63
,119,1
13
99
,316,3
50
14
2,225
,919
19
2,581
,505
25
1,200
,941
31
8,996
,228
148,9
57,96
4
153,3
26,99
7
167,4
57,66
2
186,6
28,07
2
211,3
69,21
3
247,5
66,45
0
290,4
76,01
9
340,8
31,60
5
399,4
51,04
1
467,2
46,32
8
Liabil
ities
Long
Term
Deb
t 88
,337,2
69
81
,886,3
40
74
,472,0
16
65
,950,4
22
56
,156,1
96
44
,899,2
80
31
,961,2
33
17
,090,9
93
-
-
curre
nt lia
bilitie
s
Cure
nt Po
rtion
Of L
ong T
erm
Debt
5,6
12,71
5
6,4
50,92
9
7,4
14,32
4
8,5
21,59
4
9,7
94,22
6
11
,256,9
16
12
,938,0
47
14
,870,2
41
17
,090,9
93
-
Secu
rity D
epos
it 3,9
38,62
5
4,3
32,48
8
5,2
42,31
0
5,7
66,54
1
6,3
43,19
5
6,9
77,51
4
7,6
75,26
6
8,4
42,79
2
9,2
87,07
2
10
,215,7
79
total
246,8
46,57
3
245,9
96,75
4
254,5
86,31
2
266,8
66,62
9
283,6
62,83
0
310,7
00,16
1
343,0
50,56
5
381,2
35,63
1
425,8
29,10
5
477,4
62,10
7

Cash Flow
15
Years
2019-2
0202
0-2021
2021-2
022202
2-2023
2023-2
024202
4-2025
2025-2
026202
6-2027
2027-2
028202
8-2029
Profit/
loss
707,86
4
4,3
69,034
14,
130,66
5
19,170
,410
24,
741,14
1
36,197
,237
42,
909,56
9
50,355
,586
58,
619,43
5
67,795
,288
Add no
n cash
expens
e
Deprec
iation
10,262
,225
10,
262,22
5
10,262
,225
10,
262,22
5
10,262
,225
4,8
60,000
4,860,
000
4,8
60,000
4,860,
000
4,8
60,000
10,970
,089
14,
631,25
9
24,392
,890
29,
432,63
5
35,003
,366
41,
057,23
7
47,769
,569
55,
215,58
6
63,479
,435
72,
655,28
8
(Chang
es in C
Asset
)(8,4
20,000
)
(84
2,000)
(926,2
00)
(1,0
18,820
)
(1,120,
702)
(1,2
32,772
)
(1,356,
049)
(1,4
91,654
)
(1,640,
820)
(1,8
04,902
)
(Chang
es in C
Liabili
ties)
3,938,
625
393
,863
909,82
2
524
,231
576,65
4
634
,319
697,75
1
767
,527
844,27
9
928
,707
Cashflo
w for o
peratio
n6,4
88,714
14,183
,121
24,
376,51
2
28,938
,046
34,
459,31
9
40,458
,784
47,
111,27
1
54,491
,458
62,
682,89
5
71,779
,093
Invest
ing cas
hflow
(248,5
11,125
)
O Equi
ty 148
,250,1
00
Procee
ds from
Loan
98,833
,400
yearly
Payme
nts(4,8
83,416
)
(5,6
12,715
)
(6,450,
929)
(7,4
14,324
)
(8,521,
594)
(9,7
94,226
)
(11,25
6,916)
(12
,938,0
47)
(14,87
0,241)
(17
,090,9
93)
Total F
inanci
ng (Ou
tflow)/
inflow
242,20
0,084
(5,6
12,715
)
(6,450,
929)
(7,4
14,324
)
(8,521,
594)
(9,7
94,226
)
(11,25
6,916)
(12
,938,0
47)
(14,87
0,241)
(17
,090,9
93)
Total C
ashflow
(outflo
w)/infl
ow177
,673
8,570,
406
17,925
,583
21,
523,72
2
25,937
,724
30,
664,55
8
35,854
,355
41,
553,41
2
47,812
,654
54,
688,10
1
Cash o
pening
balan
ce 177
,673
8,748,
079
26,673
,662
48,
197,38
4
74,135
,108
104
,799,6
66
140,65
4,021
182
,207,4
33
230,02
0,087
curren
t year m
oveme
nt 177
,673
8,570,
406
17,925
,583
21,
523,72
2
25,937
,724
30,
664,55
8
35,854
,355
41,
553,41
2
47,812
,654
54,
688,10
1
closing
177,67
3
8,7
48,079
26,
673,66
2
48,197
,384
74,
135,10
8
104,79
9,666
140
,654,0
21
182,20
7,433
230
,020,0
87
284,70
8,188

Punjab board of investment & trade is a provincial trade
and investment promotion agency established by the
Government of Punjab in 2009. In today′s global economy,
trade and investment play an increasingly important role in
generating means for transformative change. At PBIT, we
strive to ensure that this transformative change is
sustainable and more impactful. PBIT is committed to
enhancing the global competitiveness of Punjab and its
business. To this end, we work to attract new investments
in the region and strengthen the existing ones by
promoting local investment opportunities, facilitating
businesses and highlighting the distinct advantages of
Punjab as a business location.
Incorporated under Section 42 under the Companies
Ordinance of 1984, Punjab Board of Investments & Trade
(PBIT) assists companies which intend to invest in the
manufacturing and services sectors of Punjab. The wide
range of services provided by PBIT include providing
information on the opportunities for investments, as well as
facilitating companies which are looking for joint venture
partners. PBIT acts as Punjab's marketing arm and
actively promotes the province worldwide as one of the
best investment hubs in Asia. PBIT as Special Economic
Zone Authority Punjab also evaluates the
applications/proposals from Developers to declare their
Industrial Parks as Special Economic Zones. For granting
one time import duty exemption on machinery, equipment,
spare parts, consumables in Special Economic Zones,
PBIT is responsible to issue a confirmation Letter on the
status of the applicant prior to seeking the permission from
the relevant department/agencies to claim for the
exemption. Investors are always encouraged to discuss
their project interests with PBIT officers, wherein
Information can be obtained on major public/private
projects, prevailing sectoral policy framework, existing
incentive regime, financing options, trade statistics etc.
Punjab Board of Investment & Trade is a Steering
Committee Member and the Director of South Asia at the
World Association of Investment Promotion Agencies
(WAIPA) - a prestigious world association of organizations
similar to PBIT created by UNCTAD.
ABOUT USTRANSACTIONS
Department
Punjab Board of Investment & Trade
23 – Aikman Road, GOR 1, Lahore.
Pakistan
PABX: +92 (042) 9920 5201-06
Fax: +92 (0) 42 9920 5171
Web: https://www.pbit.gop.pk
Punjab Board of Investment and Trade targets a
socio-economic growth through its Transactions
Department. The department plans to fortify its deep
roots, both locally and internationally, by reaching out
to leading businesses for discussing the panoramic
commercial opportunities. As per the initiative of
inventiveness, the department plans to provide a
transaction advisory as defined in its role to bring-in
the investments and establish new businesses. For
this purpose, Pitch books of different identified
sectors are a new resourcefulness of this department
which would target to develop the in-house capacity
of production by connecting the local and
international market players. This would not only
ensure the technology transfer but also create
several jobs in the province. The department plans to
connect through the regional IPAs, financial
institutions, the embassies in different countries and
local chambers as well so as to fast-track the
process of economic growth and industrialization in
Punjab in regard to its recognition as ‘The Land of
Opportunities
Rana Waqas
Additional Director
Head of Transactions | PBIT
Contact:
Samad Rasheed
Deputy Manager
Transactions, PBIT
Ghazi Asad
Investment Associate
Transactions, PBIT
Punjab Board of Investment & Trade
23 – Aikman Road, GOR 1, Lahore. Pakistan
PABX: +92 (042) 9920 5201-06
Fax: +92 (042) 9920 5171
Web: https://www.pbit.gop.pk