Embed Size (px)
Citation preview
KGCAS - Prapti ISSN:2456-8708 Vol 1. Issue 2 Dec 2017
Prapti
Research Journal
Vol. 1 Issue-2 December, 2017
1. A study on problems faced by the customers towards FMCG products in Coimbatore
district..........................................................................................................................................1 - 6
Dr. M Thiyagaraj and S.Rajam
2. Indian Tax System........................................................................................................................7 - 11
J.Balakrishnan
3. Goods And Service Tax In India................................................................................................12 - 15
S.Karthik
4. An Improvised Energy-Efficient LEACH for Wireless Sensor Network...............................16 - 22
A.Krishnakumar, Dr.V.Anuratha
5. A study on account holders satisfaction towards service rendered by Keernatham agricultural
credit society, Coimbatore..........................................................................................................23 - 31
L.Lovely Lourds Preethi
6. A study pertaining to test of equality of selected indian pharmaceutical Companies ….....33 - 42
Dr..Ramya
7. A study on investors perception towards derivative market at angel broking, Salem….….43- 50
M.Praveen
8. Fault Prediction Using Fuzzy Set Based K-Means Clustering Algorithm…………………..51-56
M. Jasmine Sagaya Jonita
KGCAS - Prapti ISSN:2456-8708 Vol 1. Issue 2 Dec 2017
1
A Study on Problems Faced by the Customers
towards FMCG Products in Coimbatore District Dr. M. Thiyagaraj1 , S.Rajam2
Abstract
In Indian economy, the Fast Moving Consumer Goods sector
experienced outstanding growth in the past decade. This sector
is an important contributor to India’s Gross Domestic Product.
This industry in Coimbatore district is shaping up under the
umbrella of organized sector and it is distinctly classified into
four different segments like Food and Beverage industry,
Cleaning, Disinfectants and Home Care, Personal care and
Electronics. The study is descriptive in nature both primary
and secondary data to be considered for this analysis. 750
samples are randomly selected in the rural area of Coimbatore
District and analysed for the study. Objectives are framed and
required tools to be applied for this study. Through this study
Problems towards FMCG Product have been analysed and
provide the suitable suggestions to improve the services.
Keywords: Fast Moving, Gross Domestic Product, Indian
economy, Food and Beverage, Problems.
1. INTRODUCTION
India is one of the largest economies in the world in terms
Associate Professor1,
Department of Commerce,
Dr.S.N.S Rajalaskmi Arts and Science College,
Chinavedampatti (PO). Coimbatore.
Professor2,
Department of Commerce,
Kongunadu Arts and Science College,
Kovundampalayam, Coimbatore.
of purchasing power and increasing consumer spending,
next to China.The National Council of Applied Economic
Research (NCAER) survey report says that there are 720
million consumers across the villages in rural India. Hence,
the development of the nation largely depends upon the
development of the rural population. The Indian rural
marketing environment increased the awareness along with
rise in income levels.
In Indian economy, the Fast Moving Consumer
Goods (FMCG) sector experienced outstanding growth in
the past decade. FMCG sector is an important contributor to
India’s Gross Domestic Product (GDP).
It is the fourth largest sector in the Indian economy.
This sector also creates employment for around three
million people in downstream activities, which are generally
carried out in smaller towns of rural India.
The development of consumerism in the Coimbatore
district is due to Industrialization. This increased the growth
of FMCG market in Coimbatore district. The FMCG
industry in Coimbatore district is shaping up under the
umbrella of organized sector and it is distinctly classified
into four different segments like Food and Beverage
industry, Cleaning, Disinfectants and Home Care, Personal
care and Electronics.
KGCAS - Prapti ISSN:2456-8708 Vol 1. Issue 2 Dec 2017
2
1.1 FAST MOVING CONSUMER GOODS (FMCG)
Products which have a quick turnover, and relatively
low cost are known as Fast Moving Consumer Goods
(FMCG). FMCG products are those that get replaced within
a year. Examples of FMCG generally include a wide range
of frequently purchased consumer products such as
toiletries, soap, cosmetics, tooth cleaning products, shaving
product and detergents, as well as other non-durables such
as glassware, bulbs, batteries, paper products, and plastic
goods.
FMCG products may also include pharmaceuticals,
consumer electronics, packaged food products, soft drinks,
tissue paper, and chocolate bars. A subset of FMCG
products is Fast Moving Consumer Electronics which
includes innovative electronic products such as mobile
phones, MP3 players, digital cameras, GPS Systems and
Laptops. These are replaced more frequently than other
electronic products. White goods in FMCG refer to
household electronic items such as Refrigerators, T.Vs,
Music Systems, etc.,
2. REVIEW OF LITERATURE
Mona Chaudhary and SnehaGhai (2014) conducted a study
to find out the perception of youngsters towards cause-
related marketing of FMCG category and its impact on their
buying behaviour. It was found that the perception of youth
was the most important aspect to contribute to the society.
The researchers appreciate the initiatives taken by the
marketers who join hands with the NGO working for a
noble cause. A well-designed cause-marketing campaign
can bring benefits to the company. It works as a great
differentiator in FMCG as there are so many similar
offerings in the market. A well-rated and effectively
communicated cause marketing campaign creates a positive
impact on buying behaviour of the young consumers in
favour of the brand.
Bloom et al. (2006) have clearly written in their
study that companies have been able to use cause-related
marketing to make a distinction of their brands from
competitors in consumers' minds and to get desirable
effects, including greater efficiency for other marketing
efforts, an ability to charge higher prices, increased market
share, greater brand loyalty and better stakeholders
management.
Cheron Emmanuel et al. (2012) carried out a study
that aimed to examine the effect of brand-cause fit and
campaign duration on company and brand image,
commercial objectives and buying intention as perceived by
Japanese consumers and aimed to evaluate the moderating
role of gender and participation in philanthropic activities
on the impact of cause-related marketing (CRM)
programmes in Japan. An experimental design was used
with 196 Japanese subjects completing a survey online.
Results showed that a high brand-cause fit was found to
elicit more positive attitudes towards the CRM programme
than campaign duration. Japanese female respondents were
showing more favourable attitudes than men, confirming
results in previous research studies conducted in the West.
Hou, Jundong et al. (2008) examined several factors
that potentially influenced a consumer's purchasing decision
to participate in cause-related marketing (CRM)
programmes in the Chinese context. This study was also
intended to test empirically the hypothesized relationship

KGCAS - Prapti ISSN:2456-8708 Vol 1. Issue 2 Dec 2017
3
between cause's attributes of causes and purchase intention
in such an environment. The results show that the degree of
causes participation for consumer, fit between the brand and
the cause, cause importance, congruence between the firm's
product and the cause. The cause proximity plays an
important role in consumers' attitudes towards the product.
Kalaiselvi.S (2014), conducted “A study on
consumers preference and satisfaction towards Amway
Nutrition Products with special reference to Coimbatore
city, concluded that
3. STATEMENT OF THE PROBLEM
In modern world, the consumption of FMCG
products plays an important role in our day to day life. Rural
customers are facing the problem in quality product,
availability and accessibility. Internationally the market for
FMCG products has expanded significantly during the last
decade. In recent years the demand for FMCG products is
growing among households. FMCG products are produced
by many companies and sold in their brand names. In this
situation it is required to find out and problems faced by the
consumers’.
4. SCOPE OF THE STUDY
The study is conducted to find out the Rural
Consumers’ problems towards the FMCG Products in
Coimbatore districts. Coimbatore is the second largest
district in the state of Tamil Nadu.
Hence the study is very essential to this particular
area and the researcher has focused on rural areas in the
Coimbatore district. To attempt the specified objectives, 750
respondents were selected.
5. OBJECTIVE OF THE STUDY
To analyze the problems faced by the consumers
while using the FMCG products.
6. RESEARCH METHODOLOGY
A pilot study was conducted with 50 consumers of
retail outlets in Coimbatore District. Interview schedules
were used as a major tool to collect first-hand information
from the sample respondents. Field survey technique was
adopted to collect information from the sample respondents.
The interview schedule has been pre-tested and
modified to suit the purposes of this study. Totally 750
respondents were taken for the study. Both primary data and
secondary data have been used in this study. The primary
data have been collected from FMCG consumers in
Coimbatore district, with the help of an Interview Schedule.
The secondary data have been drawn from different
sources like newspapers, magazines, journals, books,
websites and pamphlets. In this study Garrett Ranking
method has been used to findout the problems faced by the
customers towards FMCG products in Rural area.
7. LIMITATIONS OF THE STUDY
The geographical coverage of the study is
restricted only to rural part of Coimbatore District
and hence, the results of the study cannot be
generalized in its original form to other parts of the
state or country.
The study is confined only to the rural people who
are residing in the rural part of the Coimbatore
District. The study in confined only selected
FMCG. All the FMCG were not available in rural
areas.
KGCAS - Prapti ISSN:2456-8708 Vol 1. Issue 2 Dec 2017
4
8. DATA ANALYSIS AND INTERPRETATION
8.1 GARRETT’S RANKING TECHNIQUES
With the help of Garrett’s table, the percent
position estimated is converted into scores. Then for each
factor, the scores of each individual are added and then total
value of scores and mean values of score is calculated. The
factors having highest mean value is considered to be the
most important factor. In this study Garrett ranking
technique is used to know the most important problem faced
by the customers while using the FMCG products.
In this study, to know the highest problem faced by the
respondents Garrett’s ranking techniques was used. In this
study FMCG products are Classified three groups
1.Food and Bevearage
2.Personal care Products
3.Health care Products
8.1.1 FOOD AND BEVERAGE PRODUCTS
SOURCE: PRIMARY DATA
INFERENCE
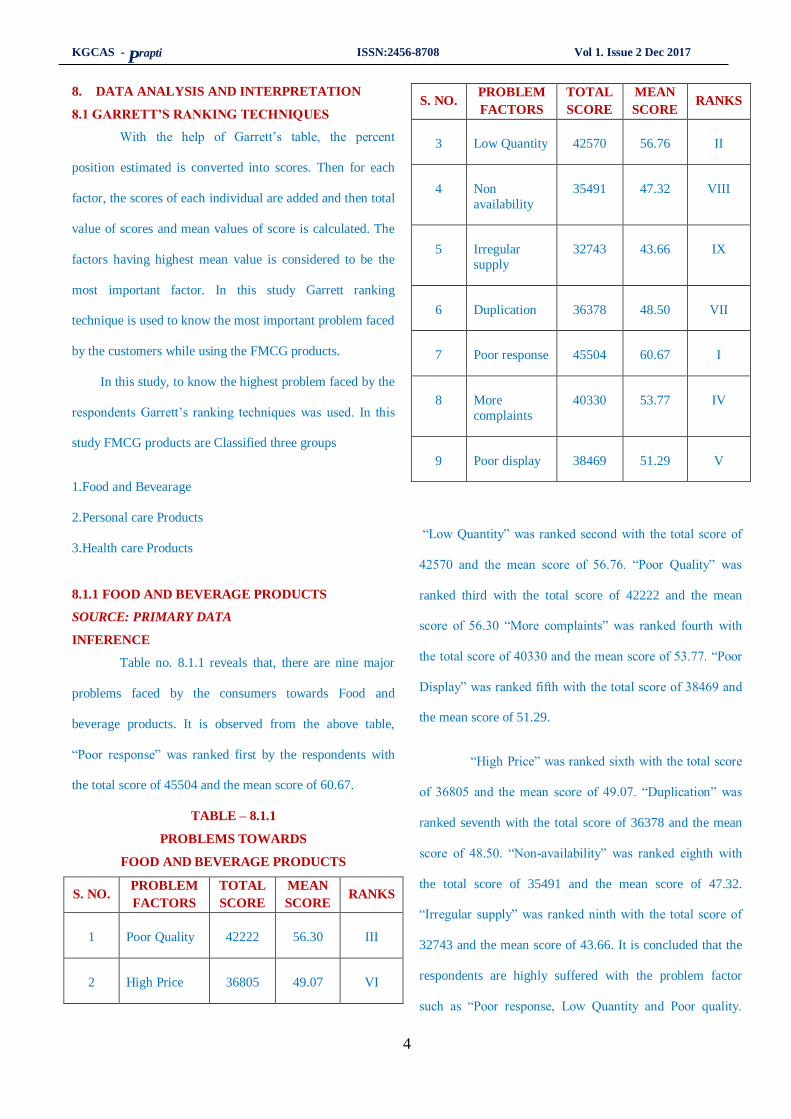
Table no. 8.1.1 reveals that, there are nine major
problems faced by the consumers towards Food and
beverage products. It is observed from the above table,
“Poor response” was ranked first by the respondents with
the total score of 45504 and the mean score of 60.67.
TABLE – 8.1.1
PROBLEMS TOWARDS
FOOD AND BEVERAGE PRODUCTS
S. NO. PROBLEM
FACTORS
TOTAL
SCORE
MEAN
SCORE RANKS
1 Poor Quality 42222 56.30 III
2 High Price 36805 49.07 VI
S. NO. PROBLEM
FACTORS
TOTAL
SCORE
MEAN
SCORE RANKS
3 Low Quantity 42570 56.76 II
4 Non
availability
35491 47.32 VIII
5 Irregular
supply
32743 43.66 IX
6 Duplication 36378 48.50 VII
7 Poor response 45504 60.67 I
8 More
complaints
40330 53.77 IV
9 Poor display 38469 51.29 V
“Low Quantity” was ranked second with the total score of
42570 and the mean score of 56.76. “Poor Quality” was
ranked third with the total score of 42222 and the mean
score of 56.30 “More complaints” was ranked fourth with
the total score of 40330 and the mean score of 53.77. “Poor
Display” was ranked fifth with the total score of 38469 and
the mean score of 51.29.
“High Price” was ranked sixth with the total score
of 36805 and the mean score of 49.07. “Duplication” was
ranked seventh with the total score of 36378 and the mean
score of 48.50. “Non-availability” was ranked eighth with
the total score of 35491 and the mean score of 47.32.
“Irregular supply” was ranked ninth with the total score of
32743 and the mean score of 43.66. It is concluded that the
respondents are highly suffered with the problem factor
such as “Poor response, Low Quantity and Poor quality.
KGCAS - Prapti ISSN:2456-8708 Vol 1. Issue 2 Dec 2017
5
These three factors are most important prblems faced by the
FMCG customer towards Food and Beverage Products.
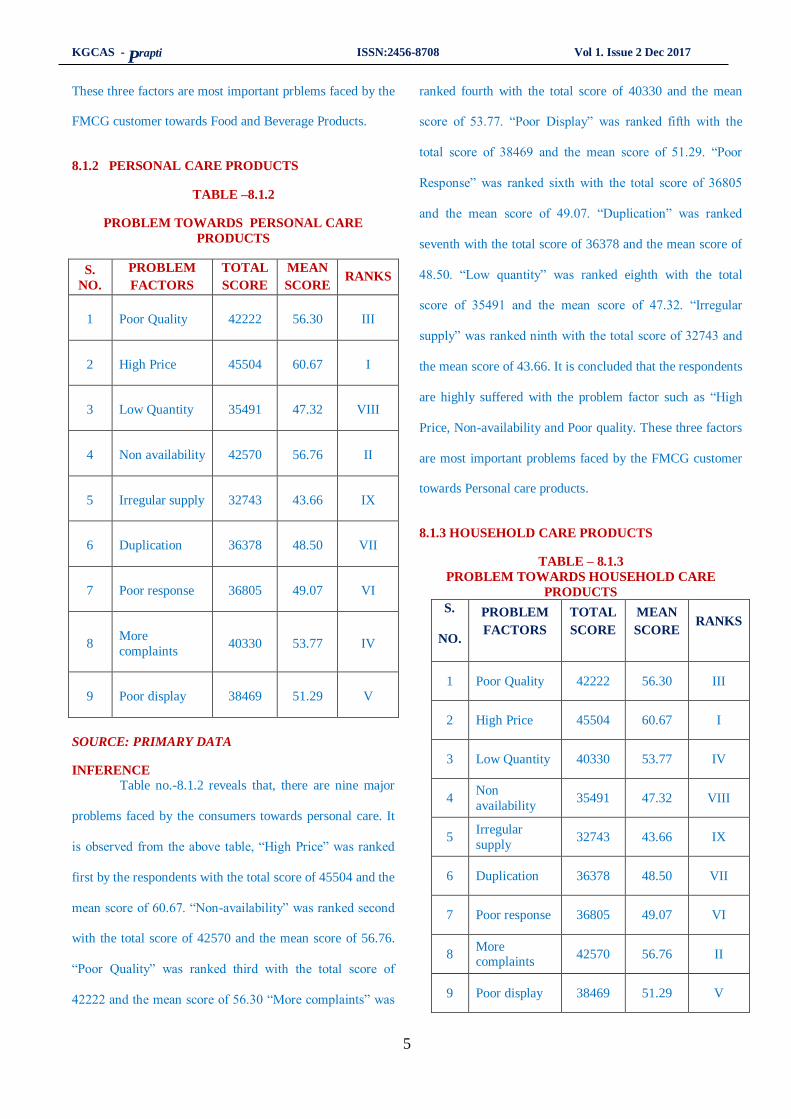
8.1.2 PERSONAL CARE PRODUCTS
TABLE –8.1.2
PROBLEM TOWARDS PERSONAL CARE
PRODUCTS
S.
NO.
PROBLEM
FACTORS
TOTAL
SCORE
MEAN
SCORE RANKS
1 Poor Quality 42222 56.30 III
2 High Price 45504 60.67 I
3 Low Quantity 35491 47.32 VIII
4 Non availability 42570 56.76 II
5 Irregular supply 32743 43.66 IX
6 Duplication 36378 48.50 VII
7 Poor response 36805 49.07 VI
8 More
complaints 40330 53.77 IV
9 Poor display 38469 51.29 V
SOURCE: PRIMARY DATA
INFERENCE
Table no.-8.1.2 reveals that, there are nine major
problems faced by the consumers towards personal care. It
is observed from the above table, “High Price” was ranked
first by the respondents with the total score of 45504 and the
mean score of 60.67. “Non-availability” was ranked second
with the total score of 42570 and the mean score of 56.76.
“Poor Quality” was ranked third with the total score of
42222 and the mean score of 56.30 “More complaints” was
ranked fourth with the total score of 40330 and the mean
score of 53.77. “Poor Display” was ranked fifth with the
total score of 38469 and the mean score of 51.29. “Poor
Response” was ranked sixth with the total score of 36805
and the mean score of 49.07. “Duplication” was ranked
seventh with the total score of 36378 and the mean score of
48.50. “Low quantity” was ranked eighth with the total
score of 35491 and the mean score of 47.32. “Irregular
supply” was ranked ninth with the total score of 32743 and
the mean score of 43.66. It is concluded that the respondents
are highly suffered with the problem factor such as “High
Price, Non-availability and Poor quality. These three factors
are most important problems faced by the FMCG customer
towards Personal care products.
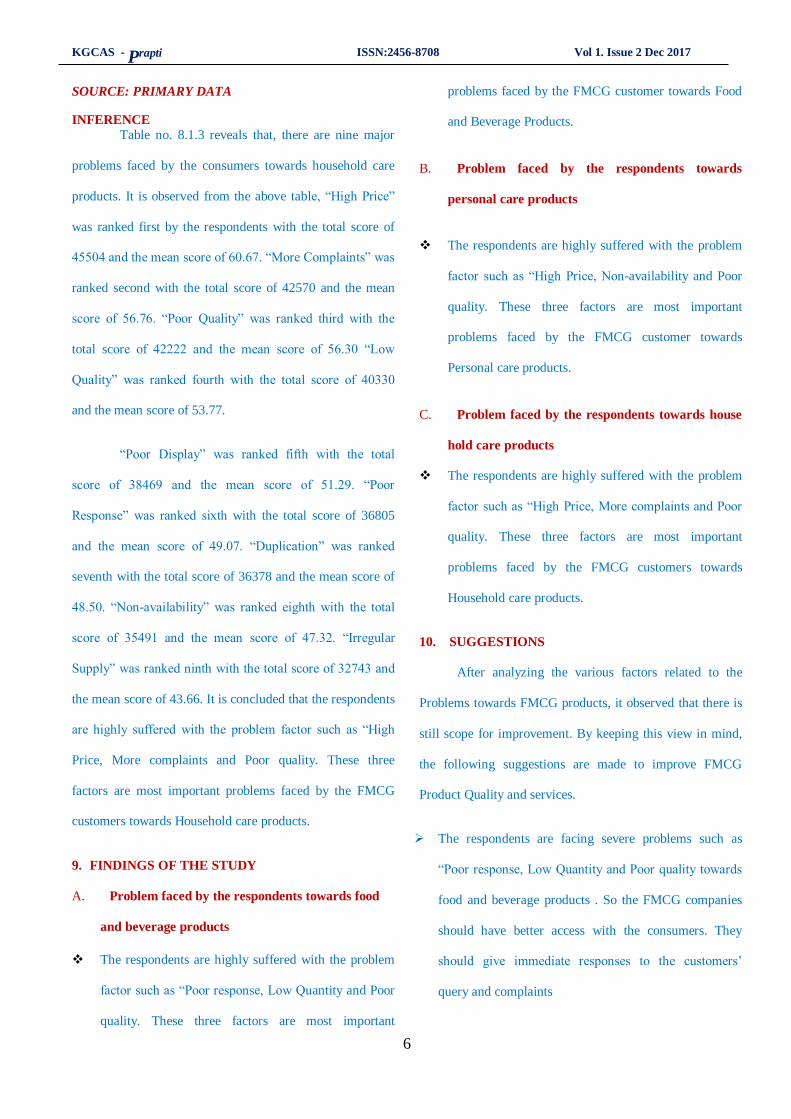
8.1.3 HOUSEHOLD CARE PRODUCTS
TABLE – 8.1.3
PROBLEM TOWARDS HOUSEHOLD CARE
PRODUCTS
S.
NO.
PROBLEM
FACTORS
TOTAL
SCORE
MEAN
SCORE
RANKS
1 Poor Quality 42222 56.30 III
2 High Price 45504 60.67 I
3 Low Quantity 40330 53.77 IV
4 Non
availability 35491 47.32 VIII
5 Irregular
supply 32743 43.66 IX
6 Duplication 36378 48.50 VII
7 Poor response 36805 49.07 VI
8 More complaints
42570 56.76 II
9 Poor display 38469 51.29 V
KGCAS - Prapti ISSN:2456-8708 Vol 1. Issue 2 Dec 2017
6
SOURCE: PRIMARY DATA
INFERENCE
Table no. 8.1.3 reveals that, there are nine major
problems faced by the consumers towards household care
products. It is observed from the above table, “High Price”
was ranked first by the respondents with the total score of
45504 and the mean score of 60.67. “More Complaints” was
ranked second with the total score of 42570 and the mean
score of 56.76. “Poor Quality” was ranked third with the
total score of 42222 and the mean score of 56.30 “Low
Quality” was ranked fourth with the total score of 40330
and the mean score of 53.77.
“Poor Display” was ranked fifth with the total
score of 38469 and the mean score of 51.29. “Poor
Response” was ranked sixth with the total score of 36805
and the mean score of 49.07. “Duplication” was ranked
seventh with the total score of 36378 and the mean score of
48.50. “Non-availability” was ranked eighth with the total
score of 35491 and the mean score of 47.32. “Irregular
Supply” was ranked ninth with the total score of 32743 and
the mean score of 43.66. It is concluded that the respondents
are highly suffered with the problem factor such as “High
Price, More complaints and Poor quality. These three
factors are most important problems faced by the FMCG
customers towards Household care products.
9. FINDINGS OF THE STUDY
A. Problem faced by the respondents towards food
and beverage products
The respondents are highly suffered with the problem
factor such as “Poor response, Low Quantity and Poor
quality. These three factors are most important
problems faced by the FMCG customer towards Food
and Beverage Products.
B. Problem faced by the respondents towards
personal care products
The respondents are highly suffered with the problem
factor such as “High Price, Non-availability and Poor
quality. These three factors are most important
problems faced by the FMCG customer towards
Personal care products.
C. Problem faced by the respondents towards house
hold care products
The respondents are highly suffered with the problem
factor such as “High Price, More complaints and Poor
quality. These three factors are most important
problems faced by the FMCG customers towards
Household care products.
10. SUGGESTIONS
After analyzing the various factors related to the
Problems towards FMCG products, it observed that there is
still scope for improvement. By keeping this view in mind,
the following suggestions are made to improve FMCG
Product Quality and services.
The respondents are facing severe problems such as
“Poor response, Low Quantity and Poor quality towards
food and beverage products . So the FMCG companies
should have better access with the consumers. They
should give immediate responses to the customers’
query and complaints
KGCAS - Prapti ISSN:2456-8708 Vol 1. Issue 2 Dec 2017
7
The respondents are facing the problem factor such as
“High Price, Non-availability and Poor quality towards
personal care products the FMCG companies are
recommended to promote FMCG in lines of pricing
strategy rather than just making low price appeals.
The respondents are highly suffered with the problem
factor such as “High Price, More complaints and Poor
quality towards house hold care products. So the
company should take necessary steps in preventing the
quality of the product.
11. CONCLUSION
The FMCG sector has had much better time in the
recent years. The FMCG market is very big in Coimbatore
Districts and it is competitive also. . In recent days we have
seen a lot of innovation in the manufacturing process and
improvement in the quality of FMCG product. With this
revolution in technology the FMCG product also increases.
Logistics companies play important role in the distribution
of FMCG. The rural people are mainly price conscious but
not so brand loyal, so they may switch to other quality
product with low price, they do not consider the taste as
important factor while making purchase decision. As well
the rural consumers are very low effect of brand ambassador
on their buying behaviour but advertisement definitely helps
them to increase their product knowledge.
12. REFERENCES
1. Dr.S.P.Gupta, Statistical Methods, Sultan Chand & Sons
Educational Publishers, New Delhi-2006.
2. J.Llian Mercer, ―Great Customer Service‖, Allen and Unwin
Publishing, New Delhi, Ed-2003.
3. Mona Chaudhary & SnehaGhai, (2014). “Perception of
Young Consumers towards Cause Marketing of FMCG
Brands”, International Journal of Sales & Marketing
Management Research and Development, Vol. 4, Issue 2,
Pp.21-26.
4. Cheron,Emmanuel; Kohlbacher, Florian; Kusuma, Kaoru,
(2012).“The effects of brand-cause fit and campaign duration
on consumer perception of cause-related marketing in
Japan”, The Journal of Consumer Marketing , Vol. 29, Issue
5 : Pp.357-368.
5. Hou, Jundong; Du, Lanying; Li, Jianfeng (2008).“Cause's
attributes influencing consumer's purchasing intention:
empirical evidence from China”, Asia Pacific Journal of
Marketing and Logistics, Vol. 20 Issue 4, Pp.363-380.
6. Kalaiselvi.S (2014), “A study on consumers preference and
satisfication towards Amway Nutrition Products with special
reference to Coimbatore city” Global Journal for Research
Analysis, Vol.3,No.10, ISSN: 2277-8160.

KGCAS - Prapti ISSN:2456-8708 Vol 1. Issue 2 Dec 2017
8
Indian Tax System
J.Balakrishnan
Abstract
Tax estimate the exact value to the tax payer and tax value are
collected based on the Income level of the tax payer. The
economic level are increased by the tax collection of the
government.
1. INTRODUCTION
Role of the Central and State Government
Central government of India levies taxes like as
Income tax, customs duty, service tax and central excise
duty.
State governments to levy income tax on agricultural
income, professional tax, value added tax, state excise duty,
land revenue and stamp duty. The local bodies are allowed
to collect octroi, property tax and other taxes on various
services like drainage and water supply.
Organizational Structure
The CBIT is headed by CBIT chairman and also
comprise six members. Member (Income Tax)
Member (Legislation and Computerization)
Member (Revenue)
Member (personnel & Vigilance)
Member (Investigation)
Member (Audit & Judicial)
Assistant Professor in Commerce,
Bishop Ambrose College,
Coimbatore.
The chairperson holds the rank of special Secretary to
Government of India while the members rank of additional
Secretary to Government of India.
The CBIT chairmen and members of CBIT are selected
from Indian Revenue Services (IRS), a premier civil
services of India, whose members constitute the top
management of Income Tax Department
2. OBJECTIVES OF TAXATION
The following are the main objectives of taxation.
1. Primary 2. Secondary
Primary
Raising more revenues
Preventing the concentration of wealth in a few
hands
Re-distribution of wealth for the common and social
purposes
Maintaining the welfare of the states.
Secondary
Encouraging the essential productions
Maintaining balanced economic growth
Enforcing government policy
Increasing savings and investment by public
Reduction of unemployment problems
Removal of Regional disparities among the states
Importance
There are many responsibilities of state to its
countrymen. State is represented by the government. The
government of any country performs a number of activities
KGCAS - Prapti ISSN:2456-8708 Vol 1. Issue 2 Dec 2017
9
in order to maintain law and order, peace and security,
satisfying with the requirement of basic needs of public
utilities. It also indicates various development programmes
and maintains diplomatic and friendly relation with other
nations in the world.
3. BENEFITS OF TAXES
Tax encourages savings and investment if a tax
payer can invest amount to his/her business and
they has to reduce in the tax payment to the
government.
Tax payer has to file tax returns, it helps when you
are in getting loan from bank.
4. ESSENTIALS OF TAX
A tax is a compulsory contribution of a person or
entity to the state as per the rules.
The tax payer does not receive direct and or special
benefit in return.
It is spent by the government for the common
interest and benefit of the people.
It is paid only by those persons and entities who
earn income exceeding a certain specified limit.
Non-Payment Penalty
Suppose the payment of tax is avoiding means the
tax payer has to pay their own money. A customer fail to
pay tax when the tax amount returns or extended and have
time to pay owe money in the same month and has to pay a
non-payment penalty equal to 0.5% of the due tax will be
levied.
Underpayment Penalty
When a customer does not make the whole
payment owed on tax and Taxes must be paid as income is
earned, and most taxpayers comply with the rule for fear
that income tax will be withheld from their pay cheques.
The independent contractors who work side jobs in
addition to their salaried employment or as full time
workers are responsible for ensuring that the tax due on
their earnings are covered through estimated tax payments.
5. TYPES OF TAXES
Two Types of taxes like
1. direct Tax and
2. Indirect Taxes
Direct Tax
Central Board of Direct Taxes (CBDT) is a part of
the Department of Revenue and it overlooks these direct
taxes.
Types of Direct Tax
Income Tax Act
Wealth Tax Act
Gift Tax Act
Interest Tax Ac:
Capital Gains Tax
Perquisite Tax
Corporate Tax – Types
Minimum Alternative Tax
Fringe Benefit Tax
Dividend Distribution Tax
Indirect Tax
Indirect Tax is depending on the goods and
services. It is differ from direct tax and it is not levied on a
person who pays them tax directly to the government.
Examples of Indirect Tax
KGCAS - Prapti ISSN:2456-8708 Vol 1. Issue 2 Dec 2017
10
VAT (Value Added Tax), Taxes on Imported Goods, Sales
Tax, etc.
Sales Tax
Sales tax is a tax that is levied on the sale of a
product. The product can be something that was produced in
India or imported and can even cover services rendered. The
sales tax is levied on the seller of the product who then
transfers it onto the person who buys said product with the
sales tax added to the price of the product. The limitation of
the sales tax is that it can be levied only ones for a particular
product, which means that if the product is sold a second
time, sales tax cannot be applied to it.
Service Tax
Goods sold in India is priced in the Sales tax ,so
the service tax added to services provided in India. In
budget 2015, it was announced that the service tax will be
increased from 12.36% to 14%. It is not added on goods but
on companies that provide services and is collected every
month otherwise once every quarter based on how the
services are provided. If the establishment is an individual
service provider then the service tax is paid only once the
customer pays the bills.
The major service which comes under vicinity of
service tax are telephone, tour operator, architect, interior
decorator, advertising, beauty parlor, health center, banking
and financial service, event management, maintenance
service, consultancy service
Current rate of interest on service tax is 14.5%.
GST - Goods and Service Tax
GST is the largest reform in India’s indirect tax
structure since the market started opening up about 25 years
ago. The GST is a consumption-based tax, as it is applicable
when the consumption takes place. The GST is included on
value-added goods and services at each stage of
consumption in the supply chain. The GST payable on the
goods and services can be set off against the GST payable
on the supply of goods and services, the merchant will pay
the applicable GST rate but can claim it back through the
tax credit mechanism.
The Rajya Sabha passed the Constitutional Amendment Bill
required for introduction of GST bills on 3 August 2016
with more than two-third majority.
The IT framework and services for implementation
of the new taxation system will be managed by "Goods and
Services Tax Network (GSTN)", a non-government
company set up by the Centre and states.
GST rates in India ranges from 0% up to 50%:
which includes 0%, 5%, 12%, 18%, 28%, 29%, 31%, 43%,
45%, 48%, 50% {Additional cess includes (28%+1%),
(28%+3%), (28%+15%), (28%+17%), (28%+20%),
(28%+22%)} varying for both goods and services on 1211
items and services.
EV's (Full Electric Vehicles): 12%
Hybrid Vehicles: 43%
Value Added Tax
VAT, is a commercial tax is not applicable on
commodities that are zero rated (eg. food and essential
drugs) or those that fall under exports. The value added tax
is levied at all the stages of the supply chain, right from the
manufacturers, dealers and distributors to the end user.
The value added tax is a tax that is levied at the
discretion of the state government and not all the states
KGCAS - Prapti ISSN:2456-8708 Vol 1. Issue 2 Dec 2017
11
implemented it when it was first announced. The tax is
levied on various goods sold in the state and the amount of
the tax is decided by the state government itself.
Custom duty & Octroi:
When the customer purchases anything that needs
to be imported from another country, a charge is applied on
it and that is the customs duty. The custom applies to all the
products that come in via land, sea or air. Even the customer
bring in products bought in another country to India, a
customs duty can be levied on it. The use of the customs
duty is to ensure that all the goods entering the country are
taxed and paid for. Customs duty ensures that goods for
other countries are taxed.
Octroi is means to ensure that goods crossing state
borders within India are taxed appropriately. Octroi levied
by the state government and functions in much the same
way as customs duty does.
Excise duty
Central Excise Act, 1944, it imposes a duty of excise on goods manufactured or produced in India. Excise duty as a
duty or tax levied upon the manufacture or production of commodities with in the country intended for home consumption.
CENTRAL BOARD OF DIRECT TAXES
Central government of India
S. No. Parliament of India
1 Taxes on income other than agricultural income (List I(Union List), Entry 82)
2 Duties of customs including export duties (List I(Union List), Entry 83)
3
Duties of excise on tobacco and other goods manufactured or produced in India except (i) alcoholic liquor for
human consumption, and (ii) opium, Indian hemp and other narcotic drugs and narcotics, but including
medicinal and toilet preparations containing alcohol or any substance included in (ii). (List I(Union List), Entry
84)
4 Corporation Tax (List I(Union List), Entry 85)
5 Taxes on capital value of assets, exclusive of agricultural land, of individuals and companies,
taxes on capital of companies (List I(Union List), Entry 86)
6 Estate duty in respect of property other than agricultural land (List I(Union List), Entry 87)
7 Duties in respect of succession to property other than agricultural land (List I(Union List), Entry
88)
KGCAS - Prapti ISSN:2456-8708 Vol 1. Issue 2 Dec 2017
12
8 Terminal taxes on goods or passengers, carried by railway, sea or air; taxes on railway fares and
freight (List I(Union List), Entry 89)
9 Taxes on sale or purchase of goods other than newspapers, where such sale or purchase takes
place in the course of inter-State trade or commerce
10 Taxes on the consignment of goods in the course of inter-State trade or commerce
It is an indirect tax which is often passed on to the consumer as part of the price. It levied or imposed at the manufacturing
stage and charged at specific rates. The duties may be levied on or specific basis or an advalorem basis that is Quantity and
Value of the commodities.
Central Excise Tariff Act, 1985
Central Excise Valuation (Determination of Price of Excisable Goods) Rules, 2000
Excise Duty:
This is a tax that is levied on all the goods
manufactured or produced in India. It is different from
customs duty because it is applicable only on things
produced in India and is also known as the Central Value
Added Tax or CENVAT. This tax is collected by the
government from the manufacturer of the goods. It can also
be collected from those entities that receive manufactured
goods and employ people to transport the goods from the
manufacturer to them.
Other Taxes in India
Professional Tax
Municipal Tax
Entertainment Tax
Stamp Duty, Registration Fees, Transfer Tax
Education Cess , Surcharge
Toll Tax
Dividend Tax
5. CONCLUSION
Tax is the major maintenance in the government of India
they taking major work in all the sectors like Direct and
Indirect taxes are the collection and filing of tax taking
importance and maintaining all the activities of the tax
payers. Based on the Income the tax payer is paying their
taxes and it is the major responsibility to them. Collection
of tax from the tax payer are using for the welfare of the
Indian economy development sector.
REFERENCES
1) https://www.hdfclife.com/insurance-knowledge-centre/tax-
saving-insurance/Tax-Structure-in-India
2) https://www.bankbazaar.com/tax/penalties-for-not-filing-tax-
how-to-avoid.html
3) http://moneyexcel.com/701/20-types-of-taxes-in-india
4) http://www.economicsdiscussion.net
5) https://taxguru.in/
6) www.google.com
7) Wikipedia
8) IndirectTaxes,,S.Sethurajan & K.Singaravelu, Speed Publishers
KGCAS - Prapti ISSN:2456-8708 Vol 1. Issue 2 Dec 2017
13
Goods and Service Tax in India S.Karthik
Abstract
The Goods and service Tax plays a vital role in the
Indian economic and also this type of tax are collected from the
tax payer like business peoples when their production depend
on the tax. The goods and services are increasing the tax of the
payer get more Income and the government are also get tax
from the beneficiary.GST create a uniform market throughout
the country from multiple taxes such as excise duty, service tax
in the central level and VAT at the state level.
1. INTRODUCTION
Goods and Services Tax (GST) is an indirect tax
that will be levied on productions, sale and consumption of
goods and services. The use of the GST is that when
applicable it will abolish all indirect taxes.The present
structure of Indirect Taxes is very difficult in India and tax
rates differ from State to State.
The tax payment as ‘Entertainment Tax’ for
watching a movie. We have to pay Value Added Tax
(VAT) on purchasing goods and services. Tax like’s Excise
duties, Import Duties, Luxury Tax, Central Sales Tax, and
Service Tax. GST bring uniformity and reduce the
cascading effect of these taxes by giving input tax credit.
GST objectives:
1. Improvement in the competitiveness of the original
Assistant Professor in Commerce,
Bishop Ambrose College, Coimbatore.
Mob. No: 90037483480,
goods and services, thereby improving the GDP rate
too.
2. Availability of input credit across the value chain.
3. Decrease the complications in tax administration
and compliance.
4. Making a law involving all the tax bases, laws and
administration procedures across the country.
5. Reduce the unhealthy competition among the states
due to taxes and revenues.
6. Adaptation mechanisms and trained staff.
7. The double registration might annoy people. Also,
these registrations result in increase compliances and
cost.
8. Uninformed estimate of the exact impact of GST.
9. No proper mechanisms to control tax evasion
2. IMPORTANCE OF GOODS AND SERVICES TAX
Goods and Services Tax (GST) is an indirect tax
that will be levied on manufacture, sale and consumption of
goods and services. The importance of the GST is that when
applicable it will abolish all indirect taxes. Hence the entire
system of taxation will be simpler.
The previous Government brought a Bill in
the Lok Sabha in 2011, but failed to get it passed. The NDA
Government introduced a “slightly modified” version of the
Bill in Lok Sabha last December. It was completed on May
6, 2016 but for GST to become a reality, the Bill must be
cleared by two-thirds majority by both Houses, and ratified
by 50% of states. It is now pending in the Rajya Sabha.

KGCAS - Prapti ISSN:2456-8708 Vol 1. Issue 2 Dec 2017
14
The structure of Indirect Taxes is very complex
in India and tax rates differ from State to State. We payment
of ‘Entertainment Tax’ for watching a movie. We have to
pay Value Added Tax (VAT) on purchasing goods and
services. And there are Excise duties, Import Duties, Luxury
Tax, Central Sales Tax, Service Tax. GST will bring
uniformity and reduce the cascading effect of these taxes by
giving input tax credit.
GST subsumes many indirect and central levies and allows
a producer to claim credit for taxes paid on all inputs,
making production efficient. This is expected to reduce the
cost for consumers.
3. FEATURES OF GST
Subsume following indirect taxes:-
Central Excise duty,
Central Indirect Taxes
Additional duties of excise
CVD&SAD)
Excise duty levied under Medicinal and Toiletries
Preparation Act
Surcharge and Cess .
Service Tax
State Indirect Taxes
VAT/CST
Purchase tax
Entry tax
Octroi
Surcharge and Cess.
GST will have two components comprising
Central GST (CGST)
State GST (SGST)
An additional Tax of 1%
State Taxable supply of Goods by State of Origin and
it would be non CENVATABLE. The additional tax on
supply of goods shall be assigned to the States from where
such supplies originate.
All goods or services
State Excise plus VAT -Alcohol for human
consumption
Electricity Duty -Electricity
Stamp Duty plus Property Taxes -Real Estate
Petroleum Products
Codification is to be specified
It’s all goods and services in the purposed GST
structure. HSN code can be used for classification of goods
and existing accounting code can be used for classification
of services.
Removes
Effect of taxation.
Basics of GST – Implementation In India
Goods and services are the dual system currently India
has a taxation of, it is quite different from dual GST. Taxes
on goods are described as “VAT” Central and State level. It
has adopted value added tax with input tax credit
mechanism for the taxation of goods and services,
respectively, with limited cross-levy set-off.
4. MODELS OF GST
There are three prime models of GST:
Central (Union) Government Level only
State Government Level only
Union and State Government Levels

KGCAS - Prapti ISSN:2456-8708 Vol 1. Issue 2 Dec 2017
15
GST work in India:
In a first of its kind initiative, the GST will be
implemented in two components – Central GST or
CGST and State GST or SGST. This dual GST
will be levied on all the supply of goods and
services across the country.
Therefore, if there is a sale within the State, then
the both CGST and SGST will be charged.
However, if the sale is outside the State, then only
the Intra-State GST will be levied by the Centre.
CGST is doing away with indirect taxes such
Central Excise Duty, Service Tax, Addl. Customs
Duty, Special Addl. Customs Duty as well as
Addl. Excise Duty. These indirect taxes are those
that are collected by the Centre.
SGST will remove indirect taxes on goods and
services which are charged by the State such as
VAT, Entertainment Tax, Purchase Tax, Octroi,
Luxury Tax and Entry Tax.
The credits of Input Tax of CGST will be
accessible for settling the output of CGST liability
at every stage. Likewise, in the States, the credits
of SGST taken on the inputs will be made
available for clearing the output of SGST’s
liability at each stage.
GST Rates Reduced from 12% to 5% on 10-11-2017
1. Desiccated coconut
2. Narrow woven fabric including cotton newar [with no
refund of unutilised input tax credit]
3. Idli, dosa butter
4. Finished leather, chamois and composition leather
5. Coir cordage and ropes, jute twine, coir products
6. Fishing net and fishing hooks
7. Worn clothing
8. Fly ash brick
List of all Goods Covered under GST 12%
The GST Council, decision-making body for the
new tax, has fixed the tax framework under the Goods and
Services Tax (GST) which is to be rolled out this July 1.
Tax rates have been finalized for 1,211 items with a
majority of items being kept under the 18 per cent slab.
GST Rates Reduced from 18% to 12% on 10-11-
2017
1. Refined sugar & sugar cubes
2. Medicinal grade oxygen
3. Printing ink
4. Hand bags and shopping bags of jute and cotton
5. Milk
6. Hats
7. Parts of specified agricultural, horticultural,
forestry, harvesting or threshing machinery
8. Specified parts of sewing machine
9. Pasta
10. Curry paste, mayonnaise and salad dressings,
mixed condiments and mixed seasoning
11. Diabetic food
12. Spectacles frames

KGCAS - Prapti ISSN:2456-8708 Vol 1. Issue 2 Dec 2017
16
13. Furniture wholly made of bamboo or cane
GST Rates from 12% to 5% on 10-11-2017
1. Idli, dosa batter
2. Finished leather, chamois and composition leather
3. Coir cordage and ropes, jute twine, coir products
4. Desiccated coconut
5. Narrow woven fabric including cotton newar [with
no refund of unutilised input tax credit]
6. Fishing net and fishing hooks
5. CONCLUSION
GST plays a vital role in the Indian government
and the collection of tax amount are increase when the tax
updating coming likewise peoples get problems when
paying the GST at the same time business peoples and
trading peoples like small, medium and large all the peoples
getting affect of the GST. Government have to take step
decrees the tax amount then only the people can get wealth
in their business level.
6. REFERENCES
1. www.quora.com
2. https://gst.caknowledge.in/
3. www.google.com
4. Wikipedia
KGCAS - Prapti ISSN:2456-8708 Vol 1. Issue 2 Dec 2017
17
An Improvised Energy-Efficient LEACH for
Wireless Sensor Network
A.Krishnakumar1, Dr. V. Anuratha2
Abstract
Wireless Sensor Network (WSN) becomes an
emerging research area in recent years because of its easy
accessible nature. The Sensor nodes are combined to form a
cluster through which the collected information are
transferred to the Base Station (BS). The clusters are headed
by Cluster Head (CH) which is a normal sensor node.
However, the CH expends more energy level than the
member nodes for its processes which reduces the lifetime of
the network. To improvise the efficiency, the protocol
Energy-Efficient LEACH (EE-LEACH) is proposed. The CH
election is proposed in this protocol and it follows the other
activities as like as LEACH protocol. The evaluation result
shows the effectiveness of the approach used in EE-LEACH
protocol compared to the existing protocols.
1. INTRODUCTION
The sensors are attaining the peak of research in
recent period. Nowadays, the sensors are becoming an
important source in daily life which also creates the need
of developments and updates in tools and algorithms for
the sensor network. Whenever the WSN is under
discussion, the efficiency of utilising the energy (battery)
1.Krishnakumar,
Research Scholar,
2.Dr.V.Anuratha, Head,
Department of PG Computer Science,
Sree Saraswathi Thyagaraja College,
Pollachi.
of a sensor node becomes a top priority.
As long as the sensor node utilising the minimal
energy the lifetime of the network is improved. Therefore,
the energy efficiency in WSN is a serious task. The sensor
nodes are commonly deployed in an area where the human
involvements are very less. The sensor node has to collect
the information like heat, light, and so on from the
environment and forwards it to the BS. As of the dynamic
nature of the sensor nodes the node may long enough to
forward the collected data to the BS. In such situations, the
sensor node forwards the collected data to the nearby
neighbour node. The neighbour node forwards the data to
the BS or other neighbour node. Finally, the data reached
the destination. In this approach, the source sensor node
forwards the data to the neighbour node without analysing
that the node is closer to BS or not which may increase the
difficulties in reaching the data and the source node does
not consider whether the data is reached to the BS or not.
Likewise, there are some other issues which degrade the
performance of the WSN.
To resolve the above discussed issues,
Heinzelman et al., (2000) introduced Low-Energy
Adaptive Clustering Hierarchy (LEACH) protocol in
which the sensor nodes are grouped as clusters. The
clusters are formed based on probability function of
KGCAS - Prapti ISSN:2456-8708 Vol 1. Issue 2 Dec 2017
18
LEACH protocol. The probability function or threshold
function is detailed in Eq1.
Where T denotes threshold, n denotes number of
nodes, p denotes probability value. In LEACH the CH is
elected based on the random selection of number. Each
node chosen it value between zero (0) and one (1). Then
the node which holds lesser value than the threshold
function value is elected as CH. Suppose, more than a node
has a lesser value then the node which announces first that
it reaches the lesser value is elected as CH.
The CH then forwards the signal to its neighbour
nodes that it has been elected as CH and asks the
neighbours to join as member nodes. Also, the CH is
incharge for collecting the information from the
environment, aggregating it and forwarding to BS.
Therefore, in comparison to the member nodes the CH
needs more efficiency to complete all the tasks. The cluster
without CH or with a drained CH becomes useless until the
election of another CH. In LEACH protocol the CH is
elected in a round robin basis in which the node which is
elected as CH cannot act as CH for the next round.
LEACH follows Time Division Multiple Access (TDMA)
for round robin.
LEACH follows a convenient cluster formation,
TDMA schedule and so on however; the protocol fails in
electing energy efficient CH. To improvise the CH
election, EE-LEACH is proposed in which an efficient CH
election is attained than the existing protocols.
The section II discusses the review of literature
in which the other existing protocols are discussed. The
proposed protocol EE-LEACH is discussed in section III
where the proposed energy efficient radio model and vice-
CH election are discussed. Section IV discusses the
evaluation results of the proposed protocol and section V
concludes with conclusion and future enhancements.
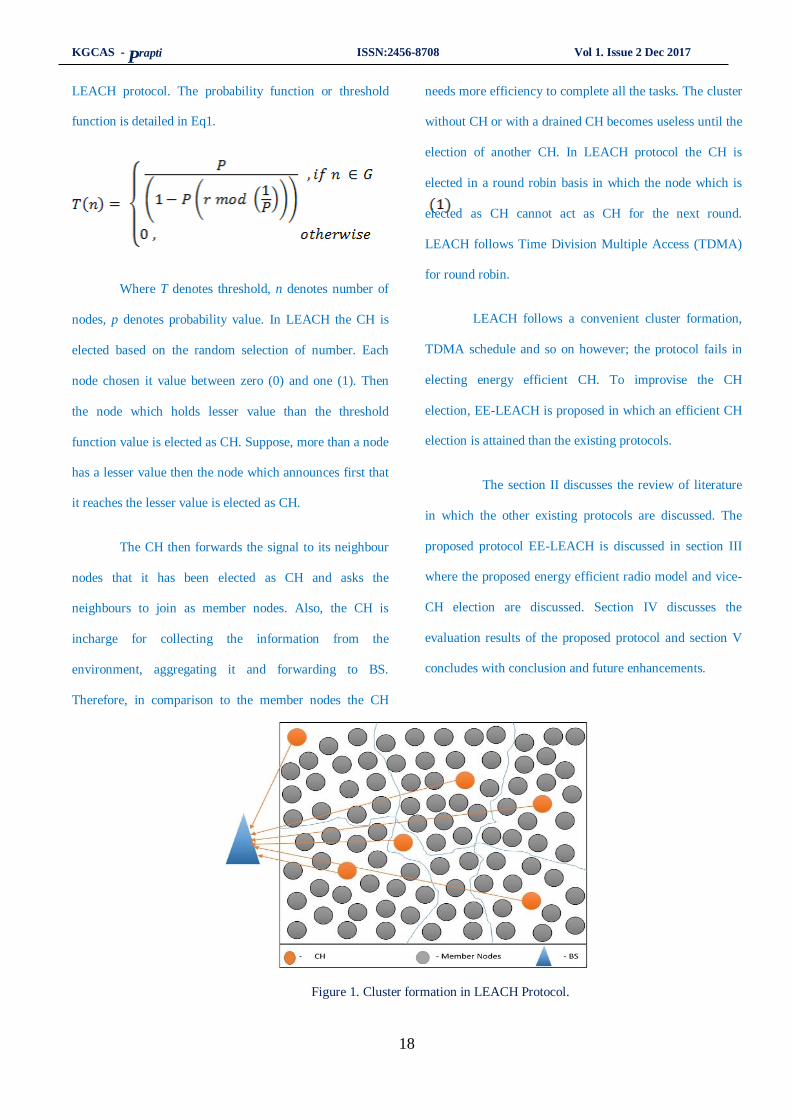
Figure 1. Cluster formation in LEACH Protocol.
KGCAS - Prapti ISSN:2456-8708 Vol 1. Issue 2 Dec 2017
19
Figure 1 shows the cluster formation in LEACH
protocol in which each CH forwards the collected
information from its member nodes to BS.
II. REVIEW OF LITERATURE
Al-Baz & El-Sayed (2017) proposed a new
algorithm for cluster head selection. The algorithm
selects the CH based on its distance and residual energy.
The algorithm also follows a better cluster formation
approach in which the single node cluster formations are
identified as well as rectified. However, the algorithm
lacks in improvising the network lifetime because of not
following the LEACH’s TDMA schedule. The energy
expends for the CH election may reduce because of
relaxing the TDMA schedule but still the rotation of CH
in each round improvise the lifetime and performance of
the network. The algorithm also lacks in intra cluster
communication because of maintaining the same sensor
node for collection of data from the member nodes and
forwarding to BS.
Umar et al., (2017) designs a dynamic re-
clustering LEACH protocol in which the CH is elected
in a dynamic manner. Whenever the energy of a CH
expends to a certain range then the CH election is called
on. The new CH is elected based on its residual energy.
The node which holds high energy level is elected as
CH for the next rounds. LEACH’s TDMA is remodified
according the proposed protocol. The proposed protocol
achieves energy efficiency for a small area network but
for a large area network the proposed protocol fails in
addressing the energy efficient CH election node. In
addition, the dynamic CH election needs to reform the
routing table and routing algorithm to be update fast to
maintains the connectivity which also reduces the
energy level of the CH to some extent.
Bongale et al., (2017) proposed Energy influenced
probability based LEACH protocol. The protocol elects the
CH based on the probability value of the proposed protocol.
Each sensor node is given a probability value based on the
residual energy level. The high residual energy level sensor
node is given a high probability value and low residual
energy level sensor node is assigned with a low probability
value. This probability value is assigned in each round so
that the CH node can be easily elected based on the
probability value. The probability value is also calculated
based on the expending level of energy at each round. The
sensor node which expends minimum energy is given a
higher probability than the node which expends more
energy. The protocol focused in CH election and not
consider effective cluster formation, better data
transmission and so on which drains the energy level in
ease.
Yang et al., (2017) proposed a clustering
algorithm for energy efficient management in WSN in
which the cluster formation is considered as highest
priority than the CH election. The CH is elected based
on the distance parameter and residual energy level. The
sensor node which maintains lesser distance to BS and
highest residual energy is identified and elected as CH.
The elected CH announces its election to the neighbour
nodes and asks to join. The radius which CH forwards
KGCAS - Prapti ISSN:2456-8708 Vol 1. Issue 2 Dec 2017
20
the message is longer than the radius of the sensor node.
Therefore, the CH can form with more number of
member nodes and reduces the election of more CH and
cluster formation. The clusters are formed with more
number of nodes which is useful in collecting the
information but it leads to data congestion. The
proposed algorithm lacks in resolving the data
congestion.
Rad et al., (2017) proposed Improved W-
LEACH routing protocol in which the LEACH
protocol’s threshold function is modified to elect the CH
based on the residual energy and the number of
neighbour nodes. The proposed protocol focused in
number of neighbours’ parameter than the residual
energy of a node. The sensor node which holds higher
number of neighbour nodes is elected as CH. This CH
election leads to drains the energy level of CH in
collecting the data form the neighbour node. The
protocol also not follows the TDMA schedule which
also drains the energy level of the sensor node in ease.
3. PROPOSED PROTOCOL
This section details the proposed protocol EE-
LEACH. This proposed protocol focused in designing the
CH election based on the residual energy of a node and
distance parameter. The distance parameter is used in two
ways to form better cluster. This proposed protocol elects
two CHs called: i) CH and ii) Vice-CH.
The CH is in charge for collection and
aggregation of information from the member nodes. As
well as, the vice-CH is in charge to forwards to collected
information to BS.
The distance parameter is considered as distance to
BS for election of CH and distance between neighbours for
election of vice- CH. The residual energy acts as same in
both elections.
1. Inter-cluster communication
The inter-cluster communication of this proposed
protocol forwards the aggregated information from
the vice-CH to the BS or to the neighbour node which
is nearer to BS. For inter-cluster communication, this
proposed protocol elects energy efficient CH using
Eq. 2 and Eq. 3.
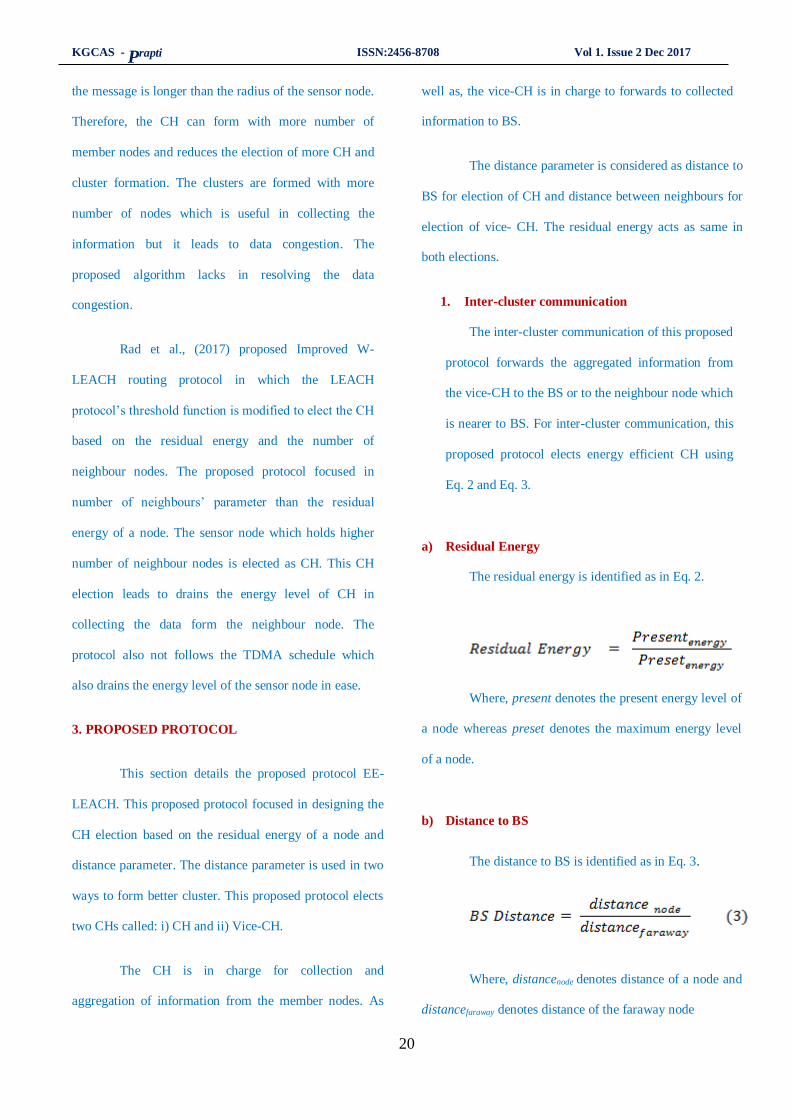
a) Residual Energy
The residual energy is identified as in Eq. 2.
Where, present denotes the present energy level of
a node whereas preset denotes the maximum energy level
of a node.
b) Distance to BS
The distance to BS is identified as in Eq. 3.
Where, distancenode denotes distance of a node and
distancefaraway denotes distance of the faraway node
KGCAS - Prapti ISSN:2456-8708 Vol 1. Issue 2 Dec 2017
21
2. Intra-cluster communication
The intra-cluster communication of this proposed
protocol collects the data form the member nodes and
aggregates the data and forward it to CH by vice-CH. The
vice-CH is elected using Eq. 2 and Eq. 4.
a) Distance between neighbours
The distance between neighbours is identified as in
Eq. 4.
(4)
Where, distancenode denotes distance of a node and
distancemaximum denotes maximum distance node.
This proposed protocol elects’ CH and vice-CH as
per LEACH’s TDMA schedule. The probability
function of LEACH protocol is modified as in Eq. 5.
(inter-cluster) and Eq.6.(intra-cluster).
and
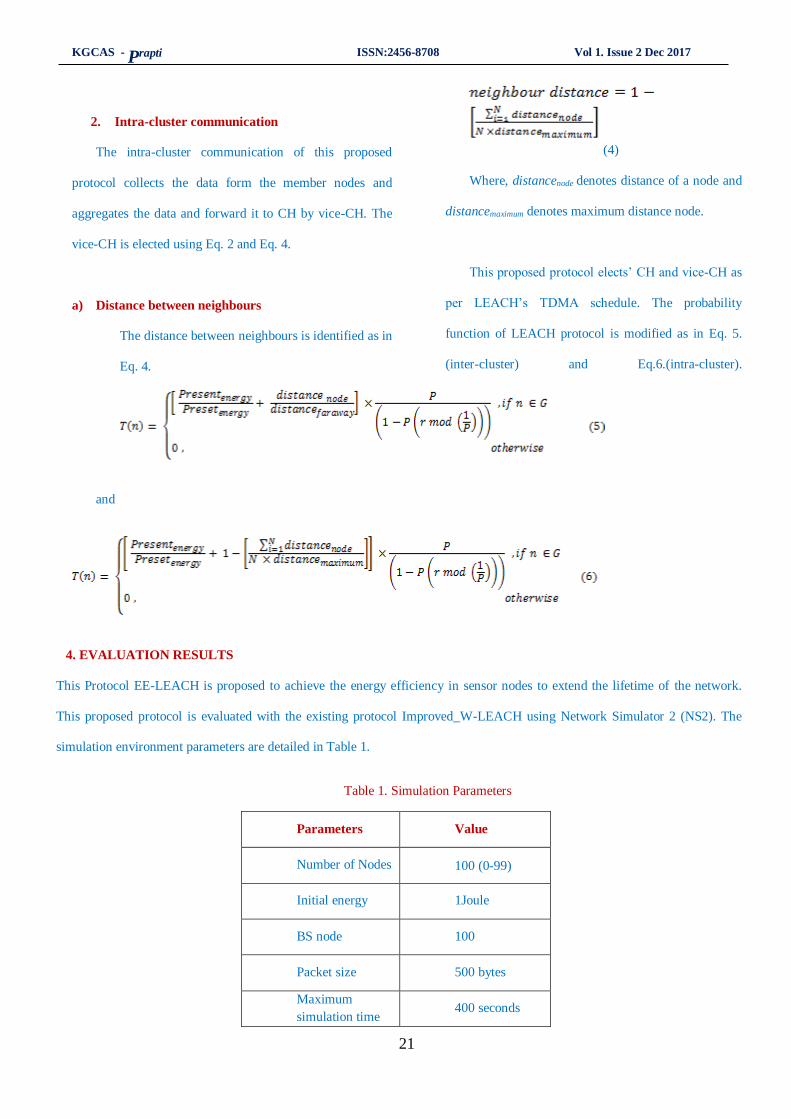
4. EVALUATION RESULTS
This Protocol EE-LEACH is proposed to achieve the energy efficiency in sensor nodes to extend the lifetime of the network.
This proposed protocol is evaluated with the existing protocol Improved_W-LEACH using Network Simulator 2 (NS2). The
simulation environment parameters are detailed in Table 1.
Table 1. Simulation Parameters
Parameters Value
Number of Nodes 100 (0-99)
Initial energy 1Joule
BS node 100
Packet size 500 bytes
Maximum
simulation time 400 seconds
KGCAS - Prapti ISSN:2456-8708 Vol 1. Issue 2 Dec 2017
22
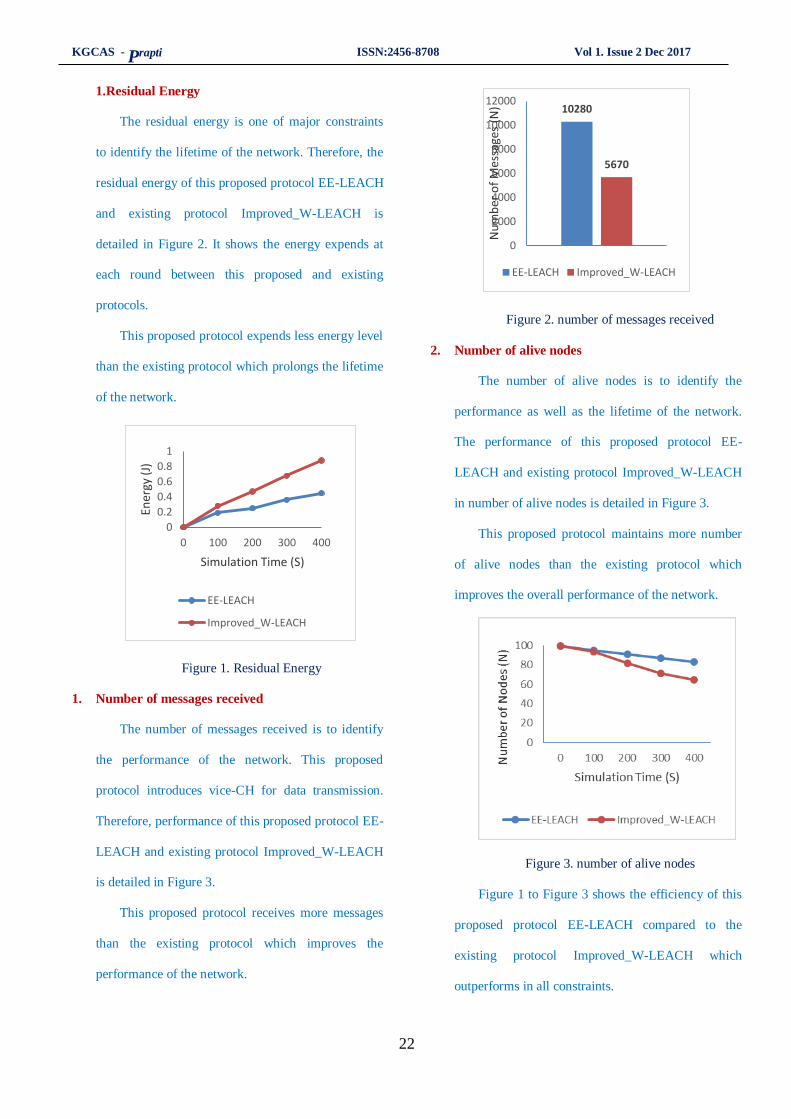
1.Residual Energy
The residual energy is one of major constraints
to identify the lifetime of the network. Therefore, the
residual energy of this proposed protocol EE-LEACH
and existing protocol Improved_W-LEACH is
detailed in Figure 2. It shows the energy expends at
each round between this proposed and existing
protocols.
This proposed protocol expends less energy level
than the existing protocol which prolongs the lifetime
of the network.
0
0.2
0.4
0.6
0.8
1
0 100 200 300 400
Ener
gy (
J)
Simulation Time (S)
EE-LEACH
Improved_W-LEACH
Figure 1. Residual Energy
1. Number of messages received
The number of messages received is to identify
the performance of the network. This proposed
protocol introduces vice-CH for data transmission.
Therefore, performance of this proposed protocol EE-
LEACH and existing protocol Improved_W-LEACH
is detailed in Figure 3.
This proposed protocol receives more messages
than the existing protocol which improves the
performance of the network.
10280
5670
0
2000
4000
6000
8000
10000
12000
Nu
mb
er o
f M
essa
ges
(N)
EE-LEACH Improved_W-LEACH
Figure 2. number of messages received
2. Number of alive nodes
The number of alive nodes is to identify the
performance as well as the lifetime of the network.
The performance of this proposed protocol EE-
LEACH and existing protocol Improved_W-LEACH
in number of alive nodes is detailed in Figure 3.
This proposed protocol maintains more number
of alive nodes than the existing protocol which
improves the overall performance of the network.
Figure 3. number of alive nodes
Figure 1 to Figure 3 shows the efficiency of this
proposed protocol EE-LEACH compared to the
existing protocol Improved_W-LEACH which
outperforms in all constraints.
KGCAS - Prapti ISSN:2456-8708 Vol 1. Issue 2 Dec 2017
23
V. CONCLUSION
The improvements in WSN creates the need of energy efficient CH to prolong the lifetime of the network. This
proposed protocol EE-LEACH concentrates in electing CH which carries the aggregated information to BS and this protocol
introduces the vice-CH which is concentrates in collecting and aggregating the information from the member nodes. This
approach improves the performance and prolongs the lifetime of the network. The evaluation results prove the performance
of the proposed protocol EE-LEACH. The future development is to improve the vice-CH functionalities such as cluster
formation, cluster movement and so on.
REFERENCES
1. Heinzelman, W. R., Chandrakasan, A., &
Balakrishnan, H. (2000, January). Energy-efficient
communication protocol for wireless microsensor
networks. In System sciences, 2000. Proceedings of
the 33rd annual Hawaii international conference on
(pp. 10-pp). IEEE.
2. Al‐Baz, A., & El‐Sayed, A. (2017). A new algorithm
for cluster head selection in LEACH protocol for
wireless sensor networks. International Journal of
Communication Systems.
3. Umar, S., Subbarayudu, Y., Kumar, K. K., &
Bashwanth, N. (2017). Designing of Dynamic Re-
clustering Leach Protocol for Calculating Total
Residual Time and Performance. International
Journal of Electrical and Computer Engineering
(IJECE), 7(3).
4. Bongale, A. M., Swarup, A., & Shivam, S. (2017,
February). EiP-LEACH: Energy influenced
probability based LEACH protocol for Wireless
Sensor Network. In Emerging Trends & Innovation
in ICT (ICEI), 2017 International Conference on (pp.
77-81). IEEE.
5. Yang, S. S., Shim, J. S., Jang, Y. H., Ju, Y. W., &
Park, S. C. (2017). Design of Clustering Algorithm
for Efficient Energy Management in Wireless Sensor
Network Environments. In Advanced Multimedia and
Ubiquitous Engineering (pp. 607-612). Springer,
Singapore.
6. Rad, F., Moghtaderinasab, Z., & Parvin, H. (2017).
An Improved W-LEACH Routing Protocol in
Wireless Sensor Network. Journal of Advances in
Computer Research, 8(2), 39-51.
KGCAS - Prapti ISSN:2456-8708 Vol 1. Issue 2 Dec 2017
24
A Study on Account Holders Satisfaction
towards Service Rendered by Keeranatham
Agricultural Credit Society, Coimbatore L.Lovely Lourds Preethi,
Abstract
Agriculture is the back bone of our country. Many
villages are based on the income they receive from agriculture
only. But for doing agriculture in now a days the villagers
don’t get much capital. For this problem the Government
started co-operative banks thought the country. The villagers
doing agriculture around the village, Keeranatham was
affected by insufficiency of finance from banks, so they
requested government to start a separate agriculture bank in
their area. As per the farmers request the government started
this bank to provide short term loans, loans with low interest,
quality seeds and good agricultural banking service to the
farmers and develop their income from agriculture.
1. INTRODUCTION
There are 4,595 Primary Agricultural Cooperative Banks at
the village level, providing short term and medium term
credit facilities to the agriculturists. These banks have
covered as on 31.3.02 85.96% of the agricultural
operational holdings in the State of which 79.57% belong to
weaker sections. Distinguishes between agricultural service
cooperatives, which provide various services to their
individually farming members, and agricultural production
cooperatives, where production resources (land, machinery)
are pooled and members farm jointly.
Assistant Professor,
Department of Commerce,
Bishop Ambrose College,
Coimbatore.
Agricultural production cooperatives are relatively rare in
the world, and known examples are limited to
collective in former socialist countries and the kibbutzim in
Israel.
The default meaning of agricultural cooperative in English
is usually an agricultural service cooperative, which is the
numerically dominant form in the world. There are two
primary types of agricultural service cooperatives, supply
cooperative and marketing cooperative. Supply cooperatives
supply their members with inputs for agricultural
production, including seeds, fertilizers, fuel, and machinery.
Marketing cooperatives are established by farmers to
undertake transformation.
The co-operative movement, which is the largest socio-
economic movement in the world, has contributed
significantly to the alleviation of poverty, creation of
productive employment as well as the enhancement of
social integration in the country. The co-operative sector is
mainly concerned with agricultural credit, marketing of
agricultural produce and distribution of fertilizers and
pesticides and other essential commodities.
SHORT-TERM LOANS
The co-operative credit institutions were evolved mainly to
check the spurious practices of the moneylenders and to
KGCAS - Prapti ISSN:2456-8708 Vol 1. Issue 2 Dec 2017
25
provide access to credit to various sections of the population
at reasonable rates of interest. The short term credit
structure in Tamil Nadu has a three-tier structure,
comprising of the Tamil Nadu State Apex Co-operative
Bank, (TNSCB) with 41 branches at the state level, 23
District Central Co-operative Banks (inclusive of one
Industrial Co-operative bank) with 750 branches at the
district level and around447 Primary Agricultural Credit
Societies (PACS) at the grassroot level, catering to the
needs of the farmers in 16317 villages (as on 31.3.2005).
The short term and medium term agricultural loans
provided by the Primary Agricultural Co-operative Banks
during the Tenth Five Year Plan wereRs.5043.93 crore and
Rs.291.51 crore as against the Target of Rs.7500 crore for
Short term and Rs. 625 crore for medium term respectively.
The short fallin achieving the target in short term credit
supply is mainly due to the continuous drought conditions
that prevailed in the state from 2002-03 to2004-05.
LONG TERM LOANS
The Tamilnadu Co-operative State Agriculture and
Rural Development Bank (TNSCARDB) at the state level
and Primary Co-operative Agricultural and Rural
Development banks (PCARDB) at the Taluk / Block level
constitute the two tiers of the long-term credit structure.
These banks provide loans totheir members for
operations related to agriculture and allied activities like
minor irrigation, cultivation of horticulture and Plantation
crops, poultry keeping, dairying, sheep breeding, sericulture
and purchase of tyre carts, tractors, power tillers, laying of
pipelines, construction of cattle shed, farmhouse etc, on a
schematic basis.
The Tamilnadu Co-operative State Agricultural
Rural Development Bank mobilizes the funds required for
loaning operations through floating of Special Development
Debentures. The Central, State Governments and NABARD
subscribe to these debentures.
Company Profile:
Keeranatham primary agriculture co-operative loan
society was Registered at 02.06.1930 and the bank activities
was started at 09.06.1930.
This bank functioning under the co-operative
societies act 1983 and rules 102 (8) of Tamilnadu societies
Rules 1988. The bank is placed under “B” class for the year
under Audit.
There were members 972 at the end of the year as
against 1304 at the beginning of the year. The share capital
of the members amounted to Rs 6, 30,940 againstRs ,56,405
at the beginning of the year.
The value of stock at the beginning of the year was
1,17,357.68 stock of the value of Rs 34,64,627.40 bought
during the year less purchase excluding sales return etc.
amounted to Rs 36,36,569.20. The value of closing stock at
the end of the year was 1, 4,427.47. Net profit should be
disbursed in accordance with the Act rules and by laws of
the society.

KGCAS - Prapti ISSN:2456-8708 Vol 1. Issue 2 Dec 2017
26
2. OBJECTIVE OF THE STUDY:
The objectives of the study are:
To study the account holders satisfaction towards
service rendered by bank.
To find out the problems related to A/c holders
To find out the influencing factors of the A/c holders
To offer suggestions to growth and development of
the bank.
3. SCOPE OF THE STUDY:
The study has been under taken:-
To assess the banks real position while providing
services to their customers.
To understand the Account holders satisfaction level
and provide solutions for their problems.
To know the real situation of the bank while
implementing new policies and loans.
To understand the Account holders expectations and
fulfill their needs from this study.
4. LIMITATIONS OF THE STUDY:
Limitations of the study are:
The respondents of this bank would not have
reveled negative issues of the bank.
The satisfaction level of the Account holders
change from time to time, Hence the result of the
project may not be applicable in the long run.
The information provided by the respondents would
be biased to certain extent.
Science most of the respondents are from rural areas
and they would not be exposed to good banking
service, hence they would think the present services
provided by this bank is the best.
5. RESEARCH METHODOLOGY:
RESEARCH DESIGN:
Research design is the basic frame work which
provides guideline for the rest of research process. It
specifies the methods of data collection and analysis. In this
study descriptive research designing is used.
DESCRIPTIVE RESEARCH DESIGN
Descriptive research design describes the Account
holder’s satisfaction towards service rendered by
Keeranatham primary agriculture bank. The main purpose
of this is to setting knowledge about to subject.
POPULATION
The population (952) specifies that the Account
holders atKeeranatham primary agriculture loan society.
SAMPLING DESIGN:
Sampling size:
This study contains 110 Account holders as
sample size.
DATA COLLECTION METHOD:
For this study two types of data were collected. One is
primary data and another One is the secondary data.
KGCAS - Prapti ISSN:2456-8708 Vol 1. Issue 2 Dec 2017
27
Primary data:
The Primary data were collected for the first time and
thus happen to be Original in character. Primary data were
collected through distributing questionnaire to the
respondents.
Secondary data:
The secondary data were already available in the
records of the bank. The Company profile and Account
holder’s details are secondary data of the bank.
6. STATISTICAL TECHNIQUES USED:
Percentage method:
The number of respondents of each category is
summarized to percentage for the convenience to the other
statistical tools namely pie chart, and bar Diagrams.
Chi square:
It is used to find the relationship between two
items.
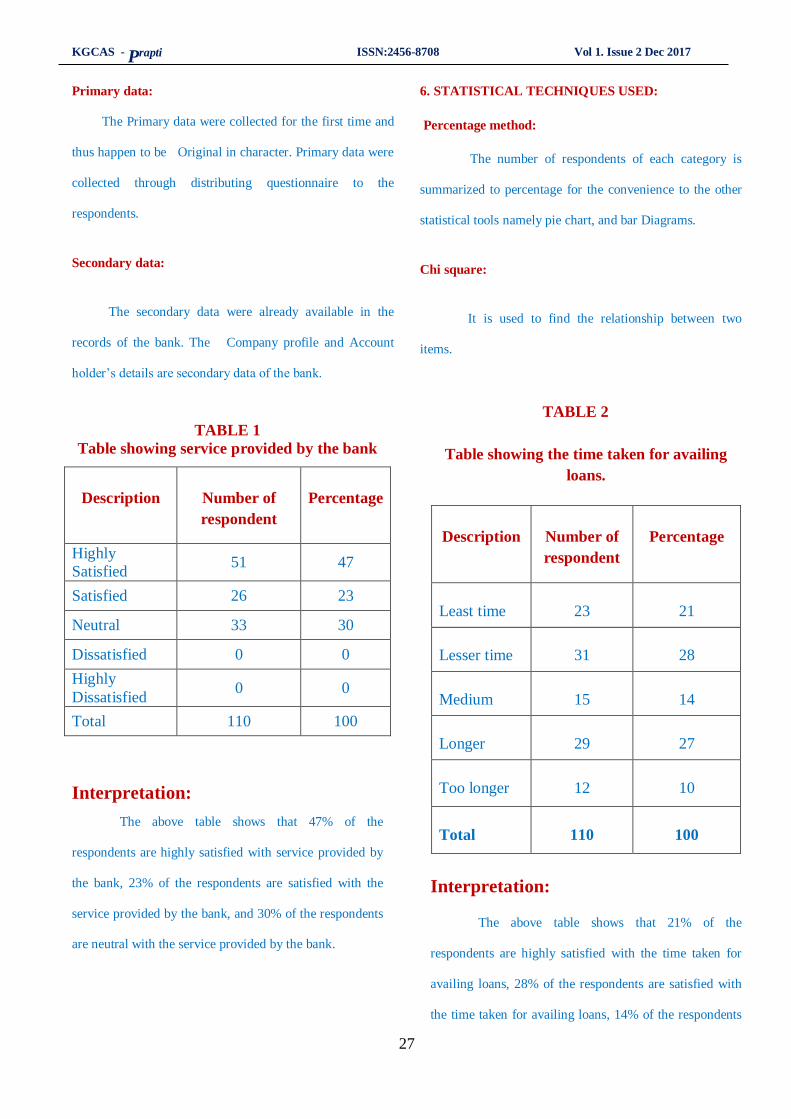
TABLE 1
Table showing service provided by the bank
Description
Number of
respondent
Percentage
Highly
Satisfied 51 47
Satisfied 26 23
Neutral 33 30
Dissatisfied 0 0
Highly
Dissatisfied 0 0
Total 110 100
Interpretation:
The above table shows that 47% of the
respondents are highly satisfied with service provided by
the bank, 23% of the respondents are satisfied with the
service provided by the bank, and 30% of the respondents
are neutral with the service provided by the bank.
TABLE 2
Table showing the time taken for availing
loans.
Description
Number of
respondent
Percentage
Least time
23
21
Lesser time
31
28
Medium
15
14
Longer
29
27
Too longer
12
10
Total
110
100
Interpretation:
The above table shows that 21% of the
respondents are highly satisfied with the time taken for
availing loans, 28% of the respondents are satisfied with
the time taken for availing loans, 14% of the respondents
KGCAS - Prapti ISSN:2456-8708 Vol 1. Issue 2 Dec 2017
28
are neutrally with the time taken for availing loans, 27%
of the respondents are dissatisfied with the time taken for
availing loans and 10% of the respondents are highly
dissatisfied with the time taken for availing loans from
this bank.
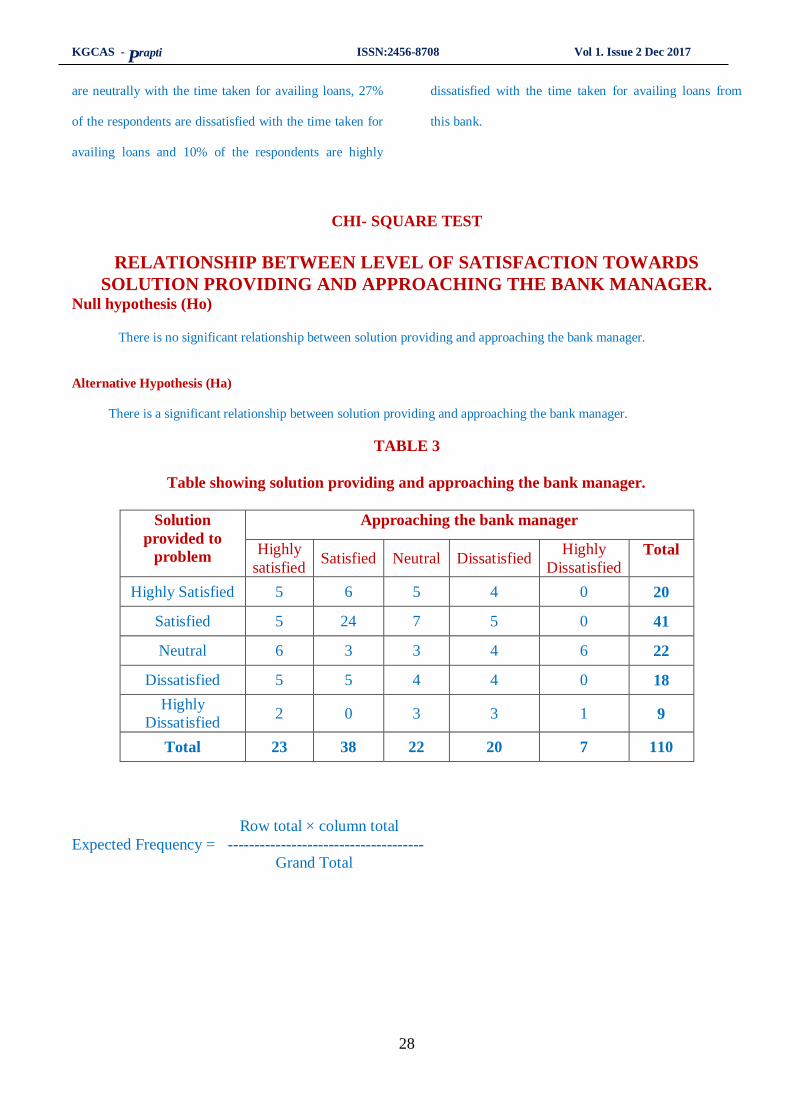
CHI- SQUARE TEST
RELATIONSHIP BETWEEN LEVEL OF SATISFACTION TOWARDS
SOLUTION PROVIDING AND APPROACHING THE BANK MANAGER. Null hypothesis (Ho) There is no significant relationship between solution providing and approaching the bank manager.
Alternative Hypothesis (Ha)
There is a significant relationship between solution providing and approaching the bank manager.
TABLE 3
Table showing solution providing and approaching the bank manager.
Solution
provided to
problem
Approaching the bank manager
Highly
satisfied Satisfied Neutral Dissatisfied
Highly
Dissatisfied
Total
Highly Satisfied 5 6 5 4 0 20
Satisfied 5 24 7 5 0 41
Neutral 6 3 3 4 6 22
Dissatisfied 5 5 4 4 0 18
Highly
Dissatisfied 2 0 3 3 1 9
Total 23 38 22 20 7 110
Row total × column total
Expected Frequency = -------------------------------------
Grand Total
KGCAS - Prapti ISSN:2456-8708 Vol 1. Issue 2 Dec 2017
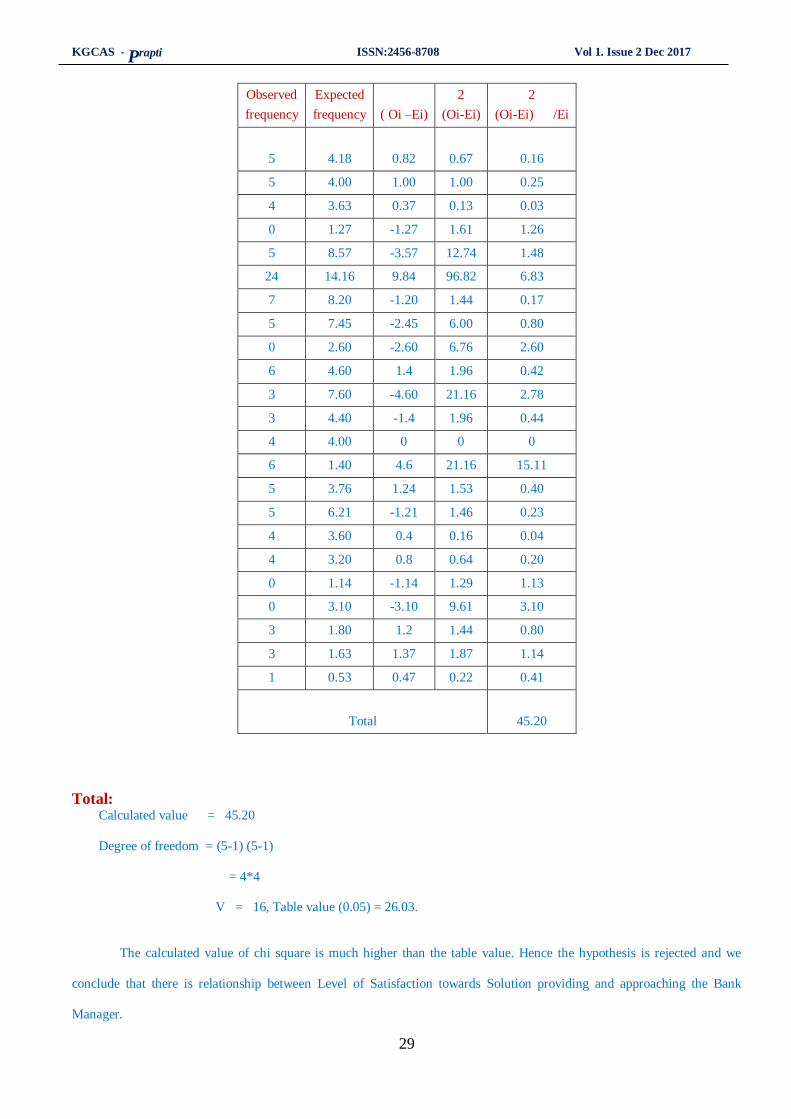
29
Observed
frequency
Expected
frequency
( Oi –Ei)
2
(Oi-Ei)
2
(Oi-Ei) /Ei
5
4.18
0.82
0.67
0.16
5 4.00 1.00 1.00 0.25
4 3.63 0.37 0.13 0.03
0 1.27 -1.27 1.61 1.26
5 8.57 -3.57 12.74 1.48
24 14.16 9.84 96.82 6.83
7 8.20 -1.20 1.44 0.17
5 7.45 -2.45 6.00 0.80
0 2.60 -2.60 6.76 2.60
6 4.60 1.4 1.96 0.42
3 7.60 -4.60 21.16 2.78
3 4.40 -1.4 1.96 0.44
4 4.00 0 0 0
6 1.40 4.6 21.16 15.11
5 3.76 1.24 1.53 0.40
5 6.21 -1.21 1.46 0.23
4 3.60 0.4 0.16 0.04
4 3.20 0.8 0.64 0.20
0 1.14 -1.14 1.29 1.13
0 3.10 -3.10 9.61 3.10
3 1.80 1.2 1.44 0.80
3 1.63 1.37 1.87 1.14
1 0.53 0.47 0.22 0.41
Total
45.20
Total: Calculated value = 45.20
Degree of freedom = (5-1) (5-1)
= 4*4
V = 16, Table value (0.05) = 26.03.
The calculated value of chi square is much higher than the table value. Hence the hypothesis is rejected and we
conclude that there is relationship between Level of Satisfaction towards Solution providing and approaching the Bank
Manager.
KGCAS - Prapti ISSN:2456-8708 Vol 1. Issue 2 Dec 2017
30
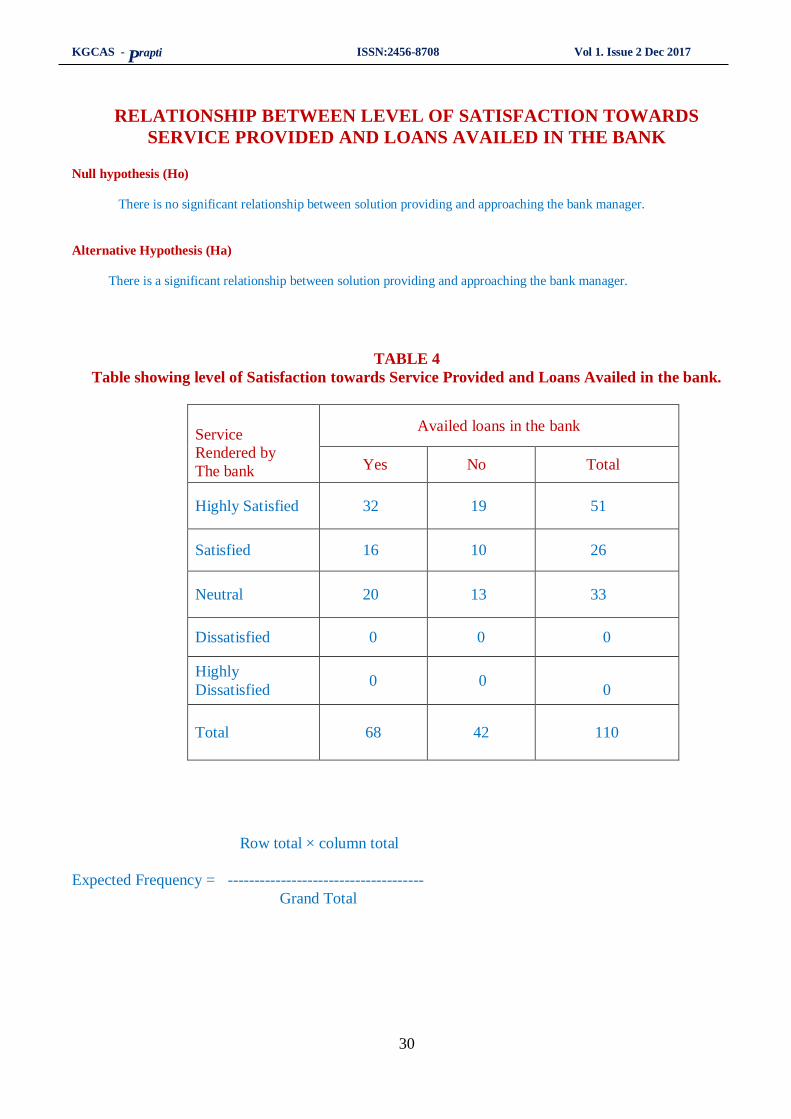
RELATIONSHIP BETWEEN LEVEL OF SATISFACTION TOWARDS
SERVICE PROVIDED AND LOANS AVAILED IN THE BANK
Null hypothesis (Ho)
There is no significant relationship between solution providing and approaching the bank manager.
Alternative Hypothesis (Ha)
There is a significant relationship between solution providing and approaching the bank manager.
TABLE 4
Table showing level of Satisfaction towards Service Provided and Loans Availed in the bank.
Service
Rendered by
The bank
Availed loans in the bank
Yes No Total
Highly Satisfied 32 19 51
Satisfied 16 10 26
Neutral 20 13 33
Dissatisfied 0 0 0
Highly
Dissatisfied 0 0
0
Total
68
42
110
Row total × column total
Expected Frequency = -------------------------------------
Grand Total
KGCAS - Prapti ISSN:2456-8708 Vol 1. Issue 2 Dec 2017
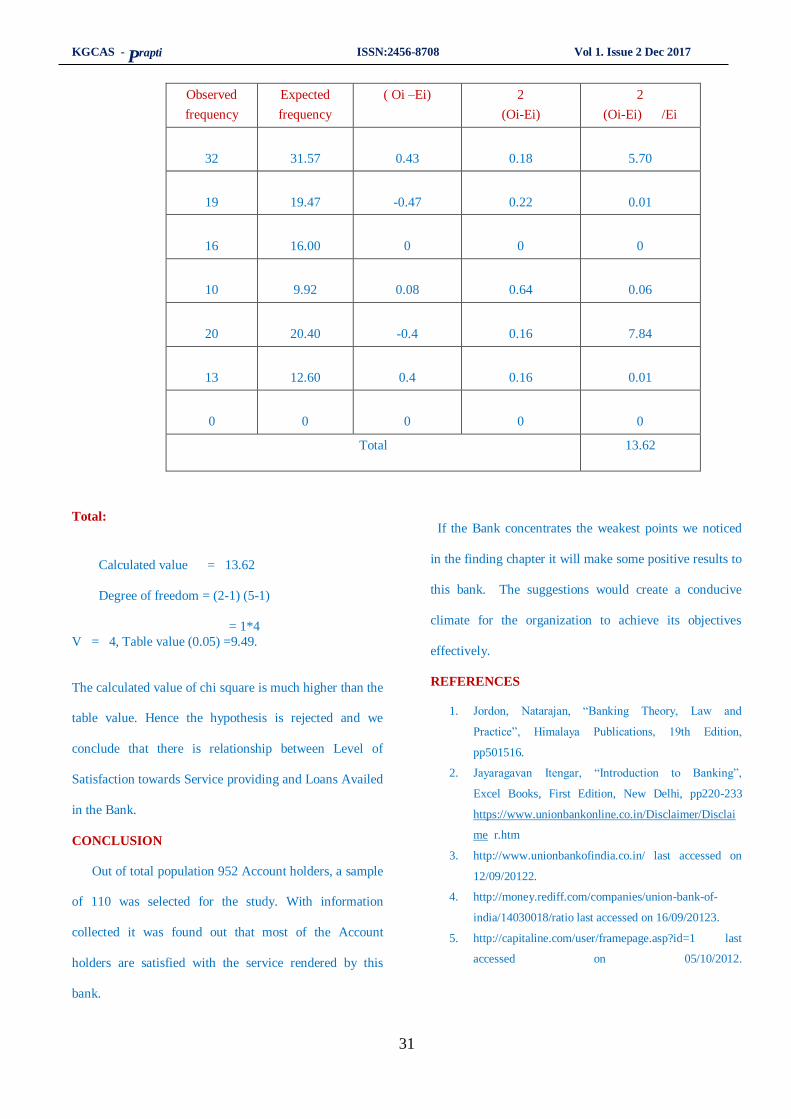
31
Observed
frequency
Expected
frequency
( Oi –Ei) 2
(Oi-Ei)
2
(Oi-Ei) /Ei
32
31.57
0.43
0.18
5.70
19
19.47
-0.47
0.22
0.01
16
16.00
0
0
0
10
9.92
0.08
0.64
0.06
20
20.40
-0.4
0.16
7.84
13
12.60
0.4
0.16
0.01
0
0
0
0
0
Total 13.62
Total:
Calculated value = 13.62
Degree of freedom = (2-1) (5-1)
= 1*4
V = 4, Table value (0.05) =9.49.
The calculated value of chi square is much higher than the
table value. Hence the hypothesis is rejected and we
conclude that there is relationship between Level of
Satisfaction towards Service providing and Loans Availed
in the Bank.
CONCLUSION
Out of total population 952 Account holders, a sample
of 110 was selected for the study. With information
collected it was found out that most of the Account
holders are satisfied with the service rendered by this
bank.
If the Bank concentrates the weakest points we noticed
in the finding chapter it will make some positive results to
this bank. The suggestions would create a conducive
climate for the organization to achieve its objectives
effectively.
REFERENCES
1. Jordon, Natarajan, “Banking Theory, Law and
Practice”, Himalaya Publications, 19th Edition,
pp501516.
2. Jayaragavan Itengar, “Introduction to Banking”,
Excel Books, First Edition, New Delhi, pp220-233
https://www.unionbankonline.co.in/Disclaimer/Disclai
me r.htm
3. http://www.unionbankofindia.co.in/ last accessed on
12/09/20122.
4. http://money.rediff.com/companies/union-bank-of-
india/14030018/ratio last accessed on 16/09/20123.
5. http://capitaline.com/user/framepage.asp?id=1 last
accessed on 05/10/2012.

KGCAS - Prapti ISSN:2456-8708 Vol 1. Issue 2 Dec 2017
32
A Study Pertaining to Test of Equality of
Selected Indian Pharmaceutical Companies Dr.Ramya
1. INTRODUCTION
The Indian pharmaceutical industry currently tops
amongst the India’s science based industries with wide
ranging capabilities in the complex field of drug
manufacture and technology. The pharmaceutical industry
in India is the world’s third largest in terms of volume and
stands 14th terms of value. India’s pharmaceutical market
grew at 15.7 per cent during the year 2011. The Indian
pharmaceutical industry is expected to grow at a rate of 9.9
per cent in 2010 and after that 9.5 per cent till 20151(
www. Indiabiznews.com). The Indian pharmaceutical
market is expected to touch US$ 74 billion sales instead of
US$11 billion sales by 2020. India joined among the
league of top ten global pharmaceutical markets in terms of
sales by 2020 with value reaching US$ 50 billion2. Exports
of pharmaceutical products from India increased from US$
6.23billion in 2006-076 to US$ 8.7 billion in 2008-09. The
Indian pharmaceutical sector is highly split with more than
20,000 registered units. It has expanded hugely in the last
two decades. The pharmaceutical industry in India is an
extremely fragmented market with severe price
competition and government price control.
Assistant Professor,
Department of Commerce (CA),
Sankara college of Science and Commerce,
Coimbatore.
The pharmaceutical industry in India meet around
70% of the country’s demand for bulk drugs, drug
intermediates, pharmaceutical formulations, chemicals,
tablets, capsules, orals and injectable.
There are approximately 250 large units and about
800 small scale units in India. Which from the core of
pharmaceutical industry in India ( including 5 central
sector units). The government stated to encourage the
growth of drug manufacturing by Indian companies in the
early 1960’s and with the patents Act in 1970. However,
economic liberalization in 90’s the former prime minister
P.V. Narashima Rao and then finance minister Dr.
Manmohan singh enabled the industry to become what it is
today3
The pharma companies have started facing challenges in
domestic market due to increase in competition from
unlisted MNCs in this segment. They are rapidly
expanding their field force to extend their geographical
reach and also Pharmaceutical companies entered a
difficult period where shareholders, the market and
regulators have created significant pressures for changing
with in the industry. The pharma industry also have
challenges particularly to improve infrastructure, new
product patent, drug price control and quality management
and R&D programs.
In the 1960’s the government started to encourage
the growth of drug manufacturing by Indian companies,
KGCAS - Prapti ISSN:2456-8708 Vol 1. Issue 2 Dec 2017
33
and also passed the patents Act in 1970. India currently
holds a modest 1-2% share, but it has been growing up
approximately 10% per year in terms of global markets.
India with its innovatively engineered genetic drugs and
active pharmaceutical ingredients (API), has gained a good
foothold in the global scene. And today India is seeking to
become a major player in outsourced clinical research as
well as contract and manufacturing and research4
((Indianmirror.com)
Indian pharma Industry emerged as developing industry
which has been able to prepare H1N1 vaccine. The
national institutes of Health, funded the scientists and the
vaccine was developed. This new vaccine works against
the old virus because the year 1918 and the 2009 strains of
H1N1 influenza share features that allow vaccine
generated antibodies both viruses. One more mile stone in
the industry is that India’s first domestic vaccine against
swine flu was made possible.
The demand for pharmaceutical products in India is
significant and is driven by many factors like low drug
penetration, rising middle class and disposable income,
increased government and private spending on healthcare
infrastructure, increasing medical insurance penetration,
changing demographic pattern and rise in chronic lifestyle
related diseases: adoption of product patents, and
aggressive market penetration driven by the relatively
smaller companies5 ( www.Indianmirror.com)
1.2. NEED FOR THE STUDY
In 2010, April 14, the Indian Pharmaceutical
Industry has been placed among the top four emerging
markets in pharma industry by the market research report
published by IMS ( Indian Medical Science ) Health
India. In the last few years, the global pharmaceutical
industry has shown a high interest in the Indian pharma
industry because of its sustained economic growth,
healthcare reforms and patent-related legislation.
Indian domestic pharmaceutical market has seen a growth
at a CAGR of about 12% in the last 5 years. About 67
Million Indians are expected to reach the age of 67 years
by 2011. People of this age group spend around 3 to 4
times more on drugs than people in younger age groups.
This indicates substantial growth of Indian pharmaceutical
industry. Patented drug are expected to have a 10% market
share of pharmaceutical industry in 2010. Every business
organization, whether manufacturing oriented or service
oriented, needs finance, i.e., money for carrying its
activities. Though business organization gets sufficient
money for carrying its activities, success of the business
depends on how well the organization manages them. That
is, it depends on how well a business organization funds its
capital and how efficiently it operates out of the invested
capital and to generate profit. While the success of a
business is also a subjective measure of how well a firm
can finance its assets and make use of the assets to
generate revenues, the business can be stable and healthy if
its financial performance consistently yields profit. These
measures often determine reorganization is considered to
be inefficient, if the performance level is often to be low,
even if it is making profit.
KGCAS - Prapti ISSN:2456-8708 Vol 1. Issue 2 Dec 2017
34
1.3. STATEMENT OF THE PROBLEM
The numbers of purely Indian pharmaceutical
companies are low. Indian pharma industry is mainly
operated as well as controlled by dominant foreign
companies having subsidiaries in India due to availability
of cheap labour in India at low cost. In 2002, over 20,000
registered drugs manufactures in India sold $9 billion
worth of formulations and bulk drugs. 85% of these
formulations were sold in India while over 60% of the bulk
drugs were exported ( www.wikipedia.com)
Over the past decade, pharmaceutical companies have
entered a difficult period where shareholders, the market
and regulators have created significant pressures for
changes within the industry. The core issues for most of
drug companies are declining productivity of in-house
R&D, patent expiration of number of block buster drugs,
increasing legal and regulatory concern, and pricing issue.
The larger pharmaceutical companies are shifting to new
business model with greater outsourcing of discovery
services, clinical research and manufacturing.
Current global financial conditions and the threat of a
broad recession accelerated the timetable for implementing
transformational changes in global organizations, as the
industry confronts lower corporate stock prices and an
increasingly cost-averse customer. Leaders of the largest
global pharmaceutical companies recognize the need for
transformational change in their organizations, but will
need to move swiftly to ensure sustained growth. About 67
Million Indians are expected to reach the age of 67 years
by 2011. People of this age group spend around 3 to 4
times more on drugs than people in younger age groups.
This indicates substantial growth of Indian pharmaceutical
industry and the patented drugs are expected to have a 10
per cent market share of pharmaceutical industry in 2010.
The Indian pharmaceutical industry would have to
contend with several challenges particularly
Effects of new product patent, Drug price control,
Regulatory reforms Infrastructure development
Quality management and Conformance to global
standards.
In the above challenges financial performance is
playing a vital role and a sound financial strength is met all
these challenges so it is necessary to find out the overall
financial status of the pharmaceutical industry is essential.
Financial performance analysis is the process of
determining the operation and financial characteristics of a
firm from accounting and financial statements. The ability
of an organization is to analyze its financial position is
essential for improving its competitive position in the
market. Through a careful analysis of its financial
performance, the organization can identify opportunities to
improve performance of the industry.
From the above point of view the present study is focused
to examine the impact of selected financial parameters,
their growth performance and their contributions towards
earnings of the particular Indian Pharmaceuticals
Companies.
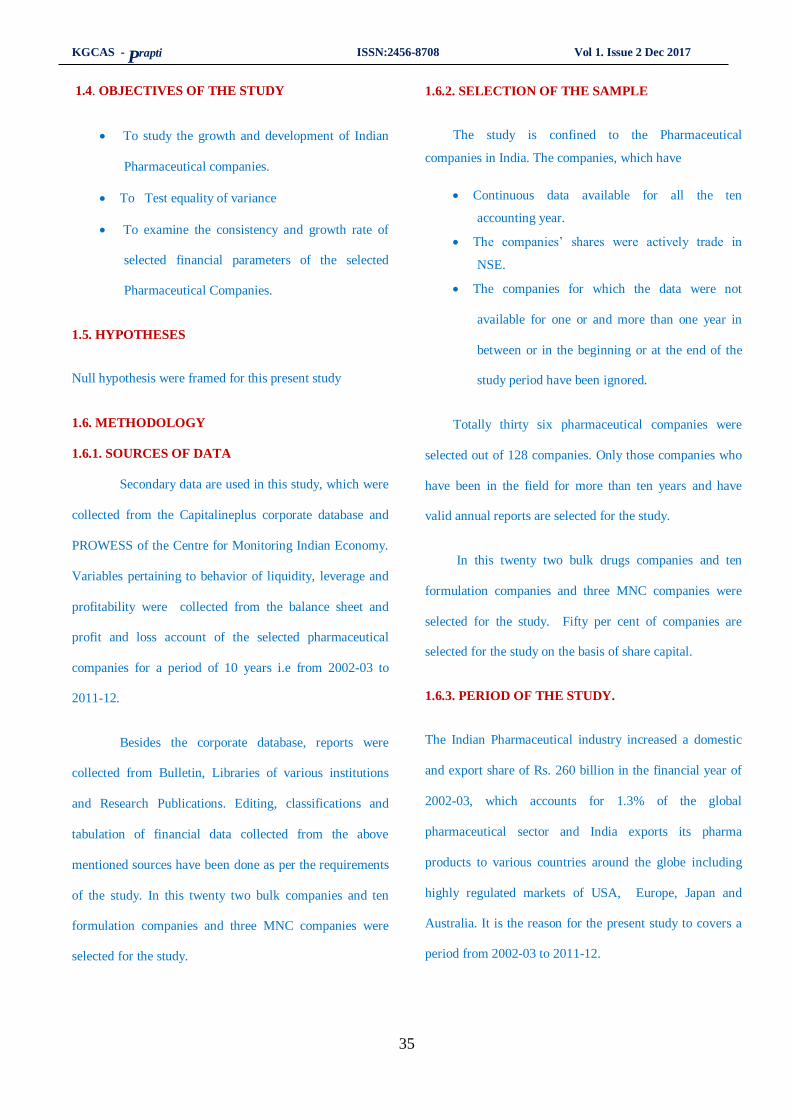
KGCAS - Prapti ISSN:2456-8708 Vol 1. Issue 2 Dec 2017
35
1.4. OBJECTIVES OF THE STUDY
To study the growth and development of Indian
Pharmaceutical companies.
To Test equality of variance
To examine the consistency and growth rate of
selected financial parameters of the selected
Pharmaceutical Companies.
1.5. HYPOTHESES
Null hypothesis were framed for this present study
1.6. METHODOLOGY
1.6.1. SOURCES OF DATA
Secondary data are used in this study, which were
collected from the Capitalineplus corporate database and
PROWESS of the Centre for Monitoring Indian Economy.
Variables pertaining to behavior of liquidity, leverage and
profitability were collected from the balance sheet and
profit and loss account of the selected pharmaceutical
companies for a period of 10 years i.e from 2002-03 to
2011-12.
Besides the corporate database, reports were
collected from Bulletin, Libraries of various institutions
and Research Publications. Editing, classifications and
tabulation of financial data collected from the above
mentioned sources have been done as per the requirements
of the study. In this twenty two bulk companies and ten
formulation companies and three MNC companies were
selected for the study.
1.6.2. SELECTION OF THE SAMPLE
The study is confined to the Pharmaceutical
companies in India. The companies, which have
Continuous data available for all the ten
accounting year.
The companies’ shares were actively trade in
NSE.
The companies for which the data were not
available for one or and more than one year in
between or in the beginning or at the end of the
study period have been ignored.
Totally thirty six pharmaceutical companies were
selected out of 128 companies. Only those companies who
have been in the field for more than ten years and have
valid annual reports are selected for the study.
In this twenty two bulk drugs companies and ten
formulation companies and three MNC companies were
selected for the study. Fifty per cent of companies are
selected for the study on the basis of share capital.
1.6.3. PERIOD OF THE STUDY.
The Indian Pharmaceutical industry increased a domestic
and export share of Rs. 260 billion in the financial year of
2002-03, which accounts for 1.3% of the global
pharmaceutical sector and India exports its pharma
products to various countries around the globe including
highly regulated markets of USA, Europe, Japan and
Australia. It is the reason for the present study to covers a
period from 2002-03 to 2011-12.
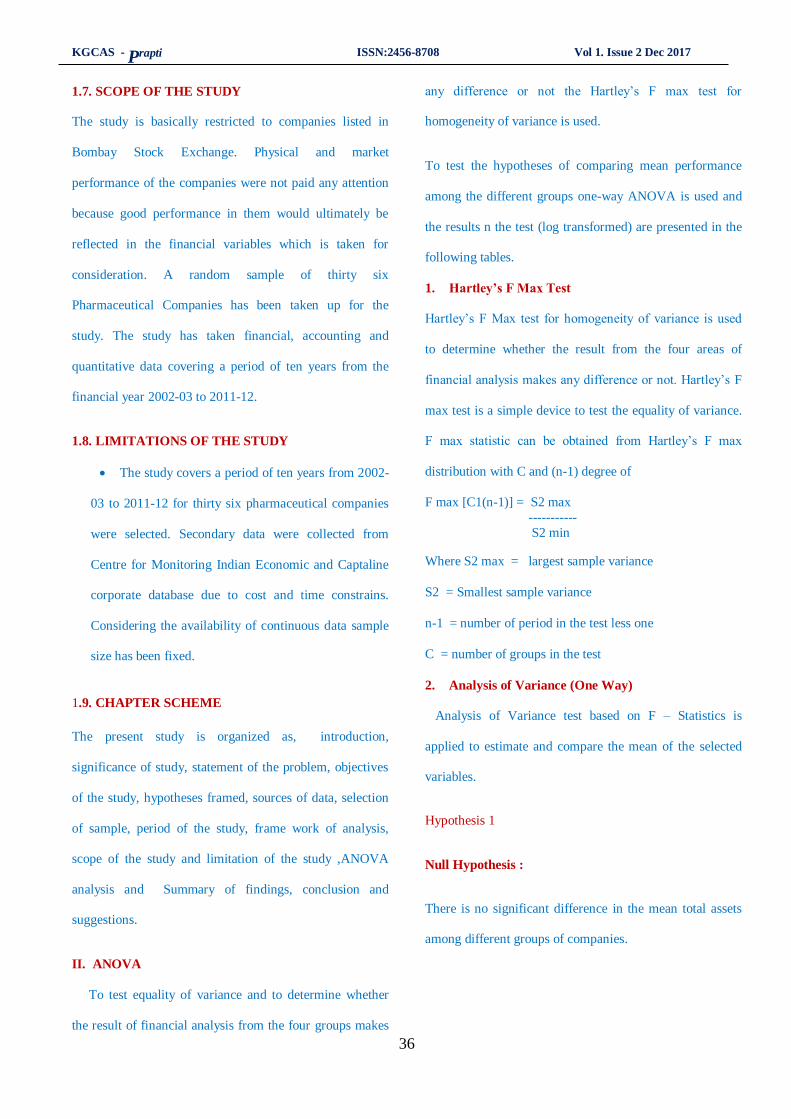
KGCAS - Prapti ISSN:2456-8708 Vol 1. Issue 2 Dec 2017
36
1.7. SCOPE OF THE STUDY
The study is basically restricted to companies listed in
Bombay Stock Exchange. Physical and market
performance of the companies were not paid any attention
because good performance in them would ultimately be
reflected in the financial variables which is taken for
consideration. A random sample of thirty six
Pharmaceutical Companies has been taken up for the
study. The study has taken financial, accounting and
quantitative data covering a period of ten years from the
financial year 2002-03 to 2011-12.
1.8. LIMITATIONS OF THE STUDY
The study covers a period of ten years from 2002-
03 to 2011-12 for thirty six pharmaceutical companies
were selected. Secondary data were collected from
Centre for Monitoring Indian Economic and Captaline
corporate database due to cost and time constrains.
Considering the availability of continuous data sample
size has been fixed.
1.9. CHAPTER SCHEME
The present study is organized as, introduction,
significance of study, statement of the problem, objectives
of the study, hypotheses framed, sources of data, selection
of sample, period of the study, frame work of analysis,
scope of the study and limitation of the study ,ANOVA
analysis and Summary of findings, conclusion and
suggestions.
II. ANOVA
To test equality of variance and to determine whether
the result of financial analysis from the four groups makes
any difference or not the Hartley’s F max test for
homogeneity of variance is used.
To test the hypotheses of comparing mean performance
among the different groups one-way ANOVA is used and
the results n the test (log transformed) are presented in the
following tables.
1. Hartley’s F Max Test
Hartley’s F Max test for homogeneity of variance is used
to determine whether the result from the four areas of
financial analysis makes any difference or not. Hartley’s F
max test is a simple device to test the equality of variance.
F max statistic can be obtained from Hartley’s F max
distribution with C and (n-1) degree of
F max [C1(n-1)] = S2 max
-----------
S2 min
Where S2 max = largest sample variance
S2 = Smallest sample variance
n-1 = number of period in the test less one
C = number of groups in the test
2. Analysis of Variance (One Way)
Analysis of Variance test based on F – Statistics is
applied to estimate and compare the mean of the selected
variables.
Hypothesis 1
Null Hypothesis :
There is no significant difference in the mean total assets
among different groups of companies.
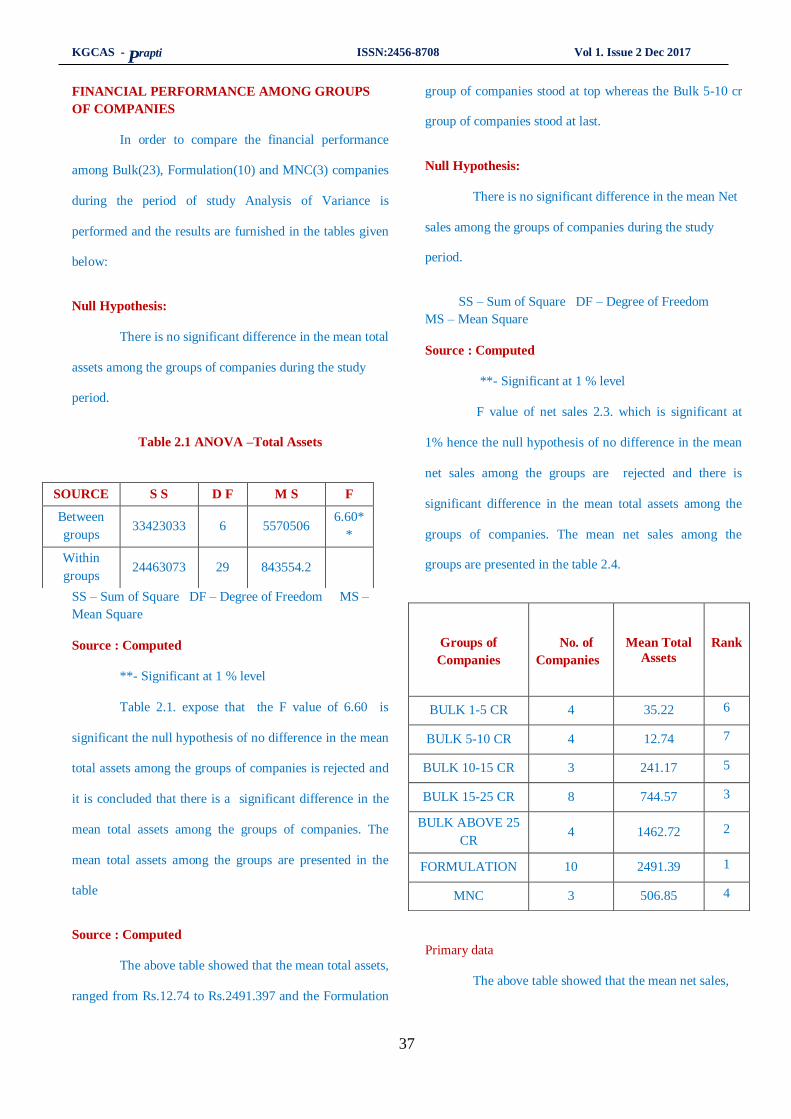
KGCAS - Prapti ISSN:2456-8708 Vol 1. Issue 2 Dec 2017
37
FINANCIAL PERFORMANCE AMONG GROUPS
OF COMPANIES
In order to compare the financial performance
among Bulk(23), Formulation(10) and MNC(3) companies
during the period of study Analysis of Variance is
performed and the results are furnished in the tables given
below:
Null Hypothesis:
There is no significant difference in the mean total
assets among the groups of companies during the study
period.
Table 2.1 ANOVA –Total Assets
SS – Sum of Square DF – Degree of Freedom MS –
Mean Square
Source : Computed
**- Significant at 1 % level
Table 2.1. expose that the F value of 6.60 is
significant the null hypothesis of no difference in the mean
total assets among the groups of companies is rejected and
it is concluded that there is a significant difference in the
mean total assets among the groups of companies. The
mean total assets among the groups are presented in the
table
Source : Computed
The above table showed that the mean total assets,
ranged from Rs.12.74 to Rs.2491.397 and the Formulation
group of companies stood at top whereas the Bulk 5-10 cr
group of companies stood at last.
Null Hypothesis:
There is no significant difference in the mean Net
sales among the groups of companies during the study
period.
SS – Sum of Square DF – Degree of Freedom
MS – Mean Square
Source : Computed
**- Significant at 1 % level
F value of net sales 2.3. which is significant at
1% hence the null hypothesis of no difference in the mean
net sales among the groups are rejected and there is
significant difference in the mean total assets among the
groups of companies. The mean net sales among the
groups are presented in the table 2.4.
Primary data
The above table showed that the mean net sales,
SOURCE S S D F M S F
Between
groups 33423033 6 5570506
6.60*
*
Within
groups 24463073 29 843554.2
Groups of
Companies
No. of
Companies
Mean Total
Assets
Rank
BULK 1-5 CR 4 35.22 6
BULK 5-10 CR 4 12.74 7
BULK 10-15 CR 3 241.17 5
BULK 15-25 CR 8 744.57 3
BULK ABOVE 25
CR 4 1462.72 2
FORMULATION 10 2491.39 1
MNC 3 506.85 4
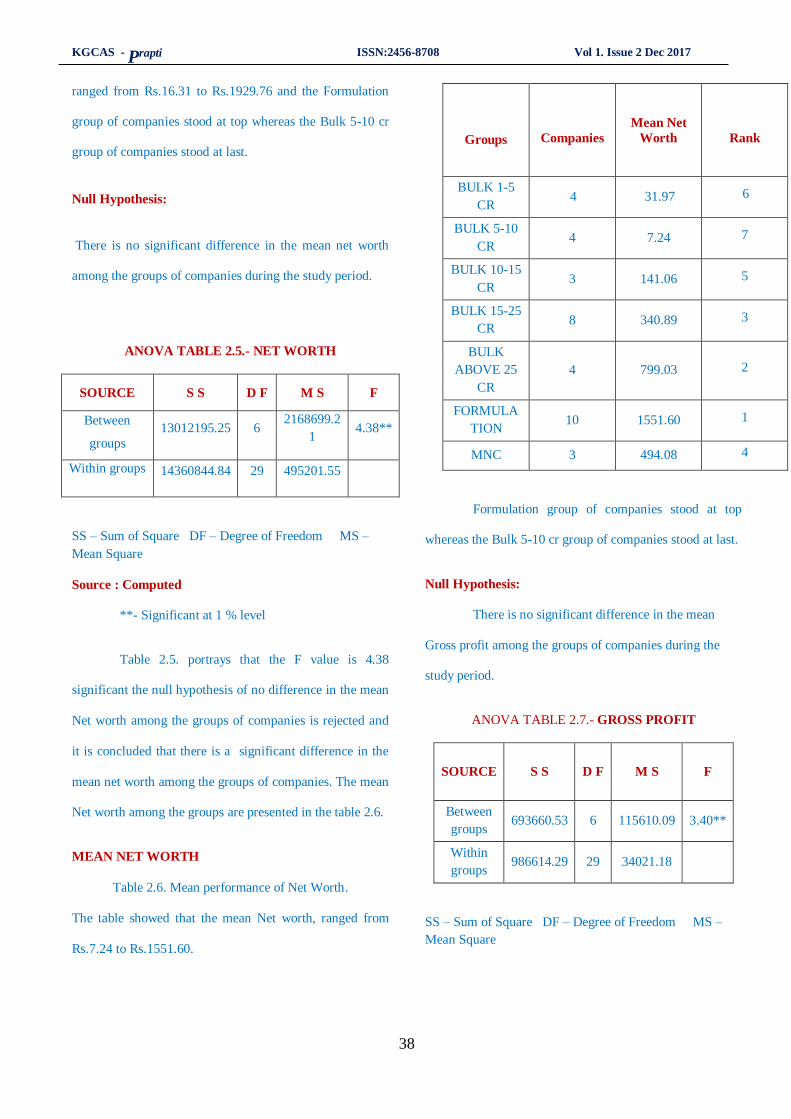
KGCAS - Prapti ISSN:2456-8708 Vol 1. Issue 2 Dec 2017
38
ranged from Rs.16.31 to Rs.1929.76 and the Formulation
group of companies stood at top whereas the Bulk 5-10 cr
group of companies stood at last.
Null Hypothesis:
There is no significant difference in the mean net worth
among the groups of companies during the study period.
ANOVA TABLE 2.5.- NET WORTH
SOURCE S S D F M S F
Between
groups
13012195.25 6 2168699.2
1 4.38**
Within groups 14360844.84 29 495201.55
SS – Sum of Square DF – Degree of Freedom MS –
Mean Square
Source : Computed
**- Significant at 1 % level
Table 2.5. portrays that the F value is 4.38
significant the null hypothesis of no difference in the mean
Net worth among the groups of companies is rejected and
it is concluded that there is a significant difference in the
mean net worth among the groups of companies. The mean
Net worth among the groups are presented in the table 2.6.
MEAN NET WORTH
Table 2.6. Mean performance of Net Worth.
The table showed that the mean Net worth, ranged from
Rs.7.24 to Rs.1551.60.
Groups
Companies
Mean Net
Worth
Rank
BULK 1-5
CR 4 31.97 6
BULK 5-10
CR 4 7.24 7
BULK 10-15
CR 3 141.06 5
BULK 15-25
CR 8 340.89 3
BULK
ABOVE 25
CR
4 799.03 2
FORMULA
TION 10 1551.60 1
MNC 3 494.08 4
Formulation group of companies stood at top
whereas the Bulk 5-10 cr group of companies stood at last.
Null Hypothesis:
There is no significant difference in the mean
Gross profit among the groups of companies during the
study period.
ANOVA TABLE 2.7.- GROSS PROFIT
SOURCE S S D F M S F
Between
groups 693660.53 6 115610.09 3.40**
Within
groups 986614.29 29 34021.18
SS – Sum of Square DF – Degree of Freedom MS –
Mean Square
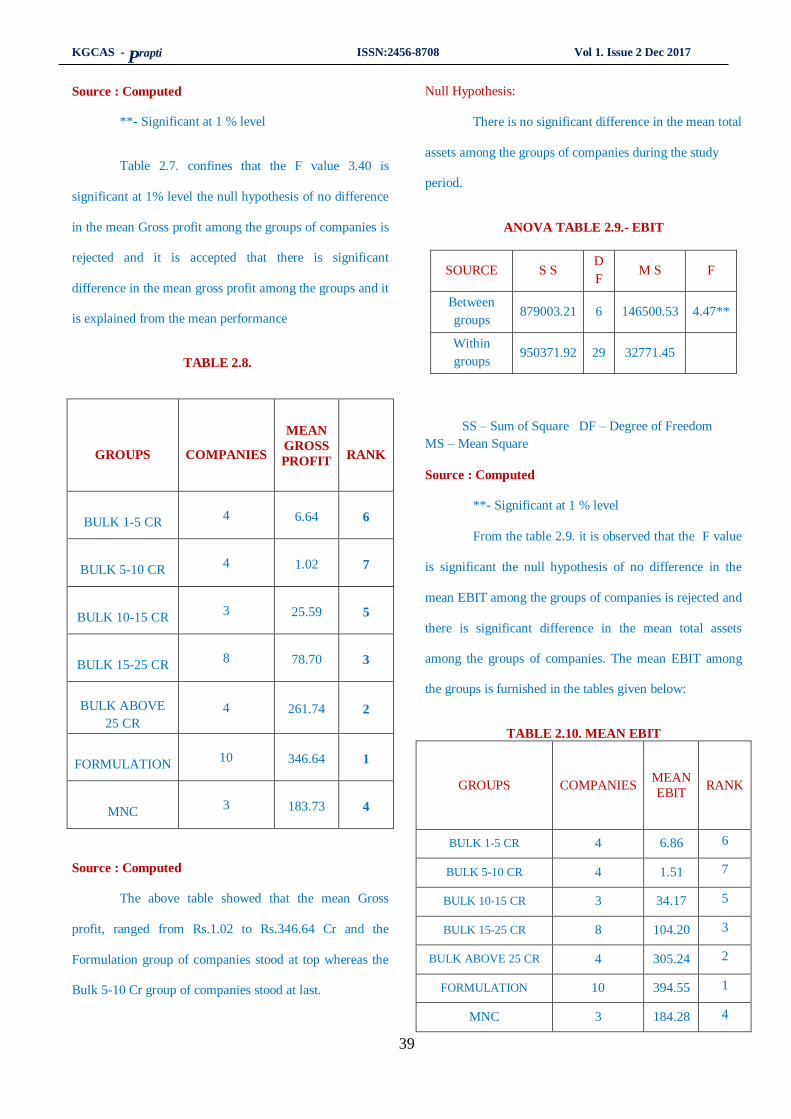
KGCAS - Prapti ISSN:2456-8708 Vol 1. Issue 2 Dec 2017
39
Source : Computed
**- Significant at 1 % level
Table 2.7. confines that the F value 3.40 is
significant at 1% level the null hypothesis of no difference
in the mean Gross profit among the groups of companies is
rejected and it is accepted that there is significant
difference in the mean gross profit among the groups and it
is explained from the mean performance
TABLE 2.8.
GROUPS
COMPANIES
MEAN
GROSS
PROFIT
RANK
BULK 1-5 CR 4 6.64 6
BULK 5-10 CR 4 1.02 7
BULK 10-15 CR 3 25.59 5
BULK 15-25 CR 8 78.70 3
BULK ABOVE
25 CR
4 261.74 2
FORMULATION 10 346.64 1
MNC 3 183.73 4
Source : Computed
The above table showed that the mean Gross
profit, ranged from Rs.1.02 to Rs.346.64 Cr and the
Formulation group of companies stood at top whereas the
Bulk 5-10 Cr group of companies stood at last.
Null Hypothesis:
There is no significant difference in the mean total
assets among the groups of companies during the study
period.
ANOVA TABLE 2.9.- EBIT
SOURCE S S D
F M S F
Between
groups 879003.21 6 146500.53 4.47**
Within
groups 950371.92 29 32771.45
SS – Sum of Square DF – Degree of Freedom
MS – Mean Square
Source : Computed
**- Significant at 1 % level
From the table 2.9. it is observed that the F value
is significant the null hypothesis of no difference in the
mean EBIT among the groups of companies is rejected and
there is significant difference in the mean total assets
among the groups of companies. The mean EBIT among
the groups is furnished in the tables given below:
TABLE 2.10. MEAN EBIT
GROUPS COMPANIES
MEAN
EBIT
RANK
BULK 1-5 CR 4 6.86 6
BULK 5-10 CR 4 1.51 7
BULK 10-15 CR 3 34.17 5
BULK 15-25 CR 8 104.20 3
BULK ABOVE 25 CR 4 305.24 2
FORMULATION 10 394.55 1
MNC 3 184.28 4

KGCAS - Prapti ISSN:2456-8708 Vol 1. Issue 2 Dec 2017
40
Primary data
The above table showed that the mean EBIT,
ranged from Rs.1.51 to 394.55 Cr and the Formulation
group of companies stood at top whereas the Bulk 5-10 Cr
group of companies stood at last.
Null Hypothesis:
There is no significant difference in the mean
PAT among the groups of companies during the study
period
SOURCE S S D F M S F
Between groups 349390.70 6.00 58231.78 2.58*
Within groups 655805.93 29.00 22614.00
SS – Sum of Square DF – Degree of Freedom MS –
Mean Square
Source : Computed
*- Significant at 5 % level
It is observed from the Table 2.11. F value 2.58 is
significant at 5% level the null hypothesis of no
difference in the mean PAT among the groups of
companies is rejected and there is significant difference
in the mean PAT among the groups of companies. The
mean score of Profit after tax among the group of
companies is furnished in the tables 2.12.
TABLE 2.12. Mean performance of Profit after
Tax(Rs. In crores)
GROUPS
COMPANIES
MEAN
PAT
RANK
BULK 1-5 CR 4 4.18 6
BULK 5-10
CR 4 0.35 7
BULK 10-15
CR 3 13.06 5
GROUPS COMPANIES
MEAN
PAT
RANK
BULK 15-25
CR 8 49.10 3
BULK
ABOVE 25
CR
4 177.00 2
FORMULATI
ON 10 244.39 1
MNC 3 115.01 4
Source : Computed
The above table showed that the mean PAT,
ranged from Rs.0.35 to 244.39 Cr and the Formulation
group of companies stood at top whereas the Bulk 5-10 Cr
group of companies stood at last.
Null Hypothesis:
There is no significant difference in the mean total
debts among the groups of companies during the study
period.
ANOVA TABLE 2.13.- TOTAL DEBTS
SOURCE S S D F M S F
Between
groups 5155148.17 6
859191.
36
1.85
NS
Within groups 13439907.41 29 463445.
08
SS – Sum of Square DF – Degree of Freedom MS –
Mean Square
Source : Computed
Ns-non significant at 5 % level
Since the F value 1.85. is no significant from the
table 2.13. the null hypothesis is accepted and it is
concluded that there is a no significant difference in the

KGCAS - Prapti ISSN:2456-8708 Vol 1. Issue 2 Dec 2017
41
mean total debts among the groups of companies. The
mean total debts among the groups are given in table 2.13.
GROUPS
COM
PANI
ES
MEAN
TOTAL
DEBTS
RANK
BULK 1-5 CR 4 3.24 -
BULK 5-10 CR 4 5.30 -
BULK 10-15 CR 3 93.39 -
BULK 15-25 CR 8 756.34 -
BULK ABOVE
25 CR 4 653.54 -
FORMULATIO
N 10 865.72 -
MNC 3 3.66 -
Source : computed
The above table showed that the mean total debts,
ranged from Rs.3.24 to Rs.865.72 Cr and the mean total
debts are on par among the groups of companies.
Null Hypothesis:
There is no significant difference in the mean total
assets among the groups of companies during the study
period.
ANOVA TABLE 2.15.- EARNINGS PER SHARE
SOURCE S S D F M S F
Between
groups 6682.20 6 1113.70
1.59
NS
Within
groups 20299.16 29 699.97
NS- Significant at 5% level
SUMMARY OF FINDINGS, CONCLUSIONS
AND SUGGESTIONS
ANOVA
The mean total assets, ranged from Rs.12.74 to
Rs.2491.397 and the Formulation group of companies
stood at top whereas the Bulk 5-10 cr group of companies
stood at last.
The mean net sales, ranged from Rs.16.31 to
Rs.1929.76 and the Formulation group of companies
stood at top whereas the Bulk 5-10 cr group of companies
stood at last.
The mean Net worth, ranged from Rs.7.24 to
Rs.1551.60 and the Formulation group of companies
stood at top whereas the Bulk 5-10 cr group of companies
stood at last.
The mean Gross profit, ranged from Rs.1.02 to
Rs.346.64 Cr and the Formulation group of companies
stood at top whereas the Bulk 5-10 Cr group of
companies stood at last.
The mean EBIT, ranged from Rs.1.51 to 394.55
Cr and the Formulation group of companies stood at top
whereas the Bulk 5-10 Cr group of companies stood at
last.
The mean PAT, ranged from Rs.0.35 to 244.39 Cr
and the Formulation group of companies stood at top
whereas the Bulk 5-10 Cr group of companies stood at
last.
The mean total debts, ranged from Rs.3.24 to
Rs.865.72 Cr and the mean total debts are on par among
the groups of companies.
the mean EPR, ranged from 0.67 to 46.91 and the
mean EPR are on par among the groups of companies.
At corporate level globalization takes place when
companies decided to take part in the emerging global
economy and establish themselves in foreign markets.

KGCAS - Prapti ISSN:2456-8708 Vol 1. Issue 2 Dec 2017
42
First they adopt their products or services to the financial
user’s linguistic and cultural requirements, and then they
might take advantage of the internet revolution and
establish a virtual presence on the international market
place with a mulitilingual corporatism.
The industry today faces the challenges of
competitions from global giants and Indian companies
response the challenges ahead and upgrade them by
moving up the value chain . they have to make a move
from offering low-end services to high-end services such
as product development, research and development,
innovation and end-to-end turnkey solutions.
Performance of a company is measured in
financial terms, the success of the firm depends on how it
is perceived by and reacts to the external economic
markets. The field of managing finance is much more
complicated and faster faces today. Important and swift
development in the field of finance and application of
new theories in decision making environment yield new
challenges and opportunities for financial managers
knowledge of all these developments and their impact is
necessary for the effective management and financial
viability of the modern business firms. Financial
managers need to know how effective decisions can be
made and ineffective ones be avoided.
Objectives of the study were to examine their
financial profile and its growth rate by applying summary
statistical measures, compound growth rate, Hartly
F’max test, one way ANOVA and forecasted trend
pattern of the selected variables by applying Polynominal
Cubic trend are presented in group-wise classification.
From the Hartly’s Fmax test of equality of
variance it is observed that except the total debts, and
earnings per share other selected variables having
homogeneity of variance. Test of significance between
the mean performance among different groups are
analysed by ANOVA, it is observed that the mean
performance of total debts and earnings per share are not
having significant difference and all other variables are
having a significant different between the groups.
6. REFERENCES
[1] Agarwarl, M.P., Analysis of Financial Statements, National
Publishing House, New Delhi, 1981, p.5.
[2] Batty, Management Accounting, McDonald and Evans
Ltd.,1970,p.143.
[3] Pandy, I.M., Elements of Financial Management, Vikas
Publishing House Pvt.Ltd.,1993, pp.1-21.
[4] Srivatsava, R.M., Financial Decision Making –Text Problems
and cases, Streling Publishers Pvt.,1989,pp.49-89.
[5] Krishna Reddy, “Financial Management”, an Analytical and
Conceptual Approach, Chaitanya Publishing House, Allahabad,
1993.
[6]Kuchhal, S.C. “Financial Management”, PRINTWELL,
Jaipur, 1992.
[7]Kullkarini, P.V. “Financial Management”, Himalaya
Publishing House, Mumbai, 1985.
[8]Maheshwari, S.N, “Principles of Management Accounting”,
Sultan Chand and Sons, New Delhi, 1985.
[9]Beaver, W H (2001) „Financial Ratios as Predictors of
Failure‟, Journal of AccountingResearch, spring.
[10]Bauman 2003 Split Information, Stock Returns and Market
Efficiency. Journal of Financial Economics, Vol 6, pp 265-
296.Returns and Market Efficiency. Journal of Financial
Economics, Vol 6, pp 265-296.
KGCAS - Prapti ISSN:2456-8708 Vol 1. Issue 2 Dec 2017
43
A Study on Investors Perception towards
Derivative Market at Angel Broking, Salem. Mr.M.Praveen.,
Abstract
The research work is undertaken on “A Study
On Investors Perception Towards Derivative Market With
Special Reference To The Investors Of Angel Brokings”.
This was done by finding out the awareness level and the
interest level among the investors .The main objective of the
research is to identify the awareness level, perception, and
product that are most preferred by the investor.
1. INTRODUCTION
GLOBAL DERIVATIVES MARKETS:
'By far the most significant event in finance
during the past decade has been the extraordinary
development and expansion of financial derivatives.
These instruments enhance the ability to differentiate risk
and allocate it to those investors most able and willing to
take it - a process that has undoubtedly improved national
productivity growth and standards of living.' -- Alan
Greenspan, Chairman, Board of Governors of the US
Federal Reserve System. The past decade has witnessed
an explosive growth in the use of financial derivatives by
a wide range of corporate and financial institutions.
Assistant Professor, Department of Commerce
Bishop Ambrose College,
Sungam By Pass Road,
Coimbatore-45
The following factors which have generally been
identified as the major driving force behind growth of
financial derivatives are the, Increased volatility is asset
prices in financial markets; the increased integration of
national financial markets with the international markets;
the marked improvement in communication facilities and
sharp decline in their costs; the development of more
sophisticated risk management strategies; and the
innovation in the number of financial assets, leading to
higher return, reduced risk as well as transaction cost as
compared to individual financial assets. The growth in
derivatives has run in parallel with increasing direct
reliance of companies on the capital markets as the major
source of long term funding.
In this respect, derivatives have a vital role to
play in enhancing shareholder value by ensuring access to
the cheapest source of funds. Furthermore, active use of
derivative instrument allows the overall business risk
profile to be modified, thereby providing the potential to
improve earnings quality by offsetting undesired risk.
2. DERIVATIVES: AN INNOVATIVE TOOL IN
THE INDIAN MARKET
Keeping in view the experience of even strong
and developed economies the world over, it is no denying
the fact that financial market is extremely volatile by

KGCAS - Prapti ISSN:2456-8708 Vol 1. Issue 2 Dec 2017
44
nature. Indian financial market is not an exception to this
phenomenon.
The attendant risk arising out of the volatility
and complexity of the financial market is an important
concern for financial analysts. As a result, the logical need
is for those financial instruments which allow fund
managers to better manage or reduce these risks.
DERIVATIVES DEFINED:
Derivative is a product whose value is derived
from the value of one or more basic variables, called
bases (underlying asset, index, or reference rate), in a
contractual manner. The underlying asset can be equity,
forex, commodity or any other asset. For example, wheat
farmers may wish to sell their harvest at a future date to
eliminate the risk of a change in prices by that date. Such
a transaction is an example of a derivative. The price of
this derivative is driven by the spot price of wheat which
is the “underlying”.
COMPANY PROFILE:
Angel Broking's tryst with excellence in
customer relations began in 1987. Today, Angel has
emerged as one of the most respected Stock-Broking and
Wealth Management Companies in India. With its unique
retail-focused stock trading business model, Angel is
committed to providing ‘Real Value for Money’ to all its
clients.
The Angel Group is a member of the Bombay
Stock Exchange (BSE), National Stock Exchange (NSE)
and the two leading Commodity Exchanges in the
country: NCDEX & MCX. Angel is also registered as a
Depository Participant with CDSL.
OUR BUSINESS
Equity Trading
Commodities
Portfolio Management Services
Mutual Funds
Life Insurance
Personal Loans
IPO
Depository Services
Investment Advisory
ANGEL GROUP
Angel Broking Ltd.
Angel Commodities Broking Ltd.
Angel Securities Ltd
3. OBJECTIVES
Derivative trading in Angel broking have
been started in the year 2001.Hence the company wanted
to know to what extent the people were aware of
derivative market and their perception towards its
products. Investor’s perception is a two-way street of how
they view the derivative segment and translate the
information they receive. Hence this research was
undertaken.
KGCAS - Prapti ISSN:2456-8708 Vol 1. Issue 2 Dec 2017
45
Primary Objective
To study the investors perception level and attitude
towards derivative segment
Secondary Objectives
To understand the profile of the investors
To analyze the investing habits of the investor
towards derivative market.
To analyze the factors influencing the investor in
choosing the types of derivative Segment
To analyze investors risk preferences towards
derivative market.
4. SCOPE OF THE STUDY
India is now one of the fastest economically
growing nations. With its vast economy, Indians have a
lot of options to invest their savings.
This study undertaken for Angel broking Pvt Ltd
aims to study the investors’ perception towards derivative
market. The study would also analyze the awareness level
of investors in this segment.
The study has been done by preparing a
questionnaire which contains prospective questions put
forth to the investor’s .The responses help in analyzing
the profile and investing habits of the investor and factors
influencing the investor in investing in derivative
segment.
All this would help in giving suggestions to
Angel broking (P) Ltd, in strengthening their marketing
efforts and in determining the market potential for
investments in derivative market.
LIMITATIONS OF THE STUDY
The area of the study is limited to the investors of
Angel broking, a part of Salem district only. Hence
the results may not be true for other geographical
locations.
Validity and Reliability of the data depends on the
truthfulness of the responses from the public.Time
at the disposal of the researcher is limited.
The size of the sample compared to the population is
very small and hence it may not represent the
whole population.
A structured questionnaire was the basis for
collecting the data, so it has the usual deficiencies
attached to this technique of data collection.
5. REVIEW OF LITERATURE
Kenji Kutsuna, Janet Kiholm Smith and Richard
L.Smith, (2009), examined the determinants of price
formulation from original price to the filling range and
from the filing range to the offer price. The study also
examined the extent to which initial and long term returns
is related to price adjustments. The study came out with
four reasons for price adjustment. First, pricing strategy to
provide incentive to the investors. Second, pricing that
reflects the bias associated with the original offer price.
Third,pricing to match the opportunity cost due to failed
offerings. Fourth, pricing based on other traded shares.
Richard B. Carter, Frederick H. Dark, Ioannis V.
Floros and Travis R. A. Sapp, (2011), studied the long
run performance of 6,686 IPOs from 1981- 2005 and
found that IPOs do not underperform on a risk adjusted
KGCAS - Prapti ISSN:2456-8708 Vol 1. Issue 2 Dec 2017
46
basis. The study also found that IPO underperformance is
more during the period 1980s and early 1990s. The IPOs
either perform same as the market or outperform on a risk
adjusted basis from 1998-2005. It also found that IPO
aftermarket returns is based on additional factors like
momentum and liquidity. The liquidity suggests Michael
A. Cusumano, (2012), analyzed the Facebook IPO was
overvalued. The IPO issue price is $38 and the market
value is $104 billion. However the price of share fell 25%
within a week form listing. Yet again the stock price
slipped more than 20% overnight. Analysts believe that
Facebook IPO should not have been priced more than
$13.80. The study points out that there is Uncertainty
about how much and how fast Facebook will grow and
how much will that growth cost to investors. There is no
proper technology to arrive that exact IPO price. However
focus on economics of the business, comparison with
peer films and a forecast about how the company will be
in future will help in arriving at the approximate price that
IPO is tend to suffer because of the heavy trading and
due to negative momentum exposure some investors tend
to sacrifice their returns.
SAMPLING DESIGN
Sampling design is to clearly define the set of objectives,
technically called the universe to be studied. The universe
can be finite or infinite. The nature of the universe studied
for this survey is finite.
Sampling Unit
The number of items selected from the population
constitutes the sample size. The respondents of the study
are present and future investors.
Sample Size
The sample size taken for the study is 150
Sampling Method
Sampling design is to clearly define set of
objects, technically called the universe to be studied. This
research has finite set of universe and the sampling design
used in the study is probability sampling. Simple Random
sampling method is used for the collection of data.
STATISTICAL TOOLS: The data has been mainly
analyzed by using the following methods and tests. Cross
Tabulation andPercentage method supplemented by
appropriate Percentage Analysis, Ranking Method, Chi –
Square Test
ANALYSIS OF DATA
GENDER OF THE RESPONDENTS
INTERPRETATION:
From the above table it is identified that, 80% of the
respondents are male and 20% of the respondents were
female.
GENDER NO OF
RESPONDENTS %
Male 120 80
Female 30 20
Total 150 100.0
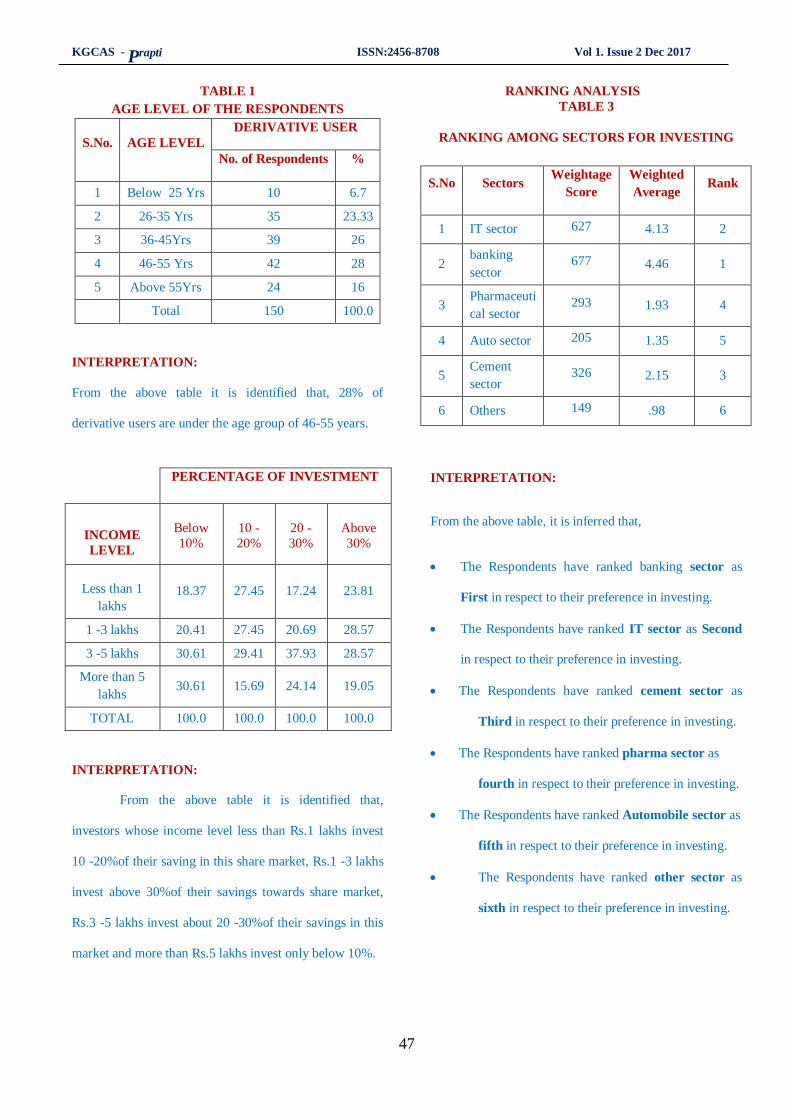
KGCAS - Prapti ISSN:2456-8708 Vol 1. Issue 2 Dec 2017
47
TABLE 1
AGE LEVEL OF THE RESPONDENTS
S.No. AGE LEVEL
DERIVATIVE USER
No. of Respondents %
1 Below 25 Yrs 10 6.7
2 26-35 Yrs 35 23.33
3 36-45Yrs 39 26
4 46-55 Yrs 42 28
5 Above 55Yrs 24 16
Total 150 100.0
INTERPRETATION:
From the above table it is identified that, 28% of
derivative users are under the age group of 46-55 years.
INTERPRETATION:
From the above table it is identified that,
investors whose income level less than Rs.1 lakhs invest
10 -20%of their saving in this share market, Rs.1 -3 lakhs
invest above 30%of their savings towards share market,
Rs.3 -5 lakhs invest about 20 -30%of their savings in this
market and more than Rs.5 lakhs invest only below 10%.
RANKING ANALYSIS
TABLE 3
RANKING AMONG SECTORS FOR INVESTING
S.No Sectors Weightage
Score
Weighted
Average Rank
1 IT sector 627 4.13 2
2 banking
sector 677 4.46 1
3 Pharmaceuti
cal sector 293 1.93 4
4 Auto sector 205 1.35 5
5 Cement
sector 326 2.15 3
6 Others 149 .98 6
INTERPRETATION:
From the above table, it is inferred that,
The Respondents have ranked banking sector as
First in respect to their preference in investing.
The Respondents have ranked IT sector as Second
in respect to their preference in investing.
The Respondents have ranked cement sector as
Third in respect to their preference in investing.
The Respondents have ranked pharma sector as
fourth in respect to their preference in investing.
The Respondents have ranked Automobile sector as
fifth in respect to their preference in investing.
The Respondents have ranked other sector as
sixth in respect to their preference in investing.
PERCENTAGE OF INVESTMENT
INCOME
LEVEL
Below
10%
10 -
20%
20 -
30%
Above
30%
Less than 1
lakhs
18.37 27.45 17.24 23.81
1 -3 lakhs 20.41 27.45 20.69 28.57
3 -5 lakhs 30.61 29.41 37.93 28.57
More than 5
lakhs 30.61 15.69 24.14 19.05
TOTAL 100.0 100.0 100.0 100.0
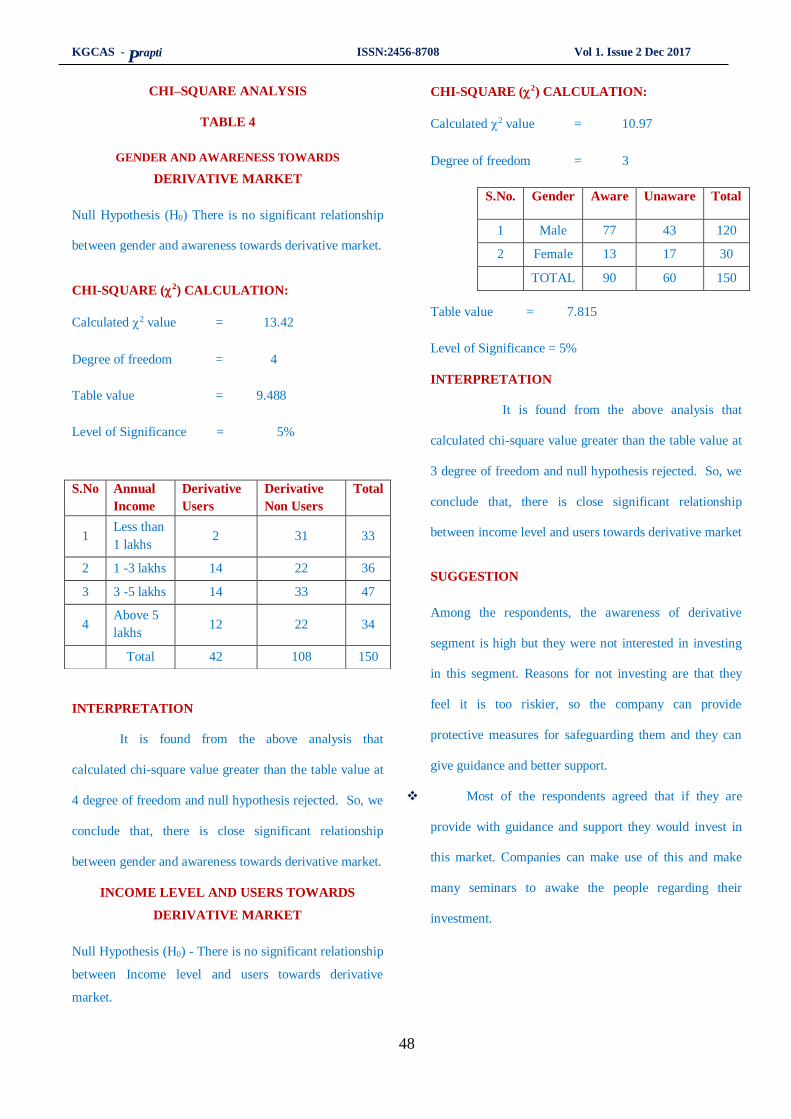
KGCAS - Prapti ISSN:2456-8708 Vol 1. Issue 2 Dec 2017
48
CHI–SQUARE ANALYSIS
TABLE 4
GENDER AND AWARENESS TOWARDS
DERIVATIVE MARKET
Null Hypothesis (H0) There is no significant relationship
between gender and awareness towards derivative market.
CHI-SQUARE (2) CALCULATION:
Calculated 2 value = 13.42
Degree of freedom = 4
Table value = 9.488
Level of Significance = 5%
INTERPRETATION
It is found from the above analysis that
calculated chi-square value greater than the table value at
4 degree of freedom and null hypothesis rejected. So, we
conclude that, there is close significant relationship
between gender and awareness towards derivative market.
INCOME LEVEL AND USERS TOWARDS
DERIVATIVE MARKET
Null Hypothesis (H0) - There is no significant relationship
between Income level and users towards derivative
market.
CHI-SQUARE (2) CALCULATION:
Calculated 2 value = 10.97
Degree of freedom = 3
Table value = 7.815
Level of Significance = 5%
INTERPRETATION
It is found from the above analysis that
calculated chi-square value greater than the table value at
3 degree of freedom and null hypothesis rejected. So, we
conclude that, there is close significant relationship
between income level and users towards derivative market
SUGGESTION
Among the respondents, the awareness of derivative
segment is high but they were not interested in investing
in this segment. Reasons for not investing are that they
feel it is too riskier, so the company can provide
protective measures for safeguarding them and they can
give guidance and better support.
Most of the respondents agreed that if they are
provide with guidance and support they would invest in
this market. Companies can make use of this and make
many seminars to awake the people regarding their
investment.
S.No Annual
Income
Derivative
Users
Derivative
Non Users
Total
1 Less than
1 lakhs 2 31 33
2 1 -3 lakhs 14 22 36
3 3 -5 lakhs 14 33 47
4 Above 5
lakhs 12 22 34
Total 42 108 150
S.No. Gender Aware Unaware Total
1 Male 77 43 120
2 Female 13 17 30
TOTAL 90 60 150
KGCAS - Prapti ISSN:2456-8708 Vol 1. Issue 2 Dec 2017
49
REFERENCE
1.Kenji Kutsuna, Janet Kiholm Smith and Richard
L.Smith, (2009), "Public Information, IPO Price
Formation and Long-Run Returns: Japanese Evidence", The
Journal of Finance, Vol. LXIV, No 1, pp 505- 546.
2.Richard B. Carter, Frederick H. Dark, Ioannis V. Floros
and Travis R. A. Sapp, (2011), "Characterizing the Risk of
IPO Long-Run Returns: The Impact of Momentum,
Liquidity, Skewness and Investment", Financial
Management, Winter 2011, pp 1067-1086.
3.Michael A. Cusumano, (2012), "Reflecting on the
Facebook IPO", Communications of the ACM, Volume 55,
No -10, pp 20-23.
KGCAS - Prapti ISSN:2456-8708 Vol 1. Issue 2 Dec 2017
50
Fault Prediction Using Fuzzy Set Based
K-Means Clustering Algorithm
Jasmine Sagaya Jonita M.,
Abstract
Unsupervised techniques like clustering may be used for
fault prediction in software modules. A fault is a problem in
software that when runs causes failure. Fault proneness is
the likelihood of a piece of software to have faults. Fault
prediction is identified as one major area to predict the
probability that the software contains fault using fuzzy set
based K-Means algorithm, has been applied for predicting
faults in program modules. Software metrics may be used in
fault prediction models to improve software quality by
predicting fault location. The concept of clustering has been
used to determine the quality of clusters for evaluation of the
fuzzy set-based initialization algorithm as compared to other
initialization techniques. The clusters obtained by fuzzy set-
based algorithm were found to have maximum gain values,
whereas Fuzzy Set finds the faults only in the place where it
has occurred. The aim of this paper is fuzzy set are applied
for finding the initial cluster centers to be input to the K-
Means Algorithm. An input threshold parameter governs
the number of initial cluster centers and by varying the user
can generate desired initial cluster centers. This paper aims
to identify software metrics and to assess their applicability
in software fault prediction. By following this technique
time consumption is reduced and the overall error rates of
this prediction approach are compared to other existing
algorithms and are found to be better in most of the cases.
Assistant Professor,
Department of BCA and Information Technology,
Nirmala College for Women,
Coimbatore.
I. INTRODUCTION
K-Means clustering is a nonhierarchical
clustering procedure in which items are moved among
sets of clusters until the desired set is reached. The
partitioning of data set is such that the sum of intra cluster
distances is reduced to an optimum value K-Means is
simple and a widely used clustering algorithm. However,
it has some inherent drawbacks. First, the user has to
initialize the number of clusters which is very difficult to
identify in most of the cases. Second, it requires selection
of the suitable initial cluster centers which is again subject
to error. Since the structure of the clusters depends on the
initial cluster centers this may result in an inefficient
clustering. Third, The K-Means algorithm is very
sensitive to noise. In a method using fuzzy set has been
proposed as an initialization of K-Means algorithm.
The fuzzy set assigns based method the
appropriate initial cluster centers and eliminates the
outliers. Hence overcoming the second and third
drawback of K-Means algorithm. In this study, we focus
on a practical problem that occurs when the fault data for
modules are not available. To solve this challenging
problem, researchers have applied a combination of
clustering techniques to cluster modules, and this process
was followed by an evaluation phase of an expert ,who
was an experienced engineer and labeled each cluster as
fault-prone or not fault-prone by examining not only the
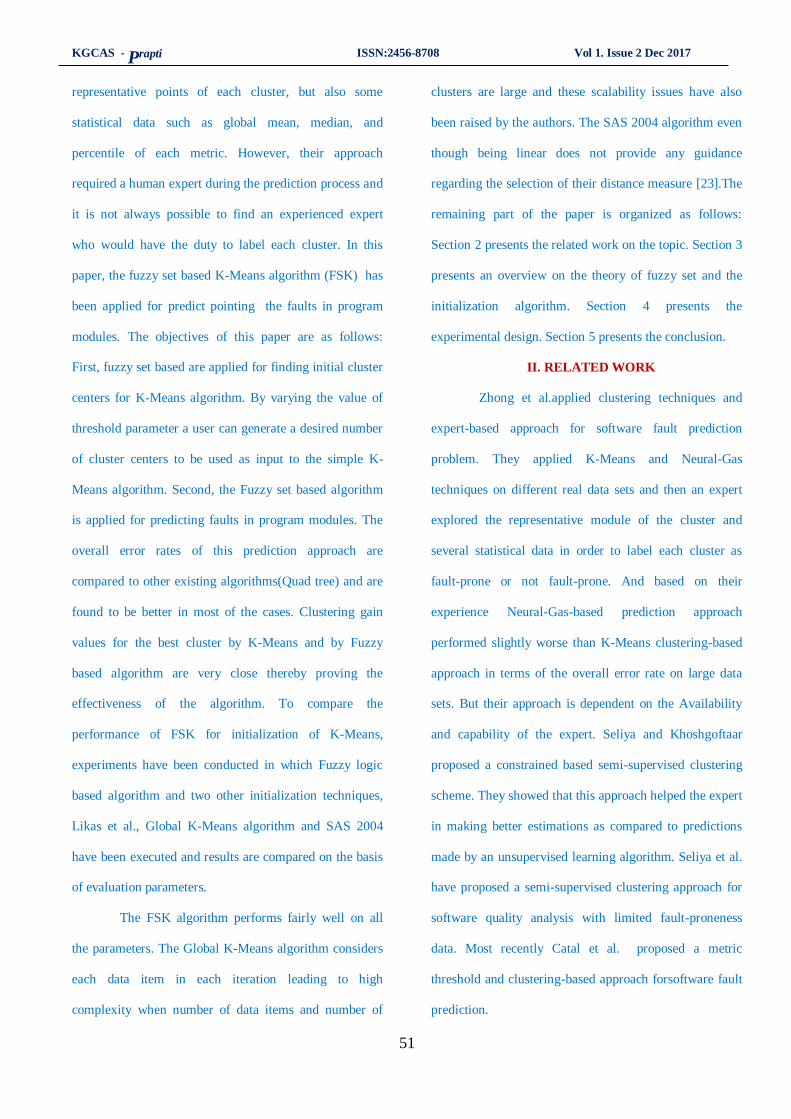
KGCAS - Prapti ISSN:2456-8708 Vol 1. Issue 2 Dec 2017
51
representative points of each cluster, but also some
statistical data such as global mean, median, and
percentile of each metric. However, their approach
required a human expert during the prediction process and
it is not always possible to find an experienced expert
who would have the duty to label each cluster. In this
paper, the fuzzy set based K-Means algorithm (FSK) has
been applied for predict pointing the faults in program
modules. The objectives of this paper are as follows:
First, fuzzy set based are applied for finding initial cluster
centers for K-Means algorithm. By varying the value of
threshold parameter a user can generate a desired number
of cluster centers to be used as input to the simple K-
Means algorithm. Second, the Fuzzy set based algorithm
is applied for predicting faults in program modules. The
overall error rates of this prediction approach are
compared to other existing algorithms(Quad tree) and are
found to be better in most of the cases. Clustering gain
values for the best cluster by K-Means and by Fuzzy
based algorithm are very close thereby proving the
effectiveness of the algorithm. To compare the
performance of FSK for initialization of K-Means,
experiments have been conducted in which Fuzzy logic
based algorithm and two other initialization techniques,
Likas et al., Global K-Means algorithm and SAS 2004
have been executed and results are compared on the basis
of evaluation parameters.
The FSK algorithm performs fairly well on all
the parameters. The Global K-Means algorithm considers
each data item in each iteration leading to high
complexity when number of data items and number of
clusters are large and these scalability issues have also
been raised by the authors. The SAS 2004 algorithm even
though being linear does not provide any guidance
regarding the selection of their distance measure [23].The
remaining part of the paper is organized as follows:
Section 2 presents the related work on the topic. Section 3
presents an overview on the theory of fuzzy set and the
initialization algorithm. Section 4 presents the
experimental design. Section 5 presents the conclusion.
II. RELATED WORK
Zhong et al.applied clustering techniques and
expert-based approach for software fault prediction
problem. They applied K-Means and Neural-Gas
techniques on different real data sets and then an expert
explored the representative module of the cluster and
several statistical data in order to label each cluster as
fault-prone or not fault-prone. And based on their
experience Neural-Gas-based prediction approach
performed slightly worse than K-Means clustering-based
approach in terms of the overall error rate on large data
sets. But their approach is dependent on the Availability
and capability of the expert. Seliya and Khoshgoftaar
proposed a constrained based semi-supervised clustering
scheme. They showed that this approach helped the expert
in making better estimations as compared to predictions
made by an unsupervised learning algorithm. Seliya et al.
have proposed a semi-supervised clustering approach for
software quality analysis with limited fault-proneness
data. Most recently Catal et al. proposed a metric
threshold and clustering-based approach forsoftware fault
prediction.

KGCAS - Prapti ISSN:2456-8708 Vol 1. Issue 2 Dec 2017
52
The results of their study demonstrate the
effectiveness of metrics threshold and show that the
standalone application of metrics threshold is easier than
the clustering and metrics thresholds-based (two stage)
approach because the selection of number of clusters is
performed heuristically in this clustering-based method.
In our present study we have presented comparative
results performed on same data sets as in Bhattacherjee
and Bishnu have applied unsupervised learning approach
for fault prediction in software module in [28].
In their work, the false negative rates (FNR) for the
clustering-based approach is less than that for metrics-
based approach, while the false positive rates (FPR) are
better for the metrics-based approach. The overall error
rates for both approaches remain the same. Supervised
techniques have however been applied for software fault
prediction [13] and software effort prediction .Several
methods for initialization of K-Means algorithm are
available in literature. Tibshirani et al. suggest a statistical
method based on gap statistic to find the optimal number
of clusters [20]. Pelleg and Moore suggest an algorithm
which efficiently searches the space of cluster locations
and number of clusters to optimize the Bayesian
Information Criterion and Akaike Information.
Figure 1: The prediction of clustering error point
Figure 2: Example of Mouse Dataset:
Criterion . Laszlo and Mukherjee present an approach for
finding the set of centers by constructing a fuzzy logic on
the set of data. Genetic algorithm has been used for
evolving centers in the K-Means algorithm and also for
finding a good partitioning .
An evaluation of several initialization techniques
for K-Means algorithm is presented.
III.OVERVIEW OF FUZZY SETAND
PROPOSEDINITIALIZATION ALGORITHM
A Fuzzy set in one dimensional spaces is a
represents recursive decomposition of space using
separators parallel to the coordinate axis. A fuzzy seta
defined in the universal space .X is a function defined in
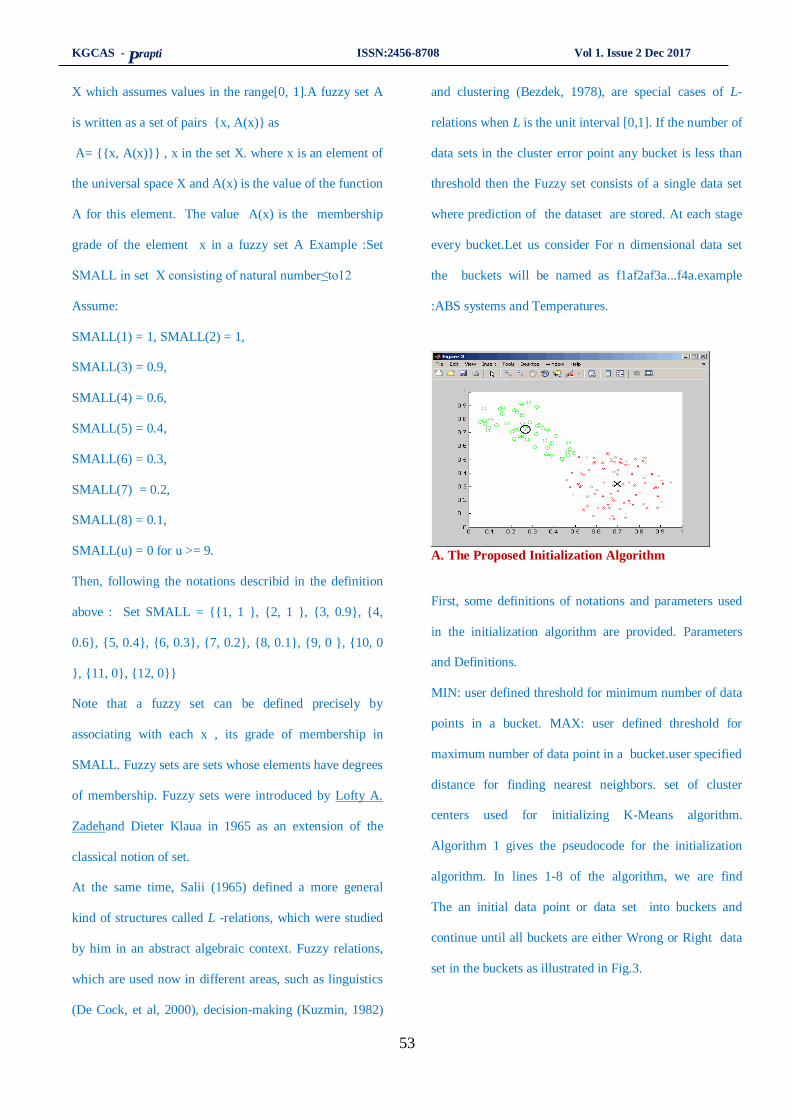
KGCAS - Prapti ISSN:2456-8708 Vol 1. Issue 2 Dec 2017
53
X which assumes values in the range[0, 1].A fuzzy set A
is written as a set of pairs {x, A(x)} as
A= {{x, A(x)}} , x in the set X. where x is an element of
the universal space X and A(x) is the value of the function
A for this element. The value A(x) is the membership
grade of the element x in a fuzzy set A Example :Set
SMALL in set X consisting of natural number≤to12
Assume:
SMALL(1) = 1, SMALL(2) = 1,
SMALL(3) = 0.9,
SMALL(4) = 0.6,
SMALL(5) = 0.4,
SMALL(6) = 0.3,
SMALL(7) = 0.2,
SMALL(8) = 0.1,
SMALL(u) = 0 for u >= 9.
Then, following the notations describid in the definition
above : Set SMALL = {{1, 1 }, {2, 1 }, {3, 0.9}, {4,
0.6}, {5, 0.4}, {6, 0.3}, {7, 0.2}, {8, 0.1}, {9, 0 }, {10, 0
}, {11, 0}, {12, 0}}
Note that a fuzzy set can be defined precisely by
associating with each x , its grade of membership in
SMALL. Fuzzy sets are sets whose elements have degrees
of membership. Fuzzy sets were introduced by Lofty A.
Zadehand Dieter Klaua in 1965 as an extension of the
classical notion of set.
At the same time, Salii (1965) defined a more general
kind of structures called L -relations, which were studied
by him in an abstract algebraic context. Fuzzy relations,
which are used now in different areas, such as linguistics
(De Cock, et al, 2000), decision-making (Kuzmin, 1982)
and clustering (Bezdek, 1978), are special cases of L-
relations when L is the unit interval [0,1]. If the number of
data sets in the cluster error point any bucket is less than
threshold then the Fuzzy set consists of a single data set
where prediction of the dataset are stored. At each stage
every bucket.Let us consider For n dimensional data set
the buckets will be named as f1af2af3a...f4a.example
:ABS systems and Temperatures.
A. The Proposed Initialization Algorithm
First, some definitions of notations and parameters used
in the initialization algorithm are provided. Parameters
and Definitions.
MIN: user defined threshold for minimum number of data
points in a bucket. MAX: user defined threshold for
maximum number of data point in a bucket.user specified
distance for finding nearest neighbors. set of cluster
centers used for initializing K-Means algorithm.
Algorithm 1 gives the pseudocode for the initialization
algorithm. In lines 1-8 of the algorithm, we are find
The an initial data point or data set into buckets and
continue until all buckets are either Wrong or Right data
set in the buckets as illustrated in Fig.3.
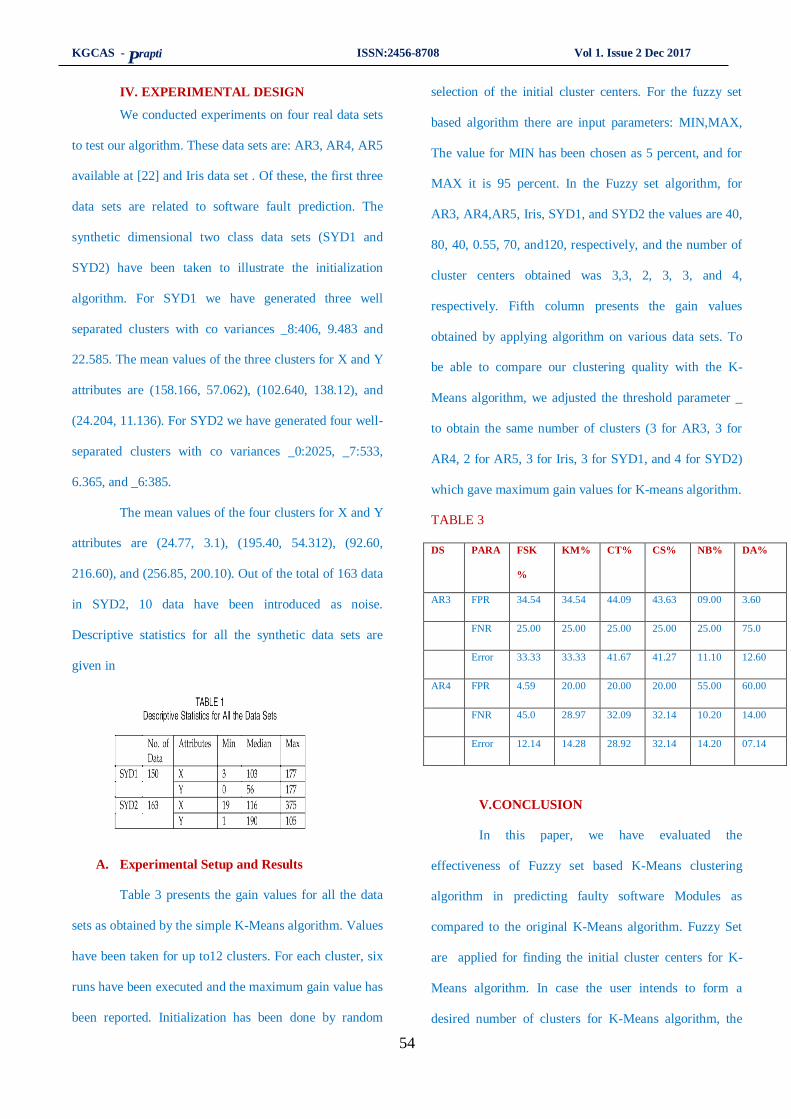
KGCAS - Prapti ISSN:2456-8708 Vol 1. Issue 2 Dec 2017
54
IV. EXPERIMENTAL DESIGN
We conducted experiments on four real data sets
to test our algorithm. These data sets are: AR3, AR4, AR5
available at [22] and Iris data set . Of these, the first three
data sets are related to software fault prediction. The
synthetic dimensional two class data sets (SYD1 and
SYD2) have been taken to illustrate the initialization
algorithm. For SYD1 we have generated three well
separated clusters with co variances _8:406, 9.483 and
22.585. The mean values of the three clusters for X and Y
attributes are (158.166, 57.062), (102.640, 138.12), and
(24.204, 11.136). For SYD2 we have generated four well-
separated clusters with co variances _0:2025, _7:533,
6.365, and _6:385.
The mean values of the four clusters for X and Y
attributes are (24.77, 3.1), (195.40, 54.312), (92.60,
216.60), and (256.85, 200.10). Out of the total of 163 data
in SYD2, 10 data have been introduced as noise.
Descriptive statistics for all the synthetic data sets are
given in
A. Experimental Setup and Results
Table 3 presents the gain values for all the data
sets as obtained by the simple K-Means algorithm. Values
have been taken for up to12 clusters. For each cluster, six
runs have been executed and the maximum gain value has
been reported. Initialization has been done by random
selection of the initial cluster centers. For the fuzzy set
based algorithm there are input parameters: MIN,MAX,
The value for MIN has been chosen as 5 percent, and for
MAX it is 95 percent. In the Fuzzy set algorithm, for
AR3, AR4,AR5, Iris, SYD1, and SYD2 the values are 40,
80, 40, 0.55, 70, and120, respectively, and the number of
cluster centers obtained was 3,3, 2, 3, 3, and 4,
respectively. Fifth column presents the gain values
obtained by applying algorithm on various data sets. To
be able to compare our clustering quality with the K-
Means algorithm, we adjusted the threshold parameter _
to obtain the same number of clusters (3 for AR3, 3 for
AR4, 2 for AR5, 3 for Iris, 3 for SYD1, and 4 for SYD2)
which gave maximum gain values for K-means algorithm.
TABLE 3
DS PARA FSK
%
KM% CT% CS% NB% DA%
AR3 FPR 34.54 34.54 44.09 43.63 09.00 3.60
FNR 25.00 25.00 25.00 25.00 25.00 75.0
Error 33.33 33.33 41.67 41.27 11.10 12.60
AR4 FPR 4.59 20.00 20.00 20.00 55.00 60.00
FNR 45.0 28.97 32.09 32.14 10.20 14.00
Error 12.14 14.28 28.92 32.14 14.20 07.14
V.CONCLUSION
In this paper, we have evaluated the
effectiveness of Fuzzy set based K-Means clustering
algorithm in predicting faulty software Modules as
compared to the original K-Means algorithm. Fuzzy Set
are applied for finding the initial cluster centers for K-
Means algorithm. In case the user intends to form a
desired number of clusters for K-Means algorithm, the
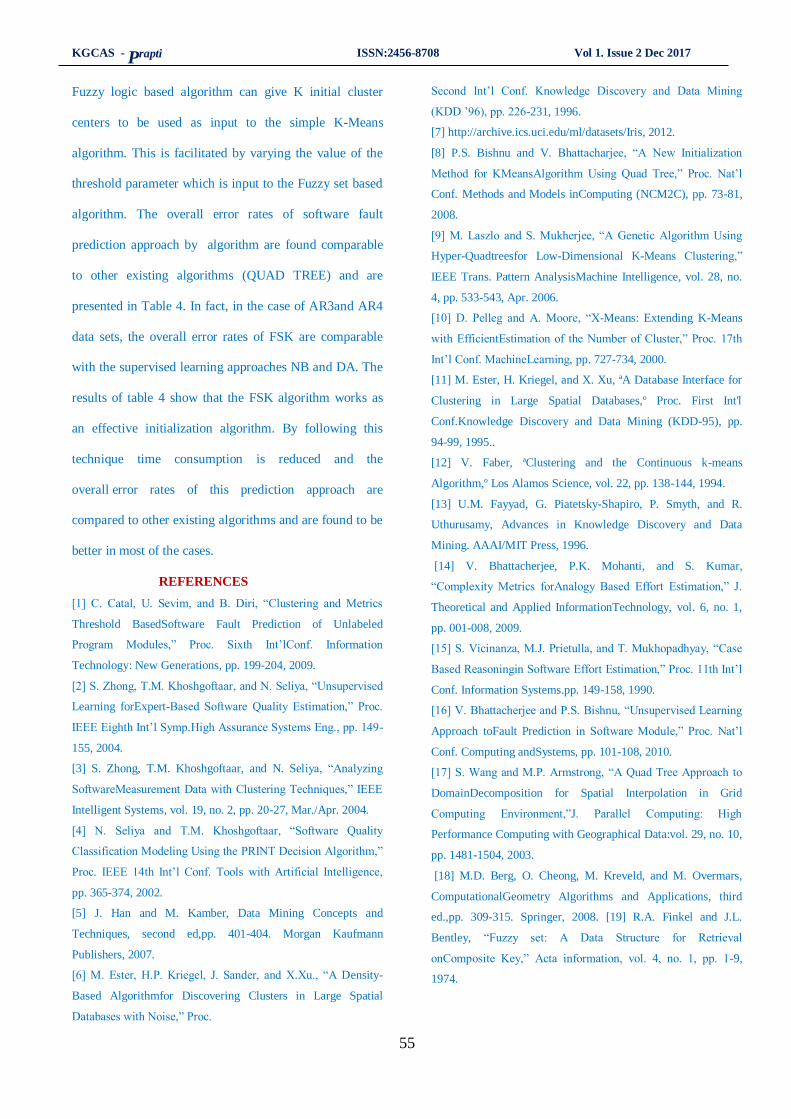
KGCAS - Prapti ISSN:2456-8708 Vol 1. Issue 2 Dec 2017
55
Fuzzy logic based algorithm can give K initial cluster
centers to be used as input to the simple K-Means
algorithm. This is facilitated by varying the value of the
threshold parameter which is input to the Fuzzy set based
algorithm. The overall error rates of software fault
prediction approach by algorithm are found comparable
to other existing algorithms (QUAD TREE) and are
presented in Table 4. In fact, in the case of AR3and AR4
data sets, the overall error rates of FSK are comparable
with the supervised learning approaches NB and DA. The
results of table 4 show that the FSK algorithm works as
an effective initialization algorithm. By following this
technique time consumption is reduced and the
overall error rates of this prediction approach are
compared to other existing algorithms and are found to be
better in most of the cases.
REFERENCES
[1] C. Catal, U. Sevim, and B. Diri, “Clustering and Metrics
Threshold BasedSoftware Fault Prediction of Unlabeled
Program Modules,” Proc. Sixth Int’lConf. Information
Technology: New Generations, pp. 199-204, 2009.
[2] S. Zhong, T.M. Khoshgoftaar, and N. Seliya, “Unsupervised
Learning forExpert-Based Software Quality Estimation,” Proc.
IEEE Eighth Int’l Symp.High Assurance Systems Eng., pp. 149-
155, 2004.
[3] S. Zhong, T.M. Khoshgoftaar, and N. Seliya, “Analyzing
SoftwareMeasurement Data with Clustering Techniques,” IEEE
Intelligent Systems, vol. 19, no. 2, pp. 20-27, Mar./Apr. 2004.
[4] N. Seliya and T.M. Khoshgoftaar, “Software Quality
Classification Modeling Using the PRINT Decision Algorithm,”
Proc. IEEE 14th Int’l Conf. Tools with Artificial Intelligence,
pp. 365-374, 2002.
[5] J. Han and M. Kamber, Data Mining Concepts and
Techniques, second ed,pp. 401-404. Morgan Kaufmann
Publishers, 2007.
[6] M. Ester, H.P. Kriegel, J. Sander, and X.Xu., “A Density-
Based Algorithmfor Discovering Clusters in Large Spatial
Databases with Noise,” Proc.
Second Int’l Conf. Knowledge Discovery and Data Mining
(KDD ’96), pp. 226-231, 1996.
[7] http://archive.ics.uci.edu/ml/datasets/Iris, 2012.
[8] P.S. Bishnu and V. Bhattacharjee, “A New Initialization
Method for KMeansAlgorithm Using Quad Tree,” Proc. Nat’l
Conf. Methods and Models inComputing (NCM2C), pp. 73-81,
2008.
[9] M. Laszlo and S. Mukherjee, “A Genetic Algorithm Using
Hyper-Quadtreesfor Low-Dimensional K-Means Clustering,”
IEEE Trans. Pattern AnalysisMachine Intelligence, vol. 28, no.
4, pp. 533-543, Apr. 2006.
[10] D. Pelleg and A. Moore, “X-Means: Extending K-Means
with EfficientEstimation of the Number of Cluster,” Proc. 17th
Int’l Conf. MachineLearning, pp. 727-734, 2000.
[11] M. Ester, H. Kriegel, and X. Xu, ªA Database Interface for
Clustering in Large Spatial Databases,º Proc. First Int'l
Conf.Knowledge Discovery and Data Mining (KDD-95), pp.
94-99, 1995..
[12] V. Faber, ªClustering and the Continuous k-means
Algorithm,º Los Alamos Science, vol. 22, pp. 138-144, 1994.
[13] U.M. Fayyad, G. Piatetsky-Shapiro, P. Smyth, and R.
Uthurusamy, Advances in Knowledge Discovery and Data
Mining. AAAI/MIT Press, 1996.
[14] V. Bhattacherjee, P.K. Mohanti, and S. Kumar,
“Complexity Metrics forAnalogy Based Effort Estimation,” J.
Theoretical and Applied InformationTechnology, vol. 6, no. 1,
pp. 001-008, 2009.
[15] S. Vicinanza, M.J. Prietulla, and T. Mukhopadhyay, “Case
Based Reasoningin Software Effort Estimation,” Proc. 11th Int’l
Conf. Information Systems.pp. 149-158, 1990.
[16] V. Bhattacherjee and P.S. Bishnu, “Unsupervised Learning
Approach toFault Prediction in Software Module,” Proc. Nat’l
Conf. Computing andSystems, pp. 101-108, 2010.
[17] S. Wang and M.P. Armstrong, “A Quad Tree Approach to
DomainDecomposition for Spatial Interpolation in Grid
Computing Environment,”J. Parallel Computing: High
Performance Computing with Geographical Data:vol. 29, no. 10,
pp. 1481-1504, 2003.
[18] M.D. Berg, O. Cheong, M. Kreveld, and M. Overmars,
ComputationalGeometry Algorithms and Applications, third
ed.,pp. 309-315. Springer, 2008. [19] R.A. Finkel and J.L.
Bentley, “Fuzzy set: A Data Structure for Retrieval
onComposite Key,” Acta information, vol. 4, no. 1, pp. 1-9,
1974.