Embed Size (px)
Citation preview


____________________________ Gyandheep Volume 1 Issue 2 January 2014_______________________________
General : Management Lessons from Indian Epics 1 - 4
Dr. Rajeswari Krishnan
Human Resource : A Study on the Impact of Academic Self-Efficacy on Academic and 5 - 9
Goal Clarity among Postgraduate Women Students in Bangalore
Bharati Rao Pothukuchi, Dr. S. Anil Kumar, Mihir Dash
Data Recovery: An Empirical Investigation of Key Executives in 10 - 22
Small and Medium Enterprises
Dr. Jasmin Padiya
Finance : Infrastructure Financing Scenario in India 23 - 34
Akinchan Buddhodev Sinha
The Financial Performance Of Indian Electrical Equipment Industry 35 - 39
Dr. P.Balasubramanian
Marketing : E-Insurance: Policyholders Acceptance and Problems 40 - 45
Dr.S.Sudalaimuthu, Mr.B.Angamuthu
A Study on Customer Satisfaction towards Amway Products 46 - 52
with reference to Coimbatore City
Dr.M.Vanishree, Dr.L.Shanthi
Factors Influencing Consumer Shopping between stores located in 53 - 63
Mall and Central Business District – A Comparative Study
Manikandan.M.K.M
Book Review : The IIMA Story: The DNA of an Institution by Prafull Anubhai 64
Devi Premnath
CONTENTS

____________________________ Gyandheep Volume 1 Issue 2 January 2014_______________________________
MESSAGE FROM THE EDITOR-IN-CHIEF
As our commitment to share valuable contributions of Academic and Corporate experts in the field of Management stands, the second issue of GYANDHEEP from Sree Narayana Guru Institute of Management Studies, Coimbatore, begins with the glimpses of management teachings that can be derived from Indian epics. India has a very rich heritage recognized all over the world and it extends its aura into different realms of management too. Unfortunately, we do not realize that what we practice today as modern management is what we traditionally carry within us, and hence an attempt is made to kindle what we already possess. Inadvertently, the last article of this issue is a book review on ‘The IIMA story’ on Indian Institute of Management, Ahmadabad, the top B-School of our country.
The current issue of GYANDHEEP has contributions which have been classified according to their functionalities namely Human Resource, Finance and Marketing. The research articles relating HR throws light on the relationship between self-efficacy and self regulated learning and problems on data handling and redundancy. The authors of Finance articles have made an effort to make us understand the scenario of infrastructure financing and also the performance of Electrical Equipment Industry in India. The articles on Marketing involve customer related studies on E-Insurance, Amway product and Consumer shopping. Retailing has become a buzz word in marketing and the papers on marketing tell us about the changing face of retail markets and how the modern customers behave in a new retail environment. The articles of GYANDHEEP in the present issue as well as issues to come promise a real enriching research experience.
Dr. Rajeswari Krishnan
Editor-in-Chief
“Out of compassion I destroy the darkness of their ignorance. From within them I light the lamp of wisdom and dispel all darkness from their lives”
- Bhagavad Gita
“I believe in innovation and that the way you get innovation is you fund research and you learn the basic facts”
-Bill Gates
“Research is what I’m doing when I don’t know what I’m doing.”
-Wernher von Braun

____________________________ Gyandheep Volume 1 Issue 2 January 2014____________________________
1
MANAGEMENT LESSONS FROM INDIAN EPICS
Dr. Rajeswari Krishnan*
1. INTRODUCTION
‘Management’, be it managing a business or any other activity, is all about bringing people together for achieving the desired goal and it involves the popular functions of management viz. planning, organizing, leading, controlling and coordinating. Management as a separate discipline has gained popularity in recent decades with the modern management gurus giving a lot of theories, concepts, principles, researches and case studies. But, in India, they were practiced since ancient days and if we study the two great epics of our great nation – Ramayan and Mahabharat – one can easily understand that every episode or incidence in these two splendid treasures of our motherland teaches a new lesson that can be linked to the modern management practices. These lessons are applicable in realistic terms in today’s world as they were applicable thousands of years back and they will be applicable thousands of years later too. While Lord Ram in Ramayan enlightens us about ‘how a human has to be’, Lord Krishna in Mahabharat deliberately teaches us ‘how a human should not be’. Both the epics are immeasurable oceans and we can keep picking up pearls of wisdom every time we dive in them. A few of the numerous management lessons that can be derived from the epics are discussed below.
2. LESSONS FROM RAMAYAN
2.1. Clear Vision – Lord Ram had a clear vision of defeating the evil forces and rescuing his wife Sita from the clutches of the Demon King Ravan. This lead to a number of actions such as sending search parties to various directions, building an overseas bridge etc. and this clarity about the goals enabled him to put his heart and soul in the battle to rescue Sita successfully.
2.2 Leadership and Decision Making – Ramayan clearly emphasizes two paradigms of leadership - the Democratic style in Ayodhya, where the King always consults his ministers and advisors in all policy matters and decision-making and the Autocratic style in Lanka, where King Ravan never listens to the opinions of his ministers and advisors and his decisions were based on arrogance, injustice and selfishness. The lesson we learn is that Democracy leads to ultimate success and Autocracy paves way to total destruction.
Lord Ram had all qualities that are expected of a good leader: Ram was a charismatic leader. He attracted everyone with his ever smiling appearance and humble but strong
behavior. As many authors describe, Ram was as soft as a fragrant flower but at the same time he could be as hard as an iron in case of need. His aura had a special quality of making everyone conform to his opinions and thoughts.
Ram treated all people equally. Although he was a Prince, Ram commanded great loyalty from all the sects of his citizens by interacting freely with them. He was totally unbiased in developing relationships with people of lower social status; he accepted the hospitality offered by the chief of fishermen Guha and gave him a high status equal to his own bothers; he allied with the forest tribes (monkey folk) and treated their leaders Sugriv, Angad, Hunuman, Nal, Neel and others as his equals, which helped him winning the war.
* Principal, Sree Narayana Guru Institute of Management Studies, Coimbatore – 641 105. E-Mail: [email protected] Mobile: 9443651978.

____________________________ Gyandheep Volume 1 Issue 2 January 2014____________________________
2
Ram was a great motivator and believed in the capabilities of his subordinates. With the tribal army, he encountered the sophisticated army of Ravan. He maintained confidence in the ability of his army and constantly enthused everyone, which ultimately lead to victory.
Ram always consulted his subordinates and took them in to confidence on all important matters and allowed them to give their opinion freely. For example, when Ravan’s brother Vibhishan approached him for protection, many of his army chiefs disagreed with his decision of taking him as their ally. Instead of punishing them, Ram clarified their suspicions and made them accept his decision full heartedly. This is a unique quality of Ram in contrast to Ravan who never allowed anybody contradict him.
Ram delegated authority to the required levels. Hanuman was given full autonomy to plan his mission in search of Sita, although he was accountable to report Ram. Hanuman in turn displayed a high sense of maturity and responsibility in all his actions. He planned to enter Lanka during night time in a miniature form o that he could not be noticed easily. He allowed Ravan to burn his tail, which ultimately set Lanka on fire.
Ram cherished values and followed code of ethics. When Ravan entered the battlefield overconfidently without much of preparations on the first day, he was rendered weaponless by Ram. Ram could have easily killed Ravan and won the war on the same day, but he allowed Ravan to go back because the code of courtesy followed by Ram stipulated that an unarmed enemy should not be attacked.
2.3 SWOT Analysis – Analyzing the strengths, weaknesses, opportunities and threats, which is one of the most important aspects of modern Management, is repeatedly adopted in Ramayan.
Hanuman, who realized his true potential through elderly Jambavan, was entrusted the mission of going to Lanka to locate Sita and deliver Lord Ram’s message. Once motivated to do the job, Hanuman did an absolute SWOT analysis about the enemies and their camp, which helped him to complete the mission successfully.
Even after reaching Lanka, Ram with his well wishers and supporters made a complete SWOT analysis on how to succeed in bringing back Sita from the demon kingdom of Ravan. He could reinforce his strengths, subdue his weaknesses, utilize the opportunities to the best of his success and overcome the threats, ultimately leading to achievement of the desired goal.
2.4 Strategic Management taught by Ramayan – Strategic management is all about framing a set of decisions and actions that result in formulation and implementation of plans designed to achieve the objectives. It involves sequential steps and dimensions:
The first dimension is the top management decision. In case of Ramayan, the strategic decision of killing the Demon King Ravan was taken jointly by the three supreme powers Vishnu, Brahma and Shiva. Lord MahaVishnu involved himself directly with the blessings of others and incarnated to earth as Ram, son of King Dhasarath of Ayodhya.
The second dimension is allocation of resources. Lord MahaVishnu knew that human resources of Ayodhya with the risk of taking them down to Lanka would be insufficient to fight Ravan. Hence, he instructed gods to take form of monkeys so that they will not be noticed by Ravan, and live in mountains nearer to Lanka.
The third dimension is long term objective. In Ramayan, the objective is to eradicate evilness from the earth and establish Dharma and hence, Ram had to kill all the demons including Ravan to eradicate evil forces.
The fourth dimension of strategic management is future oriented. Ram was compelled to stay away from Ayodhya for 14 years in the forest. This gave him lot of time, exposure and energy to plan and organize so that he can complete his mission successfully.
Fifth, strategic management involves multifunctional approach in decision making and implementation processes. This approach of involving all those around him can be observed in the entire operations of Ram. He always consulted his central team consisting of Jambavan, Hanuman, Sugriv and Vibheeshan for all his strategic orientations and they formulated a road map supported by strategic plans to achieve his mission.
Environmental analysis, which forms an integral part of strategic management, is the sixth dimension. Ram was known for extensive external analysis before making every move. For example, he with his allies considered the rainy season unfit for initiating action and they waited patiently for the season to get over to begin their search for Sita. .
____________________________ Gyandheep Volume 1 Issue 2 January 2014____________________________
3
Strategic decision making involves hierarchical division to accomplish task. Ram had effectively created this hierarchy in his battle with Ravan. The top level was constituted by Ram and Laxman followed by Sugreev, Hanumam and Jambavan at the middle level and Angad, Nal and Neel at the bottom level. Later on Vibheeshan was given the role of strategic advisor. This systematic approach gave an unquestionable victory to Ram.
2.5 Epitome of Management – The essence of management lies in achievement of high satisfaction levels of every individual in the entire community. This high order thought comes not just from monetary benefits but from a sense of pride and belongingness everyone has towards the system and its leader. After Ram came back from exile, he was crowned as King of Ayodhya. Ram’s rule that followed, also known as ‘RamRajya’ is known for its ideal state of living in all spheres of life.
3. LESSONS FROM MAHABHARAT
3.1 Transforming Weakness into Strength / Threat into Opportunity - Pandavas were to spend 13 years in exile in the forest before the great Kurushetra war. They used this challenging time as an opportunity to prepare for a big victory and they could transform their weaknesses into strengths. They met many learned saints who shared their wisdom with them. It was during this period when Arjuna acquired best of his weapons (Dhivyastras), Bhima learned humility and patience, Yudhishtra mastered the game of dice and so on, which ultimately brought them to victory.
3.2 Importance of Networking – Pandavas were able to assemble a huge army for the war in spite of the fact that they were not in power but lived in exile for 13 years. They could achieve this through networking, though not by modern ways, but by building relationships through marriages / friendships of Pandavas and their children and by identifying themselves as proponents of Dharma. While Pandavas thus built powerful allies by networking, Kauravas collected enormous wealth by invading kingdoms across the country but at the same time created powerful enemies too.
3.3 Concentration and Target Orientation – Arjun was the master in archery and there was no one who could be equated to his skills in that field. He could achieve this through his concerted efforts. Once, Dhronacharya, teacher of Pandavas and Kauravas, wanted to test the skills of his pupils. Dhrona fixed a target, a toy bird, at the top of a tree and asked everyone to aim arrow at the target. When he asked a question on what they saw after aiming the arrow, everyone including Yudhistra, Bhima, Duriyodhan and Dhushasan explained what they saw – the sky, the clouds, the tree etc. When it came to the turn of Arjun, he said ‘I see the bird and its eye, which is my target and I don’t see anything else’. Dhrona was obviously pleased and instructed him to blow the arrow. This type of target orientation and concentration towards his aim made Arjun pave his way to the position of prime warrior in the Great War of Mahabharat.
3.4 Attitude shapes the personality – It is often said that one’s thoughts and behavior will be based on what he really is. In Mahabharat, there was always an uncertainty on who would be the crowned Prince of the Hastinapur Kingdom, whether Yudhishtra or Duriyodhan. Once, Vidhura, the minister of the Kingdom wanted to test both of them. He called both to the Courtyard and gave them individual assignments of visiting the entire nation with a time limit of one month – Yudhishtra was to identify and bring a ‘bad citizen’ and Duriyodhan was to bring a ‘good citizen’. After a month, both came back empty handed – for Yudhishtra every citizen was good whereas for Duriyodhan every citizen was bad…
3.5 A good mentor is worth an entire army – Arjun and Duriyodhan went to Krishna to seek his support before the war. When given a chance, Duriyodhan chose Krishna’s Yadav army whereas Arjun chose Krishna, a single person who had taken a decision of not holding arms in the war. Arjun knew that both sides had fearsome armies and what he wanted is a strong mentor like Krishna, a beacon who would guide Pandavas to success. His decision proved to be right because Krishna acting as a chariot driver to Arjun, played a great advisory role in the war, ultimately leading Pandavas to victory.
3.6 Lessons on teamwork Individual interests to be aligned to the team interest – The Kaurava army, though had all invulnerable
personalities, could not win because the individuals were not entirely committed. Bheeshma assumed the command with a condition that he would not harm the five Pandava brothers. He also had another condition that he would not fight alongside Karna, which made a great warrior like Karna not enter into the warfield till

____________________________ Gyandheep Volume 1 Issue 2 January 2014____________________________
4
Bheeshma was laid down. He also gave away the secret of killing him to Pandavas. Drona too indirectly gave away his secret by saying that he was invulnerable as long as he held a weapon. He abandoned weapons as soon as he heard the news of his son’s death, allowing emotions to overcome logic. Karna too had promised Kunti that he would not kill Pandavas other than Arjun. Looking at the Pandavas side, Abhimanyu, son of Arjun and Kadothkaj, son of Bheema took suicidal efforts and sacrificed their personal lives for the benefit of the team although they were just kids. Some of the individuals who had individual agenda – Dhrushtadyumna to Drona, Shikandi to Bheeshma, Arjun to Karna, Bhima to Duryodhana, Sahadev to Shakuni etc - saw that they shared a common goal.
Team spirit is important for success – Kauravas did not have much of a team spirit. Bheeshma, Drona and Kripa never wanted a war against Pandavas but fought because they had vowed to protect the throne of Hastinapur. During the war time too, there was no consensus among the team members; Bheeshma didn’t get well with Karna and Shakuni, Karna with Shalya and Shakuni etc. On the other hand, on Pandavas’ side, all of them had respect for Krishna and Yudhistra and the war was common for all of them.
4. CONCLUSION Ramayan and Mahabharat were written thousands of years back, probably when civilization had started just setting in. Yet, our ancestors, saints and sages knew that only knowledge would take India forward and had given us the same in abundance in the form of stories and experiences. It is our duty to take advantage of lessons imparted by these immortal epics. What we have discussed in this article are just droplets in the ocean of knowledge and we have a lot more to offer as management lessons. Some consider Ramayan and Mahabharat as religious, but the fact is that they are NOT. During the ancient days, they were presented with a religious background so that people would listen to it and observe the rules meticulously. Today, the entire world has become a global village and hence the lessons taught by the epics do inspire and will continue to inspire millions of people across the globe cutting across the religious and linguistic barriers.
REFERENCES
1. http://www.siliconindia.com
2. http://venupayyanur.com
3. http://education.sulekha.com
4. http://articles.timesofindia.indiatime.com
5. http://testfunda.com
6. http://www.lifepositive.com
7. http://www.thetripurafoundation.org
8. http://drsasidharanspersonalwebsite.blogspot.in
9. http://bharatjanani.com
10. http://www.speakingtree.in
11. http://www.funonthenet.in
12. http://www.slideshare.net

____________________________ Gyandheep Volume 1 Issue 2 January 2014____________________________
5
A STUDY ON THE IMPACT OF ACADEMIC SELF-EFFICACY ON ACADEMIC AND CAREER GOAL CLARITY AMONG POSTGRADUATE WOMEN STUDENTS IN BANGALORE
Bharati Rao Pothukuchi*, Dr. S. Anil Kumar**, Mihir Dash*** ABSTRACT
This paper studies the impact of Academic Self-Efficacy on Academic and Career Goal Clarity among postgraduate students of Bangalore. The data for the study is collected from a sample of postgraduate women students in Bangalore. The instruments used for data collection included the Academic Self-efficacy Questionnaire and the Academic and Career Goal Clarity Scale (Chemers et al, 1991).Choice of career was influenced by the interest a student had on the subject major, while interest in getting information about statutory requirements for the course as well as of specialization, was determined by both methodical and systematic self-study as well as interest in the area of work. Preparation for the career was determined by systematic self-study methods. Keywords: Academic Self-Efficacy (ASE), Academic and Career Goal Clarity (ACGC), 1. INTRODUCTION Often we see young adult students who do exceptionally well in academics - getting high marks/percentages and good ranks - unable to prove themselves in recruitment for jobs, and in job performance thereafter. This raises questions as to what could be the underlying cause for this malaise. Does it suggest that they are not employment-ready; they do not possess the skill sets or mindsets required for being employed? Or is it that there is a fault in our methods, systems, and processes? Or is it that the students themselves who are responsible, developing poor motivation or belief in self, adopting poor study methods, or maintaining poor career goal clarity, among many other causes? Delving into career decision making and career goal clarity shows that career decision making and career goal clarity is attributed to different causes in research studies. It is considered a linear process by some, an affective process by some, a process affected by external factors by some other researchers. According to Bandura (1989) an important process considered important for career goal clarity is cognitive engagement, which is an important source of motivation function. Through cognitive processes humans generate the motivation to set career goals, plan a course of action, and guide measures through career goals.
Zimmerman explained this process of cognitive engagement through a cyclic three-phase model of self-regulated learning. The ‘Forethought Phase’ involving Task analysis (involving Goal setting and Planning), Self-motivational beliefs (involving Self-efficacy, Outcome expectation, Task value interest, Goal orientation); the ‘Performance phase’ involving Self-control (Task strategies, Self-Instruction, Time Management, Help Seeking); and the ‘Self-reflection phase’(involving Self-judgment, and Self-satisfaction). This cyclic model posits a strong case for interdependency between Academic Self-efficacy and Academic and Career Goal Clarity.Self-efficacy, which involves setting goals and
* Research scholar, Mother Teresa Women’s University, Kodaikanal,India ([email protected]) ** Associate Professor of Commerce, NMKRV College for Women, Bangalore, India (nmkrv.disha @ gmail.com) *** Professor of Quantitative Techniques, Alliance University, Bangalore, India ([email protected])

____________________________ Gyandheep Volume 1 Issue 2 January 2014____________________________
6
monitoring progress towards these goals, is a motivational belief, making individuals believe in their own ability to execute a given task. Self-efficacy serves as a core cause of human actions (Bandura 1986, Bandura and Jorden, 1991). Skilled self-regulated learners exhibit a high sense of self-efficacy in their capabilities. This influences the knowledge, skills, goals set for themselves, commitment to fulfill challenges (Zimmermann, 1989, 1990). Hence the importance of relationship between Academic Self-efficacy and Academic and Career Goal Clarity. This study has implications for Academic and Career Goal Clarity, assuming impact of Self-efficacy. Studies by Zimmermann indicate overestimates of self-efficacy beliefs are linked to poorer academic outcomes. While one possibility could be that overconfidence may undermine students' motivation to study diligently, other implications could mean greater involvement of teachers and if teachers could modify their methods to foster increases in learning among their students.Another possibility is interrelating of students' motivational feelings and beliefs in the learning processes. This aspect has great relevance to areas of education, and preparation for employability as career goals can be largely attributed to career success, according to Abele et al. This study could also have implications for identifying Career Goal Anchors in midlife. A career anchor is a person’s self-concept based on (1) self-perceived talents and abilities, (2) basic values, and (3) the evolved sense of motives and needs as they pertain to career. Career anchors are identified in middle age, and they stabilize in middle age. Most of us are not aware of our career anchors till we are forced to make choices pertaining to family, self-development, or career. Normally this kind of a choice happens with some amount of self-awareness and experience both of which happen around midlife.While Zimmermann has only mentioned the performance aspects (namely, Self-control involving Task strategies, Imagery, Self-Instruction, Time Management, Help seeking), research as to whether ‘Career Goal Clarity’ is impacted by Self-efficacy could be of significance in areas of education and in preparation for employment. 2. REVIEW OF LITERATURE Several studies have examined the role of self-efficacy in the learning process. Pajares studied the contribution of self-efficacy component of Bandura’s Social Cognitive theory (1986) to self-regulated study. Rohaty et al found a considerable relationship between the self-efficacy beliefs, achievement motivation, and self-regulated learning strategies. Bijker et al found a relationship between learning outcomes and self-efficacy, self-regulated learning capabilities, and self-directed career capabilities. Ozlem et al proposed a path model, which suggested higher level of self-efficacy directly associated with CSR (Cognitive Self-regulated learning strategies), MSR (Meta Cognitive Self-regulated learning strategies, and TSEM (Time and study environmental management strategies and Effort regulation strategies).Bandura et al found that self-efficacy is strengthened by the belief that one has personal control over his or her job situation, much of which emanates from an understanding and determination of one’s role expectations. According to Phillips et al, workers’ learning orientation helps them to facilitate achievement of goals that are important to them, evaluate their own competency and enhance their self-efficacy. The longitudinal impact of self-efficacy and career goals on objective and subjective career success was studied by Abele et al. The impact of occupational self-efficacy and career advancement goals on objective (salary, status), and subjective (career satisfaction, career attainments) areas were tested. Occupational self-efficacy measured at career entry had a positive influence on salary change and career satisfaction. Career advancement goals at career entry had a positive influence on salary and status and a positive influence on status change after seven years but a negative influence on career satisfaction after seven years. Women earned less than men, but did not differ in career advancement goals. There is a research gap in examining if there is a relationship between Academic Self-efficacy and Academic and Career Goal Clarity. Zimmermann in his interview (December 2011) indicated scope for research on setting of process goals (i.e. career goal clarity) and for research on strategy attributions to task strategies and outcomes (meaning attributing outcomes to task strategies leading to career goal clarity). Zimmermann also spoke of scope for study on the relationship between Process goals with outcome attributions (i.e. career goal clarity) and Performance stage (which included Self-efficacy and Self-regulated learning). 3. OBJECTIVES OF THE STUDY The objective of the study is to examine the impact of Academic Self-Efficacy on Academic and Career Goal Clarity among postgraduate women students in Bangalore. The study pertains to postgraduate women students, aged between 20 - 24 years, studying in Bangalore.

____________________________ Gyandheep Volume 1 Issue 2 January 2014____________________________
7
4. LIMITATIONS AND SCOPE FOR FURTHER STUDY The results of the study may not be generalizable, as the sample size considered is relatively low. Further, the background of respondents was not known in detail. The sample consisted only female respondents, so the scope can be widened if the study considers male respondents as well. In particular, Self-Regulated Learning would also be expected to play a major role in Academic and Career Goal Clarity. 5. METHODOLOGY The data for the study was collected from a sample of ninety postgraduate female students pursuing M.A., M.Sc., M.Com, in the age group 20 - 24 years from women’s colleges in Bangalore. The Academic Self-efficacy Questionnaire and Academic and Goal Clarity Scale (Chemers et al, 1991) were administered for data collection. The underlying factors contributing to Academic Self-Efficacy and Academic and Career Goal Clarity were obtained using factor analysis, and these were tested for reliability. The impact of Academic Self-Efficacy on Academic and Career Goal Clarity was identified using regression analysis. Differences between science, commerce, and arts students were analyzed using the Kruskal-Wallis test. 6. FINDINGS The results of the factor analysis of the Academic Self-efficacy Questionnaire (Chemers et al, 1991) identified two factors, as presented in Table 1.
Table 1: factors of Academic Self-Efficacy
Factors factor loadings
Systematic self-study
Scheduling time 0.792 Taking notes 0.567 How to study 0.784 reliability 0.595
Interest in study
Interest in research 0.667 Being a good student 0.722 Being good at academics 0.696 Liking work 0.741 Being capable of success 0.581 reliability 0.745
The first factor of Academic Self-Efficacy was that of Systematic Self-Study, involving Scheduling time, Taking notes, and How to study, with reliability of 0.595. The second factor was that of Interest in study, involving Interest in research, Being a good student, Being good at academic tasks, Liking work, and Being capable of success, with reliability of 0.745. Together, the factors explained 53.2% of the overall variation in Academic Self-Efficacy.The results of the factor analysis of the Academic and Career Goal Clarity Scale (Chemers et al, 1991) identified four factors, as presented in Table 2. The first factor was What expected or wanted (which included List of compulsory subjects wanted, Steps wanting to be taken to complete course, Expected Salary Range, Steps taken to get the preferred work, Expected work hours), with reliability 0.846. The second was Preparation for chosen work (which included How long to reach academic goal, Degree requirements, Preparation for work routine, Knowledge of what CV is, Knowledge of making CV), with reliability 0.805. The third factor was Statutory Requirements (which included Choice of Academic Major, Amount of time for completing Academic Major, How many classes required to reach goal, Academic plan for reaching academic goal, College Transfer allowed), with reliability 0.794. The last factor was Specialization, involving Area of interest, Choice of occupation, and Desired work environment, with reliability 0.760. Together, the factors explained 51.6% of the overall variation in Academic and Career Goal Clarity.

____________________________ Gyandheep Volume 1 Issue 2 January 2014____________________________
8
Table 2: factors of Academic and Career Goal Clarity
Factors factor loadings
What they want
What subjects are required/mandatory 0.640 What steps are required for completing course 0.708 Salary range expected 0.771 What Steps to get chosen for work 0.764 Expected work hours 0.785 reliability 0.846
Preparation
How long to reach academic goal 0.640 Degree required 0.801 Work routine required 0.628 Knowledge of what CV 0.555 Knowledge of making CV 0.632 reliability 0.805
Statutory requirements
Choice of Academic major 0.610 Time for completion of course 0.554 How many classes required to reach goal 0.582 Academic plan for reaching academic goal 0.808 College transfers allowed 0.774 reliability 0.794
Specialization
Area of interest 0.638 Choice of occupation 0.801 Desired work environment 0.605 reliability 0.760
The results of the regression analyses are presented in Table 3.
Table 3:Regression of factors of Academic and Career Goal Clarity on factors of Academic Self-Efficacy
What they want Preparation Statutory requirements Specialization [Constant] 3.152 3.422 2.455 3.630
(3.906**) (5.388**) (3.348**) (5.229**) Systematic self-study 0.214 0.307 0.348 0.220
(1.608) (2.938**) (2.880**) (1.927*) Interest in study 0.254 0.161 0.214 0.222
(1.878*) (1.514) (1.739*) (1.912*) R
2 10..3% 16.3% 17.1% 12.2%
F Stat 4.991** 8.485** 8.973** 6.038**
There was significant impact of the factors of Academic Self-Efficacy on all the factors of Academic and Career Goal Clarity. The Interest in study factor was found to have a significant impact on What expected or wanted, while the Systematic self-study factor was not found to have a significant impact; together explaining 10.3% of variation in What expected or wanted. On the other hand, the Systematic self-study factor was found to have a significant impact on Preparation, while the Interest in study factor was not found to have a significant impact, together explaining 16.3% of variation in Preparation. Both Systematic self-study factor and Interest in study factors were found to have significant impact on Statutory requirements and Specialization factors, together explaining 17.1% and 12.2% of variation in these, respectively.

____________________________ Gyandheep Volume 1 Issue 2 January 2014____________________________
9
7. DISCUSSION Choice of career was influenced by the interest a student had on the subject major, while interest in getting information about statutory requirements for the course as well as of specialization, and was determined by both methodical and systematic self-study as well as interest in the area of work. Preparation for the career was determined by systematic self-study methods. 8. RECOMMENDATIONS There is a need for systematic assessment of interests and skills of students, and equipping them with the knowledge of various career opportunities suitable to their interests and liking. They need to have enough exposure to find out the courses suitable in their line of interest, as well as greater awareness of career opportunities associated with their interests. For this, students also need to show some drive by doing more exploration and research in the areas of their interest. Greater focus is needed in empowering the students with systematic self-study methods, as well as in creating awareness about the importance of systematic self-study as systematic self-study is found to impact the entire career goal clarity process, by influencing the preparation, information on statutory requirements as well as specialization.
REFERENCES
1. Odessa, Florida : Psychological Assessment Resources Savickas,ML (1997) ‘ Constructivist career counseling : models and methods’ Advances in personal construct psychology 4(2):149-182
2. Robert K (1997), Prolonged transitions to uncertain destinations: the implications for career guidance, British Journal of Guidance and Counseling 25(3): Page 345-360
3. BJ Investigating Self-regulation and motivation: Historical Background, Methodological Developments and future prospects- by Zimmermann, AMER EDUC RES J, 45(1): 166-183 March 2008
4. Investigating Self-regulation and motivation: Historical Background, Methodological Developments and future prospects by Zimmermann BJ, AMER EDUC RES J, 45(1): 166-183, March 2008
5. The Longitudinal impact of self-efficacy and career goals on objective and subjective career success by Andrea E Abele,Daniel Spurk, Social Psychology Group, University of Eriangen-Nuvemberg,Bismarckstr.6,D91054 Eriangen, Bavaria, Germany
6. Career anchors revisited: Implications for career development in the 21st century by Edgar H Schein, Academy of Management Executive, 1996, Vol. 00, No.0
7. 2011December 2011 - Emerging Research Fronts, Barry Zimmerman Discusses Self-Regulated Learning Processes
8. Self-efficacy beliefs in academic settings-Review of educational research by Frank Pajares, 1/216 in Education and Educational Research
9. Investigating relationship between self-efficacy, academic motivation and learning strategies of UKM undergraduate students by Rohaty Mohd.Majzub, Muhammad Yusuf, Department of Educational Foundation, Faculty of Education, University of Kebangsaan, Malaysia
10. Modeling Self-regulatory capabilities and self-directing capabilities of adult students: Relations with Learning outcomes and Labor market success by Monique Bijker,Marcel van der, Klink, and Els Boshuizen (CELSTEC)
11. Relationship between Self-efficacy, Self-regulated learning strategies and achievement :A ‘Path Model’ by Sadi,Ozlem; Uyar,Adiray; March 2013, Journal of Baltic Science Education 2013, Volume 12, Issue1, Page 21, Academic journal
12. Bandura,A.And Wood,RE (1989) Effect of Percieved controllability and performance standards on self-regulationof complex decisionmaking,Journal of Personality and Social Psychology,56,Page 805-814
13. Phillips.JM and Gully SM (1997),Role of goal orientation,ability,need of achievement and locus of control in the self-efficacy and goal-setting process,Journal of Applied Psychology,82,792-802
14. The longitudinal impact of self-efficacy and career goals on objective and subjective career success by Andrea E.Abele, Daniel Spurk, Social Psychology Group, University of Eriangen- Nuremberg, Bismarckstr.6, D91054 Eriangen, Bavaria, Germany
15. 2011December 2011 - Emerging Research Fronts, Barry Zimmerman Discusses Self-Regulated Learning Processes.

____________________________ Gyandheep Volume 1 Issue 2 January 2014____________________________
10
DATA RECOVERY: AN EMPIRICAL INVESTIGATION OF KEY EXECUTIVES IN SMALL AND MEDIUM ENTERPRISES
Dr. Jasmin Padiya*
ABSTRACT Data security is a prime concern for any organization. This paper aims to critically examine various facets of enterprise data security and awareness amongst key executive about potential hazards of data security. The survey probes key executives of small and medium enterprise about their awareness and preparedness pertaining to data security and recovery. Findings of the study reveals that majority of executives are highly satisfied with the security policy formation and compliance. Key Words: Data Security Awareness, Enterprise, Data Protection, Information Security
1. INTRODUCTION The most essential asset in any organization is the data that is being processed and possessed. Loss of any critical information can be devastating to any organization. Hence, protection of data is the most important activity performed on any computing environment. Data security is a way of keeping data protected from unauthorized access & corruption. The aim of data security is to ensure privacy while securing personal or corporate data (Teotia, Punia, & Awasthi, 2012). In present business world, IT network plays a very important role to ensure efficient operations. Due to this we can see that networks will be continued to be targeted by intruders both outside and within the organization. To gauge the operational availability of these networks, it is extremely vital to create awareness about the network security.
2. LITERATURE REVIEW Majority of users while disposing old computer and hard disk removes all the files or formats in it. Surprisingly, many users believe that removing files from hard disk and emptying recycle bin means permanent deletion of data. In a study (Medlin & Cazier, 2010) recovered 300, 00000 files from 55 HDDs of donated computers. The finding reveals that there is an important need to create awareness about data security. The strategies used for data security depend on the kind of data to be protected, media used and nature of industry (Chang, 2005). Employees receive phishing messages nearly every day, and most of the users are inadequately trained to identify and safely response to them (PhishMe, 2012). Spear phishing is a popular way of infecting organizations with malware. A study by PhishMe (2012) revealed that 27% of security professionals admitted that top executives in their organizations who are attached are also involved in it. SAI Global’s Benchmarking Survey 2008 reveals that 95% of employees consider information security is vital. However, there is a lack of knowledge and training relating to data security and areas of identification and reporting of incidents (Survey, 2011).
A study by Schwartzel & Mnkandla ( 2012) concluded that there are budgetary limitations with regards to disaster recovery in the organizations as disaster recovery is not perceived as a vital business function and lack of commitment from the top management are seen in this regard. Data preservation strategies and methods require much more attention than it has been given today. Training on security awareness will not solve the problem of phishing. Though training plays a vital role, compliance with the policy is more important. Information security must adopt a layered approach including both technical and nontechnical solutions. The biggest impediment in information security is human error or security breach (Quagliata, 2011).Organizations need to design and implement measures to protect their valuable data from internal misuse, without imposing blockades that confine their employees’ ability to perform their duties. In present environment, those who are perceived as being incapable to protect the confidential data entrusted to them will experience loss of consumer confidence- and the related consequences (Moynihan, 2008).
3. OBJECTIVES 1. To measure awareness level among the corporate and SMEs about data recovery. 2. To study the corporate behaviour in post data disaster recovery.
* Associate Professor - Marketing Area, GLS Institute of Computer Technology (MBA), GLS Campus, Law Garden, Ellis Bridge, Ahmedabad – 380006. Email: [email protected], Mobile: +91 98240 52434.

____________________________ Gyandheep Volume 1 Issue 2 January 2014____________________________
11
3. To identify trends in corporate about Information security & Data confidentiality.
4. METHODOLOGY 4.1 Research Design: Descriptive
4.2 Population: Sr. Managers/Key executives of small and medium enterprises who are responsible for IT related decisions from following sectors in Ahmedabad city
o IT o Multimedia o Pharmaceutical o 4 star and 5 star Hotels o Govt. and private Hospitals o Others (placement services, consultancy, etc.)
4.3 Sample unit: Key Executives who are responsible for IT related decisions 4.4 Sample size: 150 4.5 Sampling method: Non-probability purposive sampling 4.6 Research Instruments: Questionnaire & In-depth Interview 5. RESULTS 5.1 Overall Awareness about Data Recovery
Table 1 Overall Awareness on Data Recovery
Aware Unaware Overall Analysis of Awareness 77% 23%
Interpretation Majority (77%) of senior managers were aware about data recovery concept, however to assess their accurate awareness level further specific questions were asked.
Chart 1 Overall Awareness on Data Recovery
5.2 Awareness about Data Recover after Deletion from Recycle Bin Table 2 Awareness on Data Recovery after deletion from recycle bin
Question Yes No Did you know that data can be recovered after deletion from recycle bin? 144 6
Interpretation From the above table it can be interpreted that 96% of the respondents are aware of data recovery after their deletion from recycle bin.
23%
77%
Unaware
Aware

____________________________ Gyandheep Volume 1 Issue 2 January 2014____________________________
12
Chart 2 Awareness on Data Recovery after deletion from recycle bin
5.3 Awareness about Data Recovery from Formatted Hard Disk Table 3 Awareness on possibility of Data Recovery from formatting the HDD
Question Yes No Did you know that data can be recovered even after formatting the HDD? 134 16
Interpretation It is inferred from the above table that 89% of the respondents are aware of data recovery from formatted hard disk.
Chart 3 Awareness on possibility of Data Recovery from formatting the HDD
5.4 Awareness about Data Recovery when Hard Disk is not detected in BIOS Table 4 Awareness on possibility of Data Recovery when HDD is note detected in BIOS
Question Yes No Did you know that data can be recovered when HDD does not detect in BIOS? 84 66
Interpretation Table 4 shows that 56 % of senior managers are having comparatively low awareness about data recovery when HDD is not detected in BIOS.
Chart 4 Awareness on possibility of Data Recovery when HDD is note detected in BIOS
No 4%
Yes 96%
No 11%
Yes 89%
44%
56%
No Yes

____________________________ Gyandheep Volume 1 Issue 2 January 2014____________________________
13
5.5 Data Recovery When Hard Disk is not Detected Table 5 Awareness on possibility of Data Recovery –No Detection of Hard Disk
Question Yes No When your maintenance engineer says HDD not detecting and it has to be replaced then are you
aware data recovery is possible? 100 50
Interpretation From the above table it is found that there is a moderate level of awareness (67%) about data recovery in case of no detection of hard disk by the sr. managers.
Chart 5 Awareness on possibility of Data Recovery –No Detection of Hard Disk
5.6 Comparison of Awareness Level Table 6 Comparison of different types of awareness for data recovery
Question Yes No Did you know that data can be recovered after deletion from recycle bin? 144 6 Did you know that data can be recovered even after formatting the HDD? 134 16 Did you know that data can be recovered when HDD does not detect in BIOS? 84 66 When your maintenance engineer says HDD not detecting and it has to be replaced then are you aware of the fact that data recovery is possible?
100 50
Interpretation The table 6 shows that Sr. mangers are comparatively less aware of the possibility of data recovery in case of no detection of hard disk by maintenance engineer and BIOS.
Chart 6 Comparison of different types of awareness for data recovery
5.7 Awareness about Class 100 Clean Room Environment Table 7 Awareness -Class 100 Clean Room Environment
Question Yes No Are you aware of Class 100 Clean Room Environment? 124 26
33%
67%
No Yes
0 20 40 60 80 100 120 140 160
Did you know that data can be recovered after deletion from recyclebin?
Did you know that data can be recovered even after formatting the HDD?
Did you know that data can be recovered when HDD does not detect in BIOS?
When your maintanance enginner says HDD not detecting and it has to be replaced then are you …
6
16
66
50
144
134
84
100
Yes
No

____________________________ Gyandheep Volume 1 Issue 2 January 2014____________________________
14
Interpretation From the above table it is found that there is very low level of awareness about Class 100 clean room environment amongst sr. manager.
Chart 7 Awareness of Class 100 Clean Room Environment
5.8 Causes of Data Loss Causes of Data loss in any organization can be classified as follow
Table 8 Categories of data loss
Accidental deletion of files/folders/partition Accidental format of a logical drive/ entire HDD Logical
Internal corruption of MS word/Excel/ Access / zip files Crash Internal corruption of MS outlook/ outlook express
Operating system/ application failure
Logical cum
Physical crash
Physical damage of HDD Physical crash Interpretation Around 60% of the corporate find logical cum physical crash on their system along with the logical crashes. The combine counting of these two crashes is almost same so, we can say that the corporate who finds logical cum physical crash, also finds logical problems in the long run. Physical crash problems occur less as it was found that these corporate care and maintain their systems to protect the same from physical damage which is one of the reason for data unrecoverablity.
Table 9 Causes of Media Crash
Type of Crash No Yes Logical Crash 62 88 Logical cum Physical crash 57 93 Physical crash 71 79
Chart 8 Different types of crash faced by firms
83%
17%
No Yes
0% 50% 100%
Logical Crash
Physical crash
No
Yes

____________________________ Gyandheep Volume 1 Issue 2 January 2014____________________________
15
5.9 Correlation - Different Type of Crashes
Table 10 Correlation table of media crash
Particulars
Logi
cal C
rash
Logi
cal c
um
Phys
ical
Cra
sh
Phys
ical
Cra
sh
Logical Crash 1 Logical cum Physical Crash 0.16403 1 Physical Crash 0.01225 0.02806 1
Here the correlation between Logical, Physical and Logical cum Physical crash is shown.
The above statistics shown in the table represents a positive correlation between the variables. Therefore the data tend to move in the same direction that is these three variables tend to increase or decrease together. Logical crash and logical cum physical crash are significantly co-related with each other. Physical crashes and logical crashes are least co-related with each other.
5.9.1 Regression Table 11Table Summary Output ANOVA
Table 12 ANOVA table of media crash
As the relationship between these two variables is linear, linear regression is the best tool to sure co-relation. Chart 9 Linear regressions among “Logical Crash” & “Logical cum Physical Crash”
5.10 Recovery Tool Usage & Ownership Table 13 Probability of data recovery for users of other service providers
Questions No Yes All Data Partial Data Irrelevant Data
Do you use any post data disaster recovery tool? 111 39 Did you get the data that you were looking for? 111 27 12 0
40
60
80
100
0 1 2 3
Logical Crash
Logical cum Physical crash
Regression Statistics Multiple R 0.998159
R Square 0.996322 Adjusted R Square -2 Standard Error 6.615076 Observations 1
df SS MS F Significance F
Regression 2 11854.24 5927.12 270.8969 _ Residual 1 43.75923 43.75923
Total 3 11898

____________________________ Gyandheep Volume 1 Issue 2 January 2014____________________________
16
Interpretation From above Table 13 it is obvious that 26 % of the corporate are using post data disaster recovery tool and out of this 31% of the respondents were only able to recover the last data. Whereas 31% of the respondents were not able to recover all the data, they were only able to achieve partial data around 60% to 70% on an average.
Chart10 Probability of Data Recovery Chart 11Extent of Data Recovery
5.11 Importance of Information Table 14 Information Security policy
Types Information Is important But Without Policy and
Agree to Rethink
Information Is important, Have Policy and Disagree
to Rethink
Information Is important, Have Policy Yet Agree to
Rethink Others
No. of corporate 28 33 78 11
Interpretation From the above table it can be inferred that 90% of corporate finds their information important. 70% of the firms are having policy for information security and data confidentiality in their organizations. Around 50% of the respondents feel that they are very serious about information security and data confidentiality. They still want to come up with new and innovative ideas to secure the information for loss or misuse.
Chart 12 Data Security Policy
5.12 Data Risk Perceptions Table15 Data Risk Perceptions
Do you think that your data is at risk due to any of the following situation? No Yes Planning to dispose off your old computer/hard disk. 25 125 Planning to sell your old laptops/desktops. 34 116 Issue Laptop/ Desktop of ex-employee to a new joiner. 79 71 Transfer of systems from one department to another. 76 74
Interpretation From the above table it can be inferred that there are lot of risk associated with disposal of computers and hard disks .In most of the cases it has been found that confidential data in the hard disk drive is often misused. Similarly, IT managers are also aware of the risk of data security due to selling of old laptop/computers. They are measuring the risk that may occur because of data recovery from laptops/desktops. On the other hand they find issue of Laptop or Desktop of ex-employee to a new joiner less risky than those scenarios which are discussed earlier. The main reason behind this
74%
26%
No
Yes
69%
31% 0% All Data
Partial Data
Irrelevant data
19% 22%
52%
7%
Info. Is important But Without Policy and Agree to Rethink
Info. Is important, Have Policy and Disagree to Rethink
Info. Is important, Have Policy Yet Agree to Rethink
Others

____________________________ Gyandheep Volume 1 Issue 2 January 2014____________________________
17
measurement is that corporate are thinking that, they issue laptops of old employees to new recruits who handle the same job profile in the organization. Managers perceive that transfer of systems from one department to another is less risky. However they are not aware that other department can derive secret data.
Chart 13 Data Risk Perceptions
5.12.1 Capabilities to Measure Risk
Chart 14 Risk Measurement Capabilities
The graph clearly indicates that 65% of the corporate are aware and capable of measuring the data risk due to the given scenario. 35% are still not thinking seriously about data risk. Organizations should change their risk checking approach for better information security or data confidentiality in their organization.
5.13 Dispose of Old/Malfunctioned Hard Disk Drive (HDD) Response
Table 16 Dispose of HDD Opinions No Yes
Give away the HDD as it is doing nothing to the data in it. 117 33 Format the HDD before giving it away 55 95 Use degaussing mechanism to destroy the HDD. 139 11 Erase data permanently beyond recovery using over-writing mechanism 127 23
Interpretation Majority of organizations are conscious while giving away HDD. However, only few organizations take utmost care while disposing hard disk. 5.13.1 Operation Executed by the corporate in Different situations
Chart 15 Operation executed in case of HDD failure
0% 20% 40% 60% 80% 100%
Planning to sell your old …
Issue Laptop/ Desktop of ex-…
Transfer of systems from one …
No
Yes
35.67%
64.33% Unaware
Aware
0%
50%
100%
117 55
139 127
33 95
11 23
No Yes

____________________________ Gyandheep Volume 1 Issue 2 January 2014____________________________
18
5.14 Dispose of Old/Malfunctioned Hard Disk and Type of Industry Table 17 Dispose of Old/Malfunctioned Hard Disk and Type of Industry
Option IT y Multimedia Pharma. Hospitals Hotels others
Give away the HDD as it is doing nothing to the data in it.
13 4 3 5 2 6
Format the HDD before giving it away 50 12 9 9 6 9
Use degaussing mechanism to destroy the HDD.
6 1 0 0 4 0
Erase data permanently beyond recovery using over-writing mechanism
13 0 2 1 3 4
Total 82 17 14 15 15 19
Interpretation
It is quite obvious that IT Companies are more aware about their information security and data confidentiality and prefers to format HDD and over-writing mechanism before the HDD are given away.
Chart 16 Dispose of Old/Malfunctioned Hard Disk and Type of Industry
5.15 Hypothesis Testing
5.15.1
H0: Corporate on Data Risk Measurement is significantly independent of the industries.
H1: Corporate on Data Risk Measurement is significantly dependent on the industries.
0% 10% 20% 30% 40% 50% 60% 70% 80% 90%
100% Erase data permanently beyond recovery using over-writing mechanism
Use degaussing mechanism to destroy the HDD.
Format the HDD before giving it away
Give away the HDD as it is doing nothing to the data in it.

____________________________ Gyandheep Volume 1 Issue 2 January 2014____________________________
19
Table 18 Chi-square Test- Data Risk Measurement
Plan
ning
to
disp
ose
off
your
old
co
mpu
ter/h
ard
disk
. Pl
anni
ng to
se
ll yo
ur o
ld
lapt
ops/d
eskt
ops
. Is
sue
Lapt
op/
Des
ktop
of
ex-e
mpl
oyee
to
a n
ew
join
er.
Tran
sfer
of
syst
ems f
rom
on
e de
partm
ent t
o an
othe
r. R
ow T
otal
IT Company 58 56 39 41 194 Multimedia 15 13 7 10 45 Pharmaceutical 10 8 4 4 26 Hospitals 15 13 10 7 45 Hotel 12 12 6 5 35 Others 15 14 5 7 41 Column Total 125 116 71 74 386
fe =
X2cal = ∑ (f0-fe)2 / fe
X2tab = (r-1)*(c-1) d.f. at given α
Frequency Table Table 19 Frequency Table -Data Risk Measurement
f0 fe (f0-fe)2/fe 58 62.82 0.37 56 58.30 0.09 39 35.68 0.31 41 37.19 0.39 15 14.57 0.01 13 13.52 0.02 7 8.28 0.20
10 8.63 0.22 10 8.42 0.30 8 7.81 0.00 4 4.78 0.13 4 4.98 0.19
15 14.57 0.01 13 13.52 0.02 10 8.28 0.36 7 8.63 0.31
12 11.33 0.04 12 10.52 0.21 6 6.44 0.03 5 6.71 0.44
15 13.28 0.22 14 12.32 0.23 5 7.54 0.86 7 7.86 0.09
∑ (f0-fe)2/fe = X2cal = 5.05
D .f. = 15 X2tab = 22.307

____________________________ Gyandheep Volume 1 Issue 2 January 2014____________________________
20
X2cal < X2tab
Therefore, Null Hypothesis is accepted and it can be concluded that trend among corporate on ‘Data Risk Measurement’ is independent of the industries.
5.15.2 ANOVA H0: Overall Risk measurement among corporate is same for all industries. H1: Overall Risk measurement among corporate is different for all industries.
Here, α = 0.05s ANOVAs: Single Factor
Table 20 ANOVA Summary Groups Count Sum Average Variance
Planning to dispose off your old computer/hard disk. 6.00 125.00 20.83 335.77
Planning to sell your old laptops/desktops. 6.00 116.00 19.33 327.07
Issue Laptop/ Desktop of ex-employee to a new joiner. 6.00 71.00 11.83 181.37
Transfer of systems from one department to another. 6.00 74.00 12.33 201.47
ANOVA
Table 21 ANOVA - Data Risk Measurement Source of Variation SS df MS F P-value F Crit.
Between Groups 391.50 3.00 130.50 0.50 0.69 3.10 Within Groups 5228.33 20.00 261.42
Total 5619.83 23.00
Here, nT = 24 K = 4
nT –k = 20 d.f. =denominator
k-1 = 3 d.f = numerator
Fcal =
= 0.50
Now, Ftab = --
=
F tab = 3.10
Here,
Fcal < F tab.
Null hypothesis H0 is not rejected.

____________________________ Gyandheep Volume 1 Issue 2 January 2014____________________________
21
It can be concluded that the overall Risk measurement trend among corporate is almost same for all industries.
5.15.3
H0: No significance difference in trend among different industry sectors about data risk measures.
H1: At least one industry sector has significant difference in trend from corporate of other industry about data risk measures.
ANOVA
Table 22 ANOVA Different Industry Sectors
Here, From the ANOVA table,
p = 0.69
But, α = 0.05
So, p > α
Null Hypothesis is not rejected and it can be concluded that there is no significant difference between variables.
6. FINDINGS
General awareness on Data Recovery among corporate is around 77%, which shows that IT managers are well aware of data recovery situations.
Less than 25 % of corporate are aware of Class 100 Clean Room concept. 90% of corporate feels that their information is important. Of the 90%, 70% of the firms have policy for
information security and data confidentiality and 50% are seriously re-thinking to revamp the whole data security system.
Around 65% of the corporate are aware and capable of measuring the data risk. Data risk measurement is independent of the industries. Overall risk measurement is done irrespective of all industries. Most of the corporate dispose of the HDD after formatting them. IT Companies are more aware of the information security and data confidentiality.
7. CONCLUSION Awareness about data security and potential hazard is very high among all organizations. It has been found that most of the organizations do have information relating to security policies. However, it has been found that more training relating to data security policy should be given to technical as well as non-technical employees. The corporate should
Source of Variation SS df MS F P-value F crit
Between Groups 391.5 3 130.5 0.5 0.69 3.1
Within Groups 5228.33 20 261.42
Total 5619.83 23

____________________________ Gyandheep Volume 1 Issue 2 January 2014____________________________
22
ensure compulsory compliance with existing policies and should take necessary steps to update the same. As the proverb goes ‘Prevention is better than cure’.
REFERENCES
1. Chang, C.-Y. (2005). A survey of data protection technologies . IEEE International Conference 2005 on Electro Information Technology (p. 6). Lincolin, USA: IEEE.
2. Driml, S. (2003). Enhancing Security with an IT Network Awareness Center. ISACA , IV.
3. Medlin, B. D., & Cazier, J. A. (2010). A Study of Hard Drive Forensics on Consumers’ PCs: Data Recovery and Exploitation. Journal of Management Policy and Practice , 12 (1), 27-35.
4. Moynihan, J. (2008). Managing the Insider Threat: Data Surveillance. ISACA , I.
5. PhishMe. (2012, August 7). www.finance.yahoo.com. Retrieved August 16, 2012, from www.yahoo.com: http://finance.yahoo.com/news/survey-conventional-security-awareness-training-130200079.html
6. Quagliata, K. (2011). Impact of Security Awareness Training Components on Perceived Security Effectiveness. ISACA , IV.
7. Schwartzel, T., & Mnkandla, E. (2012). The impact of critical business data on organizations. African Journal of Business Management , 6(26), 7705-7713.
8. Survey. (2011, May 9). Retrieved August 16, 2012, from www.infosecurity-magazine.com: http://www.infosecurity-magazine.com/view/1844/survey-shows-information-security-awareness-is-high-yet-compliance-is-low-/
9. Teotia, S., Punia, R., & Awasthi, M. (2012). A Survey on Data Security & Computer Networks. International Journal of Management, IT and Engineering , 2 (6), 233-244.

____________________________ Gyandheep Volume 1 Issue 2 January 2014____________________________
23
INFRASTRUCTURE FINANCING SCENARIO IN INDIA
Akinchan Buddhodev Sinha*
ABSTRACT It was not so long ago that infrastructure investment in India was financed almost completely by the public sector, that is, from government budgetary allocations and internal resources of public sector infrastructure organizations. However in the last 10-13 years, the private sector has appeared as an important player in bringing in investment and building and operating infrastructure assets from roads to ports and airports and to network industries like telecom and power. But building infrastructure is a capital-intensive process, with huge initial costs and low operating costs. It demands long-term finance as the gestation period for such projects is often much longer, like for a manufacturing plant. Moreover, infrastructure projects are characterized by non-recourse or limited recourse financing, that is, lenders can only be repaid from the revenues earned from the project. Therefore, these discussions establish the fact that infrastructure financing needs to paid due attention in order to ensure that no infrastructural projects recede due to paucity of adequate financial resources. Therefore, keeping in mind the importance of infrastructure development for a country and its financing needs, this article tries to focus upon the present status of infrastructure financing in India, evaluating the performance and sustainability of infrastructure financing in India, lacunae in infrastructure financing and future of infrastructure financing in India. Keywords: Sustainability, Infrastructure
1. INTRODUCTION It is not a matter of past, till very recently infrastructure investment in India was financed almost completely by the public sector, i.e. from government budgetary allocations and internal resources of public sector infrastructure companies. However, the picture completely changed in past ten years, with private sector investment in infrastructure moving forwards. Private sector has come up as a key player in bringing investment and building and operating infrastructure assets from roads to port, airports and network industries like telecom and power. Private investment now comprises approximately 20 percent of infrastructure investment. Yet, total infrastructure investment remains abysmally low, at around 5 percent of GDP. Compared to this, China spent an estimated 14.4 percent of GDP on infrastructure investment in 2006 and, contrary to popular perception, with little reliance on the state budget. Government of India aimed to raise the infrastructure investment to over 9 percent of GDP by the end of 11th Five-Year Plan (2007-12).
It is an undisputed fact that the public sector can develop world-class infrastructure of the degree envisioned, as China and other countries have shown. But India has embraced the route of public private partnership in infrastructure financing. The reason for Government of India adopting the mentioned approach is the limitation of public savings when looking into the mammoth infrastructure demand to underpin economic growth of 9 percent per annum. Further, private sector brings in higher efficiency in service delivery. Therefore in order to lure private sector, government is trying its level best to frame appropriate regulatory frameworks. Currently, private investment in infrastructure is 1 percent of GDP and majority of the requirements are in green-field projects in telecom and energy, with concessions mainly in transport. Countries which had encouraging private investment in infrastructure in the 1990s had levels ranging from 4 to 6 percent of GDP. Apart from purely private projects, the government focuses to catalyze private investment through PPP model. However, what is essential is to move away from institutional and governance issues and focus on financial aspects. Therefore if the above statement is followed by India in toto, then probably India’s infrastructural growth may witness astral heights. As India has a high domestic savings rate which, is almost 35 percent of GDP in 2006-07, shows that its performance is far better than East Asian Countries. Another good omen is that savings of the corporate sector have been rising continuously and stood at 8 percent of GDP in 2006-07, while public savings also contributed, rising to over 3 percent of GDP, from negative savings until 2002-03.
* Education Officer, The Institute of Company Secretaries of India, HQ, New Delhi, India. E-mail: [email protected] Mobile:+91-09393709307

____________________________ Gyandheep Volume 1 Issue 2 January 2014____________________________
24
2. REVIEW OF LITERATURE The eleventh five year plan of India recognized insufficient infrastructure as a major bottleneck on fast growth. Recognizing the necessity of infrastructure development, Government of India planned to raise infrastructure investment to over 8 percent of GDP by the end of the eleventh five year plan (2007-2012). The total revised estimated expenditure for investment in infrastructure during the eleventh five year plan was estimated at around Rs21 lakh crore. The total investment in infrastructure is estimated to have enhanced from 5.7 percent of GDP in the base year (2006-07) of the eleventh plan to approximately 8.0 percent in the year 2011. To enhance the investment in the infrastructure sector, apart from increasing budgetary allocation for the sector, the Government has been stimulating the private sector to join hands in infrastructural development. Consequently, in the recent years, a number of Public-Private Partnerships (PPP) has come up in the sector. The point to be noted is that private investment accounted for approximately 36 percent of total investment in the eleventh five year plan. (Please refer exhibit 1). The major problem in infrastructural development lies in the financing constraints. According to the Planning Commission, during the first three years of Eleventh Five Year Plan, funds from the Central Government budgeted financed around 45 percent of the total investments in infrastructure. The balance 55 percent was divided between debt financing (41 percent) and equity financing (14 percent). It is important to note that within the debt financing, commercial banks alone financed nearly 21 percent and another 10 percent was financed by the NBFCs. Notably other sources of financing, namely, External Commercial Borrowings (ECBs), equity, FDI and insurance companies financed less than 10 percent of total infrastructure investment each.
3. OBJECTIVES OF THE STUDY 1) To study the growth of infrastructure financing in India. 2) To evaluate the performance of the companies engaged in infrastructure financing in India. 3) To study the sustainability of the companies engaged in infrastructure financing in India. 4) To understand the lacunae in infrastructure financing in India. 5) To study the future of infrastructure financing in India.
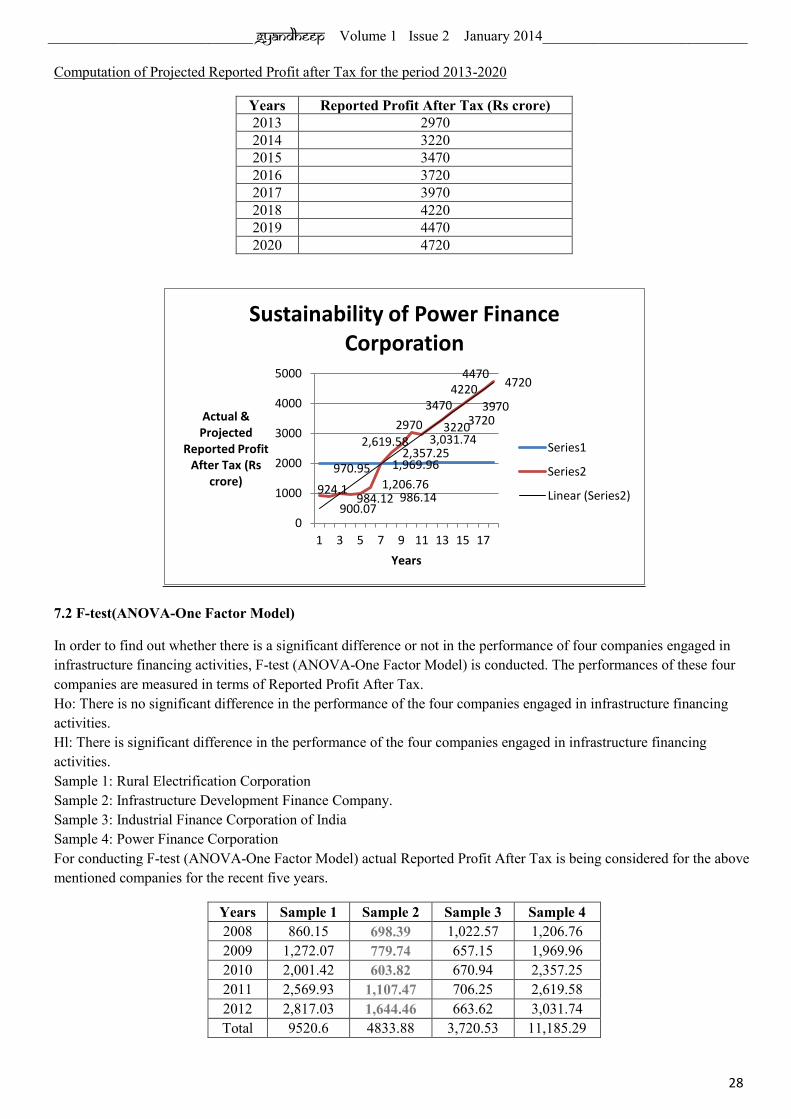
4. RESEARCH METHODOLOGY 1) Straight Line Equation Trend- It is used to judge the sustainability of the infrastructure financing companies in India by forecasting their net profit after tax. As it is a well known fact that profitability ensures sustainability, this statistical tool helps us in gauging the sustainability of the infrastructure financing companies 2) F-test (One Factor Model)- This statistical tool helps us to ascertain the performance of the infrastructure financing companies in India in terms of profit after tax. 3) F-test (Two Factor Model)- This statistical tool helps us to that whether the performance of the selected four companies, i.e., Rural Electrification Corporation, Infrastructure Development Finance Corporation, Industrial Finance Corporation of India and Power Finance Corporation, engaged in infrastructure financing activities significantly differ in terms of Sales Turnover, as also, if the three levels of Selling and Administration expenses make any material difference in sales.
5. LIMITATIONS OF THE STUDY 1) The study is based on secondary data. 2) There are several companies engaged in infrastructure financing but only four companies, viz; Rural Electrification Corporation, Infrastructure Development Finance Corporation, Industrial Finance Corporation of India and Power Finance Corporation have been considered due to time constraints. 6. PRIVATE SECTOR PARTICIPATION IN INFRASTRUCTURE FINANCING The deficiency of infrastructure in developing countries is a key roadblock to meeting populations’ requirements, to economic development and to attain the goals of the Millennium Declaration. Within the OEDC area, several countries confronts the double challenge of increasing demand and ageing physical assets in large parts of their infrastructure sectors, which could become a bottleneck to sustained growth. In the coming decades infrastructural investments which will include telecommunication, power, transportation and water and sanitation is bound to move north-ward. Thus in
____________________________ Gyandheep Volume 1 Issue 2 January 2014____________________________
25
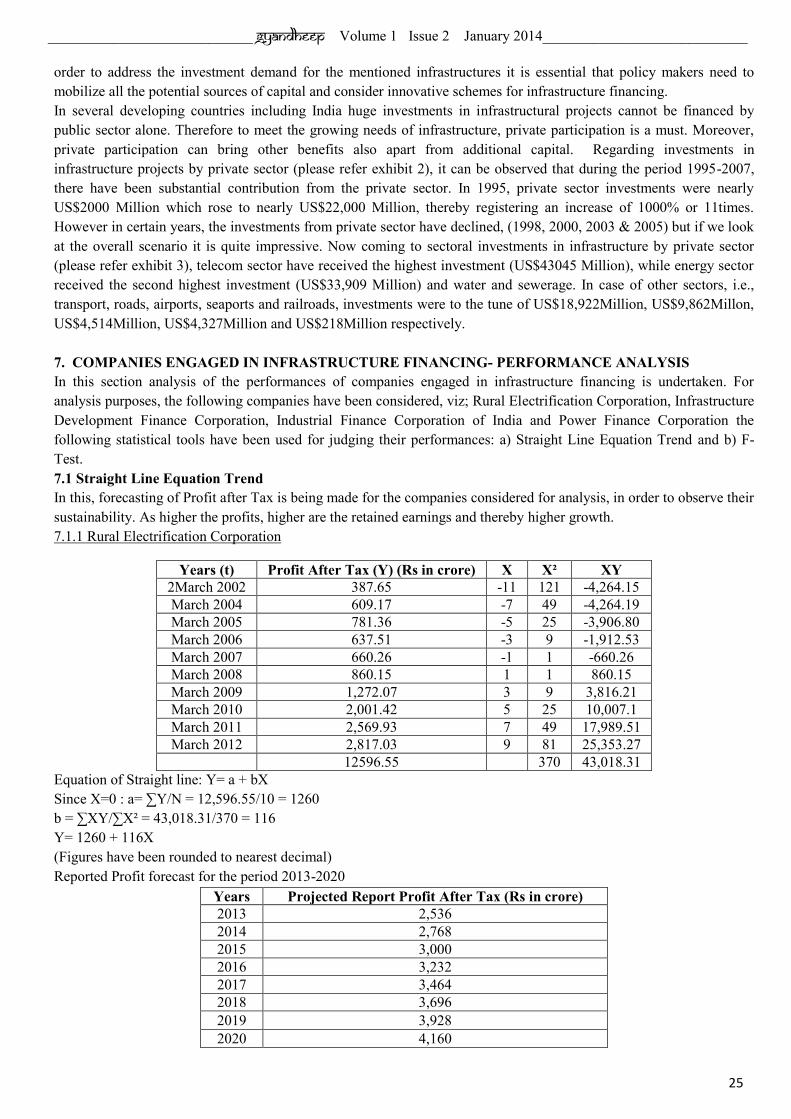
order to address the investment demand for the mentioned infrastructures it is essential that policy makers need to mobilize all the potential sources of capital and consider innovative schemes for infrastructure financing. In several developing countries including India huge investments in infrastructural projects cannot be financed by public sector alone. Therefore to meet the growing needs of infrastructure, private participation is a must. Moreover, private participation can bring other benefits also apart from additional capital. Regarding investments in infrastructure projects by private sector (please refer exhibit 2), it can be observed that during the period 1995-2007, there have been substantial contribution from the private sector. In 1995, private sector investments were nearly US$2000 Million which rose to nearly US$22,000 Million, thereby registering an increase of 1000% or 11times. However in certain years, the investments from private sector have declined, (1998, 2000, 2003 & 2005) but if we look at the overall scenario it is quite impressive. Now coming to sectoral investments in infrastructure by private sector (please refer exhibit 3), telecom sector have received the highest investment (US$43045 Million), while energy sector received the second highest investment (US$33,909 Million) and water and sewerage. In case of other sectors, i.e., transport, roads, airports, seaports and railroads, investments were to the tune of US$18,922Million, US$9,862Millon, US$4,514Million, US$4,327Million and US$218Million respectively. 7. COMPANIES ENGAGED IN INFRASTRUCTURE FINANCING- PERFORMANCE ANALYSIS In this section analysis of the performances of companies engaged in infrastructure financing is undertaken. For analysis purposes, the following companies have been considered, viz; Rural Electrification Corporation, Infrastructure Development Finance Corporation, Industrial Finance Corporation of India and Power Finance Corporation the following statistical tools have been used for judging their performances: a) Straight Line Equation Trend and b) F-Test. 7.1 Straight Line Equation Trend In this, forecasting of Profit after Tax is being made for the companies considered for analysis, in order to observe their sustainability. As higher the profits, higher are the retained earnings and thereby higher growth. 7.1.1 Rural Electrification Corporation
Years (t) Profit After Tax (Y) (Rs in crore) X X² XY 2March 2002 387.65 -11 121 -4,264.15 March 2004 609.17 -7 49 -4,264.19 March 2005 781.36 -5 25 -3,906.80 March 2006 637.51 -3 9 -1,912.53 March 2007 660.26 -1 1 -660.26 March 2008 860.15 1 1 860.15 March 2009 1,272.07 3 9 3,816.21 March 2010 2,001.42 5 25 10,007.1 March 2011 2,569.93 7 49 17,989.51 March 2012 2,817.03 9 81 25,353.27
12596.55 370 43,018.31 Equation of Straight line: Y= a + bX Since X=0 : a= ∑Y/N = 12,596.55/10 = 1260 b = ∑XY/∑X² = 43,018.31/370 = 116 Y= 1260 + 116X (Figures have been rounded to nearest decimal) Reported Profit forecast for the period 2013-2020
Years Projected Report Profit After Tax (Rs in crore) 2013 2,536 2014 2,768 2015 3,000 2016 3,232 2017 3,464 2018 3,696 2019 3,928 2020 4,160

____________________________ Gyandheep Volume 1 Issue 2 January 2014____________________________
26
7.1.2 Infrastructure Development Financial Corporation
Years (t) Profit after Taxation (Y) (Rs in crore) X X² XY 2005 304.02 -3 9 -912.06 2006 375.64 -2 4 -751.28 2007 462.87 -1 1 -462.87 2008 669.17 0 0 0 2009 735.92 1 1 735.92 2010 1012.84 2 4 2025.68 2011 1277.15 3 9 3831.45
4,837.61 28 4,466.84
Equation of a straight line : Y= a+bX Since X =0 : a= ∑Y/N = 4,837.61/7= 690 b = ∑XY/∑X² = 4,466.84/28 = 160 Therefore straight line equation will be Y = 690 + 160X Projected Profit after Tax for the period 2013-2020
Years Projected Profit After Tax (Rs in crore) 2013 1,490 2014 1,650 2015 1810 2016 1,970 2017 2,130 2018 2,290 2019 2,450 2020 2,610
7.1.3.Industrial Finance Corporation of India (IFCI)
Years (t) Profit after Tax (Y) (Rs in crore) X X² XY 2003 -259.70 -9 81 2,337.30 2004 -3,229.78 -7 49 22,608.46 2005 -443.40 -5 25 2,217 2006 -177.82 -3 9 533.46 2007 873.71 -1 1 -873.71 2008 1,022.57 1 1 1022.57 2009 657.15 3 9 1,971.45 2010 670.94 5 25 3,354.70 2011 706.25 7 49 4,943.75 2012 663.62 9 81 5,972.58
483.54 330 44,087.56
387.65
609.17 781.36
637.51 660.26
860.15 1,272.07
2,001.42 2,569.93
2,817.03 2,536
2,768
3,000 3,232 3,464
3,696 3,928
4,160
0
1000
2000
3000
4000
5000
1 2 3 4 5 6 7 8 9 10 11 12 13 14 15 16 17 18
Actual & Reported Profit
after Tax
Years
Sustainability of Rural Electrification Corporation
Series1
Series2

____________________________ Gyandheep Volume 1 Issue 2 January 2014____________________________
27
Equation of a straight line : Y = a+bX Since X=0 : a= ∑Y/N = 483.54/10 = 48 b = ∑XY/∑X² = 44,087.56/330 = 134 Therefore, straight line equation trend is: Y= 48 + 134X
Projected Profit after Tax for the period 2013-2020
Years Projected Profit After Tax (Rs crore) 2013 1,522 2014 1,790 2015 2,058 2016 2,326 2017 2,594 2018 2,862 2019 3,130 2020 3,398
7.1.4 Power Finance Corporation
Years (t) Reported Profit After Tax (Rs crore) Y X X² XY 2003 924.10 -9 81 -8316.9 2004 900.07 -7 49 -6300.49 2005 984.12 -5 25 -4920.60 2006 970.95 -3 9 -2912.85 2007 986.14 -1 1 -986.14 2008 1,206.76 1 1 1206.76 2009 1,969.96 3 9 5909.88 2010 2,357.25 5 25 11786.25 2011 2,619.58 7 49 18337.06 2012 3,031.74 9 81 27,285.66
15950.67 330 41088.63
Straight line equation is: Y= a+bX Since X=0 : a = 15,950.67/10 = 1595 b = 41088.63/330 = 125 Therefore the straight line equation is: Y = 1595 + 125X
-259.7
-3,229.78
-443.4
-177.82
873.71 1,022.57
657.15 670.94 706.25 663.62
1,522 1,790 2,058 2,326
2,594 2,862 3,130 3,398
-4000
-3000
-2000
-1000
0
1000
2000
3000
4000
1 2 3 4 5 6 7 8 9 10 11 12 13 14 15 16 17 18
Actual & Projected Profit after Tax (Rs
crore)
Years
Sustainability of IFCI
Series1
Series2
Linear (Series2)
____________________________ Gyandheep Volume 1 Issue 2 January 2014____________________________
28
Computation of Projected Reported Profit after Tax for the period 2013-2020
Years Reported Profit After Tax (Rs crore) 2013 2970 2014 3220 2015 3470 2016 3720 2017 3970 2018 4220 2019 4470 2020 4720
7.2 F-test(ANOVA-One Factor Model)
In order to find out whether there is a significant difference or not in the performance of four companies engaged in infrastructure financing activities, F-test (ANOVA-One Factor Model) is conducted. The performances of these four companies are measured in terms of Reported Profit After Tax. Ho: There is no significant difference in the performance of the four companies engaged in infrastructure financing activities. Hl: There is significant difference in the performance of the four companies engaged in infrastructure financing activities. Sample 1: Rural Electrification Corporation Sample 2: Infrastructure Development Finance Company. Sample 3: Industrial Finance Corporation of India Sample 4: Power Finance Corporation For conducting F-test (ANOVA-One Factor Model) actual Reported Profit After Tax is being considered for the above mentioned companies for the recent five years.
Years Sample 1 Sample 2 Sample 3 Sample 4 2008 860.15 698.39 1,022.57 1,206.76 2009 1,272.07 779.74 657.15 1,969.96 2010 2,001.42 603.82 670.94 2,357.25 2011 2,569.93 1,107.47 706.25 2,619.58 2012 2,817.03 1,644.46 663.62 3,031.74 Total 9520.6 4833.88 3,720.53 11,185.29
924.1
900.07 984.12
970.95
986.14 1,206.76
1,969.96 2,357.25
2,619.58 3,031.74 2970 3220
3470 3720
3970
4220 4470
4720
0
1000
2000
3000
4000
5000
1 3 5 7 9 11 13 15 17
Actual & Projected
Reported Profit After Tax (Rs
crore)
Years
Sustainability of Power Finance Corporation
Series1
Series2
Linear (Series2)

____________________________ Gyandheep Volume 1 Issue 2 January 2014____________________________
29
X l = 9521/5 = 1904 X 2 = 4834/5 = 967 X 3 = 3721/5 = 744 X 4 = 11,185/5 = 2237 Grand Mean = 1904 + 967 + 744 + 2237/4 = 1463 Variance between samples
Sample 1- Grand Mean)²
Sample 2- Grand Mean)²
Sample 3-Grand Mean)²
Sample 4 – Grand Mean)²
194,481 246,016 516,961 599,076 194,481 246,016 516,961 599,076 194,481 246,016 516,961 599,076 194,481 246,016 516,961 599,076 194,481 246,016 516,961 599,076 972,405 1,230,080 2,584,805 2,995,380
SSC= Sum of squares between samples = 972,405 + 1,230,080 + 2,584,805 + 2,995,380 = 7,782,670
Variance within samples
X1 - 1)² X2 - 2)² X3 - 3)² X4 - 4)² 860.15 1,089,936 698.39 72,361 1,022.57 77,841 1,206.76 1,060,900
1,272.07 399,424 779.74 34,969 657.15 7,569 1,969.96 71,289 2,001.42 9,409 603.82 131,769 670.94 5,329 2,357.25 14,400 2,569.93 443,556 1,107.47 17,956 706.25 1,444 2,619.58 146,689 2,817.03 833,569 1,644.46 458,329 663.62 6,400 3,031.74 632,025
2,775,894 715,384 98,583 1,925,303
SSE = Sum of squares within samples. = 2,775,894 + 715,384 + 98,583 + 1,925,303 = 5,515,164
ANOVA Table
Sources of variation Sum of squares Degrees of freedom (v) Mean Squares SSC = Between samples 7,782,670 3 2,594,223 SSE = Within samples 5,515,164 16 344,698
19
Test Statistic: F = Variation Between Samples/ Variation Within Samples F = 2,594,223/344,698 = 8 Note: The figures have been rounded off to nearest decimal.
7.3 Analysis of Variance in Two Way or in Manifold Classifications Under this section, ANOVA (Two-Factor Model) test is being applied to observe whether the performance of these four companies engaged in infrastructure financing activities significantly differ in terms of Sales/Turnover, as also, if the three levels of Selling and Administration expenses make any material difference in sales. For this purpose, the three levels of Selling and Administration expenses considered are: High, Medium and Low. Sample 1: Rural Electrification Corporation Sample 2: Infrastructure Development Finance Company. Sample 3: Industrial Finance Corporation of India Sample 4: Power Finance Corporation Selling & Administration expenses/Companies Turnover Total
Sample-1 Sample-2 Sample-3 Sample- 4 High 3378.22 6094.32 2286.51 10128.49 21,887.54
Medium 6549.76 3144.71 1655.66 6,557.37 17,907.50 Low 4757.17 3313.25 1909.15 13,014.85 22,994.42
14685.15 12552.28 5851.32 29700.71 62,789.46

____________________________ Gyandheep Volume 1 Issue 2 January 2014____________________________
30
Correction Factor = (62789)²/12 = 328,538,210 SST = Total sum of squares = ∑∑x²ij – C = │(3378)² + (6550)² + (4757)² + (6094)² + (3145)² + (3313)² + (10128)² + (6557)² + (13,015)²│- 328,538,210 = (11,410,884 + 42,902,500 + 22,629,049 + 37,136,836 + 9,891,025 + 10,975,969 + 102,576,384 + 42,994,249+ 169,390,225) – 328,538,210 = 121,368,911 SSC = Sum of squares between companies =∑(∑jxi)²/nj – C = │(14685)²/3 + (12552)²/3 + (5851)²/3 + (29701)²/3│ = 71,883,075 + 52,517,568 + 11,411,400 + 294,049,800 – 328,538,210 = 101,323,633 Sum of squares between selling and administration expenses = (∑T²/c) – C = (21,888)²/4 + (17,908)²/4 + (22,994)²/4 – 328,538,210 = 119,771,136 + 80,174,116 + 132,181,009 - 328,538,210 = 3,588,051 Error sum of squares = SST (Total sum of squares) – SSC(Sum of squares between companies) – Sum of squares between selling and administration expenses = 16,457,227 Null Hypothesis : (i) Performance of companies are equal in terms of turnover. (ii) Selling and administration expenses are equally effective for all the companies. Alternative Hypothesis: (i) Performance of companies are not equal in terms of turnover. (ii) Selling and administration expenses are not equally effective for all the companies. ANOVA Table Sources of Variation d.o.f. S.S. MSS = S.S./d.o.f FC Ftab (5%)
Between companies 3 101,323,633 MSC = 101,323,633/3 = 33,774,544 MSC/MSE = 12.30 4.76
Between selling and administration
expenses 2 3,588,051 MSR = 3,588,051/2 =
1,794,026 MSR/MSE = 0.65 5.99
Error 6 MSE = 16,457,227/6 = 2,742,871
Total Cr-1 = 11
Note: The figures have been rounded off to nearest decimal.
8. ISSUES IN INFRASTRUCTURE FINANCING IN INDIA Today prices of almost all commodities are moving upwards, especially food items, have skyrocketed in recent times and are expected to increase further due to enhanced demand for food articles, coupled with supply-side limitations. The situation is worsened due to the presence of an inefficient supply chain and rasping infrastructure in India, which result into substantial wastages due to lack of storage facilities. It is estimated that substantial quantity of food grains is lost either due to rats/rodents or due to pilferage resulting from the absence of adequate storage and transport infrastructure. Similarly, the growth in passenger and cargo volumes is applying pressure on railway and airport infrastructure. Regarding investment in airports, five major projects have taken place in recent years, i.e., development of Hyderabad International Airport, Bangalore International Airport and Terminal-3 at Delhi International Airport. While the other two projects focused upon modernization of Mumbai International Airport and Delhi International Airport (please refer exhibit 5). But as mentioned that there is a continuous increase in passenger and cargo volumes, thereby, demanding more airports to be upgraded to international standards as well as construction of new airports to join more cities across India for fast transit of goods and passengers it calls for the rapid implementation of new projects and the augmentation of current infrastructure like dedicated freight corridor (DFC). Similarly the demand for power is on the rise; mandating further increase in production. In this regard remarkable progress has been made but more needs to be done regarding capacity addition (please refer exhibit 4).In order to address the issue of infrastructural development it is assumed that a cumulative investment of nearly $80billion will be required from private debt (assuming 70 percent of debt, which would be normal as concessions kindle more debt financing)

____________________________ Gyandheep Volume 1 Issue 2 January 2014____________________________
31
financing and approximately $35billion will be required in the shape of equity. Now to meet such large scale of investment necessary amendments in regulatory and institutional set ups is needed to enable the flow of funds to the private sector. This assumes higher importance due to two reasons- lack of domestic avenues of financing infrastructure projects, and the explosion of global capital markets and the associated increase of private capital flows to emerging economies such as India.
Despite the various sources of financing infrastructure projects being available and significant developments to facilitate the flow of funds towards infrastructure sector have been initiated still there are certain issues that is plaguing this sector, consequently hampering its growth. For instance, Viability Gap Funding (VGF) has attained success in the road sector, but it has failed to create a similar impact in other infrastructure sectors, most importantly the port sector. The limited success of the VGF in sectors other than roads demands for redesigning of the scheme to suit other infrastructure sectors. For example, longer construction periods in the port sector may expose project developer to inflated costs of development and thus calls for tariff escalation. However, VGF can only be fixed before the starting of the project and tariffs need to be fixed in advance. This feature will have the probability to the restrict the investment in marginal projects. Similarly, the ECB (External Commercial Borrowings) route has its own limitations. An important problem is caused by fluctuations in exchange rates. For instance, depreciation of the rupee against the US dollar would tend to produce a higher outflow for the project developer than estimated while appreciation would result into profit by a lesser outgo. A second issue comes into picture when a firm tries to mitigate the risks against currency fluctuations. No doubt, foreign exchange risk can be managed by intelligent use of derivatives like forward rate contracts but the problem is that forward rates are rarely available for duration of over eight years, according to industry sources. Even if forward contracts are available for a longer duration, they call for very high premiums. One of the important source of financing which can address the financing needs of infrastructure sector is funds from institutions such as insurance companies and pension funds, which have long-term contractual savings. However, in India, this sector has also not witnessed for PPP and competing bidding process. Debt financing from banks can be another source of financing infrastructure projects but there are limitations to borrowing from banks, given the peculiar nature of the duration on their assets and liability side. As the banks needs to lock in the loans granted to infrastructure sector for a long gestation period (typically upwards of five years), funding these loans through short-term deposits poses risks and reduces the lending ability of the bank. An important initiative on the part of the government to step up the financing in infrastructure projects is launching of infrastructure bonds and keeping the returns earned from such bonds out of tax net. The prominent point of these bonds is that the government has exempted credit rating for infrastructure bonds. But unfortunately in India, despite high savings rates, the corporate debt market is yet to achieve the stage of maturity. 9. FUTURE OF INFRASTRUCTURE FINANCING India plans to incur US$1trillion on infrastructure over the coming next years, give birth to questions regarding the ways to accommodate the mammoth financing requirements. Majority of the analysts estimate India’s medium term trend rate of growth more than 8 percent a year, and a continuation of or further impetus to India’s already high savings rate. This will assist in offering adequately large envelope for sound growth in infrastructure. Under India’s 11th Plan, while targets for infrastructure have broadly been attained, this is partially due to the profitability of telecommunications, where investments has been particularly sound. In other fields, like, energy, roads, and railroads, either funding has lagged behind targets or the probability of physical output likely to touch the plan targets seems to be frail. The bill for financing India’s infrastructure comes out to $350 billion. The silver lining is that needed resources may be difficult to arrange but not impossible. Since Indian and foreign infrastructure companies and investors including private equity funds are lining up to be a part of the growth story as India open up its infrastructure sector. According to Hemant Joshi, Executive Director & Chief Operating Officer, CRISIL Limited, “Funds are not an issue for good, bankable projects”. International infrastructure majors such as, CLP, AES, Korea Electric, Malaysian firm IJM Corp along with financial powerhouse Citigroup and private equity firm Blackstone Group Holdings L.P. all have one thing in common, that is, they believe India is the appropriate place for investments. Foreign capital has played a pivotal role in the development of the Indian telecom sector as few Indian business houses only could afford massive investments. However, the flow of investment relies largely on the policy and regulatory environment. Clarity on policies for encouraging investments is important. In more and more sectors, the regulatory

____________________________ Gyandheep Volume 1 Issue 2 January 2014____________________________
32
environment is being fine tuned with the current need of investments in those sectors, which is a good omen. Given the potential of the sector, infrastructure is the current choice of domestic companies like Reliance Industries, GVK, GMR, the ADA group and others. The foray of the private players largely augurs well for the sector where investment requirements far exceeds the amounts provided for in government’s budgetary allocations. The total annual capital investment on infrastructure still hovers around 4 percent of GDP compared to 10 percent share in some other Asian countries. It is considered that India’s infrastructure estimated demand of $350 billion over the next five years needs to be met by a debt-equity ratio of 70:30, that is, about $250 billion of debt $100 billion of equity. It is estimated that 25 percent of the total funds would need to be raised from the private sector. The total investments during the period 2008-12 was estimated at $60 billion for roads, $75 billion for power, $22 billion for telecom and $10 billion for ports, which was almost double the investments observed during 2003-07.As mentioned in the beginning that the amount of funds needed is substantial and cannot be solely funded from budgetary resources alone. As aptly remarked by Finance Minister of India, P.Chidambaram that, “ One has to reach out to the private sector and private savings and to other mechanisms available in market today to raise funds to fund such an ambitious infrastructure project.”
10. FINDINGS AND CONCLUSION Hence, from the straight line equation trend it can be observed that companies engaged in infrastructure financing activities have tremendous potential for growth and they can be expected to be sustainable in the future, as it is evident from projected reported profit after tax for the four companies. However, they need to control their operational expenses in order to enhance their profits. Further when we refer to F-test (One Factor Model), it can be observed that the table value of F for v1=3 and v2 = 16 at 5% level of significance = 3.24. The calculated value of F is more than the table value and hence the difference in the mean values of the sample is significant, i.e., the samples may not have come from the same universe. Moreover, it also indicates that performance of infrastructure financing companies is not equal. Lastly, by applying F-test (Two Factor Model), we reject the hypothesis at (i) as the calculated value of F is more than the table value of F at 5% level of significance. Thus it can be inferred that performance of companies are not equal in terms of turnover, but we accept the hypothesis at (ii) that is the selling and administration expenses are equally effective for all the companies engaged in infrastructure financing activities as the calculated value of F is less than the critical value or table value of F at 5% level of significance. Thus, the above mentioned statistical results evaluate the performance of infrastructure financing companies from different dimensions and at the same time it brings out scenario of infrastructure financing in India to some extent. It is a well established truth that quality infrastructure can act as a catalyst in economic growth and that inadequacy of supportive infrastructure acts as a drag on our Gross Domestic Product (GDP). Therefore it is high time to remove the deficiencies or bottlenecks that exist in the various sources of infrastructure finance in order to facilitate adequate allocation for various sectors of infrastructure.
Exhibit 1 Table 1: Revised Projected Investment on Infrastructure
(Rs. crore at 2006-07 prices)
Tenth Plan 2007-08 2008-09 2009-10 2010-11 2011-12 Eleventh Plan
GDP 1,78,40,877 47,17,187 50,03,545 55,63,800 57,92,904 63,14,265 2,71,91,700
Public Investment 6,94,006 1,99,539 2,38,054 2,62,963 2,90,832 3,19,904 13,11,293
Private Investment 2,25,220 1,04,268 1,21,138 1,39,866 1,69,227 2,08,413 7,42,912
Total 9,19,225 3,03,807 3,59,192 4,02,829 4,60,059 5,28,316 20,54,205
Investment as percentage of GDP
Public Investment 3.89 4.23 4.76 4.90 5.02 5.07 4.82
Private Investment 1.26 2.21 2.42 2.61 2.92 3.30 2.73
Total 5.15 6.44 7.18 7.51 7.94 8.37 7.55
Source: Mid-Term Appraisal of the Eleventh Five Year Plan, Planning Commission.

____________________________ Gyandheep Volume 1 Issue 2 January 2014____________________________
33
Exhibit-2
Exhibit-3
Exhibit-4
Source: http://www.npti.in/Download/Misc/workinggroup%20report%20final%20100212/10Chapter%2008%20Financial%20Issues%2025.01.2012.pdf

____________________________ Gyandheep Volume 1 Issue 2 January 2014____________________________
34
Exhibit-5 Investments in Airport Projects
REFERENCES:
1. IDFC Occasional Paper Series- Financing Infrastructure Website: http://www.idfc.com/pdf/white_papers/Financing_Infrastructure.pdf Retrieved on 6th of December, 2012
2. Financing Infrastructure in India: Macroeconomic Lessons and Emerging Market Case Studies Website: http://www.imf.org/external/pubs/ft/wp/2011/wp11181.pdf Retrieved on 8th of December, 2012
3. Financial statements of Rural Electrification Corporation Website: http://www.moneycontrol.com/financials/ruralelectrificationcorporation/balance-sheet/REC02 Retrieved on 12th of December, 2012
4. Financial statements of IDFC Website: http://www.moneycontrol.com/financials/idfc/results/quarterly-results/IDF Retrieved on 12th of December, 2012
5. Financial statements of IFCI Website: http://www.moneycontrol.com/financials/ifci/balance-sheet/IFC02 Retrieved on 12th of December, 2012
6. Financial statements of Power Finance Corporation Website:http://www.moneycontrol.com/financials/powerfinancecorporation/balance-sheet/PFC02 Retrieved on 12th of December, 2012
7. Infrastructure Financing- Betting Big on India Website: http://www.ibef.org/download/funding.pdf Retrieved on 13th of December, 2012
8. Infrastructure financing in India- Progress & Prospects Website: http://rbi.org.in/scripts/BS_SpeechesView.aspx?Id=655 Retrieved on 9th of April, 2013.
9. OECD Principles for Private Sector Participation in Infrastructure Website: http://www.oecd.org/daf/inv/investment-policy/38309896.pdf Retrieved on 9th of April, 2013.
10. Funding Infrastructure-A relook at institutional and regulatory set-ups Website: http://crisil.com/pdf/infra-advisory/funding-infrastructure-jan11.pdf Retrieved on 10th of April, 2013.

____________________________ Gyandheep Volume 1 Issue 2 January 2014____________________________
35
THE FINANCIAL PERFORMANCE OF INDIAN ELECTRICAL EQUIPMENT INDUSTRY
Dr. P.Balasubramanian*
ABSTRACT Electricity plays a very important role in creating a promising future for the developing economies in this millennium. This sector sells cables, switchgears, transformers and other large electrical products. This study is based on the secondary data obtained from the official directory and database of the Centre for Monitoring the Indian Economy (CMIE) namely ‘PROWESS’ and Capitaline data base. The sample covers manufacturing companies listed in BSE 500 index. In addition journals, books, newspaper and internet information are the supportive data used in this study. Profitability is studied through ratio analysis and using various statistical tools like correlation, mean, standard deviation and co-efficient of variation. This industry plays a vital role in the development of an Indian economy. The efficient performance of this industry will help to improve the profitability position which in turn will help in reducing the problem of equipment shortage. Key words: Finance, Performance, Industry, Electrical Equipment
1. INTRODUCTION It is widely recognised that the next boom of capital appreciation in the current scenario in India will be driven by the power and capital. India is one of the leading consumers of power in the world. The electrical equipment industry is facing a number of challenges which, if addressed by all the stakeholders, can further accelerate the growth process and contribute significantly to reducing the power demand-supply gap in the country. Some of the major challenges include the upwards volatility in raw material, especially metal prices, lack of standardization of product specifications for T&D equipment across different utilities and a lack of appropriate planning leading to accumulation of orders by utilities resulting in sub-optimal utilisation of available domestic manufacturing capacity. 2. OBJECTIVE OF THE STUDY The main objective of the study is to analyse the solvency and profitability position of Indian Electrical Equipment Industry. 3. SCOPE OF THE STUDY The scope of the financial performance of Electrical equipment industry is evaluated through profitability. The analysis is based on accounting data. 4. METHODOLOGY 4.1 Secondary data used in this study is based on the financial statements of Electrical industries. 4.2 Statistical Tools The tools used for the study are
Ratios Mean Standard deviation Co-efficient of variation Correlation analysis
* HOD – Commerce Sri Ramalinga Sowdambigai College of Science and Commerce, Vadavalli - Thondamuthur Road, Onappalayam, Coimbatore - 641 109, E -mail:[email protected], Cell No: 9865128124
____________________________ Gyandheep Volume 1 Issue 2 January 2014___________________________
36
5. LIMITATIONS OF THE STUDY Statistical tools used in this study have its own limitations Only the Profitability position is ascertained in this study Only few companies are considered for this study.
6. REVIEW OF LITERATURE Kuntluru and Mohd, Akbar Alikhan (2009) undertook a study entitled “Financing Pattern of Foreign and Domestic-owned Pharmaceutical companies in India” The researchers have observed a significant difference between the financing patterns of domestic and foreign- owned companies in Pharmaceutical Industry. Jayasubramanian P (2010) has made an attempt to study the financial performance of selected Pharmaceutical companies in India; he suggested that the financial performances of the companies under study were satisfactory. The companies having large capital and making higher sales yielded more profit than the other companies. He further suggested that the companies will have to perform in order to increase it sales for better sustenance. Rajendran and Nagarajan (2010) in their research work entitled “A study on Solvency Position of LIC of India” have intended to evaluate the solvency position of LIC. The researchers have observed that correlation analysis revealed a positive correlation between the equity share capital and total current liability in firm during the study period. The analysis reveals that LIC proportionally distributed its profit to equity share capital as well as to liabilities, which vary due to the needs of the company. The analysis has found that there is more variation in current liabilities due to heavy competition. Vadivel C (2010) has made a study on the financial and operating performance of selected Indian industries in the liberalized economic environment which had provided many valuable facts to the Industrial world. The researcher had made trend analysis, profitability analysis, and productivity analysis and pointed out that the industries can concentrate more on cost control and Economic production. 7. ANALYSIS Financial performance of Electrical Equipment Industry-Selected Companies from BSE 500 A solvency and Profitability ratio has been used to analyse the financial performance of an Electrical Equipment Industry. The ratios are:
Current ratio (CR) Liquid ratio (LR) Debt Equity (DE) Net profit ratio (NPR) Return on assets (ROA) Return on equity (ROE) Return on Net worth (RON)
Table 1 reveals that the solvency and profitability position of selected Electrical equipment companies and overall position of this sector for the study period from 1997 to 2012. Solvency is explained with current ratio, liquid ratio and debt equity ratio. The profitability is explained with net profit ratio, return on assets and return on net worth.
7.1 Current Ratio The relationship between current assets and current liabilities is expressed in the current ratio. Current assets is more (2.58) than current liabilities (1). It indicates that electrical equipment industry is financial sufficient to meets its short term liabilities. Lesser the co-efficient of variation indicates that there is uniformity in the solvency position. Finally it is studied that Electrical Equipment sector has good short term solvency position.

____________________________ Gyandheep Volume 1 Issue 2 January 2014___________________________
37
7.2 Liquid Ratio The proportion of liquid assets to current liabilities is expressed in liquid ratio. Liquid asset are 1.93 to current liabilities 1.00. It indicates that liquidity position of Electrical Equipment sector is good throughout the fifteen years of the study period.
Table: 1
Solvency and Profitability ratio of Selected Electrical Equipment Companies
S.No Company Name
Summary Statistics CR LR DE NPR
% ROA %
RON %
1 ABB Ltd
Mean 1.47 1.33 0.38 6.61 8.10 18.07 SD 0.13 0.09 0.55 1.34 2.18 6.64 CV 11.3 14.7 0.69 4.93 3.72 2.72
2 Amara Raja Batt.
Mean 2.6 2.0 6.0 11.4 12.0 20.2 SD 0.5 0.4 8.3 8.0 8.0 14.5 CV 5.6 4.8 0.7 1.5 1.5 1.4
3 BHEL
Mean 2.36 1.42 10.34 4.08 3.39 7.83 SD 0.83 0.49 7.36 4.0 3.52 7.9 CV 2.83 2.9 1.4 1.01 0.96 0.99
4 Bajaj Electrical
Mean 1.78 1.34 11.81 2.09 3.64 11.53 SD 0.17 0.11 5.36 1.97 3.36 16.45 CV 10.59 11.7 2.2 1.06 1.08 0.88
5 Bharat bijilee
Mean 1.63 1.13 4.63 4.67 7.03 18.4 SD 0.21 0.17 1.55 5.4 8.18 21.52 CV 7.59 6.68 2.98 0.86 0.85 0.85
6 Cromptons greaves
Mean 1.68 1.31 7.31 2.91 5.18 11.7 SD 0.36 0.22 4.55 4.87 6.99 19.84 CV 4.56 5.87 1.6 0.59 0.74 0.58
7 EMCO
Mean 2.74 2.06 17.81 4.68 3.96 9.95 SD 0.48 0.33 7.93 3.00 2.98 5.68 CV 5.67 6.26 2.24 1.55 1.32 1.74
8 Finolex cables
Mean 6.39 5.14 7.31 9.06 6.72 8.28 SD 2.72 2.63 2.86 5.95 5.24 5.91 CV 2.34 1.96 2.55 1.52 1.28 1.39
9 Havells India
Mean 2.59 1.64 7.88 5.41 9.06 22.81 SD 0.96 0.79 7.94 1.55 4.35 9.01 CV 2.69 2.06 0.99 3.48 2.08 2.53
10 Overall Mean 2.58 1.93 8.16 5.65 6.56 14.30 SD 1.57 1.24 4.87 2.96 2.86 5.58 CV 1.71 1.55 1.67 1.9 2.29 2.56
Complied and computed from CMIE database

____________________________ Gyandheep Volume 1 Issue 2 January 2014___________________________
38
7.3 Debt-Equity Ratio The relationship between outsiders fund and internal funds is an aid to determine the long term solvency position. Outsiders fund is more (8.16) than internal funds. It is indicated that long term solvency position is in the danger zone with regards to Electrical Equipment sector. 7.4 Net Profit Ratio The percentage of net profit after interest and tax to net sales is expressed in net profit ratio. The overall net profit is less (8.16%) in Electrical Equipment sector. It clearly exhibits that majority of the profit is absorbed by interest to outsiders. Profitability position is not so good in Electrical Equipment sector. 7.5 Return on Assets The relationship between return and total assets is expressed in percentage. The ratio indicates that the Electrical Equipment sector revived a return of 6.56% from total assets. The value though not promising ensures a return of 25 % from the total assets in the upcoming years. 7.6 Return on Net Worth The percentage of return to net worth is an important indicator of profitability position. The return from net worth is 14.30% which is not a good figure. The figure indicates that this sector will face difficulties in raising share capital in future.
Chart 1 Chart 2 Chart Showing Solvency position of Electrical
Equpiment Chart Showing Profitability position of Electrical
Equipment
Table: 2 Correlation analysis of Electrical Equpiment
Ratios CR LR DE NPR ROA RON CR 1.00 LR 0.99 1.00 DE 0.13 0.07 1.00 NPR 0.52 0.55 - 0.37 1.00 ROA 0.07 0.10 - 0.61 0.79 1.00 RON - 0.38 - 0.38 - 0.54 0.32 0.81 1.00
Correlation analysis at 0.01 level of significance
MEAN sd cv
Solvency CR
Solvency LR
Solvency DE MEAN sd cv
Profitability NPR
Profitability ROA
Profitability RON

____________________________ Gyandheep Volume 1 Issue 2 January 2014___________________________
39
Table 2 reveals that there is a very high correlation between current ratio and liquid ratio at one percentage level of significance. There is a negative correlation between debt-equity ratio with net profit, return on asset and return on net worth ratio. 8. SUGGESTIONS
Electrical Equipment industries should take necessary steps to reduce its debt. The profitability position should be improved by increasing sales. Proper power generation in India will boost up the indusrial growth to a better platform.
9. CONCLUSION Present world scenario indicates that a country will become a developing one, only if it satisifies the infrastructure demands of the people.Electricity plays a vital role in infrastructure development. The government should take necessary steps to generate power thereby giving a boost to electrical equipment industry. REFERENCE
1. SudershanKuntluru and Mohd. Akbar Alikhan., “Financing Pattern of Foreign and Domestic Owned Pharmaceutical Companies in India,” The Management Accountant, Vol.44, No.12, December 2009, pp.984-987.
2. P.Jayasubramanian, “A study on the financial performance of selected Pharmaceutical companies in India”, April 2010.
3. S.Maheswari, “Financial Performance of paper industry in India”, April 2010. 4. Rajendran R. and Natarajan B., “A study on Solvency Position of LIC of India”, Southern Economist, Vol.48,
No.19, February 1, 2010, pp.33-37. 5. C.Vadivel,”A study on the financial and operating performance of selected Indian Industries in the liberalized
economic environment.”October 2010. 6. Sharma Corporate Financial structure – Print well Publishers, Jaipur (India) 1988. 7. Sharma,R.K andGupta,S.K., Management Accounting: Principles and Practice, KalyaniPublishers, Ludhiana,
p.150, 1986. 8. Sharma, R.K and ShashiK.Gupta “Financial Management “- KalyanPblishers –Ludhiana, New Delhi, Noida (U.P)
Hyderabad, Madras, Calcutta, Cuttack- Reprinted 1993. 9. Sivayya, K. V and V.B.M. Das; Indian Industrial Economy; S.Chand and Company Ltd., New Delhi, 11th Edition,
pp.403-405, 2001. 10. www.indiainfoline.com 11. www.search.ebscohost.com 12. www.proquest.umi.com 13. www.bseindia.com

____________________________ Gyandheep Volume 1 Issue 2 January 2014___________________________
40
E-INSURANCE: POLICYHOLDERS ACCEPTANCE AND PROBLEMS
Dr.S.Sudalaimuthu,1* Mr.B.Angamuthu**
ABSTRACT After liberalization Information Technology (IT) plays a vital role in all areas including E-Insurance. It helps to access information about insurance products 24x7, payment of premium etc. The success of E-Insurance depends on the policyholders’ acceptance and awareness. The aim of this research is to study the factors that influence the acceptance of E-Insurance by the policyholders, The Problems associated with E-Insurance and the benefits of E-Insurance are also studied in this paper. The data for research was collected from 150 policy holders through a structured questionnaire. The study attempts to put light on the different features of E-Insurance schemes which will prove to be a breakthrough technology for the insurance industry in India. Keywords: E-Insurance, Information Technology, Acceptance, E-commerce,
1. INTRODUCTION AND EXECUTION OF THE STUDY 1.1 Introduction Adoption of Information Communication Technology (ICT) in the Insurance Industry is expected to witness a dynamic growth in the ensuing years. Currently, the adoption of ICT in insurance industry has undergone dynamic growth owing to the increasing customer base. Today various insurance companies are providing Electronic based insurance (E-Insurance) facilities to their clients. They can check the balance premium, maturity date, dues and outstanding premium of their policies. They provide new information regarding the new insurance products available in the market. Electronic commerce is quickly emerging as a incarnation of globalization. At this stage, it is still too early to say whether electronic commerce will narrow or broaden the gap between the rich and the poor. However, it is safe to say that the rapid expansion of electronic transactions constitutes an unprecedented opportunity for trade and development: Now, insurance companies will reach new levels of international competitiveness and participate more actively in the emerging global information economy. Insurance companies are considered to be quite conservative in applying new ICTs. Insurers are considered to be conservative in general. Still, they have invested enormous sums in internet activities. In e-commerce, the standard subjects are information, demand assessment and calculation, proposal preparation and online contract conclusion, online notification of claims, address changes, partial access to customer and contract data as well as increasing intranet distribution in companies. The latter is, by the way, a promising approach in B2C (Business-to-Consumer). Internal e-business projects are mainly based on customer relationship management and systems for managing contract portfolios. 1.2 Top ten Insurance Companies in India The following are the top 10 insurance companies in India, 2012 Life Insurance Corporation in India (LIC) Bajaj Allianz General Insurance ICICI Prudential Life Insurance SBI Life Insurance Birla Sun life Insurance TATA AIG General Insurance
* Reader, Department of Banking Technology, School of Management, Pondicherry University, Puducherry-605014,
India. E-mail:[email protected] ** Faculty, Department of Commerce and Management, Karpagam University, Coimbatore – 641 021, Tamil Nadu,
India.E-mail:[email protected]

____________________________ Gyandheep Volume 1 Issue 2 January 2014___________________________
41
Max Newyork Life reliance Life Insurance Oriental Insurance Company HDFC Standard Life Insurance 1.3 Statement of the Problem In recent years, technology has become an increasingly familiar element, which has brought sweeping changes in the industrial structure and the competitive environment. The emerging technological developments in microelectronics and telecommunications combined with intense competition have changed every aspect of insurance and redefined the world financial system. In the light of the sweeping changes that has taken place in insurance services and innovative product services, it is appropriately though to evaluate the role of IT and also to make a comparison between public insurance and private insurance company. The insurance industry renders many services to the policyholders and general public. But, it can be found that all services do not reach the customer in a proper manner because of some practical difficulties like customer privacy, requirement for digital signatures which are fail-safe, sharing databases of customers etc. E-Insurance ensures quick service like low transaction cost to the policyholders, reducing occupation stress among the employees, accessibility of insurance information 24X7, v i s u a l i z a t i o n o f i n f o r ma t i o n , adding useful links to the websites and live chat technologies etc. This study will enable the customer to have a clear idea about the introduction of innovative IT and enhancing the acceptance among the policyholders related to E-Insurance. The E-Insurance applications in insurance sector pose various questions to the researchers and the researchers are in the process of exploring answers to these questions.
What are the factors that influence the acceptance of E-Insurance? What are the problems and benefits associated in E-insurance?
1.4 Objectives of the study
1. To find out the factors influencing the acceptance of E-Insurance by policy holders 2. To study the problems faced by policyholders under E-Insurance schemes 3. To study the benefits associated with E-Insurance technologies
2. RESEARCH METHODOLOGY 2.1 Data and Sources The study is based on both primary and secondary data. The Primary data is collected from the policyholders through a structured questionnaire. The questionnaire helps to understand the policy holder’s perception towards the acceptance of E-Insurance technologies. Further, theoretical inputs of the study were contributed by books, journals and various websites. 2.2 Questionnaire The questionnaire is divided into three parts. The first part of the questionnaire contains questions relating to demographic profile of the respondents 16 items are considered in the second part which highlights the acceptance of attributes of the respondents. A 5-Point likert scale has been used to measure the perception in this regard. Ranking method is used to rank the problems and benefits under study. 2.3 Sampling Area and Framework The structured questionnaire designed was used to collect the data from 200 respondents in Coimbatore city of which 50 respondents failed to give unbiased responses, thereby making a total of 150 samples for the final study. All the samples were selected on the basis of judgment sampling method and the period of study was between March and July 2012. 2.4 Application of Statistical Tools Various statistical tools namely percentage analysis, Kendall's coefficient of concordance and factor analysis were used for analyzing the objectives. The Bartlett’s Test of Sphercity was used for factor analysis as the asymptotic significant value of χ2 comes out lesser than the one percent level of significant.

____________________________ Gyandheep Volume 1 Issue 2 January 2014___________________________
42
3. ANALYSIS AND DISCUSSIONS The discussions are presented below using SPSS 13 a software package. 3.1 Personal factors of the Policyholders The classification of the policyholders based on their gender, age group, education, occupation and income is given in the table below
Table - 1: Personal Factors of the Policyholders Variable Character No. of Policyholders Percent Gender Male 84 56
Female 66 44
Age group (In Years) 20-30 years 64 43 30-40 years 58 39 40-50 years 21 14 Above 50 years 7 5
Education Below SSLC 5 3 HSC 36 24 Degree (UG) 64 43 Postgraduate 45 30
Occupation Professional 39 26 Business 63 42 Employee 48 32
Income (Rs. Per month) Upto Rs 10,000 44 29 Rs 10,001- Rs 20,000 59 39 Rs 20,001- Rs 30,000 28 19 Above Rs 30,000 19 13
Source: Primary data
Table - 1 shows that majorities (56%) of the policyholders are male and 44% of the policyholders are female. About 43% of the policyholders are under the young age group (20-30 years), Most (43%) of the policyholders have completed degree (UG) level education. Majority (42%) of the policyholders have their own business and 39% of the policyholders earns a monthly income between Rs.10,001-20,000.
3.2 Influencing factors on Acceptance of E-Insurance by the Policyholders The general purpose of factor analysis is to find out a method of summarizing the information contained in a number of original variables into a smaller set of new composite dimensions (factors) with minimum loss of information. Factor analysis identifies and defines the underlying dimensions (factors) that exist in the original variables selected for the study. Using the Principle Component Analysis, five factors have been extracted based on the variance (Eigen value greater than 1 for considered). Since the idea of factor analysis is to identify the factors that meaningfully summarize the set of closely related variables, the rotation phase of the factor analysis attempts to transfer initial matrix into one that is easier to interpret. Varimax rotation method is used to extract meaningful factors, communalities are also used. Finally, factor analysis presents the following results.
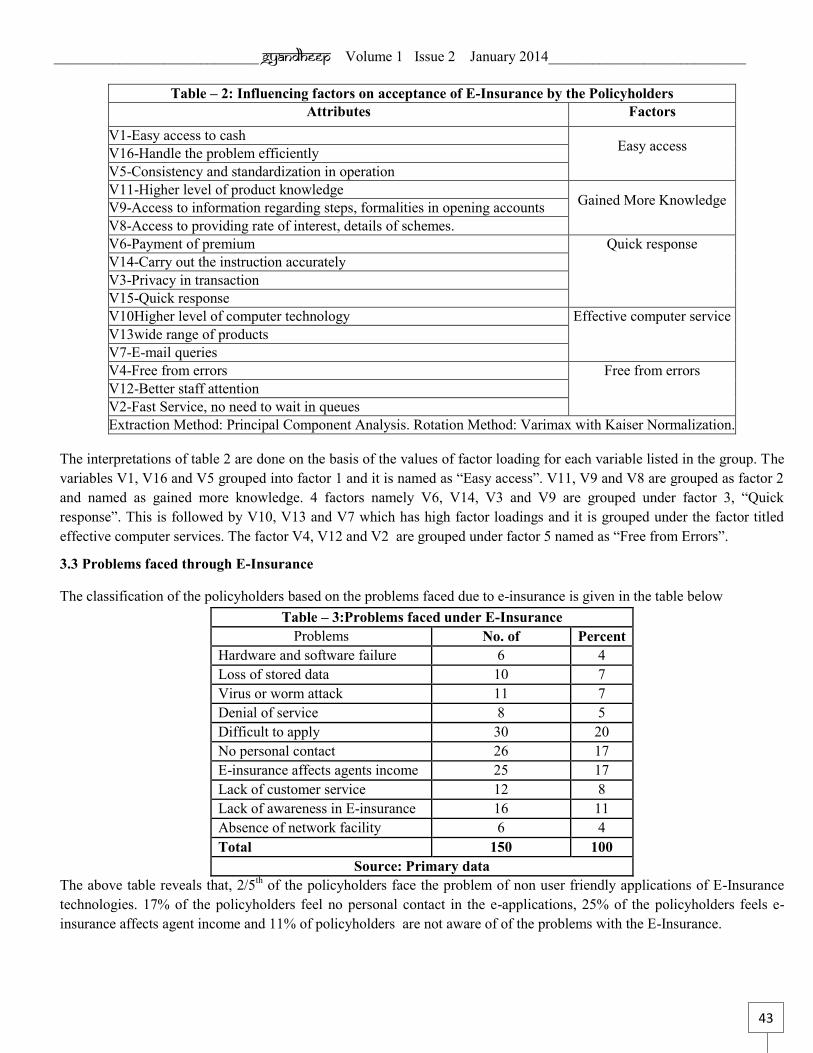
____________________________ Gyandheep Volume 1 Issue 2 January 2014___________________________
43
Table – 2: Influencing factors on acceptance of E-Insurance by the Policyholders Attributes Factors
V1-Easy access to cash Easy access V16-Handle the problem efficiently
V5-Consistency and standardization in operation V11-Higher level of product knowledge
Gained More Knowledge V9-Access to information regarding steps, formalities in opening accounts V8-Access to providing rate of interest, details of schemes. V6-Payment of premium Quick response
V14-Carry out the instruction accurately V3-Privacy in transaction V15-Quick response V10Higher level of computer technology Effective computer service
V13wide range of products V7-E-mail queries V4-Free from errors Free from errors
V12-Better staff attention V2-Fast Service, no need to wait in queues Extraction Method: Principal Component Analysis. Rotation Method: Varimax with Kaiser Normalization.
The interpretations of table 2 are done on the basis of the values of factor loading for each variable listed in the group. The variables V1, V16 and V5 grouped into factor 1 and it is named as “Easy access”. V11, V9 and V8 are grouped as factor 2 and named as gained more knowledge. 4 factors namely V6, V14, V3 and V9 are grouped under factor 3, “Quick response”. This is followed by V10, V13 and V7 which has high factor loadings and it is grouped under the factor titled effective computer services. The factor V4, V12 and V2 are grouped under factor 5 named as “Free from Errors”.
3.3 Problems faced through E-Insurance
The classification of the policyholders based on the problems faced due to e-insurance is given in the table below Table – 3:Problems faced under E-Insurance
Problems No. of Policyholders
Percent Hardware and software failure 6 4 Loss of stored data 10 7 Virus or worm attack 11 7 Denial of service 8 5 Difficult to apply 30 20 No personal contact 26 17 E-insurance affects agents income 25 17 Lack of customer service 12 8 Lack of awareness in E-insurance 16 11 Absence of network facility 6 4 Total 150 100
Source: Primary data The above table reveals that, 2/5th of the policyholders face the problem of non user friendly applications of E-Insurance technologies. 17% of the policyholders feel no personal contact in the e-applications, 25% of the policyholders feels e-insurance affects agent income and 11% of policyholders are not aware of of the problems with the E-Insurance.

____________________________ Gyandheep Volume 1 Issue 2 January 2014___________________________
44
3.4 Policyholders Benefits under E-Insurance Table 4 & 5 shows the Kendall’s Mean rank and test statistics towards the benefit of e-insurance.
Table – 4: Kendall’s Mean Rank on the benefits of E-insurance Factors Mean Rank
Information collected is better and cheaper 3.85 Speed of response 3.58 provide new ways of doing business in competitive market 8.10 Global accessibility 6.25 Increased sales without additional force 6.21 Regular updates on the policy status 5.88 Direct debit/Electronic payment of premiums 8.25 Electronic submission of insurance proposal form 8.27 Avoid postage and courier expenses 7.24 Provide 24 hours service 5.92 Real time knowledge through data base building 6.69 Immediate premium collection and funds transfer 7.76
Source: Primary data
From the Table - 4 it is clear that speed of response is ranked 1 (3.58), Information collected is better and cheaper is ranked 2 (3.85), regular updates of policy status is ranked 3 (5.88), provide 24 hours service is ranked 4 (5.92), increased sales without additional sales force is ranked 5 (6.21), global accessibility is ranked as 6 (6.25), real time knowledge through data base building is ranked as 7(6.69), avoid postage and courier expenses is ranked as 8 (7.24),immediate premium collection and funds transfer is ranked as 9 (7.76), provide new ways of doing business in competitive market is ranked as 10 (8.10), direct debit/electronic payment of premiums is ranked as 11 (8.25) and electronic submission of insurance proposal form is ranked as 12(8.27) with regard to the benefit of E-Insurance. 3.5 Relationship of Mean Rank towards Benefits of E-Insurance Kendall's W is a non-parametric statistic, also known as Kendall's coefficient of concordance. It is used to assess the priority of the policyholders on certain aspects. The policyholders were asked to rank their priorities and based on their opinion the Mean rank was calculated through Kendall’s W test with testing of following hypothesis.
Ho: “There is no significant difference between Mean Rank on the benefit of E-Insurance.”
Ho1: “There is a significant difference between Mean Rank on the benefit of E-Insurance.”
Table – 5: Kendall’s test Statistics Kendall's W .191 Chi-Square 315.628 df 11 Asymp. Sig. .000
It is inferred from the Table - 5 that Asymptotic significant value of χ2 is less than the 5% level of significance. Therefore Ho is rejected and Ho1 is accepted. It is concluded that there is a significant difference between the Mean Rank on the benefits of E-Insurance.

____________________________ Gyandheep Volume 1 Issue 2 January 2014___________________________
45
4. CONCLUSION From this research it can be concluded that easy access of insurance related information, gained more knowledge
through online, quick response from insurance company, effective computer service and free from errors are the major factor influencing the acceptance of E-Insurance by the policyholders. Further, it is found that the policy holders find it difficult to fill the e-forms for the various products provided by the companies. If necessary steps are taken in this regard then E-Insurance applications will be a great success in the present scenario.
REFERENCES 1. Ajit Ranade and Rajeev Abuja (1999), Life insurance in India emerging issues Economic and Political Weekly,
p. 16-23. 2. Byrd., T.A., and Marshall., T.E., (1997), Relating information technology investment to organizational
performance: A causal model analysis. Omega-International Journal of Management Science, Volume 25, No.1, p 43-56.
3. Dhrubarabjan Dandapat (1995), Performance of LIC of India – an overview, Southern Economist, Volume 33, Mar 1, p17.
4. Francalanci. C., and Galal. H., (1998), Information technology and worker composition: Determinants of productivity in the life insurance industry. MIS Quarterly, Volume 22, Number 2, p 227-241..
5. Gopalkrishnan. G., (1994), Insurance: Principles and Practice, Sterling Publishers, New Delhi. 6. Gupta., P.K., (2005), Insurance and Risk Management, Himalaya Publishing House, Mumbai. 7. Harrington Niehaus. (2006), Risk Management and Insurance, Tata McGraw Hill Edition, New Delhi. 8. Mishra, M.N., (2001), Insurance-principles and practices, S Chand & Co, Ltd., New Delhi. 9. Mittal R.k & Anil Chandhok (2002), Privatization of life insurance sector in India – impact and perspective
Indian journal of marketing, Volume .XXXII, Issue.11, p 5-7. 10. Rajan Das & Raveendra., C., (2004), Strategic choices in life insurance business Strategic Marketing, Jan-Feb,
Volume-III, p13 – 15. 11. Ramakrishna Reddy and Raghunadha Reddy., A., (2000), Life insurance corporation of India: Need for new
lessons, Journal of Management & Research, Vol. 4, No. 2, p 206-214. 12. Sudarsana Reddy., G., Customer Perception Towards Private Life Insurance Companies, Journal of Marketing,
Volume xxxv, Number 4. 13. E-insurance will start soon: IRDA chief, http://www.thehindu.com/business/Industry/article3735081.ece, Retrieved
on August 07, 2012. 14. E-insurance in India, http://business.mapsofindia.com/articles/e-insurance-in-india-policy-and-procedures.html 15. E-insurance likely by June, http://www.business-standard.com/india/news/e-insurance-likely-by-june/472602/,
retrieved April 26, 2012. 16. ICT in Insurance Industry in India 2012, http://www.marketresearch.com/Netscribes-India-Pvt-Ltd-v3676/ICT-
Insurance-India-6842230/, Retrieved February 20, 2012. 17. Top 10 Insurance Companies in India 2012, http://www.onsecrethunt.com/2012/06/top-10-insurance-companies-
in-india-2012.html,

____________________________ Gyandheep Volume 1 Issue 2 January 2014___________________________
46
A STUDY ON CUSTOMER SATISFACTION TOWARDS AMWAY PRODUCTS WITH REFERENCE TO COIMBATORE CITY
Dr.M.Vanishree*, Dr.L.Shanthi**
ABSTRACT Getting rich through the easiest possible way is the modern mantra of a common man and this might be the reason why MLM has come into existence. MLM has been existential for more than 50 years (Carmichael, 1995). The multi-level marketing system is important in Amway's business plan. Amway has already given a helping hand to over 3 million people to start on their business. The objective of this paper is to study the level of satisfaction of customers towards Amway products and also to analyze the problems faced by them. The sample size chosen for the study is 130. Tools like simple percentage and ANOVA are used for the analysis. Results are discussed based on the analysis of the study.
1. INTRODUCTION The term “multi level marketing”, defined by many researchers such as MLM or network marketing, means selling products or services via a trading plan which works on more than one level. Another explanation, MLM companies do not sell products through a normal distribution scheme or retail stores but they sell through individual persons, friends, colleagues and even strangers, who in turn receive commission when they make sales in the next level of marketing. The research has also suggested that MLM is a marketing activity where a company has to sell products through irregular distribution channel. To describe - the functioning of MLM, the company distributes products and services through independent salespeople who take up the responsibility of selling products to other people, and also recruiting new members (as known as down-lines). These salespersons will get commission paid by sales made by their down-lines.
2. ABOUT AMWAY It was just about 16 years ago when Amway, a well established American household product producer, started its multi level marketing in Taiwan. The Amway/Amway Global, a subsidiary of Alticor, is marketing nutritional supplements, skin and personal care products, air and water purifiers and a line of home cleaning products. The products are sold through Independent Business Owners (IBO). The most effective strategy for this is direct marketing or attraction marketing. Amway has helped the common man to successfully tap the unlimited potential which is available in the modern competitive market.
2.1 Amway in India Amway promotes individual entrepreneurship through its innovative direct selling approach to world class consumer products. Amway India is the country’s leading direct selling FMCG-company which manufactures and sells world-class consumer products. Amway Guarantees 100% money back for all its products, thereby by providing stimulus to the local manufacturing industries. Amway sources all its products from within India, thereby providing stimulus to the local manufacturing industry. Amway India is a wholly owned subsidiary of US based Amway Corporation, Ada, Michigan, USA. Established in 1995, Amway India commenced its commercial operations in May 1998 and has emerged as the largest Direct Selling FMCG Company. The Company is headquartered at the National Capital Region of India - New Delhi. The company has invested around 35 million US $ (Rs. 151 crore) in India of which Rs.26 crore were pumped in the form of direct foreign investment. It is found that Amway India has 400 full time employees and has generated indirect employment for 1,650 persons through contract manufacturing assignments. The Company has provided income
* Assistant Professor, Department of International Business, Sree Narayana Guru College, K.G.Chavadi, Coimbatore -
641 105. E-Mail: [email protected], Mobile: 9944425608. ** Head, Department of Business Administration with CA, Sree Narayana Guru College, K.G.Chavadi, Coimbaore -
641 105 E-Mail: [email protected], Mobile: 9894654252.

____________________________ Gyandheep Volume 1 Issue 2 January 2014___________________________
47
generating opportunity to over 4, 50,000 active independent Amway Business Owners. Amway India provides free and unlimited training to all its distributors to help them grow their business. The company conducts 29,000 training sessions in a year which is participated by over 1.5 million Business Owners and prospects. Amway India is a member of the Indian Direct Selling Association (IDSA). The IDSA is an industry regulatory body, with several reputed international and Indian Direct Selling companies as they are members. Amway India is also a member of the Confederation of Indian Industries (CII) and Federation of Indian Chambers of Commerce (FICCI). In ten years of commercial operation, Amway India has established a nation-wide presence in over 125 offices and 55 city warehouses and four regional mother warehouses. The distribution and home delivery network set up with the support of independent logistics partners is spread across 3,000 locations.
3. STATEMENT OF THE PROBLEM Amway promotes individual entrepreneurship through its innovative direct selling approach of world class consumer products. Amway India is the country’s leading direct selling FMCG-company which manufactures and sells world-class consumer products. Hence the researcher has made an attempt to understand the demographic profile of Amway customers which determine a very important role in determining the success of the company.
4. OBJECTIVE OF THE STUDY 1. To study the level of satisfaction of customers towards Amway products. 2. To analyze the problems faced by customers and suggest suitable remedial measures.
3. RESEARCH METHODOLOGY 3.1 Area of The Study Area of the study is confined to Coimbatore city.
3.2 Sample Design The type of sampling, chosen is convenience sampling. 3.3. Sample Size For the purpose of analysis the researcher has chosen sample size of 130.
3.4 Tools Tools that are to be used for analysis are:-
1. Simple percentage analysis to study the personal details of the respondents. 2. Analysis of variance (ANOVA) to study the satisfaction level of the respondents.
3.5 Limitations of The Study The study was mainly based on the primary data. Therefore, the validity of the data depends on the responses given by the respondents. The study is confined to respondents in Coimbatore. Therefore, the results cannot be generalized.
4. DATA ANALYSIS: 4.1 Personal background of the respondents The above table reveals that, most of the respondents selected for the study are females within the age group 25 to 40 possessing collegiate education. The respondents are mainly employed people with monthly income level of more than 20,000.
ANOVA- This test helps to identify the satisfaction of the respondents with regards to various factors namely price, quality, availability, brand image, durability and so on.
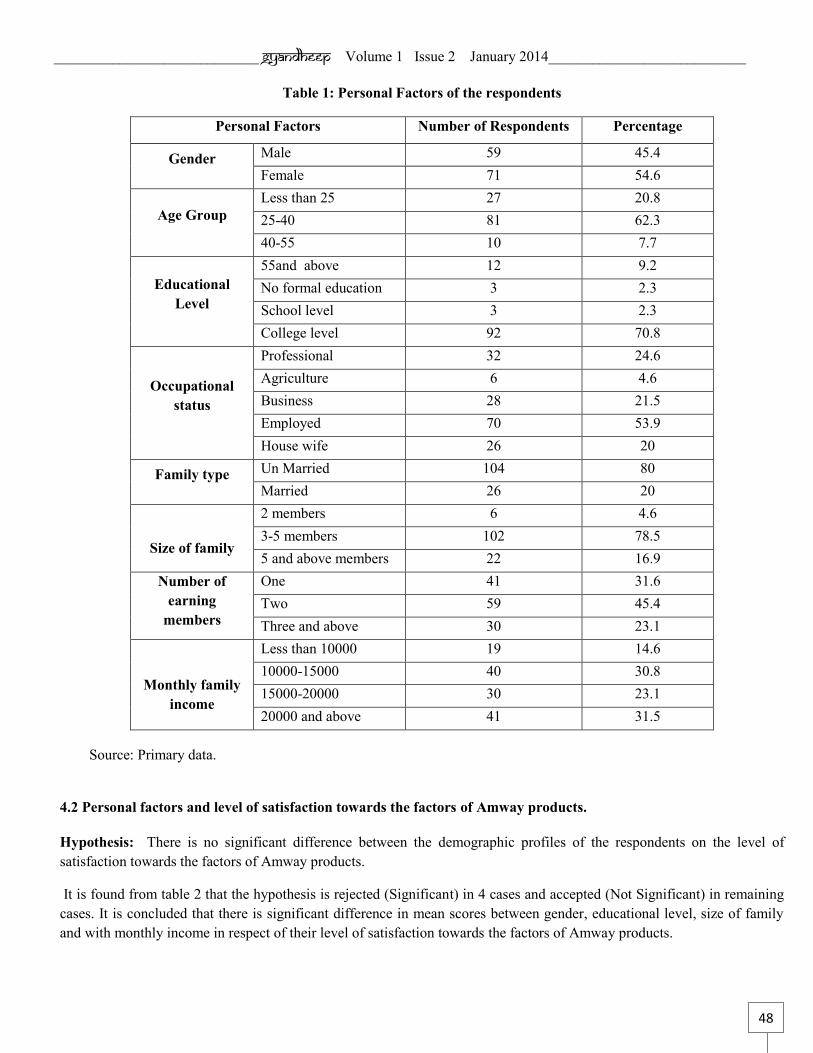
____________________________ Gyandheep Volume 1 Issue 2 January 2014___________________________
48
Table 1: Personal Factors of the respondents
Personal Factors Number of Respondents Percentage
Gender Male 59 45.4 Female 71 54.6
Age Group Less than 25 27 20.8 25-40 81 62.3 40-55 10 7.7
Educational Level
55and above 12 9.2 No formal education 3 2.3 School level 3 2.3 College level 92 70.8
Occupational status
Professional qualification
32 24.6 Agriculture 6 4.6 Business 28 21.5 Employed 70 53.9 House wife 26 20
Family type Un Married 104 80 Married 26 20
Size of family
2 members 6 4.6 3-5 members 102 78.5 5 and above members 22 16.9
Number of earning
members
One 41 31.6 Two 59 45.4 Three and above 30 23.1
Monthly family income
Less than 10000 19 14.6 10000-15000 40 30.8 15000-20000 30 23.1 20000 and above 41 31.5
Source: Primary data.
4.2 Personal factors and level of satisfaction towards the factors of Amway products.
Hypothesis: There is no significant difference between the demographic profiles of the respondents on the level of satisfaction towards the factors of Amway products.
It is found from table 2 that the hypothesis is rejected (Significant) in 4 cases and accepted (Not Significant) in remaining cases. It is concluded that there is significant difference in mean scores between gender, educational level, size of family and with monthly income in respect of their level of satisfaction towards the factors of Amway products.

____________________________ Gyandheep Volume 1 Issue 2 January 2014___________________________
49
Table 2: Results of ANOVA personal factors and level of satisfaction towards the factors of Amway products
Personal factors Source of variation
Degree of freedom
Sum of squares
Mean sum of squares
f values
p values
Significant/Not significant
Gender Between Groups 19 8.543 0.450
2.089 0.009 S With Groups 110 23.680 0.215 Total 129 32.223
Age group
(in yrs)
Between Groups 19 19.929 1.049 0.680 0.831 NS With Groups 110 169.648 1.542
Total 129 189.577
Educational level Between Groups 19 16.161 0.851
3.182 0.000 S With Groups 110 29.408 0.256 Total 129 45.569
Occupational level
Between Groups 19 36.217 1.906 1.015 0.451 NS With Groups 110 206.675 1.879
Total 129 242.892
Marital status
Between Groups 19 5.634 0.297 1.887 0.22 NS With Groups 110 17.289 0.157
Total 129 22.923
Type of family
Between Groups 19 5.15. 0.218 1.495 0.101 NS With Groups 110 16.073 0.146
Total 129 20.223
Size of family
Between Groups 19 7.052 0.371 2.151 0.007 S With Groups 110 18.979 0.173
Total 129 26.031
Number of earning members
Between Groups 19 11.421 0.601 1.065 0.397 NS With Groups 110 62.087 0.564
Total 129 73.508
Monthly family income
Between Groups 19 38.575 2.030 2.070 0.010
S With Groups 110 107.894 0.981
Total 129 146.469
Note:-S- Significant (p value≤0.05): Ns-Not significant (p value˃0.05)
4.3 Personal factors and level of satisfaction towards the services offered in marketing Amway products. The factors considered are presentation, delivery services, promptness and courteous and so on.
Hypothesis: There is no significant difference between the personal classification of the respondents and their level of satisfaction towards Amway products. It is found from table 3 that the hypothesis is rejected (Significant) in 2 cases and accepted (Not Significant) in remaining cases. It is concluded that there is significant difference in mean scores between gender and marital status in respect of their level of satisfaction towards the factors of Amway products.

____________________________ Gyandheep Volume 1 Issue 2 January 2014___________________________
50
Table 3: Results of ANOVA personal factors and level of satisfaction towards services offered in marketing Amway products.
Personal factors
Source of variation
Degree of freedom
Sum of squares
Mean sum of squares
f values p values
Significant/Not significant
Gender Between Groups 18 12.377 0.688
3.846 0.000 S With Groups 111 19.846 0.179 Total 129 32.223
Age group (in yrs)
Between Groups 18 21.556 1.198 0.791 0.707 NS With Groups 111 168.021 1.514
Total 129 189.577
Educational level
Between Groups 18 5.538 0.308 0.853 0.635 NS With Groups 111 40.031 0.361
Total 129 45.569
Occupational level
Between Groups 18 46.620 2.590 1.465 0.117 NS With Groups 111 196.273 1.768
Total 129 242.892
Marital status
Between Groups 18 6.712 0.373 2.553 0.001
S With Groups 111 16.211 0.146 Total 129 22.923
Type of family
Between Groups 18 2.656 0.148 0.932 0.542
NS
With Groups 111 17.567 0.158 Total 129 20.223
Size of family
Between Groups 18 3.071 0.171 0.825 0.668
NS With Groups 111 22.960 0.207 Total 129 26.031
Number of earning
members
Between Groups 18 8.989 0.499 0.859 0.628
NS With Groups 111 64.518 0.581 Total 129 73.508
Monthly family income
Between Groups 18 27.965 1.554 1.455 0.121
NS With Groups 111 118.504 1.068 Total 129 146.469
Note:-S- Significant (p value≤0.05): Ns-Not significant (p value˃0.05)
4.4 Personal factors and level of satisfaction on the ways of convincing the customer of Amway distributors. The factors considered are demonstration, explanation about use of the products, attractive offers and so on.
Hypothesis: There is no significant difference between the demographic profile of the respondents and their level of satisfaction on various ways of convincing the customer of Amway distributors.
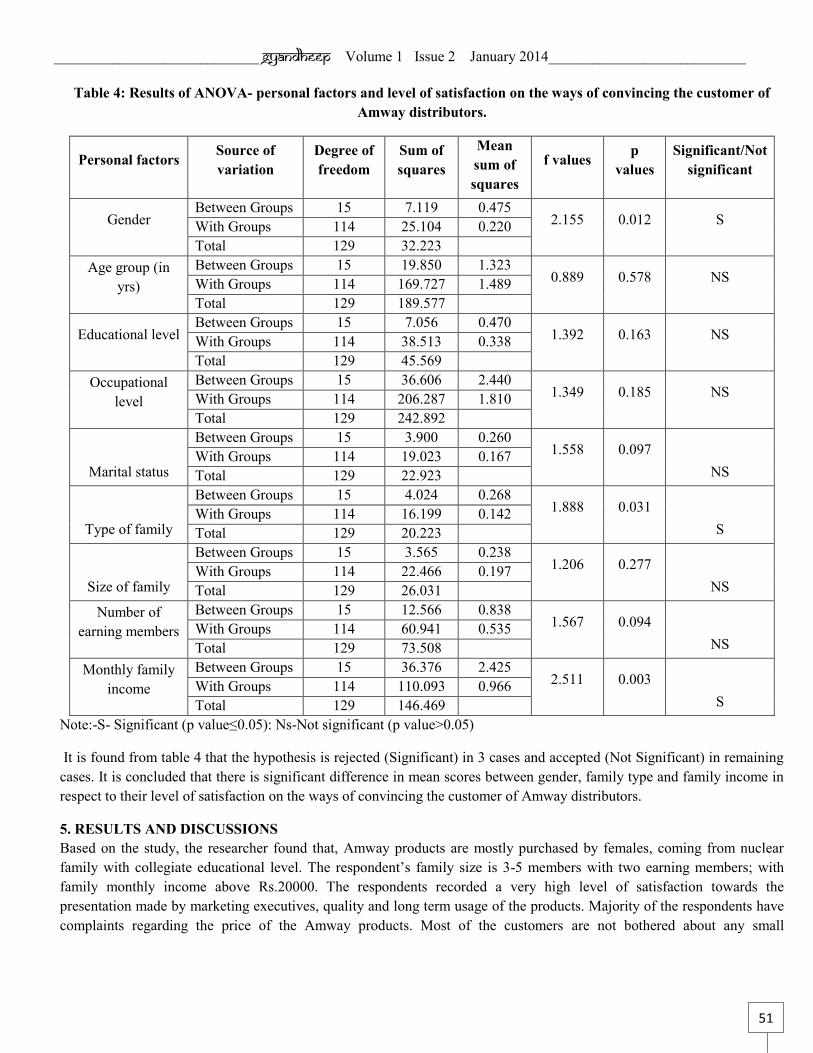
____________________________ Gyandheep Volume 1 Issue 2 January 2014___________________________
51
Table 4: Results of ANOVA- personal factors and level of satisfaction on the ways of convincing the customer of Amway distributors.
Personal factors Source of variation
Degree of freedom
Sum of squares
Mean sum of squares
f values p values
Significant/Not significant
Gender Between Groups 15 7.119 0.475
2.155 0.012 S With Groups 114 25.104 0.220 Total 129 32.223
Age group (in yrs)
Between Groups 15 19.850 1.323 0.889 0.578 NS With Groups 114 169.727 1.489
Total 129 189.577
Educational level Between Groups 15 7.056 0.470
1.392 0.163 NS With Groups 114 38.513 0.338 Total 129 45.569
Occupational level
Between Groups 15 36.606 2.440 1.349 0.185 NS With Groups 114 206.287 1.810
Total 129 242.892
Marital status
Between Groups 15 3.900 0.260 1.558 0.097
NS With Groups 114 19.023 0.167 Total 129 22.923
Type of family
Between Groups 15 4.024 0.268 1.888 0.031
S With Groups 114 16.199 0.142 Total 129 20.223
Size of family
Between Groups 15 3.565 0.238 1.206 0.277
NS With Groups 114 22.466 0.197 Total 129 26.031
Number of earning members
Between Groups 15 12.566 0.838 1.567 0.094
NS With Groups 114 60.941 0.535 Total 129 73.508
Monthly family income
Between Groups 15 36.376 2.425 2.511 0.003
S With Groups 114 110.093 0.966 Total 129 146.469
Note:-S- Significant (p value≤0.05): Ns-Not significant (p value˃0.05)
It is found from table 4 that the hypothesis is rejected (Significant) in 3 cases and accepted (Not Significant) in remaining cases. It is concluded that there is significant difference in mean scores between gender, family type and family income in respect to their level of satisfaction on the ways of convincing the customer of Amway distributors.
5. RESULTS AND DISCUSSIONS Based on the study, the researcher found that, Amway products are mostly purchased by females, coming from nuclear family with collegiate educational level. The respondent’s family size is 3-5 members with two earning members; with family monthly income above Rs.20000. The respondents recorded a very high level of satisfaction towards the presentation made by marketing executives, quality and long term usage of the products. Majority of the respondents have complaints regarding the price of the Amway products. Most of the customers are not bothered about any small
____________________________ Gyandheep Volume 1 Issue 2 January 2014___________________________
52
inconvenience and recommends the Amway products to others. The ANOVAs test reveals that marital status, size of the family and their income level play a significant role in determining the satisfaction level.
Although the customers are satisfied with the products usage, quality, they feel that, the prices of the products are high. So the company can reduce the price, so that they can widen their customer base to the middle class segment.
6. CONCLUSION The success of business today depends upon the company's ability to quickly adapt to changes in the marketplace. The knowledge of dynamic networking market has helped them to modernize their business. The willingness to act spontaneously has helped the industry to have a sustained give birth to have a sustained existance.
REFERENCES 1. Alturas, Braulio Santos, Mariada Conceicao Pereira and Ivo (2005), “Determinants of Consumers’ Satisfaction and
Acceptance of Direct Selling”. 2. Subir Bandyopadhyay, Nittaya Wongtada and Gillian Rice (2011), "Measuring the impact of inter-attitudinal
conflict on consumer evaluations of foreign products", Journal of Consumer Marketing, Vol: 28, Iss: 3, pp: 211 - 224.
3. http://en.wikipedia.org/wiki/Administration 4. http://en.wikipedia.org/wiki/Amway 5. http://en.wikipedia.org/wiki/Business 6. http://www.amway.in/ 7. http://www.amway.in/Articles/Article.

____________________________ Gyandheep Volume 1 Issue 2 January 2014___________________________
53
FACTORS INFLUENCING CONSUMER SHOPPING BETWEEN STORES LOCATED IN MALL AND CENTRAL BUSINESS DISTRICT – A COMPARATIVE STUDY
Manikandan.M.K.M*
ABSTRACT Retailing in India is the happening sector. The Indian retail sector offers huge potential for development and job creation. Many new malls are coming up in various parts of the country and shopping at malls has become a family entertainment option. On that front this article tries to study the common factors that influences shoppers who shop in stores located in a mall and stores located in a central business district. The study was done at Coimbatore which has mall and well developed market place. The stores ‘Max’ and Big Bazaar were identified to carry out data collection at the mall and Big Bazaar was taken up for data collection from a central business district respectively. The responses were obtained with the help of a structured questionnaire covering the concepts of Store image, Price perception. A total of 15 items were used to study the customer perception about the store located in Mall and CBD on the aspect of store image and price perception in a 5 point scale. The statistical tool, factor analysis was carried out to screen the variables for further analysis. Key Words: Mall, Central Business Districts, Factor Analysis
1. INTRODUCTION Retailing in India happens through a vast number of unorganized retailers with over 12 million retails outlets spread across the country in various sizes and formats. India has the largest retail density with 9 stores available for every 1000 people. The Indian retail industry is providing 8% of the countries employment with its vast distribution of retail stores across the country.
2. BUSINESS MODELS IN RETAIL The business model followed by the retailer is generally called as “Format”. By way of classification of stores on location, one can classify store as Chain Store Format, High Street Format, Destination Format, and Convenience Format. The formats like Franchisee Model, Independent Retail stores are falling under the category of store format by Ownership.
2.1 Retail Locations Location plays an important role in the success of a retail store. Many consumers like to shop in stores closer to their habitat. Location decisions give strategic competitive advantage to retailers as competitors find it difficult to copy the strategy on this aspect. Also location strategy is very risky as the store invest considerable amount of resources in setting up of the store in that location. There are three types of locations that the retailers can choose from. Free Standing location, Central Business District and Shopping Centers. 2.1.1. Free Standing stores A free standing store can be defined as a store that depends on its own pulling power and promotion tactics to attract the customers. There are several advantages in this type of stores. There will be less competition, as customers visiting the stores come with the intention of purchasing products. Compared with planned locations, the rental is less and offer better visibility to the customers.
* Assistant Professor, KPR School of Business, Kollupalayam P.O, Arasur, Coimbatore 641 407. E-mail: [email protected] Mobile: 9025263188

____________________________ Gyandheep Volume 1 Issue 2 January 2014___________________________
54
2.1.2 Central Business District Central Business District (CBD) is the traditional business area in a city and it attracts many people and employees during the business hours and normally it a hub for public transportation and there is very high level of pedestrian traffic. The trade area associated with the Central Business district varies with the size of the city. Parking is very difficult in Central Business Districts (CBD) and the area lacks in planning. Due to heavy congestion on the streets consumers may not feel comfortable in shopping in these locations. 2.1.3 Shopping Centers A Shopping Center is a group of retail and other commercial establishment that is planned, owned and managed as a single property. Some of the formats are community Shopping Centers, Megamalls, Lifestyle Centers, and Neighborhood Shopping Centers etc. The stores in the planned shopping centers complement each other. Shopping centers attracted more customers as the center hosts more stores, hence customers can buy more varieties of products. Shopping Malls are one of the formats under the location Shopping Centers.
3. SCOPE OF THE RESEARCH Indian retail landscape is still developing. Many new malls have started to sprout in major cities and towns. But still leading retailers prefer to have their stores in central business district as it is easy to get more foot falls. The scope of the study is to get an understanding on the factors that are considered as important by consumers who go for shopping in these two locations. Each location of the retail store offers its specific advantage as mall offers the convenience of shopping and other related retail services like vast parking facility, convenience of choice, fully covered environment, option of entertainment etc. Store located in Central Business District (CBD) offers the benefit of convenience as it is easy to travel by using public transport and shopping can be clubbed with other activities.
4. OBJECTIVE OF THE STUDY 1. To find the major factors that influence the consumers while they shop at stores located in Mall and store located at
Central Business District (CBD). 2. To study, if there is any difference between the two set of customers shopping at these two locations over the
factors identified.
5. LIMITATIONS OF THE STUDY The study was done in Coimbatore city, and the findings of the study limits only to the customer’s knowledge of the city. The study was done between formats with one store selling exclusive apparels and the other store is a hypermarket format where apparel is one of the category considered for this study and the study is basically done for the customers of apparel section in the hypermarket format store.
6. LITERATURE REVIEW Factors that are influencing shopping There are many factors that influences the consumers’ purchase decisions. Some of the prominent factors are, the image of the store, risk associated with the purchase of the product and the price perception of consumers on the store or about the product category. Store’s physical environment influences the store image perception related to the merchandise available and the perceived services quality (Baker et al., 1994; Zimmer and Golden, 1988). The attitudes of the consumers are developed from the cues they get from the store image (J.Semeijn et al., 2004). Store image is perceived with many elements like the store’s opening and closing time, the availability of merchandise in the shelf of the stores, product availability during the shopping time, the quality of the product made available to the customers, the depth of assortment of merchandises, layout design of the stores, the easiness of finding the merchandise in the shelves of the stores, knowledge of the employees who are placed to assist the customers during their purchase, behavior of employees while dealing with the

____________________________ Gyandheep Volume 1 Issue 2 January 2014___________________________
55
customers, ability of employees in assisting each customers, and the problem associated with the returning of products (J. Semeijn et al., 2004).Reference price is any price to which other prices are related. There are a variety of bases upon which consumers can compare prices. A similar concept is "reservation price," the price just low enough to result in purchase. A reservation price may be influenced by budget constraints and goals as well as experience with or knowledge of actual prices (Jacobson and Obermiller 1990).Research on the relationship between price and perceived quality has argued that a price too low suggests unacceptable quality (Monroe 1973). Gabor (1977) states that the last price paid is the reference price of a good and Olander (1969) claim that consumers have a memory of numerous past prices and use modal price as their referent.The price perception of consumers is influencing the stores to go for promotions. Gauri et al (2008) states that customers who search across the stores are the one who look for price promotions. Retailers offer price promotions to attract price sensitive customers who search across stores looking for lower prices. Consumers who are with low willingness to pay high shift their purchase to a promotion period whereas consumers with high willingness to pay purchase the product at a higher price point (Conlisk, Gerstner, and Sobel (1984). For non durable product categories, the customers with low willingness to pay will stockpile the product to cover the non promotional periods (Jacobson and Obermiller 1990).
7. RESEARCH METHODOLOGY The research was carried out by taking two stores in Coimbatore City in TamilNadu. The study was conducted during May and June of 2011. For obtaining responses relating to the category “stores located in the Mall, Max stores in Brookfield Mall was selected. A total of 150 responses were obtained from this store. The other store that was chosen for study is Big Bazaar which is located in Central Business District. 100 responses were obtained under this category. The responses were obtained with the help of a structured questionnaire covering the concepts of Store image, Price perception. There were 10 items representing Store image that were adopted from J.Semeijn et al (2004). Another 5 items related to the price perception were developed with the help of attitude scale developed by Burton et al (1998). Hence a total of 15 items were used to study the customer perception about the store located in Mall and CBD on the aspect of store image and price perception in a 5 point scale. The factor analysis helps in isolating the factor influencing the subject understudy.
7.1 Hypothesis Null Hypothesis: There is no significant difference between Retail Store located in a Mall and Store located in Central Business District on major shopping factors influencing consumers. Alternate Hypothesis There is significant difference between Retail Store located in a Mall and Store located in Central Business District on major shopping factors influencing consumers. 7.2 Statistical Tools Used Factor analysis Independent Sample T-Test 8. ANALYSIS AND INTERPRETATION Factor analysis is a tool to identify the variables that exhibit a pattern of correlations within a set of observed variables. In this study responses on 15 variables that influence the consumer’s perception on the store image and price perception for retail store located in a Mall and in Central Business District were obtained using Principal component Analysis method. The reliability statistics of the 15 item shows the alpha value of over .500 (.690).

____________________________ Gyandheep Volume 1 Issue 2 January 2014___________________________
56
Reliability Test for the items Reliability Statistics
Cronbach's Alpha N of Items
690 15 Data Analysis for Mall Based Store: The suitability of sample data for the factor analysis is first found through Kaiser-Meyer-Olkin (KMO) measure, which is an indicator of the suitability of the sample for factor analysis. Small values of KMO indicate that the factor analysis may not be appropriate for the data. The KMO value is found to be .636 (Table 1) for the data that was obtained from the respondents at mall location. Hence the data supports the factor analysis. Bartlett’s Test of Sphericity is also significant. Hence factor analysis can be performed for the sample data.
Table 1 : KMO and Bartlett's Test Kaiser-Meyer-Olkin Measure of Sampling Adequacy. .636
Bartlett's Test of Sphericity Approx. Chi-Square 761.062
df 105 Sig. .000
From Table 2, we can find that the first five components together account for 66% of variance with Initial Eigen values of more than 1.
Table 2: Total Variance Explained
Com
pone
nt Initial Eigenvalues Extraction Sums of Squared
Loadings Rotation Sums of Squared
Loadings
Total % of Variance
Cumulative % Total % of
Variance Cumulative
% Total % of Variance
Cumulative %
1 3.049 20.325 20.325 3.049 20.325 20.325 2.858 19.053 19.053 2 2.904 19.360 39.686 2.904 19.360 39.686 2.280 15.200 34.253 3 1.715 11.434 51.119 1.715 11.434 51.119 1.975 13.169 47.422 4 1.288 8.586 59.705 1.288 8.586 59.705 1.557 10.377 57.799 5 1.066 7.107 66.812 1.066 7.107 66.812 1.352 9.013 66.812 6 .997 6.649 73.461 7 .848 5.650 79.112 8 .631 4.205 83.317 9 .568 3.786 87.103 10 .492 3.279 90.382 11 .411 2.740 93.122 12 .338 2.254 95.376 13 .310 2.068 97.444 14 .199 1.326 98.769 15 .185 1.231 100.000
Table 3 shows the variables with individual factor loading. The table shows the variable converging in five factors. We can take the variable with the highest factor loading and can proceed for the next stage of test on application of independent sample t-test.

____________________________ Gyandheep Volume 1 Issue 2 January 2014___________________________
57
Rotated Component Matrix for Mall Based Store
Table3: Rotated Component Matrixa Component 1 2 3 4 5 Facilities in the store are neat -.001 -.045 .705 .257 .089 Products in promotion are clearly visible -.251 .465 .574 -.275 .256 I am able to find the required merchandise during shopping .072 .868 .027 .249 .106 Store offers high quality products .121 .102 .714 .130 -.018 Store offers a wide variety of products .006 .282 .206 .719 -.099 Employees in the store are fully informed about the product and offers .139 .815 .136 .109 .003
Employees are well behaved with customers -.181 .495 .532 -.128 -.162 I do not have any difficulty when returning items .042 .010 .140 .014 .879 I get individual attention to my problem from employees .005 .468 -.210 .426 .486 The store’s opening hours are convenient to me -.045 .025 .087 .756 .101 I do not like to put extra effort to find lower prices .869 .162 .022 -.115 .052 The money saved by finding low prices is usually not worth the time and effort .842 -.198 .087 -.026 -.077
I would never shop at more than one store to find low prices .721 .035 .255 .080 -.222 Generally speaking, the higher the price of a product, the higher quality .642 .064 -.264 .104 .206
The old saying "The level of service at the store will be related to the price charged" is generally true .568 .141 -.282 -.086 .335
Statistics for store located in Central Business District. The KMO value is found to be .538 (Table 4) for the data that was obtained from the respondents at CBD location. Bartlett’s Test of Sphericity is also significant. Hence factor analysis can be performed for the sample data.
Table 4: KMO and Bartlett's Test Kaiser-Meyer-Olkin Measure of Sampling Adequacy. .538
Bartlett's Test of Sphericity Approx. Chi-Square 200.088
df 105 Sig. .000
Table 5 illustrates the total variance explained for the store located in CBD. The first six components together account for 61% variance and Table 6 details the variables that are grouped in factors with individual factor loading.
Table 5: Total Variance Explained (Store Located in CBD)
Com
pone
nt Initial Eigenvalues Extraction Sums of Squared
Loadings Rotation Sums of Squared
Loadings
Total % of Variance
Cumulative % Total % of
Variance Cumulative
% Total % of Variance
Cumulative %
1 2.401 16.010 16.010 2.401 16.010 16.010 2.182 14.548 14.548 2 1.669 11.130 27.140 1.669 11.130 27.140 1.555 10.363 24.911 3 1.552 10.346 37.486 1.552 10.346 37.486 1.500 10.000 34.911

____________________________ Gyandheep Volume 1 Issue 2 January 2014___________________________
58
4 1.294 8.626 46.112 1.294 8.626 46.112 1.416 9.440 44.351 5 1.263 8.422 54.535 1.263 8.422 54.535 1.310 8.732 53.083 6 1.060 7.067 61.602 1.060 7.067 61.602 1.278 8.519 61.602 7 .992 6.615 68.217 8 .837 5.580 73.797 9 .815 5.433 79.230 10 .704 4.694 83.925 11 .628 4.186 88.110 12 .547 3.645 91.755 13 .515 3.432 95.187 14 .403 2.684 97.871 15 .319 2.129 100.000
Table 6 shows the variables with individual factor loading. The table shows the variable converging in six factors. We can take the variable with the highest factor loading and proceed for the next stage of test on application of independent sample t-test.
Table 6: Rotated Component Matrixa (Store located in CBD)
Component 1 2 3 4 5 6 Facilities in the store are neat .625 .150 .137 .192 -.312 -.065 Products in promotion are clearly visible .800 .104 -.191 -.044 .097 -.077 I am able to find the required Merchandise during shopping -.001 -.189 .568 -.043 .003 .288
Store offers high quality products .587 -.180 .154 .076 -.495 -.001 Store offers a wide variety of products -.073 .079 .053 .256 .012 -.657 Employees are fully informed about the product and offers -.071 -.019 .075 .640 .429 .162
Employees are well behaved with customers .756 -.201 -.039 -.057 .021 .061 I do not have any difficulty when returning items .223 -.603 .105 -.147 .395 .101 I get individual attention to my problem from employees .209 .640 -.213 -.155 .202 .130
The store’s opening hours are convenient to me -.185 .186 .167 .253 -.074 .755 I do not like to put extra effort to find lower prices -.079 .005 .161 .129 .727 -.110 The money saved by finding low prices is usually not worth the time and effort .075 .094 .767 .246 .193 -.009
I would never shop at more than one store to find low prices -.266 .166 .591 -.302 -.025 -.306
Generally speaking, the higher the price of a product, the higher quality -.081 -.006 .007 -.782 .064 .142
The old saying "The level of service at the store will be related to the price charged" is generally true -.085 .750 .202 .027 .024 -.008
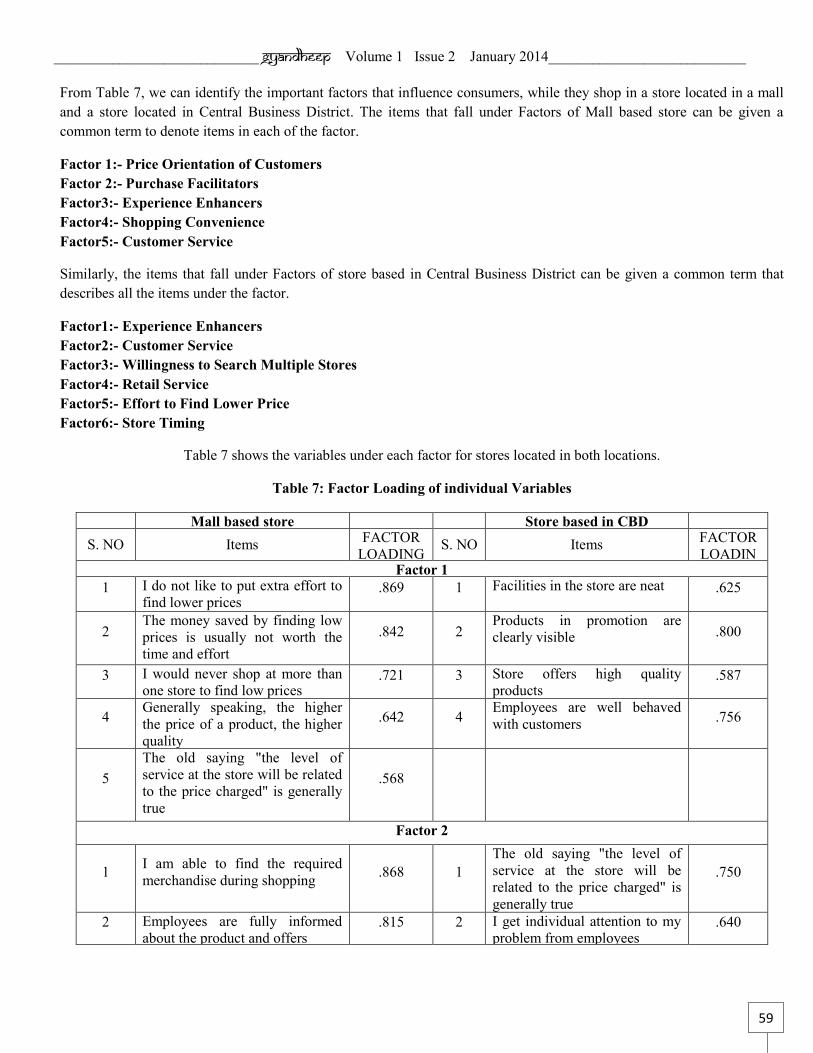
____________________________ Gyandheep Volume 1 Issue 2 January 2014___________________________
59
From Table 7, we can identify the important factors that influence consumers, while they shop in a store located in a mall and a store located in Central Business District. The items that fall under Factors of Mall based store can be given a common term to denote items in each of the factor.
Factor 1:- Price Orientation of Customers Factor 2:- Purchase Facilitators Factor3:- Experience Enhancers Factor4:- Shopping Convenience Factor5:- Customer Service
Similarly, the items that fall under Factors of store based in Central Business District can be given a common term that describes all the items under the factor.
Factor1:- Experience Enhancers Factor2:- Customer Service Factor3:- Willingness to Search Multiple Stores Factor4:- Retail Service Factor5:- Effort to Find Lower Price Factor6:- Store Timing
Table 7 shows the variables under each factor for stores located in both locations.
Table 7: Factor Loading of individual Variables
Mall based store Store based in CBD S. NO Items FACTOR
LOADING S. NO Items FACTOR LOADIN
G Factor 1 1 I do not like to put extra effort to
find lower prices .869 1 Facilities in the store are neat .625
2 The money saved by finding low prices is usually not worth the time and effort
.842 2 Products in promotion are clearly visible .800
3 I would never shop at more than one store to find low prices
.721 3 Store offers high quality products
.587
4 Generally speaking, the higher the price of a product, the higher quality
.642 4 Employees are well behaved with customers .756
5 The old saying "the level of service at the store will be related to the price charged" is generally true
.568
Factor 2
1 I am able to find the required merchandise during shopping .868 1
The old saying "the level of service at the store will be related to the price charged" is generally true
.750
2 Employees are fully informed about the product and offers
.815 2 I get individual attention to my problem from employees
.640

____________________________ Gyandheep Volume 1 Issue 2 January 2014___________________________
60
Factor 3
1 Store offers high quality products
.714 1 The money saved by finding low prices is usually not worth the time and effort
.767
2 Facilities in the store are neat
.705 2 I would never shop at more than one store to find low prices .591
3 Products in promotion are clearly visible .574 3 I am able to find the required
merchandise during shopping .568
4 Employees are well behaved with customers .532
Factor 4
1 The store’s opening hours are convenient to me .756 1 Employees are fully informed
about the product and offers .640
2 Store offers a wide variety of products
.719
Factor 5
1 I do not have any difficulty when returning items .879 1 I do not like to put extra effort
to find lower prices .727
2 I get individual attention to my problem from employees
.486
Factor 6
1 The store’s opening hours are convenient to me .755
From the above Table 7, we can identify the common items that got higher factor loading and has prominent presence in both the type of study. They are as follows.
1. I do not like to put extra effort to find lower prices 2. The money saved by finding low prices is usually not worth the time and effort 3. I am able to find the required merchandise during shopping 4. Store offers high quality products 5. Facilities in the store are neat 6. The store’s opening hours are convenient to me 7. I do not have any difficulty when returning items 8. The old saying "The level of service at the store will be related to the price charged" is generally true
In order to find if there is any significant difference exists between the two store samples means, Independent sample t- test was carried out. The results of the t-test are given below in Table 8.

____________________________ Gyandheep Volume 1 Issue 2 January 2014___________________________
61
Table 8: Independent Samples Test
Opinions
Levene's Test for Equality of Variances
t-test for Equality of Means
95% Confidence Interval of the
Difference
F Sig. t df
Sig. (2-
tailed)
Mean Differe
nce
Std. Error Difference Lower Upper
Facilities in the store
are neat
Equal variances assumed
.046 .831 -.178 248 .859 -.01000 .05633 -.12094 .10094
Equal variances
not assumed
-.178 212.924 .859 -.01000 .05628 -
.12094 .10094
The store’s opening hours are
convenient to me
Equal variances assumed
73.275 .000 -5.748 248 .000 -.63667 .11077 -.85483
-.41851
Equal variances
not assumed
-5.111 134.211 .000 -.63667 .12456 -
.88303 -
.39030
I do not have any difficulty
when returning
items
Equal variances assumed
55.830 .000 -2.335 248 .020 -.29000 .12418 -.53458
-.04542
Equal variances
not assumed
-2.089 137.270 .039 -.29000 .13884 -
.56453 -
.01547
I do not like to put extra effort
to find lower prices
Equal variances assumed
.736 .392 -1.442 248 .151 -.19000 .13180 -.44959 .06959
Equal variances
not assumed
-1.466 224.087 .144 -.19000 .12961 -
.44540 .06540
The money saved by
finding low prices is
usually not worth the time and
effort
Equal variances assumed
2.059 .153 -1.998 248 .047 -.28667 .14348 -.56926
-.00407
Equal variances
not assumed
-2.059 232.514 .041 -.28667 .13921 -
.56095 -
.01239

____________________________ Gyandheep Volume 1 Issue 2 January 2014___________________________
62
I am able to find the required
merchandise during shopping
Equal variances assumed
10.259 .002 2.967 248 .003 .35000 .11796 .11767 .58233
Equal variances
not assumed
3.132 243.792 .002 .35000 .11175 .12988 .57012
Store offers high
quality products
Equal variances assumed
.209 .648 -.541 248 .589 -.04667 .08623 -.21651 .12318
Equal variances
not assumed
-.539 209.583 .590 -.04667 .08656 -
.21730 .12397
The Old Saying
"The Level of Service at the store
will be related to the price
charged" Is Generally
True
Equal variances assumed
1.906 .169 .314 248 .754 .03667 .11695 -.19368 .26701
Equal variances
not assumed
.329 241.722 .742 .03667 .11141 -
.18279 .25612
Inference from Table 8: 1. The variable ‘Facilities in the store are neat’ has a p value of 0.859 (p>0.05). Hence we fail to reject Ho and
conclude that there is no significant difference on this variable between stores which are located in a Mall and Central Business District.
2. The variable ‘The store’s opening hours are convenient to me’ has a p value of less than 0.05 (p=0.000), and hence we can prove that there is a significant difference exists between the stores for this variable.
3. The variable’ I do not have any difficulty when returning items’ also has the p value of less than 0.05 (p = 0.020) and hence we can conclude that there is a significant difference between the stores in Mall and CBD.
4. The variable ‘I do not like to put extra effort to find lower prices’ has p value of .151 which is greater than .05 and hence we fail to reject the Ho. So there is no significant difference exists between the stores in mall and CBD.
5. The variable ‘The money saved by finding low prices is usually not worth the time and effort’ has a p value of 0.047 (p<0.05) and hence we reject the Ho and accept the alternate hypothesis that there is significant difference exists between the stores in Mall and CBD.
6. The variable ‘I am able to find the required merchandise during shopping’ takes the p value of 0.002 (p<0.05) and so we are rejecting the Ho and accepting the alternate hypothesis that there is a significant difference exists between the stores for this variable.
7. The variable ‘Store offers high quality products’ has a p value of .589 and hence we fail to reject the Ho. We infer that there is no significant difference between the stores in mall and CBD.
8. The variable ‘The Old Saying "The Level of Service at the store will be related to the price charged" Is Generally True’ has a p value of .754 (p>0.05) and in this case also the study fails to reject Ho and hence we conclude that there is no significant difference between store located in a Mall and CBD.

____________________________ Gyandheep Volume 1 Issue 2 January 2014___________________________
63
9. CONCLUSION There are many differences that exist between a store that is located in a shopping center (Mall) and a store located at the main bazaar of the town. This study illustrates that there are certain factors that are seen on similar lines by the consumers between the stores located in Mall and CBD. In this study, we can isolate certain factors like, facilities in the store, extra effort required in search of lower price, quality of products available in the store, and perception of price with the service availability in the store. It can be concluded that the customers see no difference between the Mall based store and CBD based store.
This study highlights the factors that influence the customers purchase decision. The factors are namely, Convenient stores opening hour, Difficulty in returning the items after purchase, Worthiness of effort in search of low price, and Availability of products that are on the list while purchasing in a store located in a Mall and in CBD. However the consumers opinion differ in relation to these which are sighted above.
REFERENCES
1. Ailawadi, K., & Keller, K. (2004). Understanding Retail Branding: Conceptual insights and research priorities. Journal of Retailing, 80(4), 331-342.
2. Berman and Evans (Tenth Edition), Retail Management- A Strategic Approach, Pearson Education, pp: 291-303.
3. Dhar, S.K. and Hoch, S.J. (1997), “Why store brand penetration varies by retailer”, Marketing Science, Vol. 16 No. 3, pp. 208-27.
4. Dunn, M, G.; Murphy, P, E.; Skelly, G U. (1986). The influence of perceived risk on brand preference for supermarket products: Journal of Retailing, 62(2), 204-216.
5. Gabor, A., and Granger, C.W.J., (1979) "Price Sensitivity of the Consumer", Management Decision, Vol. 17 (8), 569 – 575.
6. Gauri.K. Dinesh., Sudhir.K, and Talukdar.D. (2008),”The Temporal and Spatial Dimensions of Price Search: Insights from Matching Household Survey and Purchase Data,” Journal of Marketing Research, 45(April), pp226-240.
7. Jacobson.R., and Obermiller.C (1990),” The Formation of Expected Future Price: A Reference Price for Forward-Looking Consumers,” Journal of Consumer Research, 16(March), pp 420-4332.
8. Levy, Weitz & et.al. Retailing Management, Sixth Edition, Tata-McGraw Hill Publications, pp: 221-234. 9. Lichtenstein, D. R., Ridgway, N. M., & Netemeyer, R. G. (1993). Price perceptions and consumer shopping
behavior: A field study. Journal of Marketing Research, 30(May), 234–45. 10. Ramanathan.S. and Dhar.S.K (2010), “The Effect of Sales Promotions on the Size and Composition of the
Shopping Basket: Regulatory Compatibility from Framing and Temporal Restrictions,” Journal of Marketing Research, 47(June), pp542-552.
11. Vedamani G.G. (2008), Retail Management-functional Principles & Practices, Jaico Publishing House, Mumbai.
____________________________ Gyandheep Volume 1 Issue 2 January 2014___________________________
64
BOOK REVIEW
Ms.Devi Premnath*
Bored of reading and referring books related to subjects, I thought of refreshing and feeding my little brain with something valuable and intelligent, and for this I had to drive myself to “destination” SNGIMS library. Many books were stacked around and a book with a golden egg captivated my attention. I started delving more into the book as I had always tried to know the secrets of this premier B school of India “IIM A” .The title of the book The IIMA Story: The DNA of an Institution itself was fascinating. The book is authored by Prafull Anubhai who has been associated with the Indian Institute of Management Ahmadabad (IIMA) for over forty-five years as visiting faculty and as a Board member. The author starts the story of IIM A right from its inception. The Foreword of the story has been excellently charted by Keshubhai Mahindra a former chairman of IIM-A's board of governors. The introductory chapter brings in the spirit of some of the stakeholders along with the Indian government and people such as scientist Vikram Sarabhai, politician Jivraj Mehta (Gujarat's first chief minister) and business baron Kasturbhai Lalbhai for creating a management institute that has made India proud. Their vision has resulted in making of an institution comparable with that of Harvard School of Business. In his book the author tells about the pains taken to infuse the essence of Harvard b school into IIM A . The importance of case study analysis has been underlined many times in the book which often made me introspect into the type of management education that we give our students of Anna University. The author narrates about the masterpiece architecture of IIM A and the contribution of the renowned architect Louis Kahn. The book talks about the role of its director, its faculty hiring methods, its association and tussles with the government, its evolution over time. Prafull in his book brings in some accounts that uphold the morality and integrity of this great institution par excellence .IIMA has been successful in keeping itself away from the shadows of politics falling on it. As we start sailing through the book, at times the book becomes a little bit arid, but I admit that painting a picture of 50 year old institution is not an easy job. The biography of IIMA has some brilliant and rare photographs that are a treat to our eyes. It helps us to visualize the text as we read through. The voices of some famous alumni’s could have been included to make the book a little more conversational. I personally feel that all management teachers should read this book. It will change the perspective in which we view the modern management education, because we faculty fraternity has the power to mould and bring in some of the brilliant managers and entrepreneurs that the world is yet to see.
* Associate Professor, Sree Narayana Guru Institute of Management Studies, Coimbatore – 641 105. E-mail: [email protected], Mobile: 9894069046.
Title of the Book : The IIMA Story: The DNA of an Institution
Author : Prafull Anubhai
Publication : Random House India

____________________________ Gyandheep Volume 1 Issue 2 January 2014____________________________
GUIDELINES TO AUTHORS
The articles should have a standard size of not exceeding 10 pages (around 2500 words) including Diagrams, Graphs and Tables.
Text must be neatly typed in A4 size papers with 1” margin all the sides, using Times New Roman font, 12 font size and 1.5 line spacing.
The cover page of the article should bear the Paper Title, Name(s) of the Author(s), Author affiliation(s), Full address, E-mail ID, Contact Phone number and a brief profile of the author(s).
The article should have an abstract of not exceeding 150 words.
The references should be at the end of the article, numbered and organized alphabetically by surnames of the first authors. The references should have the following details: Name of the Author(s), Year of Publication, and source reference.
Examples: 1) Books: Belch& Belch. (2006), Advertising and Promotion, Tata McGraw – Hill Publishing Co. Ltd., India.
2) Journals: Benjamin J. Cohen (2003), Can the Euro Ever Challenge the Dollar?, Journal of Common Market
Studies, Volume 41, Issue 4, p575-595.
3) Websites: Forex Trading Gurus, http://www.forex-trading-gurus.com/forex-market/advantages-of-the-forex-spot-market.html, Retrieved on September 08, 2008
The article should be accompanied by a declaration by the author(s) regarding its authenticity, originality, non violation
of copyright and not publishing/ presenting it elsewhere. All the articles are subject to peer review. The contributors are requested to send two hard copies of the manuscript along with a softcopy in a CD to ‘The Editor,
Gyandheep, Sree Narayana Guru Institute of Management Studies, K G Chavadi, Coimbatore – 641105’. A soft copy of the manuscript is required to be sent to [email protected] Last date for receiving the article for getting it published in the forthcoming issue of the journal is 31st October.

____________________________ Gyandheep Volume 1 Issue 2 January 2014____________________________
GYANDHEEP
The Journal for Enriching Contemporary Management Thoughts
SUBSCRIPTION FORM
Period Rate Discount Amount Payable
One Year (12 Months) Rs.500/- Nil Rs.500/-
Subscription period : _________________________ to _________________________
Payment Details:
Money Order/ Demand Draft/ Cheque No. __________ Dated ___________In favour of “THE PRINCIPAL,
SREE NARAYANA GURU INSTITUTE OF MANAGEMENT STUDIES”, Payable at Coimbatore.
(Outstation cheques are not accepted; only payable at par cheques are accepted)
Subscriber No. (Renewal) : _________________________________________________
Delivery Details:
Name : _________________________________________________________________
Address : _______________________________________________________________
_______________________________________________ Pin : ___________________
Send your subscription to
Dr. RAJESWARI KRISHNAN CHIEF EDITIOR, GYANDHEEP
Sree Narayana Guru Institute of Management Studies Palakkad Main Road, K.G.Chavadi, Coimbatore – 641 105
Phone : 0422 2656877, 2656899 E-mail : [email protected], Website : sngims.com