Embed Size (px)
Citation preview
© TEBU Finance 1
Practice Example:McDonald’s Cash Flows
© TEBU Finance 2
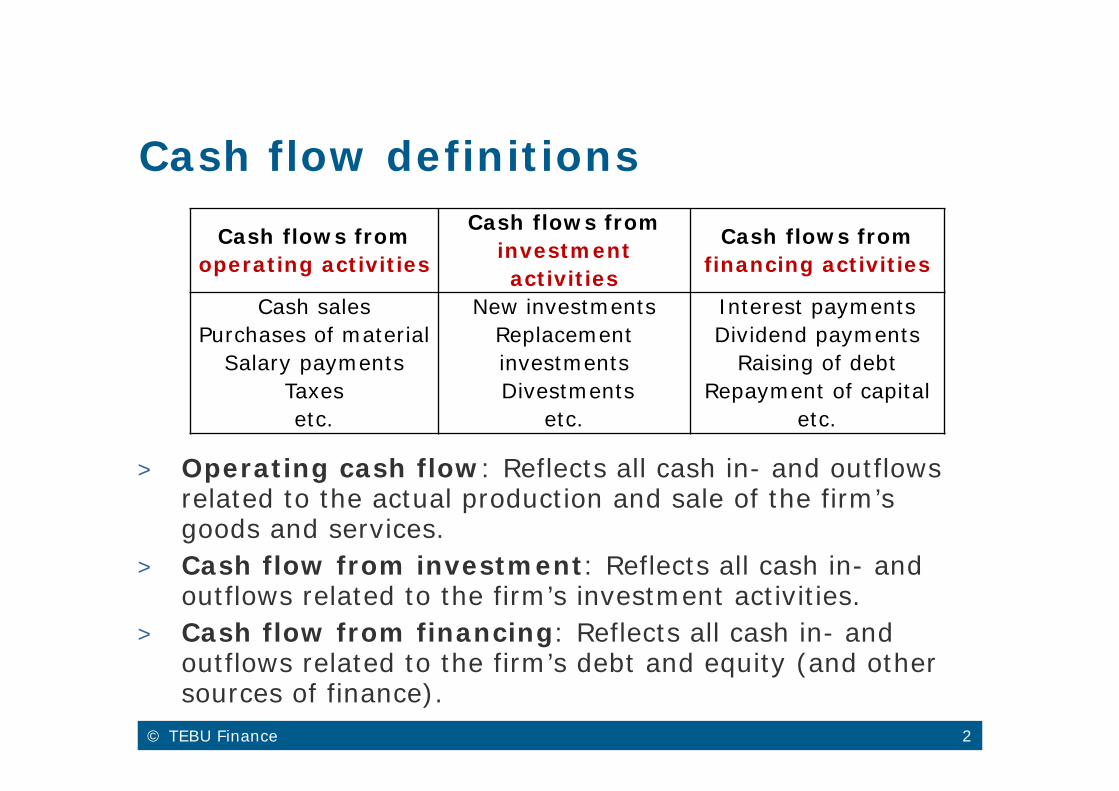
> Operating cash flow: Reflects all cash in- and outflows related to the actual production and sale of the firm’s goods and services.
> Cash flow from investment: Reflects all cash in- and outflows related to the firm’s investment activities.
> Cash flow from financing: Reflects all cash in- and outflows related to the firm’s debt and equity (and other sources of finance).
Cash flow definitionsCash flows from
operating activities
Cash flows from investment activities
Cash flows from financing activities
Cash salesPurchases of material
Salary paymentsTaxesetc.
New investmentsReplacement investmentsDivestments
etc.
Interest paymentsDividend payments
Raising of debtRepayment of capital
etc.
© TEBU Finance 3
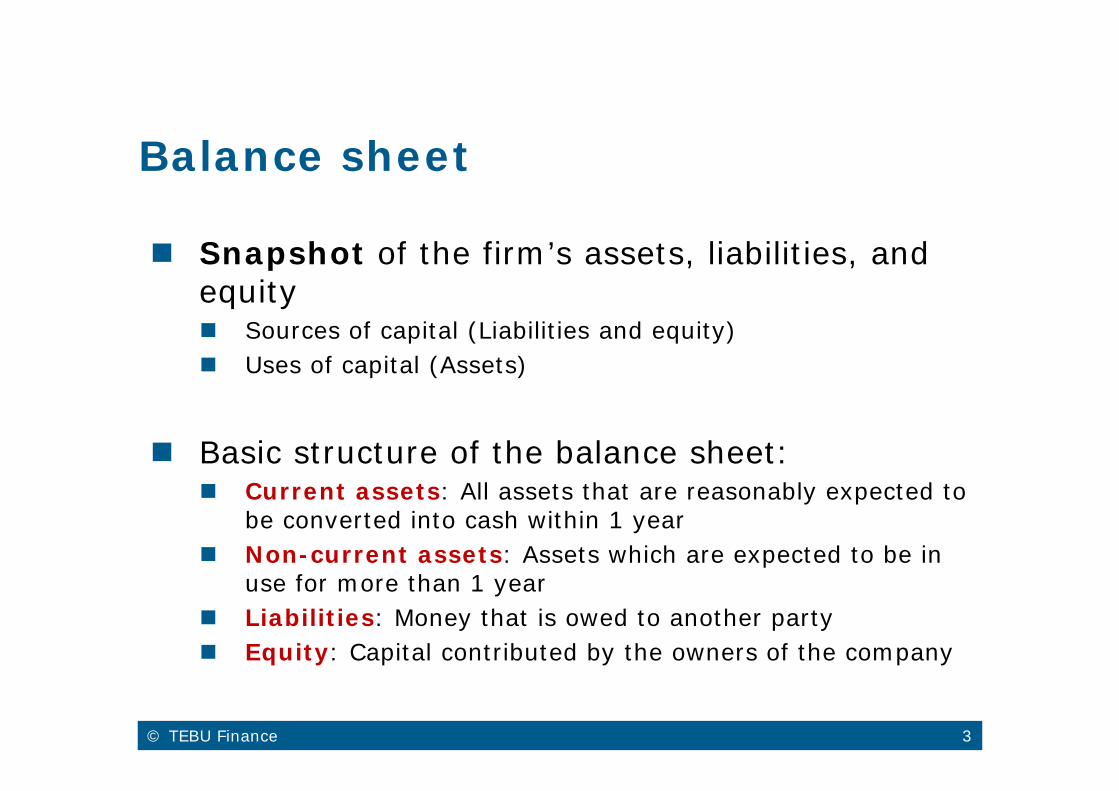
Balance sheet
Snapshot of the firm’s assets, liabilities, and equity Sources of capital (Liabilities and equity) Uses of capital (Assets)
Basic structure of the balance sheet: Current assets: All assets that are reasonably expected to
be converted into cash within 1 year Non-current assets: Assets which are expected to be in
use for more than 1 year Liabilities: Money that is owed to another party Equity: Capital contributed by the owners of the company
© TEBU Finance 4
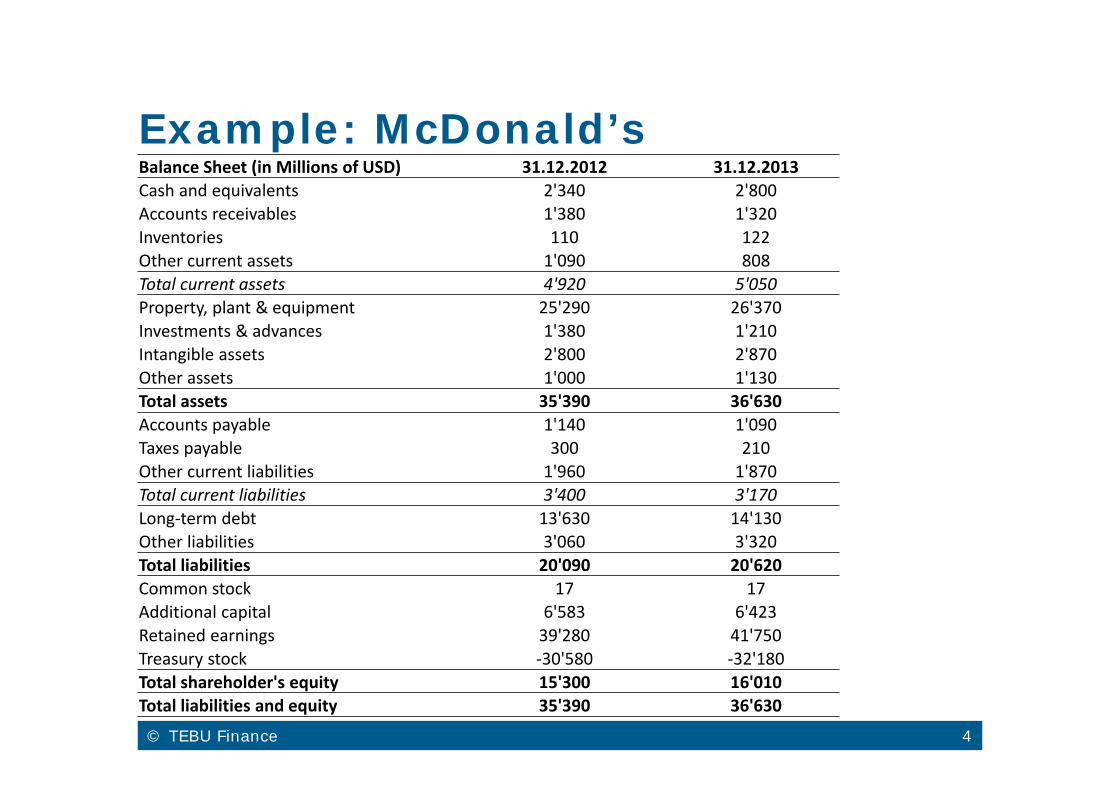
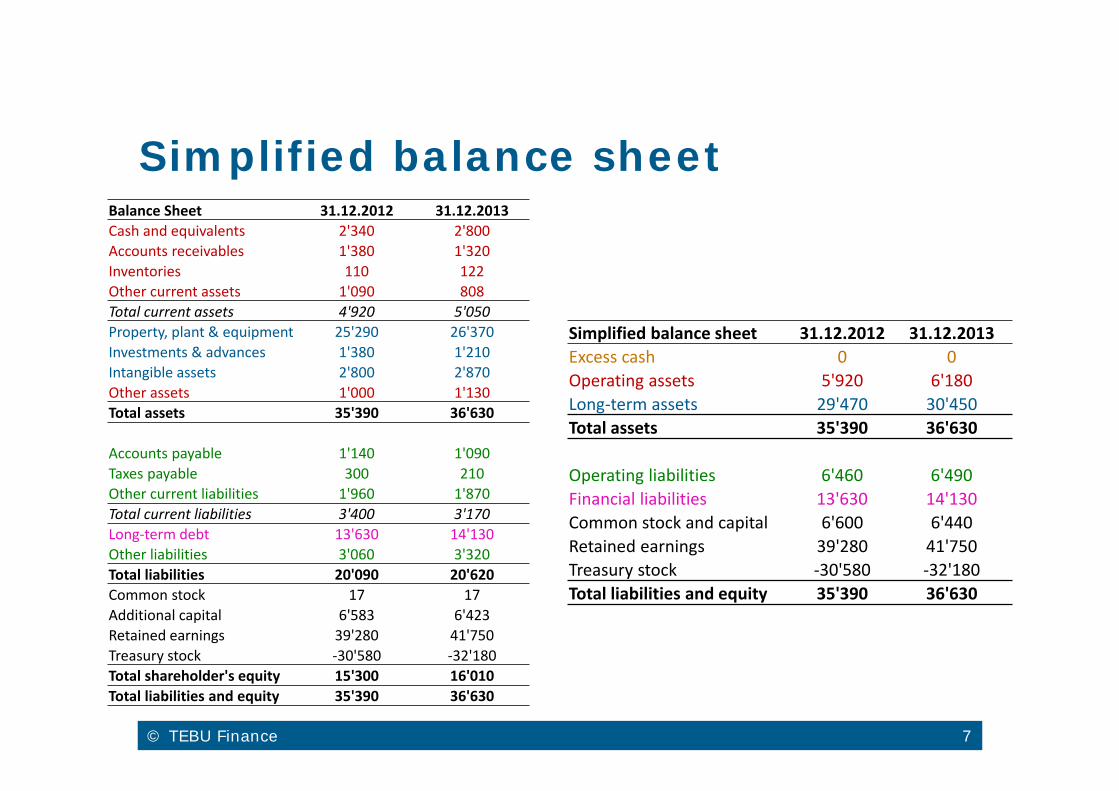
Example: McDonald’sBalance Sheet (in Millions of USD) 31.12.2012 31.12.2013Cash and equivalents 2'340 2'800Accounts receivables 1'380 1'320Inventories 110 122Other current assets 1'090 808Total current assets 4'920 5'050Property, plant & equipment 25'290 26'370Investments & advances 1'380 1'210Intangible assets 2'800 2'870Other assets 1'000 1'130Total assets 35'390 36'630Accounts payable 1'140 1'090Taxes payable 300 210Other current liabilities 1'960 1'870Total current liabilities 3'400 3'170Long‐term debt 13'630 14'130Other liabilities 3'060 3'320Total liabilities 20'090 20'620Common stock 17 17Additional capital 6'583 6'423Retained earnings 39'280 41'750Treasury stock ‐30'580 ‐32'180Total shareholder's equity 15'300 16'010Total liabilities and equity 35'390 36'630
© TEBU Finance 5
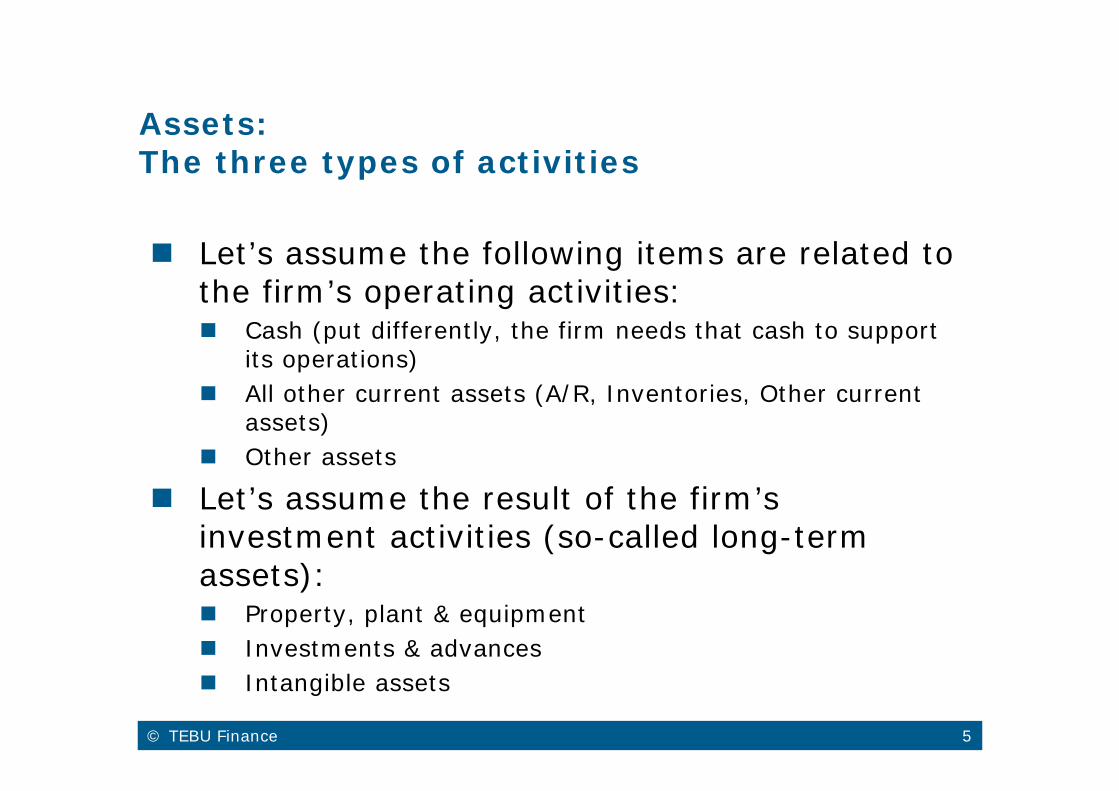
Assets:The three types of activities
Let’s assume the following items are related to the firm’s operating activities: Cash (put differently, the firm needs that cash to support
its operations) All other current assets (A/R, Inventories, Other current
assets) Other assets
Let’s assume the result of the firm’s investment activities (so-called long-term assets): Property, plant & equipment Investments & advances Intangible assets

© TEBU Finance 6
Liabilities and equity:The three types of activities
Operating activity: All current liabilities “Other liabilities”
Debt financing activities: Long-term debt
Equity financing activities: Everything listed under equity
© TEBU Finance 7
Simplified balance sheet
Simplified balance sheet 31.12.2012 31.12.2013Excess cash 0 0Operating assets 5'920 6'180Long‐term assets 29'470 30'450Total assets 35'390 36'630
Operating liabilities 6'460 6'490Financial liabilities 13'630 14'130Common stock and capital 6'600 6'440Retained earnings 39'280 41'750Treasury stock ‐30'580 ‐32'180Total liabilities and equity 35'390 36'630
Balance Sheet 31.12.2012 31.12.2013Cash and equivalents 2'340 2'800Accounts receivables 1'380 1'320Inventories 110 122Other current assets 1'090 808Total current assets 4'920 5'050Property, plant & equipment 25'290 26'370Investments & advances 1'380 1'210Intangible assets 2'800 2'870Other assets 1'000 1'130Total assets 35'390 36'630
Accounts payable 1'140 1'090Taxes payable 300 210Other current liabilities 1'960 1'870Total current liabilities 3'400 3'170Long‐term debt 13'630 14'130Other liabilities 3'060 3'320Total liabilities 20'090 20'620Common stock 17 17Additional capital 6'583 6'423Retained earnings 39'280 41'750Treasury stock ‐30'580 ‐32'180Total shareholder's equity 15'300 16'010Total liabilities and equity 35'390 36'630

© TEBU Finance 8
General rules
Operating assets: All asset positions that are not excess cash and that are not depreciated or amortized.
Long-term assets: All asset positions that are depreciated or amortized (or impaired).
Operating liabilities: All liabilities that are not interest bearing.
Financial liabilities: All interest-bearing liabilities
© TEBU Finance 9
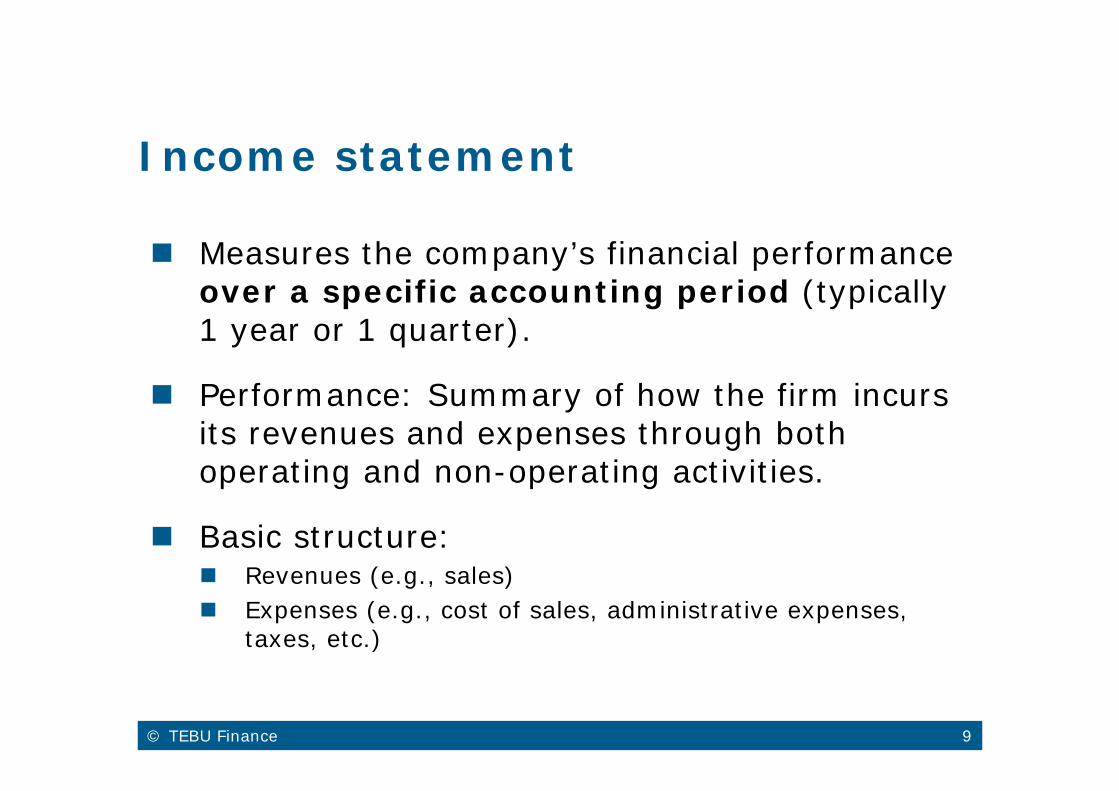
Income statement
Measures the company’s financial performance over a specific accounting period (typically 1 year or 1 quarter).
Performance: Summary of how the firm incurs its revenues and expenses through both operating and non-operating activities.
Basic structure: Revenues (e.g., sales) Expenses (e.g., cost of sales, administrative expenses,
taxes, etc.)

© TEBU Finance 10
Example: McDonald’s
Income statement (in millions of USD) 2012 2013Net revenues 27'570 28'110‐ COGS (excl D&A) 15'260 15'620‐ Depreciation and amortization 1'490 1'590Gross income 10'820 10'900‐ SG&A Expenses 2'460 2'410‐ Other expenses (income) ‐253 ‐247EBIT 8'613 8'737‐ Interest expenses 533 537Pretax income 8'080 8'200‐ Income taxes 2'620 2'610Net income 5'460 5'590
© TEBU Finance 11
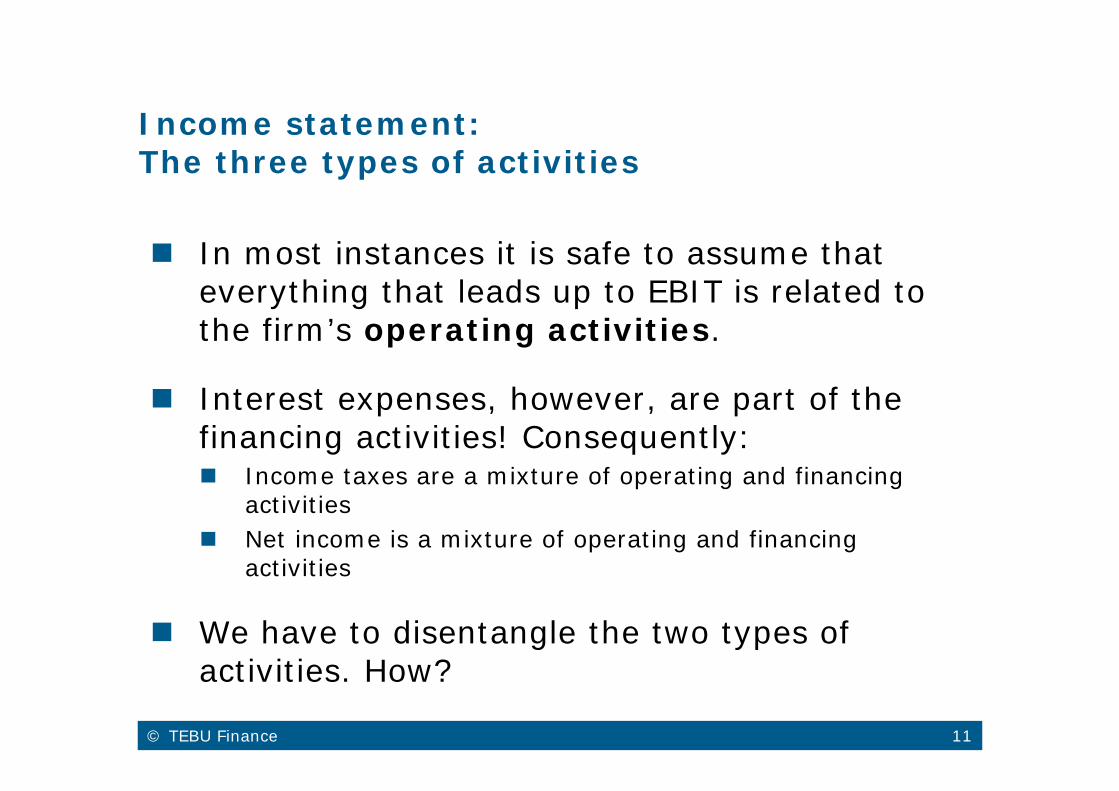
Income statement:The three types of activities
In most instances it is safe to assume thateverything that leads up to EBIT is related tothe firm’s operating activities.
Interest expenses, however, are part of thefinancing activities! Consequently: Income taxes are a mixture of operating and financing
activities Net income is a mixture of operating and financing
activities
We have to disentangle the two types of activities. How?

© TEBU Finance 12
Adjustments for NOPLAT
First compute the taxes the firm would have to paywithout debt financing. These are the so-calledAdjusted taxes.
Then derive the net income the firm would havewithout debt financing. That’s the so-called Net Operating Profit Less Adjusted Taxes(NOPLAT)
NOPLAT = EBIT – Adjusted taxes
© TEBU Finance 13
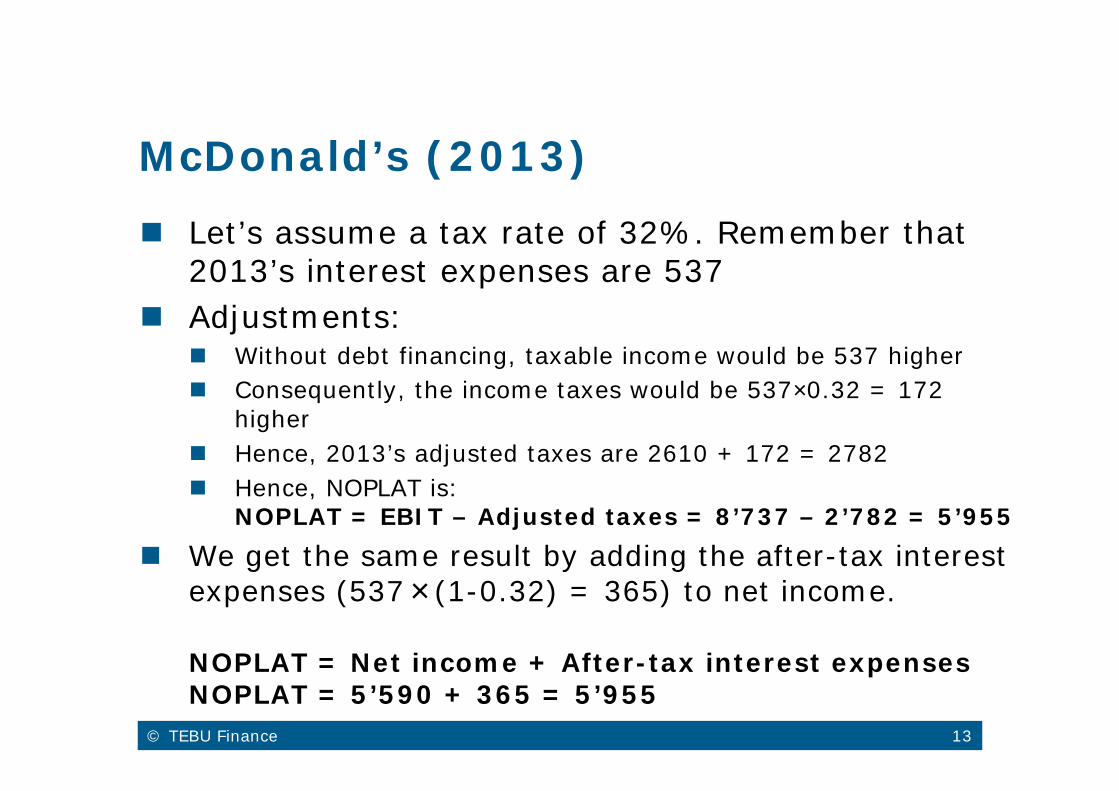
McDonald’s (2013) Let’s assume a tax rate of 32%. Remember that
2013’s interest expenses are 537 Adjustments:
Without debt financing, taxable income would be 537 higher Consequently, the income taxes would be 537×0.32 = 172
higher Hence, 2013’s adjusted taxes are 2610 + 172 = 2782 Hence, NOPLAT is:
NOPLAT = EBIT – Adjusted taxes = 8’737 – 2’782 = 5’955 We get the same result by adding the after-tax interest
expenses (537×(1-0.32) = 365) to net income.
NOPLAT = Net income + After-tax interest expensesNOPLAT = 5’590 + 365 = 5’955

© TEBU Finance 14
Linking balance sheet and incomestatement
The part of the firm’s Net income (incomestatement), which is not distributed toshareholders as a dividend, is added to Retainedearnings (Balance sheet).
Retained earningst = Retained earningst-1+Net incomet – Dividendt
McDonald’s (2013): Net income = 5’590 Retained earnings increase by 2’470 from 39’280 to 41’750 Hence, the dividend was 5’590 – 2’470 = 3’120.

© TEBU Finance 15
Financial planning
Introduction
Historical Cash Flow Statement
Cash Flow Projection

© TEBU Finance 16
The cash flow statement
The relevant questions: How much cash did McDonald’s generate in 2013? How much did it generate from operations? How much was used for investments? How much was available for distribution to the
providers of capital (debt and equity together)? How much was available for distribution to the
providers of equity? How much was actually distributed to the providers of
capital (debt and equity together)?
© TEBU Finance 17
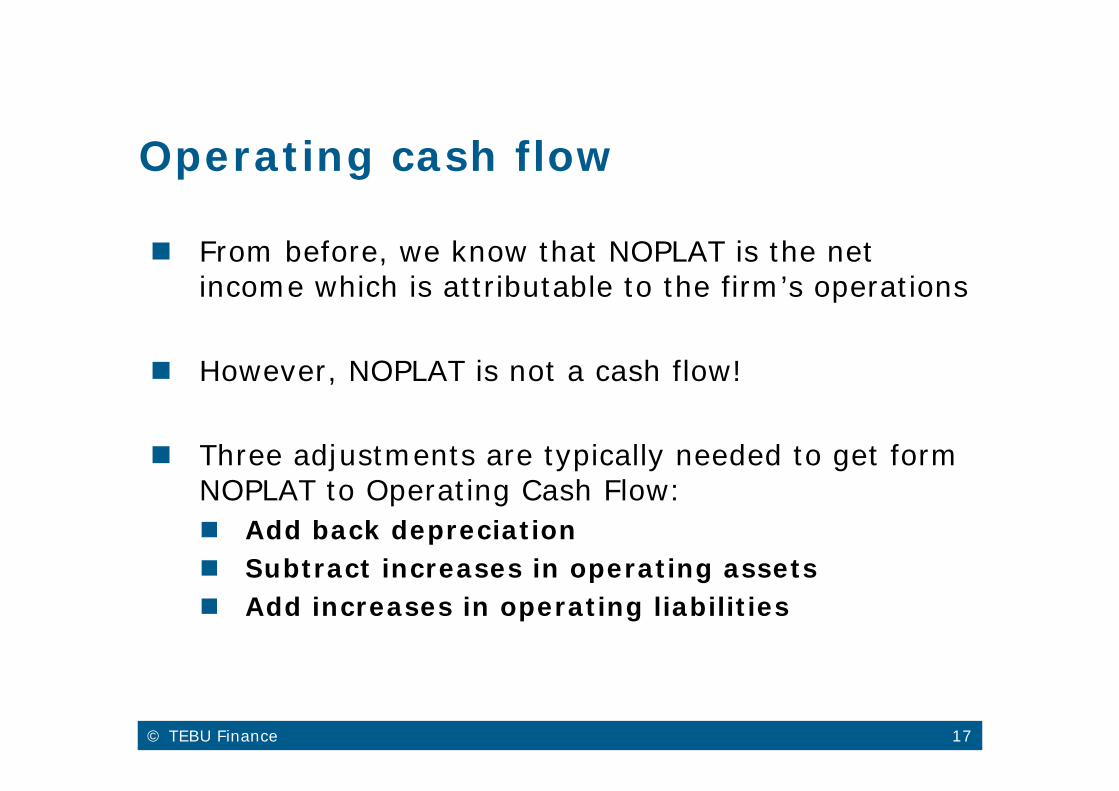
Operating cash flow
From before, we know that NOPLAT is the netincome which is attributable to the firm’s operations
However, NOPLAT is not a cash flow!
Three adjustments are typically needed to get form NOPLAT to Operating Cash Flow: Add back depreciation Subtract increases in operating assets Add increases in operating liabilities

© TEBU Finance 18
Operating cash flow
v
Simplified balance sheet 31.12.2012 31.12.2013 ChangeExcess cash 0 0 0Operating assets 5'920 6'180 260Long‐term assets 29'470 30'450 980Total assets 35'390 36'630 1'240Operating liabilities 6'460 6'490 30Debt 13'630 14'130 500Common stock and capital 6'600 6'440 ‐160Retained earnings 39'280 41'750 2'470Treasury stock ‐30'580 ‐32'180 ‐1'600Total liabilities and equity 35'390 36'630 1'240
Income statement 2013Net revenues 28'110‐ COGS (excl D&A) 15'620‐ Depreciation and amortization 1'590Gross income 10'900‐ SG&A Expenses 2'410‐ Other expenses (income) ‐247EBIT 8'737‐ Interest expenses 537Pretax income 8'200‐ Income taxes 2'610Net income 5'590+ After‐tax interest expenses 365NOPLAT 5'955
Cash flow statement 2013Net income 5'590+ After‐tax interest expenses 365NOPLAT 5'955
Interpretation: With its operating activities, McD has generated a cash flow of 7’315 million in 2013. Because of the substantial depreciation and amortization charges, this operating cash flow is considerably higher than the NOPLAT of 5’955 million
+ Depreciation and amortization 1'590‐ Increase in operating assets 260+ Increase in operating liabilities 30Operating Cash Flow 7'315

© TEBU Finance 19
The free cash flow
Next we look at the firm’s investment activity. How much did the McD invest in 2013?
Income statement 2013Net revenues 28'110‐ COGS (excl D&A) 15'620‐ Depreciation and amortization 1'590Gross income 10'900‐ SG&A Expenses 2'410‐ Other expenses (income) ‐247EBIT 8'737
Simplified balance sheet 31.12.2012 31.12.2013 ChangeExcess cash 0 0 0Operating assets 5'920 6'180 260Long‐term assets 29'470 30'450 980Total assets 35'390 36'630 1'240
Despite the fact that the firm had depreciation charges of 1’590, the long-term assets increased by 980 from 29’470 to 30’450. Hence, net investmentswere 2’570:
Net investments = Depreciation + Change in book value of long-term assets= 1’590 + 980 = 2’570.

© TEBU Finance 20
The free cash flow (2)
By subtracting the net investments from theoperating cash flow, we get the Free Cash Flow (FCF)
The free cash flow is the most important cash flow figure in firm valuation
It is the amount of money the firm generates that is not tied up in the operating or investment activities
It is the amount of money that, in principle, can be distributed to the providers of capital (debt and equity).
Cash flow statement 2013Operating cash flow 7’315‐ Net investments 2’570Free Cash Flow 4’745

© TEBU Finance 21
The residual cash flow
Next we look at cash flows from debt financing. Interest expenses (after taxes!) New borrowing / repayment of debt
From above we know that after-tax interest expenses are 365 (=Interest expenses*(1-tax rate))
Moreover, debt outstanding increased by 500, according to the balance sheet. Cash inflow
© TEBU Finance 22
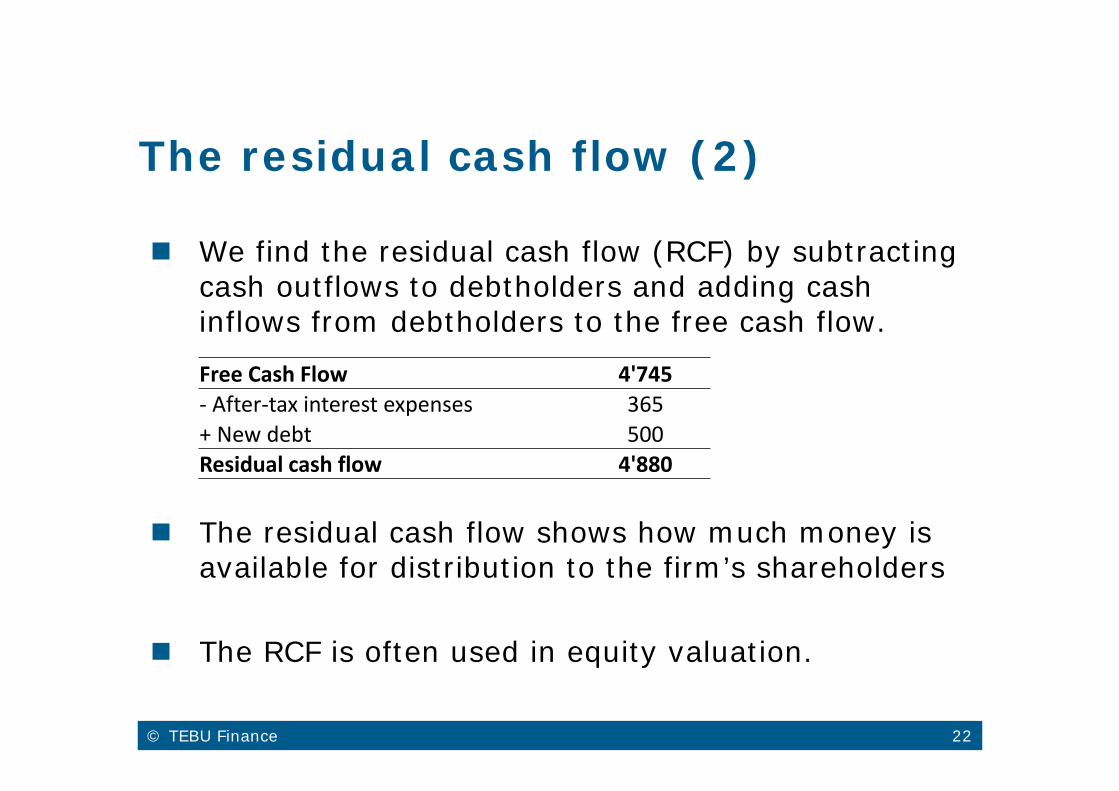
The residual cash flow (2)
We find the residual cash flow (RCF) by subtracting cash outflows to debtholders and adding cash inflows from debtholders to the free cash flow.
The residual cash flow shows how much money is available for distribution to the firm’s shareholders
The RCF is often used in equity valuation.
Free Cash Flow 4'745‐ After‐tax interest expenses 365+ New debt 500Residual cash flow 4'880

© TEBU Finance 23
Change in excess cash
The last step of the investigation is to look at the cash flows from equity financing.
Paid-in capital decreased by 160 Cash outflow
Retained earnings increased by 2’470Remember that net income was 5’590 Dividend of 5’590 – 2’470 = 3’120
The value of the treasury shares increased by 1’600. This is the result of share repurchases. Cash outflow
© TEBU Finance 24
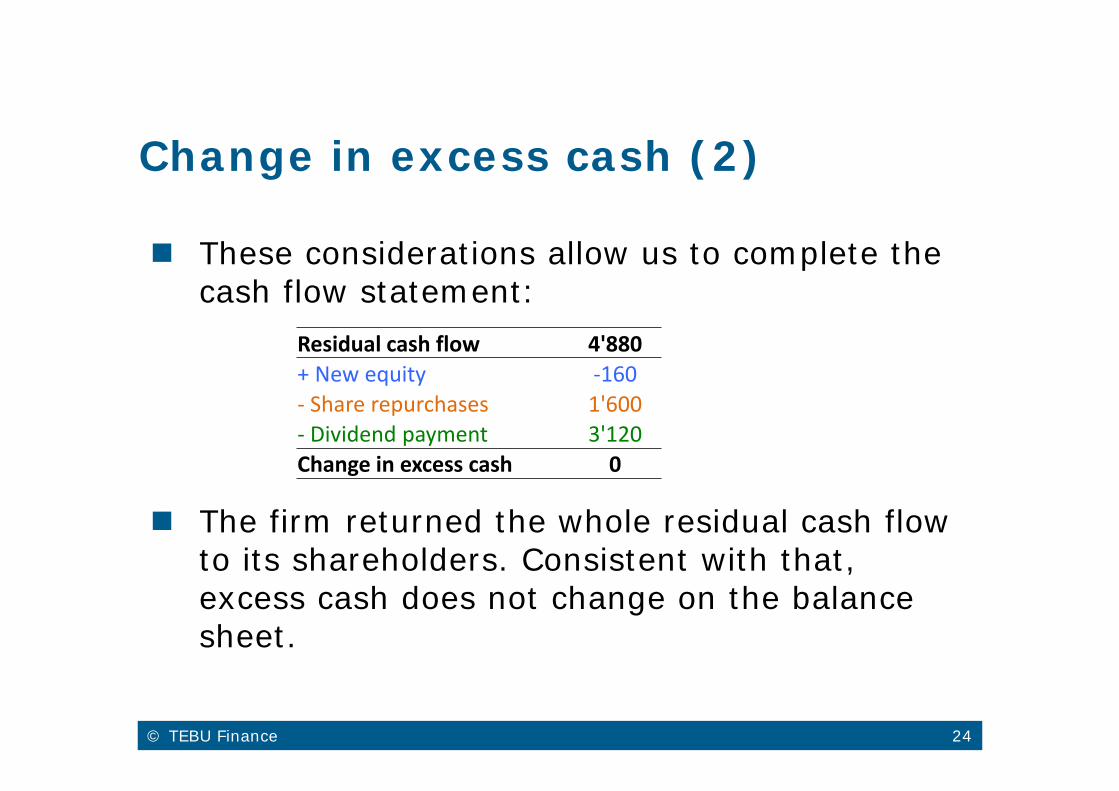
Change in excess cash (2)
These considerations allow us to complete the cash flow statement:
The firm returned the whole residual cash flow to its shareholders. Consistent with that, excess cash does not change on the balance sheet.
Residual cash flow 4'880+ New equity ‐160‐ Share repurchases 1'600‐ Dividend payment 3'120Change in excess cash 0
© TEBU Finance 25
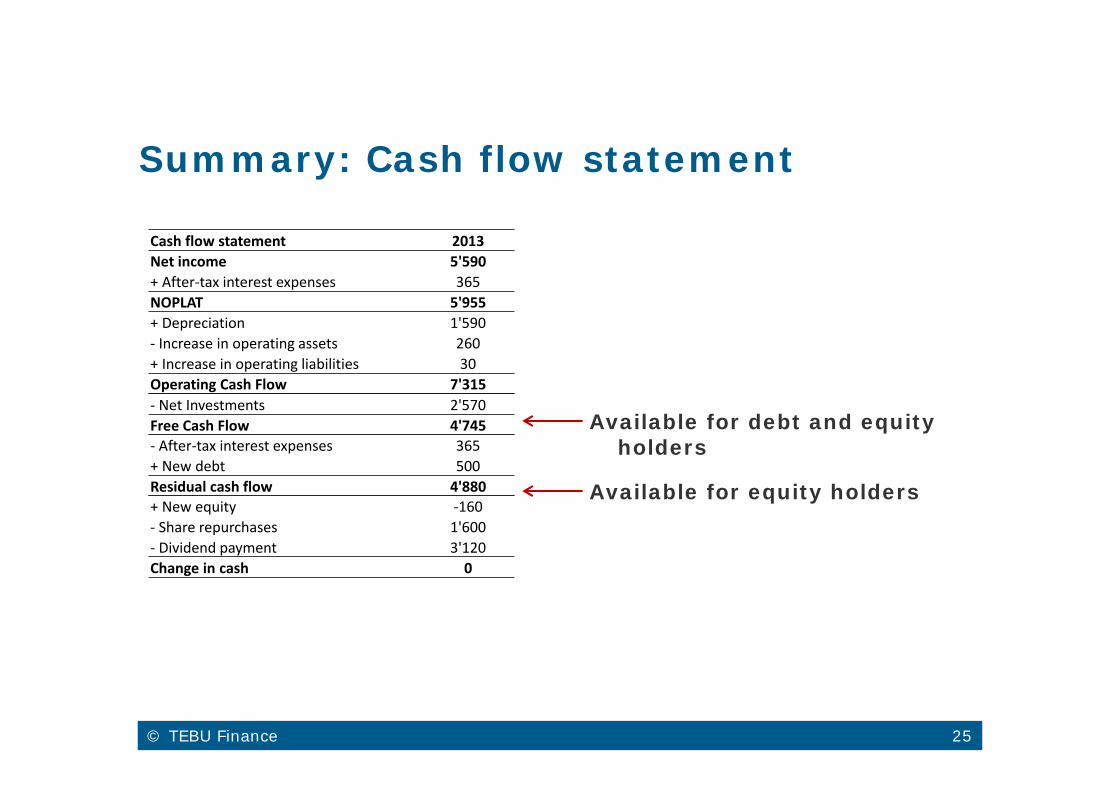
Summary: Cash flow statement
Cash flow statement 2013Net income 5'590+ After‐tax interest expenses 365NOPLAT 5'955+ Depreciation 1'590‐ Increase in operating assets 260+ Increase in operating liabilities 30Operating Cash Flow 7'315
Available for debt and equity holders
Available for equity holders
‐ Net Investments 2'570Free Cash Flow 4'745‐ After‐tax interest expenses 365+ New debt 500Residual cash flow 4'880+ New equity ‐160‐ Share repurchases 1'600‐ Dividend payment 3'120Change in cash 0
© TEBU Finance 26
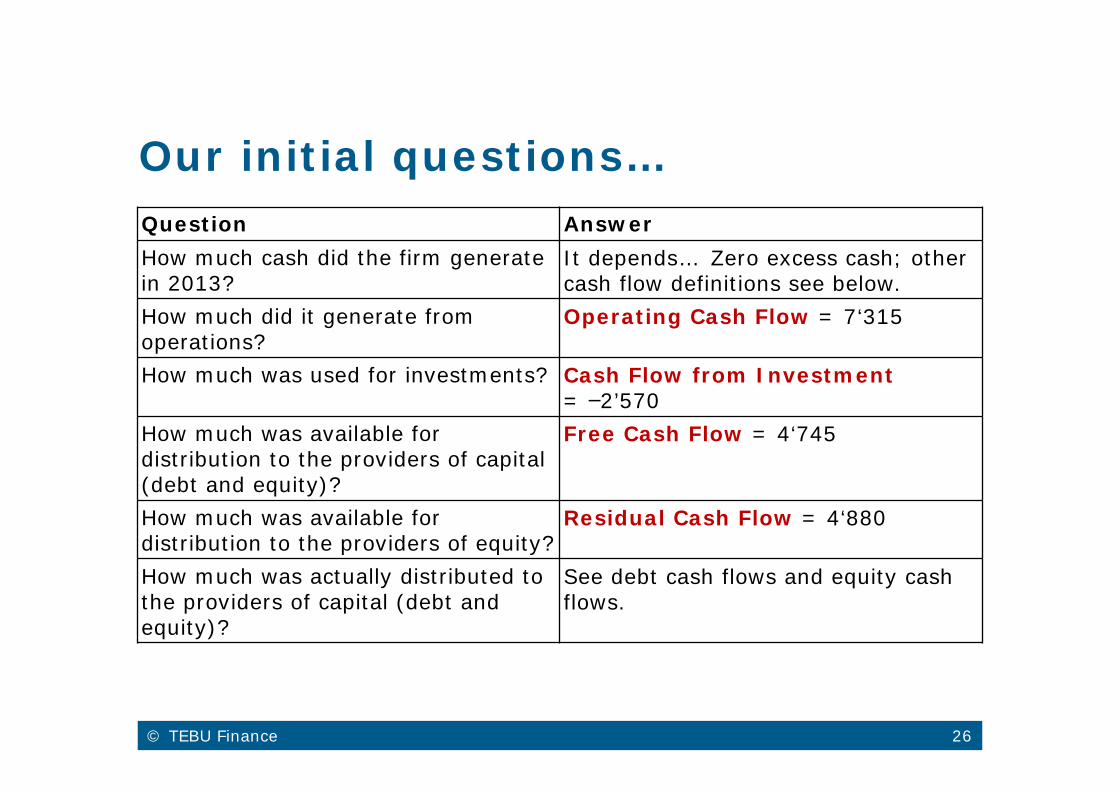
Our initial questions…Question AnswerHow much cash did the firm generate in 2013?
It depends… Zero excess cash; othercash flow definitions see below.
How much did it generate from operations?
Operating Cash Flow = 7‘315
How much was used for investments? Cash Flow from Investment = –2’570
How much was available for distribution to the providers of capital (debt and equity)?
Free Cash Flow = 4‘745
How much was available for distribution to the providers of equity?
Residual Cash Flow = 4‘880
How much was actually distributed to the providers of capital (debt and equity)?
See debt cash flows and equity cash flows.
© TEBU Finance 27
The mechanics We started with net income and made adjustments to
filter out the cash flows from operations, investments, and financing.
In particular, to get operating cash flow: Add back interest payments after taxes because this is
a financing cash flow (therefore, we subtract it later on) Add back depreciation (non-cash expenses) Subtract the change in net working capital (and other non-
cash revenues/expenses and earnings neutral cash flows) The cash flow statement allows us to see directly where
the money comes from (operations, divestitures, financing) and where it goes to (operations, investments, financing).
Therefore, it is an important element of financial planning.

© TEBU Finance 28
Financial planning
Introduction
Historical Cash Flow Statement
Cash Flow Projection
© TEBU Finance 29
Forecasting the cash flow statement forvaluation purposes (1)
Percentage of sales method: Identify the main driver(s) of the firm’s business activities. In many industries, sales are the main driving force. In
other industries (f.ex., wealth management) it could be assets under management.
Find out how the other positions are related to sales. For example, operating cash could be 5% of sales, on average. Express «all» other positions as a percentage of sales.
Forecast sales. By doing so, you implicitly also forecast «all» other positions.
© TEBU Finance 30
Forecasting the cash flow statement forvaluation purposes (2)
T-Account method: Explicitly model each account (f.ex., sales, COGS,
investments) separately and use that information to derive the cash flow statement.
Method of choice for «extraordinary» activities (f.ex., large investments)
Often, we do not have enough information to implement this method. Moreover, many accounts (f.ex., accounts receivable) are likely to be a function of other accounts (f.ex., sales).
In practice, it makes sense to combine the two approaches.

© TEBU Finance 31
Forecasting the cash flow statement forvaluation purposes (3)
Suggested procedure: Forecast the balance sheet and income statement using the
percentage of sales method. For the positions that are not directly related to sales, use
the T-Account method. Use the forecasted balance sheets and income statements
to derive the cash flow statements. Follow the same procedure as before.
Keep in mind that the balance sheets and income statements must be consistent! (Assets = Debt + Equity, etc.)
A word of caution: Each valuation is the result of a set of assumptions Unreasonable assumptions produce useless forecasts

© TEBU Finance 32
Example: McDonald‘s Let’s go back to McDonald’s and try to project 2014’s cash
flows… To do so, we make the following assumptions:
Income statement assumptions (2014):
Item Value Assumption CommentsNet revenues 27'810 Analyst forecasts
COGS 58% of Net revenues Historical valueDepreciation 6% of Long‐term assets at year end Historical valueSG&A 9% of Net revenues Historical valueOther expenses 0Interest expenses 3.25% of Debt at the start of the year Market‐implied cost of debtTax rate 32% of Pretax income Historical value
© TEBU Finance 33
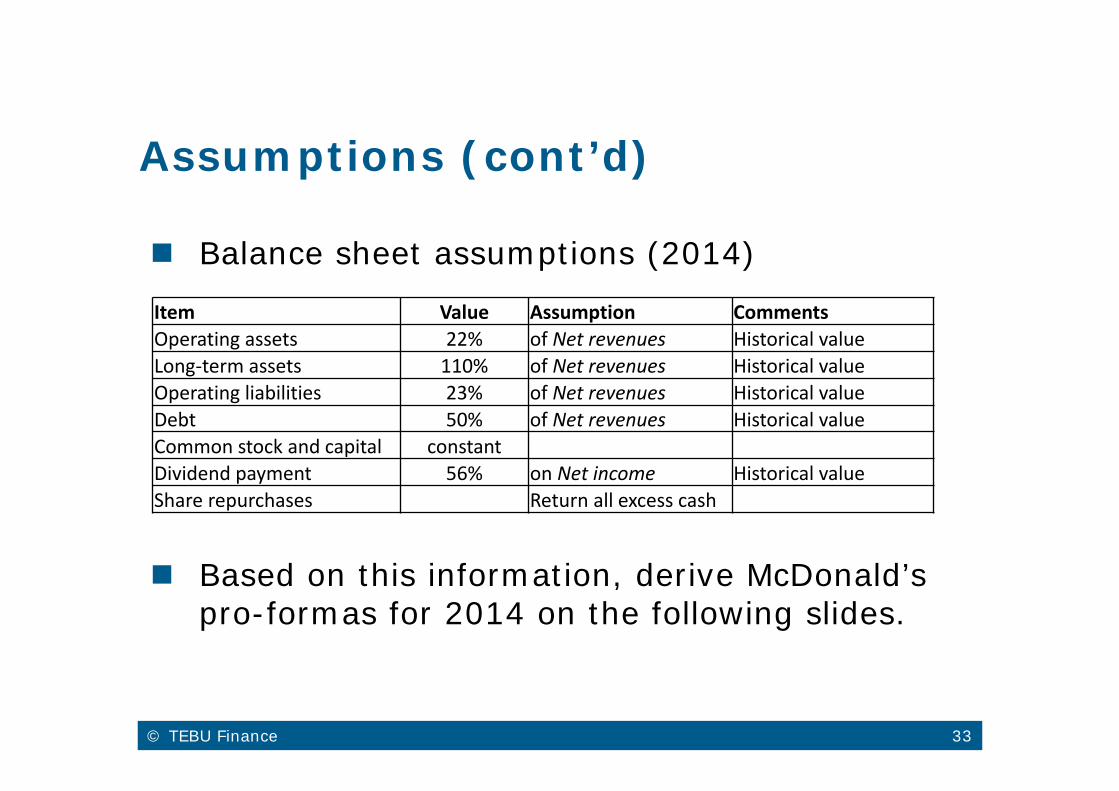
Assumptions (cont’d)
Balance sheet assumptions (2014)
Based on this information, derive McDonald’s pro-formas for 2014 on the following slides.
Item Value Assumption CommentsOperating assets 22% of Net revenues Historical valueLong‐term assets 110% of Net revenues Historical valueOperating liabilities 23% of Net revenues Historical valueDebt 50% of Net revenues Historical valueCommon stock and capital constantDividend payment 56% on Net income Historical valueShare repurchases Return all excess cash

© TEBU Finance 34
The income statement (2014)
Income statement 2013 Assumption E2014Net revenues 28'110 Analyst forecast 27'810‐ COGS (excl D&A) 15'620 58% of Net revenues‐ Depreciation and amortization 1'590 6% of Long‐term assets at year end
Gross income 10'900
‐ SG&A Expenses 2'4109% of Net revenues
‐ Other expenses (income) ‐247 ZeroEBIT 8'737‐ Interest expenses 537 3.25% of Debt at the start of the year
Pretax income 8'200‐ Income taxes 2'610 32% of Pretax incomeNet income 5'590
© TEBU Finance 35
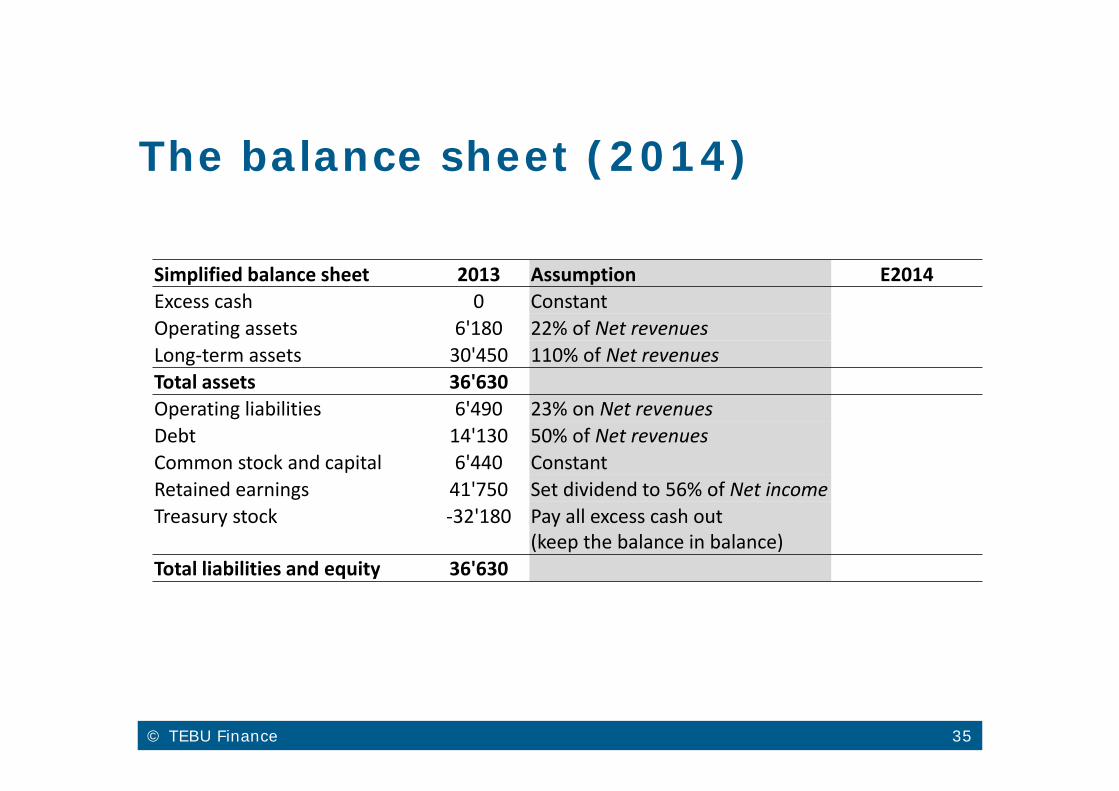
The balance sheet (2014)
Simplified balance sheet 2013 Assumption E2014Excess cash 0 ConstantOperating assets 6'180 22% of Net revenuesLong‐term assets 30'450 110% of Net revenuesTotal assets 36'630Operating liabilities 6'490 23% on Net revenuesDebt 14'130 50% of Net revenuesCommon stock and capital 6'440 ConstantRetained earnings 41'750 Set dividend to 56% of Net incomeTreasury stock ‐32'180 Pay all excess cash out
(keep the balance in balance)Total liabilities and equity 36'630
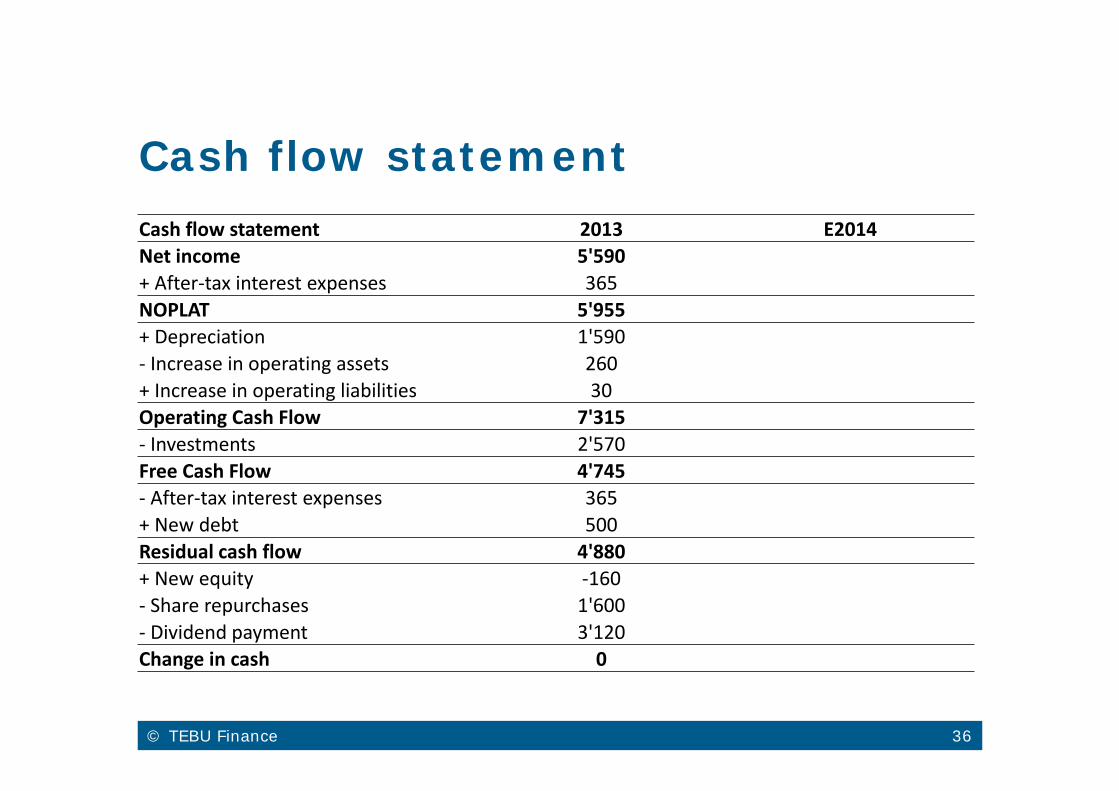
© TEBU Finance 36
Cash flow statementCash flow statement 2013 E2014Net income 5'590+ After‐tax interest expenses 365NOPLAT 5'955+ Depreciation 1'590‐ Increase in operating assets 260+ Increase in operating liabilities 30Operating Cash Flow 7'315‐ Investments 2'570Free Cash Flow 4'745‐ After‐tax interest expenses 365+ New debt 500Residual cash flow 4'880+ New equity ‐160‐ Share repurchases 1'600‐ Dividend payment 3'120Change in cash 0
© TEBU Finance 37
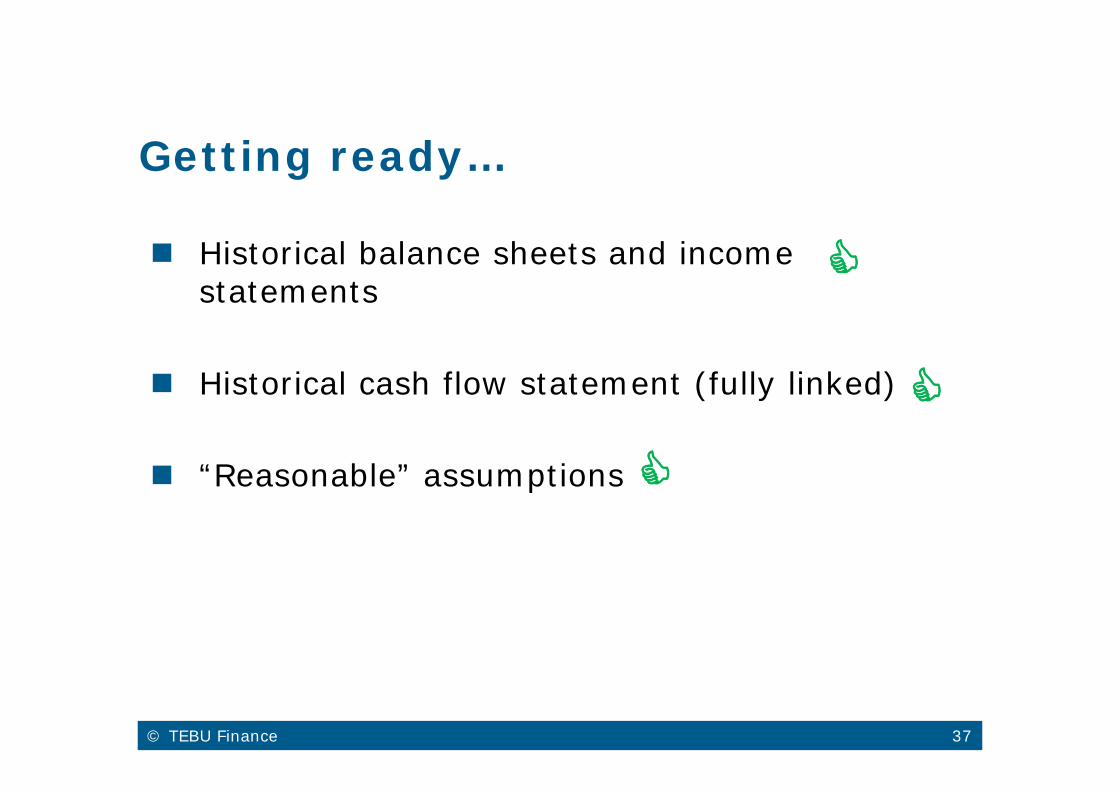
Getting ready…
Historical balance sheets and income statements
Historical cash flow statement (fully linked)
“Reasonable” assumptions
© TEBU Finance 38
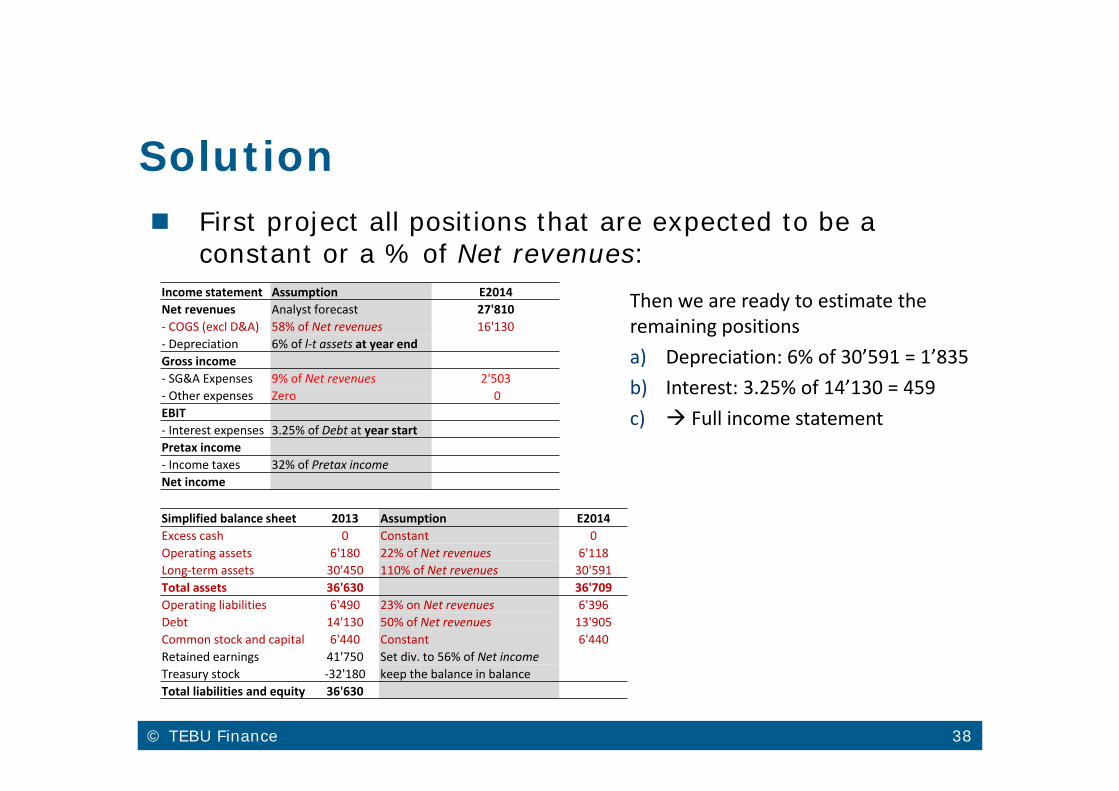
Solution First project all positions that are expected to be a
constant or a % of Net revenues:Income statement Assumption E2014Net revenues Analyst forecast 27'810‐ COGS (excl D&A) 58% of Net revenues 16'130‐ Depreciation 6% of l‐t assets at year endGross income‐ SG&A Expenses 9% of Net revenues 2'503‐ Other expenses Zero 0EBIT‐ Interest expenses 3.25% of Debt at year startPretax income‐ Income taxes 32% of Pretax incomeNet income
Simplified balance sheet 2013 Assumption E2014Excess cash 0 Constant 0Operating assets 6'180 22% of Net revenues 6'118Long‐term assets 30'450 110% of Net revenues 30'591Total assets 36'630 36'709Operating liabilities 6'490 23% on Net revenues 6'396Debt 14'130 50% of Net revenues 13'905Common stock and capital 6'440 Constant 6'440Retained earnings 41'750 Set div. to 56% of Net incomeTreasury stock ‐32'180 keep the balance in balanceTotal liabilities and equity 36'630
Then we are ready to estimate the remaining positionsa) Depreciation: 6% of 30’591 = 1’835b) Interest: 3.25% of 14’130 = 459c) Full income statement

© TEBU Finance 39
Solution (cont‘d) The resulting income statement
The resulting balance sheet
Income statement Assumption E2014Net revenues Analyst forecast 27'810‐ COGS (excl D&A) 58% of Net revenues 16'130‐ Depreciation 6% of l‐t assets at year end 1’835Gross income 9’845‐ SG&A Expenses 9% of Net revenues 2'503‐ Other expenses Zero 0EBIT 7’342‐ Interest expenses 3.25% of Debt at year start 459Pretax income 6'883‐ Income taxes 32% of Pretax income 2'202Net income 4'680
Simplified balance sheet 2013 Assumption E2014Excess cash 0 Constant 0Operating assets 6'180 22% of Net revenues 6'118Long‐term assets 30'450 110% of Net revenues 30'591Total assets 36'630 36'709Operating liabilities 6'490 23% on Net revenues 6'396Debt 14'130 50% of Net revenues 13'905Common stock and capital 6'440 Constant 6'440Retained earnings 41'750 Set div. to 56% of Net income 43’809Treasury stock ‐32'180 keep the balance in balance ‐33’841Total liabilities and equity 36'630 36’709
Now we can complete the balance sheeta) Dividend: 56% of 4’680 = 2’621.
Hence, Retained earnings increase by: Net income – Dividend = 4’680 – 2’621 = 2’059.
Ret. earnings = 41’750+2’059=43’809
b) To keep the balance in balance (A = L+E = 36’709), the value of the treasury stock in 2014 must be ‐33’841. This is an increase of 1’661 compared to 2013. Hence, expected share repurchases are 1’661.

© TEBU Finance 40
The resulting cash flow statement
Now we are ready to forecast the cash flow statement.
We follow the very same procedure as before.

© TEBU Finance 41
The forecasted cash flow statement
Cash flow statement 2013 E2014Net income 5'590 4'680+ After‐tax interest expenses 365 312NOPLAT 5'955 4'992+ Depreciation 1'590 1'835‐ Increase in operating assets 260 ‐62+ Increase in operating liabilities 30 ‐94Operating Cash Flow 7'315 6'796‐ Investments 2'570 1'976Free Cash Flow 4'745 4'819‐ After‐tax interest expenses 365 312+ New debt 500 ‐225Residual cash flow 4'880 4'282+ New equity ‐160 0‐ Share repurchases 1'600 1'661‐ Dividend payment 3'120 2'621Change in cash 0 0
Our projections imply that McD will generate a FCF of 4.8 billion in 2014.

© TEBU Finance 42
Summary

© TEBU Finance 43
Pro-forma cash flow statement
We have discussed the basic principles to compile the pro forma financial statements.
Now we are able to understand the firm’s sources and uses of cash, not only in the past but also in the future.
This is one of the key skills we need to understand and implement valuation.