Embed Size (px)
Citation preview

Practical ROI Goes Beyond the Math
Track 1 Session 5

2
Dan Goudey
Director, DC Storage and Throughput
– Email:
– Phone:
– Website: www.grainger.com
W.W. Grainger, Inc.
Marc Wulfraat
President & Founder
– Email: [email protected]
– Phone: (514) 482-3572 x 100
– Website: www.mwpvl.com
– LinkedIn: Marc Wulfraat
MWPVL International Inc.

Abstract
3
The case for capital investment has to include
a demonstrable return to the shareholders.
However, a holy war rages on as to what values
can be utilized on either side of the equation
(investment vs. return). This hybrid session
consists of a fact-based presentation on the
science of justification followed by an
insightful panel discussion among real
practitioners who remain employed because
they consistently deliver returns on
investment. It will enlighten, educate, and
perhaps provide the impetus needed to
advance your next project.
Agenda
4
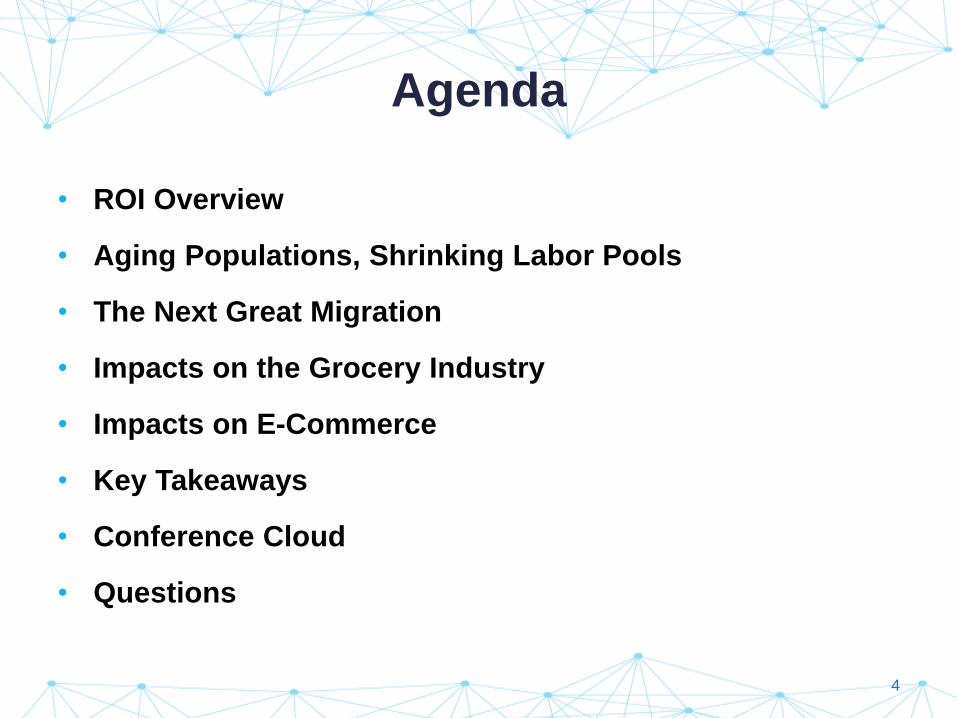
• ROI Overview
• Aging Populations, Shrinking Labor Pools
• The Next Great Migration
• Impacts on the Grocery Industry
• Impacts on E-Commerce
• Key Takeaways
• Conference Cloud
• Questions
Return on Investment Definition
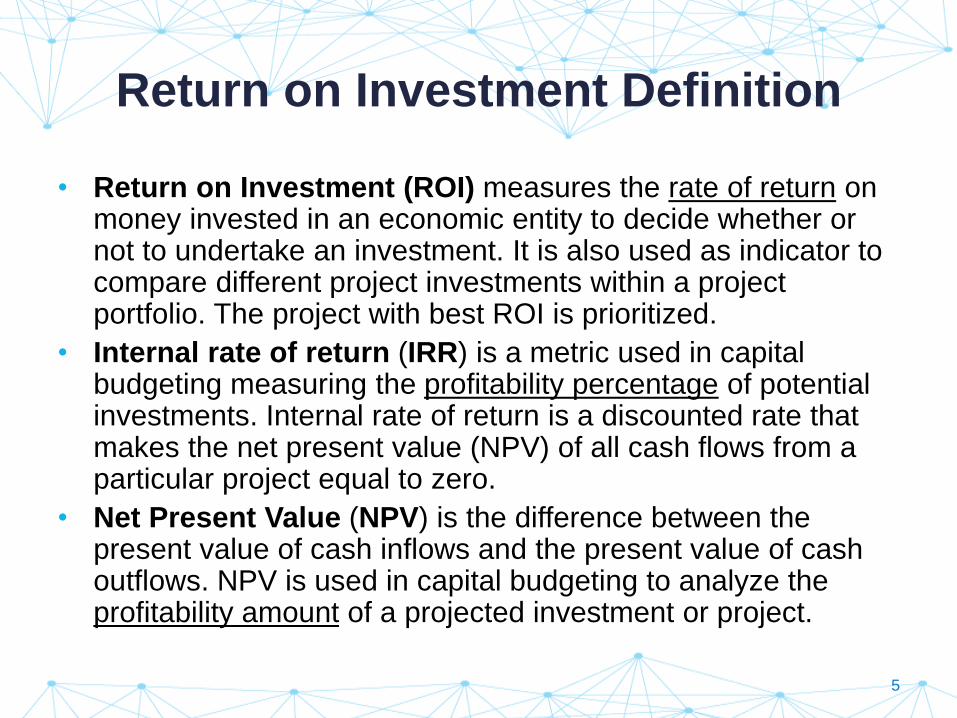
• Return on Investment (ROI) measures the rate of return on money invested in an economic entity to decide whether or not to undertake an investment. It is also used as indicator to compare different project investments within a project portfolio. The project with best ROI is prioritized.
• Internal rate of return (IRR) is a metric used in capital budgeting measuring the profitability percentage of potential investments. Internal rate of return is a discounted rate that makes the net present value (NPV) of all cash flows from a particular project equal to zero.
• Net Present Value (NPV) is the difference between the present value of cash inflows and the present value of cash outflows. NPV is used in capital budgeting to analyze the profitability amount of a projected investment or project.
5
Evolution of ROI Drivers in Our Industry
6
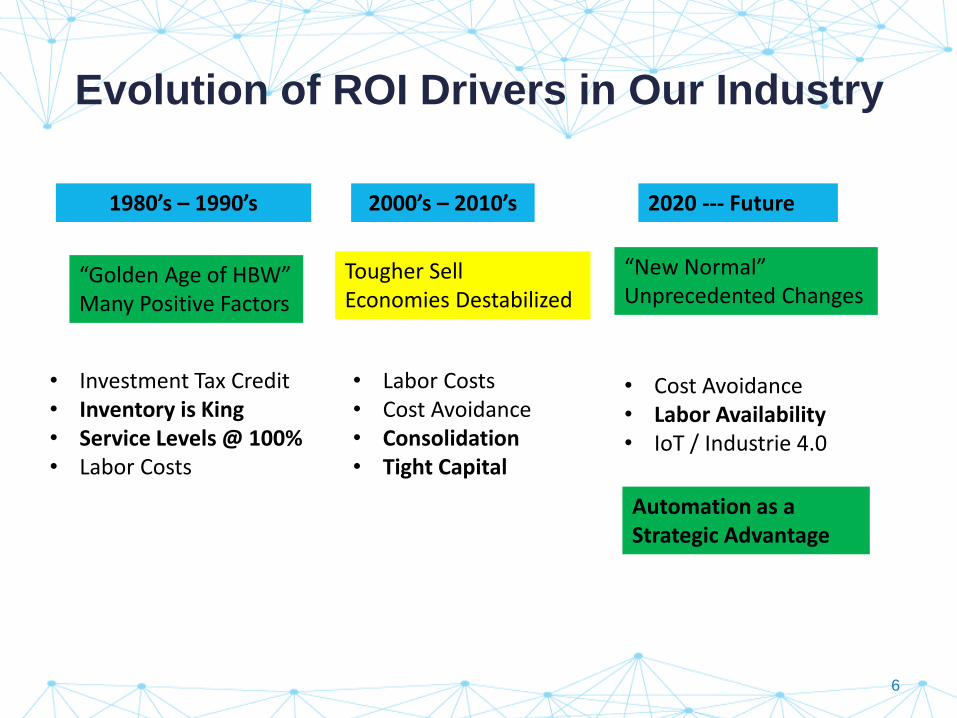
1980’s – 1990’s 2000’s – 2010’s 2020 --- Future
• Investment Tax Credit• Inventory is King• Service Levels @ 100%• Labor Costs
• Labor Costs• Cost Avoidance• Consolidation• Tight Capital
• Cost Avoidance• Labor Availability• IoT / Industrie 4.0
“Golden Age of HBW”Many Positive Factors
Tougher SellEconomies Destabilized
“New Normal”Unprecedented Changes
Automation as a Strategic Advantage
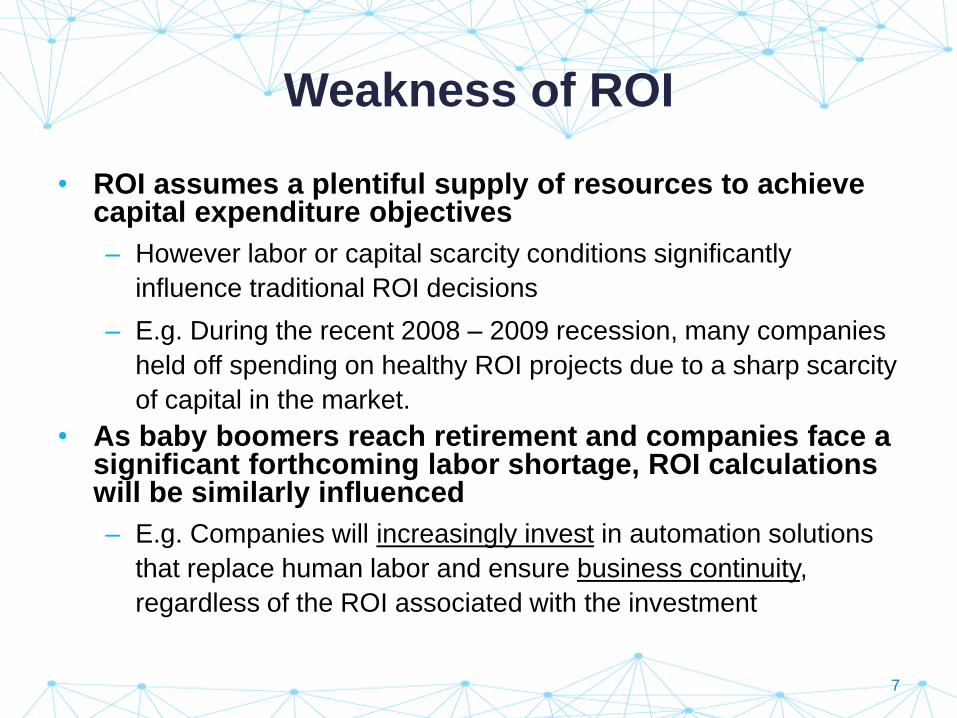
Weakness of ROI
• ROI assumes a plentiful supply of resources to achieve capital expenditure objectives
– However labor or capital scarcity conditions significantly
influence traditional ROI decisions
– E.g. During the recent 2008 – 2009 recession, many companies
held off spending on healthy ROI projects due to a sharp scarcity
of capital in the market.
• As baby boomers reach retirement and companies face a significant forthcoming labor shortage, ROI calculations will be similarly influenced
– E.g. Companies will increasingly invest in automation solutions
that replace human labor and ensure business continuity,
regardless of the ROI associated with the investment
7
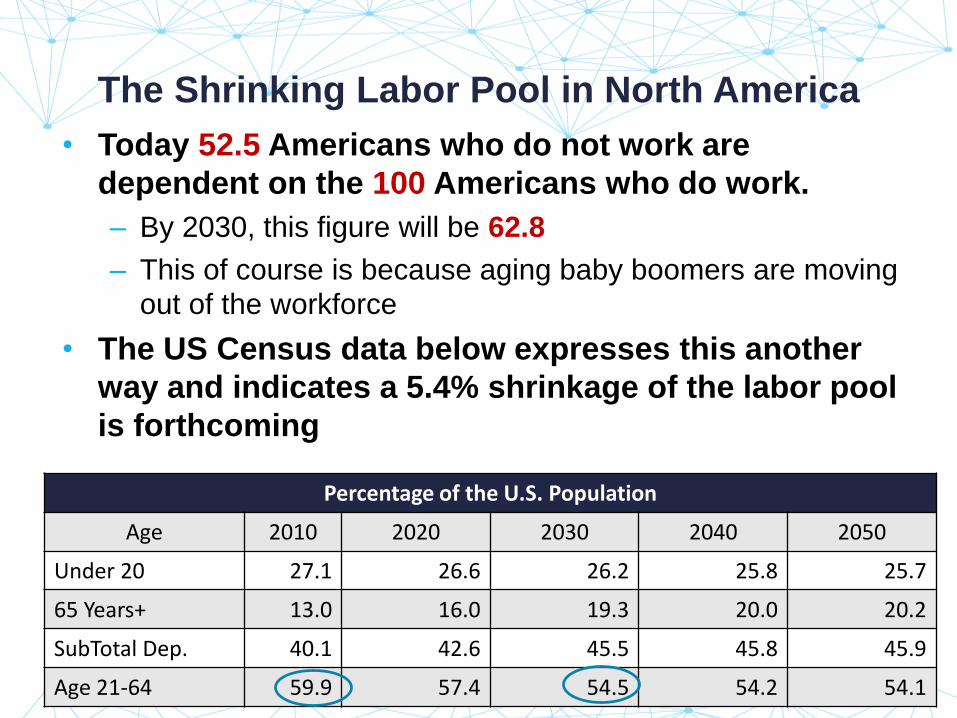
The Shrinking Labor Pool in North America
• Today 52.5 Americans who do not work are
dependent on the 100 Americans who do work.
– By 2030, this figure will be 62.8
– This of course is because aging baby boomers are moving
out of the workforce
• The US Census data below expresses this another
way and indicates a 5.4% shrinkage of the labor pool
is forthcoming
Percentage of the U.S. Population
Age 2010 2020 2030 2040 2050
Under 20 27.1 26.6 26.2 25.8 25.7
65 Years+ 13.0 16.0 19.3 20.0 20.2
SubTotal Dep. 40.1 42.6 45.5 45.8 45.9
Age 21-64 59.9 57.4 54.5 54.2 54.1
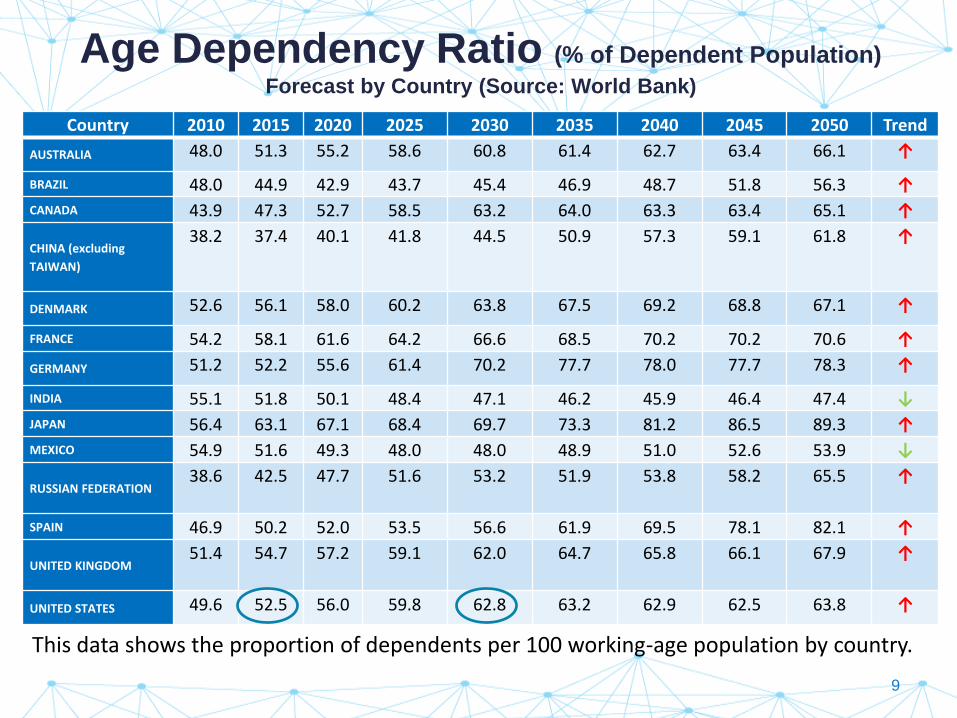
Age Dependency Ratio (% of Dependent Population)
Forecast by Country (Source: World Bank)
Country 2010 2015 2020 2025 2030 2035 2040 2045 2050 Trend
AUSTRALIA 48.0 51.3 55.2 58.6 60.8 61.4 62.7 63.4 66.1 ↑
BRAZIL 48.0 44.9 42.9 43.7 45.4 46.9 48.7 51.8 56.3 ↑
CANADA 43.9 47.3 52.7 58.5 63.2 64.0 63.3 63.4 65.1 ↑
CHINA (excluding
TAIWAN)
38.2 37.4 40.1 41.8 44.5 50.9 57.3 59.1 61.8 ↑
DENMARK 52.6 56.1 58.0 60.2 63.8 67.5 69.2 68.8 67.1 ↑
FRANCE 54.2 58.1 61.6 64.2 66.6 68.5 70.2 70.2 70.6 ↑
GERMANY 51.2 52.2 55.6 61.4 70.2 77.7 78.0 77.7 78.3 ↑
INDIA 55.1 51.8 50.1 48.4 47.1 46.2 45.9 46.4 47.4 ↓
JAPAN 56.4 63.1 67.1 68.4 69.7 73.3 81.2 86.5 89.3 ↑
MEXICO 54.9 51.6 49.3 48.0 48.0 48.9 51.0 52.6 53.9 ↓
RUSSIAN FEDERATION38.6 42.5 47.7 51.6 53.2 51.9 53.8 58.2 65.5 ↑
SPAIN 46.9 50.2 52.0 53.5 56.6 61.9 69.5 78.1 82.1 ↑
UNITED KINGDOM51.4 54.7 57.2 59.1 62.0 64.7 65.8 66.1 67.9 ↑
UNITED STATES 49.6 52.5 56.0 59.8 62.8 63.2 62.9 62.5 63.8 ↑
This data shows the proportion of dependents per 100 working-age population by country.
9
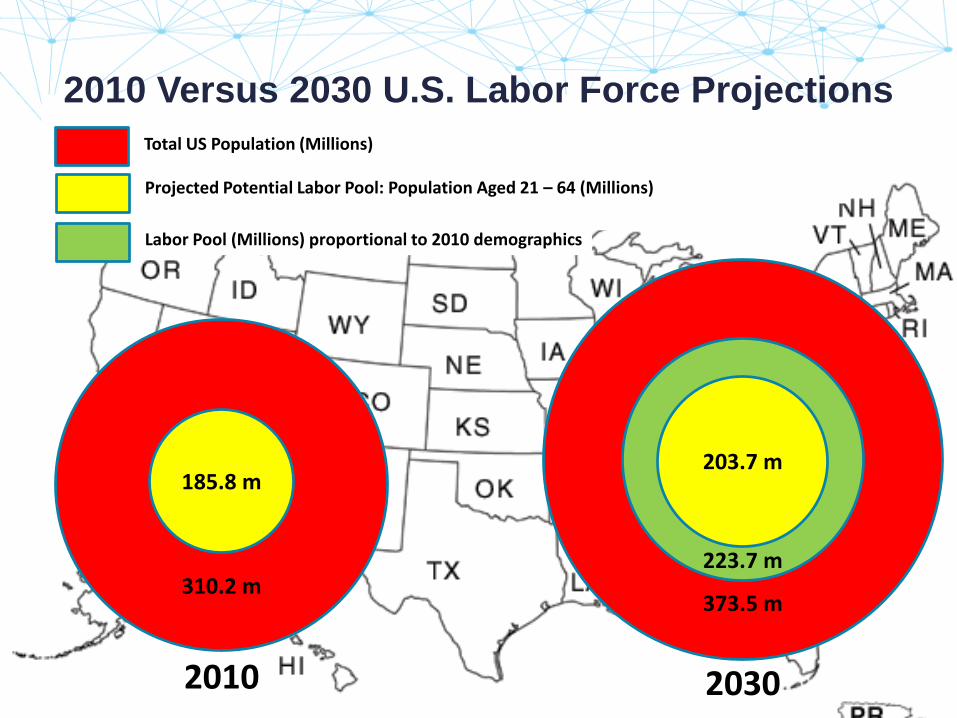
2010 Versus 2030 U.S. Labor Force Projections
310.2 m
2010
185.8 m
373.5 m
223.7 m
2030
203.7 m
Total US Population (Millions)
Projected Potential Labor Pool: Population Aged 21 – 64 (Millions)
Labor Pool (Millions) proportional to 2010 demographics
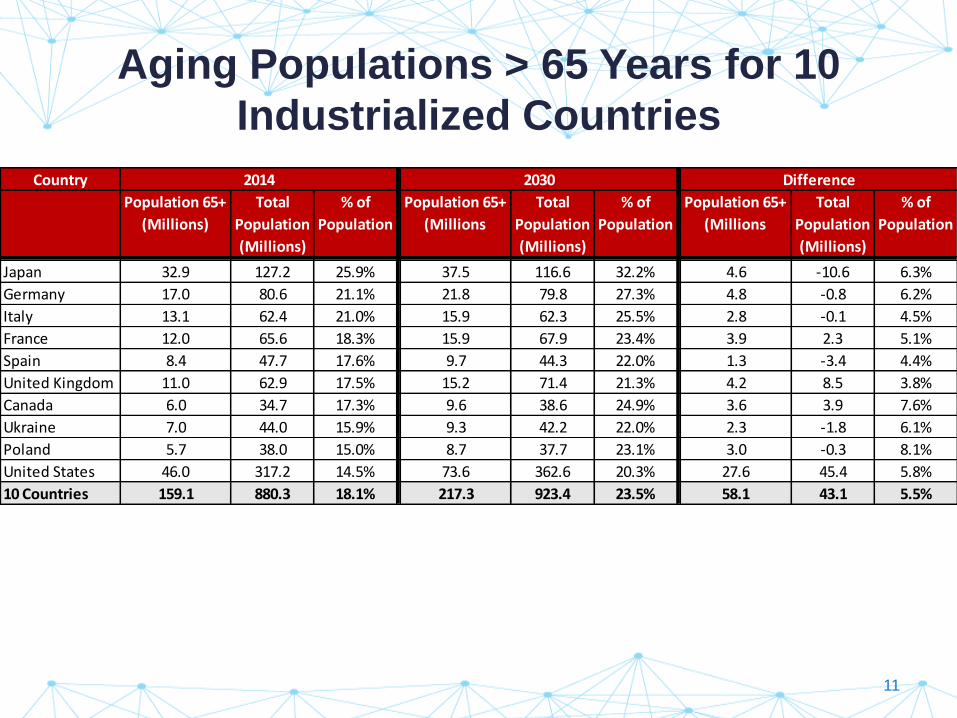
Aging Populations > 65 Years for 10
Industrialized Countries
Country
Population 65+
(Millions)
Total
Population
(Millions)
% of
Population
Population 65+
(Millions
Total
Population
(Millions)
% of
Population
Population 65+
(Millions
Total
Population
(Millions)
% of
Population
Japan 32.9 127.2 25.9% 37.5 116.6 32.2% 4.6 -10.6 6.3%
Germany 17.0 80.6 21.1% 21.8 79.8 27.3% 4.8 -0.8 6.2%
Italy 13.1 62.4 21.0% 15.9 62.3 25.5% 2.8 -0.1 4.5%
France 12.0 65.6 18.3% 15.9 67.9 23.4% 3.9 2.3 5.1%
Spain 8.4 47.7 17.6% 9.7 44.3 22.0% 1.3 -3.4 4.4%
United Kingdom 11.0 62.9 17.5% 15.2 71.4 21.3% 4.2 8.5 3.8%
Canada 6.0 34.7 17.3% 9.6 38.6 24.9% 3.6 3.9 7.6%
Ukraine 7.0 44.0 15.9% 9.3 42.2 22.0% 2.3 -1.8 6.1%
Poland 5.7 38.0 15.0% 8.7 37.7 23.1% 3.0 -0.3 8.1%
United States 46.0 317.2 14.5% 73.6 362.6 20.3% 27.6 45.4 5.8%
10 Countries 159.1 880.3 18.1% 217.3 923.4 23.5% 58.1 43.1 5.5%
2014 2030 Difference
11
What the Impact of Demographics Means
for America
• By 2030, we will experience a 5.4% labor pool reduction equivalent to approximately 20 million people
– In other words, relative to today’s workforce, the US will have 20
million less people to get the jobs done - a 5.4% reduction.
• It is highly likely that much of this labor reduction will come from blue collar logistics jobs as the forthcoming generation is more technology-literate.
• Further, we can expect these shortages to be pronounced in logistics centroids where blue collar labor is concentrated.
• This has massive implications on the workforce of tomorrow and provides a strong indicator that strong growth in distribution automation is inevitable.
12
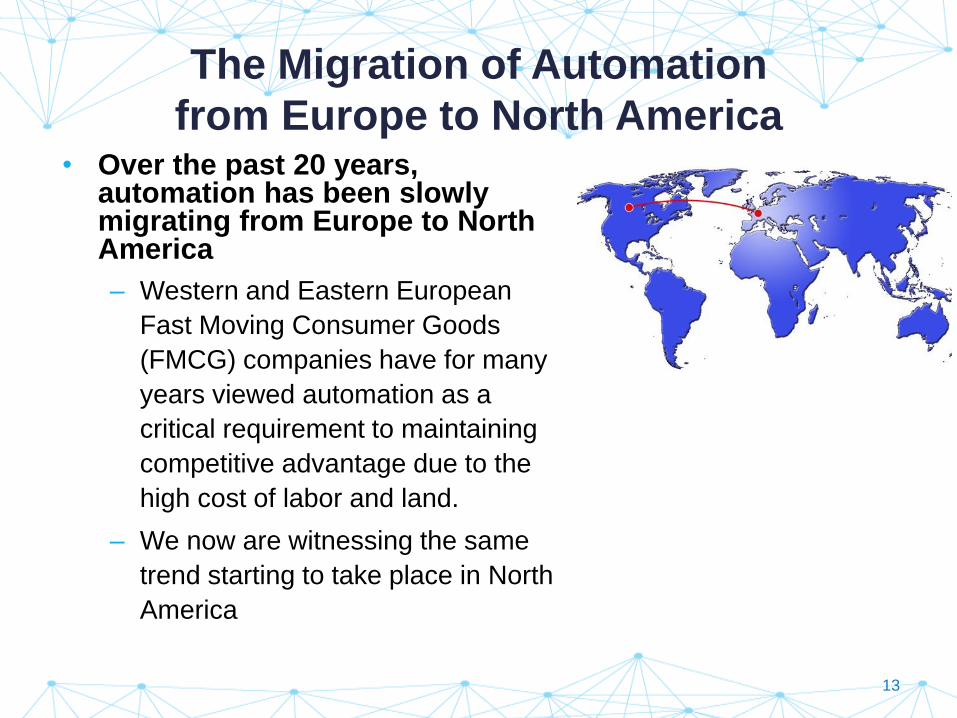
The Migration of Automation
from Europe to North America• Over the past 20 years,
automation has been slowly migrating from Europe to North America
– Western and Eastern European
Fast Moving Consumer Goods
(FMCG) companies have for many
years viewed automation as a
critical requirement to maintaining
competitive advantage due to the
high cost of labor and land.
– We now are witnessing the same
trend starting to take place in North
America
13
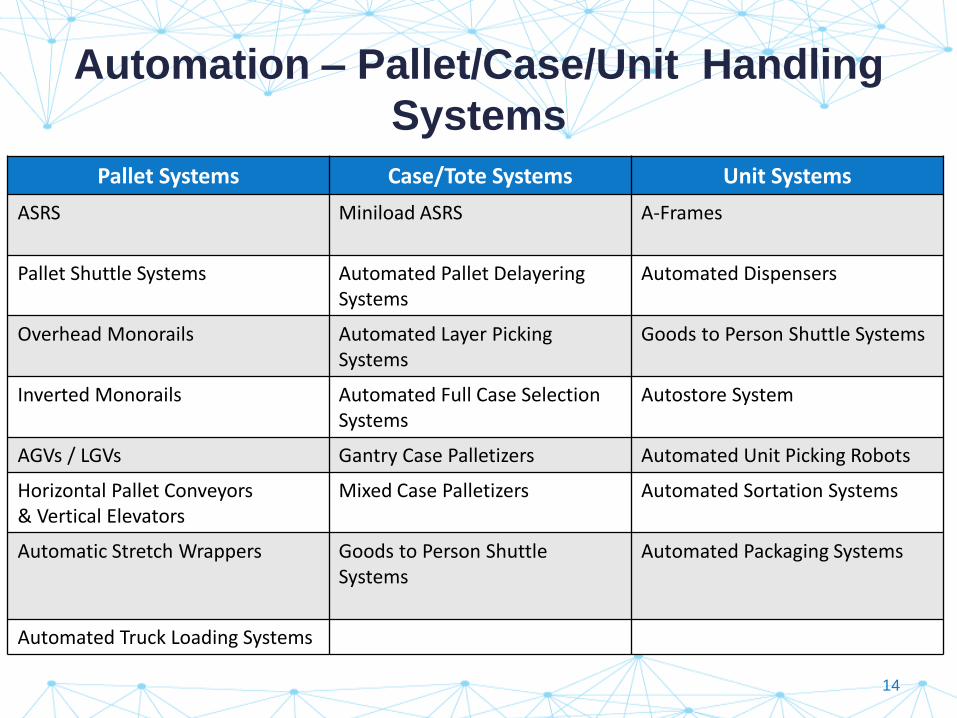
Automation – Pallet/Case/Unit Handling
Systems
Pallet Systems Case/Tote Systems Unit Systems
ASRS Miniload ASRS A-Frames
Pallet Shuttle Systems Automated Pallet Delayering Systems
Automated Dispensers
Overhead Monorails Automated Layer Picking Systems
Goods to Person Shuttle Systems
Inverted Monorails Automated Full Case Selection Systems
Autostore System
AGVs / LGVs Gantry Case Palletizers Automated Unit Picking Robots
Horizontal Pallet Conveyors& Vertical Elevators
Mixed Case Palletizers Automated Sortation Systems
Automatic Stretch Wrappers Goods to Person Shuttle Systems
Automated Packaging Systems
Automated Truck Loading Systems
14
North American Grocery Industry
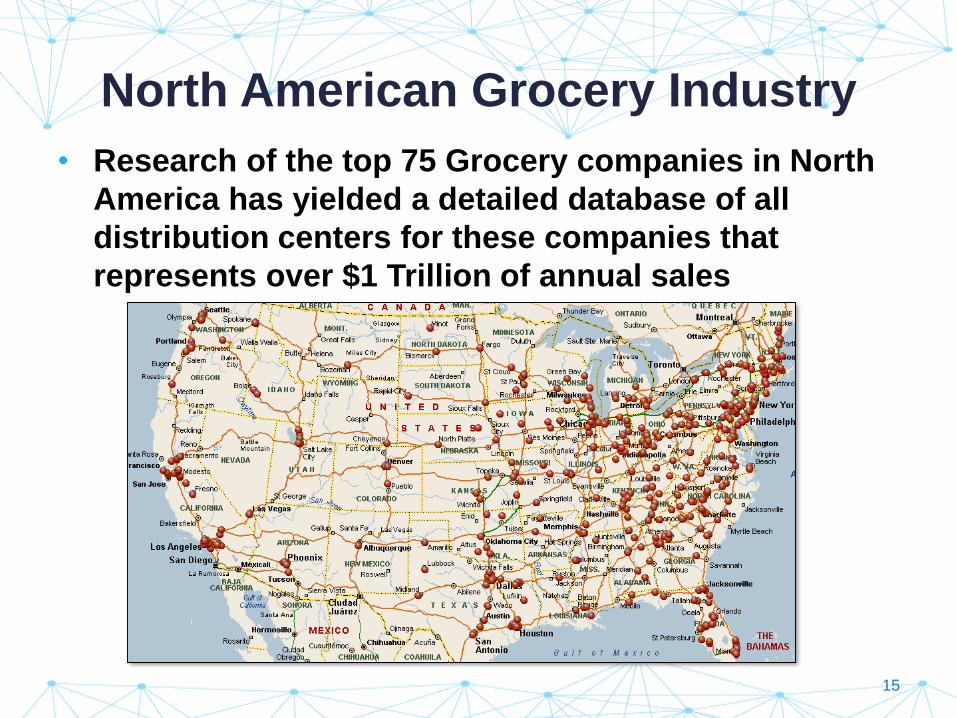
• Research of the top 75 Grocery companies in North
America has yielded a detailed database of all
distribution centers for these companies that
represents over $1 Trillion of annual sales
15
North American Grocery Industry
• The North American grocery industry has traditionally been slow to embrace automated material handling systems due to the industry’s slim net margins that are typically in the range of 2.0% or less.
• In the 1980s, the top 75 North American grocery companies were almost exclusively operating with conventional distribution centers. Early attempts at automation and mechanization were largely being dismantled because the costs to operate equipment were higher than using manual labor.
• Fast forward to 2016 and we see a noticeable change in adoption rate taking place in an industry that has traditionally been very conservative.
16
Use of DC Automation: Top 75 Grocery
Firms in North America
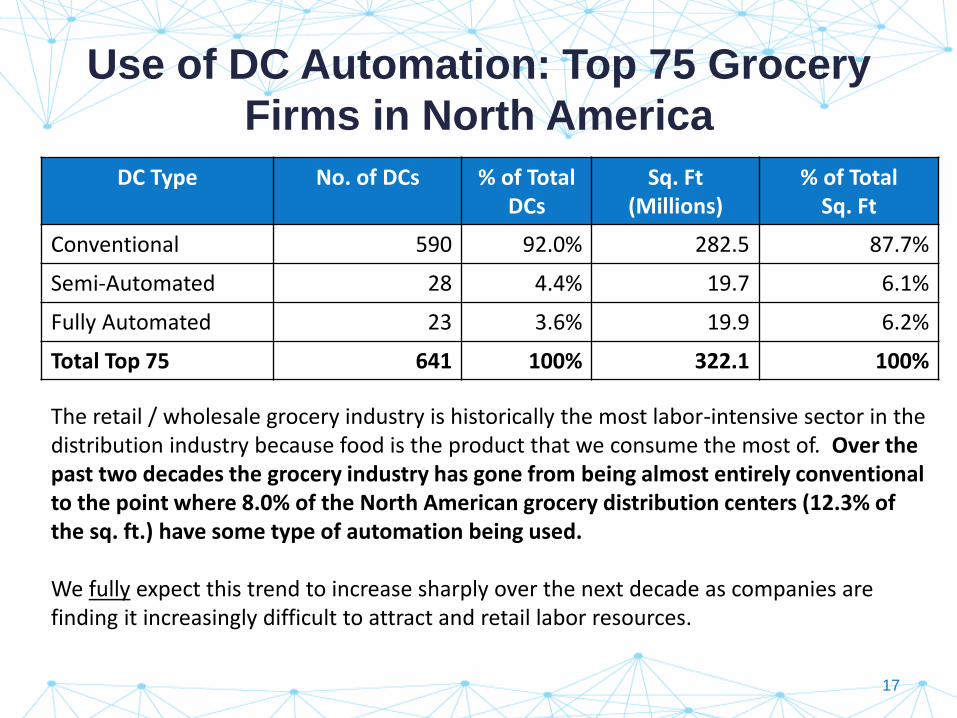
DC Type No. of DCs % of TotalDCs
Sq. Ft(Millions)
% of TotalSq. Ft
Conventional 590 92.0% 282.5 87.7%
Semi-Automated 28 4.4% 19.7 6.1%
Fully Automated 23 3.6% 19.9 6.2%
Total Top 75 641 100% 322.1 100%
The retail / wholesale grocery industry is historically the most labor-intensive sector in the distribution industry because food is the product that we consume the most of. Over the past two decades the grocery industry has gone from being almost entirely conventional to the point where 8.0% of the North American grocery distribution centers (12.3% of the sq. ft.) have some type of automation being used.
We fully expect this trend to increase sharply over the next decade as companies are finding it increasingly difficult to attract and retail labor resources.
17
The Rise of E-Commerce
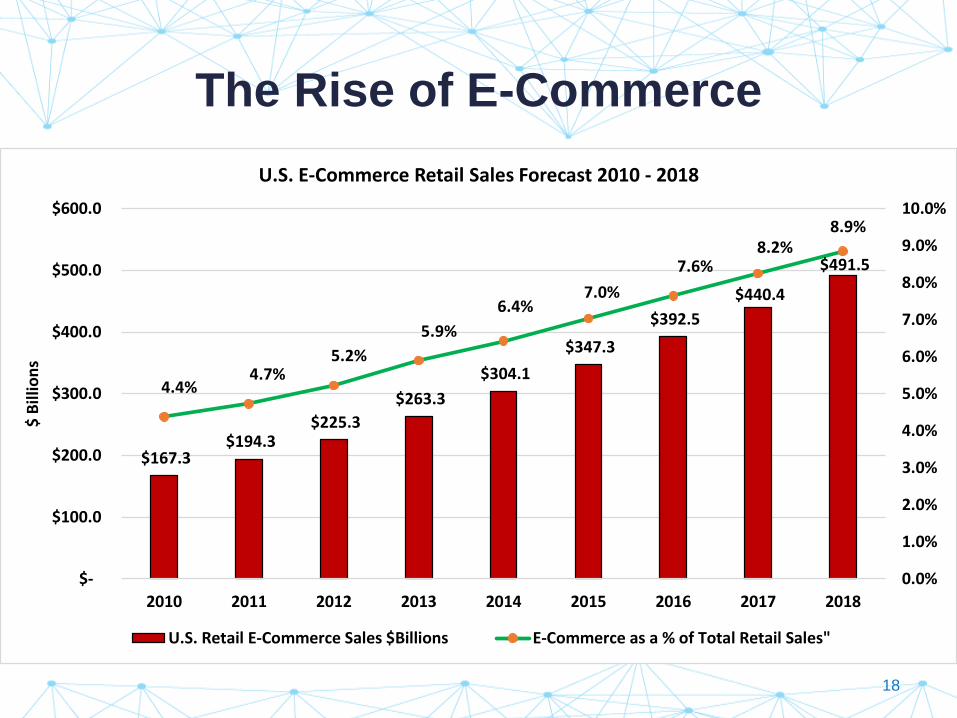
$167.3 $194.3
$225.3
$263.3
$304.1
$347.3
$392.5
$440.4
$491.5
4.4%4.7%
5.2%
5.9%
6.4%7.0%
7.6%8.2%
8.9%
0.0%
1.0%
2.0%
3.0%
4.0%
5.0%
6.0%
7.0%
8.0%
9.0%
10.0%
$-
$100.0
$200.0
$300.0
$400.0
$500.0
$600.0
2010 2011 2012 2013 2014 2015 2016 2017 2018
$ B
illio
ns
U.S. E-Commerce Retail Sales Forecast 2010 - 2018
U.S. Retail E-Commerce Sales $Billions E-Commerce as a % of Total Retail Sales"
18
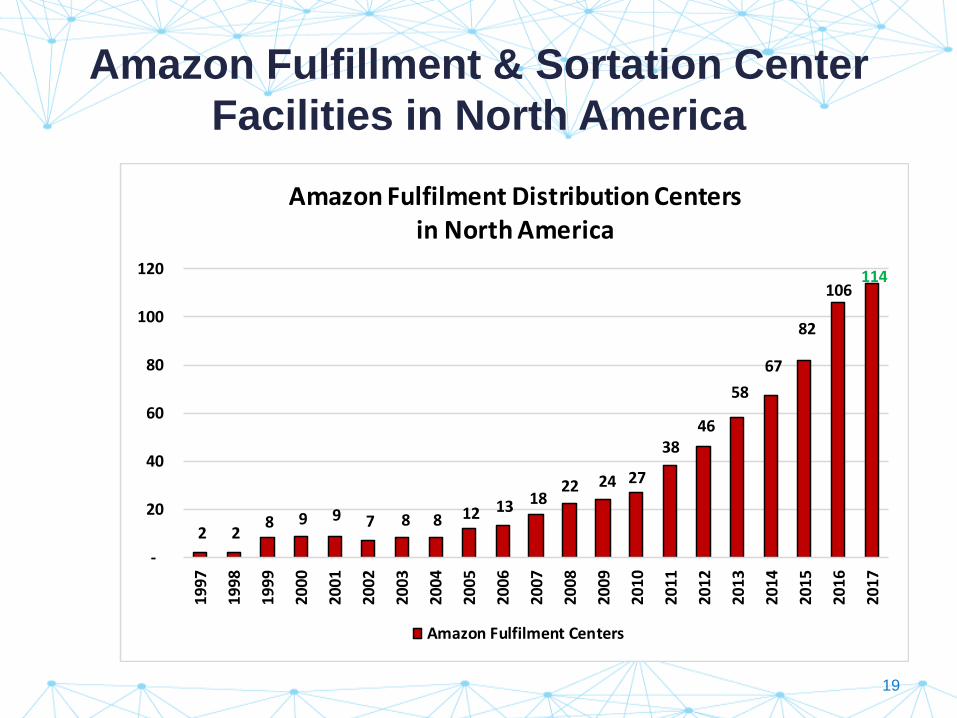
Amazon Fulfillment & Sortation Center
Facilities in North America
19
2 2 8 9 9 7 8 8 12 13 18
22 24 27
38 46
58
67
82
106 114
-
20
40
60
80
100
120
1997
1998
1999
2000
2001
2002
2003
2004
2005
2006
2007
2008
2009
2010
2011
2012
2013
2014
2015
2016
2017
Amazon Fulfilment Distribution Centers in North America
Amazon Fulfilment Centers
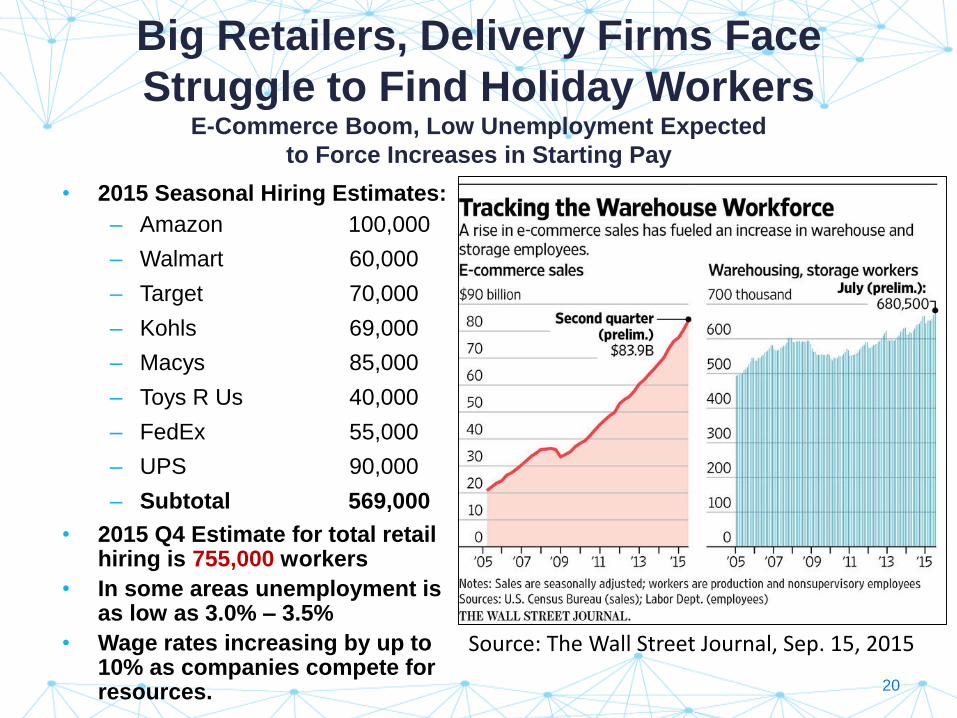
Big Retailers, Delivery Firms Face
Struggle to Find Holiday WorkersE-Commerce Boom, Low Unemployment Expected
to Force Increases in Starting Pay
• 2015 Seasonal Hiring Estimates:
– Amazon 100,000
– Walmart 60,000
– Target 70,000
– Kohls 69,000
– Macys 85,000
– Toys R Us 40,000
– FedEx 55,000
– UPS 90,000
– Subtotal 569,000
• 2015 Q4 Estimate for total retail hiring is 755,000 workers
• In some areas unemployment is as low as 3.0% – 3.5%
• Wage rates increasing by up to 10% as companies compete for resources.
Source: The Wall Street Journal, Sep. 15, 2015
20
Growth in E-Commerce is Driving Growth
in Automation
• Amazon is the driving force behind growth in the
e-commerce sector
• At least 40 of Amazon’s fulfillment centers in the
USA have 1,000+ people working inside the building
• Handling of retail units is extremely labor intensive
so as e-commerce grows the demand for more
warehouse and trucking labor will increase
disproportionately faster
• This trend will further increase the demand for
automation technologies
21
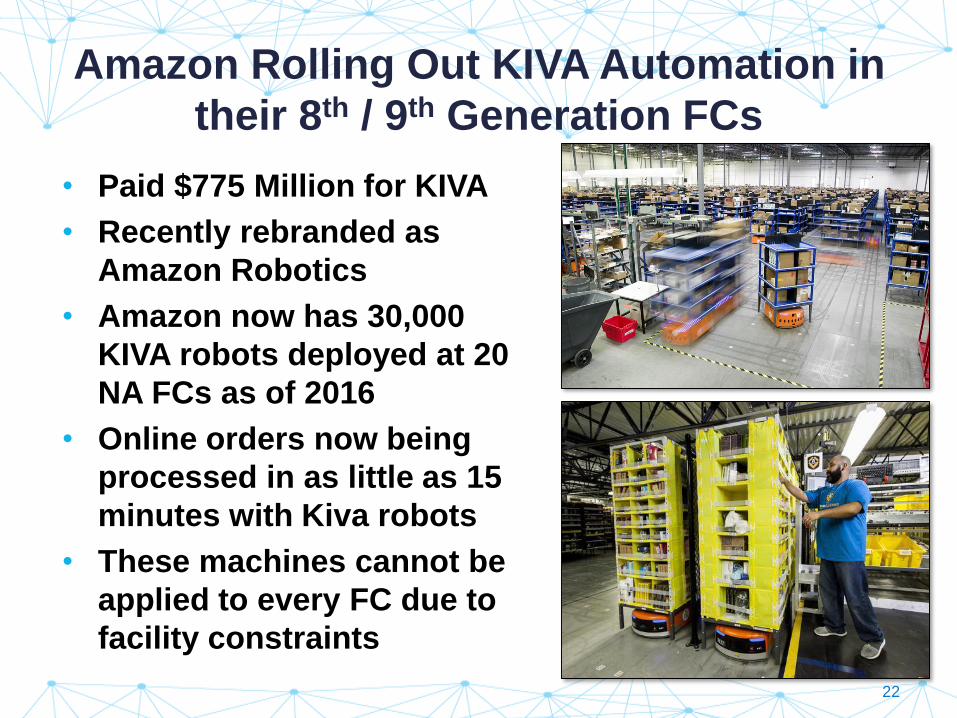
Amazon Rolling Out KIVA Automation in
their 8th / 9th Generation FCs
• Paid $775 Million for KIVA
• Recently rebranded as
Amazon Robotics
• Amazon now has 30,000
KIVA robots deployed at 20
NA FCs as of 2016
• Online orders now being
processed in as little as 15
minutes with Kiva robots
• These machines cannot be
applied to every FC due to
facility constraints
22
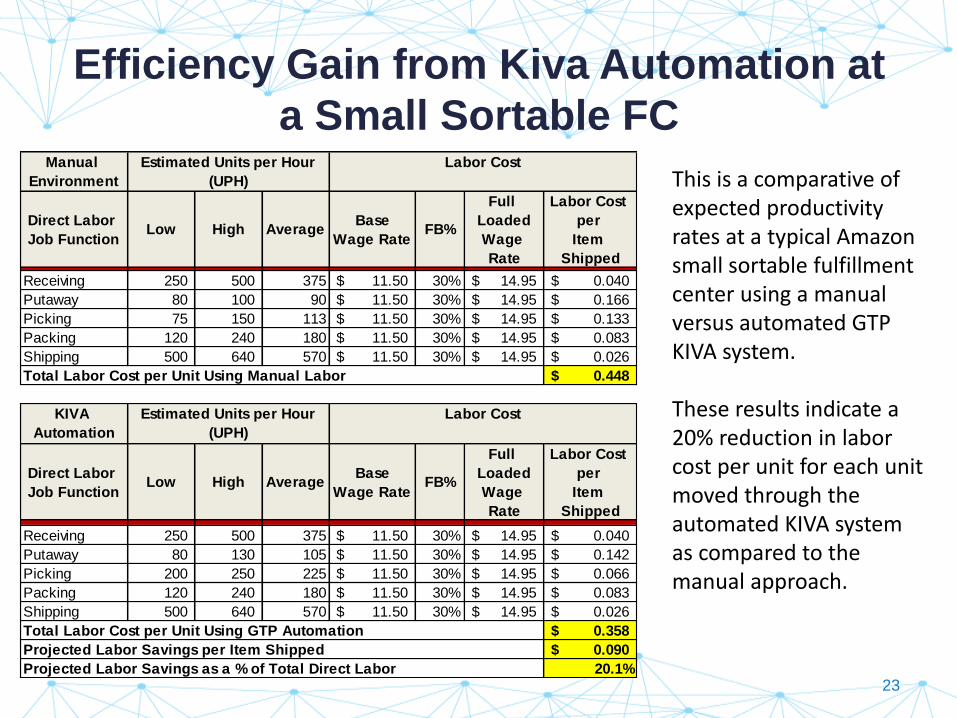
Efficiency Gain from Kiva Automation at
a Small Sortable FC
This is a comparative of expected productivity rates at a typical Amazon small sortable fulfillment center using a manual versus automated GTP KIVA system.
These results indicate a 20% reduction in labor cost per unit for each unit moved through the automated KIVA system as compared to the manual approach.
Manual
Environment
Direct Labor
Job FunctionLow High Average
Base
Wage RateFB%
Full
Loaded
Wage
Rate
Labor Cost
per
Item
Shipped
Receiving 250 500 375 11.50$ 30% 14.95$ 0.040$
Putaway 80 100 90 11.50$ 30% 14.95$ 0.166$
Picking 75 150 113 11.50$ 30% 14.95$ 0.133$
Packing 120 240 180 11.50$ 30% 14.95$ 0.083$
Shipping 500 640 570 11.50$ 30% 14.95$ 0.026$
0.448$
KIVA
Automation
Direct Labor
Job FunctionLow High Average
Base
Wage RateFB%
Full
Loaded
Wage
Rate
Labor Cost
per
Item
Shipped
Receiving 250 500 375 11.50$ 30% 14.95$ 0.040$
Putaway 80 130 105 11.50$ 30% 14.95$ 0.142$
Picking 200 250 225 11.50$ 30% 14.95$ 0.066$
Packing 120 240 180 11.50$ 30% 14.95$ 0.083$
Shipping 500 640 570 11.50$ 30% 14.95$ 0.026$
0.358$
0.090$
20.1%
Total Labor Cost per Unit Using GTP Automation
Projected Labor Savings per Item Shipped
Projected Labor Savings as a % of Total Direct Labor
Estimated Units per Hour
(UPH)
Labor Cost
Total Labor Cost per Unit Using Manual Labor
Estimated Units per Hour
(UPH)
Labor Cost
23
Concluding Thoughts
• More than ever before, companies are investing
capital into automated material handling for reasons
other than pure ROI. This is a strong departure from
traditional behavior which is driven by:
– Strong impetus to be technologically advanced as a
competitive advantage
– Need to handle future throughput and growth with less
reliance on human labor
– Desire to stay ahead of the market and be in a position of
strength as the pending labor pool shortage becomes an
increasing issue for North American companies,
particularly in the logistics industry.
24

ROI Panel Discussion
25
Key Takeaways
26
• North American companies are already having a tough time attracting and retaining people to work for their logistics and distribution operations.
• The North American labor shortage issue is starting to impact distributors and retailers.
• Growth in e-commerce is adding fuel to the fire.
• North America is starting to look like Europe 20 years ago when automation started to become the ‘norm’.
• Changing demographics will drive major growth in the North American automated material handling industry and the automation of unit/piece handling will be in significant demand due as companies look for ways to reduce their reliance on labor, particularly in the retail e-commerce sector.

Conference Cloud
27
• Get from RICH
RODGERS
Additional Resources

Questions?


![[INFOGRAPHIC] ROI](https://img.pdfslide.us/doc/110x75/5400af278d7f728b408b49aa/infographic-roi.jpg)