Embed Size (px)
Citation preview
Practical Lessons from 20 Years of Bubble Experiments
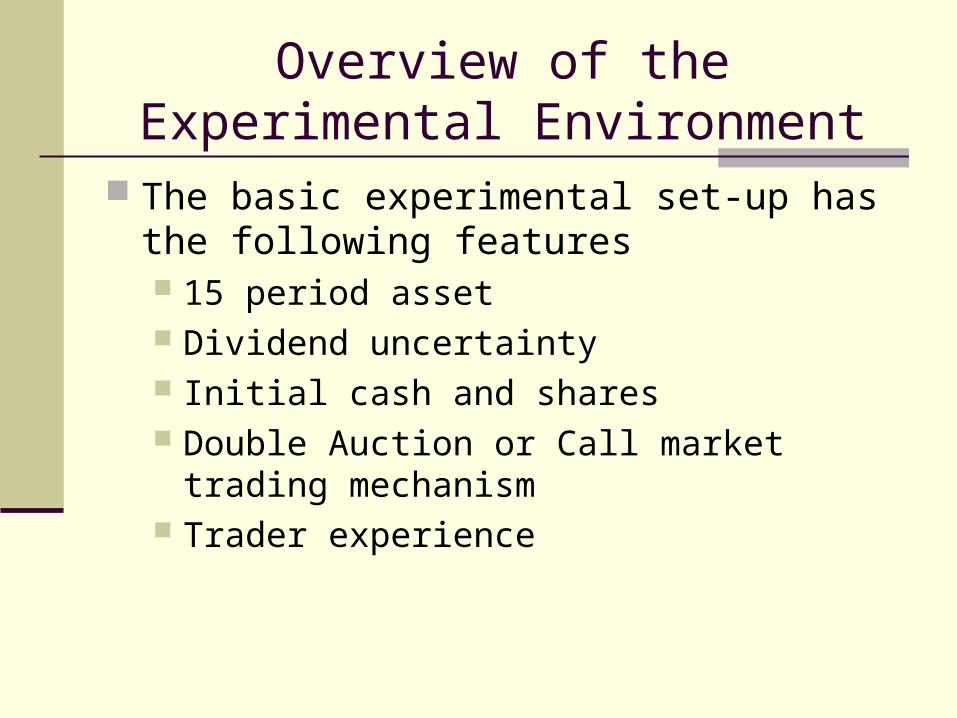
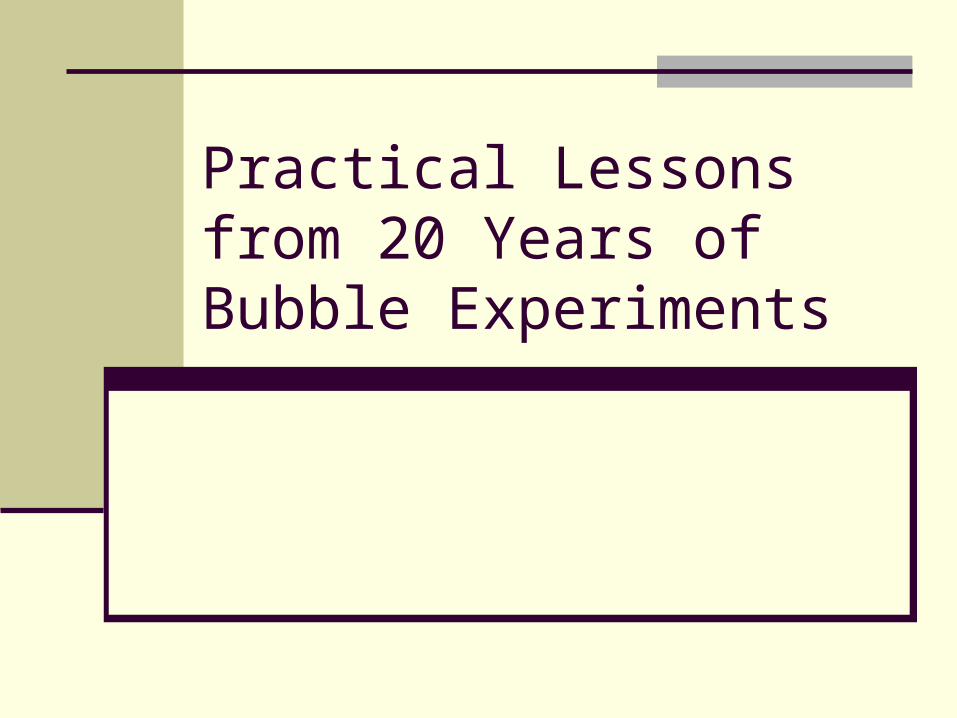
Overview of the Experimental Environment
The basic experimental set-up has the following features 15 period asset Dividend uncertainty Initial cash and shares Double Auction or Call market trading
mechanism Trader experience
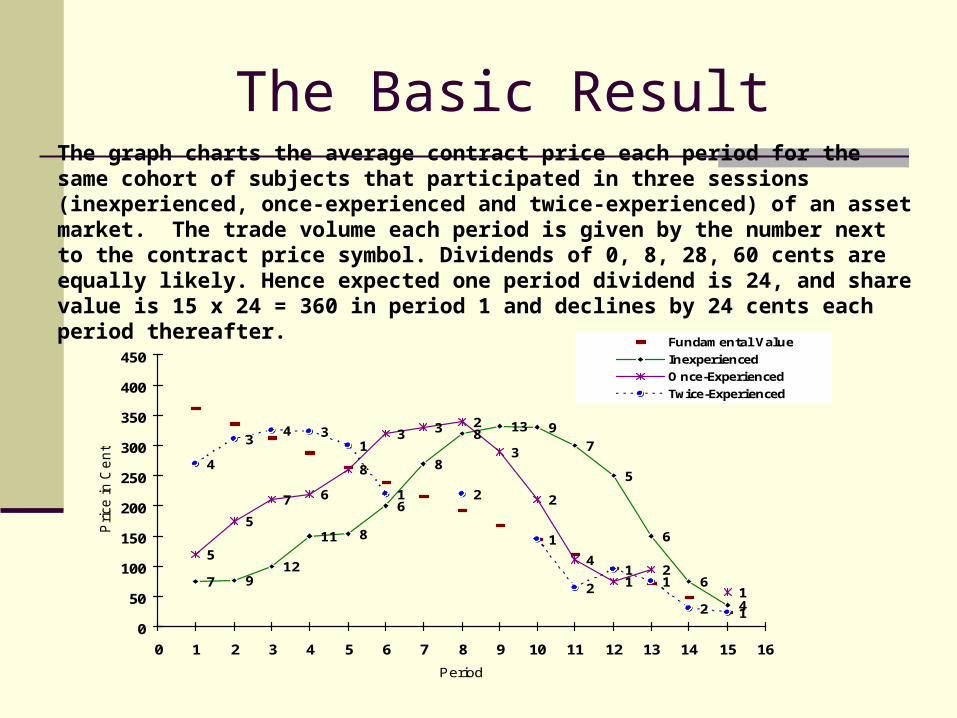
The Basic ResultThe graph charts the average contract price each period for the same cohort of subjects that participated in three sessions (inexperienced, once-experienced and twice-experienced) of an asset market. The trade volume each period is given by the number next to the contract price symbol. Dividends of 0, 8, 28, 60 cents are equally likely. Hence expected one period dividend is 24, and share value is 15 x 24 = 360 in period 1 and declines by 24 cents each period thereafter.
6
8
813 9
7
5
6
6
4
7 912
11 8
2
11
4
2
3
233
8
67
5
5
4
34 3
1
1 2
1
2
11
2 10
50
100
150
200
250
300
350
400
450
0 1 2 3 4 5 6 7 8 9 10 11 12 13 14 15 16
Period
Pri
ce
in
Ce
nts
Fundamental Value
Inexperienced
O nce-Experienced
Twice-Experienced

What Might be Causing This?
The subject pool is not representative
Period
Pric
e i
n C
en
ts
0
50
100
150
200
250
300
350
400
450
0 1 2 3 4 5 6 7 8 9 10 11 12 13 14 15
8
8
7
2
3
7
3
4
6
25
8
138
9
Figure 6. Mean Contract Price and Volume, Arizona Executives
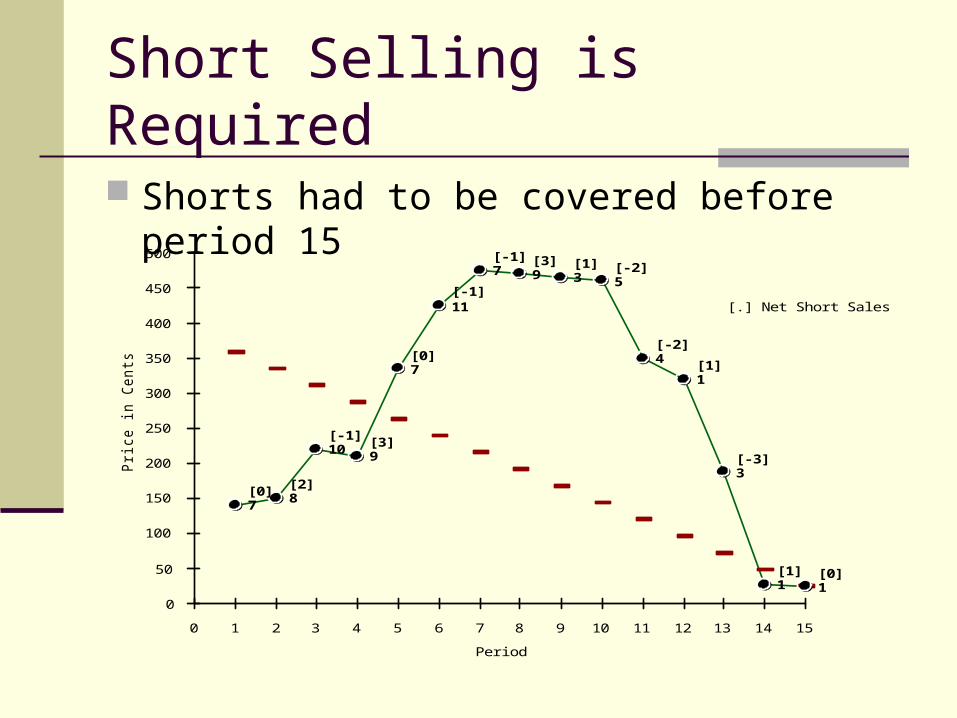
Short Selling is Required
Shorts had to be covered before period 15
Period
Pri
ce
in
Ce
nts
0
50
100
150
200
250
300
350
400
450
500
0 1 2 3 4 5 6 7 8 9 10 11 12 13 14 15
11
7 9 3 5
4
1
3
1 1
7 8
10 9
7
[0] [2]
[-1] [3]
[0]
[-1]
[-1] [3] [1] [-2]
[-2]
[1]
[-3]
[1] [0]
[.] Net Short Sales

Insiders Will Take Hold
Experienced traders – grad students
Period
Pri
ce
in
Ce
nts
0
50
100
150
200
250
300
350
400
450
0 1 2 3 4 5 6 7 8 9 10 11 12 13 14 15
23
3 33 2
2 4
4
62
3
6 2
[4][0]
[-1]
[-4] [-1] [-1][-1]
[0] [-2][0] [-1]
[-1] [-1]
[1]
[.] Net Purchases byInsiders
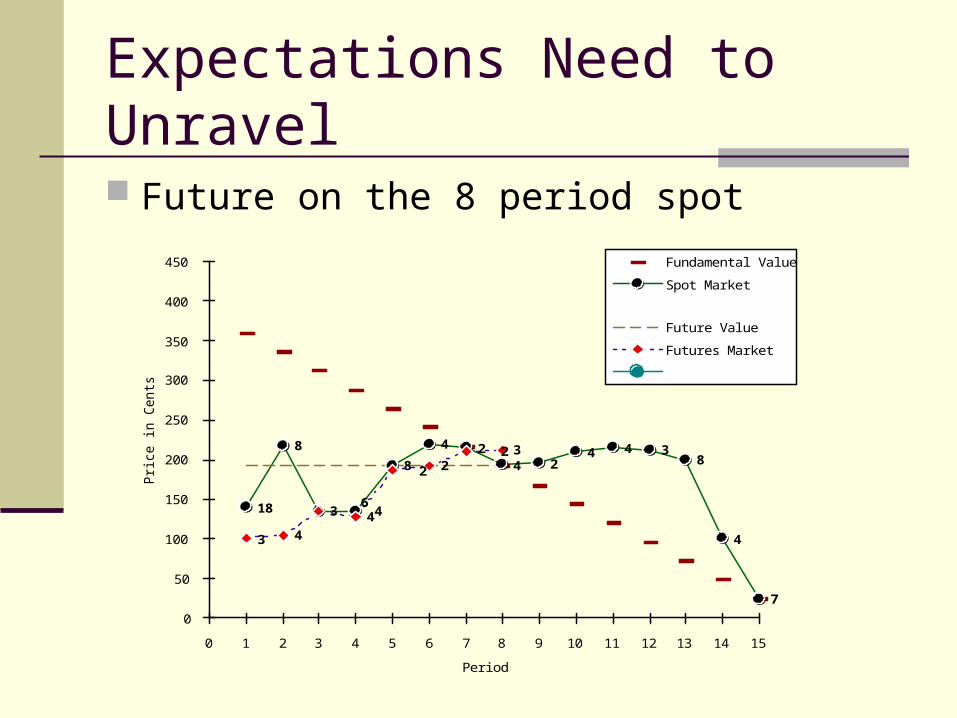
Expectations Need to Unravel
Future on the 8 period spot
Period
Pri
ce
in
Ce
nts
0
50
100
150
200
250
300
350
400
450
0 1 2 3 4 5 6 7 8 9 10 11 12 13 14 15
4 24 2
4 4 38
4
7
18
8
6 4
8 2
3 44
2 23
3
Fundamental Value
Spot Market
Future Value
Futures Market
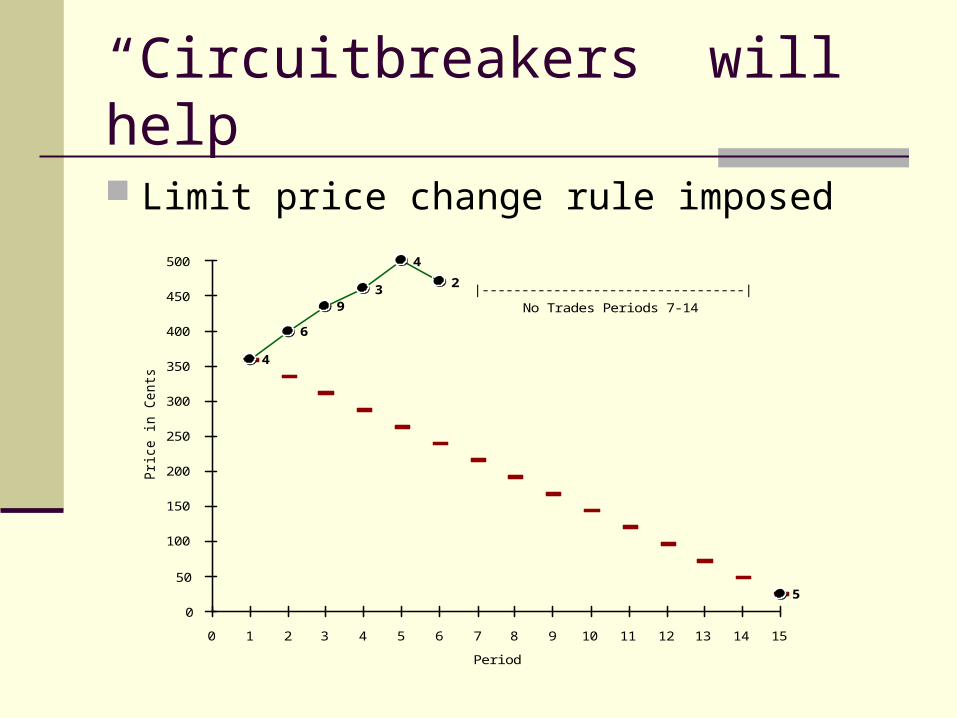
“Circuitbreakers” will help
Limit price change rule imposed
Period
Pri
ce
in
Ce
nts
0
50
100
150
200
250
300
350
400
450
500
0 1 2 3 4 5 6 7 8 9 10 11 12 13 14 15
2
5
4
6
93
4
|---------------------------------|No Trades Periods 7-14
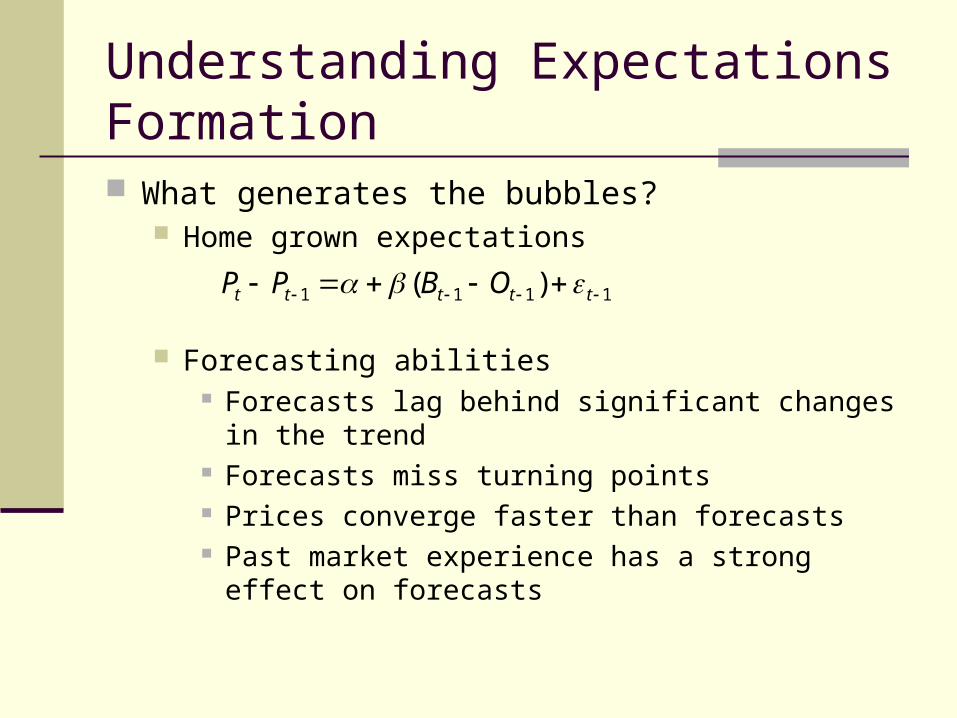
Understanding Expectations Formation What generates the bubbles?
Home grown expectations
Forecasting abilities Forecasts lag behind significant changes in the trend Forecasts miss turning points Prices converge faster than forecasts Past market experience has a strong effect on
forecasts
1111 )( ttttt OBPP
Momentum Trading
Trade is influenced by price changes. Positive changes brings in more buy orders
and pushes prices up This continues until the momentum traders
become cash constrained and then fundamentals push prices down
Momentum traders then sell-off causing the violent crash
Implications from Momentum
At the initial throws of price increase, the further price is from fundamentals the larger the bubble will be
Cash to Asset Value is crucial to the bubble size and path The higher the cash infusion the bigger the
bubble
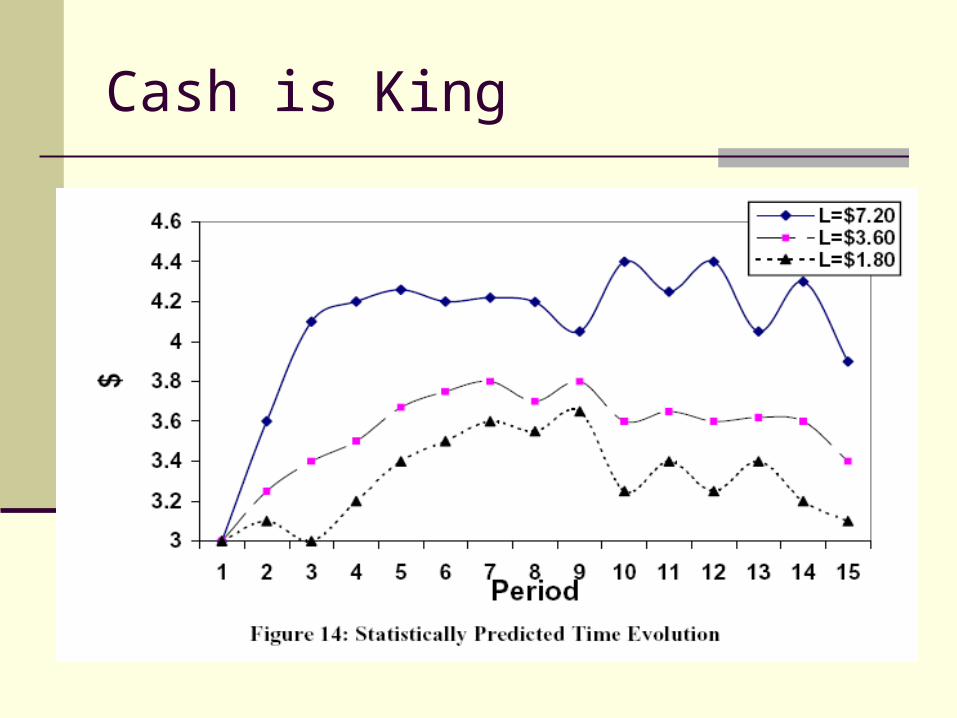
Cash is King
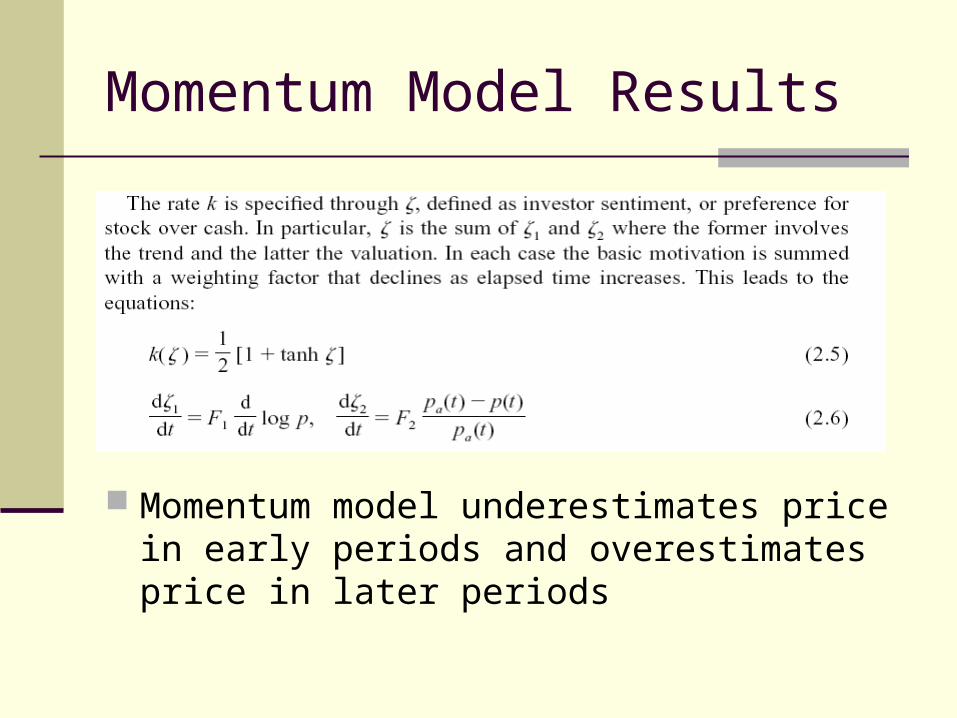
Momentum Model Results
Momentum model underestimates price in early periods and overestimates price in later periods
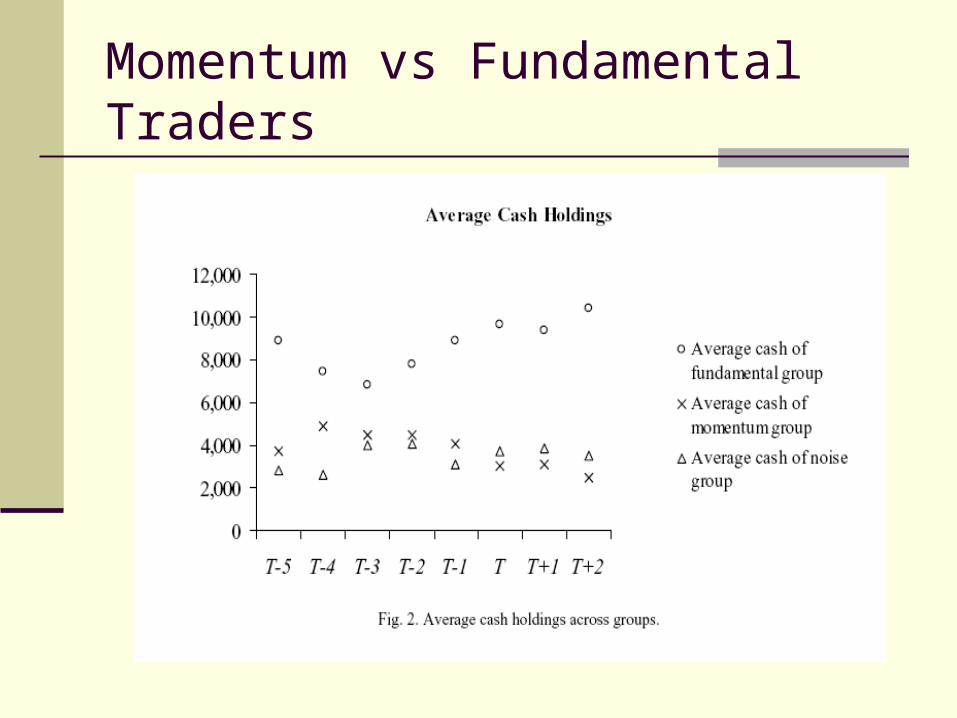
Momentum vs Fundamental Traders
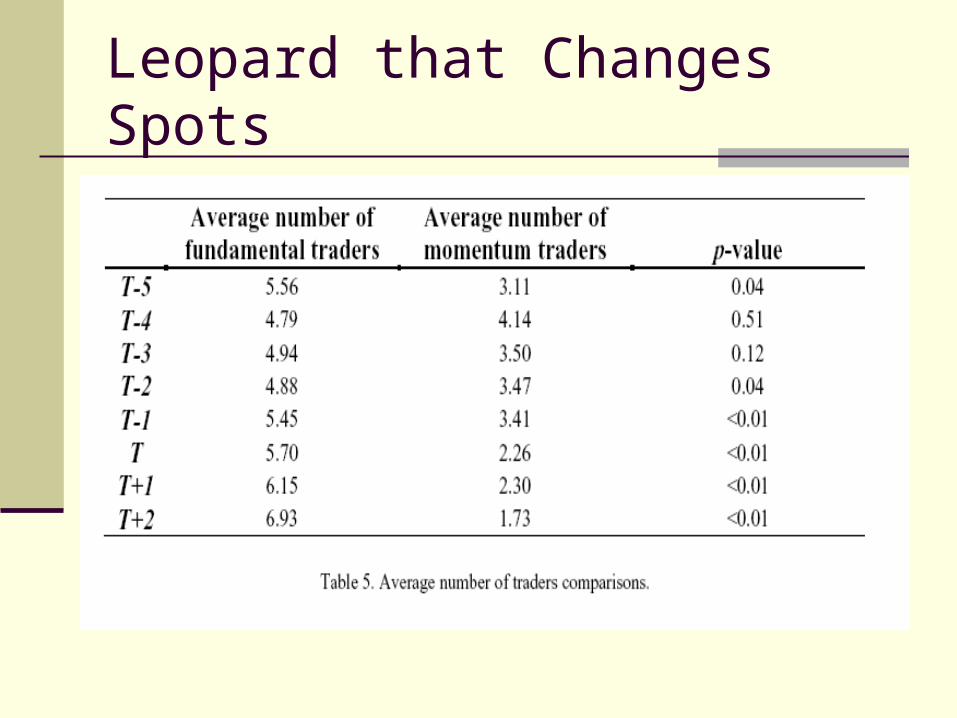
Leopard that Changes Spots
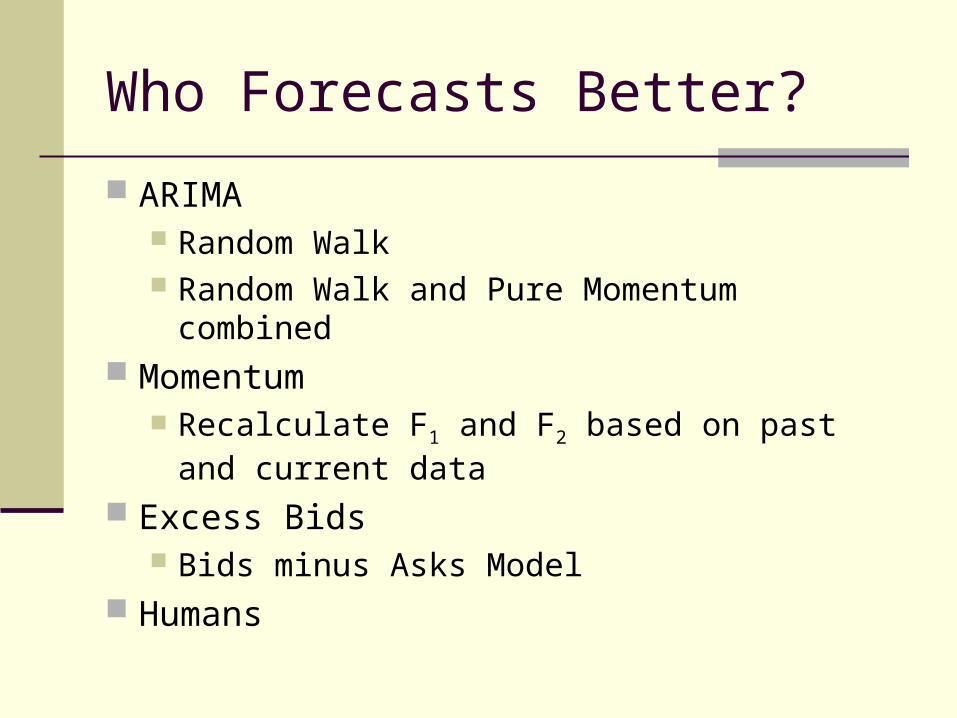
Who Forecasts Better?
ARIMA Random Walk Random Walk and Pure Momentum combined
Momentum Recalculate F1 and F2 based on past and
current data Excess Bids
Bids minus Asks Model Humans
Predictors Battle Royal
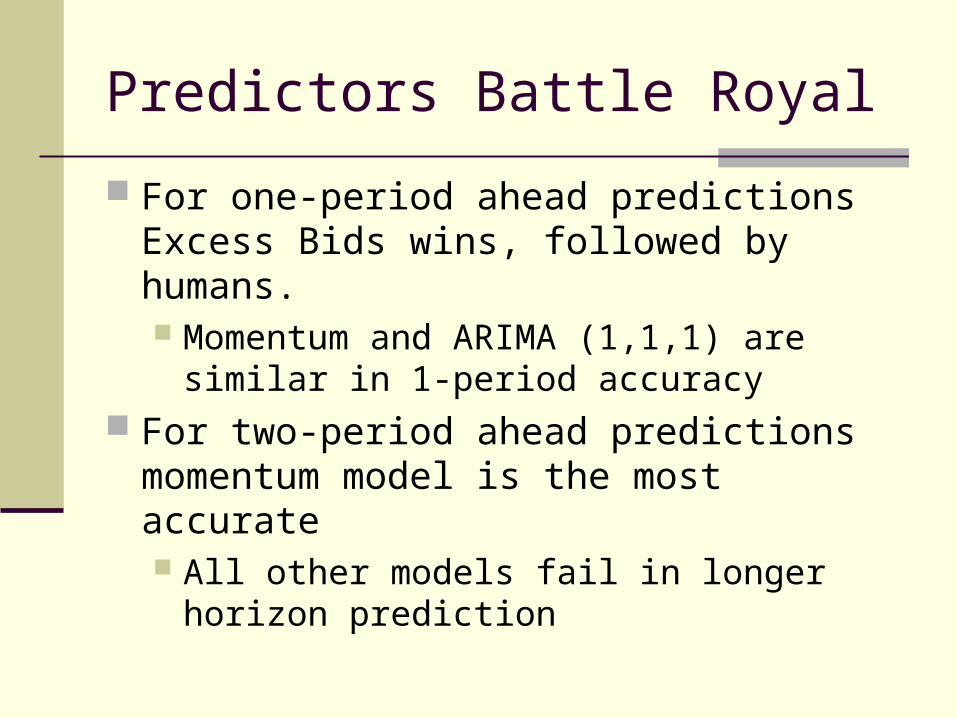
For one-period ahead predictions Excess Bids wins, followed by humans. Momentum and ARIMA (1,1,1) are similar in 1-
period accuracy For two-period ahead predictions momentum
model is the most accurate All other models fail in longer horizon
prediction
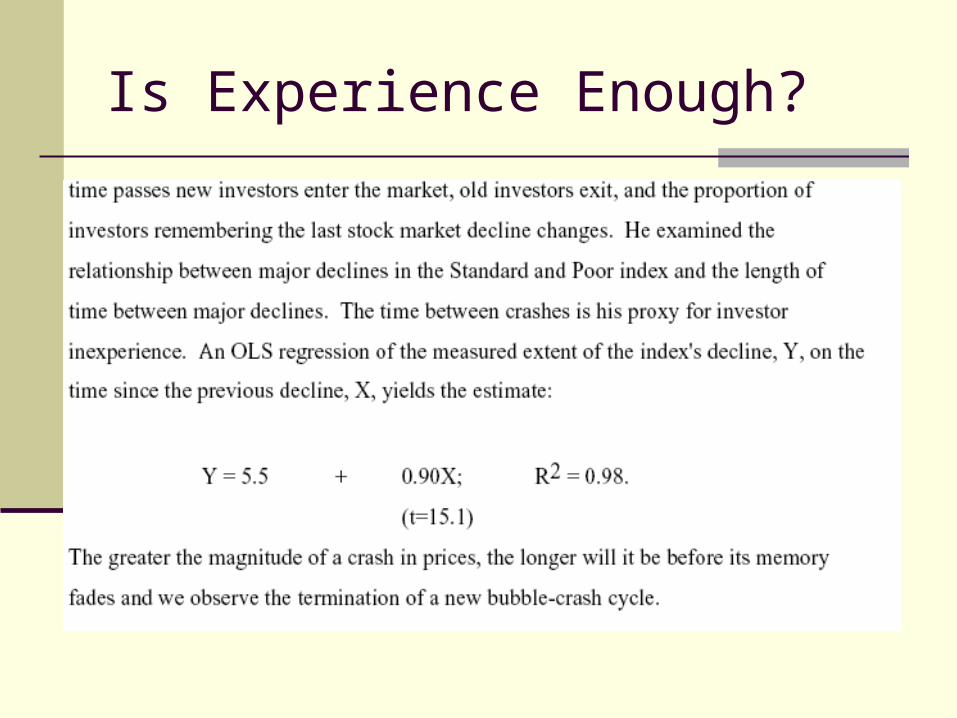
Is Experience Enough?
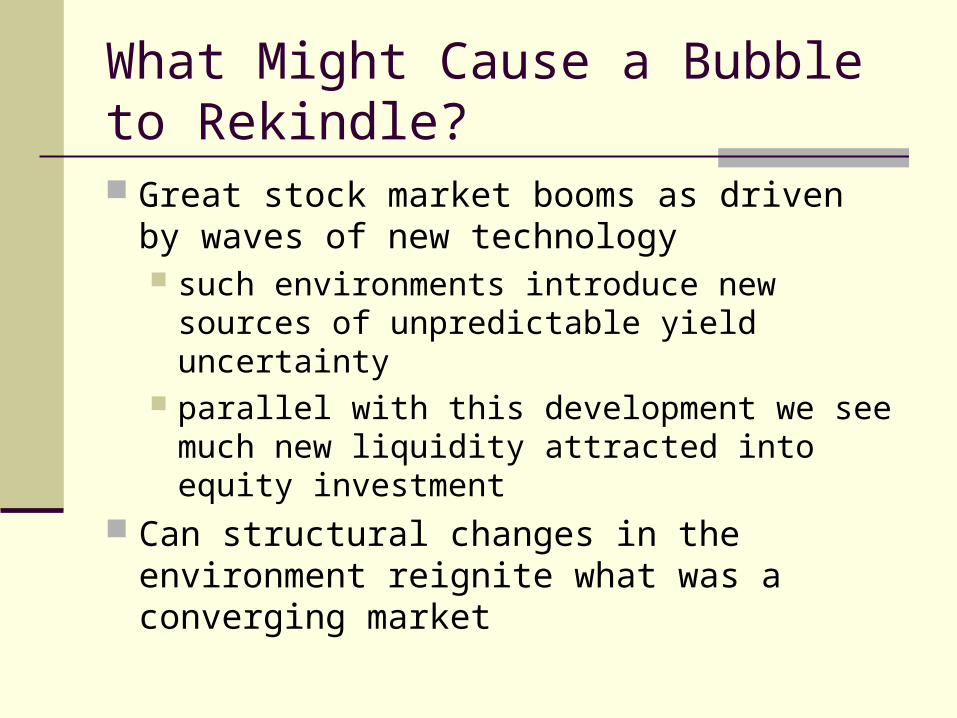
What Might Cause a Bubble to Rekindle? Great stock market booms as driven by
waves of new technology such environments introduce new sources of
unpredictable yield uncertainty parallel with this development we see much
new liquidity attracted into equity investment Can structural changes in the environment
reignite what was a converging market
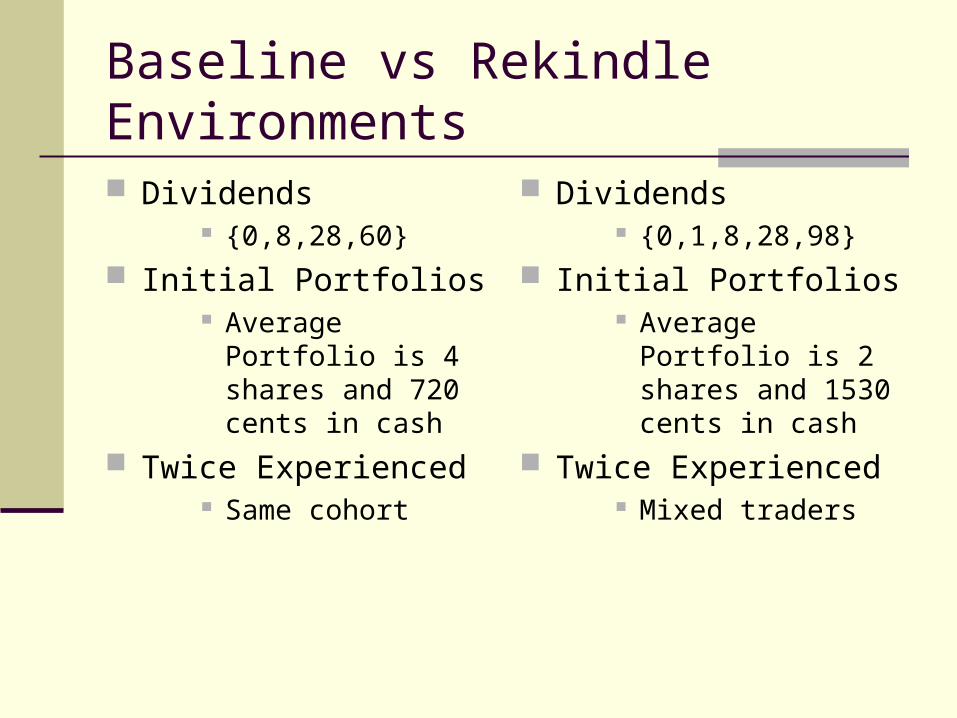
Baseline vs Rekindle Environments
Dividends {0,8,28,60}
Initial Portfolios Average Portfolio is
4 shares and 720 cents in cash
Twice Experienced Same cohort
Dividends {0,1,8,28,98}
Initial Portfolios Average Portfolio is
2 shares and 1530 cents in cash
Twice Experienced Mixed traders
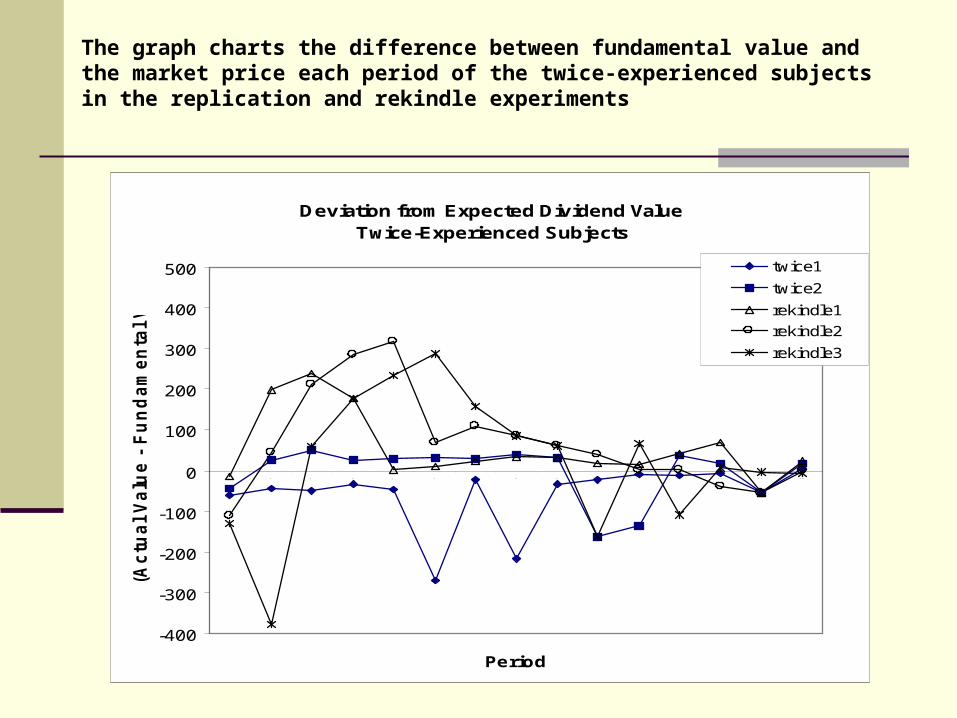
The graph charts the difference between fundamental value and the market price each period of the twice-experienced subjects in the replication and rekindle experiments
Deviation from Expected Dividend ValueTwice-Experienced Subjects
-400
-300
-200
-100
0
100
200
300
400
500
1 2 3 4 5 6 7 8 9 1 0 1 1 1 2 1 3 1 4 1 5
Period
(Ac
tua
l V
alu
e -
Fu
nd
am
en
tal
Va
lue
) twice1
twice2
rekindle1
rekindle2
rekindle3
Do Speculative Stocks Influence Value Stock Behavior? An overreaction in the speculative stock tends to
divert investment capital away from value stocks Trading prices of value stocks are generally lower
and more volatile when one of the assets is a speculative stock.
In addition, the temporal minimum price of the value stock during the last phase of the experiment is lower in the presence of the speculative stock (when the trading price of the speculative asset is declining sharply). suggesting that the psychological impact of rapidly falling
prices in the speculative asset lead to more conservative bidding and aggressive selling of the value asset, even though the latter does not suffer negative earnings updates during this period (affect heuristic).
Overreaction and Information
Groups with disparate beliefs about the fundamentals of a stock
Each group has information that the asset will be worth either 10 or 100
Group 1 has information that leads to a 25% chance of 10 and a 75% chance that it is 100
Group 1 has information that leads to a 75% chance of 10 and a 25% chance that it is 100
Trading continues with this information for 10 minutes New information is revealed to one for the gropus that
aligns with the other group For example, Group 1 is told there is new information that
determines that there is a 75% chance of 10 and a 25% chance that it is 100
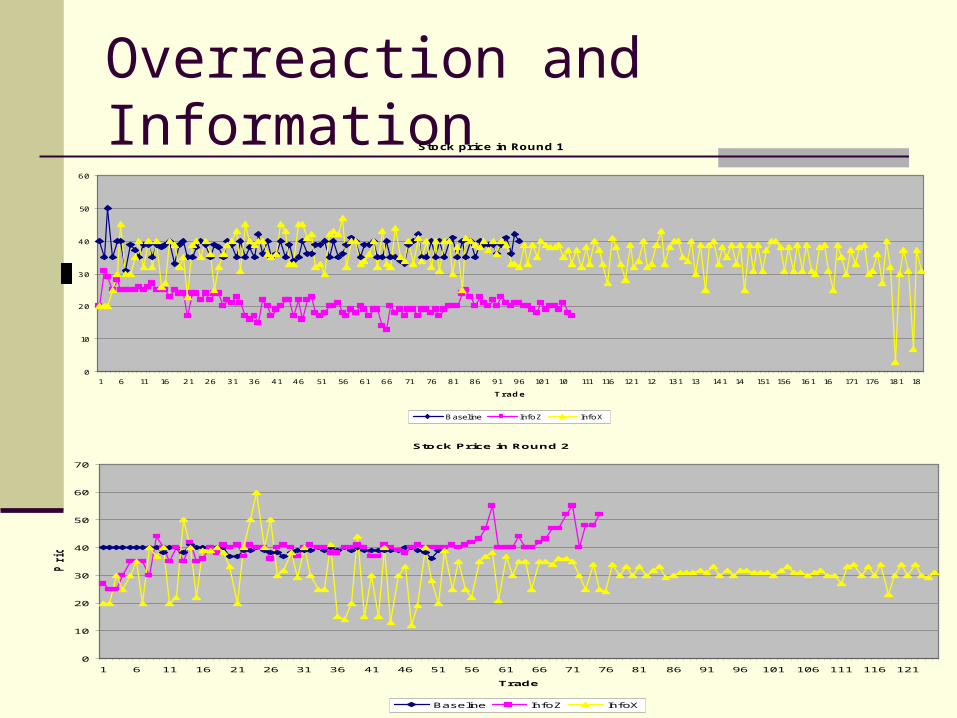
Overreaction and InformationStock price in Round 1
0
10
20
30
40
50
60
1 6 11 16 21 26 31 36 41 46 51 56 61 66 71 76 81 86 91 96 101 10 111 116 121 12 131 13 141 14 151 156 161 16 171 176 181 18
Trade
Baseline InfoZ InfoX
Stock Price in Round 2
0
10
20
30
40
50
60
70
1 6 11 16 21 26 31 36 41 46 51 56 61 66 71 76 81 86 91 96 101 106 111 116 121
Trade
Pric
e
Baseline InfoZ InfoX
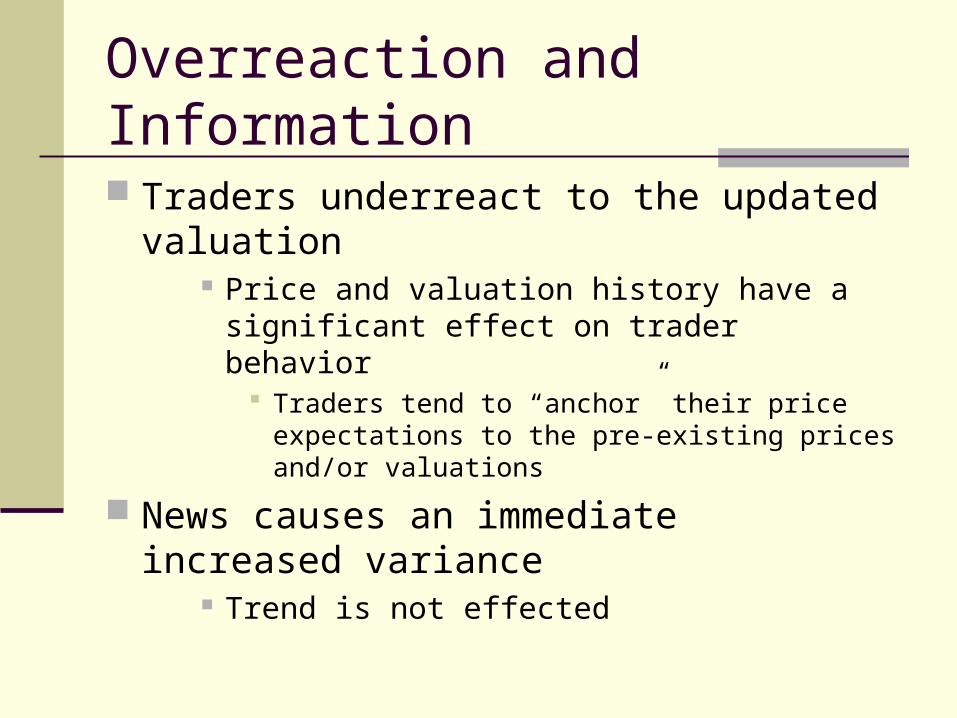
Overreaction and Information
Traders underreact to the updated valuation Price and valuation history have a significant
effect on trader behavior Traders tend to “anchor” their price expectations to
the pre-existing prices and/or valuations
News causes an immediate increased variance
Trend is not effected
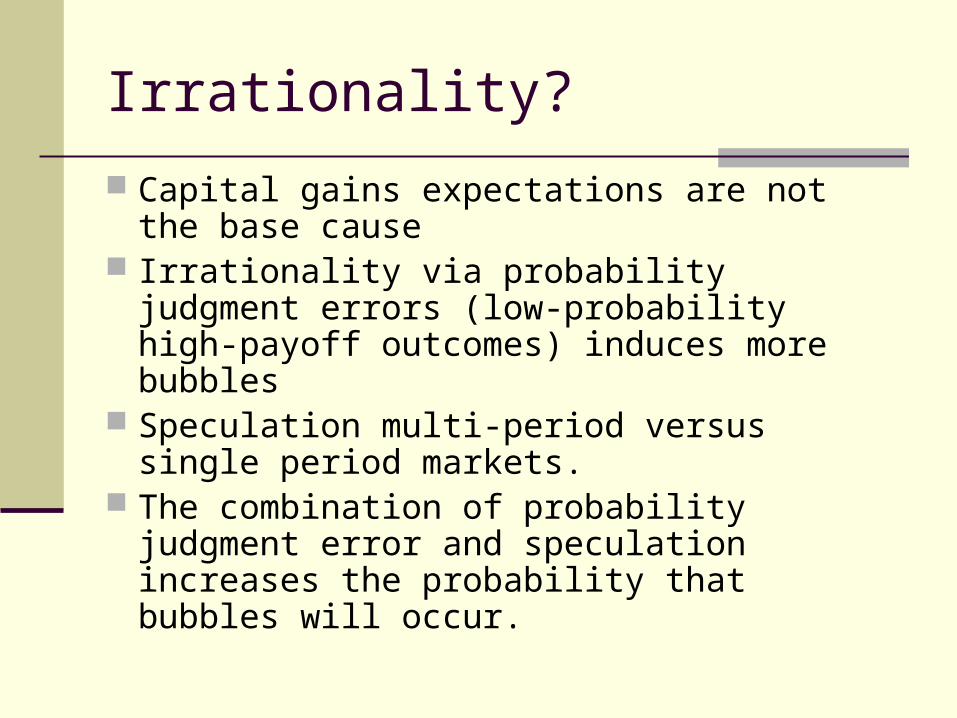
Irrationality?
Capital gains expectations are not the base cause
Irrationality via probability judgment errors (low-probability high-payoff outcomes) induces more bubbles
Speculation multi-period versus single period markets.
The combination of probability judgment error and speculation increases the probability that bubbles will occur.
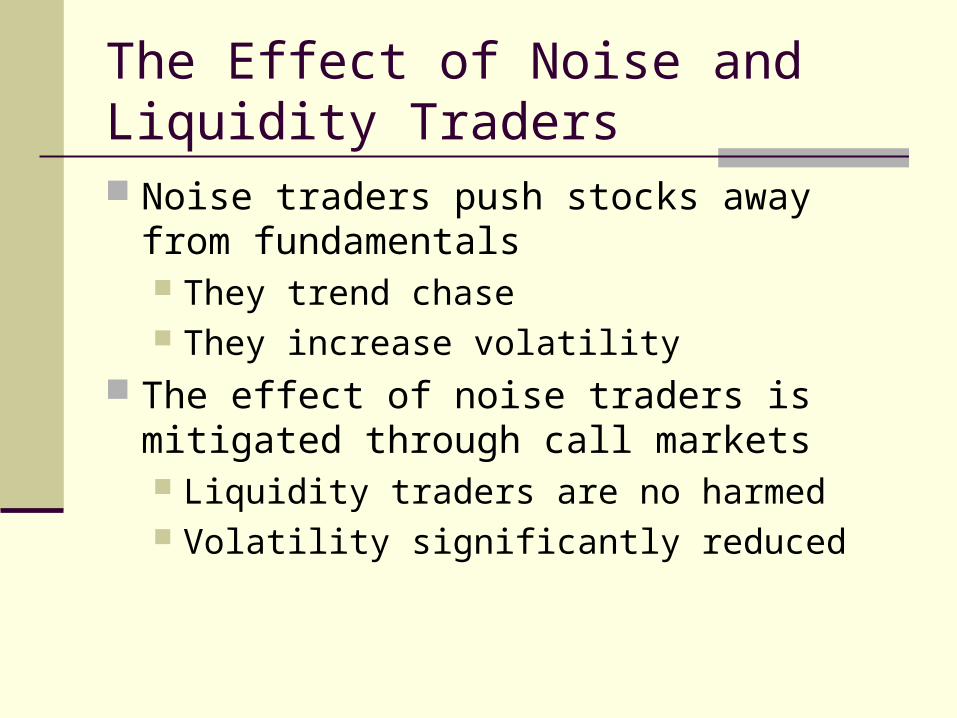
The Effect of Noise and Liquidity Traders Noise traders push stocks away from
fundamentals They trend chase They increase volatility
The effect of noise traders is mitigated through call markets Liquidity traders are no harmed Volatility significantly reduced
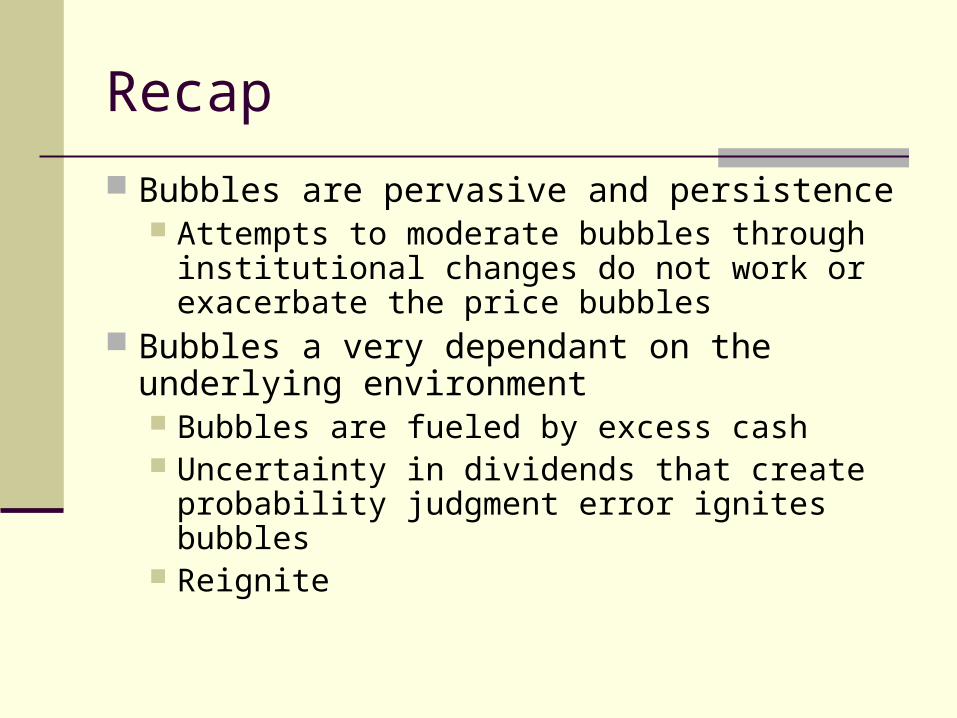
Recap
Bubbles are pervasive and persistence Attempts to moderate bubbles through
institutional changes do not work or exacerbate the price bubbles
Bubbles a very dependant on the underlying environment Bubbles are fueled by excess cash Uncertainty in dividends that create probability
judgment error ignites bubbles Reignite
Recap
Timing the market from all of the tested models is not possible Chasing the market can leave you holding the
bag Forecasts lag the market and miss turning
points The combination of probability judgment error
and speculation increases the probability that bubbles will occur.
Recap
There are spillovers from speculation in one stock to another Volatility begets volatility Crash in one market can have a affect
heuristic in another There is an underreaction to expectations
alignment Traders anchor on the price trend
The presence of noise traders increase the bubble characteristics and price volatility