Embed Size (px)
Citation preview
Information Technology Services
Practical Database Design in a Research Environment November 29, 2010
Contact [email protected] with questions.
Practical Database Design
In A Research Environment
Thomas P. Reardon, MA
Sr. Applications Programmer/Analyst
Learning Environment and Internet Services
Information Technology Services
University of Nebraska Medical Center

Information Technology Services
Practical Database Design in a Research Environment November 29, 2010
Contact [email protected] with questions.
Practical Database Design in a Research Environment Page 2 of 31
Foreword
This handout was prepared to provide an introductory look into the problems and solutions of typical data
management problems for researchers and educators, and provide some basic design information to
supplement the resources provided at UNMC.
The LEIS group of UNMC Information Technology Services provides a comprehensive range of
consultation, and analysis, design, and development solutions for all your data management problems.
For assistance with database analysis and design at any point (but preferably as early as possible) don’t
hesitate to contact:
Tom Reardon
Sr. Programmer/Analyst
LEIS
9-5671
- That’s what we get paid for
Information Technology Services
Practical Database Design in a Research Environment November 29, 2010
Contact [email protected] with questions.
Practical Database Design in a Research Environment Page 3 of 31
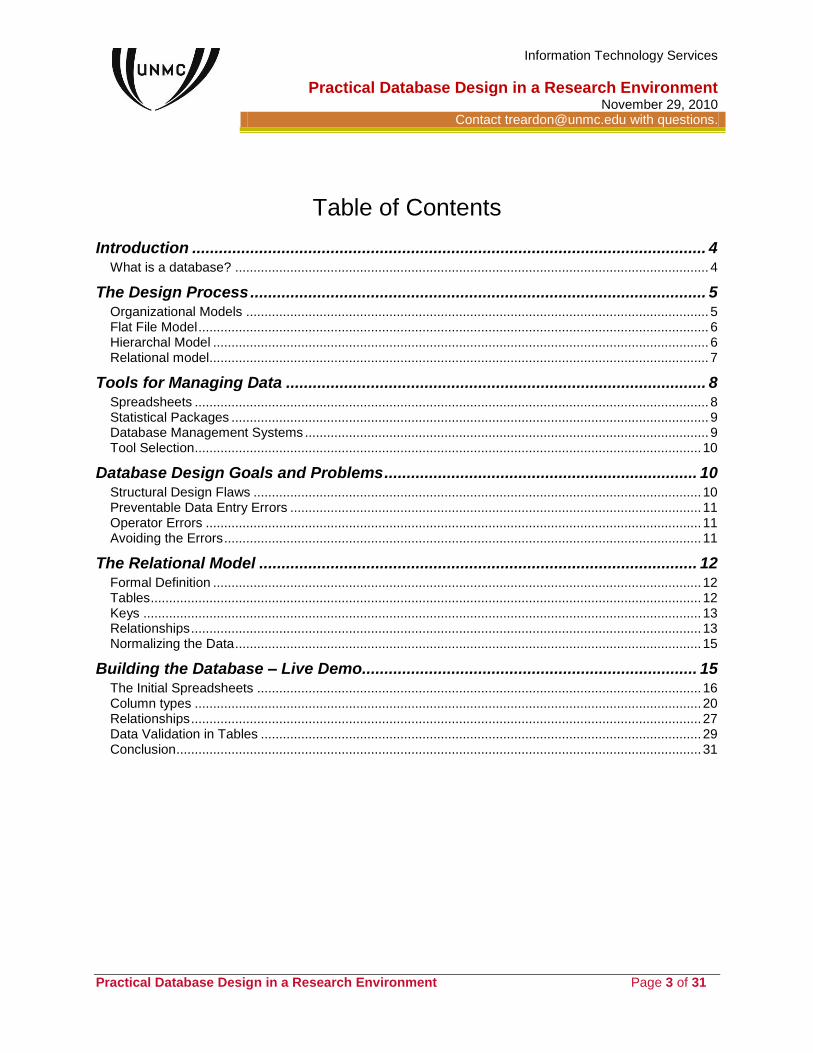
Table of Contents
Introduction ................................................................................................................... 4
What is a database? ................................................................................................................................. 4
The Design Process ...................................................................................................... 5
Organizational Models .............................................................................................................................. 5 Flat File Model ........................................................................................................................................... 6 Hierarchal Model ....................................................................................................................................... 6 Relational model........................................................................................................................................ 7
Tools for Managing Data .............................................................................................. 8
Spreadsheets ............................................................................................................................................ 8 Statistical Packages .................................................................................................................................. 9 Database Management Systems .............................................................................................................. 9 Tool Selection .......................................................................................................................................... 10
Database Design Goals and Problems ...................................................................... 10
Structural Design Flaws .......................................................................................................................... 10 Preventable Data Entry Errors ................................................................................................................ 11 Operator Errors ....................................................................................................................................... 11 Avoiding the Errors .................................................................................................................................. 11
The Relational Model .................................................................................................. 12
Formal Definition ..................................................................................................................................... 12 Tables ...................................................................................................................................................... 12 Keys ........................................................................................................................................................ 13 Relationships ........................................................................................................................................... 13 Normalizing the Data ............................................................................................................................... 15
Building the Database – Live Demo........................................................................... 15
The Initial Spreadsheets ......................................................................................................................... 16 Column types .......................................................................................................................................... 20 Relationships ........................................................................................................................................... 27 Data Validation in Tables ........................................................................................................................ 29 Conclusion ............................................................................................................................................... 31
Information Technology Services
Practical Database Design in a Research Environment November 29, 2010
Contact [email protected] with questions.
Practical Database Design in a Research Environment Page 4 of 31
Introduction
What is a database?
All a database is, really, is a mechanical method of organizing and accurately storing large amounts
data in an efficient manner so it can be retrieved rapidly, and in the correct form for whatever
purpose the users of the data need it.
Simple enough, but the problem is…
Within that simple definition lies a minefield, because real world data is usually sloppy, inefficient, and
often inaccurate. While humans are pretty good at dealing with that (at least in small amounts) computer
systems blow up pretty quickly. In attempting to design a good database, there are a number of problems
but by far and away the most serious stumbling block is:
We’re way too good at what we do...
The human brain is pretty good at dealing with fuzzy data, and as content experts we know the material
we’re dealing with, and we’re used to dealing with information in a narrative form.
So we know that, for example that: gm- rod, gram neg. rod, and gram negative bacillus are the same
thing, and we’re usually pretty good (but sometimes NOT, and with disastrous effects) at looking at data
and finding discrepancies like being off a few decimal points (3ul vs. 3000ul) or using the wrong units.
We’ve also created some aids we almost automatically use to help us highlight important pieces of
information, such as color, bold script, etc... These however are not usually recognized by a computer,
unless a considerable amount of time and money is spent on custom programming.
So, we deal with this…
By constructing organizational models, by establishing conventions for naming data items, by limiting the
amount and type of data that can be contained in a single field, by creating business rules for flagging
data that might be out of range, and using other tools to help insure the accuracy of the data - all done
within the constraints of machine capability, and the time and money available to build the database.
For decades, the mechanical system used to create databases is the computer, so that’s what we’ll be
talking about – but back before computers became affordable, there was the index card system. This was
a pack of index cards, with categories along the edges (marked by holes in the card) that were punched
out when the data on the card met the criteria (sex, gender, whatever). Just stick a probe thru and the
matching cards fell out.
The idea is that the most important first step, the logical organization of data, is not necessarily
dependant on the tools used to organize it. It’s important to think about the organization and use of the
data before you go picking your tools. And in most cases you’ll probably be using more than one tool (say
a database and statistical program) to work with your data.
Information Technology Services
Practical Database Design in a Research Environment November 29, 2010
Contact [email protected] with questions.
Practical Database Design in a Research Environment Page 5 of 31
The Design Process
The first step in the design process, before we even consider what tools to use, is to take a close look at
what you’re doing now (if it’s for an existing project) or what you want to accomplish in a future project.
Some important considerations are:
What is the overall purpose of the database? Normally we advise people to write out a short
statement of what you want the database to achieve – but if you’ve got an abstract, you’ve probably
done that already.
Diagram out the workflow
o How to you collect the data
o Who collects it
o Who enters it into the database, and what is their experience level – both with the data and
with computers.
What’s the expected lifetime of the project?
Can basically the same form be used for multiple projects – either now or in the future.
What kinds of analysis are you going to do?
Organizational Models Data models are ways to logically think about how to organize data and to provide rules about how to
manipulate the data – they don’t necessarily describe how the data is physically stored on the computer,
or the products used to manage and manipulate the data.
There are many different models used to organize data, but the ones we’ll be concerned with are the flat
file model, the hierarchal model, and the relational model.
No matter which model we talk about we’re concerned with organizing data into fields and records.
Defining what a field and record are can sometimes get a bit complicated, but for this handbook:
A field is one unique data element such as blood pressure or heart rate, and defined as a variable
type. A variable is a location in a computer that stores a specific type of data, such as integer ( a
number without decimal point), floating point number( with decimal points), character, or
byte(used for Yes/No, true/false, etc.)
A record is a group of (hopefully) related fields such as Animal ID, Date Recorded, Heart Rate,
Temperature, etc.
The organizational model is concerned with how the fields and records relate to each other, which has a
critical effect on how easily data is entered, updated, retrieved, and exported to other programs.
Information Technology Services
Practical Database Design in a Research Environment November 29, 2010
Contact [email protected] with questions.
Practical Database Design in a Research Environment Page 6 of 31
Flat File Model A flat file is a way or organizing data where the individual records have no relationship to each other. A
good example is a contact list that might look like, in a Word label document or Excel spreadsheet:
(1) with each field in a separate record:
John Doe
Surgery
9999
9-9999
(2) with all the fields in the same record, as a comma delimited file (.csv):
John Doe, Surgery,9999,9-9999
Common variations on this example include having the fields separated by tabs instead of commas or
having each field in a fixed position with a fixed length in the file.
The structure in example 1 might be useful for producing address (or specimen, etc.) labels – but not for
much else. It could take a considerable amount of programming to get that information into a form usable
by most programs.
The structure in example 2 is quite a bit more useful, and is commonly used for moving information
between programs, when implemented as a
simple text file. If implemented in a spreadsheet
page or stats package data file it could
represent a page in a lab notebook.
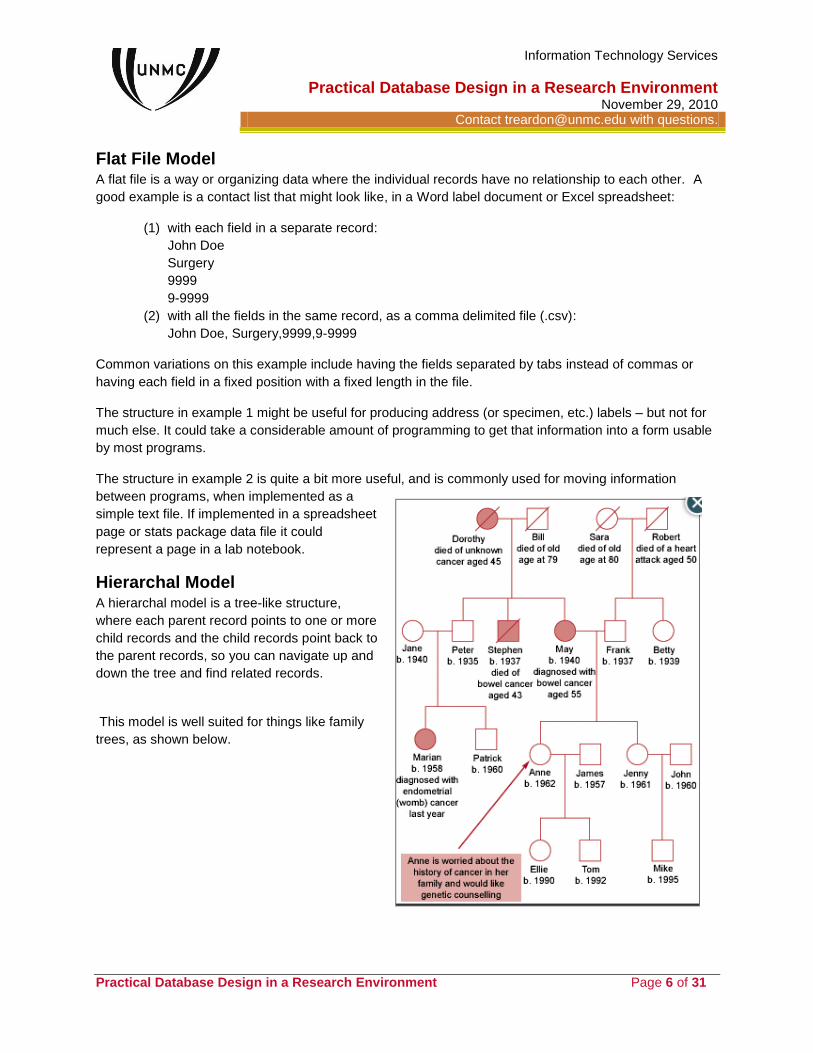
Hierarchal Model A hierarchal model is a tree-like structure,
where each parent record points to one or more
child records and the child records point back to
the parent records, so you can navigate up and
down the tree and find related records.
This model is well suited for things like family
trees, as shown below.
Information Technology Services
Practical Database Design in a Research Environment November 29, 2010
Contact [email protected] with questions.
Practical Database Design in a Research Environment Page 7 of 31
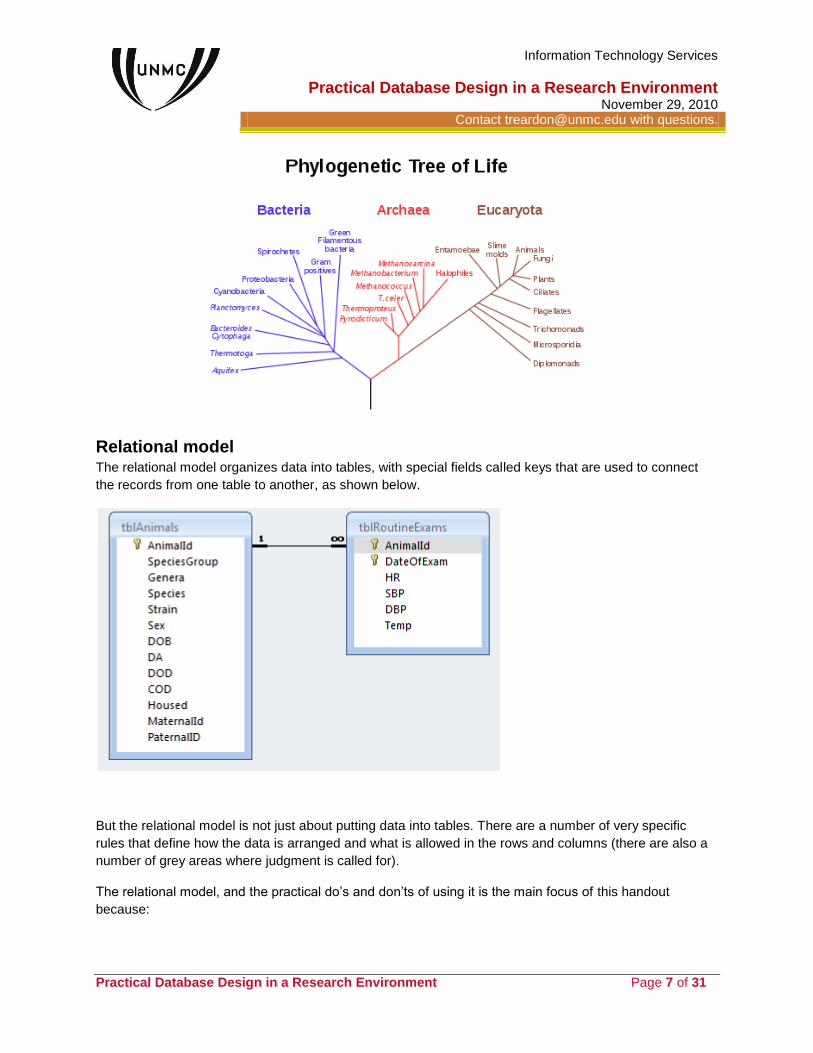
Relational model The relational model organizes data into tables, with special fields called keys that are used to connect
the records from one table to another, as shown below.
But the relational model is not just about putting data into tables. There are a number of very specific
rules that define how the data is arranged and what is allowed in the rows and columns (there are also a
number of grey areas where judgment is called for).
The relational model, and the practical do’s and don’ts of using it is the main focus of this handout
because:
Information Technology Services
Practical Database Design in a Research Environment November 29, 2010
Contact [email protected] with questions.
Practical Database Design in a Research Environment Page 8 of 31
1. The tool for building and using a relational database, the Database Management Systems
(DBMS) are readily available, in a wide variety of power and price to fit all needs. On this campus
Microsoft Access is commonly used for small volume (under about 100,000 records and 5 or
fewer simultaneous users) on a desktop or network, and MySQL®, MS-SQL®, and PostgreSQL®
are available for internet applications. Other commercial products such as Oracle® can be
purchased for large scale use.
2. Other models (flat file, hierarchal) are easily implemented using a relational DBMS.
3. Many of the rules used in constructing the tables in a relational DBMS are used to good effect in
organizing your data in other products, such as Excel® or SAS®.
Tools for Managing Data
There are far too many specialized software packages used to collect, manipulate, and analyze data to
present here - and workers in a specific field will be familiar with the ones appropriate to their work, so
we’ll be concentrating on some generalized tools - these are spreadsheets, statistical packages, and
database management systems, and how to use them in combination.
Each type of product has its strengths and weaknesses, and each has some of the functionality of the
others. For relatively simple projects it’s possible that a single tool will suffice, and although it is often
possible to develop complex projects using a single tool it is usually much more effective to use multiple
tools – playing to the strengths of each.
This handout will be using MSAccess, Excel, and SAS as examples.
Very briefly, some of the strengths and weakness of the various tools are:
Spreadsheets Spreadsheets were originally designed for financial projections and creating what-if scenarios.
Strength
The ease of data entry if the data are relatively simple.
It’s easy to calculate values, and a large number of mathematical and basic statistical functions are
included.
Pivot tables provide a number of ways to summarize and filter data.
Fairly easy to make relatively good, if not publication quality charts.
Weakness
Hard to customize data entry for complicated situations.
Not very good at managing large amounts of data with complicated relationships, for example patient
records with multiple visits.
Hard to sort or select for specific sub-sets of the data.
Complex statistics are usually beyond its reach.
Information Technology Services
Practical Database Design in a Research Environment November 29, 2010
Contact [email protected] with questions.
Practical Database Design in a Research Environment Page 9 of 31
Statistical Packages Stats packages are, of course, used to perform sophisticated statistical analyses - which ones to use for
what data is a subject for statisticians - not something this handout will go into. They also vary quite a bit
in their ability to manipulate and manage data, and the ease of data entry. For example, of the two major
packages used on this campus, SPSS has a better user interface for well organized data, but SAS has
much more powerful data manipulation and management capability - again a topic for another handout.
Strength
Sophisticated statistical analysis.
Powerful sets of mathematical functions – usually more so that spreadsheets.
Good ability sort and subset data.
Good data manipulation capability.
Powerful graphing capability, including creating publication quality graphs.
Weakness
Hard to customize data entry for complicated situations.
Could have a steeper learning curve than a database product when trying manipulating data
Takes a considerable amount of programming to manage complicated data relationships.
Database Management Systems Database Management Systems are designed to manage large amounts of complex data..
Strength
Manage and track large amounts of data.
Powerful structure to develop queries to find specific information.
Adaptable to a wide range of projects – from simple, single table designs to extremely complicated
situations.
Relatively easy to create data entry forms and reports in complex situations.
Fairly easy to make relatively good, if not publication quality charts.
Allows multiple user access at the same time.
Relatively easy to import/export data from/to other applications.
Weakness
Limited statistical capability largely restricted to basic descriptive measures.
Charting and graphing capability is often limited.
Requires Investing time to learn basic skills and get assistance in creating more complex forms,
reports, and queries.
Information Technology Services
Practical Database Design in a Research Environment November 29, 2010
Contact [email protected] with questions.
Practical Database Design in a Research Environment Page 10 of 31
Tool Selection
What tool or tools to use for data management can be a complicated
question, and the answer depends not only on the complexity and amount
of the data, but also on such things as the familiarly of the users with the
data, the number of users, the questions the data is expected to answer,
etc.
Since database management systems, and relational databases in
particular are the most flexible tool available for managing data in a wide
variety of situations this handout concentrates on the steps involved
developing a good relational database that will allow you to easily move
data out to other products for further analysis.
Database Design Goals and Problems As we said before, a database is a mechanical method of organizing and accurately storing large
amounts data in an efficient manner so it can be retrieved rapidly, and in the correct form for
whatever purpose the users of the data need it.
A Database Management System includes the database itself (the tables in a relational system) and the
tools used to operate on the database. Those tools always include a query language – Structured Query
Language (SQL) is the standard for relational databases, but others such as Visual Basic for Applications
(VBA) that comes with the Microsoft products might be available. You’ll also be working with form and
report design tools, either built-in or as part of a third party package, and means to import and export
data.
Whether you’re dealing with a simple or complex database you’ll always need to add, update, and delete
information, and retrieve it in a usable form – and you need to do it accurately and with a minimum of
effort. But it’s not really that simple, and to begin the design process we need to know what types of
errors we might be dealing with – so we’ll know how to design to avoid them.
I’ve designated three broad categories of errors (and they blend into each other) with some common
examples.
Structural Design Flaws Structural design flaws are caused by the design of the system itself. Some examples are:
Addition, Deletion, and Update anomalies that can cause a database to behave unpredictably.
Some examples would be:
o Not being able to add a newborn rat to a database, unless it’s already been used in an
experiment.
Information Technology Services
Practical Database Design in a Research Environment November 29, 2010
Contact [email protected] with questions.
Practical Database Design in a Research Environment Page 11 of 31
o Having feeding records for an animal, but not having that animal listed in a master table –
so you don’t know it’s sex, age, etc.
o Trying to update blood chemistry records for rabbit R2706, but having it update mouse
M204 instead.
Inability to retrieve information efficiently. You KNOW it’s there, but can’t find it – what column is it
in and how is it recorded.
Redundant information – everybody’s had the problem of getting several of the same mailings.
Inconsistent information – Is Vancomycin the same as Vanco. The computer has no way of
knowing.
Loss of information caused by using the wrong type of variable, for example a Zip code becoming
999 instead of 00999 because a field was defined as numeric instead of character.
Naming fields in such a way that it makes it hard to export to another program, for example using
very long field names, or names that contain spaces. These are not necessarily problems
WITHIN the database, but only show up when you need to export data.
Preventable Data Entry Errors These are data entry errors that the system could either prevent, or provide a warning, if the right data
validation rules are in place. Some examples are:
Data out of range - for example a systolic blood pressure of 12000, or a patient being born
10/01/2105
Creating unusable data caused by using the wrong type of variable, such as defining a field as
character instead of numeric for temperature and entering mixed character and numeric data – ie
98.6F
Loss of information due to rounding errors
Operator Errors These are data entry errors that could not be caught by the system. Some examples would be:
Inconsistent spellings or terms for the same thing
Reversed letters and/or numbers
Wrong codes
Inaccurate entry within a variable’s acceptable range
Avoiding the Errors Avoiding these errors requires a three-pronged approach at both the table design level and the forms
design level. We need to:
Design the database according to a formal model that constrains what can be done and insures
that additions, deletions, updates, etc. are done efficiently and predictably. This is best done at
the table/database structure design level; although some implementation can be done at the
forms design level.
Create data validation rules that limit the type and values of information that can be entered. This
can be done at table design or forms design levels (you can do this in Excel too – from the Data
tab).
Information Technology Services
Practical Database Design in a Research Environment November 29, 2010
Contact [email protected] with questions.
Practical Database Design in a Research Environment Page 12 of 31
Using basic design principles and psychology in creating the user interface that will make it easy
to enter the correct information, and to detect when errors have been made. This is, in my
opinion, the most important step - and by far the most difficult and time consuming, and is done
mostly at the forms design level.
The Relational Model
Formal Definition
The relational model is a model based on mathematical set theory developed by E.F. Codd in 1969 at
IBM. It is defined as a set of relations composed of unordered tables and unordered attributes.
To be considered a true relational database, they need to meet Codds’ (1985) 13 rules (now about 300).
Ok –I just through that in so you’d know the formal terms in case you wanted to start looking into the more
academic sources on database management.
In “real speak” this translates to a set of tables, with each table composed of unordered rows and
unordered columns. And, and of course, we won’t be concerned with all of the rules – not even all of the
original 13 – but only those with practical importance in typical situations.
We’re going to try to stay away from the technical terms as much as possible, but we need to define a few
things before we get to the practical examples, so:
Tables
Tables contain the data in a relational database. Everything else – the forms, queries, reports, etc. - are
just ways of looking at (and manipulating) the data that are in the tables. A database can consist of only
one, but usually consists of several tables that are related to each other.
As a practical matter each table should be concerned with only one “type” of data – and this is a pretty
fuzzy guideline. For example in a patient management database, the patient demographics would be in
one table, test results in another, procedures done in yet another, etc. Table design - picking and
choosing what goes into what table – is guided by a process called normalization.
Some of the rules for tables are (in no particular order):
1) Rows and columns are unordered. You cannot depend to the position of a column, or the record
number of a row to identify a column or record. If you need to arrange rows in a specific order, you
need to sort based on the value of the data in a specific column or columns. In Microsoft Access, for
example, new records are always added at the bottom of a data list.
2) Rows are unique - no two rows may contain the exact same information. Each row is identified by a
unique primary key, which is the value in a column or columns that you designate when you design
the table (such as ID#, Medical record #, etc.).
3) Column values contain the same kind of information (such as phone #’s, diagnosis code).
4) Column values are atomic, meaning they consist of only one thing and there are no repeat groups.
5) All column values depend on the value of the primary key
6) No column value depends on any other column value, other that the primary key (i.e. not derived from
a calculation).
Information Technology Services
Practical Database Design in a Research Environment November 29, 2010
Contact [email protected] with questions.
Practical Database Design in a Research Environment Page 13 of 31
Keys
Keys are extremely important. They are special columns in a table which allow you to identify the rows of
a table, and allow you to connect different tables in a functioning database.
The Primary Key uniquely defines a row in a table.
An example of a primary key would be a patient’s SSN because it’s unique, instead of a last
name - which is not. Of course we wouldn’t actually use a SSN due to security concerns.
All tables must have a primary key, and a key should be:
o Minimal – use as few columns as possible (avoid first name, last name – you couldn’t
count on them being unique anyway).
o Stable – data used as the primary key should be unchanging.
A product name would not be a good primary key, because at any moment marketing
could decide to change it.
o Simple and familiar.
Other key terms you’ll run into are:
Foreign key - a primary key in one table, that’s used to relate (join) records in another table. If
PatientId is the primary key in the patient demographic table, in the lab results table it would be
the column used to identify the patient. Foreign keys must be of the same type (integer,
character, etc.) and length as the primary key, but they don’t need to be named the same.
Compound key - a key that is composed of two or more columns. An example might be using
the DateDone and TestName columns as the primary key in a lab results table if a specific test is
done only once per day.
Surrogate key - a key that doesn’t arise from the data. A common example of this is to use the
auto number type of field to create a primary key. A surrogate key can always be used as a
primary key, and in some cases it’s clearly your best choice - an example would be in a
retrospective study where you want to strip out the patient identifying information after the data is
entered and verified. In others, there are good arguments on both sides.
Relationships Relationships are the means of connecting (joining) tables together to provide meaningful responses to
queries about the data. There are three types of relationships we normally talk about.
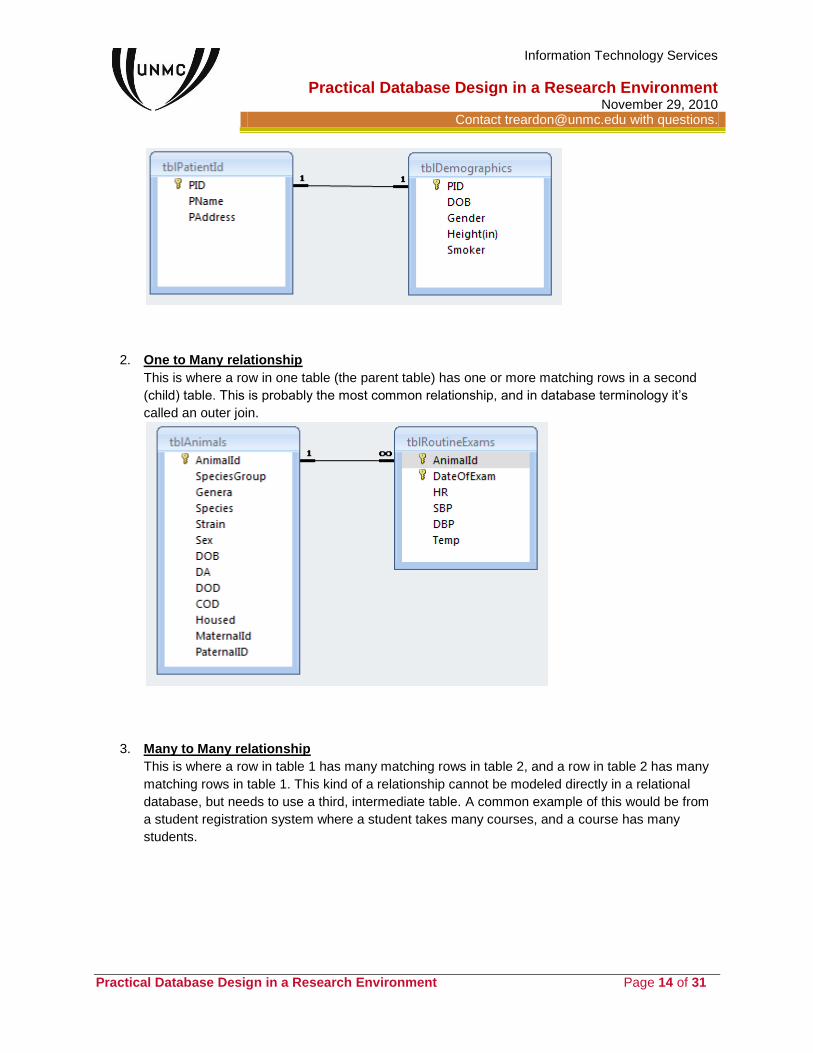
1. One to One relationship
This is where a row in one table has one and only one matching row in a second table. This might
be used in cases where:
o There are too many columns for the system to handle in one table.
o You might want to separate the data for logical clarity, or ease in constructing forms.
o You might need to separate parts of the data for security reasons.
o In database terminology this type of join is called an inner join
Information Technology Services
Practical Database Design in a Research Environment November 29, 2010
Contact [email protected] with questions.
Practical Database Design in a Research Environment Page 14 of 31
2. One to Many relationship
This is where a row in one table (the parent table) has one or more matching rows in a second
(child) table. This is probably the most common relationship, and in database terminology it’s
called an outer join.
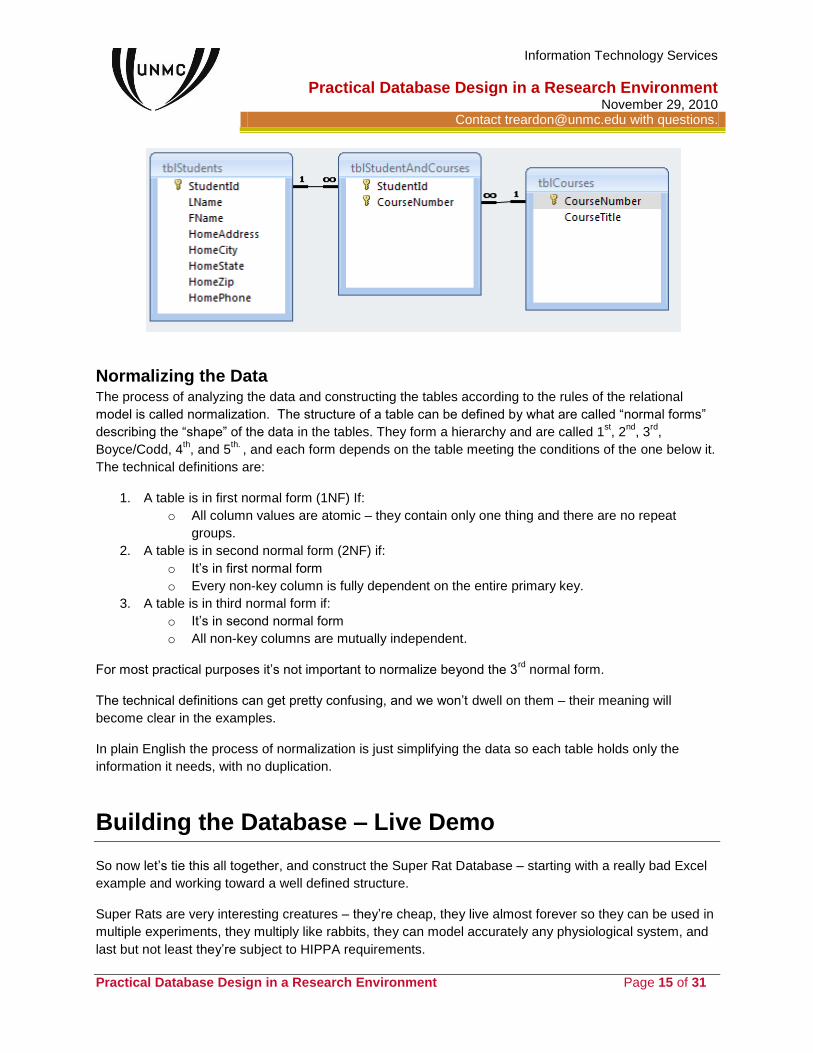
3. Many to Many relationship
This is where a row in table 1 has many matching rows in table 2, and a row in table 2 has many
matching rows in table 1. This kind of a relationship cannot be modeled directly in a relational
database, but needs to use a third, intermediate table. A common example of this would be from
a student registration system where a student takes many courses, and a course has many
students.
Information Technology Services
Practical Database Design in a Research Environment November 29, 2010
Contact [email protected] with questions.
Practical Database Design in a Research Environment Page 15 of 31
Normalizing the Data
The process of analyzing the data and constructing the tables according to the rules of the relational
model is called normalization. The structure of a table can be defined by what are called “normal forms”
describing the “shape” of the data in the tables. They form a hierarchy and are called 1st, 2
nd, 3
rd,
Boyce/Codd, 4th, and 5
th. , and each form depends on the table meeting the conditions of the one below it.
The technical definitions are:
1. A table is in first normal form (1NF) If:
o All column values are atomic – they contain only one thing and there are no repeat
groups.
2. A table is in second normal form (2NF) if:
o It’s in first normal form
o Every non-key column is fully dependent on the entire primary key.
3. A table is in third normal form if:
o It’s in second normal form
o All non-key columns are mutually independent.
For most practical purposes it’s not important to normalize beyond the 3rd
normal form.
The technical definitions can get pretty confusing, and we won’t dwell on them – their meaning will
become clear in the examples.
In plain English the process of normalization is just simplifying the data so each table holds only the
information it needs, with no duplication.
Building the Database – Live Demo
So now let’s tie this all together, and construct the Super Rat Database – starting with a really bad Excel
example and working toward a well defined structure.
Super Rats are very interesting creatures – they’re cheap, they live almost forever so they can be used in
multiple experiments, they multiply like rabbits, they can model accurately any physiological system, and
last but not least they’re subject to HIPPA requirements.
Information Technology Services
Practical Database Design in a Research Environment November 29, 2010
Contact [email protected] with questions.
Practical Database Design in a Research Environment Page 16 of 31
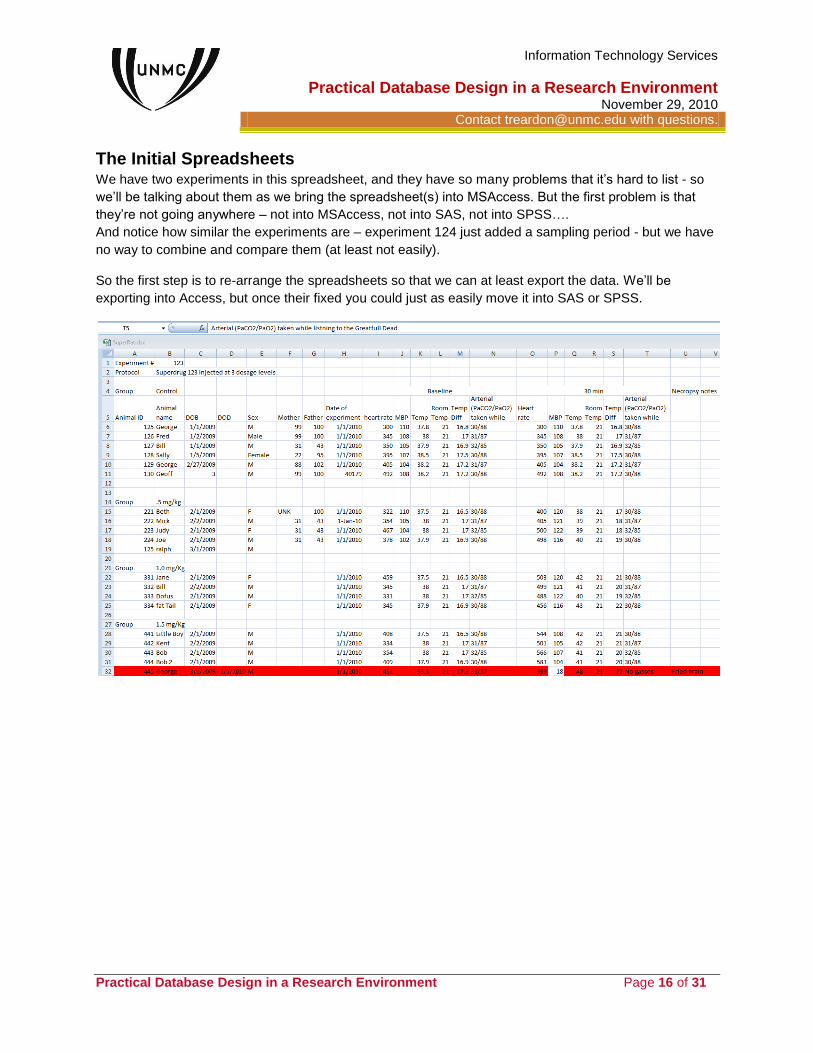
The Initial Spreadsheets
We have two experiments in this spreadsheet, and they have so many problems that it’s hard to list - so
we’ll be talking about them as we bring the spreadsheet(s) into MSAccess. But the first problem is that
they’re not going anywhere – not into MSAccess, not into SAS, not into SPSS….
And notice how similar the experiments are – experiment 124 just added a sampling period - but we have
no way to combine and compare them (at least not easily).
So the first step is to re-arrange the spreadsheets so that we can at least export the data. We’ll be
exporting into Access, but once their fixed you could just as easily move it into SAS or SPSS.
Information Technology Services
Practical Database Design in a Research Environment November 29, 2010
Contact [email protected] with questions.
Practical Database Design in a Research Environment Page 17 of 31
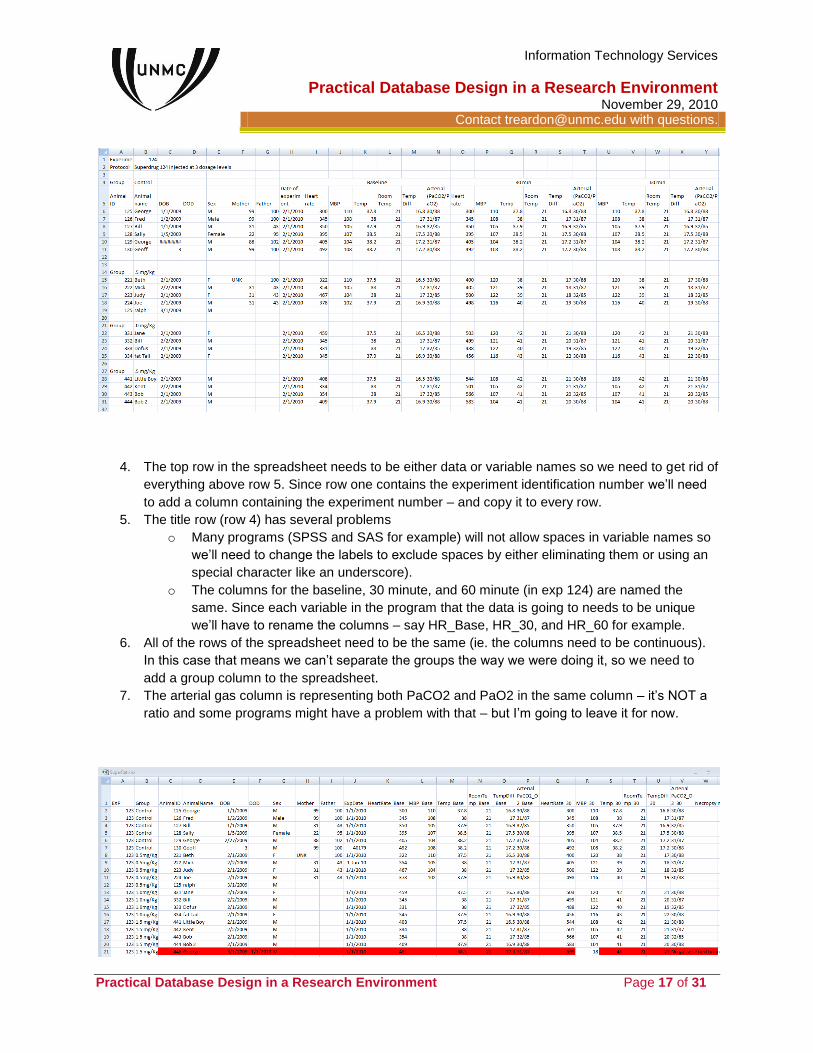
4. The top row in the spreadsheet needs to be either data or variable names so we need to get rid of
everything above row 5. Since row one contains the experiment identification number we’ll need
to add a column containing the experiment number – and copy it to every row.
5. The title row (row 4) has several problems
o Many programs (SPSS and SAS for example) will not allow spaces in variable names so
we’ll need to change the labels to exclude spaces by either eliminating them or using an
special character like an underscore).
o The columns for the baseline, 30 minute, and 60 minute (in exp 124) are named the
same. Since each variable in the program that the data is going to needs to be unique
we’ll have to rename the columns – say HR_Base, HR_30, and HR_60 for example.
6. All of the rows of the spreadsheet need to be the same (ie. the columns need to be continuous).
In this case that means we can’t separate the groups the way we were doing it, so we need to
add a group column to the spreadsheet.
7. The arterial gas column is representing both PaCO2 and PaO2 in the same column – it’s NOT a
ratio and some programs might have a problem with that – but I’m going to leave it for now.
Information Technology Services
Practical Database Design in a Research Environment November 29, 2010
Contact [email protected] with questions.
Practical Database Design in a Research Environment Page 18 of 31
This is still pretty bad, but at least we can move the data around without too many problems so let’s just
use the external data function to import it into our Access Database, and begin the process of simplifying
and organizing the data. The first thing you might notice is that each experiment still has its own table,
making comparisons between experiments hard – but this will be solved automatically as we work thru
the issues. Some of the other problems are:
There’s no way to uniquely identify each record, so we can’t create a primary key to allow us to do
updates, additions, and deletions reliably.
The arterial gasses column contains both PaCO2 and PaO2 in the same column, so you can’t do
anything with it.
The group is identified by character field – so you can identify the group, but can’t use the information
for anything else – say a dose/response curve.
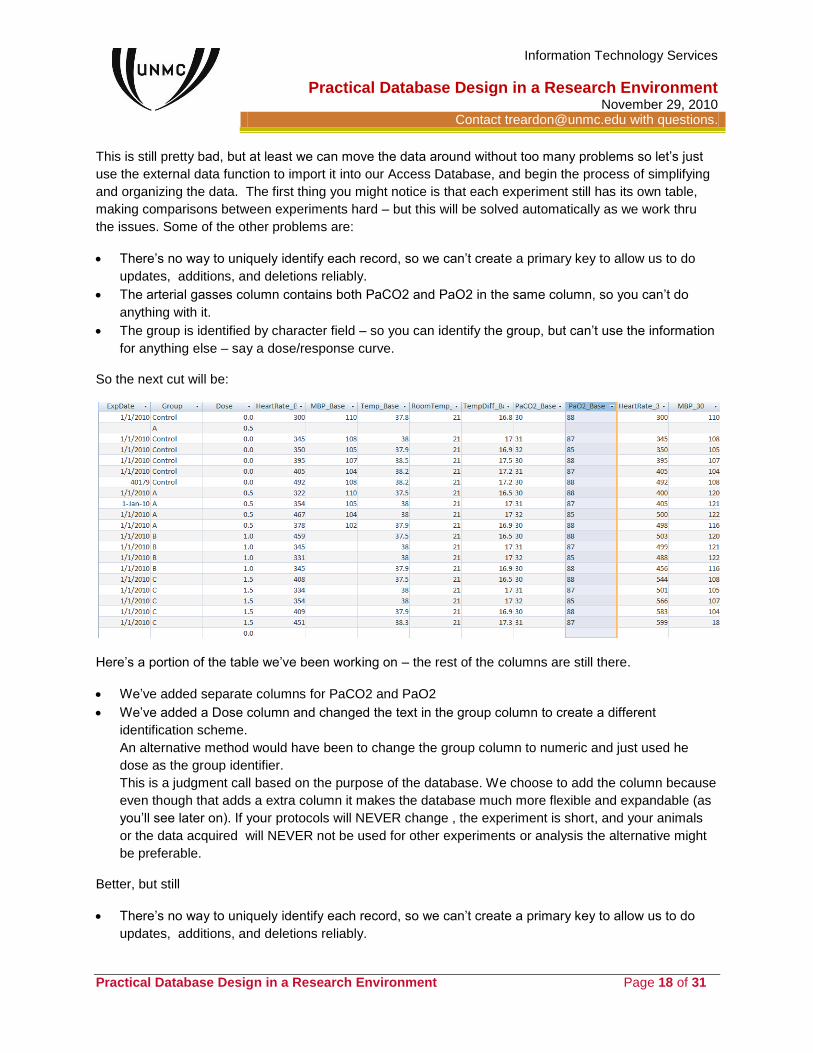
So the next cut will be:
Here’s a portion of the table we’ve been working on – the rest of the columns are still there.
We’ve added separate columns for PaCO2 and PaO2
We’ve added a Dose column and changed the text in the group column to create a different
identification scheme.
An alternative method would have been to change the group column to numeric and just used he
dose as the group identifier.
This is a judgment call based on the purpose of the database. We choose to add the column because
even though that adds a extra column it makes the database much more flexible and expandable (as
you’ll see later on). If your protocols will NEVER change , the experiment is short, and your animals
or the data acquired will NEVER not be used for other experiments or analysis the alternative might
be preferable.
Better, but still
There’s no way to uniquely identify each record, so we can’t create a primary key to allow us to do
updates, additions, and deletions reliably.
Information Technology Services
Practical Database Design in a Research Environment November 29, 2010
Contact [email protected] with questions.
Practical Database Design in a Research Environment Page 19 of 31
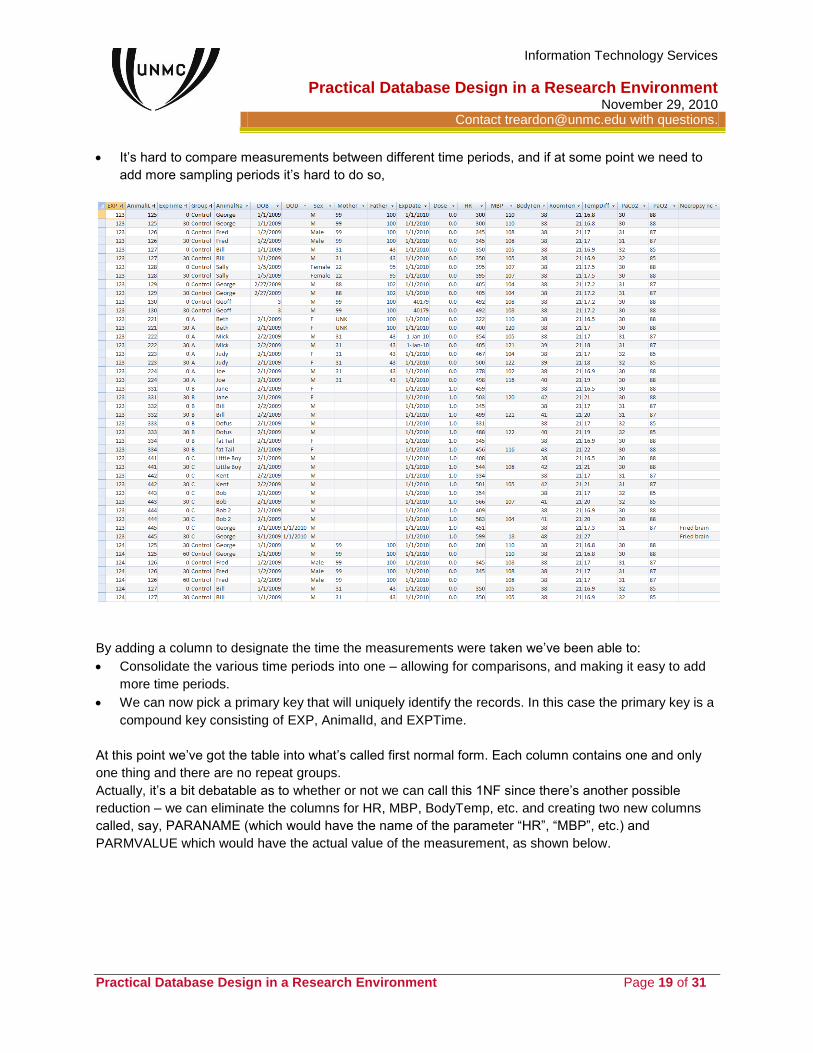
It’s hard to compare measurements between different time periods, and if at some point we need to
add more sampling periods it’s hard to do so,
By adding a column to designate the time the measurements were taken we’ve been able to:
Consolidate the various time periods into one – allowing for comparisons, and making it easy to add
more time periods.
We can now pick a primary key that will uniquely identify the records. In this case the primary key is a
compound key consisting of EXP, AnimalId, and EXPTime.
At this point we’ve got the table into what’s called first normal form. Each column contains one and only
one thing and there are no repeat groups.
Actually, it’s a bit debatable as to whether or not we can call this 1NF since there’s another possible
reduction – we can eliminate the columns for HR, MBP, BodyTemp, etc. and creating two new columns
called, say, PARANAME (which would have the name of the parameter “HR”, “MBP”, etc.) and
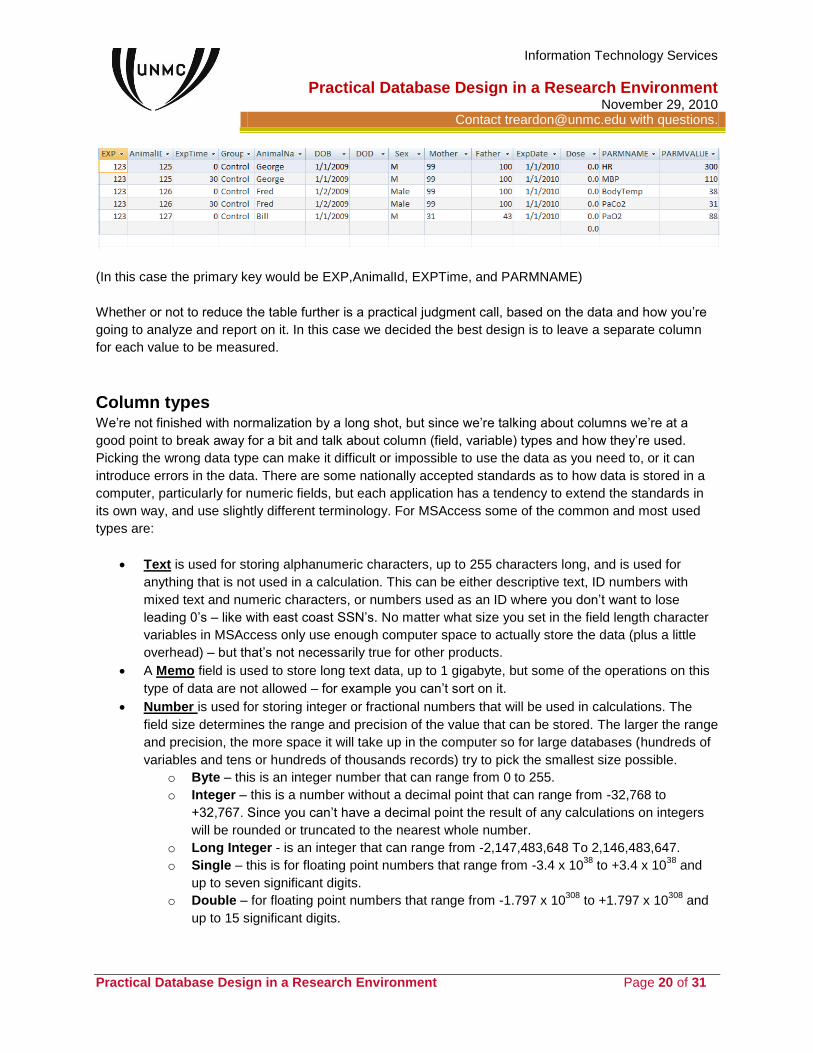
PARMVALUE which would have the actual value of the measurement, as shown below.
Information Technology Services
Practical Database Design in a Research Environment November 29, 2010
Contact [email protected] with questions.
Practical Database Design in a Research Environment Page 20 of 31
(In this case the primary key would be EXP,AnimalId, EXPTime, and PARMNAME)
Whether or not to reduce the table further is a practical judgment call, based on the data and how you’re
going to analyze and report on it. In this case we decided the best design is to leave a separate column
for each value to be measured.
Column types
We’re not finished with normalization by a long shot, but since we’re talking about columns we’re at a
good point to break away for a bit and talk about column (field, variable) types and how they’re used.
Picking the wrong data type can make it difficult or impossible to use the data as you need to, or it can
introduce errors in the data. There are some nationally accepted standards as to how data is stored in a
computer, particularly for numeric fields, but each application has a tendency to extend the standards in
its own way, and use slightly different terminology. For MSAccess some of the common and most used
types are:
Text is used for storing alphanumeric characters, up to 255 characters long, and is used for
anything that is not used in a calculation. This can be either descriptive text, ID numbers with
mixed text and numeric characters, or numbers used as an ID where you don’t want to lose
leading 0’s – like with east coast SSN’s. No matter what size you set in the field length character
variables in MSAccess only use enough computer space to actually store the data (plus a little
overhead) – but that’s not necessarily true for other products.
A Memo field is used to store long text data, up to 1 gigabyte, but some of the operations on this
type of data are not allowed – for example you can’t sort on it.
Number is used for storing integer or fractional numbers that will be used in calculations. The
field size determines the range and precision of the value that can be stored. The larger the range
and precision, the more space it will take up in the computer so for large databases (hundreds of
variables and tens or hundreds of thousands records) try to pick the smallest size possible.
o Byte – this is an integer number that can range from 0 to 255.
o Integer – this is a number without a decimal point that can range from -32,768 to
+32,767. Since you can’t have a decimal point the result of any calculations on integers
will be rounded or truncated to the nearest whole number.
o Long Integer - is an integer that can range from -2,147,483,648 To 2,146,483,647.
o Single – this is for floating point numbers that range from -3.4 x 1038
to +3.4 x 1038
and
up to seven significant digits.
o Double – for floating point numbers that range from -1.797 x 10308
to +1.797 x 10308
and
up to 15 significant digits.
Information Technology Services
Practical Database Design in a Research Environment November 29, 2010
Contact [email protected] with questions.
Practical Database Design in a Research Environment Page 21 of 31
o Decimal – this is a non standard floating point type that is specific to MSAccess. I
recommend strongly against using it until you have a strong grasp of how to set the scale
and precision. The default values are not what are normally expected from a floating
point number and loss of data is quite possible.
Date/Time is a special type of variable used for recording dates/times and allows you to perform
date/time calculations.
AutoNumber is a long integer that is automatically generated by the computer. You can select
either sequential or random generations, but once selected the type can’t be changed, and you
can’t modify an auto-number field yourself.
Yes/No is used for storing Boolean (Yes/No, True/False, On/Off). Access uses the values 0 for
False and -1 for True by default – but it will consider anything other than 0 as True.
Currency is a special type of data, used for currency, that insures that rounding is done correctly,
and displays and inputs the data using regional settings.
Along with the field length you can specify different formats that control the way the data is displayed
– how many places after the decimal point for example - but have no effect on how it’s stored
internally. You can also specify an input mask to regulate how the data is entered.
Now, back to our tables…
We’ve been concentrating on the experimental variables, and that’s pretty well taken care of, but the
table contains a lot of duplicated and redundant information about the experimental animals that can
create a number of problems. Some of the problems that could arise are:
When an animal dies you need to update every record in the database that the animal appears in.
If you need to add information about an animal, say a vaccination record or a housing record you
need to do it in every record the animal appears in.
Of course, when you NEED to update every record it’s almost a given that you’ll miss a few.
The animal information columns are not independent – name depends on animal ID, so if you
need to change the name (if they get married for instance – hey these ARE Super Rats) you’ll
probably miss a few and bingo – inconsistent data.
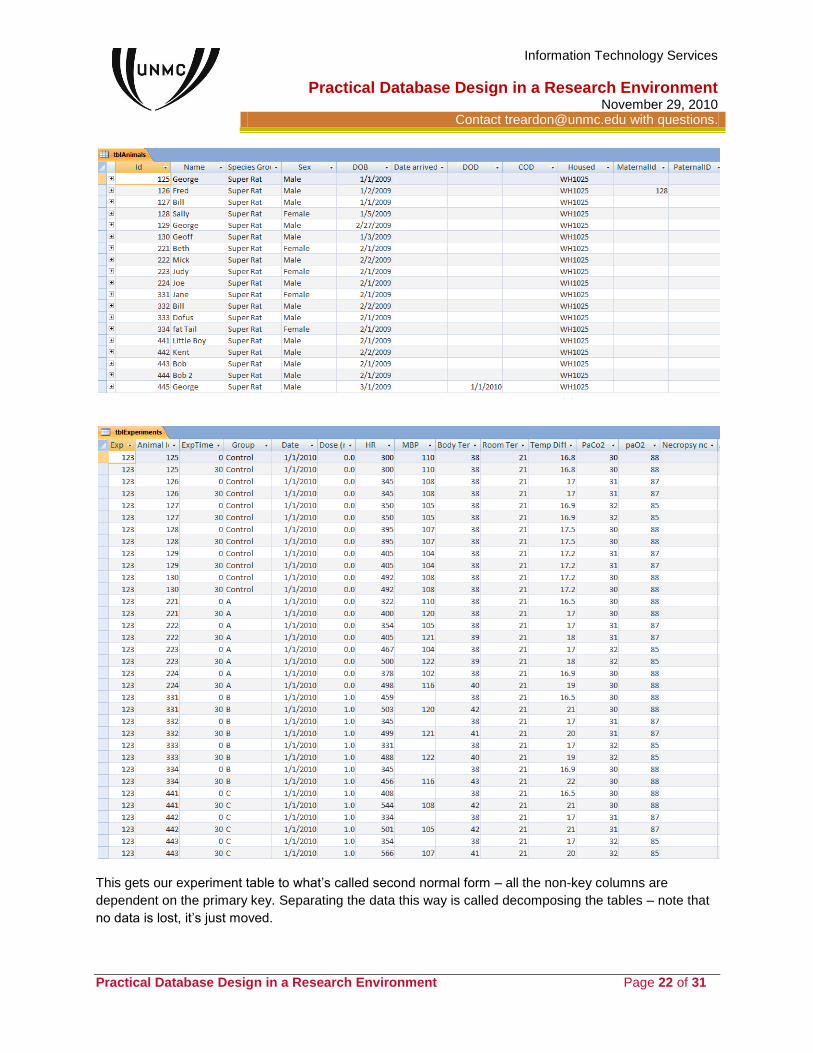
So the way around this is to separate the animal data from the experiment data by building an animal
table, and removing the animal specific data from the experiment table, so our table now look like
this
Information Technology Services
Practical Database Design in a Research Environment November 29, 2010
Contact [email protected] with questions.
Practical Database Design in a Research Environment Page 22 of 31
This gets our experiment table to what’s called second normal form – all the non-key columns are
dependent on the primary key. Separating the data this way is called decomposing the tables – note that
no data is lost, it’s just moved.
Information Technology Services
Practical Database Design in a Research Environment November 29, 2010
Contact [email protected] with questions.
Practical Database Design in a Research Environment Page 23 of 31
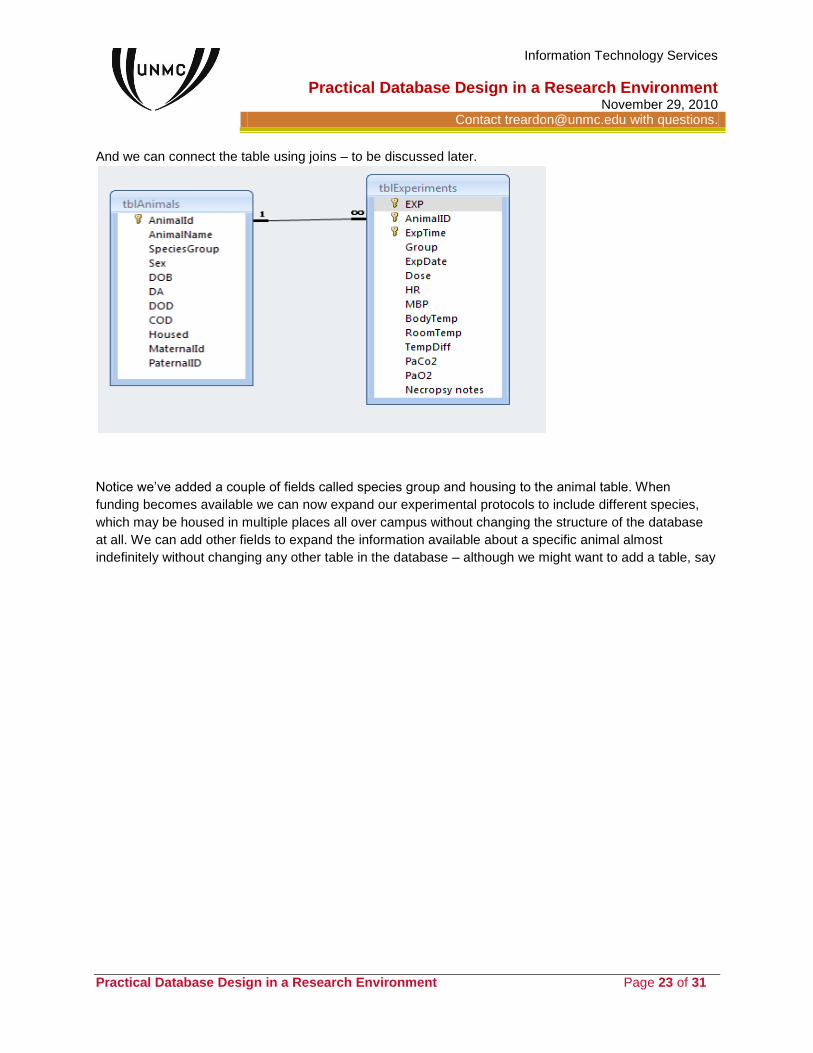
And we can connect the table using joins – to be discussed later.
Notice we’ve added a couple of fields called species group and housing to the animal table. When
funding becomes available we can now expand our experimental protocols to include different species,
which may be housed in multiple places all over campus without changing the structure of the database
at all. We can add other fields to expand the information available about a specific animal almost
indefinitely without changing any other table in the database – although we might want to add a table, say
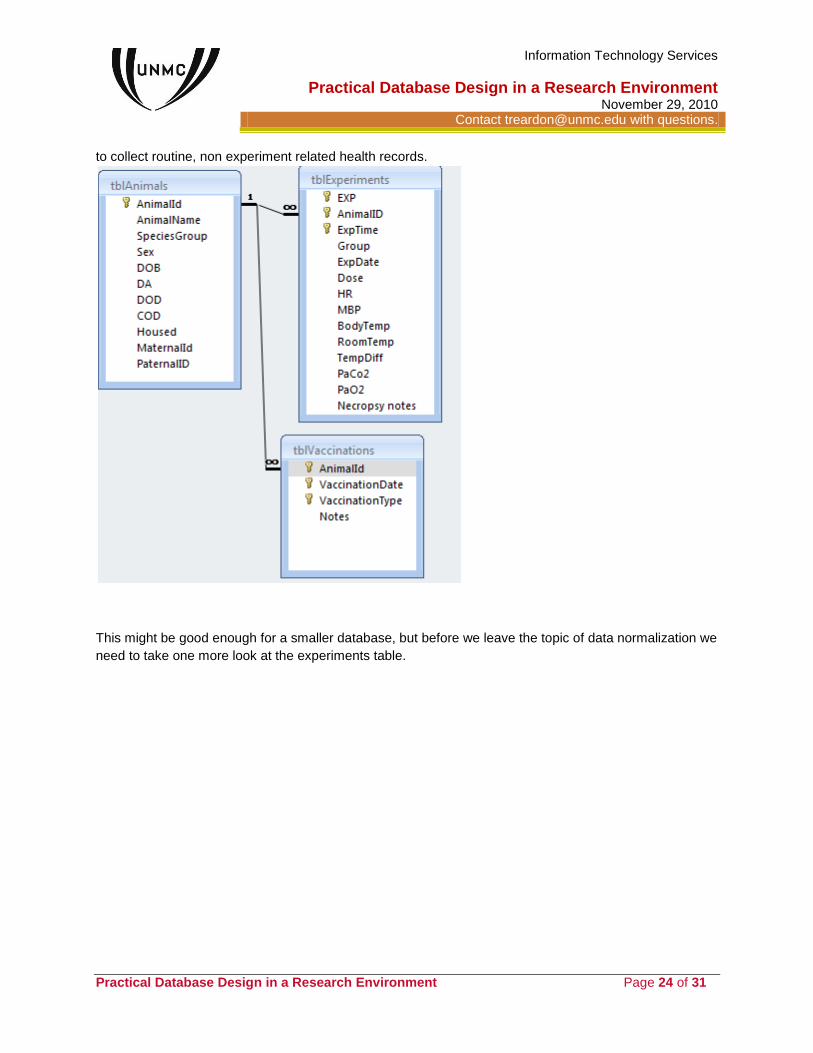
Information Technology Services
Practical Database Design in a Research Environment November 29, 2010
Contact [email protected] with questions.
Practical Database Design in a Research Environment Page 24 of 31
to collect routine, non experiment related health records.
This might be good enough for a smaller database, but before we leave the topic of data normalization we
need to take one more look at the experiments table.
Information Technology Services
Practical Database Design in a Research Environment November 29, 2010
Contact [email protected] with questions.
Practical Database Design in a Research Environment Page 25 of 31
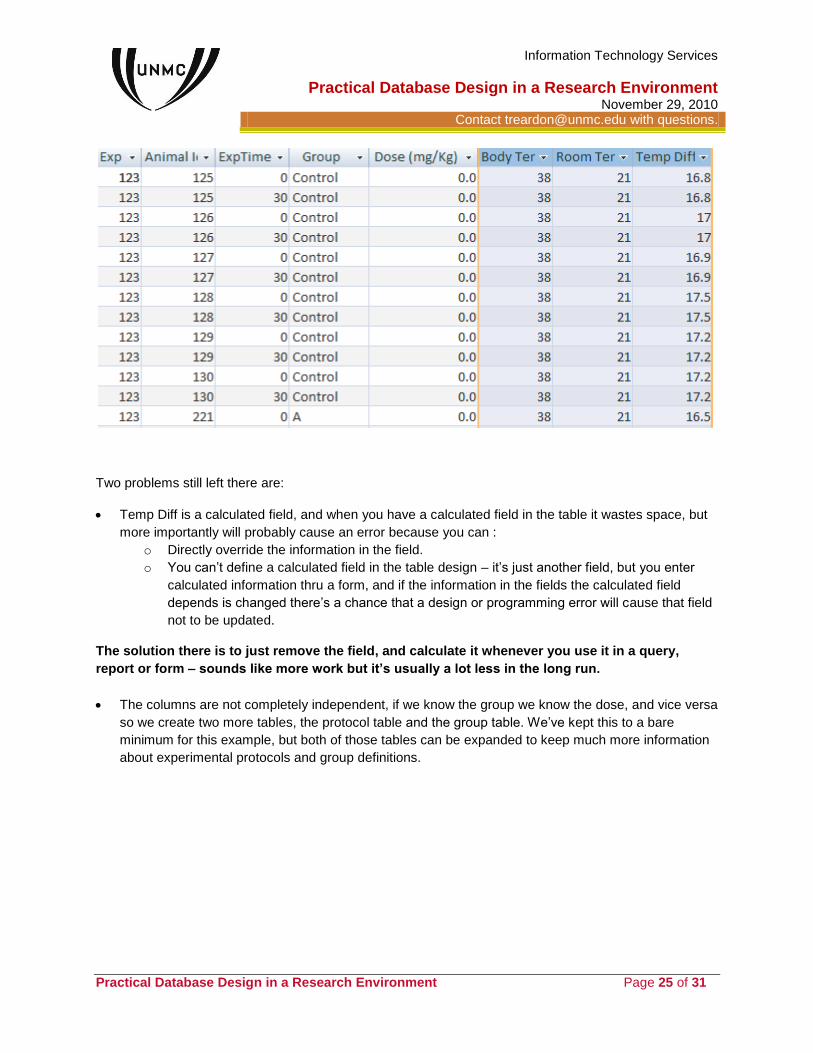
Two problems still left there are:
Temp Diff is a calculated field, and when you have a calculated field in the table it wastes space, but
more importantly will probably cause an error because you can :
o Directly override the information in the field.
o You can’t define a calculated field in the table design – it’s just another field, but you enter
calculated information thru a form, and if the information in the fields the calculated field
depends is changed there’s a chance that a design or programming error will cause that field
not to be updated.
The solution there is to just remove the field, and calculate it whenever you use it in a query,
report or form – sounds like more work but it’s usually a lot less in the long run.
The columns are not completely independent, if we know the group we know the dose, and vice versa
so we create two more tables, the protocol table and the group table. We’ve kept this to a bare
minimum for this example, but both of those tables can be expanded to keep much more information
about experimental protocols and group definitions.
Information Technology Services
Practical Database Design in a Research Environment November 29, 2010
Contact [email protected] with questions.
Practical Database Design in a Research Environment Page 26 of 31
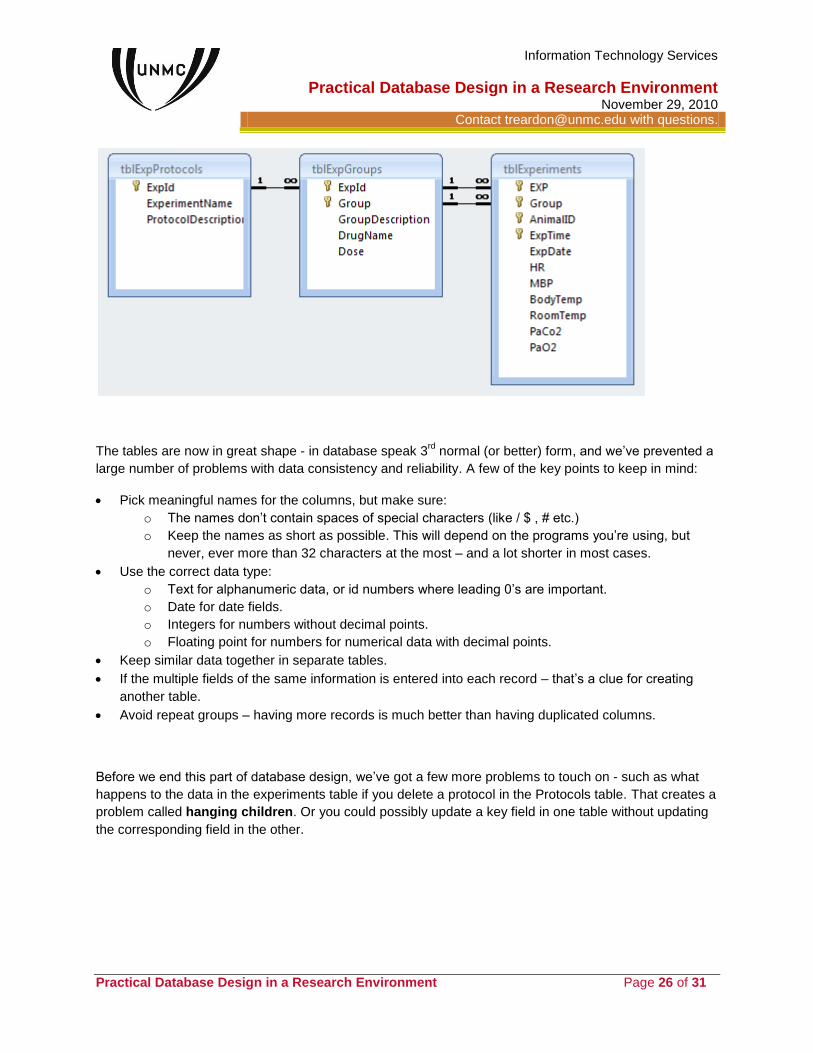
The tables are now in great shape - in database speak 3rd
normal (or better) form, and we’ve prevented a
large number of problems with data consistency and reliability. A few of the key points to keep in mind:
Pick meaningful names for the columns, but make sure:
o The names don’t contain spaces of special characters (like / $ , # etc.)
o Keep the names as short as possible. This will depend on the programs you’re using, but
never, ever more than 32 characters at the most – and a lot shorter in most cases.
Use the correct data type:
o Text for alphanumeric data, or id numbers where leading 0’s are important.
o Date for date fields.
o Integers for numbers without decimal points.
o Floating point for numbers for numerical data with decimal points.
Keep similar data together in separate tables.
If the multiple fields of the same information is entered into each record – that’s a clue for creating
another table.
Avoid repeat groups – having more records is much better than having duplicated columns.
Before we end this part of database design, we’ve got a few more problems to touch on - such as what
happens to the data in the experiments table if you delete a protocol in the Protocols table. That creates a
problem called hanging children. Or you could possibly update a key field in one table without updating
the corresponding field in the other.
Information Technology Services
Practical Database Design in a Research Environment November 29, 2010
Contact [email protected] with questions.
Practical Database Design in a Research Environment Page 27 of 31
Relationships Relationships are used to connect the data from one table to another by defining what are called joins –
connecting specific fields in the tables - and by enforcing referential integrity we can prevent hanging child
records.
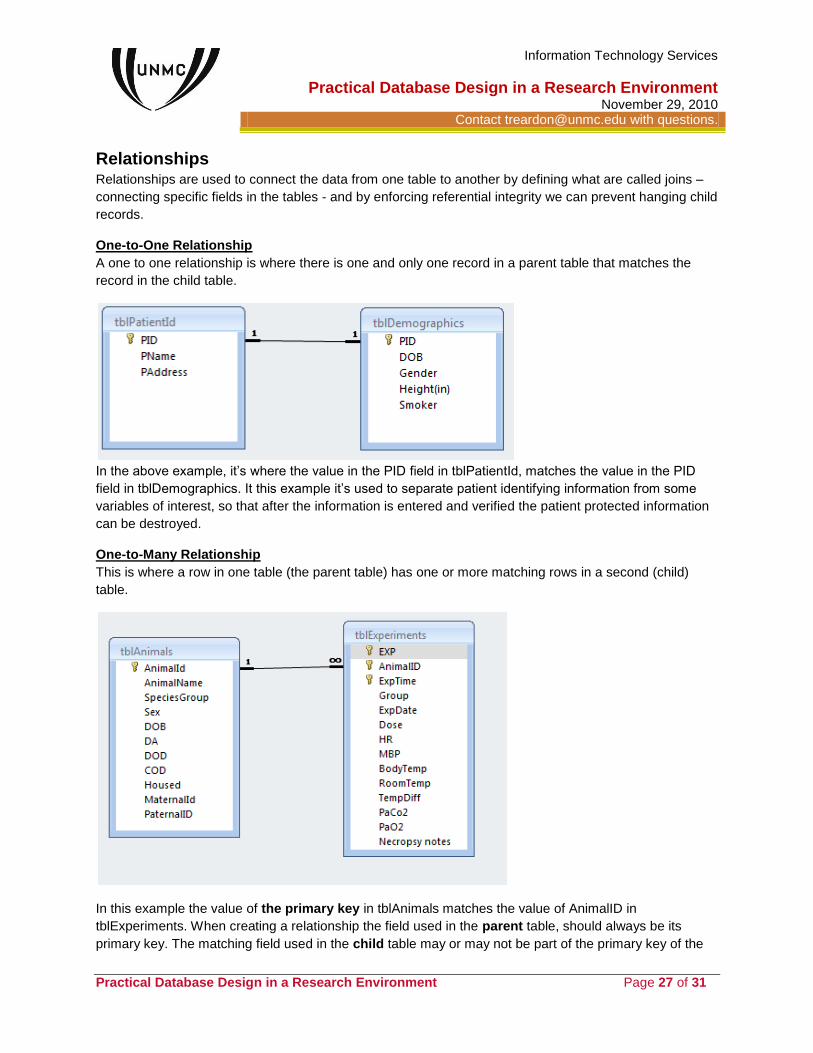
One-to-One Relationship
A one to one relationship is where there is one and only one record in a parent table that matches the
record in the child table.
In the above example, it’s where the value in the PID field in tblPatientId, matches the value in the PID
field in tblDemographics. It this example it’s used to separate patient identifying information from some
variables of interest, so that after the information is entered and verified the patient protected information
can be destroyed.
One-to-Many Relationship
This is where a row in one table (the parent table) has one or more matching rows in a second (child)
table.
In this example the value of the primary key in tblAnimals matches the value of AnimalID in
tblExperiments. When creating a relationship the field used in the parent table, should always be its
primary key. The matching field used in the child table may or may not be part of the primary key of the
Information Technology Services
Practical Database Design in a Research Environment November 29, 2010
Contact [email protected] with questions.
Practical Database Design in a Research Environment Page 28 of 31
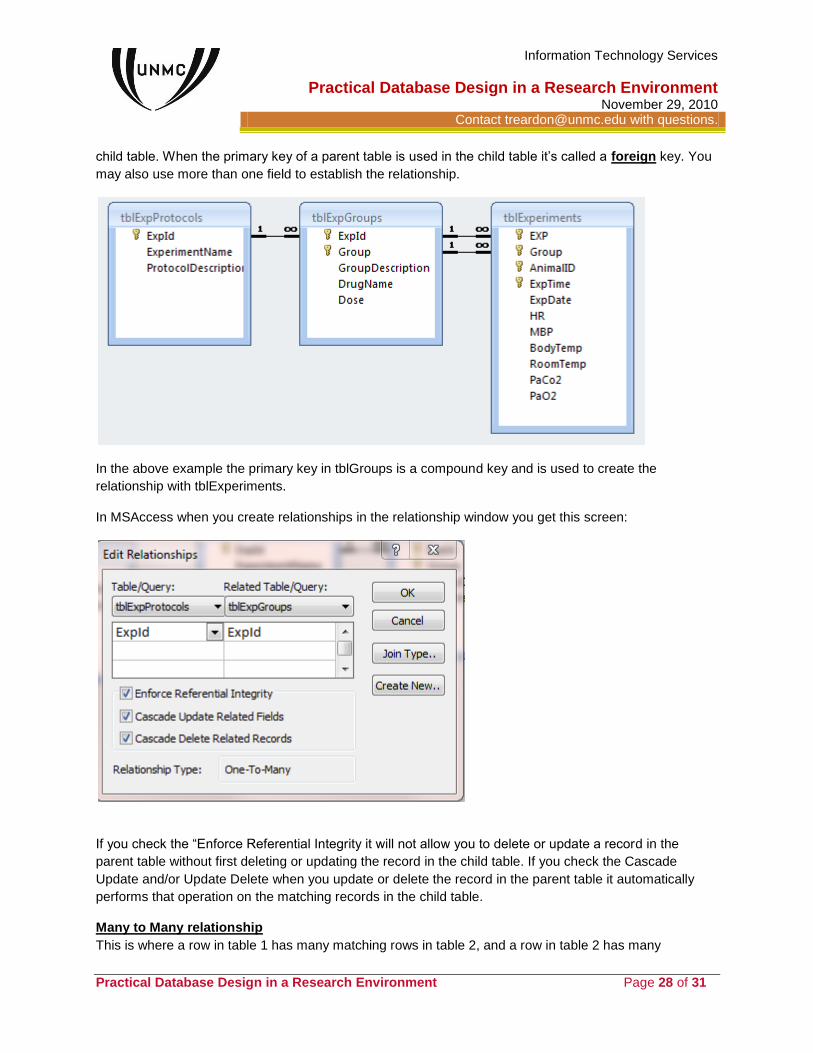
child table. When the primary key of a parent table is used in the child table it’s called a foreign key. You
may also use more than one field to establish the relationship.
In the above example the primary key in tblGroups is a compound key and is used to create the
relationship with tblExperiments.
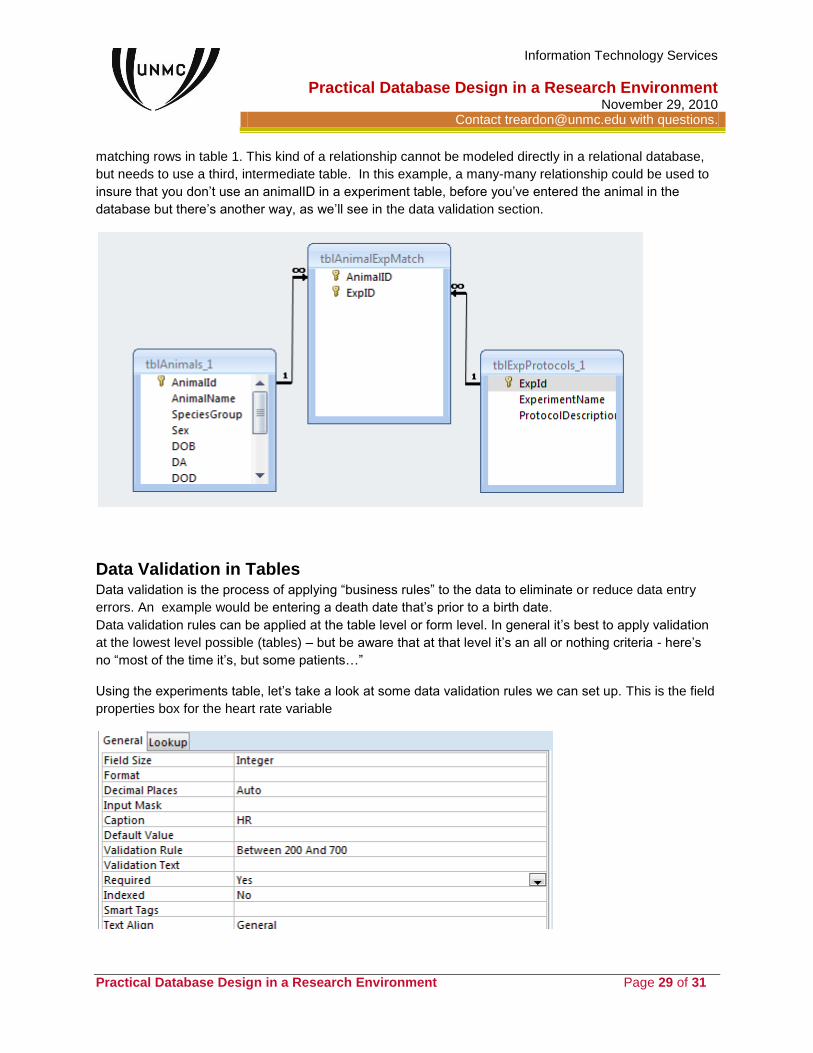
In MSAccess when you create relationships in the relationship window you get this screen:
If you check the “Enforce Referential Integrity it will not allow you to delete or update a record in the
parent table without first deleting or updating the record in the child table. If you check the Cascade
Update and/or Update Delete when you update or delete the record in the parent table it automatically
performs that operation on the matching records in the child table.
Many to Many relationship
This is where a row in table 1 has many matching rows in table 2, and a row in table 2 has many
Information Technology Services
Practical Database Design in a Research Environment November 29, 2010
Contact [email protected] with questions.
Practical Database Design in a Research Environment Page 29 of 31
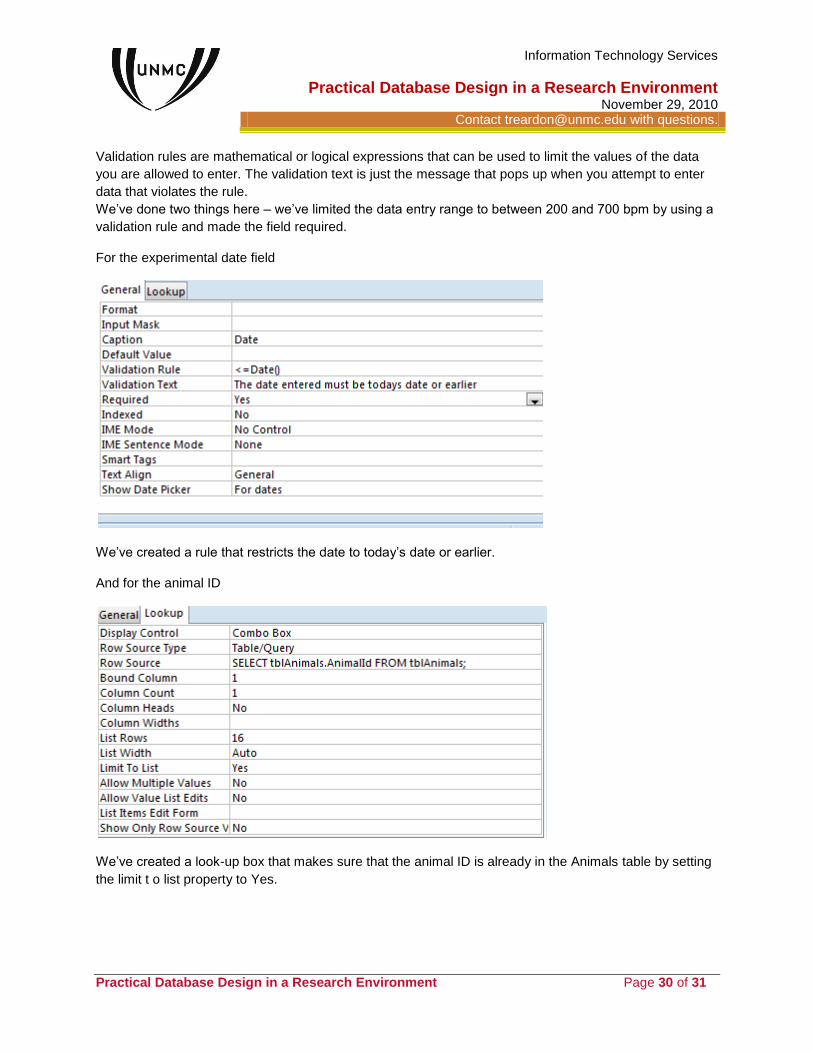
matching rows in table 1. This kind of a relationship cannot be modeled directly in a relational database,
but needs to use a third, intermediate table. In this example, a many-many relationship could be used to
insure that you don’t use an animalID in a experiment table, before you’ve entered the animal in the
database but there’s another way, as we’ll see in the data validation section.
Data Validation in Tables Data validation is the process of applying “business rules” to the data to eliminate or reduce data entry
errors. An example would be entering a death date that’s prior to a birth date.
Data validation rules can be applied at the table level or form level. In general it’s best to apply validation
at the lowest level possible (tables) – but be aware that at that level it’s an all or nothing criteria - here’s
no “most of the time it’s, but some patients…”
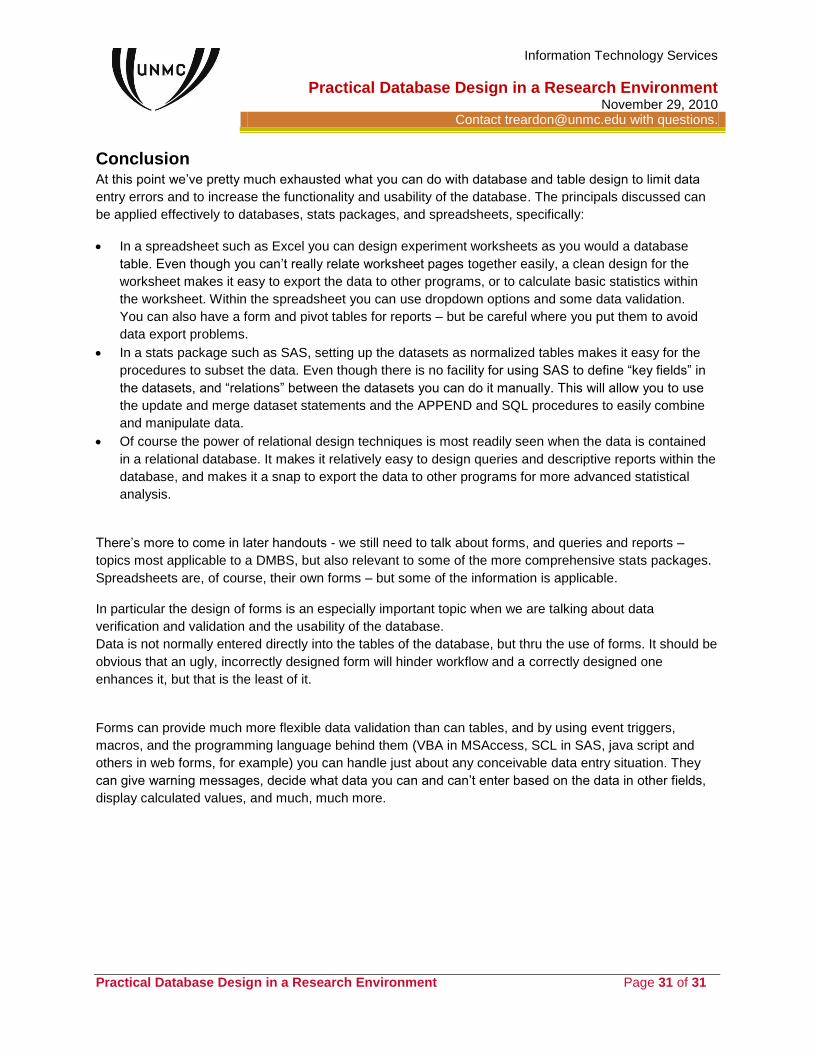
Using the experiments table, let’s take a look at some data validation rules we can set up. This is the field
properties box for the heart rate variable
Information Technology Services
Practical Database Design in a Research Environment November 29, 2010
Contact [email protected] with questions.
Practical Database Design in a Research Environment Page 30 of 31
Validation rules are mathematical or logical expressions that can be used to limit the values of the data
you are allowed to enter. The validation text is just the message that pops up when you attempt to enter
data that violates the rule.
We’ve done two things here – we’ve limited the data entry range to between 200 and 700 bpm by using a
validation rule and made the field required.
For the experimental date field
We’ve created a rule that restricts the date to today’s date or earlier.
And for the animal ID
We’ve created a look-up box that makes sure that the animal ID is already in the Animals table by setting
the limit t o list property to Yes.
Information Technology Services
Practical Database Design in a Research Environment November 29, 2010
Contact [email protected] with questions.
Practical Database Design in a Research Environment Page 31 of 31
Conclusion At this point we’ve pretty much exhausted what you can do with database and table design to limit data
entry errors and to increase the functionality and usability of the database. The principals discussed can
be applied effectively to databases, stats packages, and spreadsheets, specifically:
In a spreadsheet such as Excel you can design experiment worksheets as you would a database
table. Even though you can’t really relate worksheet pages together easily, a clean design for the
worksheet makes it easy to export the data to other programs, or to calculate basic statistics within
the worksheet. Within the spreadsheet you can use dropdown options and some data validation.
You can also have a form and pivot tables for reports – but be careful where you put them to avoid
data export problems.
In a stats package such as SAS, setting up the datasets as normalized tables makes it easy for the
procedures to subset the data. Even though there is no facility for using SAS to define “key fields” in
the datasets, and “relations” between the datasets you can do it manually. This will allow you to use
the update and merge dataset statements and the APPEND and SQL procedures to easily combine
and manipulate data.
Of course the power of relational design techniques is most readily seen when the data is contained
in a relational database. It makes it relatively easy to design queries and descriptive reports within the
database, and makes it a snap to export the data to other programs for more advanced statistical
analysis.
There’s more to come in later handouts - we still need to talk about forms, and queries and reports –
topics most applicable to a DMBS, but also relevant to some of the more comprehensive stats packages.
Spreadsheets are, of course, their own forms – but some of the information is applicable.
In particular the design of forms is an especially important topic when we are talking about data
verification and validation and the usability of the database.
Data is not normally entered directly into the tables of the database, but thru the use of forms. It should be
obvious that an ugly, incorrectly designed form will hinder workflow and a correctly designed one
enhances it, but that is the least of it.
Forms can provide much more flexible data validation than can tables, and by using event triggers,
macros, and the programming language behind them (VBA in MSAccess, SCL in SAS, java script and
others in web forms, for example) you can handle just about any conceivable data entry situation. They
can give warning messages, decide what data you can and can’t enter based on the data in other fields,
display calculated values, and much, much more.