Embed Size (px)
Citation preview
PRACTICAL APPLICATIONS OF PULMONARY FUNCTION TESTS
MODERATOR : DR.G.P SINGH PRESENTERS : DR.SWATI AGGARWAL DR.KARTHIK PONNAPPAN DR.JOKHOORAM
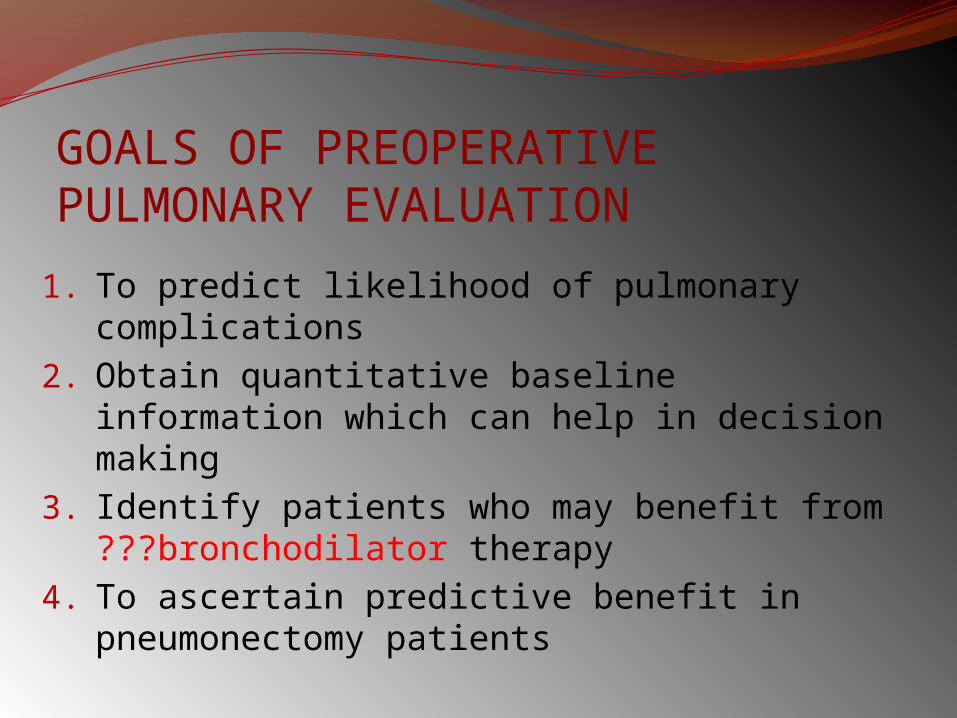
GOALS OF PREOPERATIVE PULMONARY EVALUATION
1. To predict likelihood of pulmonary complications
2. Obtain quantitative baseline information which can help in decision making
3. Identify patients who may benefit from ???bronchodilator therapy
4. To ascertain predictive benefit in pneumonectomy patients
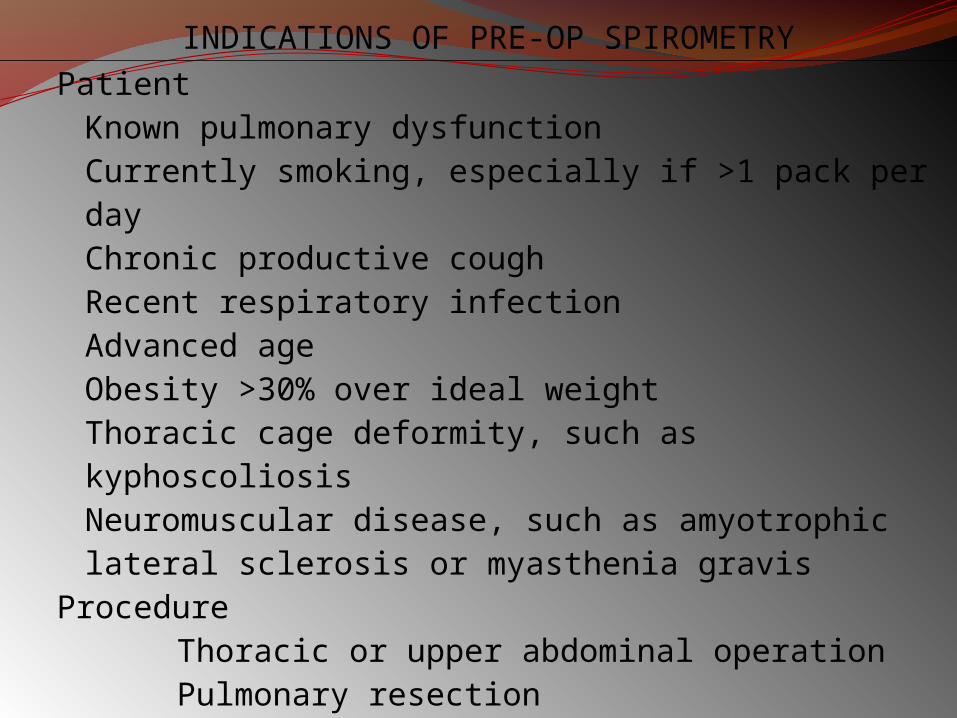
INDICATIONS OF PRE-OP SPIROMETRY Patient
Known pulmonary dysfunctionCurrently smoking, especially if >1 pack per dayChronic productive coughRecent respiratory infectionAdvanced ageObesity >30% over ideal weightThoracic cage deformity, such as kyphoscoliosisNeuromuscular disease, such as amyotrophic lateral sclerosis or myasthenia gravis
ProcedureThoracic or upper abdominal operationPulmonary resectionProlonged anesthesia
4
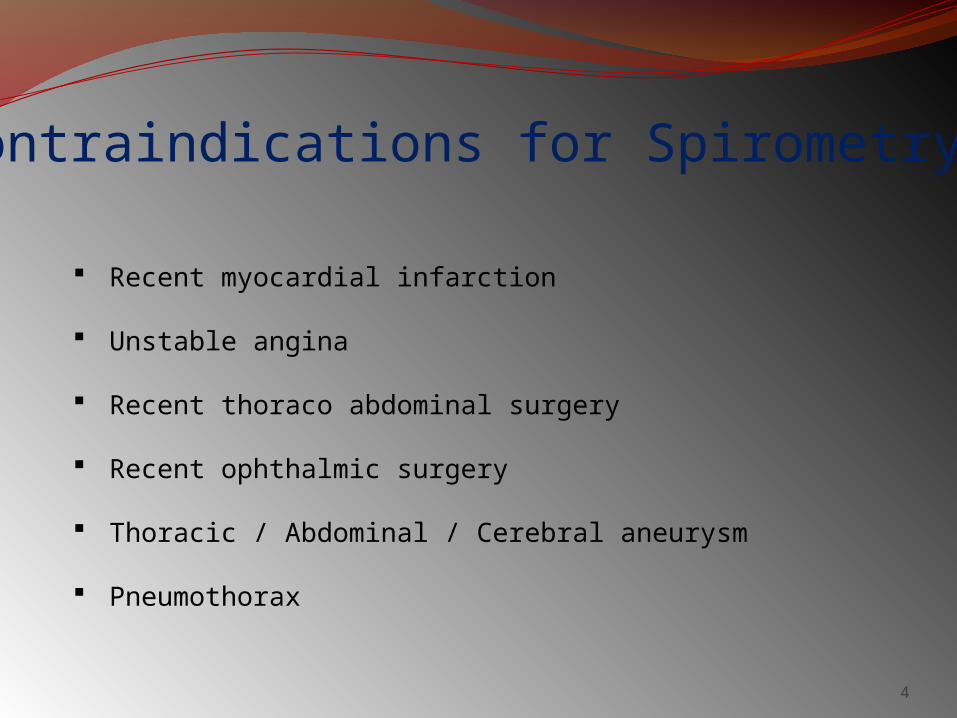
Contraindications for Spirometry
Recent myocardial infarction
Unstable angina
Recent thoraco abdominal surgery
Recent ophthalmic surgery
Thoracic / Abdominal / Cerebral aneurysm
Pneumothorax
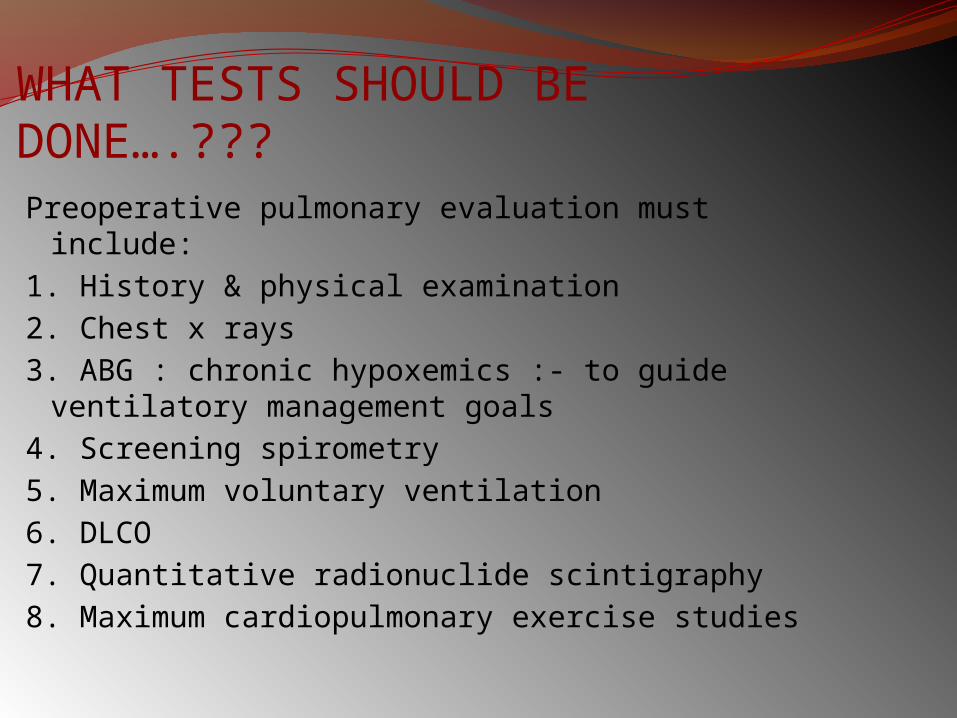
WHAT TESTS SHOULD BE DONE….???Preoperative pulmonary evaluation must include:1. History & physical examination2. Chest x rays 3. ABG : chronic hypoxemics :- to guide
ventilatory management goals 4. Screening spirometry 5. Maximum voluntary ventilation 6. DLCO 7. Quantitative radionuclide scintigraphy 8. Maximum cardiopulmonary exercise studies
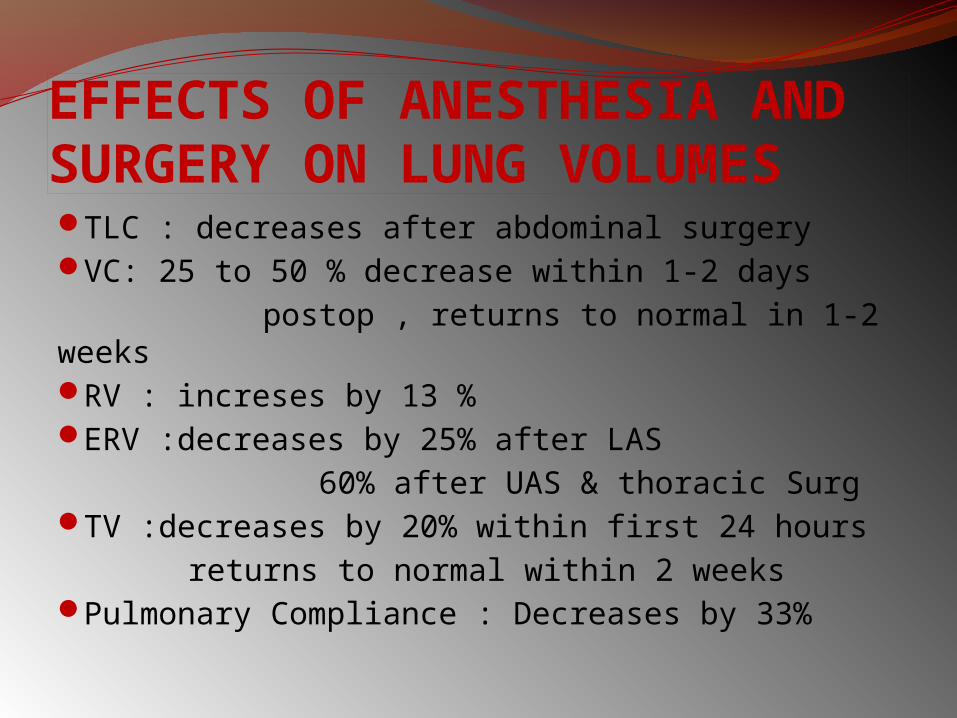
EFFECTS OF ANESTHESIA AND SURGERY ON LUNG VOLUMESTLC : decreases after abdominal surgery VC: 25 to 50 % decrease within 1-2 days postop , returns to normal in 1-2 weeks RV : increses by 13 %ERV :decreases by 25% after LAS 60% after UAS & thoracic Surg TV :decreases by 20% within first 24 hours returns to normal within 2 weeks Pulmonary Compliance : Decreases by 33%
APPLIED ASPECTS OF SOME LUNG CAPACITIES
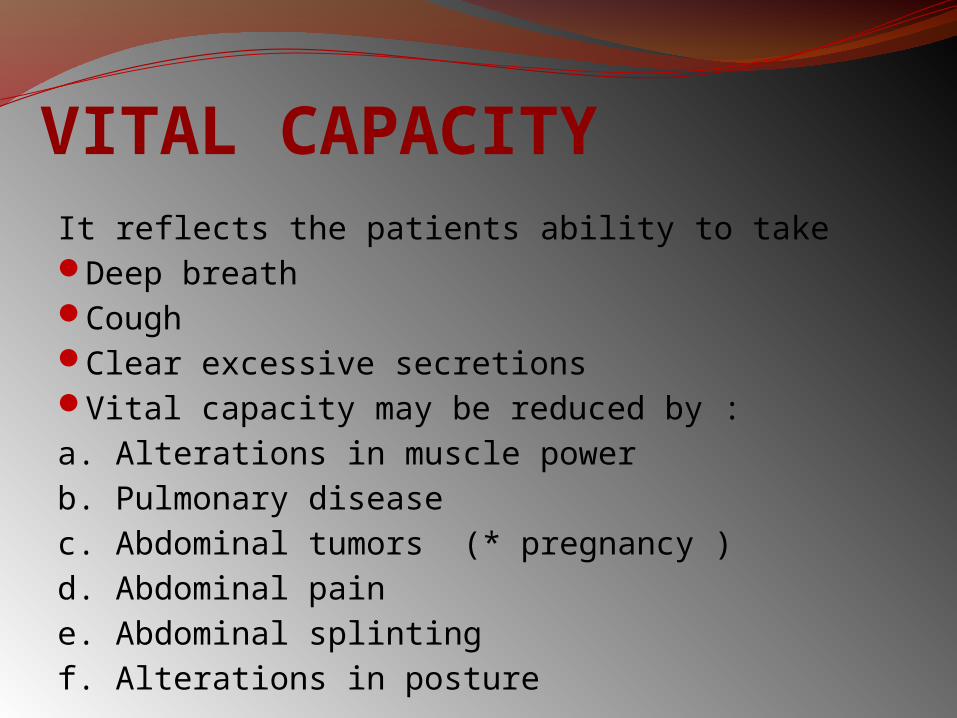
VITAL CAPACITYIt reflects the patients ability to takeDeep breath CoughClear excessive secretionsVital capacity may be reduced by : a. Alterations in muscle power b. Pulmonary disease c. Abdominal tumors (* pregnancy )d. Abdominal pain e. Abdominal splintingf. Alterations in posture
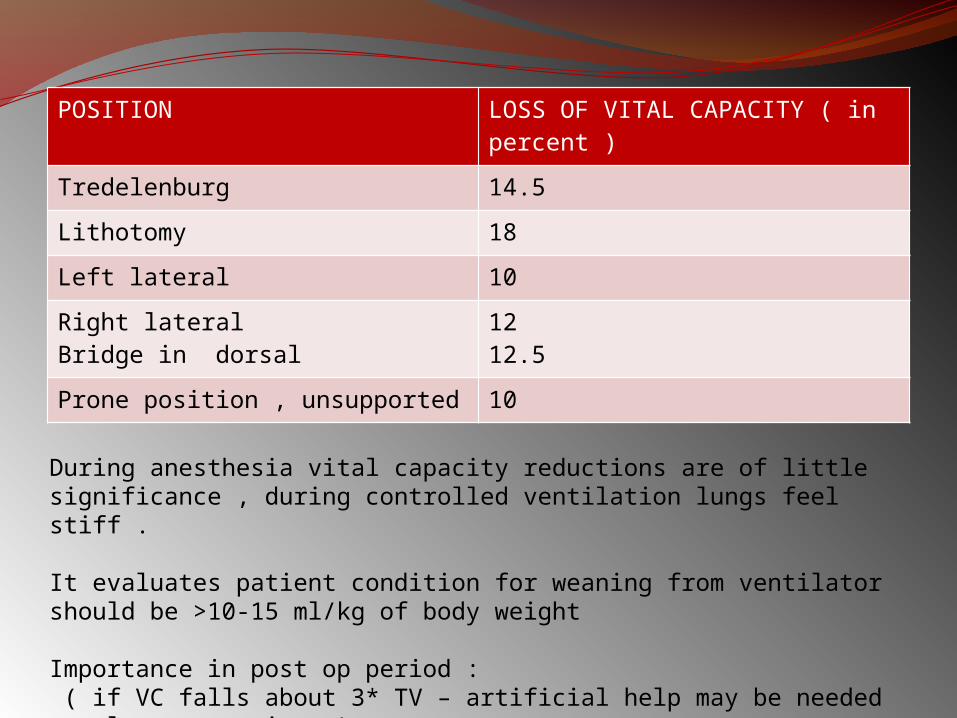
POSITION LOSS OF VITAL CAPACITY ( in percent )
Tredelenburg 14.5
Lithotomy 18
Left lateral 10
Right lateralBridge in dorsal
1212.5
Prone position , unsupported 10
During anesthesia vital capacity reductions are of little significance , during controlled ventilation lungs feel stiff .
It evaluates patient condition for weaning from ventilator should be >10-15 ml/kg of body weight Importance in post op period : ( if VC falls about 3* TV – artificial help may be needed to clear secretions )
RESIDUAL VOLUMEDepends on limits of chest wall expansion and small airways collapse Any increase in it signifies lung is larger than usual and cannot empty adequately occurs in
- After thoracic operations - OAD

11
It greatly influences ventilation–perfusion relationships within
the lung (when FRC is reduced , venous admixture increases &
results in arterial hypoxemia , mechanism can b understood by
its relationship with closing capacity )
FUNCTIONAL RESIDUAL CAPACITYNormally FRC is 40-50% of the TLC (30ml/kg IBW )
FRC determines two primary physiologic functions
1. the elastic pressure–volume
relationships within the lung.
At FRC chest wall and the
lung are in equilibrium with
each other
2. oxygen reserve when apnea
occurs
12
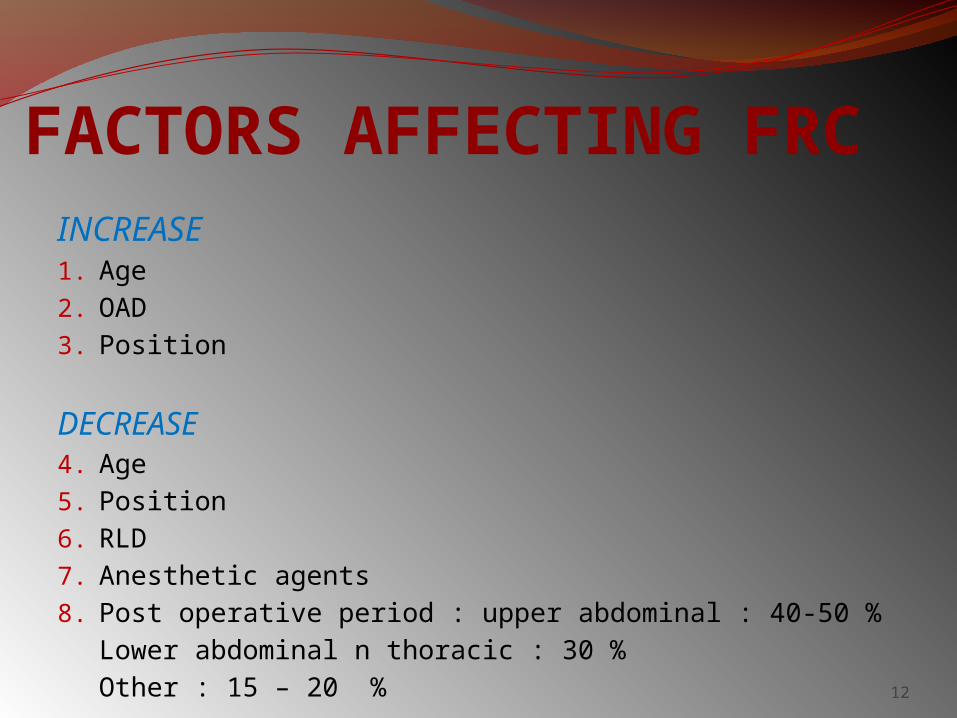
FACTORS AFFECTING FRCINCREASE
1. Age 2. OAD3. Position
DECREASE4. Age 5. Position 6. RLD7. Anesthetic agents8. Post operative period : upper abdominal : 40-50 % Lower abdominal n thoracic : 30 %
Other : 15 – 20 %
13
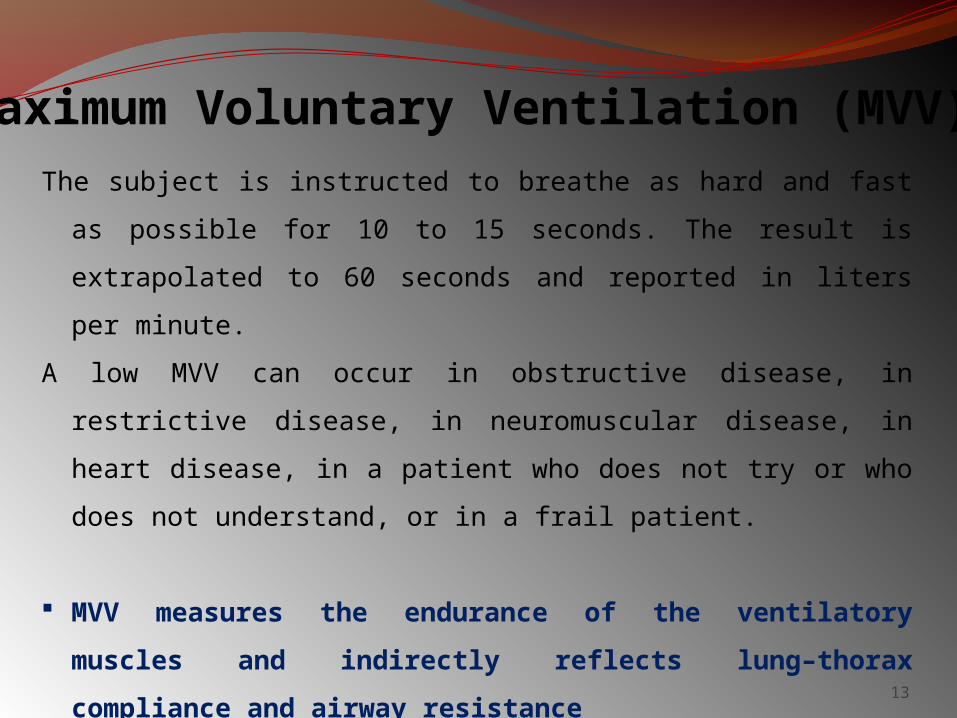
The subject is instructed to breathe as hard and fast as possible
for 10 to 15 seconds. The result is extrapolated to 60 seconds
and reported in liters per minute.
A low MVV can occur in obstructive disease, in restrictive
disease, in neuromuscular disease, in heart disease, in a
patient who does not try or who does not understand, or in a
frail patient.
MVV measures the endurance of the ventilatory
muscles and indirectly reflects lung–thorax compliance
and airway resistance
Maximum Voluntary Ventilation (MVV)
14
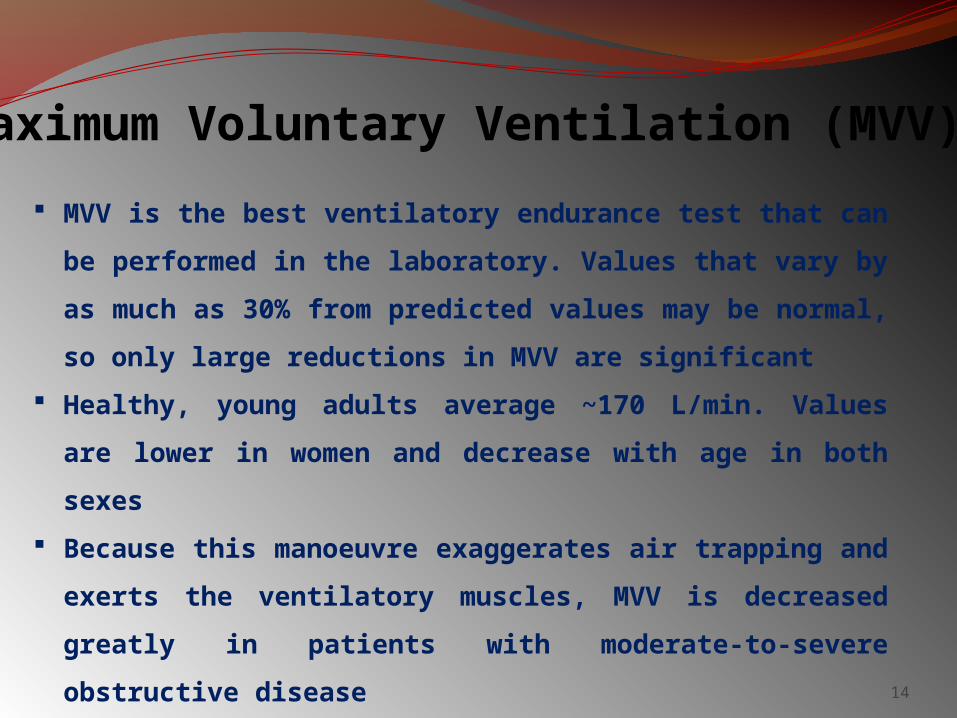
MVV is the best ventilatory endurance test that can be
performed in the laboratory. Values that vary by as
much as 30% from predicted values may be normal, so
only large reductions in MVV are significant
Healthy, young adults average ~170 L/min. Values are
lower in women and decrease with age in both sexes
Because this manoeuvre exaggerates air trapping and
exerts the ventilatory muscles, MVV is decreased
greatly in patients with moderate-to-severe obstructive
disease
MVV is usually normal in patients with restrictive
disease
Maximum Voluntary Ventilation (MVV)
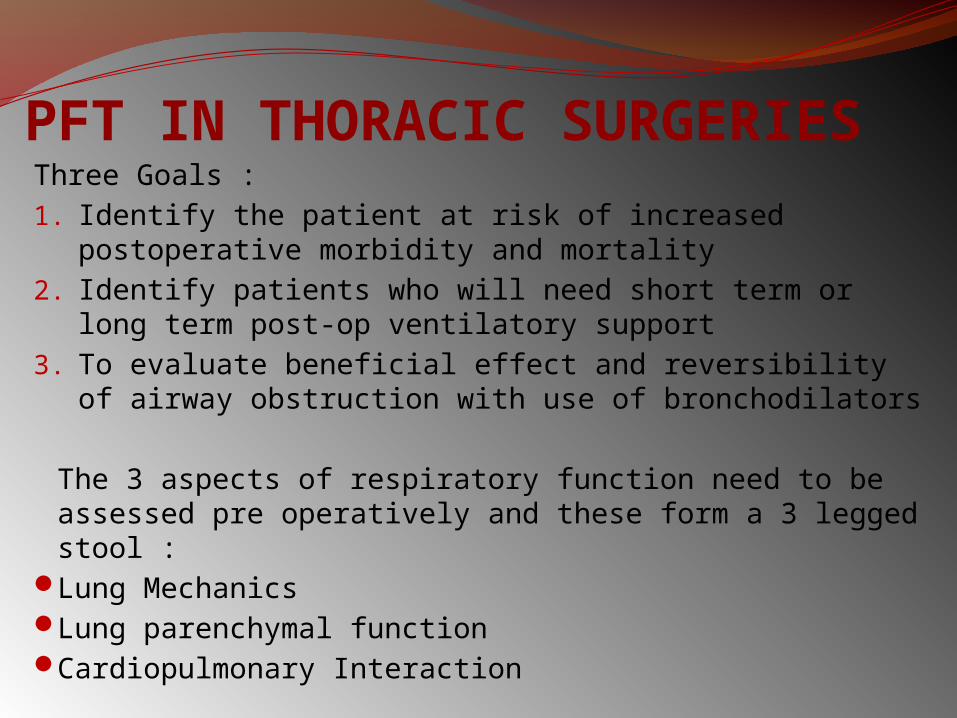
PFT IN THORACIC SURGERIES Three Goals :1. Identify the patient at risk of increased postoperative
morbidity and mortality 2. Identify patients who will need short term or long term
post-op ventilatory support 3. To evaluate beneficial effect and reversibility of airway
obstruction with use of bronchodilators
The 3 aspects of respiratory function need to be assessed pre operatively and these form a 3 legged stool :
Lung Mechanics Lung parenchymal function Cardiopulmonary Interaction
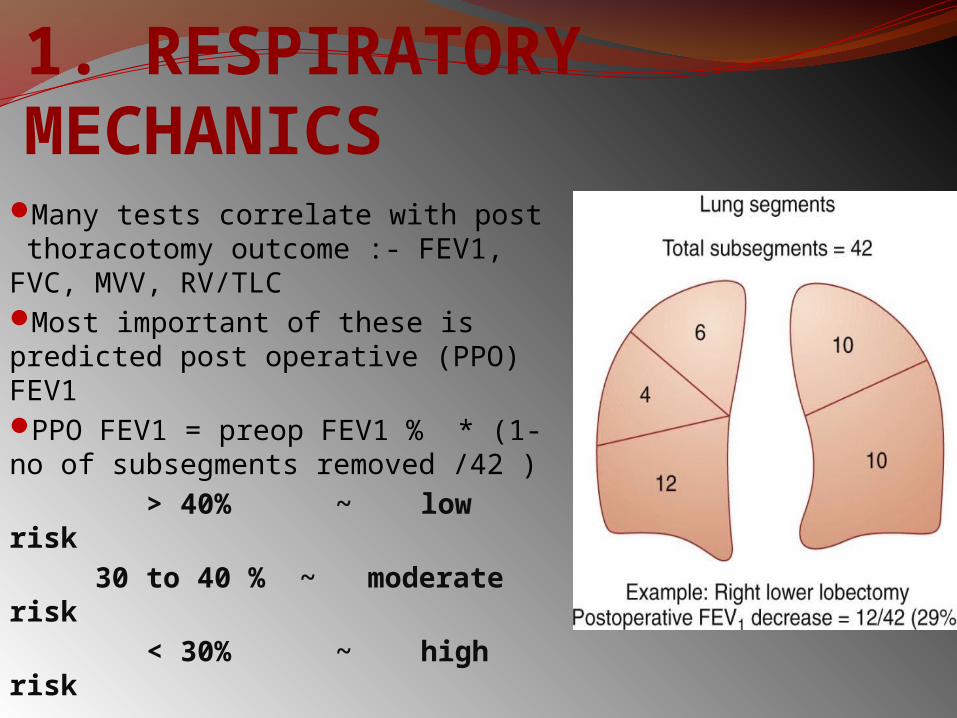
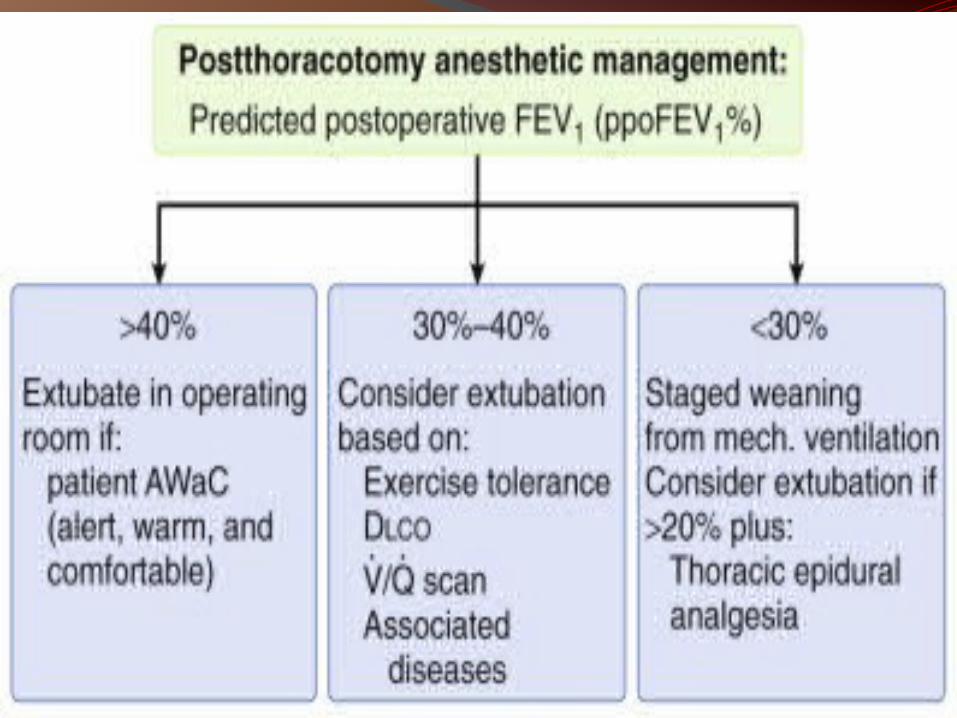
1. RESPIRATORY MECHANICSMany tests correlate with post thoracotomy outcome :- FEV1, FVC, MVV, RV/TLC Most important of these is predicted post operative (PPO) FEV1PPO FEV1 = preop FEV1 % * (1- no of subsegments removed /42 ) > 40% ~ low risk 30 to 40 % ~ moderate risk < 30% ~ high risk
2. LUNG PARENCHYMAL FUNCTIONThe lungs ability to exchanger O2 and CO2 between pulmonary vascular bed and alveoli is assessed by : 1.ABG : cut offs PaO2 < 60 mmHg, PaCO2 > 45 mmHg , the patients who do not meet these warning criterias are at increased risk 2.DLCO : correlates with total functioning cross sectional area of alveolar capillary interface, corrected DLCO can be used to calculate post transection DLCO ppoDLCO <40 % - correlates with increased respiratory and cardiac complications
<20 %- unaccepatably high periop mortality rate
3.CARDIOPULMONARY INTERACTION Laboratory exercise testing – gold standard
Maximal O2 Consumption (VO2max) – most
useful predictor of post-thoracotomy outcome
Stair climbing
1 flight means 20 steps with 6 inches/step
5 flights - VO2max > 20 mL/kg/min
2 flights - VO2max > 12 mL/kg/min
6MWT – 6 Minute Walk Test
Less than 2000 feet (610 m)
correlates to VO2max < 15 mL/kg/min
Fall in SpO2 more than 4 % during
exercise
Estimated ppoVO2max < 10 mL/kg/min is
an absolute contraindication for
pulmonary resection
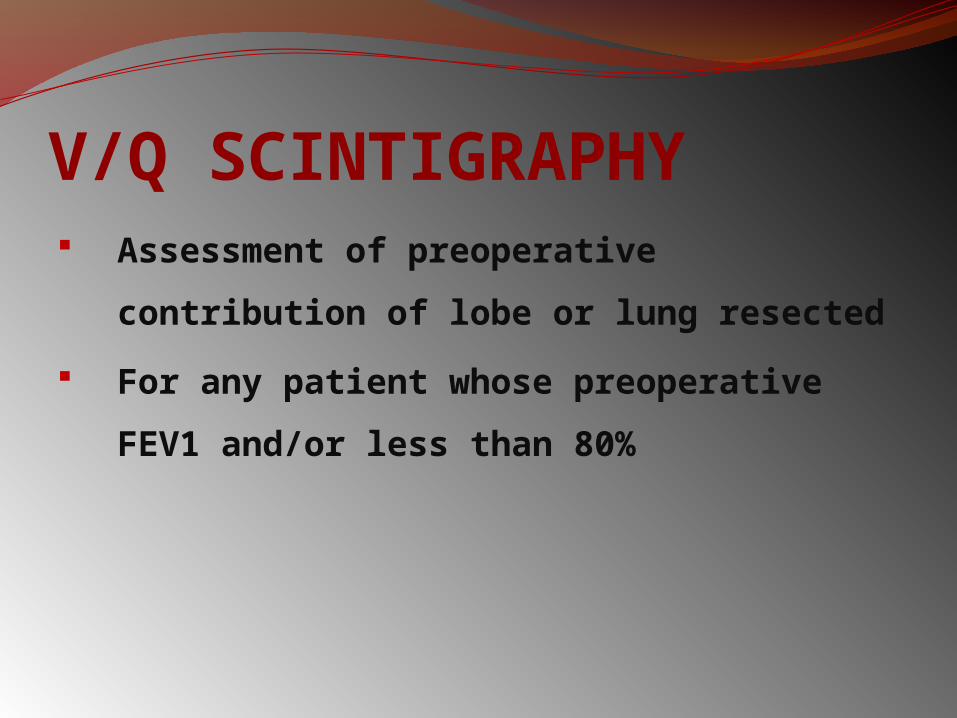
V/Q SCINTIGRAPHY Assessment of preoperative
contribution of lobe or lung resected
For any patient whose preoperative
FEV1 and/or less than 80%
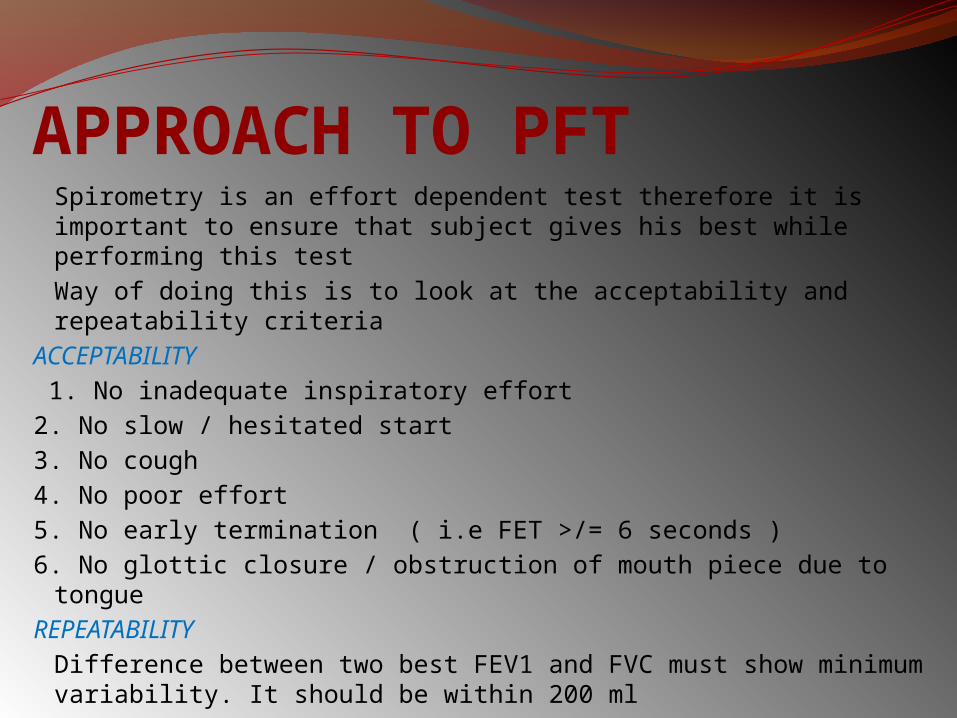
APPROACH TO PFT Spirometry is an effort dependent test therefore it is important to ensure that subject gives his best while performing this test Way of doing this is to look at the acceptability and repeatability criteria
ACCEPTABILITY 1. No inadequate inspiratory effort 2. No slow / hesitated start 3. No cough 4. No poor effort 5. No early termination ( i.e FET >/= 6 seconds )6. No glottic closure / obstruction of mouth piece due to tongueREPEATABILITY
Difference between two best FEV1 and FVC must show minimum variability. It should be within 200 ml
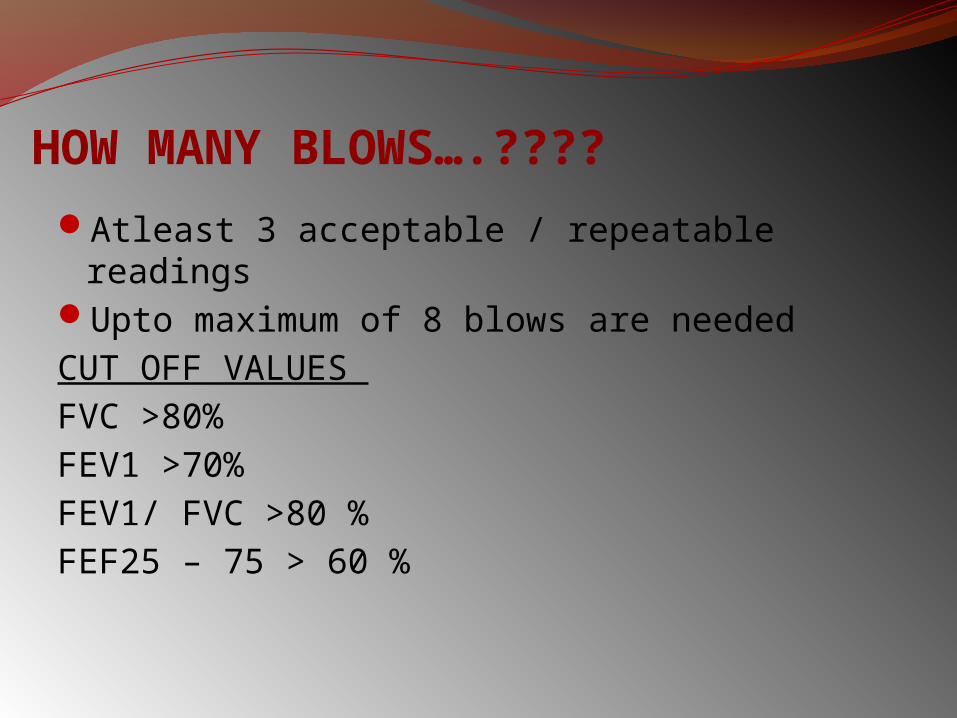
HOW MANY BLOWS….????Atleast 3 acceptable / repeatable readings Upto maximum of 8 blows are needed CUT OFF VALUES FVC >80% FEV1 >70%FEV1/ FVC >80 %FEF25 – 75 > 60 %
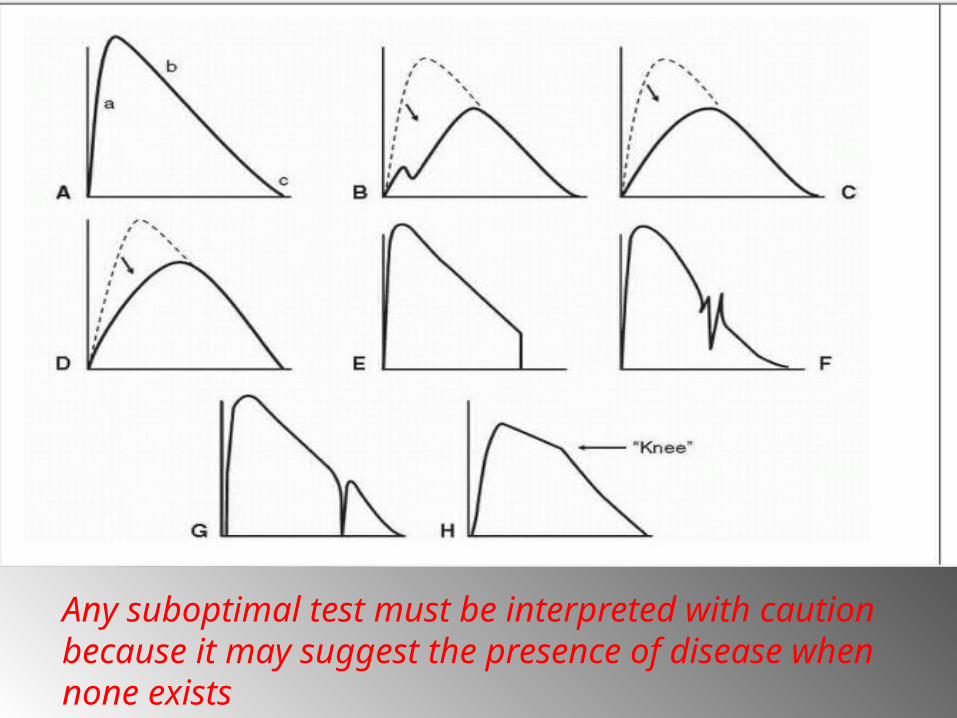
Any suboptimal test must be interpreted with caution because it may suggest the presence of disease when none exists
STEPS FOR PFT INTERPRETATION
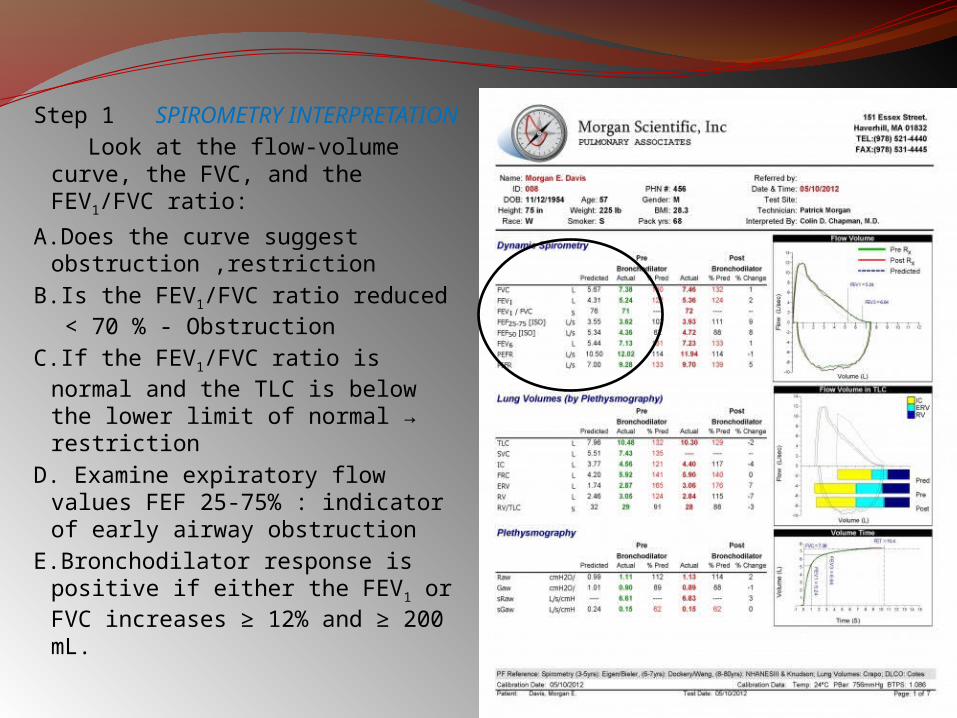
Step 1 SPIROMETRY INTERPRETATION
Look at the flow-volume curve, the FVC, and the FEV1/FVC ratio:
A.Does the curve suggest obstruction ,restriction
B.Is the FEV1/FVC ratio reduced < 70 % - Obstruction
C.If the FEV1/FVC ratio is normal and the TLC is below the lower limit of normal → restriction
D. Examine expiratory flow values FEF 25-75% : indicator of early airway obstruction
E.Bronchodilator response is positive if either the FEV1 or FVC increases ≥ 12% and ≥ 200 mL.
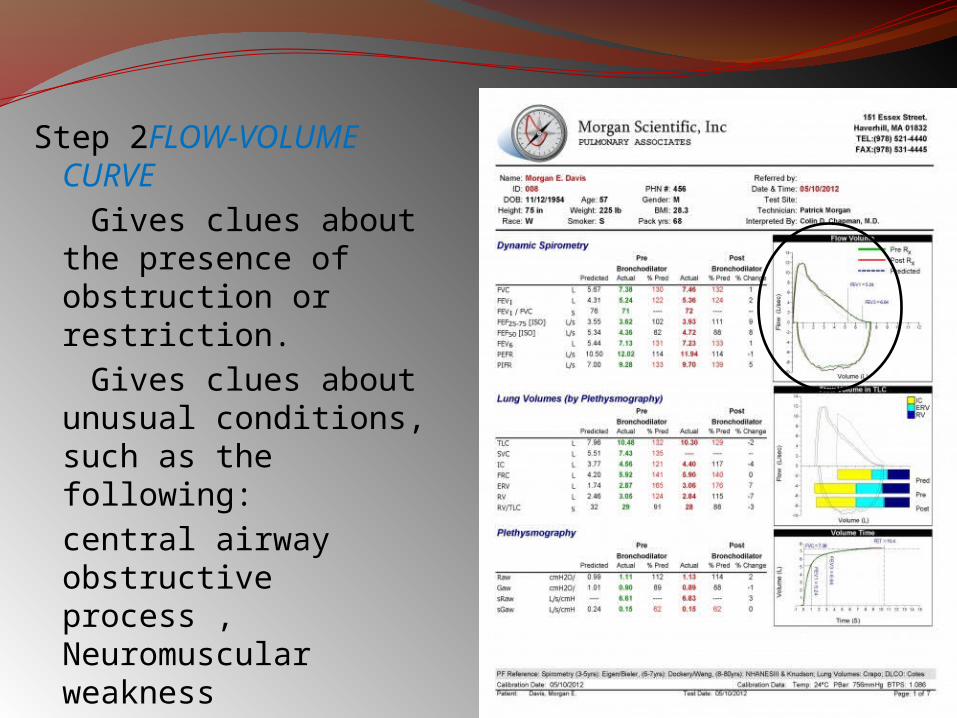
Step 2FLOW-VOLUME CURVE
Gives clues about the presence of obstruction or restriction.
Gives clues about unusual conditions, such as the following:
central airway obstructive process , Neuromuscular weakness
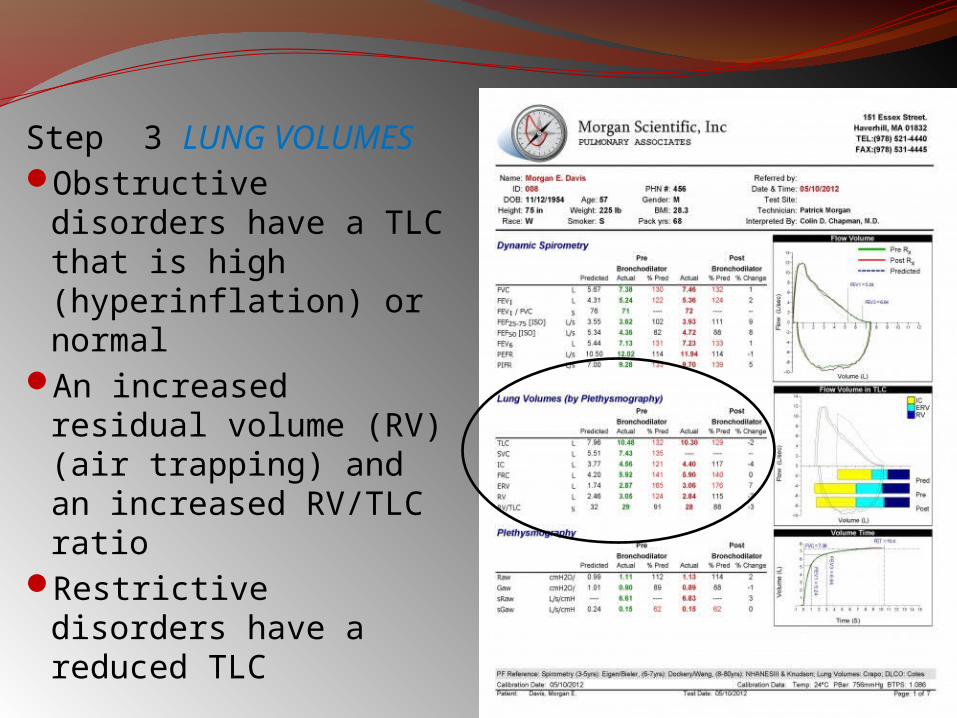
Step 3 LUNG VOLUMESObstructive disorders
have a TLC that is high (hyperinflation) or normal
An increased residual volume (RV) (air trapping) and an increased RV/TLC ratio
Restrictive disorders have a reduced TLC
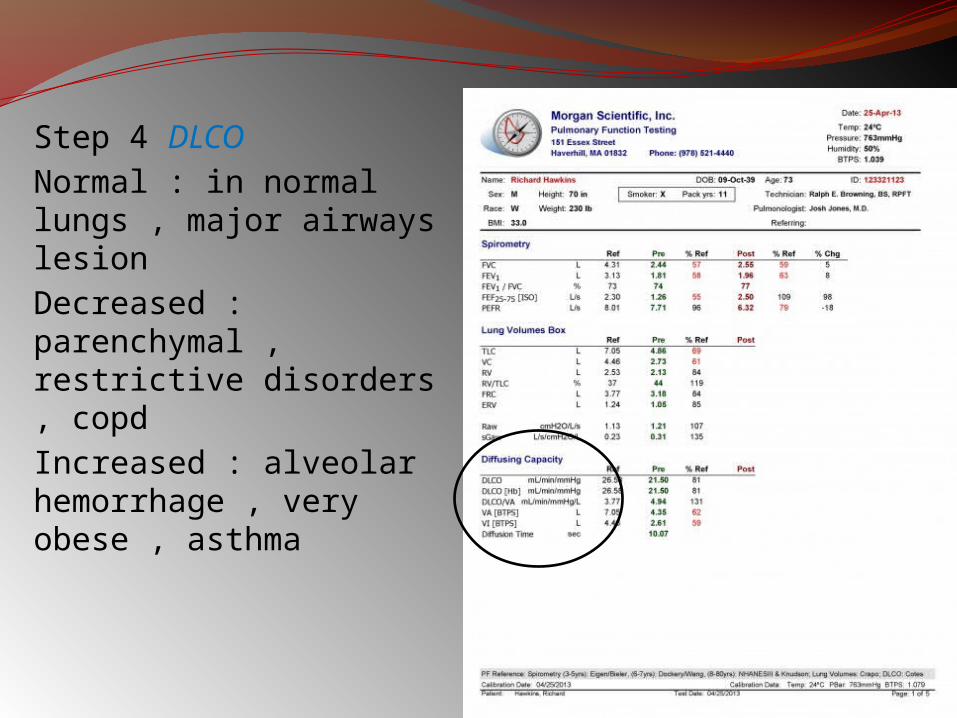
Step 4 DLCONormal : in normal lungs , major airways lesion Decreased : parenchymal , restrictive disorders , copd Increased : alveolar hemorrhage , very obese , asthma
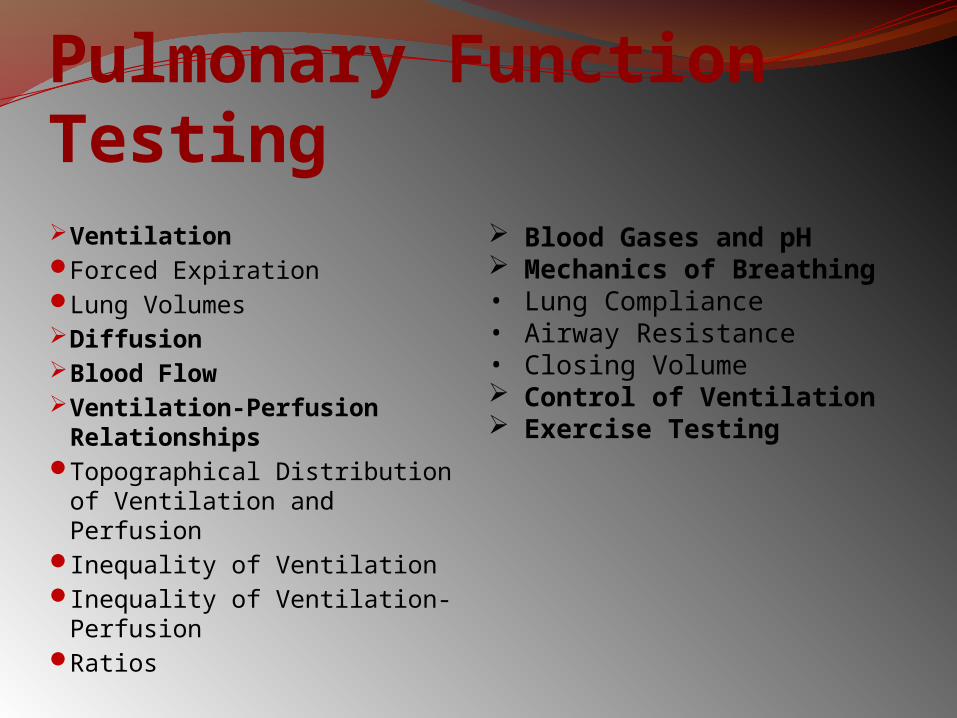
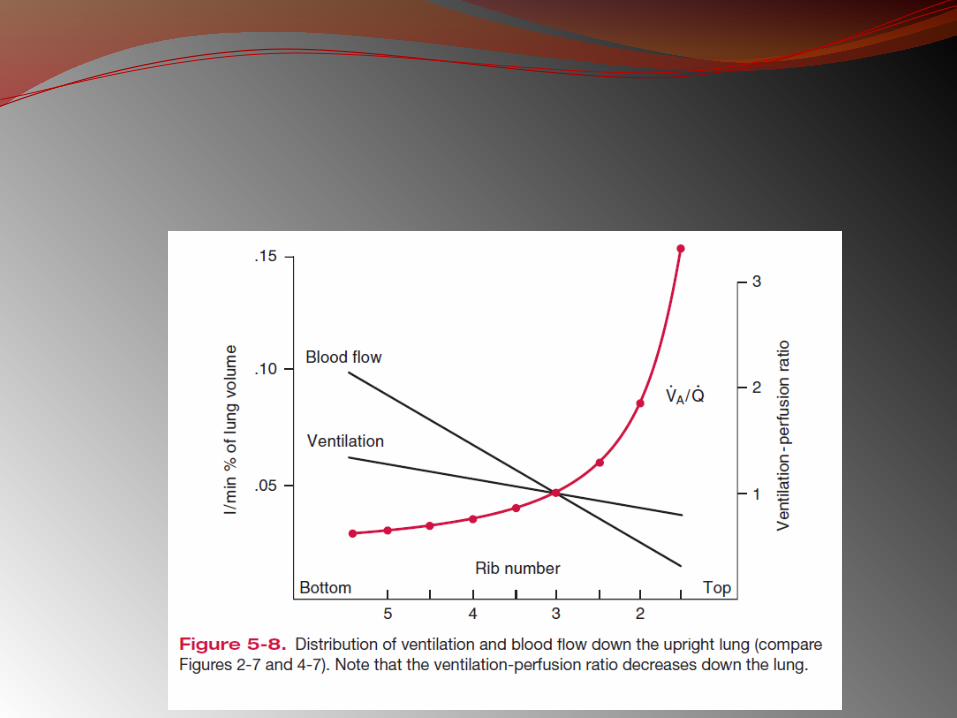
Pulmonary Function Testing VentilationForced ExpirationLung Volumes Diffusion Blood Flow Ventilation-Perfusion
RelationshipsTopographical Distribution
of Ventilation and PerfusionInequality of VentilationInequality of Ventilation-
PerfusionRatios
Blood Gases and pH Mechanics of Breathing• Lung Compliance• Airway Resistance• Closing Volume Control of Ventilation Exercise Testing
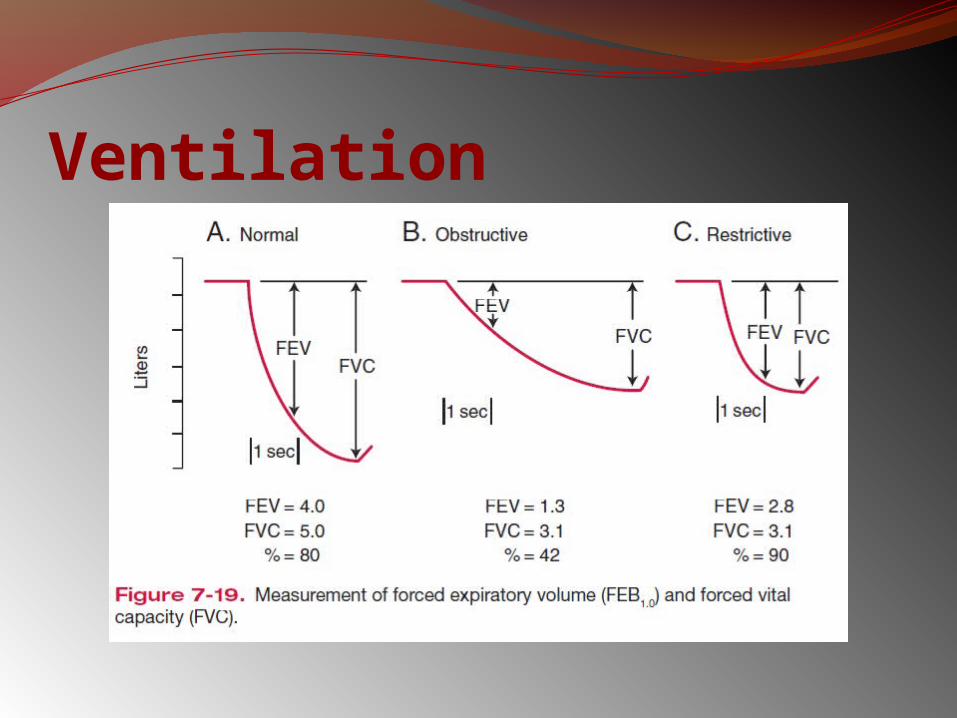
Ventilation
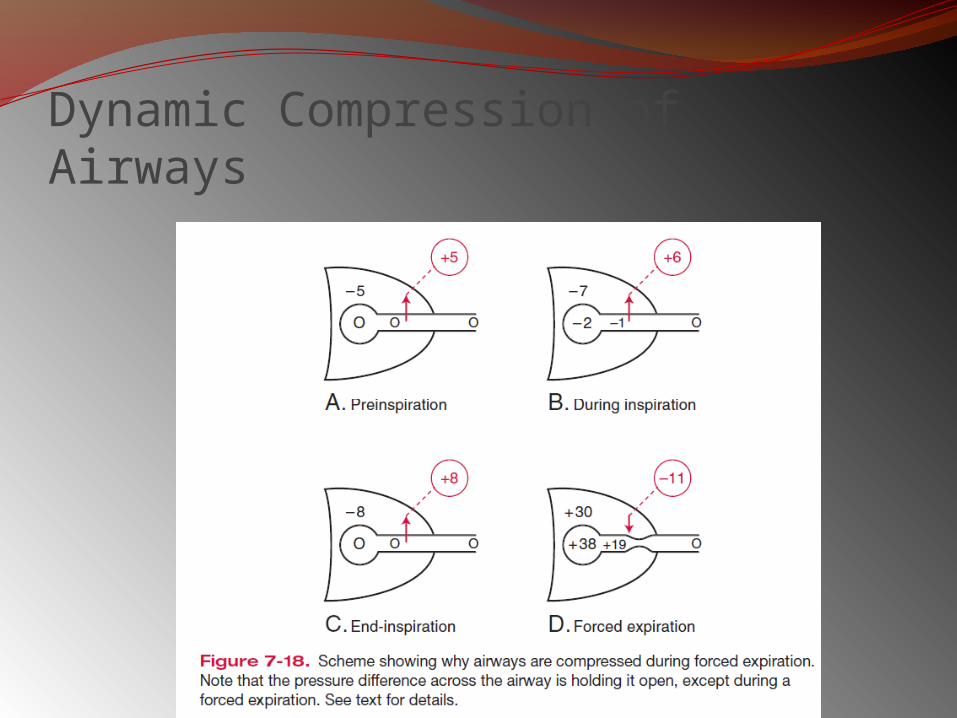
Dynamic Compression of Airways
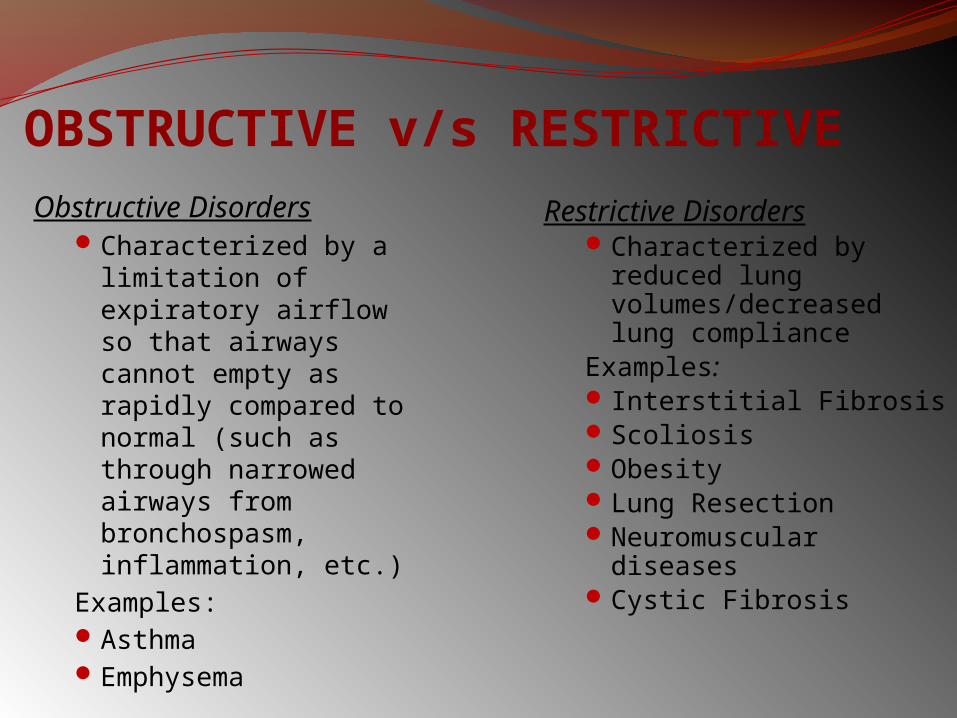
OBSTRUCTIVE v/s RESTRICTIVEObstructive Disorders
Characterized by a limitation of expiratory airflow so that airways cannot empty as rapidly compared to normal (such as through narrowed airways from bronchospasm, inflammation, etc.)
Examples:AsthmaEmphysema
Restrictive DisordersCharacterized by
reduced lung volumes/decreased lung compliance
Examples: Interstitial FibrosisScoliosisObesityLung ResectionNeuromuscular diseasesCystic Fibrosis
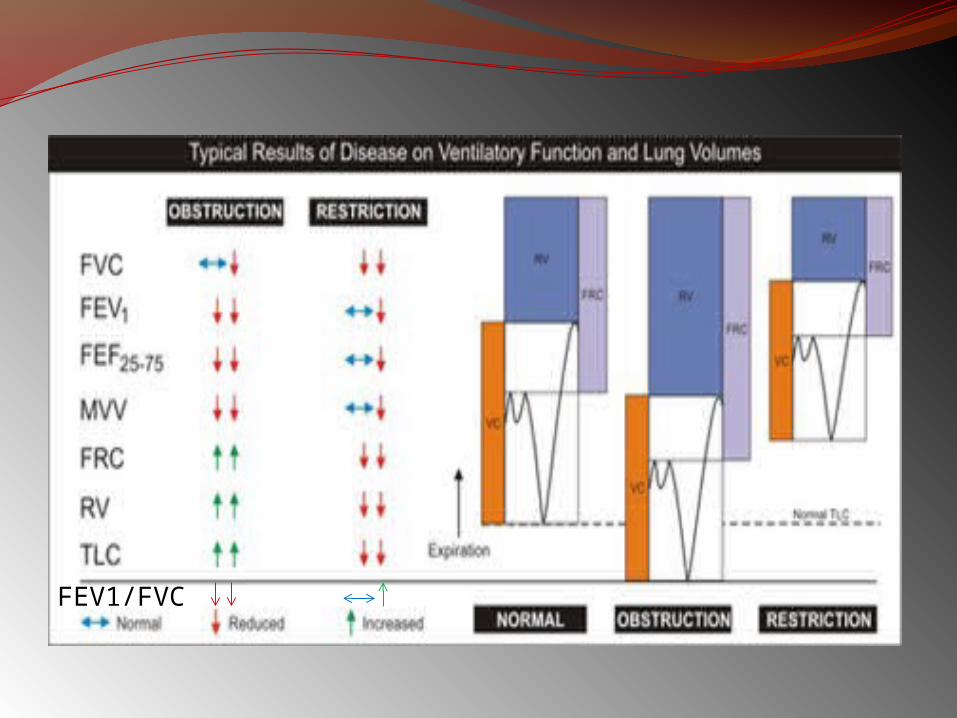
FEV1/FVC
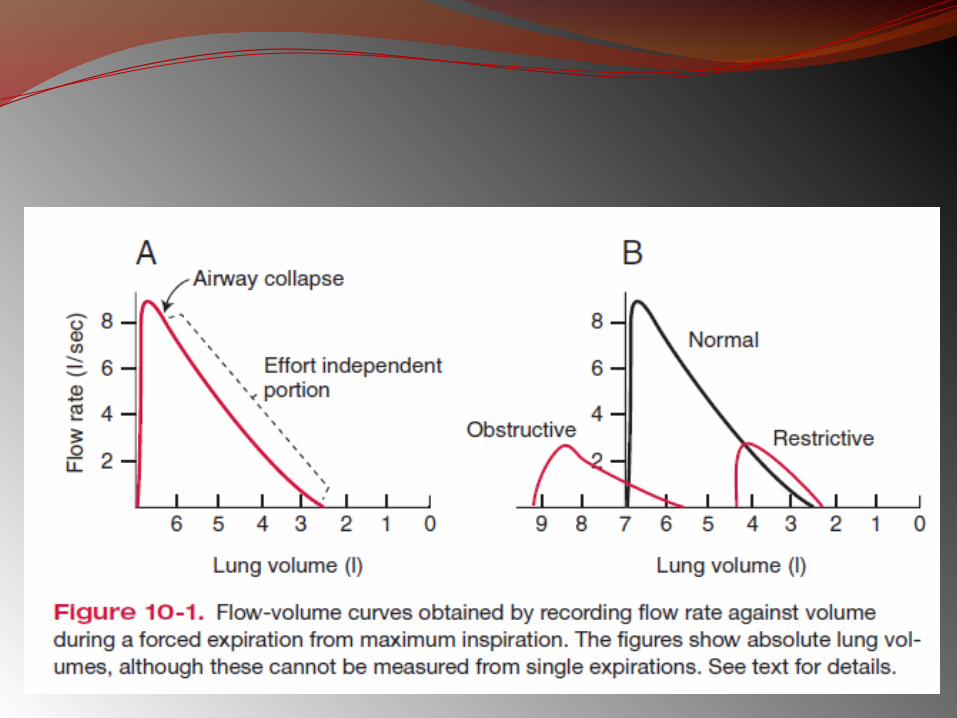
In restrictive diseases, the maximum flow rate is reduced, as is the total volume exhaled.
The flow rate is often abnormally high during the latter part of expiration because of the increased lung recoil.
By contrast, in obstructive diseases, the flow rate is very low in relation to lung volume, and a scooped-out appearance is seen.
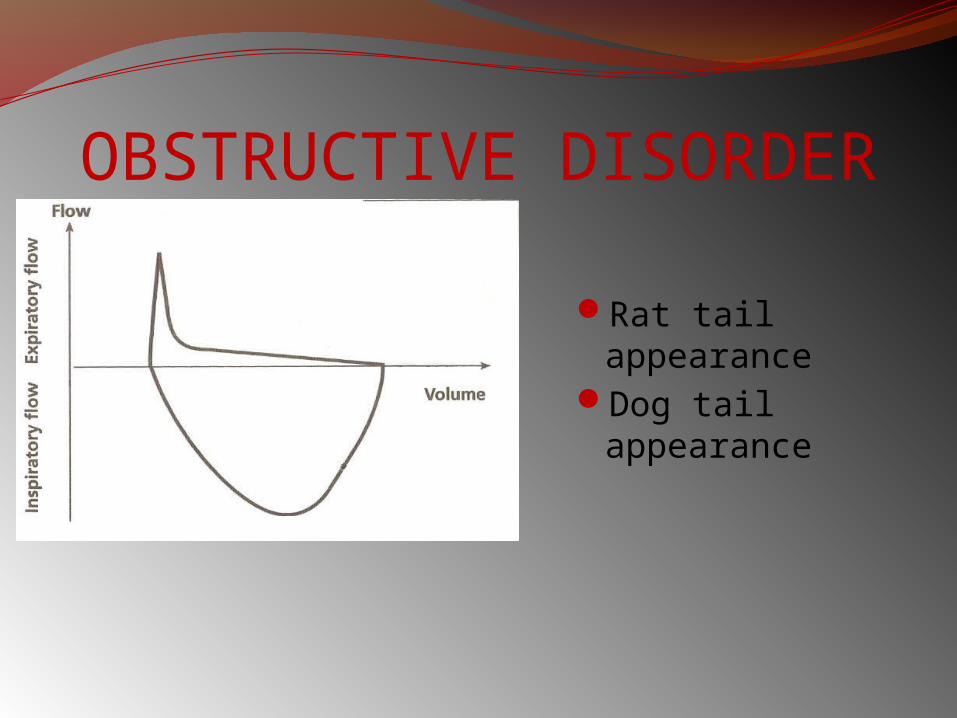
OBSTRUCTIVE DISORDER
Rat tail appearanceDog tail
appearance
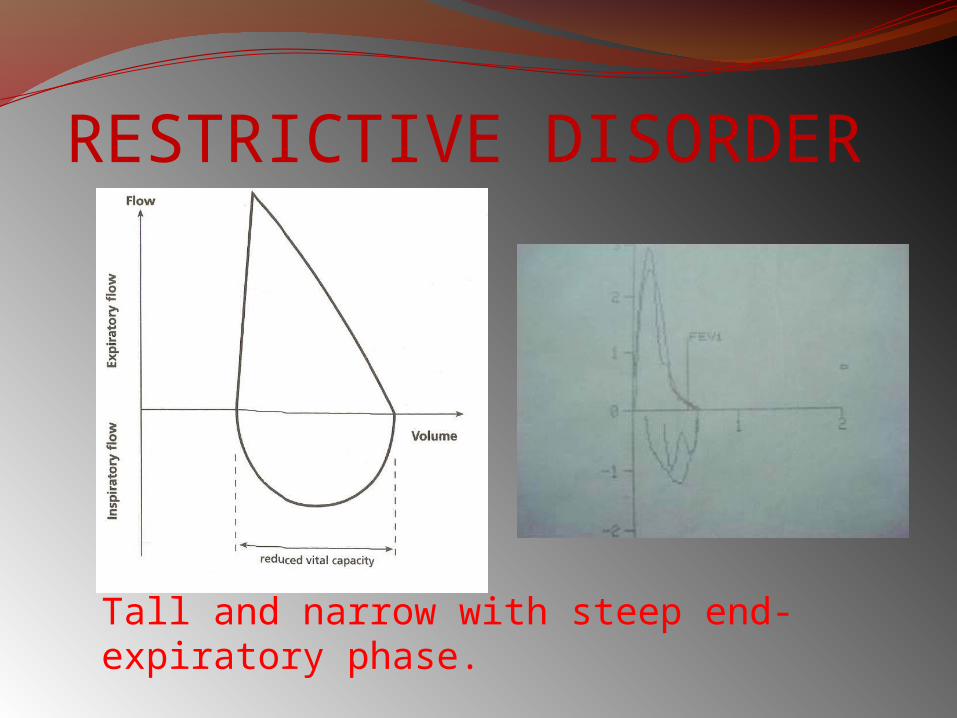
RESTRICTIVE DISORDER
Tall and narrow with steep end-expiratory phase.
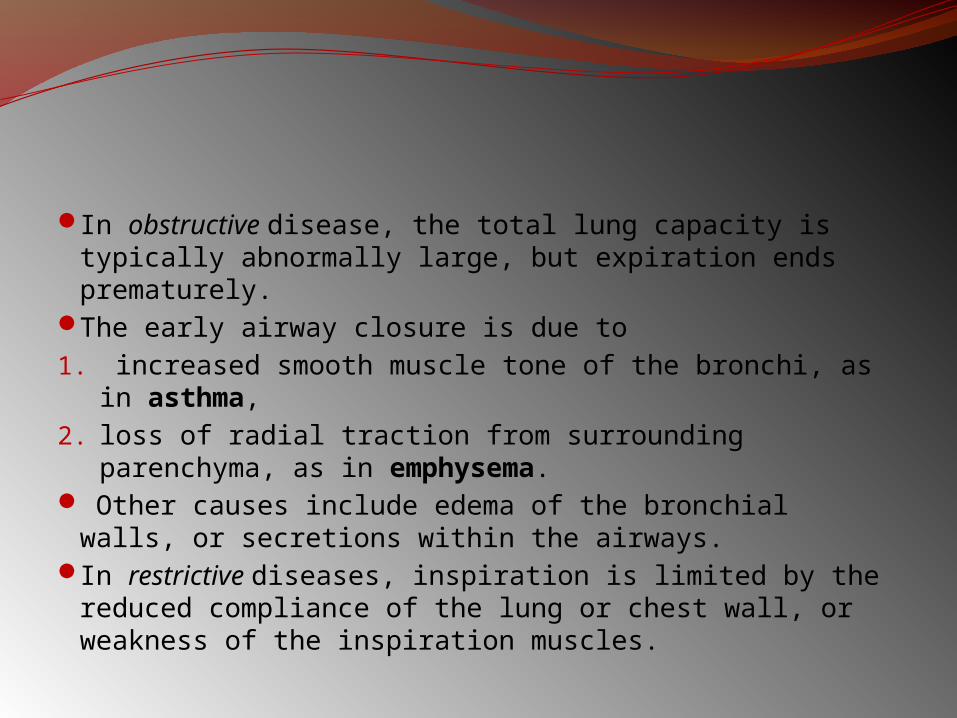
In obstructive disease, the total lung capacity is typically abnormally large, but expiration ends prematurely.
The early airway closure is due to1. increased smooth muscle tone of the bronchi, as in
asthma, 2. loss of radial traction from surrounding parenchyma, as
in emphysema. Other causes include edema of the bronchial walls, or
secretions within the airways.In restrictive diseases, inspiration is limited by the
reduced compliance of the lung or chest wall, or weakness of the inspiration muscles.
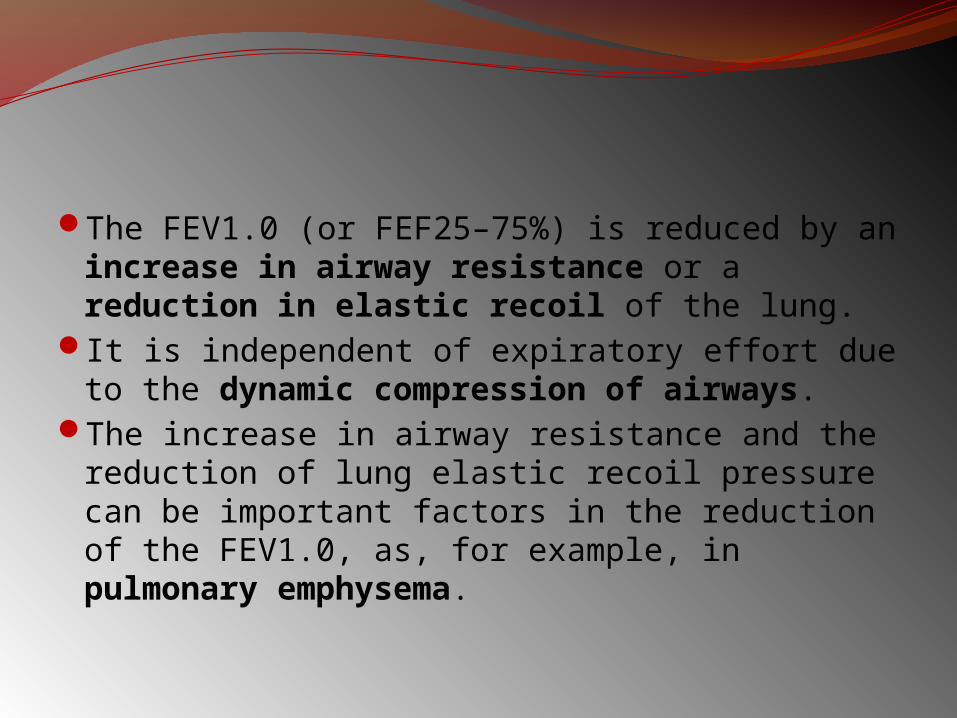
The FEV1.0 (or FEF25–75%) is reduced by an increase in airway resistance or a reduction in elastic recoil of the lung.
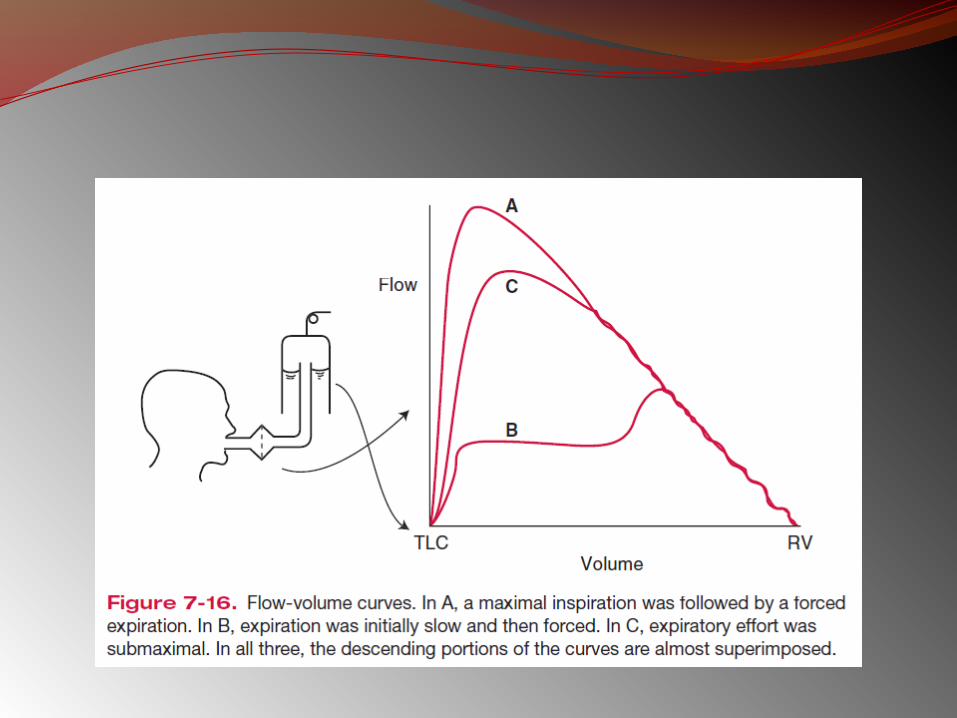
It is independent of expiratory effort due to the dynamic compression of airways.
The increase in airway resistance and the reduction of lung elastic recoil pressure can be important factors in the reduction of the FEV1.0, as, for example, in pulmonary emphysema.
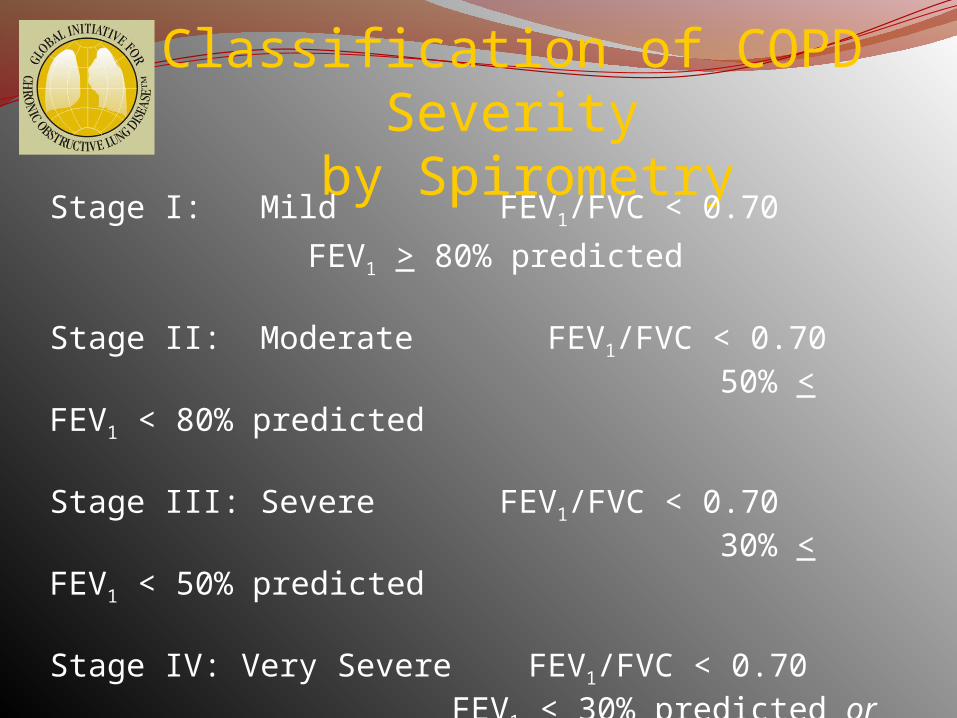
Classification of COPD Severity
by SpirometryStage I: Mild FEV1/FVC < 0.70
FEV1 > 80% predicted
Stage II: Moderate FEV1/FVC < 0.70 50% < FEV1 < 80% predicted
Stage III: Severe FEV1/FVC < 0.70 30% < FEV1 < 50% predicted
Stage IV: Very Severe FEV1/FVC < 0.70 FEV1 < 30% predicted or
FEV1 < 50% predicted plus chronic respiratory failure
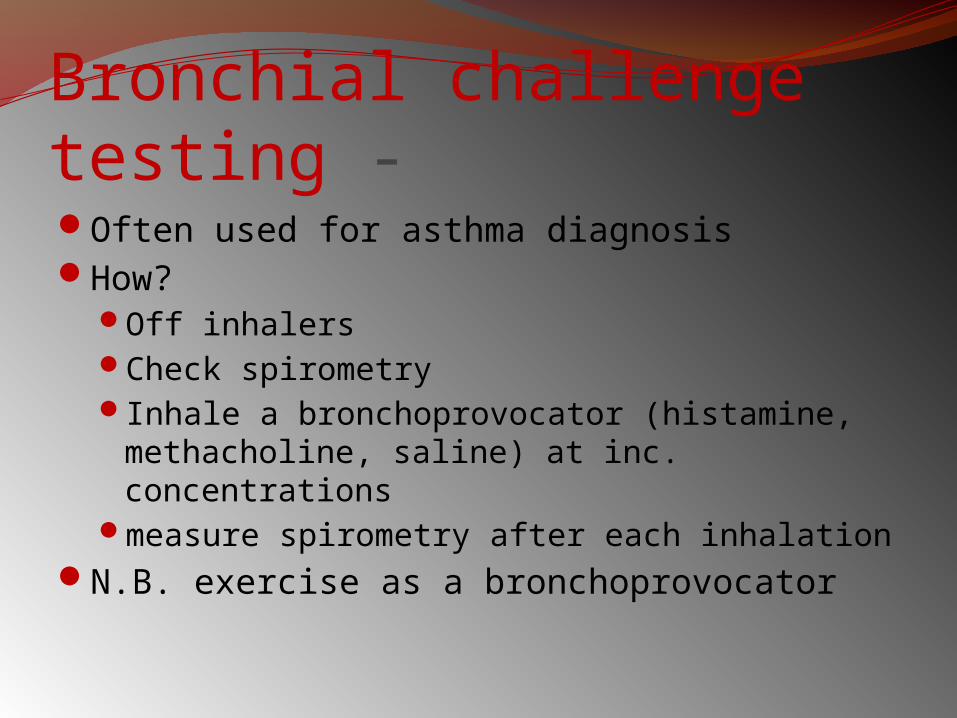
Bronchial challenge testing -Often used for asthma diagnosisHow?
Off inhalersCheck spirometryInhale a bronchoprovocator (histamine,
methacholine, saline) at inc. concentrationsmeasure spirometry after each inhalation
N.B. exercise as a bronchoprovocator
Bronchial challenge - interpretationThreshold for positive may vary centre to
centreIndicates ‘Bronchial hyperresponsiveness’Negative test virtually excludes asthmaFalse positives post-infection
46
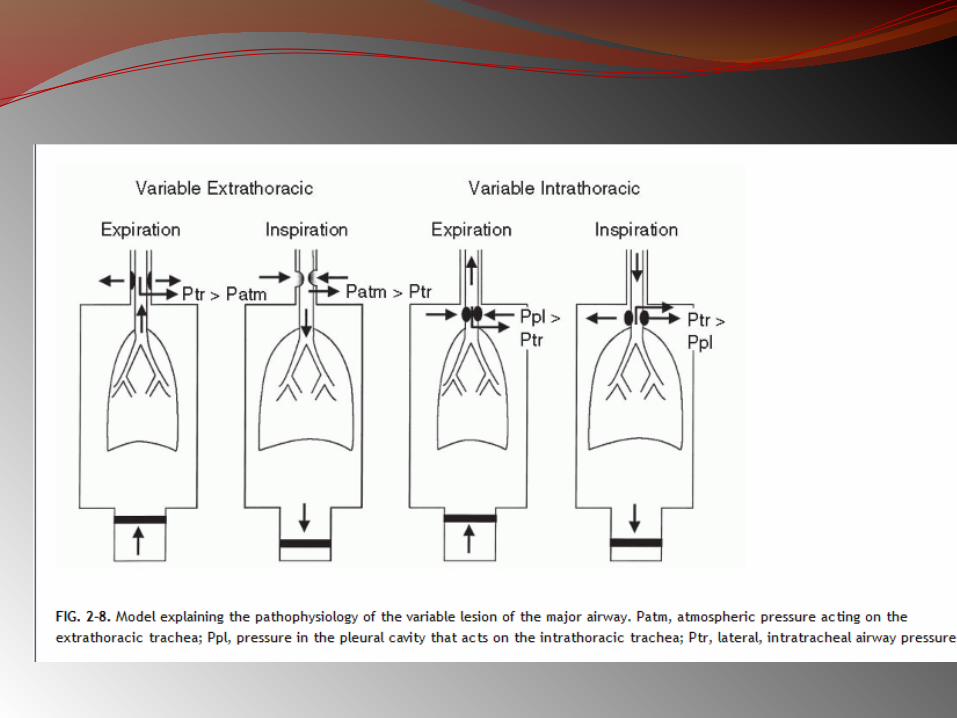
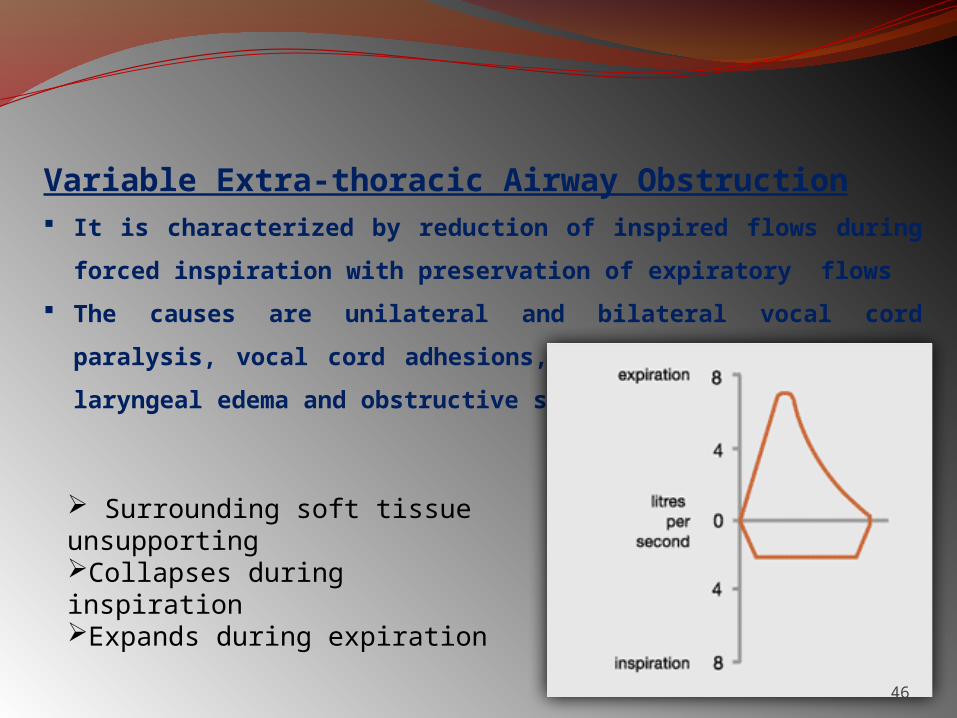
Variable Extra-thoracic Airway Obstruction It is characterized by reduction of inspired flows during forced
inspiration with preservation of expiratory flows
The causes are unilateral and bilateral vocal cord paralysis,
vocal cord adhesions, vocal cord constriction, laryngeal edema
and obstructive sleep apnea
Surrounding soft tissue unsupportingCollapses during inspirationExpands during expiration
47
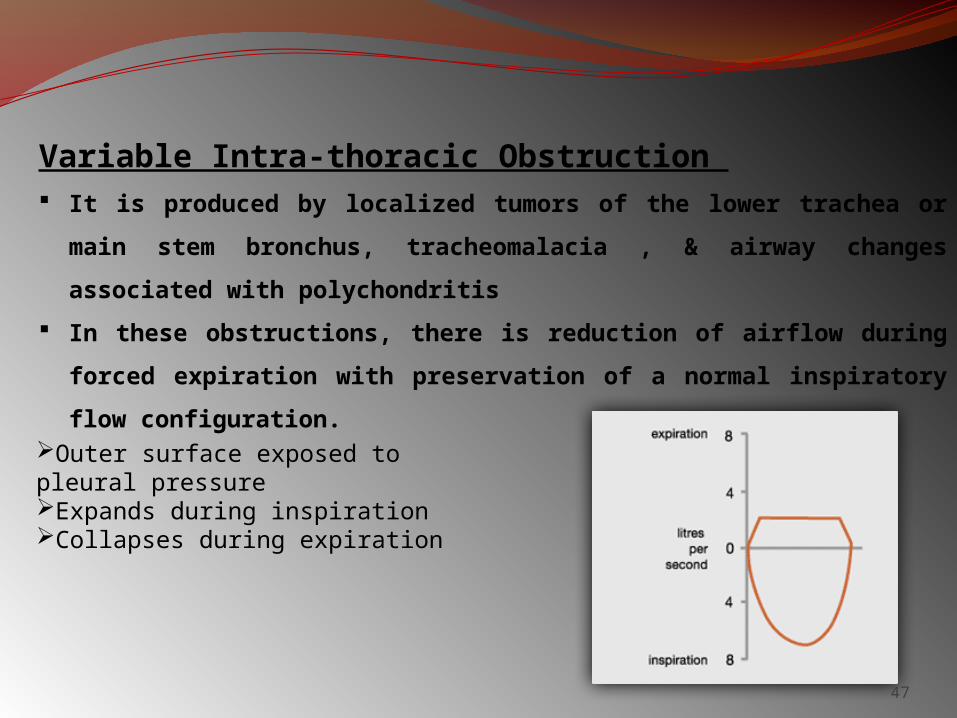
Variable Intra-thoracic Obstruction It is produced by localized tumors of the lower trachea or main
stem bronchus, tracheomalacia , & airway changes associated
with polychondritis
In these obstructions, there is reduction of airflow during forced
expiration with preservation of a normal inspiratory flow
configuration. Outer surface exposed to pleural pressureExpands during inspirationCollapses during expiration
48
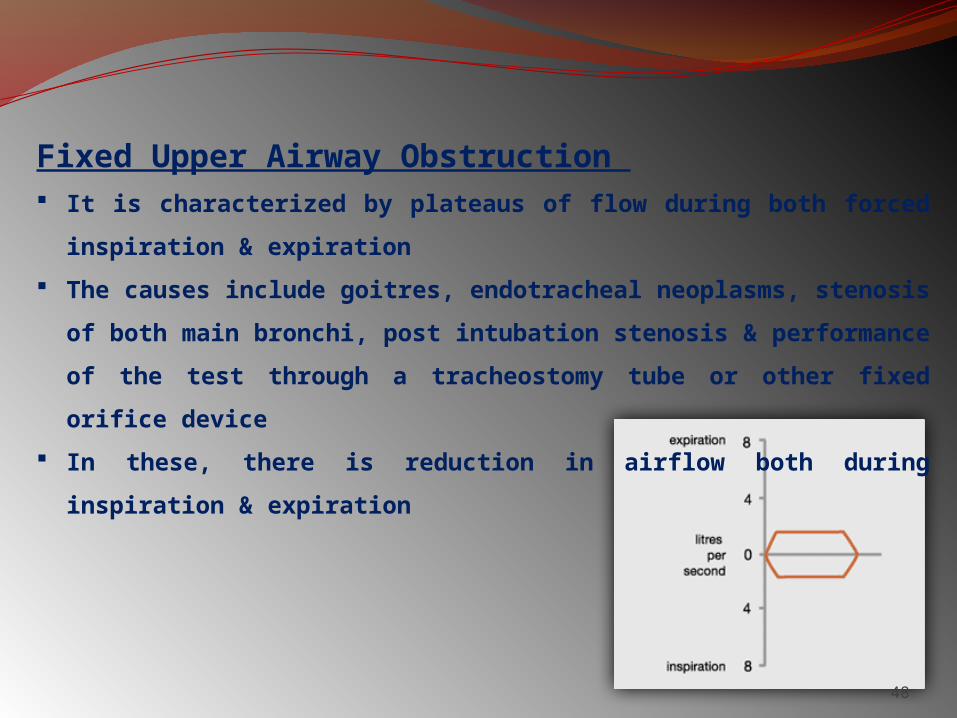
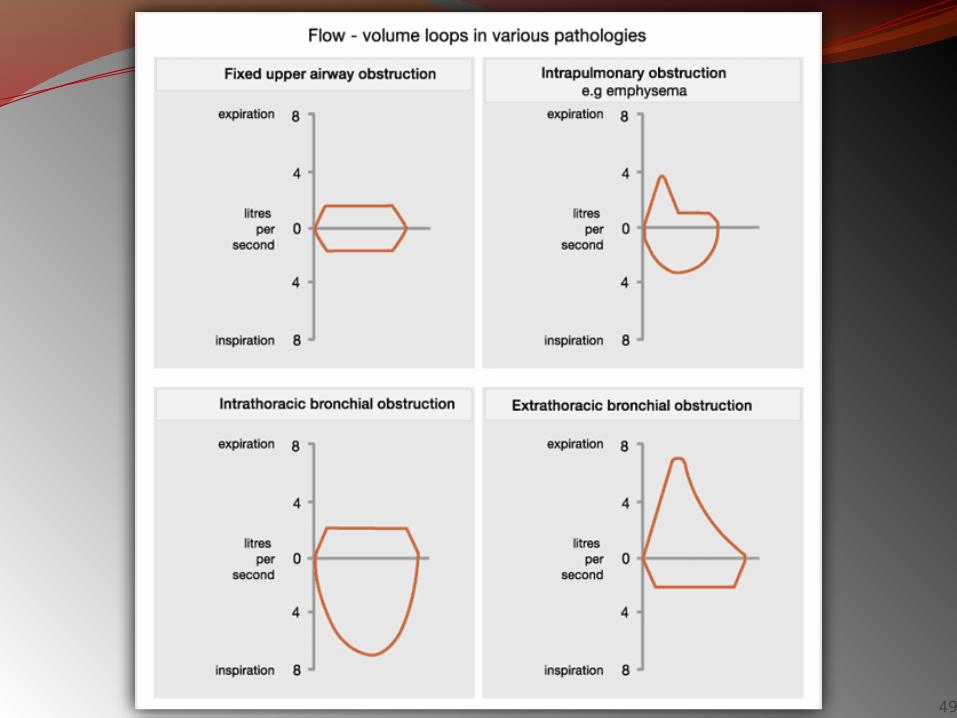
Fixed Upper Airway Obstruction It is characterized by plateaus of flow during both forced
inspiration & expiration
The causes include goitres, endotracheal neoplasms, stenosis of
both main bronchi, post intubation stenosis & performance of
the test through a tracheostomy tube or other fixed orifice
device
In these, there is reduction in airflow both during inspiration &
expiration
49
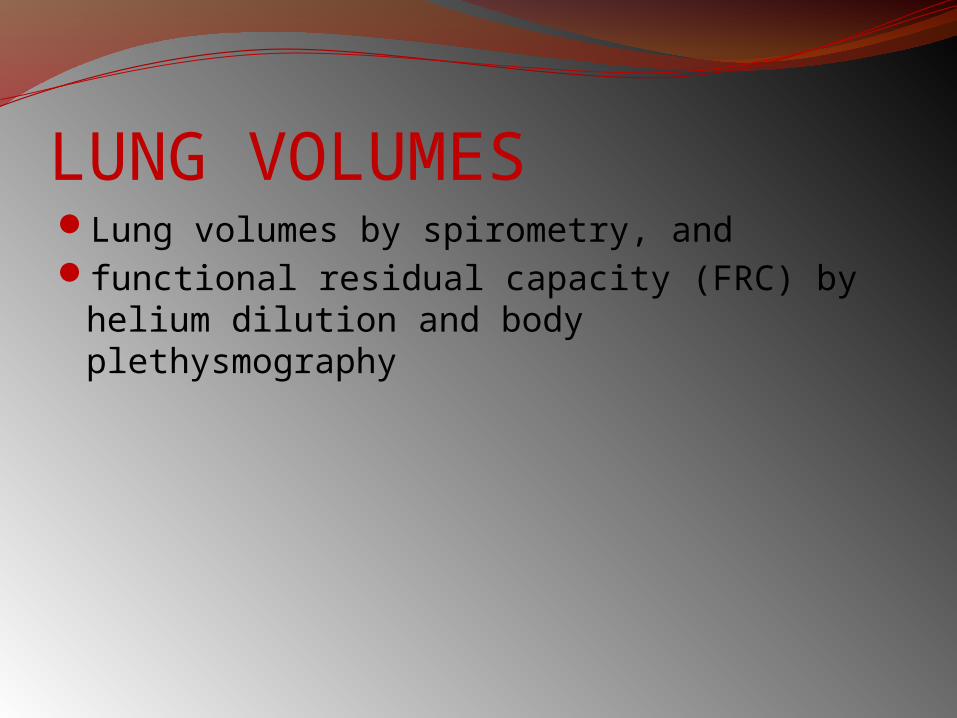
LUNG VOLUMESLung volumes by spirometry, and functional residual capacity (FRC) by helium
dilution and body plethysmography
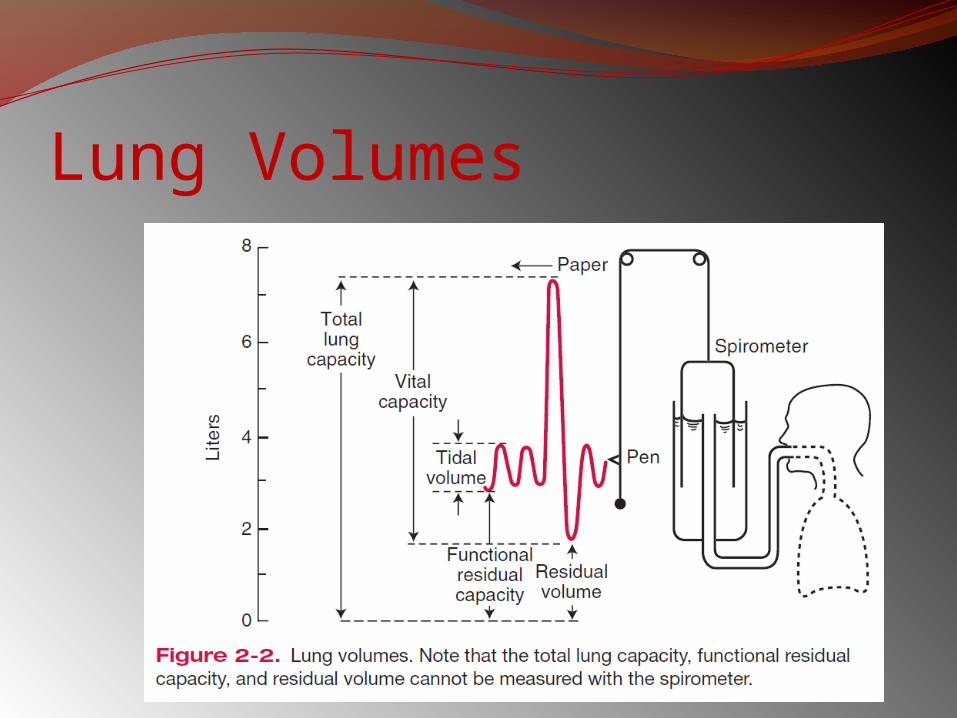
Lung Volumes
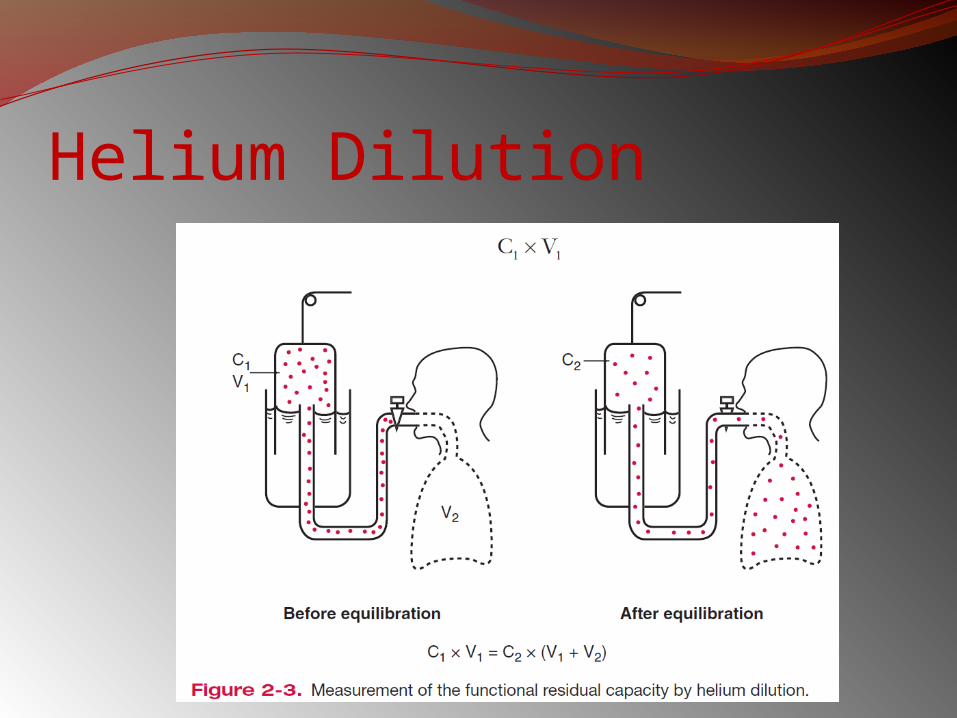
Helium Dilution
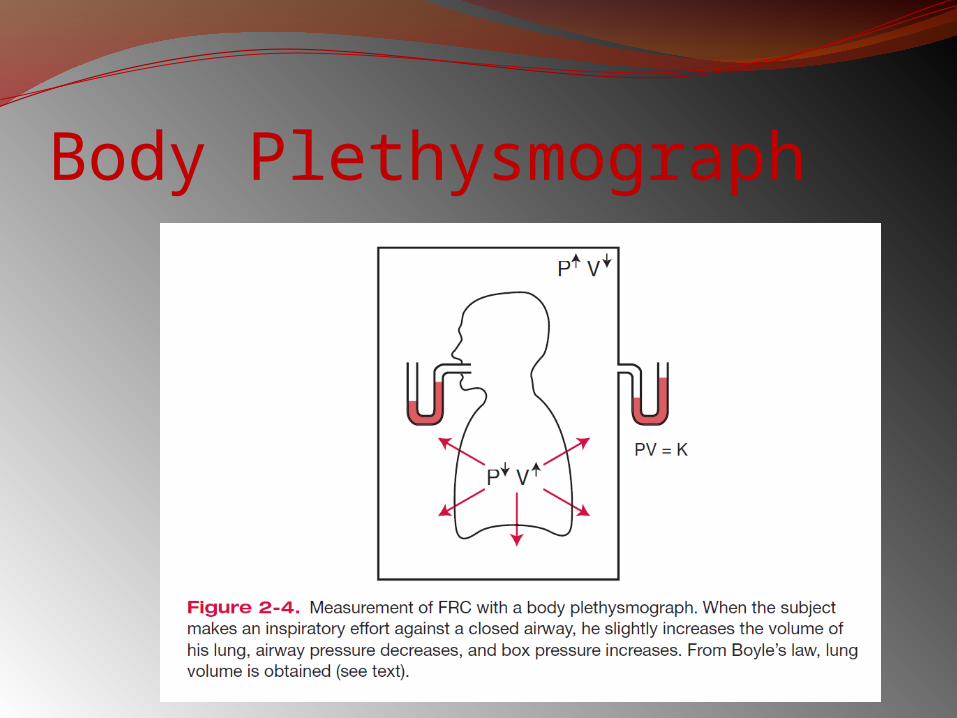
Body Plethysmograph
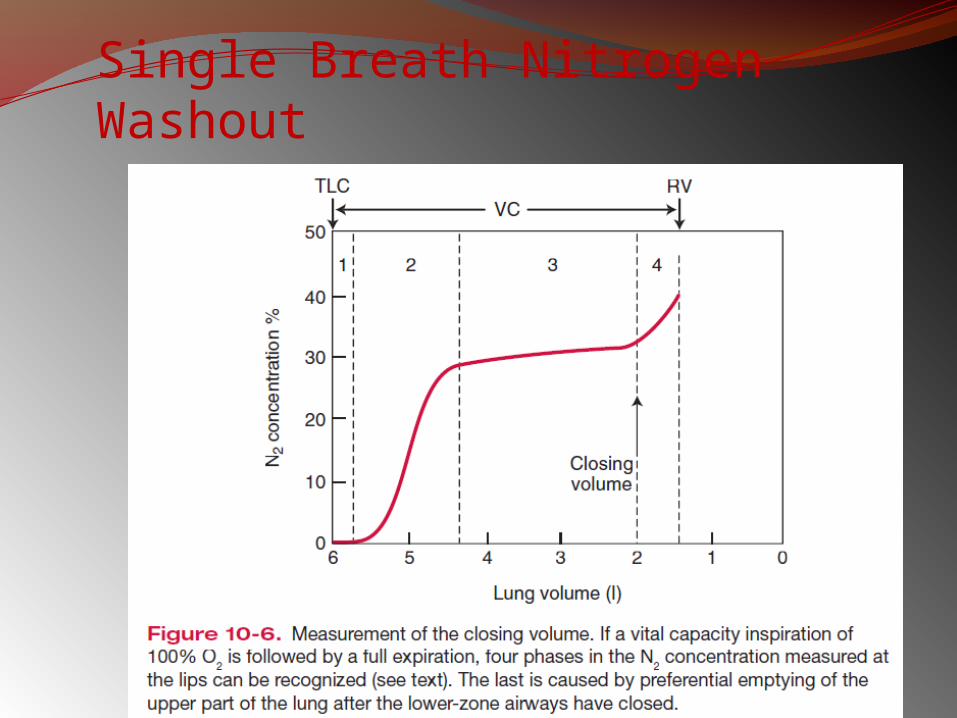
Single Breath Nitrogen Washout
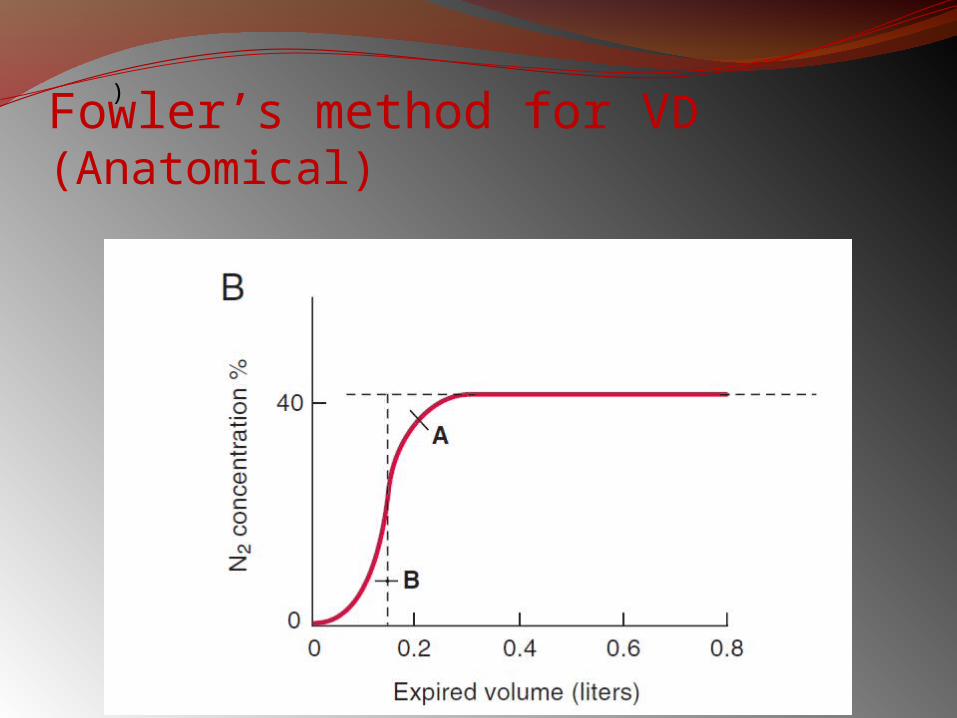
Fowler’s method for VD (Anatomical)
)
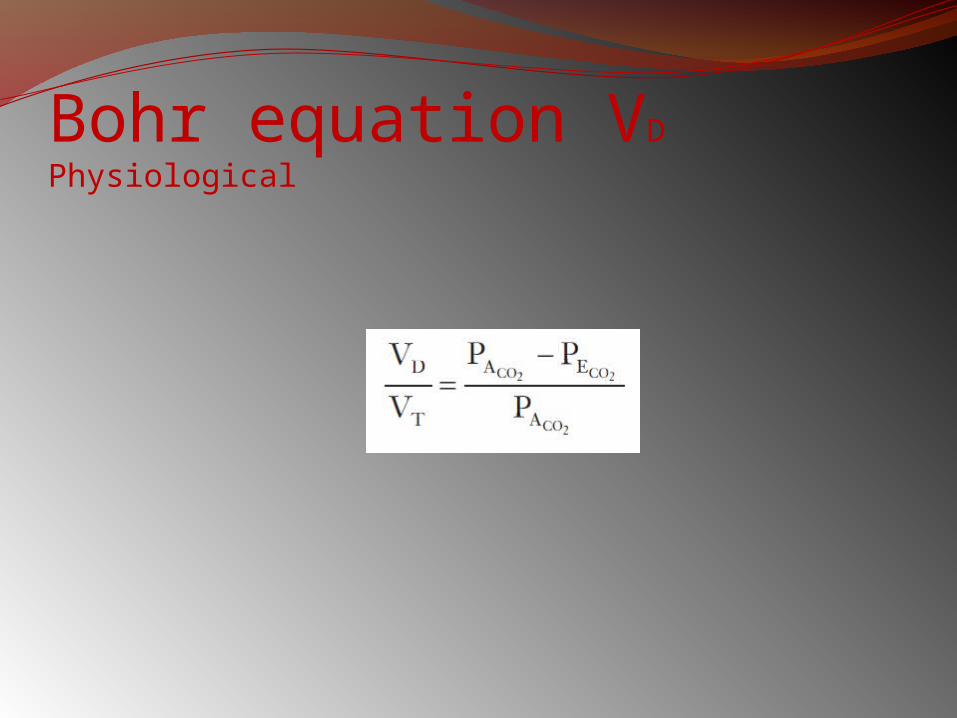
Bohr equation VD Physiological
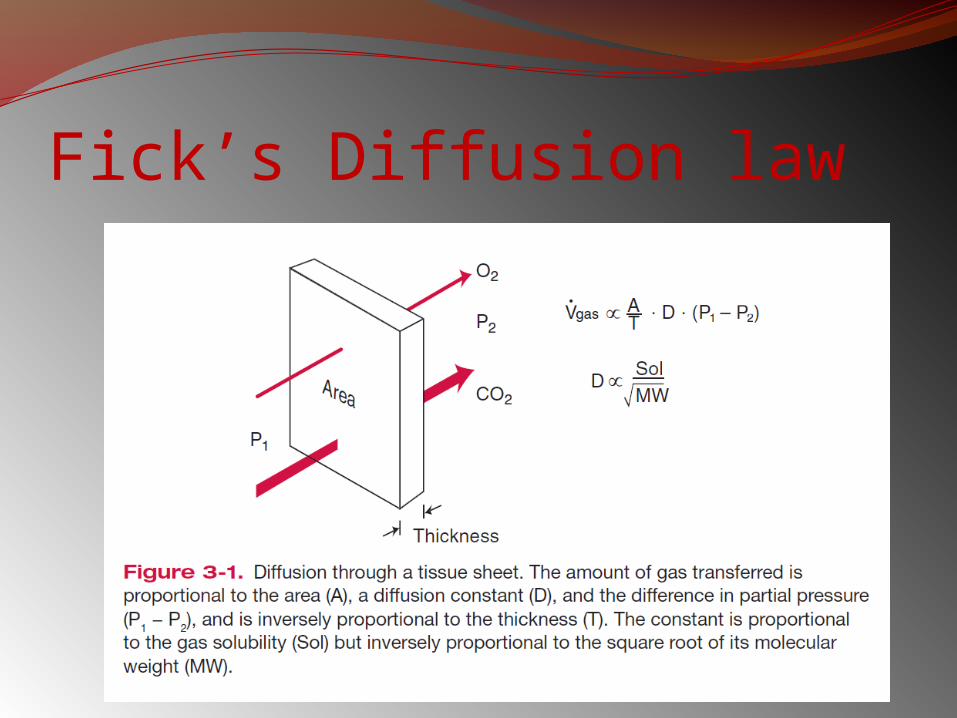
Fick’s Diffusion law
Examples of diffusion- and perfusion-limited gases are carbon monoxide and nitrous oxide, respectively.
Oxygen transfer is normally perfusion limited, but some diffusion limitation may occur under some conditions, including intense exercise, thickening of the blood-gas barrier, and alveolar hypoxia.
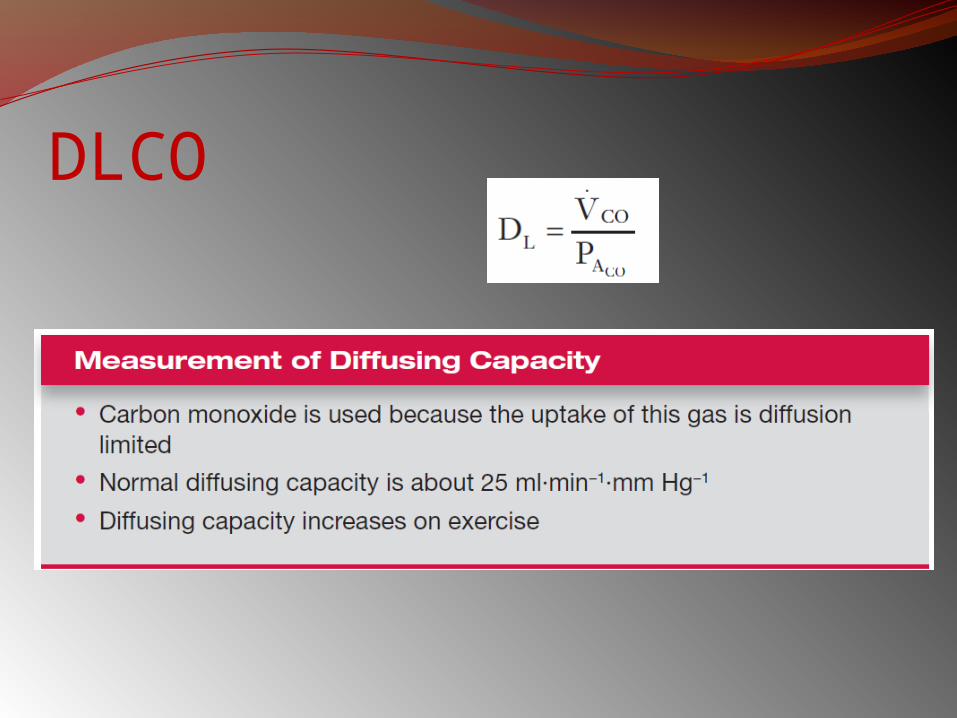
DLCO
DLCO - interpretationDLCO ↓ by:
Pulmonary vascular diseasesConditions affecting alveoliCardiac diseasesAnaemiaPregnancyRecent smoking
DLCO - interpretationDLCO ↑ by
PolycythaemiaPulmonary haemorrhageL to R shuntExercise
Blood FlowThe volume of blood passing through the
lungs each minute (Q) can be calculated using the Fick principle.
This states that the O2 consumption per minute (VO2) measured at the lungs is equal to the product of blood flow and A-V concentration gradient of O2.
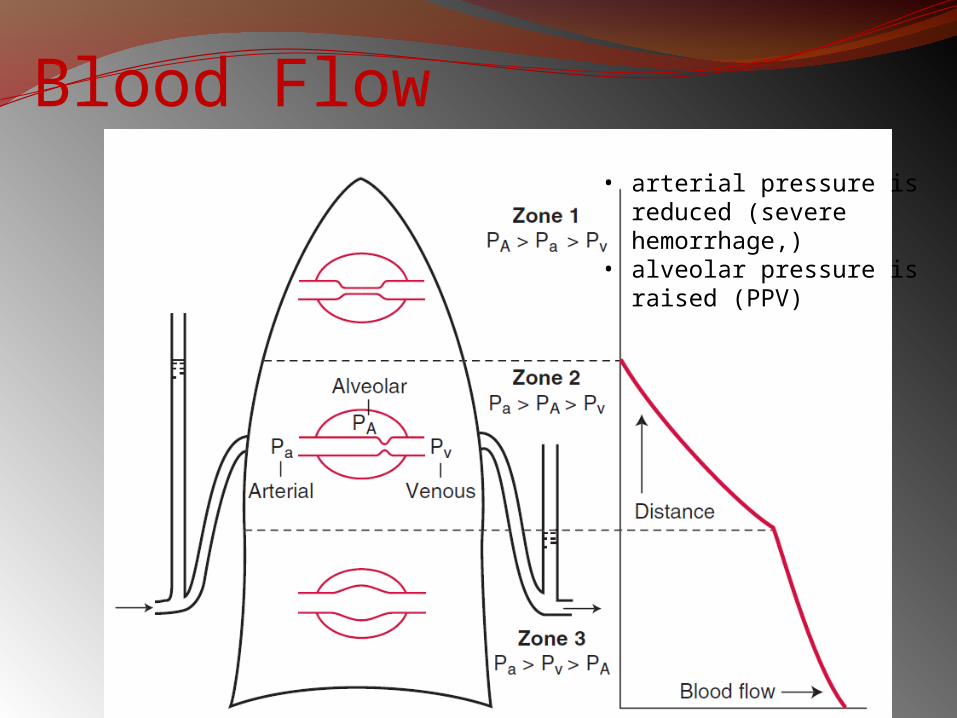
Blood Flow• arterial pressure is
reduced (severe hemorrhage,)
• alveolar pressure is raised (PPV)
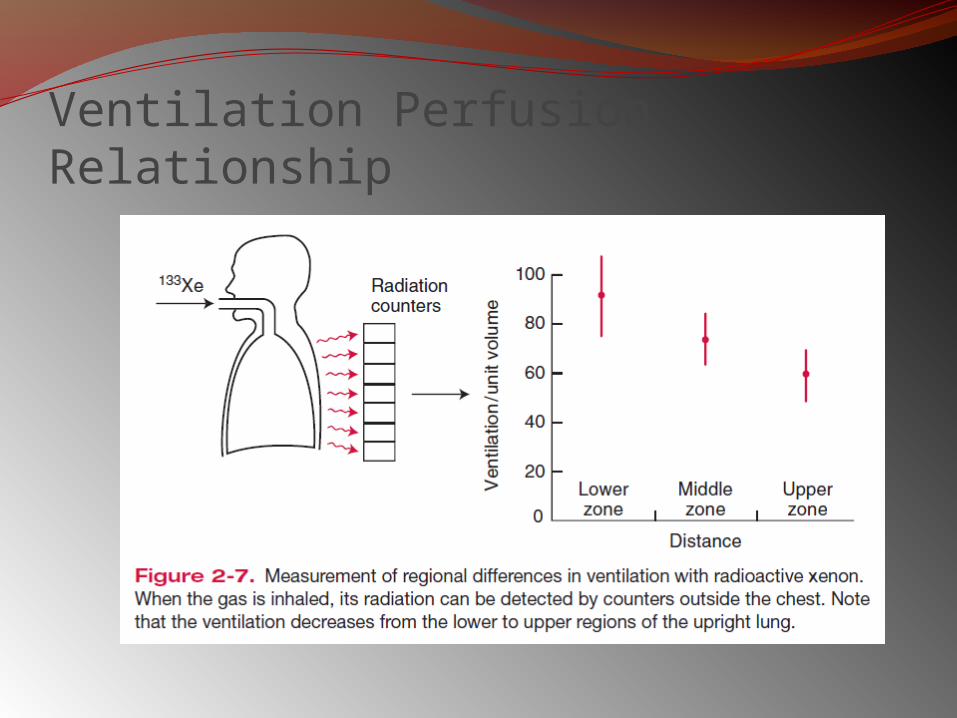
Ventilation Perfusion Relationship
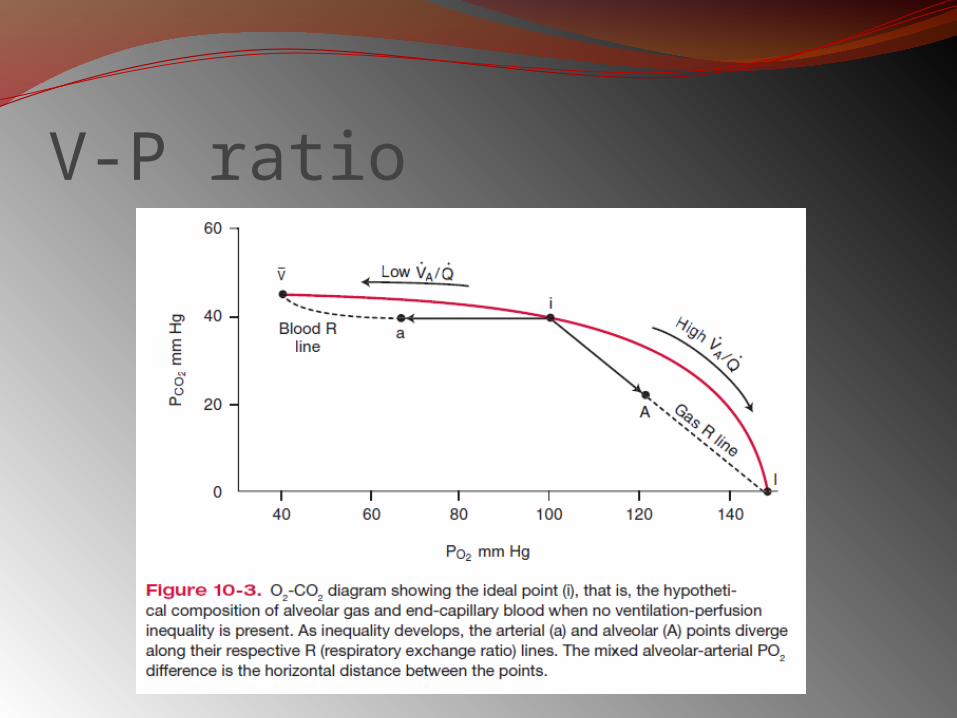
V-P ratio
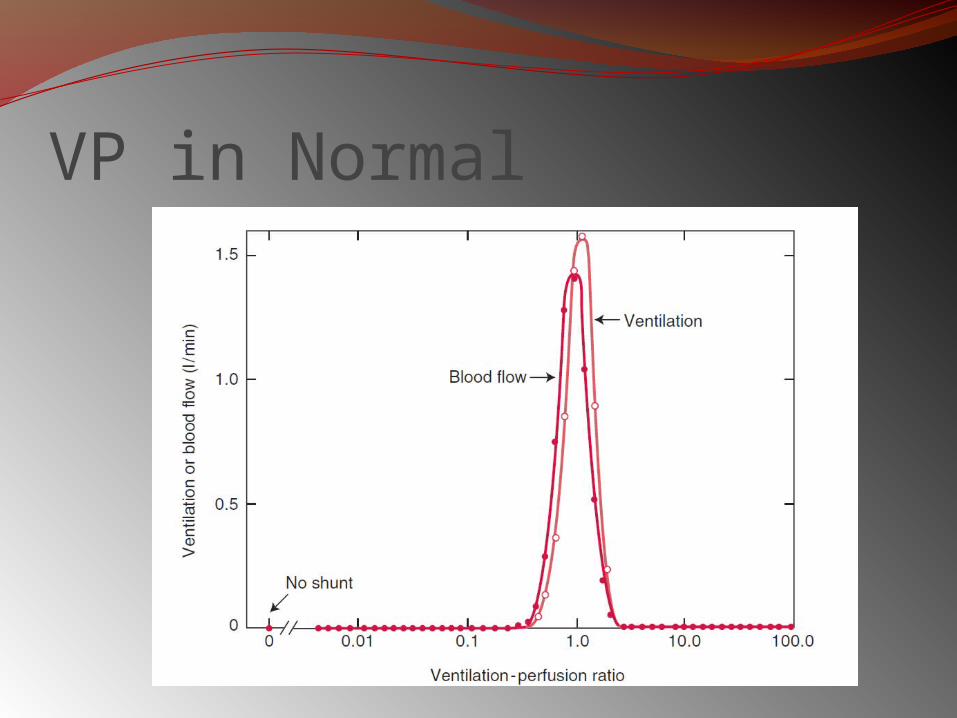
VP in Normal
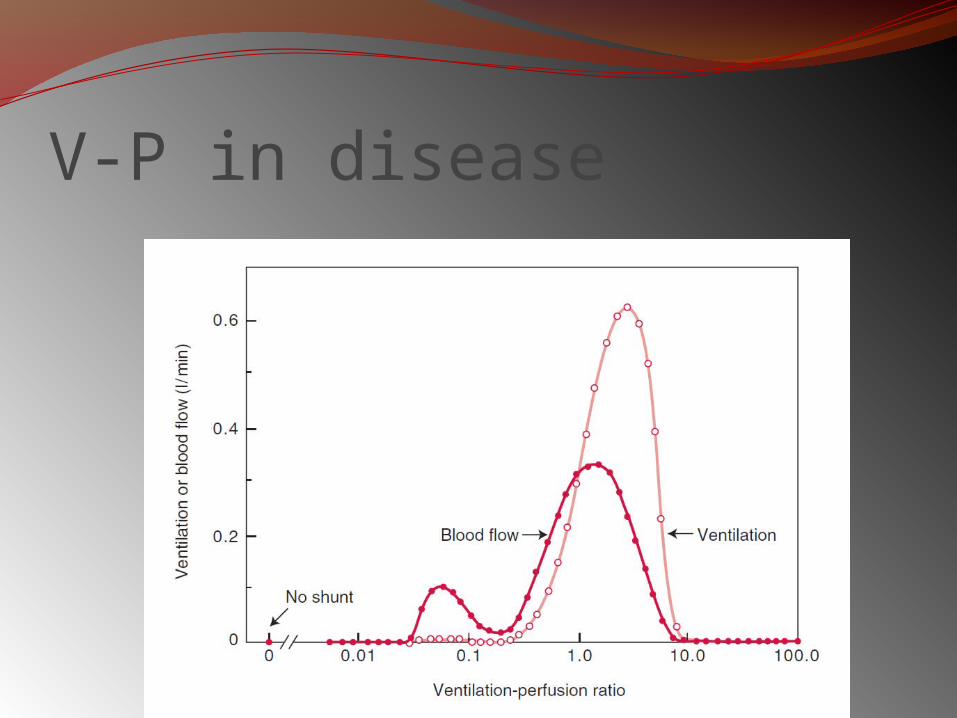
V-P in disease
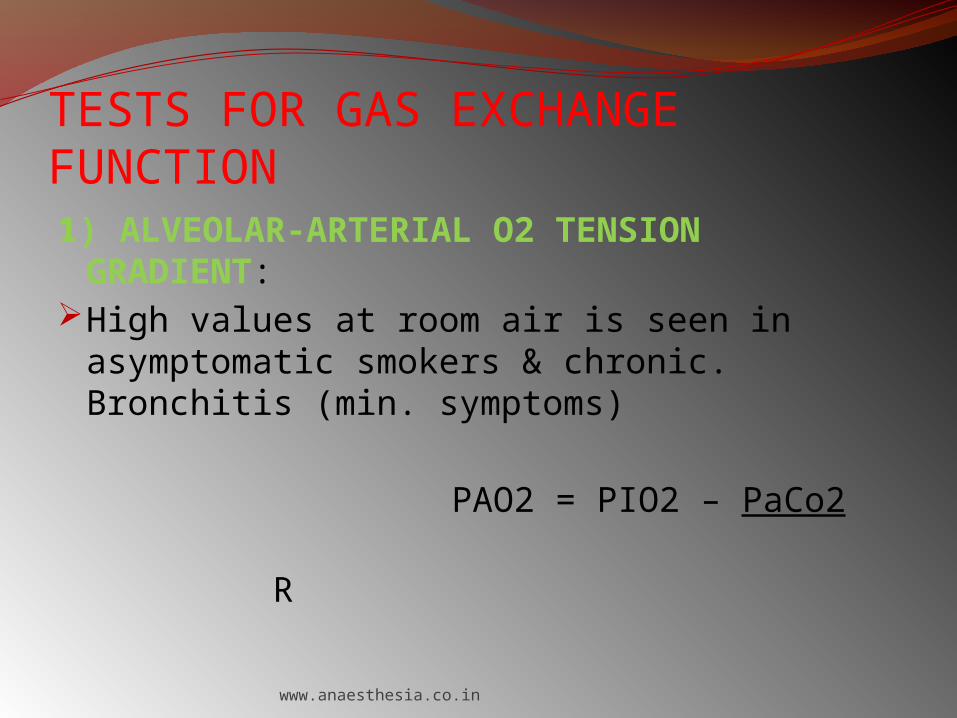
TESTS FOR GAS EXCHANGE FUNCTION1) ALVEOLAR-ARTERIAL O2 TENSION
GRADIENT:High values at room air is seen in
asymptomatic smokers & chronic. Bronchitis (min. symptoms)
PAO2 = PIO2 – PaCo2 R
www.anaesthesia.co.in
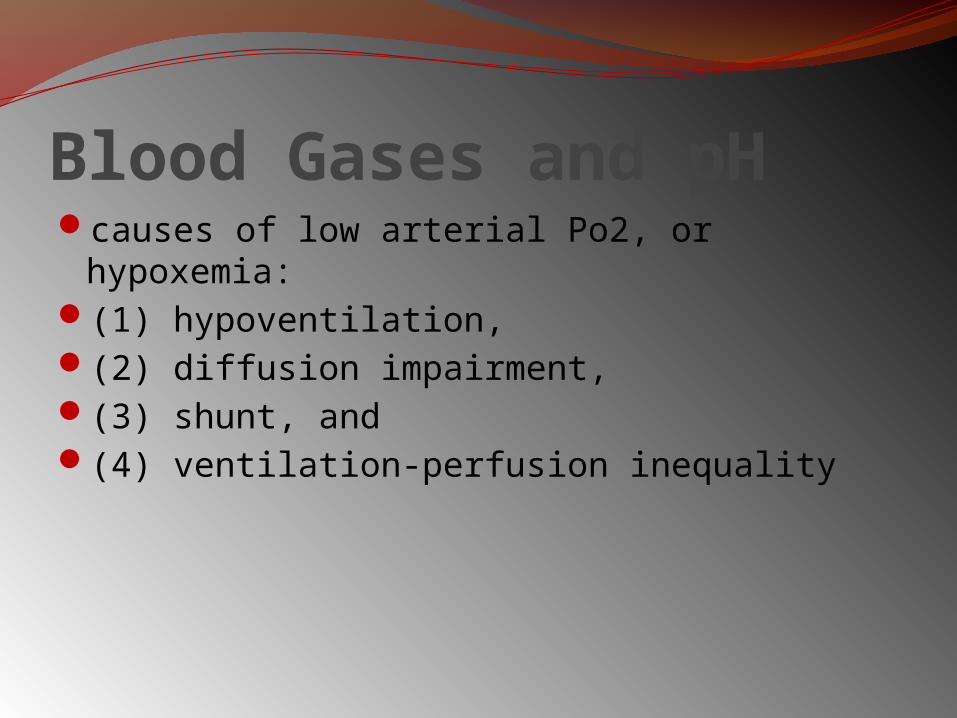
Blood Gases and pHcauses of low arterial Po2, or hypoxemia: (1) hypoventilation, (2) diffusion impairment,(3) shunt, and(4) ventilation-perfusion inequality
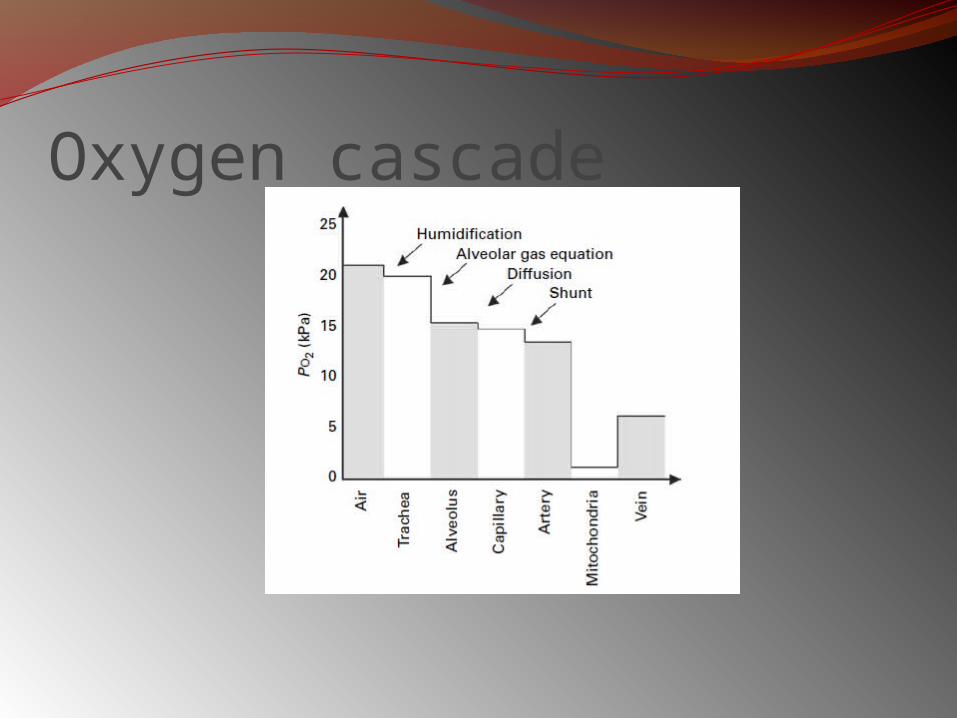
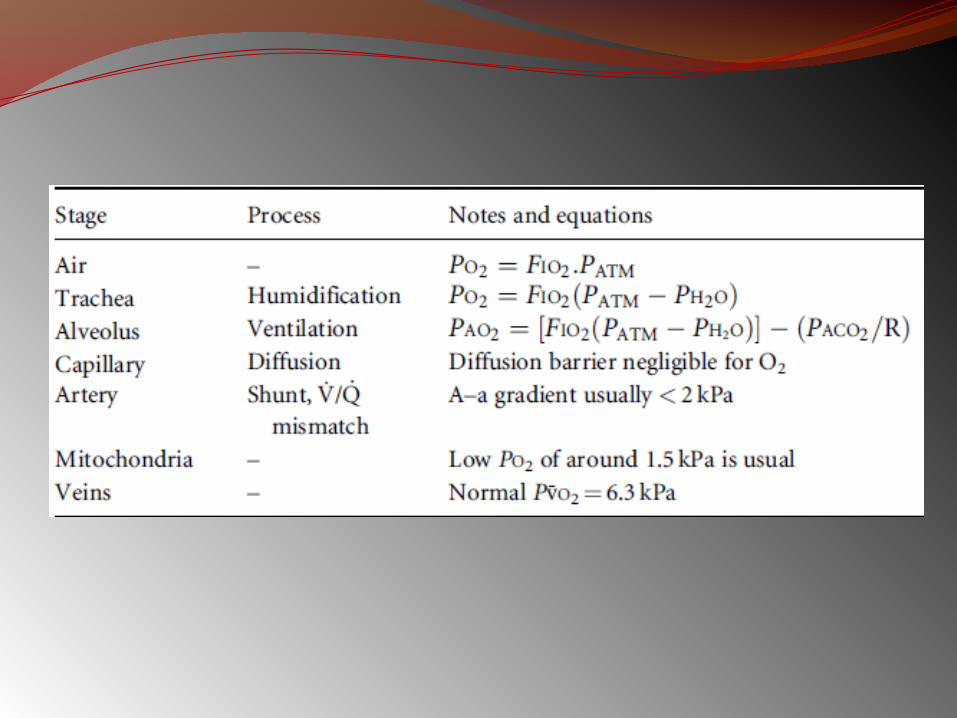
Oxygen cascade
causes of an increased arterial Pco2: (1) hypoventilation (2) ventilation-perfusion inequality
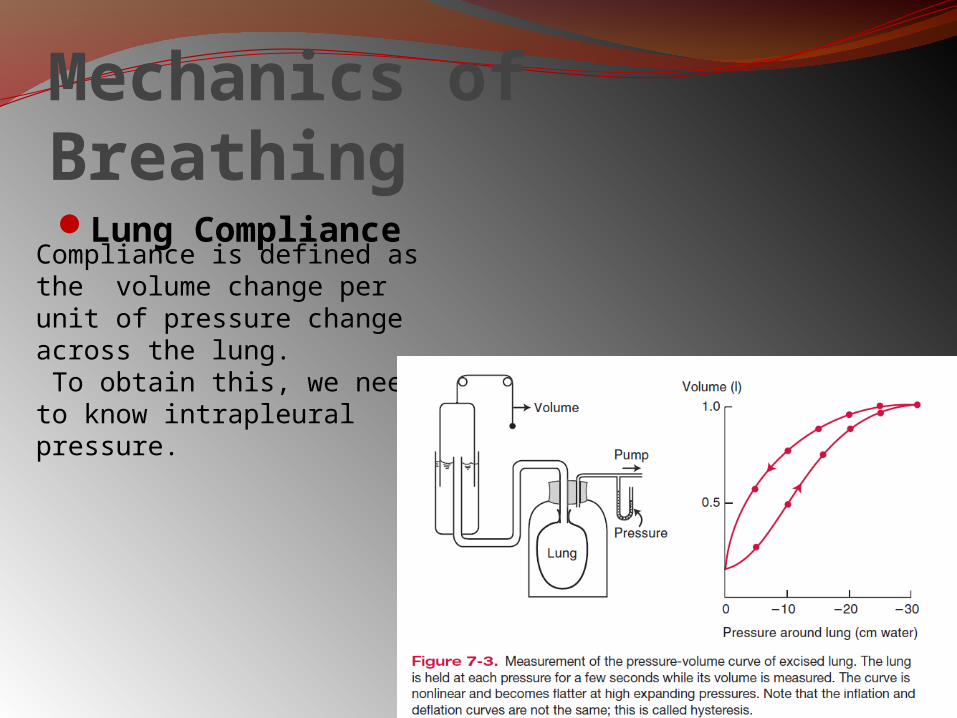
Mechanics of BreathingLung Compliance
Compliance is defined as the volume change per unit of pressure change across the lung. To obtain this, we need to know intrapleural pressure.
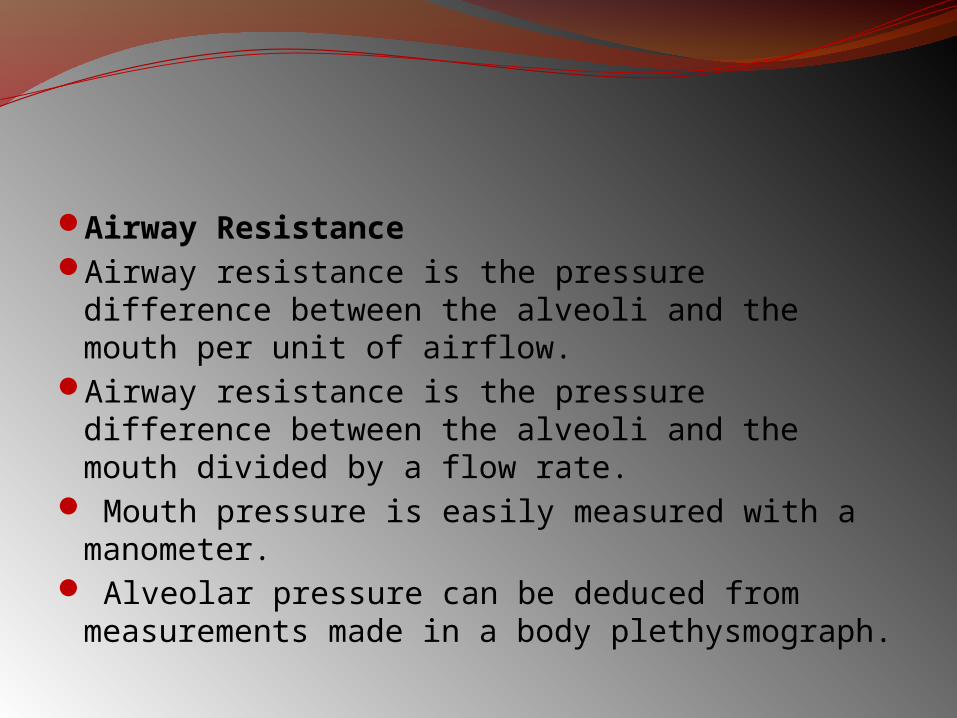
Airway ResistanceAirway resistance is the pressure difference
between the alveoli and the mouth per unit of airflow.
Airway resistance is the pressure difference between the alveoli and the mouth divided by a flow rate.
Mouth pressure is easily measured with a manometer.
Alveolar pressure can be deduced from measurements made in a body plethysmograph.
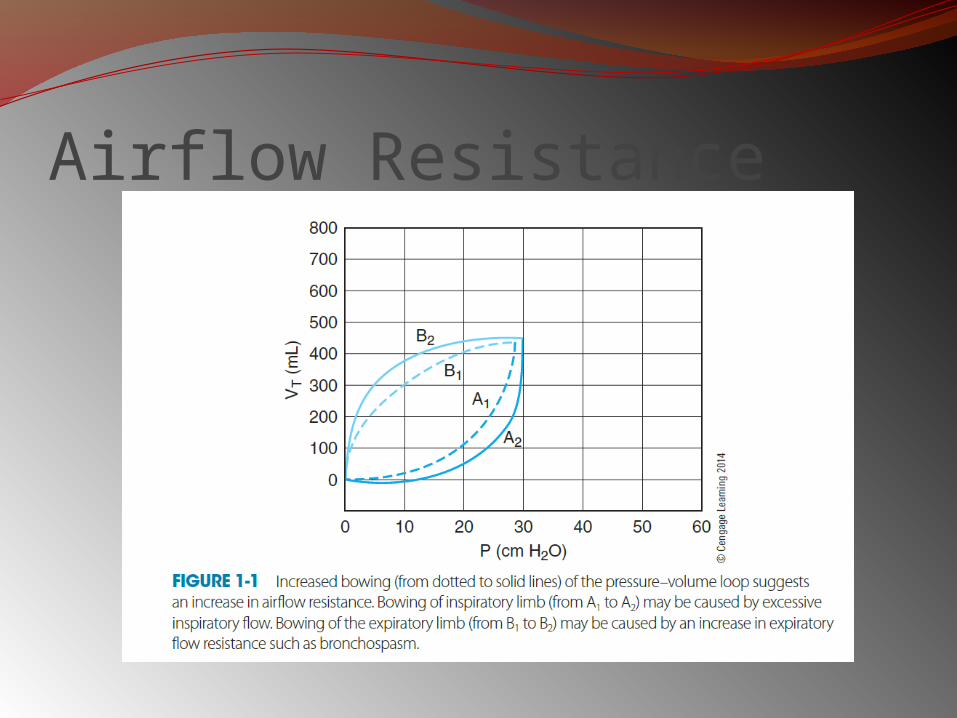
Airflow Resistance
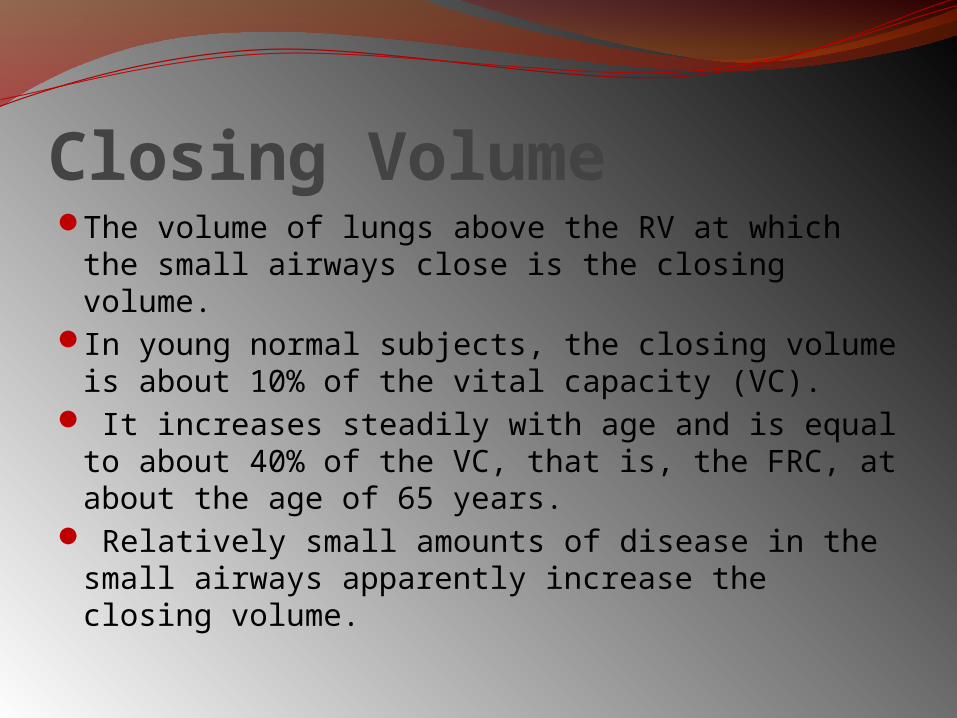
Closing VolumeThe volume of lungs above the RV at which
the small airways close is the closing volume.In young normal subjects, the closing volume
is about 10% of the vital capacity (VC). It increases steadily with age and is equal to
about 40% of the VC, that is, the FRC, at about the age of 65 years.
Relatively small amounts of disease in the small airways apparently increase the closing volume.
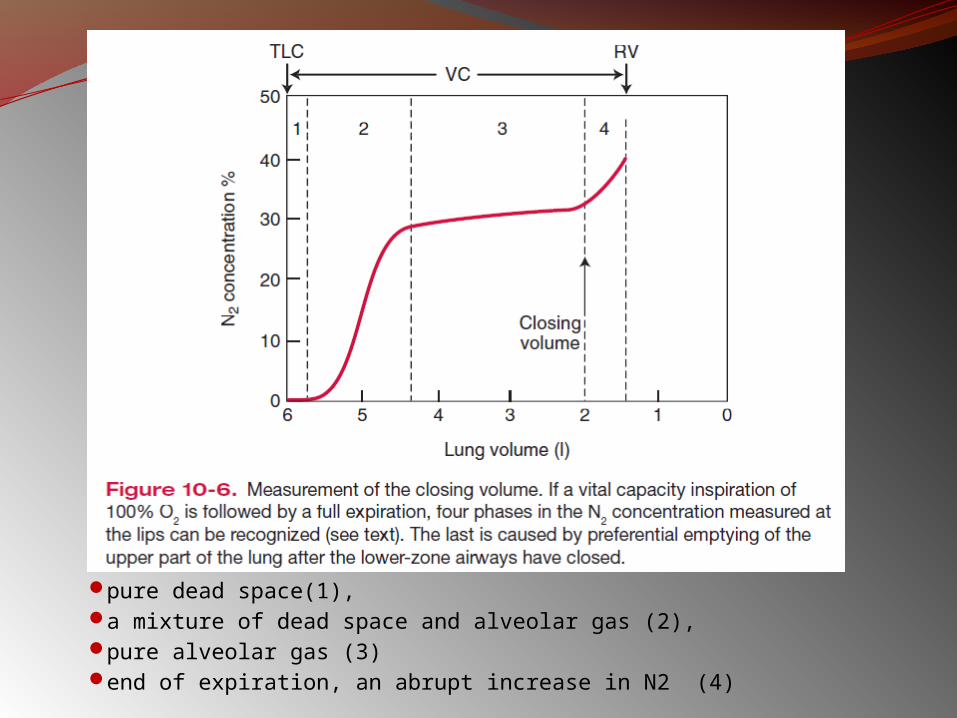
pure dead space(1),a mixture of dead space and alveolar gas (2),pure alveolar gas (3)end of expiration, an abrupt increase in N2 (4)
Control of Ventilation
The responsiveness of the chemoreceptors and respiratory center to CO2 can be measured by having the subject rebreathe into a rubber bag.
The ventilatory response to hypoxia can be measured in a similar way if the subject rebreathes from a bag with a low Po2 but constant Pco2.
Exercise TestingExercise testing can be valuable in detecting small amounts of lung disease.
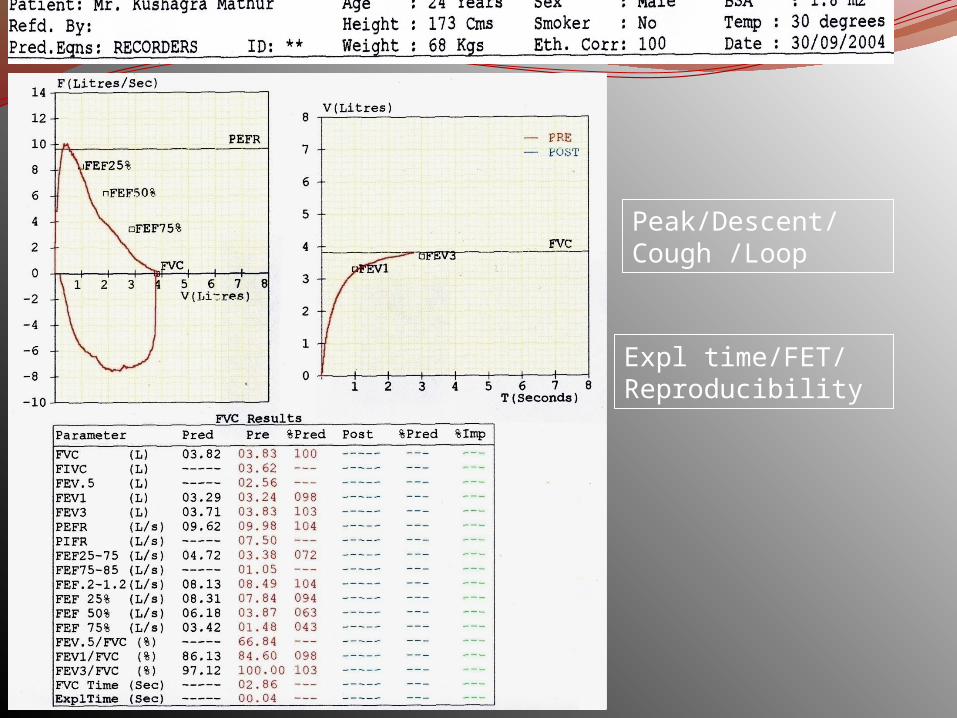
Peak/Descent/Cough /Loop
Expl time/FET/ Reproducibility
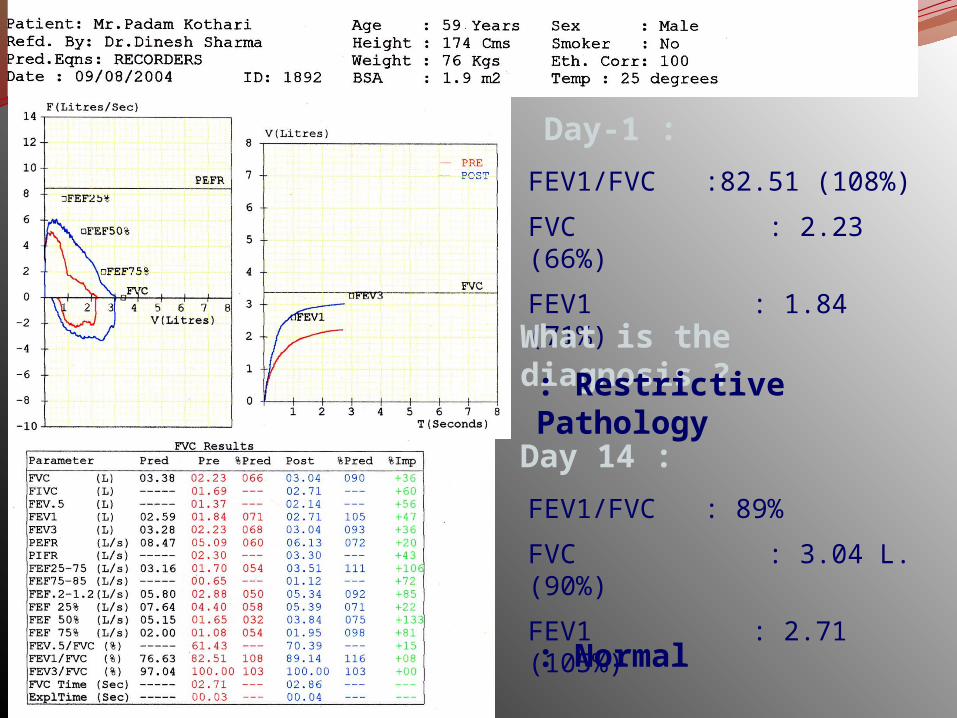
Day-1 :
FEV1/FVC :82.51 (108%)
FVC : 2.23 (66%)
FEV1 : 1.84 (71%)
What is the diagnosis ?: Restrictive Pathology
Day 14 :
FEV1/FVC : 89%
FVC : 3.04 L.(90%)
FEV1 : 2.71 (105%)
: Normal
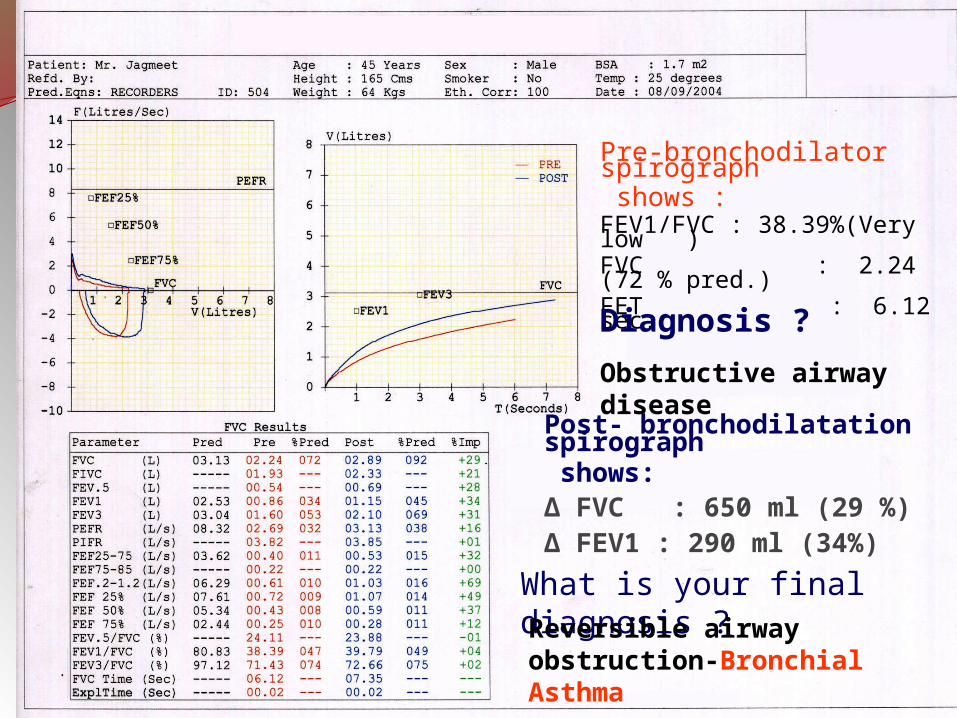
Pre-bronchodilator spirograph shows :FEV1/FVC : 38.39%(Very low )FVC : 2.24 (72 % pred.)FET : 6.12 sec.
Diagnosis ?
Obstructive airway disease
Post- bronchodilatation spirograph shows:Δ FVC : 650 ml (29 %)Δ FEV1 : 290 ml (34%)
What is your final diagnosis ?Reversible airway obstruction-Bronchial Asthma
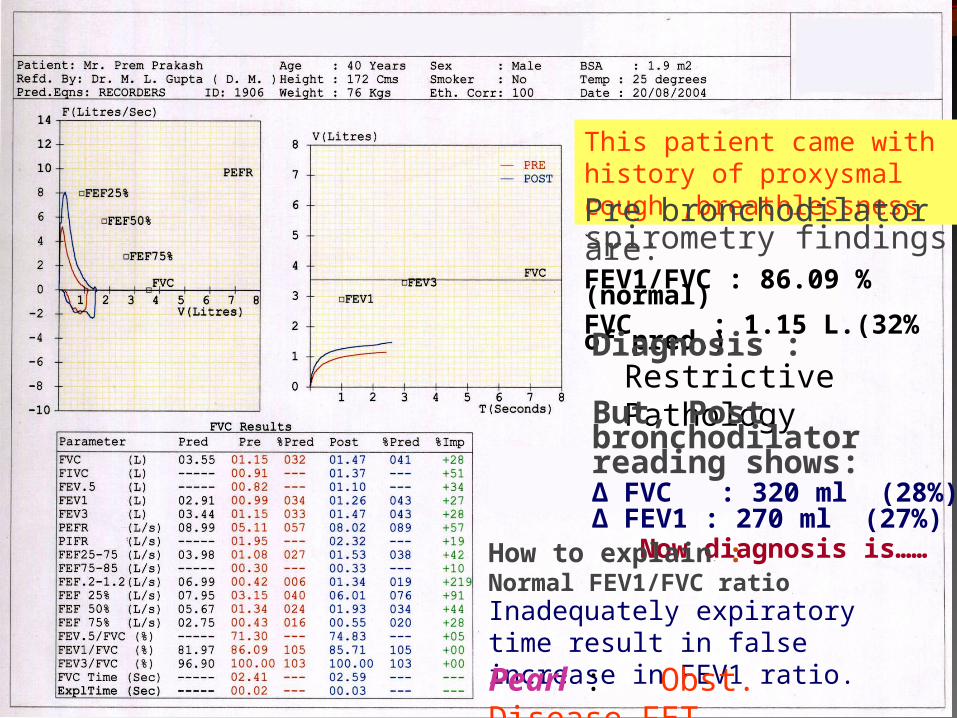
This patient came with history of proxysmal cough ,breathlessness
Pre bronchodilatorspirometry findings are:FEV1/FVC : 86.09 %(normal)FVC : 1.15 L.(32% of pred.)
Diagnosis :Restrictive Pathology
But, Post bronchodilator reading shows: Δ FVC : 320 ml (28%)Δ FEV1 : 270 ml (27%) Now diagnosis is……
How to explain : Normal FEV1/FVC ratioInadequately expiratory time result in false increase in FEV1 ratio.
Pearl : Obst. Disease,FET
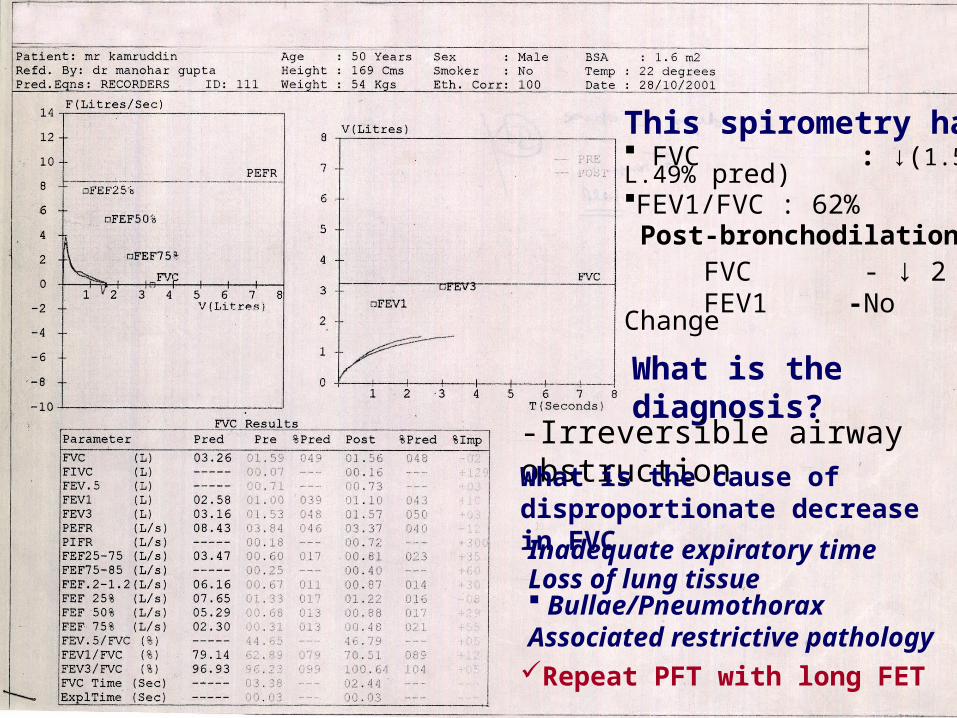
This spirometry has FVC : ↓(1.59 L.49% pred)FEV1/FVC : 62% Post-bronchodilation FVC - ↓ 2 % FEV1 -No Change
What is the diagnosis?
-Irreversible airway obstructionWhat is the cause of disproportionate decrease in FVC
Inadequate expiratory timeLoss of lung tissue Bullae/Pneumothorax Associated restrictive pathology Repeat PFT with long FET
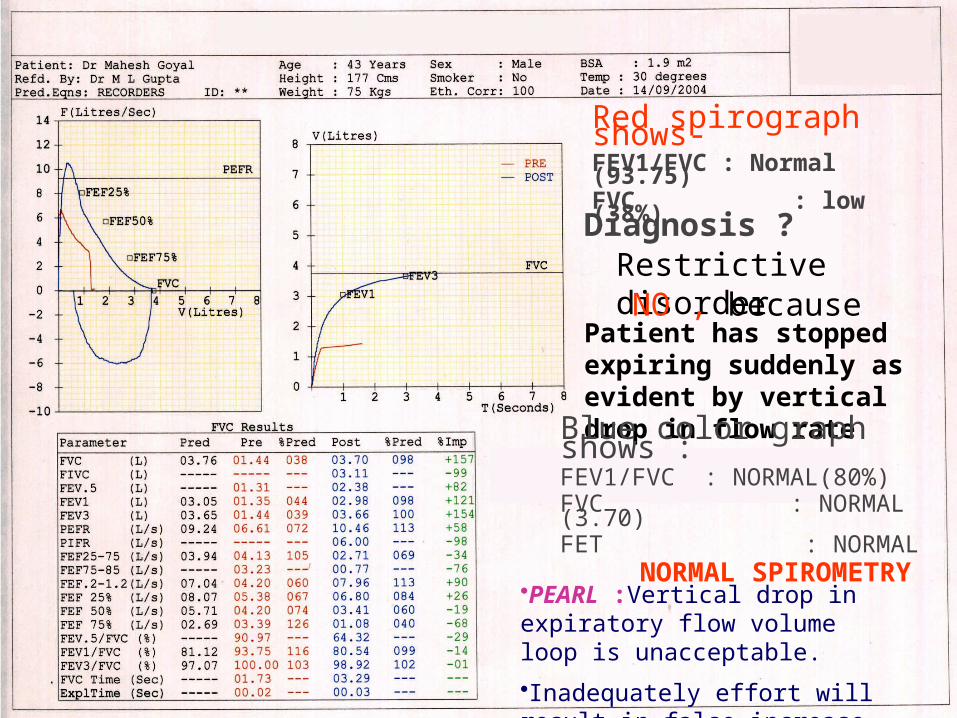
Red spirograph shows-FEV1/FVC : Normal (93.75)FVC : low (38%)
Diagnosis ?Restrictive disorderNO , because
Patient has stopped expiring suddenly as evident by vertical drop in flow rate
Blue color graph shows :FEV1/FVC : NORMAL(80%)FVC : NORMAL (3.70)FET : NORMAL NORMAL SPIROMETRY
•PEARL :Vertical drop in expiratory flow volume loop is unacceptable.
•Inadequately effort will result in false increase in FEV1/FVC ratio.
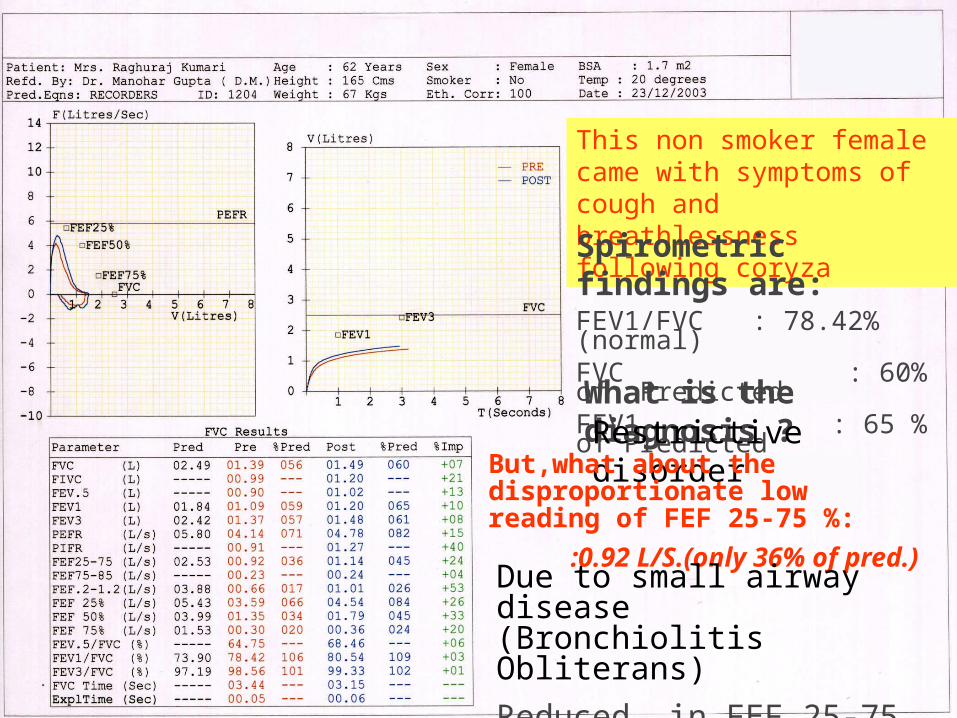
This non smoker female came with symptoms of cough and breathlessness following coryza
Spirometric findings are:FEV1/FVC : 78.42% (normal)FVC : 60% of PredictedFEV1 : 65 % of Predicted
What is the diagnosis ?Restrictive disorder
But,what about the disproportionate low reading of FEF 25-75 %:
:0.92 L/S.(only 36% of pred.)
Due to small airway disease (Bronchiolitis Obliterans)
Reduced in FEF 25-75 % with normal FEV1/FVC ratio.
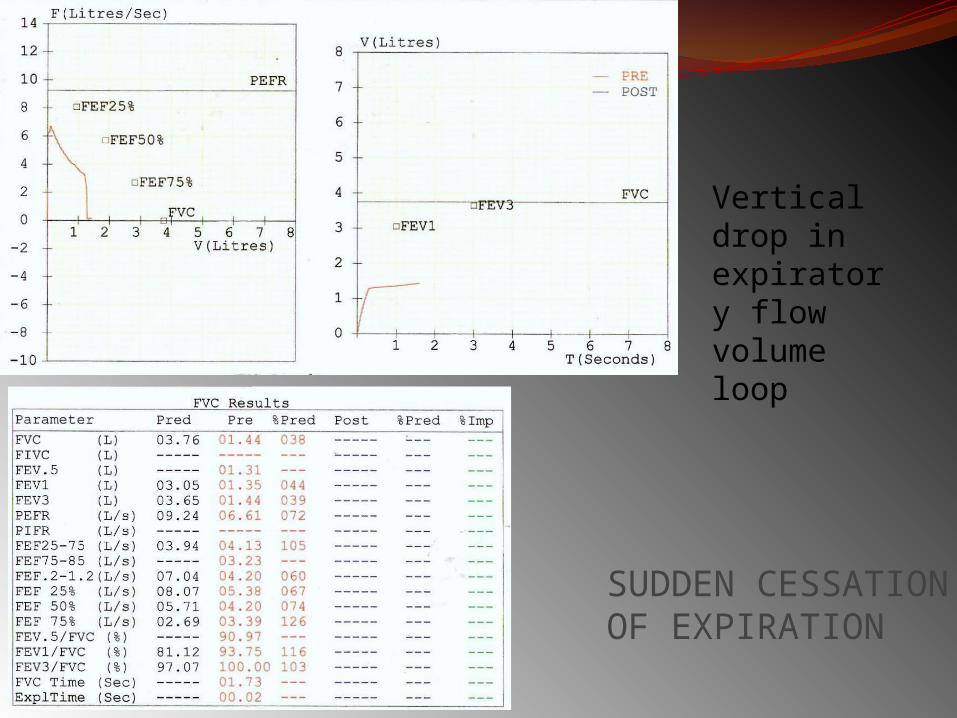
SUDDEN CESSATION OF EXPIRATION
Vertical drop in expiratory flow volume loop
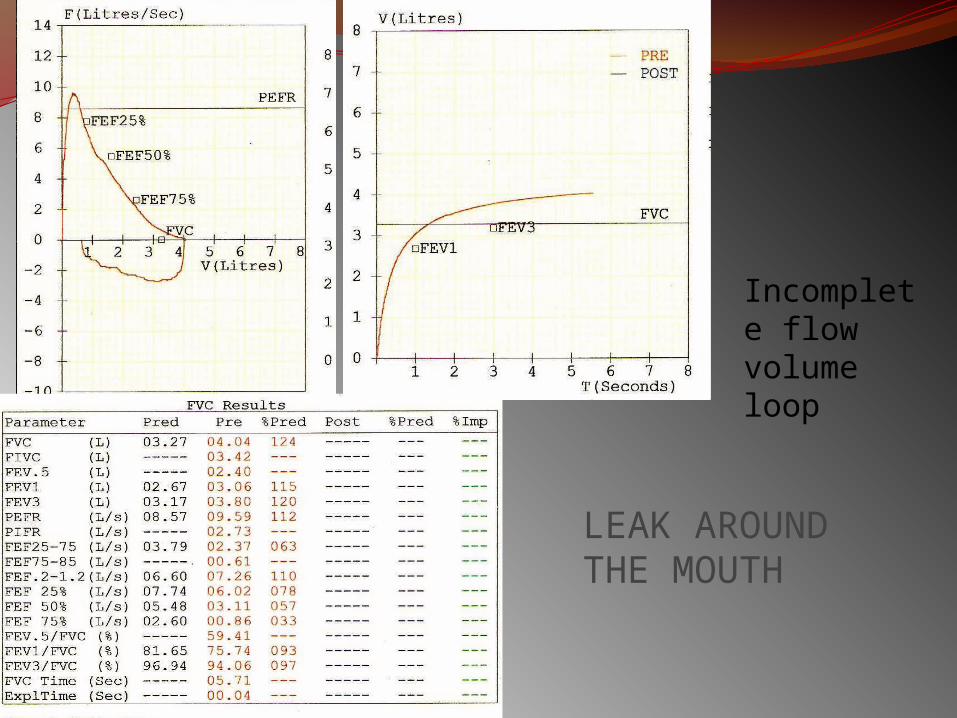
LEAK AROUND THE MOUTH
Incomplete flow volume loop
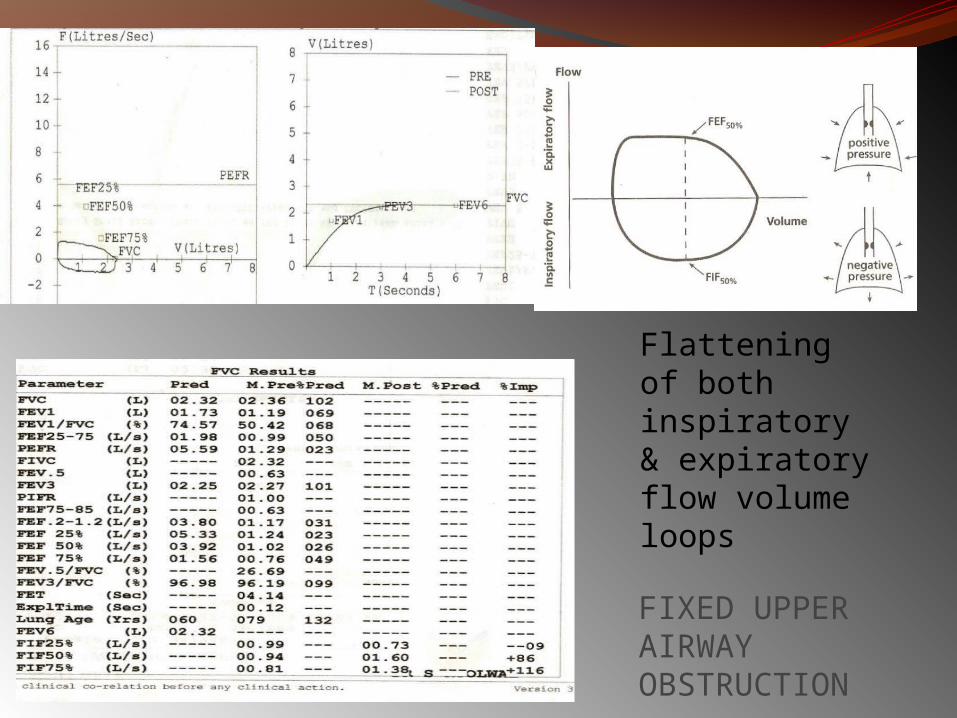
FIXED UPPER AIRWAY OBSTRUCTION
Flattening of both inspiratory & expiratory flow volume loops
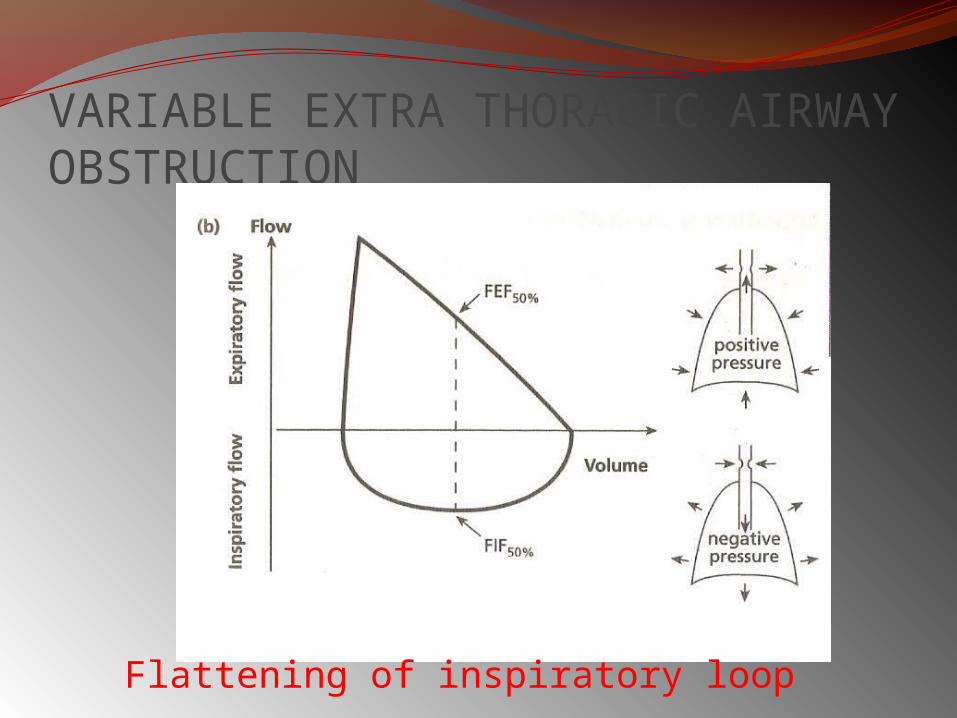
VARIABLE EXTRA THORACIC AIRWAY OBSTRUCTION
Flattening of inspiratory loop
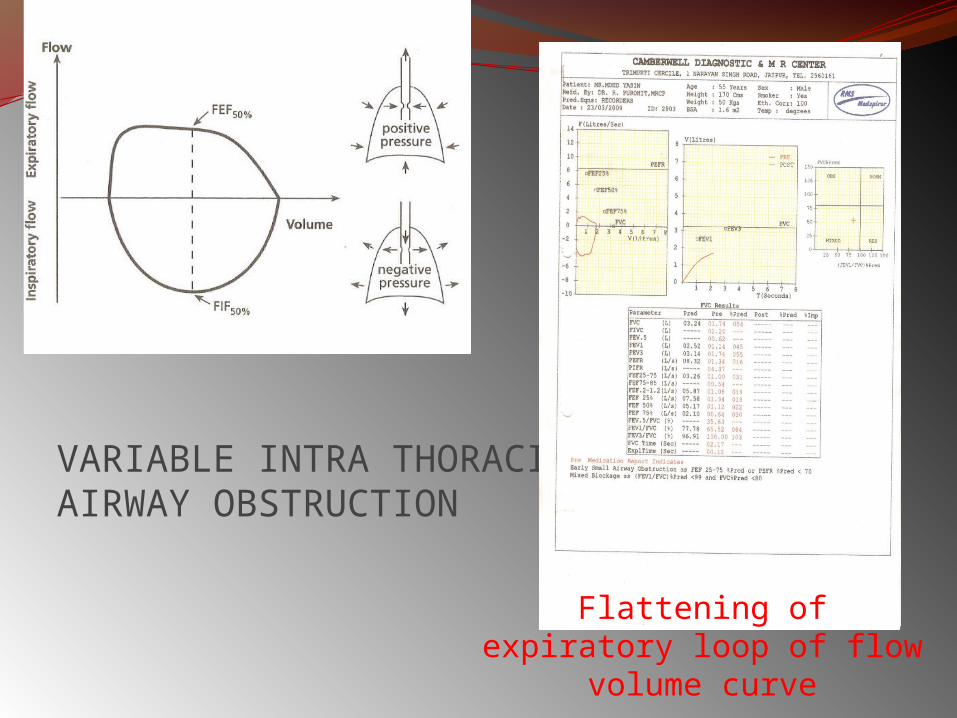
VARIABLE INTRA THORACIC AIRWAY OBSTRUCTION
Flattening of expiratory loop of flow volume curve
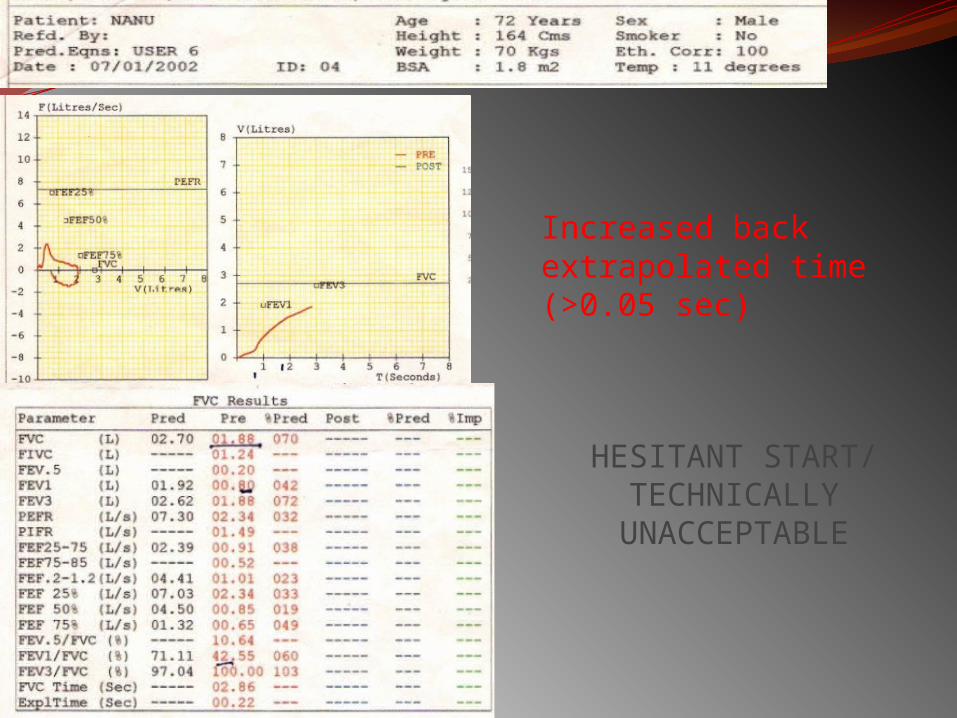
HESITANT START/ TECHNICALLY
UNACCEPTABLE
Increased back extrapolated time (>0.05 sec)
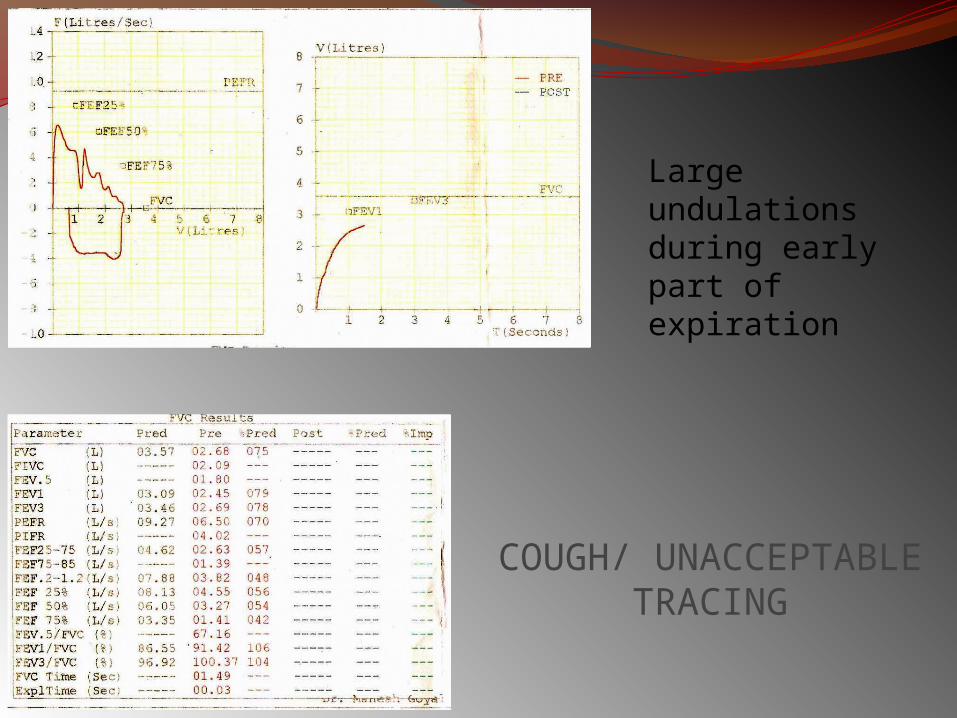
COUGH/ UNACCEPTABLE TRACING
Large undulations during early part of expiration
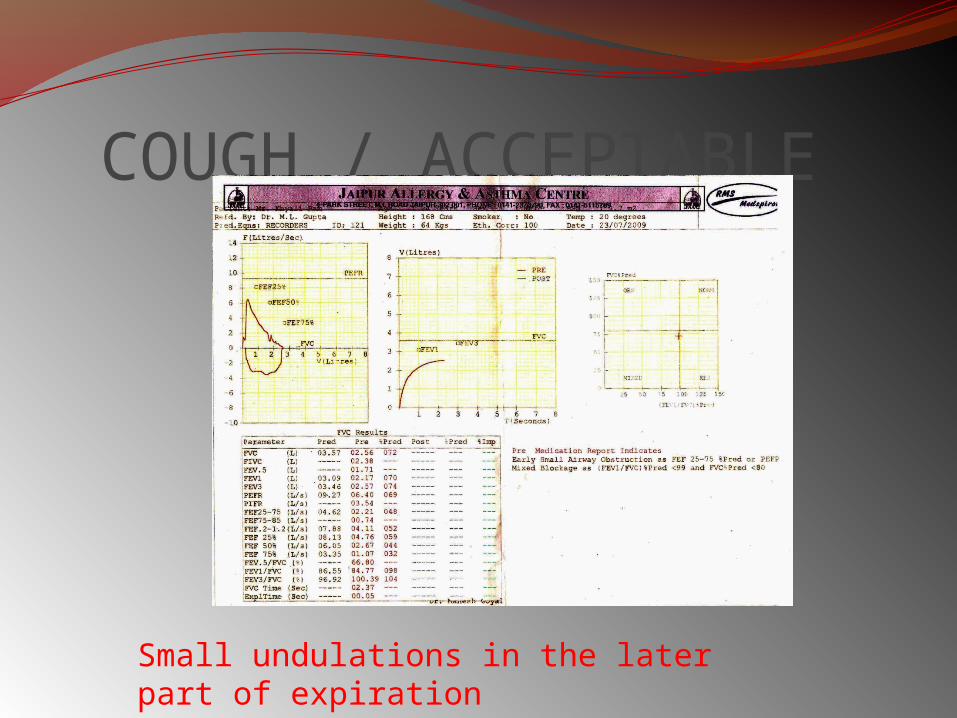
COUGH / ACCEPTABLE
Small undulations in the later part of expiration
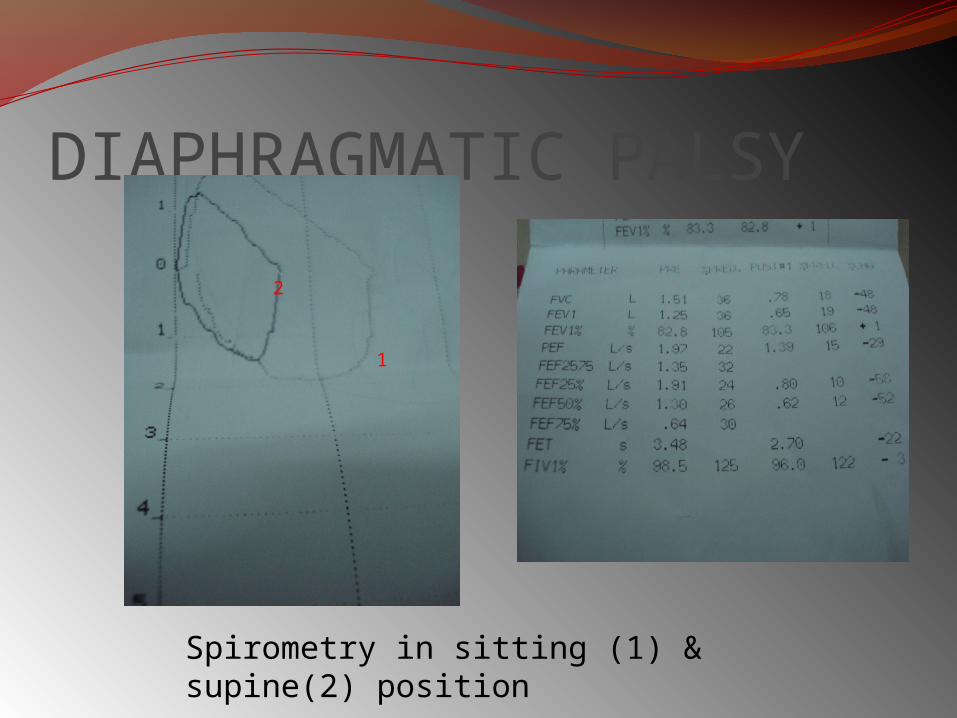
DIAPHRAGMATIC PALSY
2
1
Spirometry in sitting (1) & supine(2) position
104

THANK YOU!