Embed Size (px)
Citation preview

Practical 2: Using Graphs, solver, conditionals statement
Gopalan Vivek
Objectives
Learn about chartsFormatting chart componentsUsing SolverIF statementNested statements
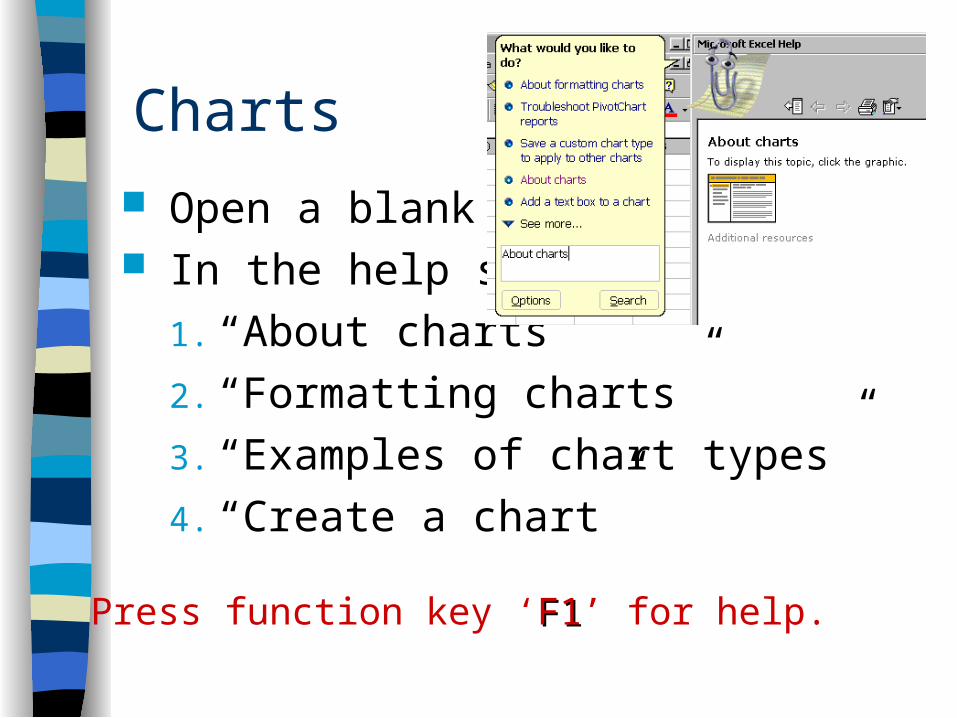
Charts
Open a blank Excel windows In the help search for
1. “About charts”
2. “Formatting charts”
3. “Examples of chart types”
4. “Create a chart”
Press function key ‘F1F1’ for help.
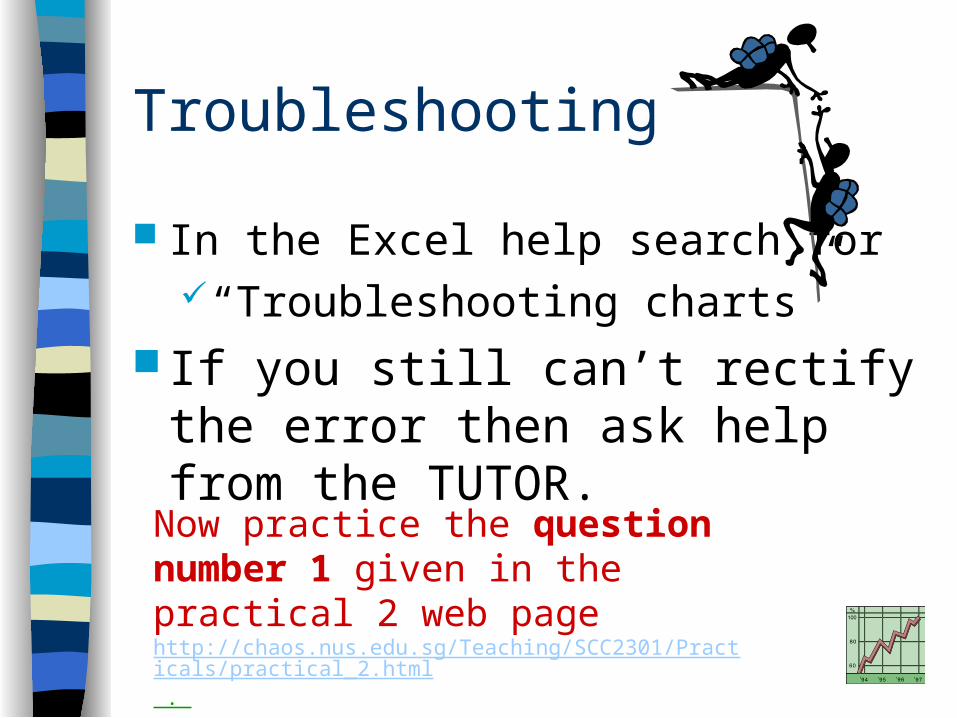
Troubleshooting
In the Excel help search for “Troubleshooting charts”
If you still can’t rectify the error then ask help from the TUTOR.
Now practice the question number 1 given in the practical 2 web page http://chaos.nus.edu.sg/Teaching/SCC2301/Practicals/practical_2.html .
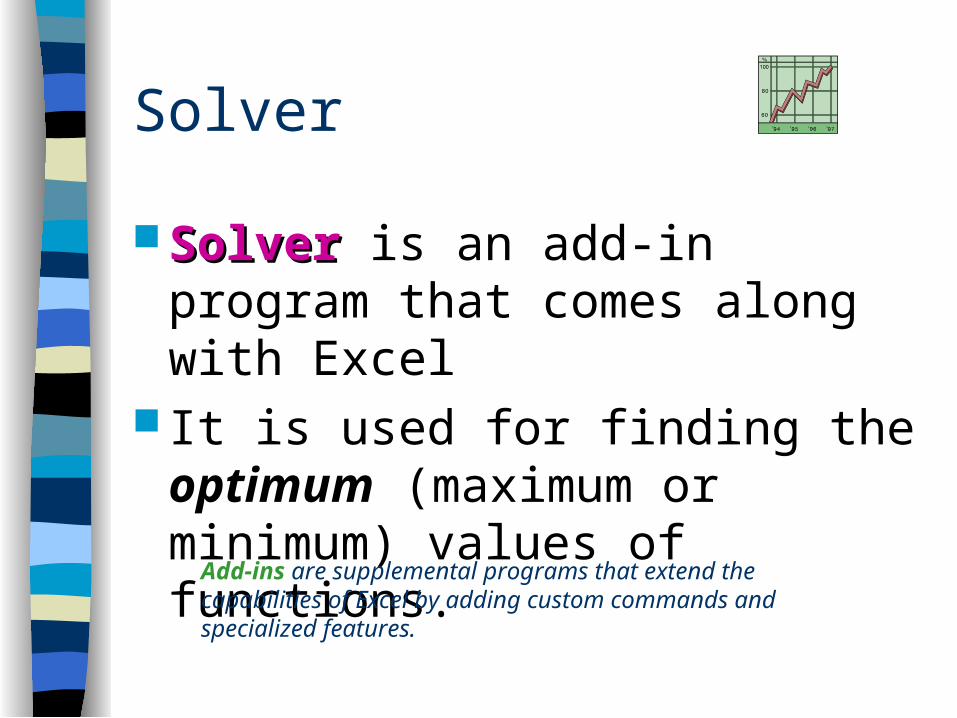
Solver
SolverSolver is an add-in program that comes along with Excel
It is used for finding the optimum (maximum or minimum) values of functions.
Add-ins are supplemental programs that extend the capabilities of Excel by adding custom commands and specialized features.

Solver – installing and loading
Type “Install and load solver” in the Excel help and follow the instructions.
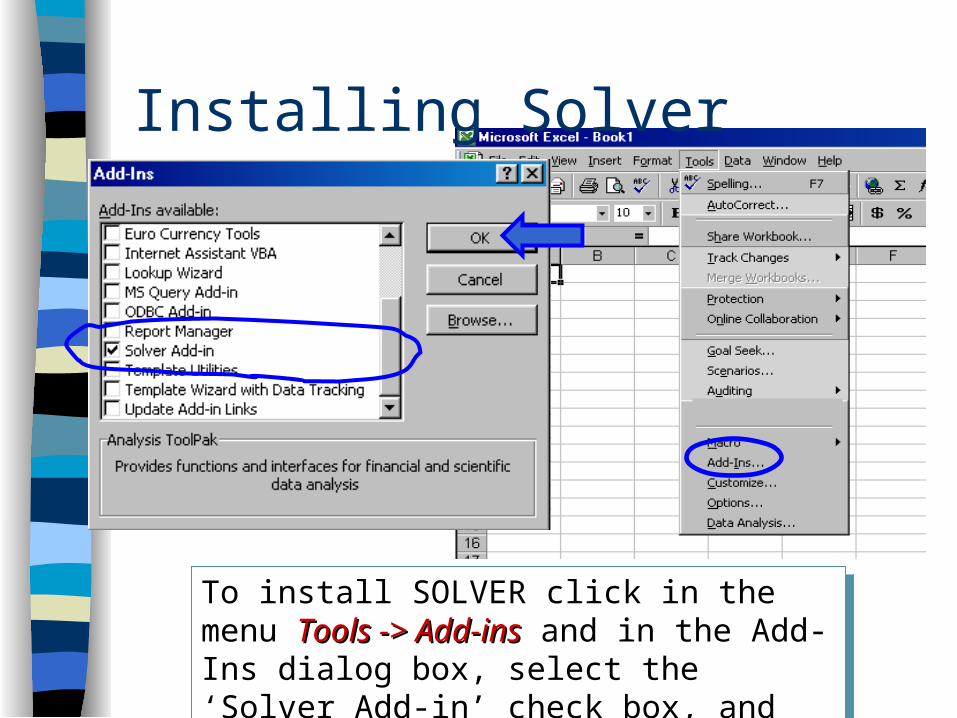
Installing Solver
To install SOLVER click in the menu Tools -> Tools -> Add-insAdd-ins and in the Add-Ins dialog box, select the ‘Solver Add-in’ check box, and then click OK.
To install SOLVER click in the menu Tools -> Tools -> Add-insAdd-ins and in the Add-Ins dialog box, select the ‘Solver Add-in’ check box, and then click OK.
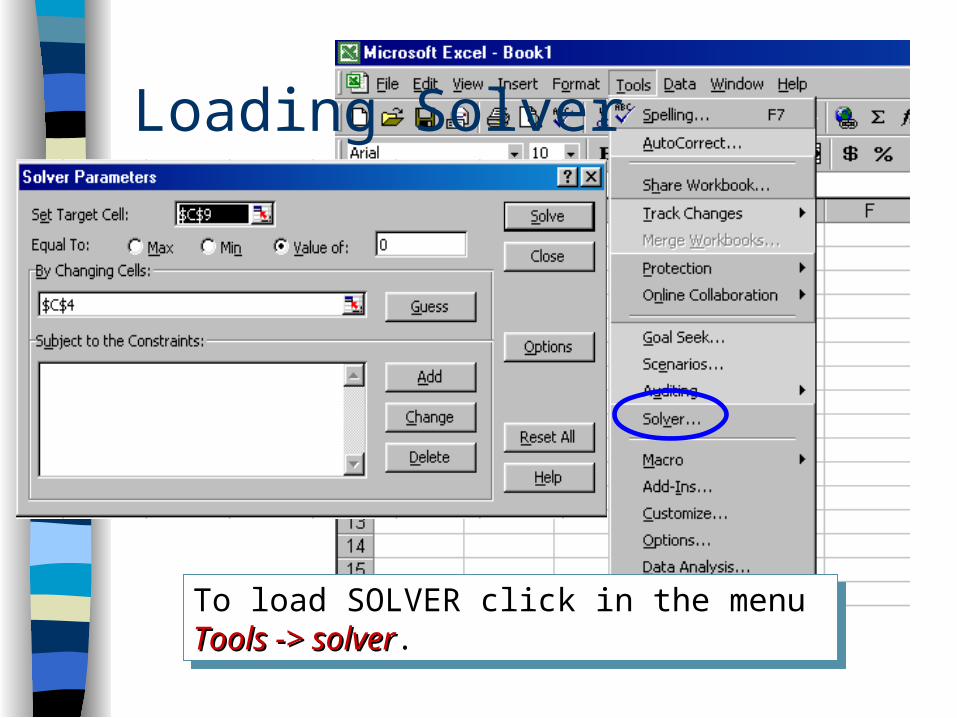
Loading Solver
To load SOLVER click in the menu Tools -> Tools -> solversolver.
To load SOLVER click in the menu Tools -> Tools -> solversolver.
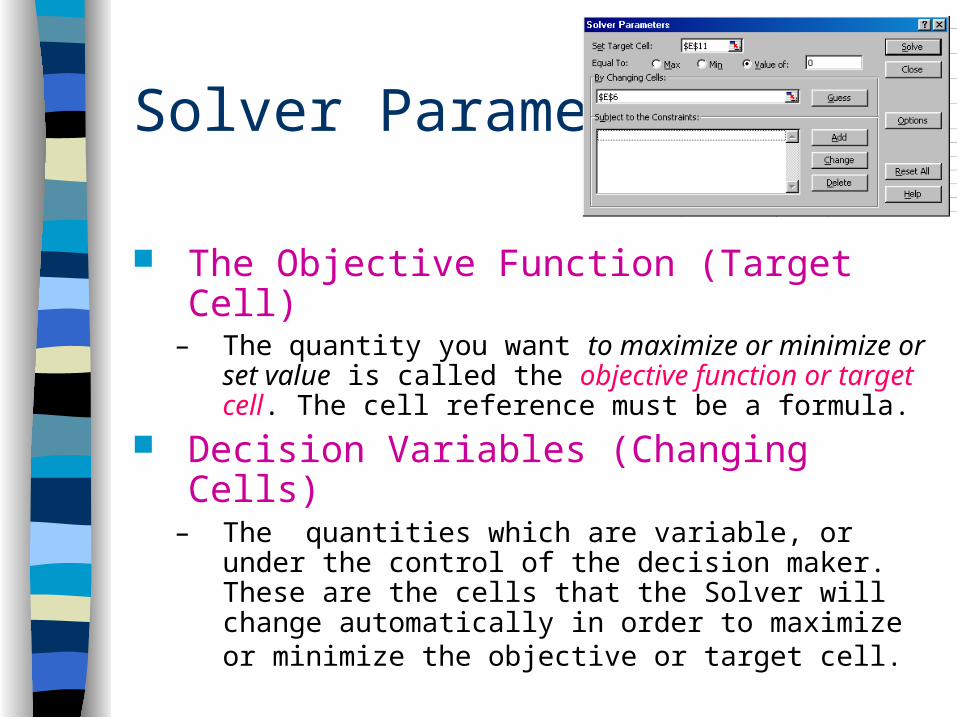
Solver Parameters
The Objective Function (Target Cell)– The quantity you want to maximize or minimize
or set value is called the objective function or target cell. The cell reference must be a formula.
Decision Variables (Changing Cells)– The quantities which are variable, or under the
control of the decision maker. These are the cells that the Solver will change automatically in order to maximize or minimize the objective or target cell.
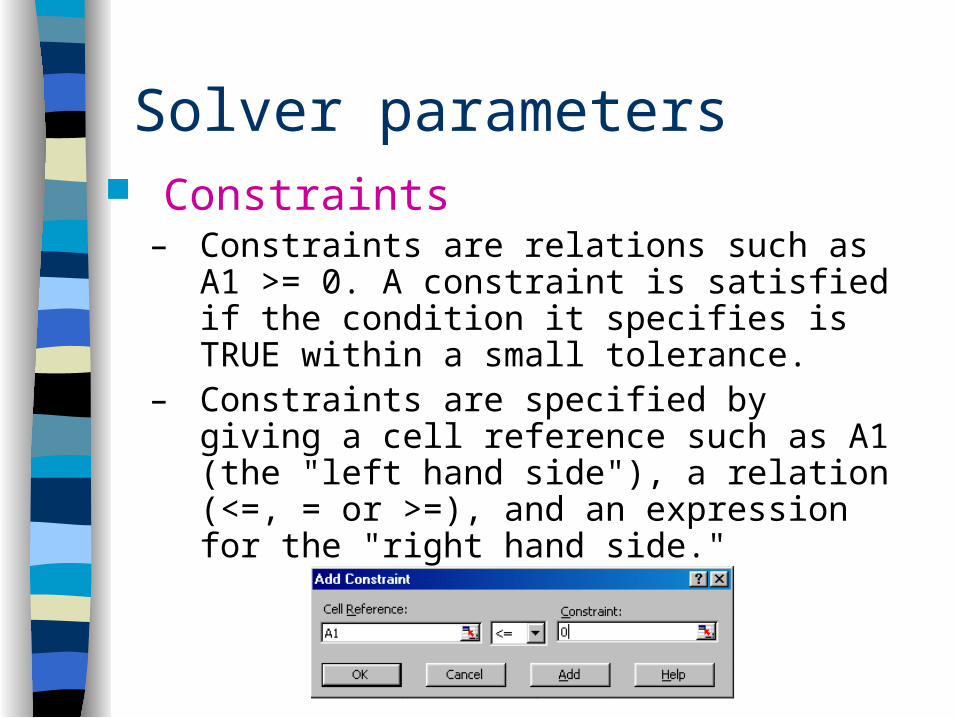
Solver parameters Constraints
– Constraints are relations such as A1 >= 0. A constraint is satisfied if the condition it specifies is TRUE within a small tolerance.
– Constraints are specified by giving a cell reference such as A1 (the "left hand side"), a relation (<=, = or >=), and an expression for the "right hand side."
Bre
ak-E
ven
Ana
lysi
s
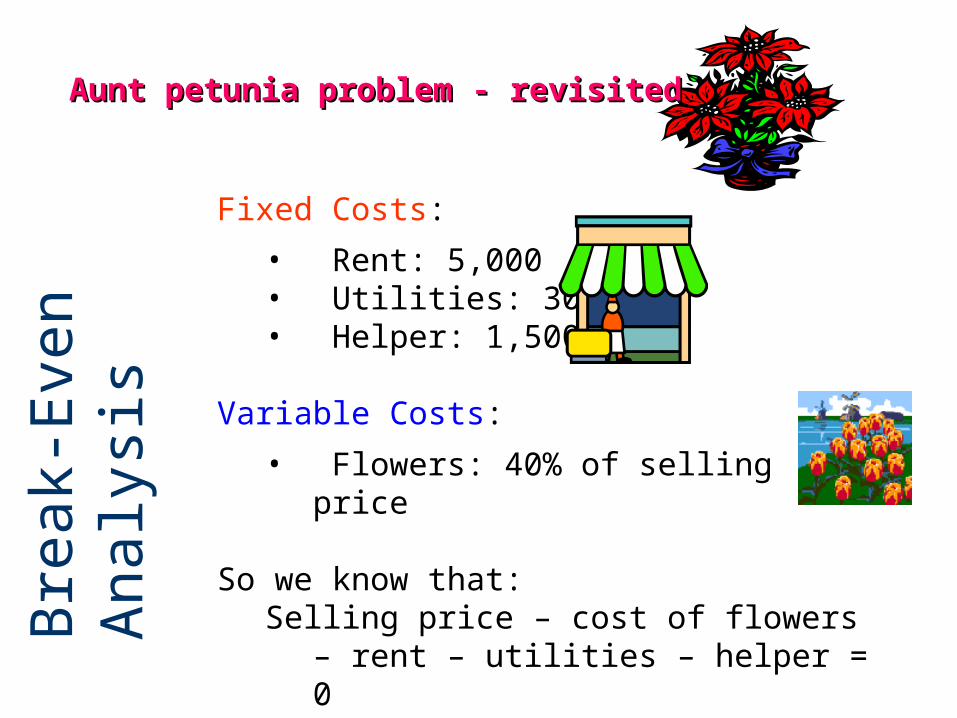
Fixed Costs:
• Rent: 5,000• Utilities: 300• Helper: 1,500
Variable Costs:
• Flowers: 40% of selling price
So we know that: Selling price – cost of flowers – rent – utilities
– helper = 0when she breaks even???
Aunt petunia problem - revisitedAunt petunia problem - revisited
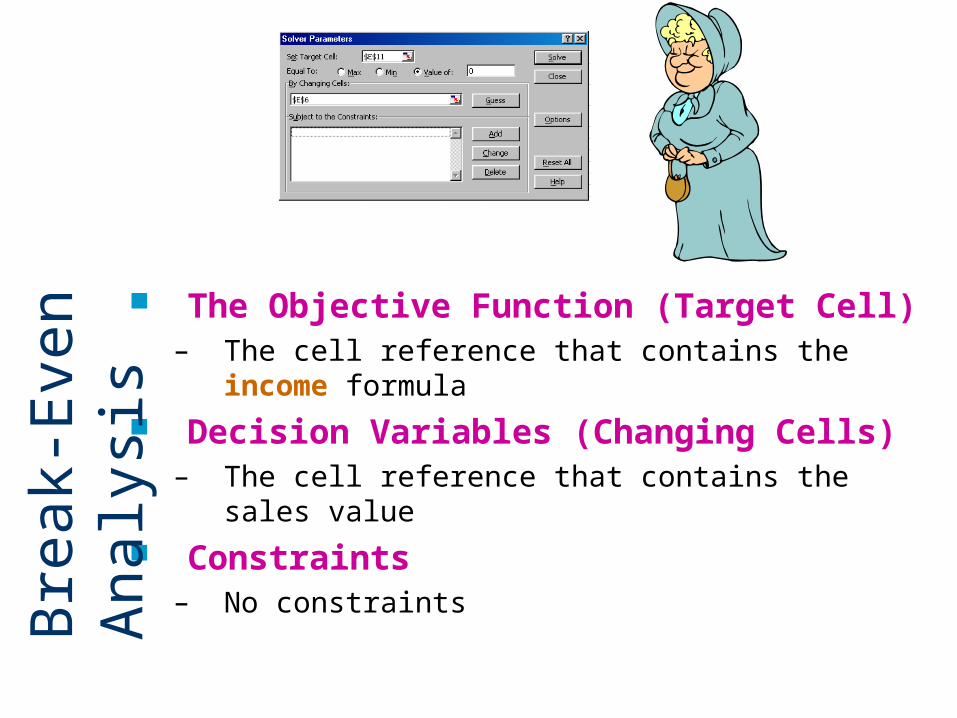
The Objective Function (Target Cell)– The cell reference that contains the income
formula
Decision Variables (Changing Cells)– The cell reference that contains the sales value
Constraints– No constraints
Bre
ak-E
ven
Ana
lysi
s
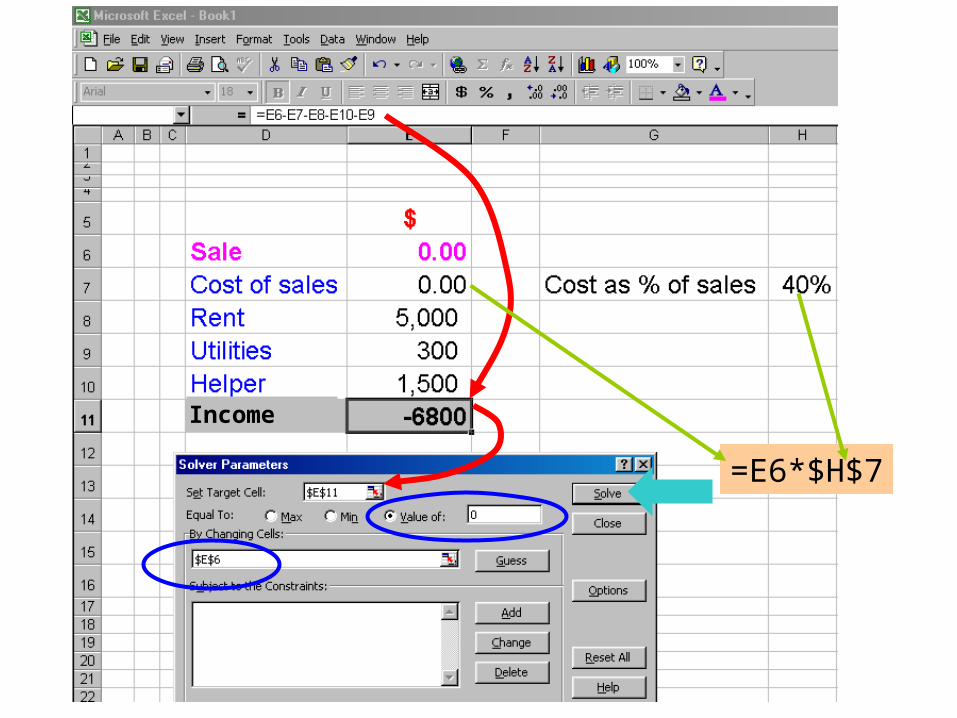
Income
=E6*$H$7

Now practice the question number 2 given in the practical 2 web page http://chaos.nus.edu.sg/Teaching/SCC2301/Practicals/practical_2.html .
Aunt petunia problem - solutionAunt petunia problem - solution
IF statement
Conducts conditional tests on values and formulas.
In the Excel help search for “IF statement” for more details.
Also learn to use “Formula Palette” using Excel help
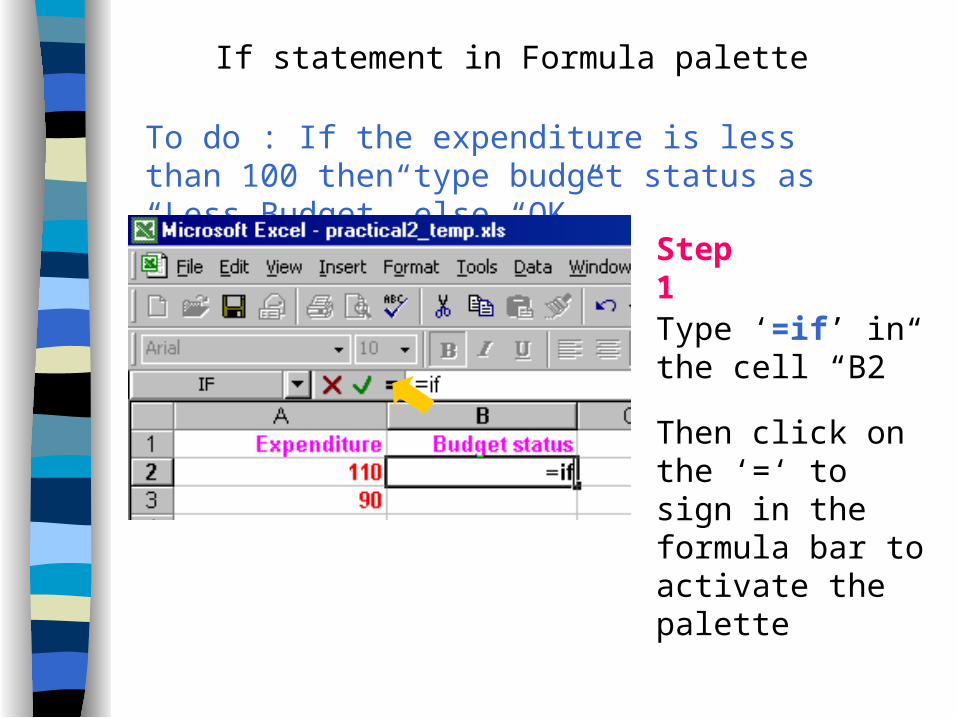
If statement in Formula palette
Type ‘=if’ in the cell “B2”
To do : If the expenditure is less than 100 then type budget status as “Less Budget” else “OK”
Then click on the ‘=‘ to sign in the formula bar to activate the palette
Step 1
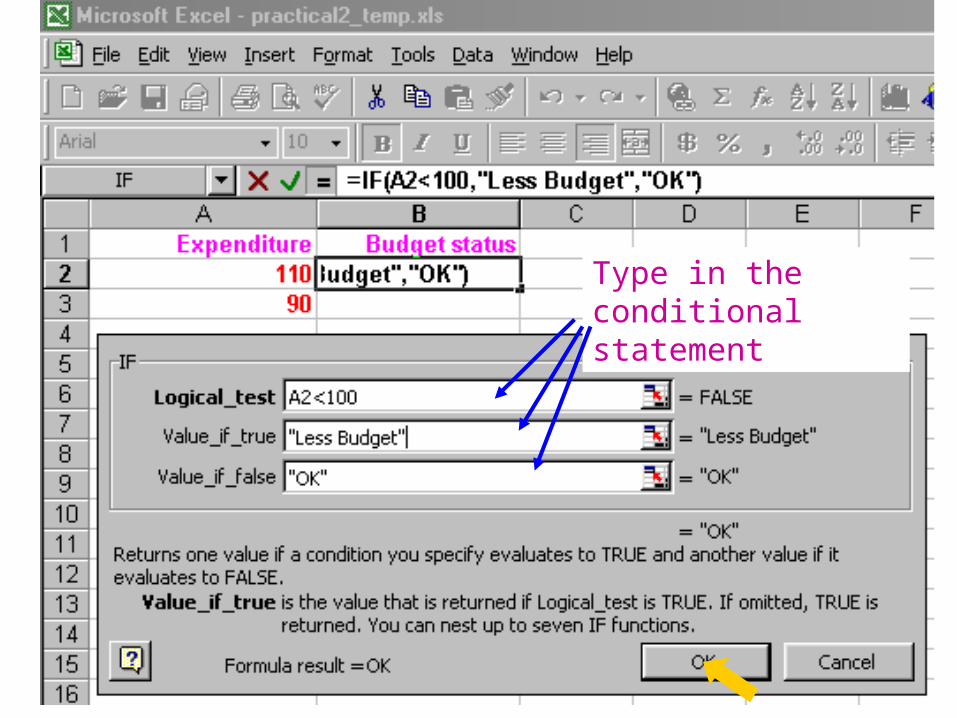
Type in the conditional statement
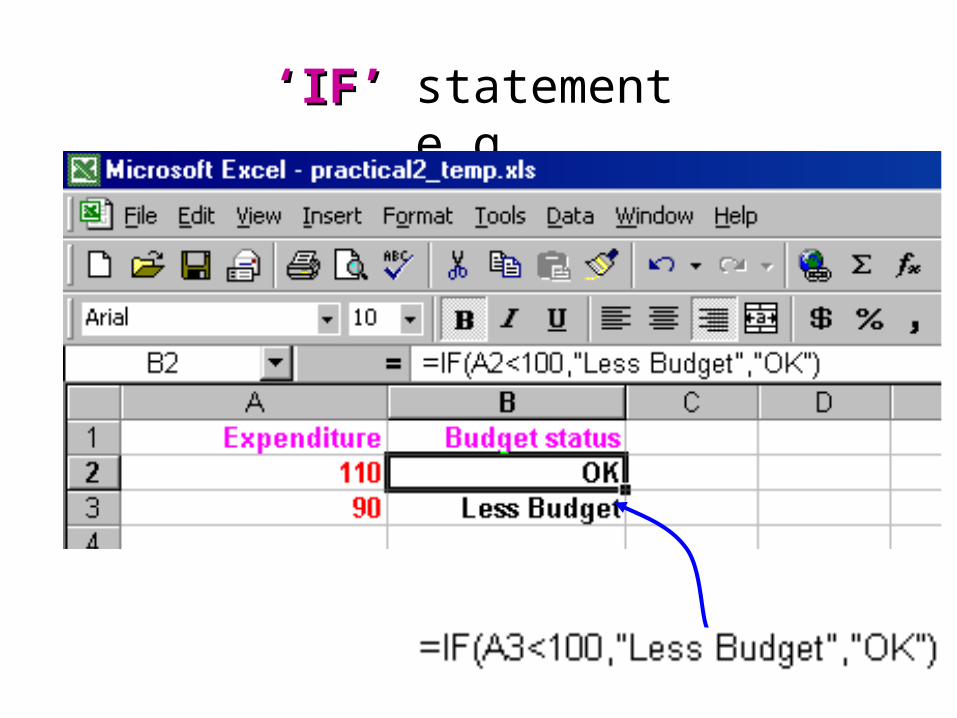
‘‘IF’IF’ statement e.g.
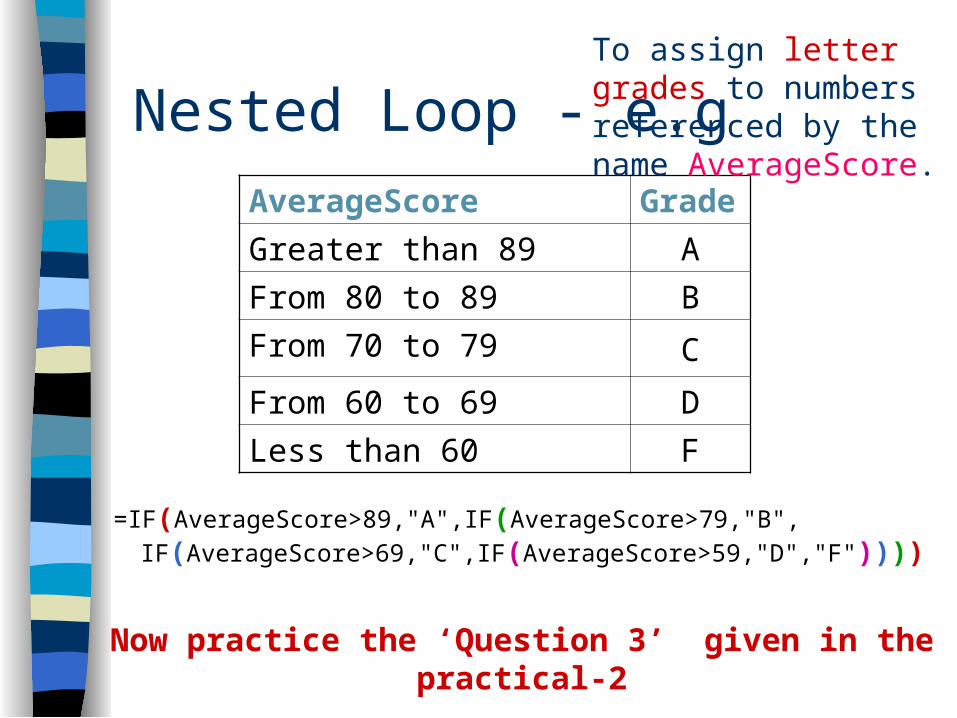
Nested Loop - e.g
=IF(AverageScore>89,"A",IF(AverageScore>79,"B", IF(AverageScore>69,"C",IF(AverageScore>59,"D","F"))))
AverageScore Grade
Greater than 89 A
From 80 to 89 B
From 70 to 79 C
From 60 to 69 D
Less than 60 F
To assign letter grades to numbers referenced by the name AverageScore.
Now practice the ‘Question 3’ given in the practical-2
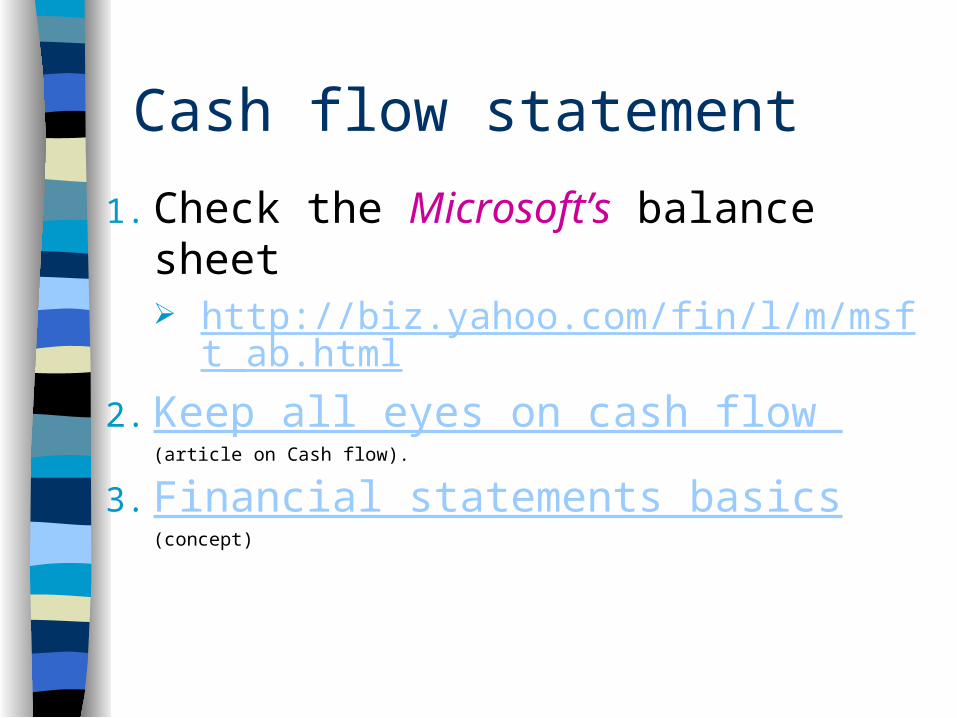
Cash flow statement
1. Check the Microsoft’s balance sheet http://biz.yahoo.com/fin/l/m/msft_ab.html
2. Keep all eyes on cash flow (article on Cash flow).
3. Financial statements basics (concept)
Practice – Do this after finishing your Quiz (if you have time)
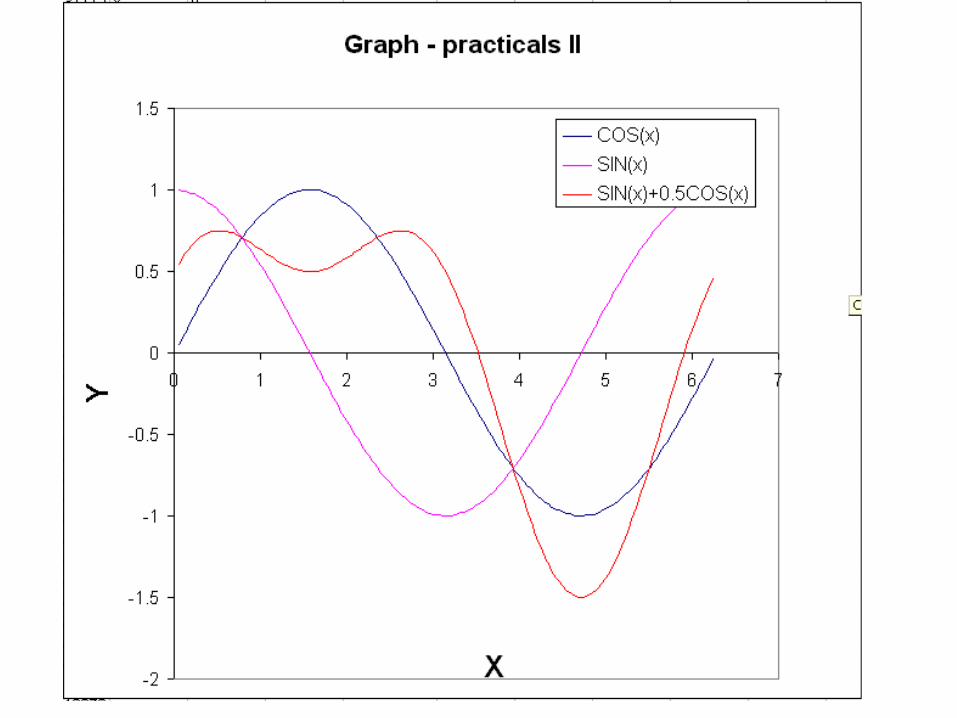
Draw a graph for y = sin(x) + 0.5cos(2x) in the range [0, 2] and using solver find maximum and minimum values of the function in that range.