Embed Size (px)
Citation preview

8/21/2019 PR 9e ISM 01, Graphs
http://slidepdf.com/reader/full/pr-9e-ism-01-graphs 1/65
1
Copyright © 2012 Pearson Education, Inc. Publishing as Prentice Hall
Chapter 1
Graphs
Section 1.11. 0
2. ( )5 3 8 8− − = =
3.2 23 4 25 5+ = =
4. 2 2 211 60 121 3600 3721 61+ = + = =
Since the sum of the squares of two of the sidesof the triangle equals the square of the third side,the triangle is a right triangle.
5. 12 bh
6. true
7. x-coordinate; y-coordinate
8. quadrants
9. midpoint
10. False; the distance between two points is nevernegative.
11. False; points that lie in Quadrant IV will have a
positive x -coordinate and a negative y-coordinate.The point ( )1,4− lies in Quadrant II.
12. True; 1 2 1 2,2 2
x x y y M
+ + =
13. (a) Quadrant II(b) x -axis(c) Quadrant III(d) Quadrant I(e) y-axis
(f) Quadrant IV
14. (a) Quadrant I(b) Quadrant III(c) Quadrant II(d) Quadrant I(e) y-axis(f) x -axis
15. The points will be on a vertical line that is twounits to the right of the y-axis.

8/21/2019 PR 9e ISM 01, Graphs
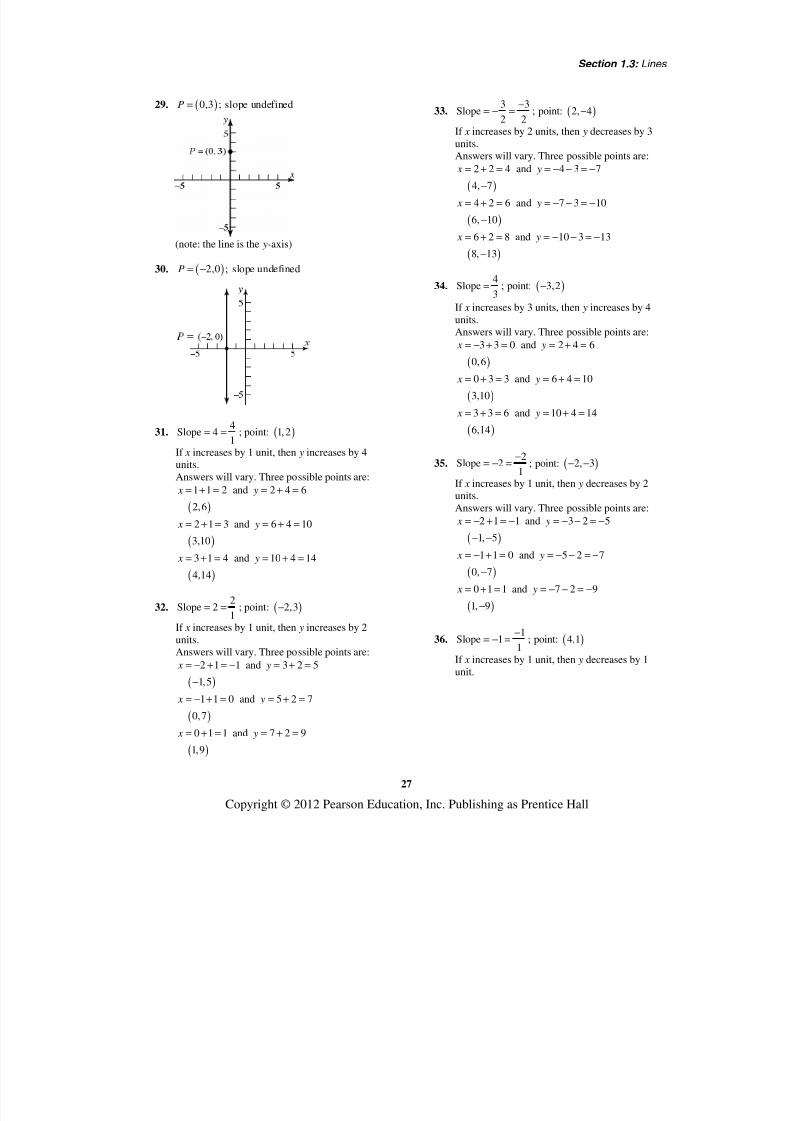
http://slidepdf.com/reader/full/pr-9e-ism-01-graphs 2/65
Chapter 1: Graphs
2
Copyright © 2012 Pearson Education, Inc. Publishing as Prentice Hall
16. The points will be on a horizontal line that isthree units above the x -axis.
17. 2 21 2
2 2
( , ) (2 0) (1 0)
2 1 4 1 5
d P P = − + −
= + = + =
18. 2 21 2
2 2
( , ) ( 2 0) (1 0)
( 2) 1 4 1 5
d P P = − − + −
= − + = + =
19. 2 21 2
2 2
( , ) ( 2 1) (2 1)
( 3) 1 9 1 10
d P P = − − + −
= − + = + =
20. ( )2 2
1 2
2 2
( , ) 2 ( 1) (2 1)
3 1 9 1 10
d P P = − − + −
= + = + =
21. ( )( )
( )
221 2
22
( , ) (5 3) 4 4
2 8 4 64 68 2 17
d P P = − + − −
= + = + = =
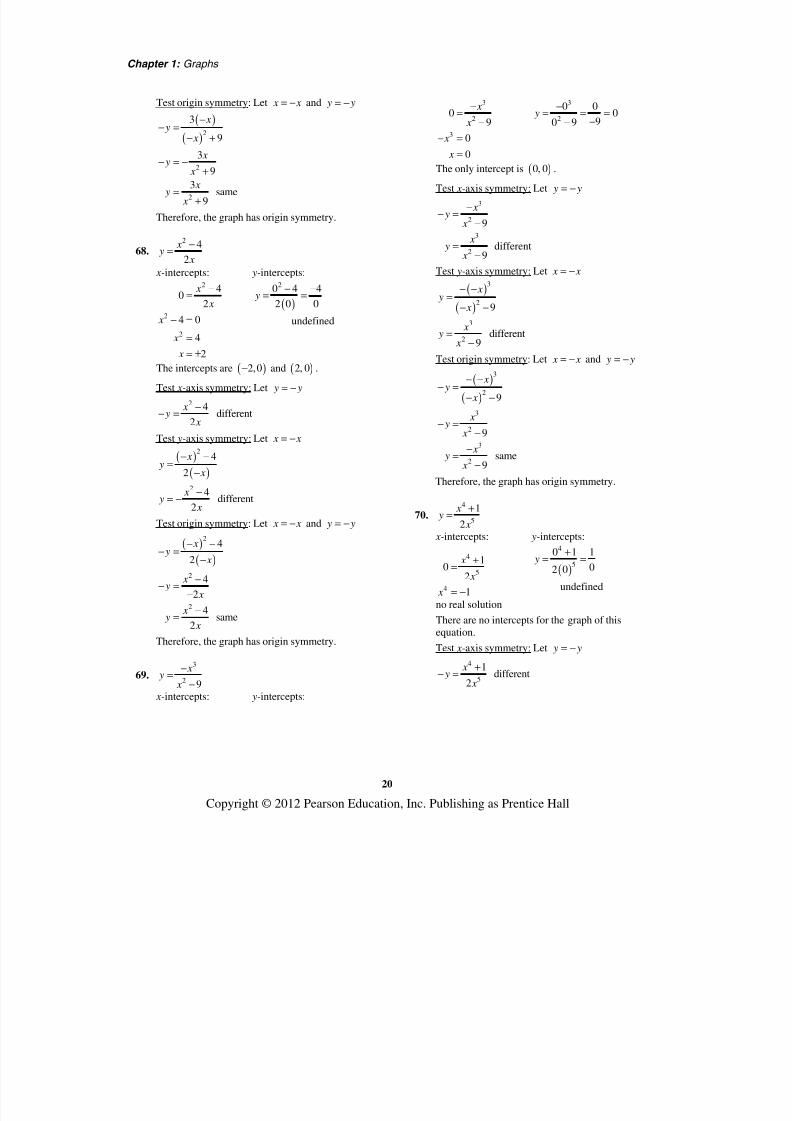
22. ( )( ) ( )
( )
2 2
1 2
2 2
( , ) 2 1 4 0
3 4 9 16 25 5
d P P = − − + −
= + = + = =
23. ( )2 2
1 2
2 2
( , ) 6 ( 3) (0 2)
9 ( 2) 81 4 85
d P P = − − + −
= + − = + =
24. ( ) ( )2 2
1 2
2 2
( , ) 4 2 2 ( 3)
2 5 4 25 29
d P P = − + − −
= + = + =
25. ( )22
1 2
2 2
( , ) (6 4) 4 ( 3)
2 7 4 49 53
d P P = − + − −
= + = + =
26. ( ) ( )2 2
1 2
2 2
( , ) 6 ( 4) 2 ( 3)
10 5 100 25
125 5 5
d P P = − − + − −
= + = +
= =
27.2 2
1 2
2 2 2 2
( , ) (0 ) (0 )
( ) ( )
d P P a b
a b a b
= − + −
= − + − = +
28.2 2
1 2
2 2
2 2 2
( , ) (0 ) (0 )
( ) ( )
2 2
d P P a a
a a
a a a a
= − + −
= − + −
= + = =
29. ( 2,5), (1,3), ( 1,0) A B C = − = = −
( )
( )
( )
2 2
2 2
2 2
2 2
2 2
2 2
( , ) 1 ( 2) (3 5)
3 ( 2) 9 4 13
( , ) 1 1 (0 3)
( 2) ( 3) 4 9 13
( , ) 1 ( 2) (0 5)
1 ( 5) 1 25 26
d A B
d B C
d A C
= − − + −
= + − = + =
= − − + −
= − + − = + =
= − − − + −
= + − = + =
Verifying that ∆ ABC is a right triangle by thePythagorean Theorem:
[ ] [ ] [ ]
( ) ( ) ( )
2 2 2
2 2 2
( , ) ( , ) ( , )
13 13 26
13 13 26
26 26
d A B d B C d A C + =
+ =
+ =
=
The area of a triangle is1
2 A bh= ⋅ . In this
problem,

8/21/2019 PR 9e ISM 01, Graphs
http://slidepdf.com/reader/full/pr-9e-ism-01-graphs 3/65
Section 1.1: The Distance and Midpoint Formulas
3
Copyright © 2012 Pearson Education, Inc. Publishing as Prentice Hall
[ ] [ ]1 ( , ) ( , )2
1 113 13 132 2
13 square units2
A d A B d B C = ⋅⋅
= ⋅ = ⋅⋅
=
30. ( 2, 5), (12, 3), (10, 11) A B C = − = = −
( )
( )
( )
2 2
2 2
2 2
2 2
2 2
2 2
( , ) 12 ( 2) (3 5)
14 ( 2)
196 4 200
10 2
( , ) 10 12 ( 11 3)
( 2) ( 14)
4 196 200
10 2
( , ) 10 ( 2) ( 11 5)
12 ( 16)
144 256 400
20
d A B
d B C
d A C
= − − + −
= + −
= + =
=
= − + − −
= − + −
= + =
=
= − − + − −
= + −
= + =
=
Verifying that ∆ ABC is a right triangle by thePythagorean Theorem:
[ ] [ ] [ ]
( ) ( ) ( )
2 2 2
2 2 2
( , ) ( , ) ( , )
10 2 10 2 20
200 200 400
400 400
d A B d B C d A C + =
+ =
+ =
=
The area of a triangle is1
2 A bh= . In this
problem,
[ ] [ ]1
( , ) ( , )2
110 2 10 2
2
1100 2
2
100 square units
A d A B d B C = ⋅ ⋅
= ⋅ ⋅
= ⋅ ⋅
=
31. ( 5,3), (6,0), (5,5) A B C = − = =
( )
( )
( )
2 2
2 2
2 2
2 2
2 2
2 2
( , ) 6 ( 5) (0 3)
11 ( 3) 121 9
130
( , ) 5 6 (5 0)
( 1) 5 1 25
26
( , ) 5 ( 5) (5 3)
10 2 100 4
104
2 26
d A B
d B C
d A C
= − − + −
= + − = +
=
= − + −
= − + = +
=
= − − + −
= + = +
=
=
Verifying that ∆ ABC is a right triangle by thePythagorean Theorem:
[ ] [ ] [ ]
( ) ( ) ( )
2 2 2
2 2 2
( , ) ( , ) ( , )
104 26 130
104 26 130
130 130
d A C d B C d A B+ =
+ =
+ =
=
The area of a triangle is1
2 A bh= . In this

8/21/2019 PR 9e ISM 01, Graphs
http://slidepdf.com/reader/full/pr-9e-ism-01-graphs 4/65
Chapter 1: Graphs
4
Copyright © 2012 Pearson Education, Inc. Publishing as Prentice Hall
problem,
[ ] [ ]1
( , ) ( , )2
1104 26
2
12 26 26
2
12 26
2
26 square units
A d A C d B C = ⋅ ⋅
= ⋅ ⋅
= ⋅ ⋅
= ⋅ ⋅
=
32. ( 6, 3), (3, 5), ( 1, 5) A B C = − = − = −
( )
( )
( )
2 2
2 2
2 2
2 2
2 2
2 2
( , ) 3 ( 6) ( 5 3)
9 ( 8) 81 64
145
( , ) 1 3 (5 ( 5))
( 4) 10 16 100
116 2 29
( , ) 1 ( 6) (5 3)
5 2 25 4
29
d A B
d B C
d A C
= − − + − −
= + − = +
=
= − − + − −
= − + = +
= =
= − − − + −
= + = +
=
Verifying that ∆ ABC is a right triangle by thePythagorean Theorem:
[ ] [ ] [ ]
( ) ( ) ( )
2 2 2
2 2 2
( , ) ( , ) ( , )
29 2 29 145
29 4 29 145
29 116 145
145 145
d A C d B C d A B+ =
+ =
+ ⋅ =
+ =
=
The area of a triangle is1
2 A bh= . In this
problem,
[ ] [ ]1
( , ) ( , )2
129 2 29
2
12 29
2
29 square units
A d A C d B C = ⋅ ⋅
= ⋅ ⋅
= ⋅ ⋅
=
33. (4, 3), (0, 3), (4, 2) A B C = − = − =
( )
( ) ( )
( )
22
2 2
2 2
2 2
22
2 2
( , ) (0 4) 3 ( 3)
( 4) 0 16 0
16
4
( , ) 4 0 2 ( 3)
4 5 16 25
41
( , ) (4 4) 2 ( 3)
0 5 0 25
25
5
d A B
d B C
d A C
= − + − − −
= − + = +
=
=
= − + − −
= + = +
=
= − + − −
= + = +
=
=
Verifying that ∆ ABC is a right triangle by thePythagorean Theorem:
[ ] [ ] [ ]( )
2 2 2
22 2
( , ) ( , ) ( , )
4 5 41
16 25 41
41 41
d A B d A C d B C + =
+ =
+ =
=
The area of a triangle is1
2 A bh= . In this
8/21/2019 PR 9e ISM 01, Graphs
http://slidepdf.com/reader/full/pr-9e-ism-01-graphs 5/65
Section 1.1: The Distance and Midpoint Formulas
5
Copyright © 2012 Pearson Education, Inc. Publishing as Prentice Hall
problem,
[ ] [ ]1
( , ) ( , )2
14 5
2
10 square units
A d A B d A C = ⋅ ⋅
= ⋅ ⋅
=
34. (4, 3), (4,1), (2, 1) A B C = − = =
( )
( ) ( )
( )
22
2 2
2 2
2 2
22
2 2
( , ) (4 4) 1 ( 3)
0 4
0 16
16
4
( , ) 2 4 1 1
( 2) 0 4 0
4
2
( , ) (2 4) 1 ( 3)
( 2) 4 4 16
20
2 5
d A B
d B C
d A C
= − + − −
= +
= +
=
=
= − + −
= − + = +
=
=
= − + − −
= − + = +
=
=
Verifying that ∆ ABC is a right triangle by thePythagorean Theorem:
[ ] [ ] [ ]
( )
2 2 2
22 2
( , ) ( , ) ( , )
4 2 2 5
16 4 20
20 20
d A B d B C d A C + =
+ =
+ =
=
The area of a triangle is1
2 A bh= . In this problem,
[ ] [ ]1
( , ) ( , )2
14 22
4 square units
A d A B d B C = ⋅ ⋅
= ⋅ ⋅
=
35. The coordinates of the midpoint are:
1 2 1 2( , ) ,2 2
4 43 5,
2 2
8 0,
2 2
(4,0)
x x y y x y
+ + =
− ++ =
=
=
36. The coordinates of the midpoint are:
( )
1 2 1 2( , ) ,2 2
2 2 0 4,
2 2
0 4,
2 2
0, 2
x x y y x y
+ + =
− + + =
=
=
37. The coordinates of the midpoint are:
1 2 1 2
( , ) ,2 2
3 6 2 0,
2 2
3 2,
2 2
3,1
2
x x y y
x y + +
=
− + + =
=
=
38. The coordinates of the midpoint are:
1 2 1 2( , ) ,2 2
2 4 3 2,2 2
6 1,
2 2
13,
2
x x y y x y
+ + =
+ − + =
− =
= −

8/21/2019 PR 9e ISM 01, Graphs
http://slidepdf.com/reader/full/pr-9e-ism-01-graphs 6/65
Chapter 1: Graphs
6
Copyright © 2012 Pearson Education, Inc. Publishing as Prentice Hall
39. The coordinates of the midpoint are:
1 2 1 2( , ) ,2 2
4 6 3 1,
2 2210
,2 2
(5, 1)
x x y y x y
+ + =
+ − + =
−
=
= −
40. The coordinates of the midpoint are:
1 2 1 2( , ) ,2 2
4 2 3 2,
2 2
2 1,
2 21
1,2
x x y y x y
+ + =
− + − + =
− − =
= − −
41. The coordinates of the midpoint are:
1 2 1 2( , ) ,2 2
0 0,
2 2
,2 2
x x y y x y
a b
a b
+ + =
+ + =
=
42. The coordinates of the midpoint are:
1 2 1 2( , ) ,2 2
0 0,
2 2
,2 2
x x y y x y
a a
a a
+ + =
+ + =
=
43. The x coordinate would be 2 3 5+ = and the y
coordinate would be 5 2 3− = . Thus the new
point would be ( )5, 3 .
44. The new x coordinate would be 1 2 3− − = − and
the new y coordinate would be 6 4 10+ = . Thus
the new point would be ( )3,10−
45. a. If we use a right triangle to solve theproblem, we know the hypotenuse is 13 units inlength. One of the legs of the triangle will be2+3=5. Thus the other leg will be:
2 2 2
2
2
5 13
25 169
144
12
b
b
b
b
+ =
+ =
=
=
Thus the coordinates will have an y value of1 12 13− − = − and 1 12 11− + = . So the points
are ( )3,11 and ( )3, 13− .
b. Consider points of the form ( )3, y that are a
distance of 13 units from the point ( )2, 1− − .
( ) ( )
( ) ( )
( ) ( )
2 2
2 1 2 1
2 2
2 2
2
2
3 ( 2) 1
5 1
25 1 2
2 26
d x x y y
y
y
y y
y y
= − + −
= − − + − −
= + − −
= + + +
= + +
( )
( )( )
2
22 2
2
2
13 2 26
13 2 26
169 2 26
0 2 143
0 11 13
y y
y y
y y
y y
y y
= + +
= + +
= + +
= + −
= − +
11 011
y y
− ==
or 13 013
y y
+ == −
Thus, the points ( )3,11 and ( )3, 13− are a
distance of 13 units from the point ( )2, 1− − .
46. a. If we use a right triangle to solve theproblem, we know the hypotenuse is 17 units inlength. One of the legs of the triangle will be2+6=8. Thus the other leg will be:
2 2 2
2
2
8 17
64 289
225
15
b
b
b
b
+ =
+ =
=
=
Thus the coordinates will have an x value of1 15 14− = − and 1 15 16+ = . So the points are
( )14, 6− − and ( )16, 6− .

8/21/2019 PR 9e ISM 01, Graphs
http://slidepdf.com/reader/full/pr-9e-ism-01-graphs 7/65
Section 1.1: The Distance and Midpoint Formulas
7
Copyright © 2012 Pearson Education, Inc. Publishing as Prentice Hall
b. Consider points of the form ( ), 6 x − that are
a distance of 17 units from the point ( )1, 2 .
( ) ( )
( ) ( )( )
( )
2 2
2 1 2 1
22
22
2
2
1 2 6
2 1 8
2 1 64
2 65
d x x y y
x
x x
x x
x x
= − + −
= − + − −
= − + +
= − + +
= − +
( )
( )( )
2
22 2
2
2
17 2 65
17 2 65
289 2 65
0 2 2240 14 16
x x
x x
x x
x x x x
= − +
= − +
= − +
= − −= + −
14 0
14
x
x
+ =
= −
or 16 0
16
x
x
− =
=
Thus, the points ( )14, 6− − and ( )16, 6− are a
distance of 13 units from the point ( )1,2 .
47. Points on the x -axis have a y-coordinate of 0. Thus,
we consider points of the form ( ), 0 x that are adistance of 6 units from the point ( )4, 3− .
( ) ( )
( ) ( )
( )
2 2
2 1 2 1
2 2
22
2
2
4 3 0
16 8 3
16 8 9
8 25
d x x y y
x
x x
x x
x x
= − + −
= − + − −
= − + + −
= − + +
= − +
( )
2
22 2
2
2
2
6 8 25
6 8 25
36 8 25
0 8 11
( 8) ( 8) 4(1)( 11)
2(1)
8 64 44 8 108
2 2
8 6 34 3 3
2
x x
x x
x x
x x
x
= − +
= − +
= − +
= − −
− − ± − − −=
± + ±= =
±= = ±
4 3 3 x = + or 4 3 3 x = −
Thus, the points ( )4 3 3,0+ and ( )4 3 3,0− are
on the x -axis and a distance of 6 units from thepoint ( )4, 3− .
48. Points on the y-axis have an x -coordinate of 0.
Thus, we consider points of the form ( )0, y that
are a distance of 6 units from the point ( )4, 3− .
( ) ( )
( ) ( )
2 2
2 1 2 1
2 2
2 2
2
2
4 0 3
4 9 6
16 9 6
6 25
d x x y y
y
y y
y y
y y
= − + −
= − + − −
= + + +
= + + +
= + +
( )
2
22 2
2
2
2
6 6 25
6 6 25
36 6 25
0 6 11
( 6) (6) 4(1)( 11)
2(1)
6 36 44 6 802 2
6 4 53 2 5
2
x x
x x
x x
x x
x
= + +
= + +
= + +
= + −
− ± − −=
− ± + − ±= =
− ±= = − ±
6 2 5 x = − + or 6 2 5 x = − −
Thus, the points ( )0, 6 2 5− + and ( )0, 6 2 5− −

8/21/2019 PR 9e ISM 01, Graphs
http://slidepdf.com/reader/full/pr-9e-ism-01-graphs 8/65
Chapter 1: Graphs
8
Copyright © 2012 Pearson Education, Inc. Publishing as Prentice Hall
are on the y-axis and a distance of 6 units from the
point ( )4, 3− .
49. ( ) 1 2 1 2, ,
2 2
x x y y M x y
+ + = =
.
( )1 1 1, ( 3, 6)P x y= = − and ( , ) ( 1,4) x y = − , so
1 2
2
2
2
2
31
2
2 3
1
x x x
x
x
x
+=
− +− =
− = − +
=
and 1 2
2
2
2
2
64
2
8 6
2
y y y
y
y
y
+=
+=
= +
=
Thus, 2 (1, 2)P = .
50.
( )
1 2 1 2, ,2 2
x x y y M x y
+ + = =
.
( )2 2 2, (7, 2)P x y= = − and ( , ) (5, 4) x y = − , so
1 2
1
1
1
2
75
2
10 7
3
x x x
x
x
x
+=
+=
= +
=
and 1 2
1
1
1
2
( 2)4
2
8 ( 2)
6
y y y
y
y
y
+=
+ −− =
− = + −
− =
Thus, 1 (3, 6)P = − .
51. The midpoint of AB is:
( )
0 6 0 0
,2 2
3, 0
D
+ +
= =
The midpoint of AC is:
( )
0 4 0 4,
2 2
2, 2
E + +
=
=
The midpoint of BC is:
( )
6 4 0 4,
2 2
5, 2
F + +
=
=
( )2 2
2 2
( , ) 0 4 (3 4)
( 4) ( 1) 16 1 17
d C D = − + −
= − + − = + =
( )2 2
2 2
( , ) 2 6 (2 0)
( 4) 2 16 4
20 2 5
d B E = − + −
= − + = +
= =
2 2
2 2
( , ) (2 0) (5 0)
2 5 4 25
29
d A F = − + −
= + = +
=
52. Let 1 2(0, 0), (0, 4), ( , )P P P x y= = =
( )
( )
( )
2 21 2
2 21
2 2
2 2
2 22
2 2
2 2
, (0 0) (4 0)
16 4
, ( 0) ( 0)
4
16
, ( 0) ( 4)
( 4) 4
( 4) 16
d P P
d P P x y
x y
x y
d P P x y
x y
x y
= − + −
= =
= − + −
= + =
→ + =
= − + −
= + − =
→ + − =
Therefore,
( )22
2 2
4
8 16
8 16
2
y y
y y y
y
y
= −
= − +
=
=
which gives2 2
2
2 16
12
2 3
x
x
x
+ =
=
= ±
Two triangles are possible. The third vertex is
( ) ( )2 3, 2 or 2 3, 2− .
53. Let ( )1 0,0P = , ( )2 0,P s= , ( )3 , 0P s= , and
( )4 ,P s s= . y
x
(0, )s
(0, 0)
( , 0)s
( , )s s
The points 1P and 4P are endpoints of one
diagonal and the points 2P and 3P are the

8/21/2019 PR 9e ISM 01, Graphs
http://slidepdf.com/reader/full/pr-9e-ism-01-graphs 9/65
Section 1.1: The Distance and Midpoint Formulas
9
Copyright © 2012 Pearson Education, Inc. Publishing as Prentice Hall
endpoints of the other diagonal.
1,4
0 0, ,
2 2 2 2
s s s s M
+ + = =
2,3
0 0, ,
2 2 2 2
s s s s M
+ + = =
The midpoints of the diagonals are the same.Therefore, the diagonals of a square intersect attheir midpoints.
54. Let ( )1 0,0P = , ( )2 , 0P a= , and
3
3,
2 2
a aP
=
. To show that these vertices
form an equilateral triangle, we need to showthat the distance between any pair of points is thesame constant value.
( ) ( ) ( )( ) ( )
2 2
1 2 2 1 2 1
2 2 2
,
0 0 0
d P P x x y y
a a a
= − + −
= − + − = =
( ) ( ) ( )2 2
2 3 2 1 2 1
22
2 2 22
,
30
2 2
3 4
4 4 4
d P P x x y y
a aa
a a aa a
= − + −
= − + −
= + = = =
( ) ( ) ( )2 2
1 3 2 1 2 1
22
2 2 22
,
30 0
2 2
3 4
4 4 4
d P P x x y y
a a
a a aa a
= − + −
= − + −
= + = = =
Since all three distances have the same constantvalue, the triangle is an equilateral triangle.Now find the midpoints:
1 2
2 3
1 3
4
5
6
0 0 0, , 0
2 2 2
3
3 30 ,2 2, 4 42 2
30 0
32 2, ,2 2 4 4
P P
P P
P P
a aP M
a a
a aaP M
a a
a aP M
+ + = = =
+ + = = =
+ +
= = =
( )
22
4 5
22
2 2
3 3, 0
4 2 4
3
4 4
3
16 16 2
a a ad P P
a a
aa a
= − + −
= +
= + =
( )
22
4 6
22
2 2
3, 0
4 2 4
3
4 4
3
16 16 2
a a ad P P
a a
aa a
= − + −
= − +
= + =
( )
22
5 6
22
2
3 3 3,
4 4 4 4
02
4 2
a a a ad P P
a
aa
= − + −
= +
= =
Since the sides are the same length, the triangleis equilateral.
55. 2 21 2
2 2
( , ) ( 4 2) (1 1)
( 6) 0
36
6
d P P = − − + −
= − +
=
=
( )2 2
2 3
2 2
( , ) 4 ( 4) ( 3 1)
0 ( 4)
16
4
d P P = − − − + − −
= + −
=
=
2 21 3
2 2
( , ) ( 4 2) ( 3 1)
( 6) ( 4)
36 16
52
2 13
d P P = − − + − −
= − + −
= +
=
=
Since [ ] [ ] [ ]2 22
1 2 2 3 1 3( , ) ( , ) ( , )d P P d P P d P P+ = ,
the triangle is a right triangle.

8/21/2019 PR 9e ISM 01, Graphs
http://slidepdf.com/reader/full/pr-9e-ism-01-graphs 10/65
Chapter 1: Graphs
10
Copyright © 2012 Pearson Education, Inc. Publishing as Prentice Hall
56. ( )2 2
1 2
2 2
( , ) 6 ( 1) (2 4)
7 ( 2)
49 4
53
d P P = − − + −
= + −
= +
=
( )2 2
2 3
2 2
( , ) 4 6 ( 5 2)
( 2) ( 7)
4 49
53
d P P = − + − −
= − + −
= +
=
( )2 2
1 3
2 2
( , ) 4 ( 1) ( 5 4)
5 ( 9)
25 81
106
d P P = − − + − −
= + −
= +
=
Since [ ] [ ] [ ]2 22
1 2 2 3 1 3( , ) ( , ) ( , )d P P d P P d P P+ = ,
the triangle is a right triangle.
Since ( ) ( )1 2 2 3, ,d P P d P P= , the triangle is
isosceles.
Therefore, the triangle is an isosceles righttriangle.
57. ( ) ( )2 2
1 2
2 2
( , ) 0 ( 2) 7 ( 1)
2 8 4 64 68
2 17
d P P = − − + − −
= + = + =
=
( )2 2
2 3
2 2
( , ) 3 0 (2 7)
3 ( 5) 9 25
34
d P P = − + −
= + − = +
=
( ) ( )2 2
1 3
2 2
( , ) 3 ( 2) 2 ( 1)
5 3 25 9
34
d P P = − − + − −
= + = +
=
Since 2 3 1 3( , ) ( , )d P P d P P= , the triangle is
isosceles.
Since [ ] [ ] [ ]2 2 2
1 3 2 3 1 2( , ) ( , ) ( , )d P P d P P d P P+ = ,
the triangle is also a right triangle.
Therefore, the triangle is an isosceles righttriangle.
58. ( ) ( )2 2
1 2
2 2
( , ) 4 7 0 2
( 11) ( 2)
121 4 125
5 5
d P P = − − + −
= − + −
= + =
=
( )2 2
2 3
2 2
( , ) 4 ( 4) (6 0)
8 6 64 36
100
10
d P P = − − + −
= + = +
=
=
( ) ( )2 2
1 3
2 2
( , ) 4 7 6 2
( 3) 4 9 16
25
5
d P P = − + −
= − + = +
=
=
Since [ ] [ ] [ ]2 2 2
1 3 2 3 1 2( , ) ( , ) ( , )d P P d P P d P P+ = ,
the triangle is a right triangle.
59. Using the Pythagorean Theorem:2 2 2
2
2
90 90
8100 8100
16200
16200 90 2 127.28 feet
d
d
d
d
+ =
+ =
=
= = ≈
90
9090
90
d
60. Using the Pythagorean Theorem:2 2 2
2 2
60 60
3600 3600 7200
7200 60 2 84.85 feet
d
d d
d
+ =
+ = → =
= = ≈
60
6060
60
d
61. a. First: (90, 0), Second: (90, 90),Third: (0, 90)
8/21/2019 PR 9e ISM 01, Graphs
http://slidepdf.com/reader/full/pr-9e-ism-01-graphs 11/65
Section 1.1: The Distance and Midpoint Formulas
11
Copyright © 2012 Pearson Education, Inc. Publishing as Prentice Hall
(0,0)
(0,90)
(90,0)
(90,90)
X
Y
b. Using the distance formula:
2 2
2 2
(310 90) (15 90)
220 ( 75) 54025
5 2161 232.43 feet
d = − + −
= + − =
= ≈
c. Using the distance formula:
2 2
2 2
(300 0) (300 90)
300 210 134100
30 149 366.20 feet
d = − + −
= + =
= ≈
62. a. First: (60, 0), Second: (60, 60)Third: (0, 60)
(0,0)
(0,60)
(60,0)
(60,60)
x
y
b. Using the distance formula:
2 2
2 2
(180 60) (20 60)
120 ( 40) 16000
40 10 126.49 feet
d = − + −
= + − =
= ≈
c. Using the distance formula:
2 2
2 2
(220 0) (220 60)
220 160 74000
20 185 272.03 feet
d = − + −
= + =
= ≈
63. The Neon heading east moves a distance 30t
after t hours. The truck heading south moves a
distance 40t after t hours. Their distance apart
after t hours is:
2 2
2 2
2
(30 ) (40 )
900 1600
2500
50 miles
d t t
t t
t
t
= +
= +
=
=
d40t
30t
64.15 miles 5280 ft 1 hr
22 ft/sec
1 hr 1 mile 3600 sec
⋅ ⋅ =
( )22
2
100 22
10000 484 feet
d t
t
= +
= +
100
22t
d
65. a. The shortest side is between 1 (2.6,1.5)P =
and 2 (2.7,1.7)P = . The estimate for the
desired intersection point is:
( )
1 2 1 2 2.6 2.7 1.5 1.7, ,
2 2 2 2
5.3 3.2,
2 2
2.65,1.6
x x y y+ + + + =
=
=
b. Using the distance formula:
2 2
2 2
(2.65 1.4) (1.6 1.3)
(1.25) (0.3)
1.5625 0.09
1.6525
1.285 units
d = − + −
= +
= +
=
≈
66. Let 1 (2002, 204)P = and 2 (2008, 375)P = . The
midpoint is:

8/21/2019 PR 9e ISM 01, Graphs
http://slidepdf.com/reader/full/pr-9e-ism-01-graphs 12/65
Chapter 1: Graphs
12
Copyright © 2012 Pearson Education, Inc. Publishing as Prentice Hall
( )
( )
1 2 1 2, ,2 2
2002 2008 204 375,
2 2
4010 579,
2 2
2005, 289.5
x x y y x y
+ + =
+ + =
=
=
The estimate for 2005 is $289.5 billion. Theestimate net sales of Wal-Mart Stores, Inc. in2005 is $7.5 billion off from the reported valueof $282 billion.
67. For 1998 we have the ordered pair
( )1998,16530 and for 2008 we have the ordered
pair ( )2008,21834 . The midpoint is
( )
( )
1998 2008 16530 21834year, $ ,
2 2
4006 38364,
2 2
2003,19182
+ + =
=
=
Using the midpoint, we estimate the povertylevel in 2003 to be $19,182. This is slightlyhigher than the actual value.
68. Answers will vary.
Section 1.2
1. ( )
( )
2 3 1 7
2 3 6
3 3
6
x
x
x
x
+ − = −
+ = −
+ = −
= −
The solution set is { }6− .
2. 2
2
9 0
9
9
3
x
x
x
x
− =
=
= ±
= ±
The solution set is { }3,3− .
3. intercepts
4. 0 y =
5. y-axis
6. 4
7. ( )3,4−
8. True
9. False; the y-coordinate of a point at which thegraph crosses or touches the x -axis is always 0.The x -coordinate of such a point is an x -intercept.
10. False; a graph can be symmetric with respect toboth coordinate axes (in such cases it will also besymmetric with respect to the origin).
For example: 2 2 1 x y+ =
11. 4 y x x = −
40 0 0
0 0
= −
=
41 1 1
1 0
= −
≠
40 ( 1) 1
0 1 1
= − − −
≠ − −
The point (0, 0) is on the graph of the equation.
12. 3 2 y x x = −
30 0 2 0
0 0
= −
=
31 1 2 1
1 1
= −
≠ −
31 1 2 1
1 1
− = −
− = −
The points (0, 0) and (1, –1) are on the graph ofthe equation.
13.2 2
9 y x = + 2 23 0 9
9 9
= +
=
2 20 3 9
0 18
= +
≠
2 20 ( 3) 9
0 18
= − +
≠
The point (0, 3) is on the graph of the equation.
14. 3 1 y x = +
32 1 1
8 2
= +
≠
31 0 1
1 1
= +
=
30 1 1
0 0
= − +
=
The points (0, 1) and (–1, 0) are on the graph ofthe equation.
15. 2 2 4 x y+ =
2 20 2 4
4 4
+ =
=
2 2( 2) 2 4
8 4
− + =
≠ ( ) ( )
2 2
2 2 4
4 4
+ =
=
( )(0, 2) and 2, 2 are on the graph of the
equation.

8/21/2019 PR 9e ISM 01, Graphs
http://slidepdf.com/reader/full/pr-9e-ism-01-graphs 13/65
Section 1.2: Graphs of Equations in Two Variables; Intercepts; Symmetry
13
Copyright © 2012 Pearson Education, Inc. Publishing as Prentice Hall
16. 2 24 4 x y+ =
2 20 4 1 4
4 4
+ ⋅ =
=
2 22 4 0 4
4 4
+ ⋅ =
= ( )
22 12
2 4 4
5 4
+ =
≠
The points (0, 1) and (2, 0) are on the graph ofthe equation.
17. 2 y x = +
x -intercept: y-intercept:0 2
2
x
x
= +
− =
0 2
2
y
y
= +
=
The intercepts are ( )2,0− and ( )0, 2 .
18. 6 y x = −
x-intercept: y-intercept:0 6
6
x
x
= −
=
0 6
6
y
y
= −
= −
The intercepts are( )6,0 and
( )0, 6− .
19. 2 8 y x = + x-intercept: y-intercept:
0 2 8
2 8
4
x
x
x
= +
= −
= −
( )2 0 8
8
y
y
= +
=
The intercepts are ( )4,0− and ( )0, 8 .
20. 3 9 y x = −
x-intercept: y-intercept:
0 3 9
3 9
3
x
x
x
= −
=
=
( )3 0 9
9
y
y
= −
= −
The intercepts are ( )3,0 and ( )0, 9− .
21. 2 1 y x = −
x-intercepts: y-intercept:2
2
0 1
1
1
x
x
x
= −
=
= ±
20 1
1
y
y
= −
= −
The intercepts are ( )1,0− , ( )1,0 , and ( )0, 1− .

8/21/2019 PR 9e ISM 01, Graphs
http://slidepdf.com/reader/full/pr-9e-ism-01-graphs 14/65
Chapter 1: Graphs
14
Copyright © 2012 Pearson Education, Inc. Publishing as Prentice Hall
22. 2 9 y x = −
x-intercepts: y-intercept:2
2
0 9
9
3
x
x
x
= −
=
= ±
20 9
9
y
y
= −
= −
The intercepts are ( )3,0− , ( )3,0 , and ( )0, 9− .
23. 2 4 y x = − +
x-intercepts: y-intercepts:2
2
0 4
4
2
x
x
x
= − +
=
= ±
( )2
0 4
4
y
y
= − +
=
The intercepts are ( )2,0− , ( )2,0 , and ( )0,4 .
24. 2 1 y x = − +
x-intercepts: y-intercept:2
2
0 1
1
1
x
x
x
= − +
=
= ±
( )2
0 1
1
y
y
= − +
=
The intercepts are ( )1,0− , ( )1,0 , and ( )0,1 .
25. 2 3 6 x y+ =
x-intercepts: y-intercept:
( )2 3 0 6
2 6
3
x
x
x
+ =
=
=
( )2 0 3 6
3 6
2
y
y
y
+ =
=
=
The intercepts are ( )3,0 and ( )0,2 .
26. 5 2 10 x y+ =
x-intercepts: y-intercept:
( )5 2 0 10
5 10
2
x
x
x
+ =
=
=
( )5 0 2 10
2 10
5
y
y
y
+ =
=
=
The intercepts are ( )2,0 and ( )0, 5 .
8/21/2019 PR 9e ISM 01, Graphs
http://slidepdf.com/reader/full/pr-9e-ism-01-graphs 15/65
Section 1.2: Graphs of Equations in Two Variables; Intercepts; Symmetry
15
Copyright © 2012 Pearson Education, Inc. Publishing as Prentice Hall
27. 29 4 36 x y+ =
x-intercepts: y-intercept:
( )2
2
2
9 4 0 36
9 36
4
2
x
x
x
x
+ =
=
=
= ±
( )2
9 0 4 36
4 36
9
y
y
y
+ =
=
=
The intercepts are ( )2,0− , ( )2,0 , and ( )0,9 .
28. 24 4 x y+ =
x-intercepts: y-intercept:2
2
2
4 0 4
4 4
1
1
x
x
x
x
+ =
=
=
= ±
( )2
4 0 4
4
y
y
+ =
=
The intercepts are ( )1,0− , ( )1,0 , and ( )0,4 .
29.
30.
31.
32.
33.
5
−5
y
5−5
(a) = (5, 2)
(b) = ( 5, 2)− −
(c) = ( 5, 2)−
(5, −2)
34.
8/21/2019 PR 9e ISM 01, Graphs
http://slidepdf.com/reader/full/pr-9e-ism-01-graphs 16/65
Chapter 1: Graphs
16
Copyright © 2012 Pearson Education, Inc. Publishing as Prentice Hall
35.
36.
37.
38.
39. a. Intercepts: ( )1,0− and ( )1,0
b. Symmetric with respect to the x-axis, y-axis,and the origin.
40. a. Intercepts: ( )0,1
b. Not symmetric to the x-axis, the y-axis, northe origin
41. a. Intercepts: ( )20,π − , ( )0,1 , and ( )2
, 0π
b. Symmetric with respect to the y-axis.
42. a. Intercepts: ( )2,0− , ( )0, 3− , and ( )2,0
b. Symmetric with respect to the y-axis.
43. a. Intercepts: ( )0,0
b. Symmetric with respect to the x-axis.
44. a. Intercepts: ( )2,0 ,− ( )0, 2 , ( )0, 2 ,− and ( )2,0
b. Symmetric with respect to the x-axis, y-axis,and the origin.
45. a. Intercepts: ( )2,0− , ( )0,0 , and ( )2,0
b. Symmetric with respect to the origin.
46. a. Intercepts: ( )4,0− , ( )0,0 , and ( )4,0
b. Symmetric with respect to the origin.
47. a. x-intercept: [ ]2,1− , y-intercept 0
b. Not symmetric to x-axis, y-axis, or origin.
48. a. x-intercept: [ ]1,2− , y-intercept 0
b. Not symmetric to x-axis, y-axis, or origin.
49. a. Intercepts: none
b. Symmetric with respect to the origin.
50. a. Intercepts: none
b. Symmetric with respect to the x -axis.
51.

8/21/2019 PR 9e ISM 01, Graphs
http://slidepdf.com/reader/full/pr-9e-ism-01-graphs 17/65
Section 1.2: Graphs of Equations in Two Variables; Intercepts; Symmetry
17
Copyright © 2012 Pearson Education, Inc. Publishing as Prentice Hall
52.
53.
54.
55. 2 4 y x = +
x-intercepts: y-intercepts:20 4
4
x
x
= +
− =
2
2
0 4
4
2
y
y
y
= +
=
= ±
The intercepts are ( )4,0− , ( )0, 2− and ( )0, 2 .
Test x-axis symmetry: Let y y= −
( )2
2
4
4 same
y x
y x
− = +
= +
Test y-axis symmetry: Let x x = − 2 4 y x = − + different
Test origin symmetry: Let x x = − and y y= − .( )
2
2
4
4 different
y x
y x
− = − +
= − +
Therefore, the graph will have x-axis symmetry.
56. 2 9 y x = +
x-intercepts: y-intercepts:
2(0) 9
0 9
9
x
x
x
= − +
= − +
=
2
2
0 9
9
3
y
y
y
= +
=
= ±
The intercepts are ( )9,0− , ( )0, 3− and ( )0, 3 .
Test x-axis symmetry: Let y y= −
( )2
2
9
9 same
y x
y x
− = +
= +
Test y-axis symmetry: Let x x = − 2 9 y x = − + different
Test origin symmetry: Let x x = − and y y= − .
( )2
2
9
9 different
y x
y x
− = − +
= − +
Therefore, the graph will have x-axis symmetry.
57. 3 y x =
x-intercepts: y-intercepts:30
0
x
x
=
=
3 0 0 y = =
The only intercept is ( )0, 0 .
Test x-axis symmetry: Let y y= −
3 different y x − =
Test y-axis symmetry: Let x x = − 3 3 different y x x = − = −
Test origin symmetry: Let x x = − and y y= − 3 3
3 same
y x x
y x
− = − = −
=
Therefore, the graph will have origin symmetry.
58. 5 y x =
x-intercepts: y-intercepts:30
0
x
x
=
=
5 0 0 y = =
The only intercept is ( )0,0 .
Test x-axis symmetry: Let y y= − 5 different y x − =
Test y-axis symmetry: Let x x = − 5 5 different y x x = − = −

8/21/2019 PR 9e ISM 01, Graphs
http://slidepdf.com/reader/full/pr-9e-ism-01-graphs 18/65
Chapter 1: Graphs
18
Copyright © 2012 Pearson Education, Inc. Publishing as Prentice Hall
Test origin symmetry: Let x x = − and y y= −
5 5
5 same
y x x
y x
− = − = −
=
Therefore, the graph will have origin symmetry.
59. 2 9 0 x y+ − =
x-intercepts: y-intercepts:2
2
9 0
9
3
x
x
x
− =
=
= ±
20 9 0
9
y
y
+ − =
=
The intercepts are ( )3,0− , ( )3,0 , and ( )0, 9 .
Test x-axis symmetry: Let y y= −
2 9 0 different x y− − =
Test y-axis symmetry: Let x x = −
( )2
2
9 0
9 0 same
x y
x y
− + − =
+ − =
Test origin symmetry: Let x x = − and y y= −
( )2
2
9 0
9 0 different
x y
x y
− − − =
− − =
Therefore, the graph will have y-axis symmetry.
60. 2 4 0 x y− − =
x-intercepts: y-intercept:2
20 4 04
2
x x
x
− − ==
= ±
2
0 4 04
4
y y
y
− − =− =
= −
The intercepts are ( )2,0− , ( )2,0 , and ( )0, 4− .
Test x-axis symmetry: Let y y= −
( )2
2
4 0
4 0 different
x y
x y
− − − =
+ − =
Test y-axis symmetry: Let x x = −
( )2
2
4 0
4 0 same
x y
x y
− − − =
− − =
Test origin symmetry: Let x x = − and y y= − ( ) ( )
2
2
4 0
4 0 different
x y
x y
− − − − =
+ − =
Therefore, the graph will have y-axis symmetry.
61. 2 29 4 36 x y+ =
x-intercepts: y-intercepts:
( )22
2
2
9 4 0 36
9 36
4
2
x
x
x
x
+ =
=
=
= ±
( )2 2
2
2
9 0 4 36
4 36
9
3
y
y
y
y
+ =
=
=
= ±
The intercepts are ( )2,0− , ( )2,0 , ( )0, 3 ,− and
( )0,3 .
Test x-axis symmetry: Let y y= −
( )22
2 2
9 4 36
9 4 36 same
x y
x y
+ − =
+ =
Test y-axis symmetry: Let x x = −
( )2 2
2 2
9 4 36
9 4 36 same
x y
x y
− + =
+ =
Test origin symmetry: Let x x = − and y y= −
( ) ( )2 2
2 2
9 4 36
9 4 36 same
x y
x y
− + − =
+ =
Therefore, the graph will have x-axis, y-axis, andorigin symmetry.
62. 2 24 4 x y+ =
x-intercepts: y-intercepts:2 2
2
2
4 0 4
4 4
1
1
x
x
x
x
+ =
=
=
= ±
( )2 2
2
4 0 4
4
2
y
y
y
+ =
=
= ±
The intercepts are ( )1,0− , ( )1,0 , ( )0, 2− , and
( )0, 2 .
Test x-axis symmetry: Let y y= −
( )22
2 2
4 4
4 4 same
x y
x y
+ − =
+ =
Test y-axis symmetry: Let x x = −
( )2 2
2 2
4 4
4 4 same
x y
x y
− + =
+ =
Test origin symmetry: Let x x = − and y y= − ( ) ( )
2 2
2 2
4 4
4 4 same
x y
x y
− + − =
+ =
Therefore, the graph will have x-axis, y-axis, andorigin symmetry.
63. 3 27 y x = −
x-intercepts: y-intercepts:

8/21/2019 PR 9e ISM 01, Graphs
http://slidepdf.com/reader/full/pr-9e-ism-01-graphs 19/65
Section 1.2: Graphs of Equations in Two Variables; Intercepts; Symmetry
19
Copyright © 2012 Pearson Education, Inc. Publishing as Prentice Hall
3
3
0 27
27
3
x
x
x
= −
=
=
30 27
27
y
y
= −
= −
The intercepts are ( )3,0 and ( )0, 27− .
Test x-axis symmetry: Let y y= −
3 27 different y x − = −
Test y-axis symmetry: Let x x = −
( )3
3
27
27 different
y x
y x
= − −
= − −
Test origin symmetry: Let x x = − and y y= −
( )3
3
27
27 different
y x
y x
− = − −
= +
Therefore, the graph has none of the indicatedsymmetries.
64. 4 1 y x = −
x-intercepts: y-intercepts:4
4
0 1
1
1
x
x
x
= −
=
= ±
40 1
1
y
y
= −
= −
The intercepts are ( )1,0− , ( )1,0 , and ( )0, 1− .
Test x-axis symmetry: Let y y= −
4 1 different y x − = −
Test y-axis symmetry: Let x x = −
( )4
4
1
1 same
y x
y x
= − −
= −
Test origin symmetry: Let x x = − and y y= −
( )4
4
1
1 different
y x
y x
− = − −
− = −
Therefore, the graph will have y-axis symmetry.
65. 2 3 4 y x x = − −
x-intercepts: y-intercepts:
( )( )
20 3 4
0 4 1
4 or 1
x x
x x
x x
= − −
= − +
= = −
( )20 3 0 4
4
y
y
= − −
= −
The intercepts are ( )4, 0 , ( )1,0− , and ( )0, 4− .
Test x-axis symmetry: Let y y= −
2 3 4 different y x x − = − −
Test y-axis symmetry: Let x x = −
( ) ( )2
2
3 4
3 4 different
y x x
y x x
= − − − −
= + −
Test origin symmetry: Let x x = − and y y= −
( ) ( )2
2
3 4
3 4 different
y x x
y x x
− = − − − −
− = + −
Therefore, the graph has none of the indicatedsymmetries.
66.2 4 y x = +
x-intercepts: y-intercepts:2
2
0 4
4
no real solution
x
x
= +
= −
20 4
4
y
y
= +
=
The only intercept is ( )0, 4 .
Test x-axis symmetry: Let y y= −
2 4 different y x − = +
Test y-axis symmetry: Let x x = −
( )2
2
4
4 same
y x
y x
= − +
= +
Test origin symmetry: Let x x = − and y y= −
( )2
2
4
4 different
y x
y x
− = − +
− = +
Therefore, the graph will have y-axis symmetry.
67.2
3
9
x y
x =
+
x-intercepts: y-intercepts:
2
30
9
3 0
0
x
x
x
x
=+
=
=
( )
2
3 0 00
90 9 y = = =
+
The only intercept is ( )0, 0 .
Test x-axis symmetry: Let y y= −
2
3 different
9
x y
x − =
+
Test y-axis symmetry: Let x x = −
( )
( )2
2
3
9
3 different
9
x y
x
x y
x
−=
− +
= −+
8/21/2019 PR 9e ISM 01, Graphs
http://slidepdf.com/reader/full/pr-9e-ism-01-graphs 20/65
Chapter 1: Graphs
20
Copyright © 2012 Pearson Education, Inc. Publishing as Prentice Hall
Test origin symmetry: Let x x = − and y y= −
( )
( )2
2
2
3
9
3
9
3 same
9
x y
x
x
y x
x y
x
−− =
− +
− = − +
=+
Therefore, the graph has origin symmetry.
68.2 4
2
x y
x
−=
x-intercepts: y-intercepts:2
2
2
40
2
4 0
4
2
x
x
x
x
x
−=
− =
=
= ±
( )
20 4 4
2 0 0
undefined
y − −
= =
The intercepts are ( )2,0− and ( )2, 0 .
Test x-axis symmetry: Let y y= −
2 4 different
2
x y
x
−− =
Test y-axis symmetry: Let x x = −
( )
( )
2
2
4
2
4 different2
x y
x
x y x
− −=
−
−= −
Test origin symmetry: Let x x = − and y y= −
( )
( )
2
2
2
4
2
4
2
4 same
2
x y
x
x y
x
x y
x
− −− =
−
−− =
−
−=
Therefore, the graph has origin symmetry.
69.3
2 9
x y
x
−=
−
x-intercepts: y-intercepts:
3
2
3
09
0
0
x
x
x
x
−=
−
− =
=
3
2
0 00
90 9 y
−= = =
−−
The only intercept is ( )0, 0 .
Test x-axis symmetry: Let y y= −
3
2
3
2
9
different9
x y
x
x y
x
−− =
−
=−
Test y-axis symmetry: Let x x = −
( )
( )
3
2
3
2
9
different9
x y
x
x y x
− −=
− −
=−
Test origin symmetry: Let x x = − and y y= −
( )
( )
3
2
3
2
3
2
9
9
same9
x y
x
x y
x
x y
x
− −− =
− −
− =−
−=
−
Therefore, the graph has origin symmetry.
70.4
5
1
2
x y
x
+=
x-intercepts: y-intercepts:
4
5
4
10
2
1
x
x
x
+=
= −
( )
4
5
0 1 1
02 0
undefined
y +
= =
no real solution
There are no intercepts for the graph of thisequation.
Test x-axis symmetry: Let y y= −
4
5
1 different
2
x y
x
+− =

8/21/2019 PR 9e ISM 01, Graphs
http://slidepdf.com/reader/full/pr-9e-ism-01-graphs 21/65
Section 1.2: Graphs of Equations in Two Variables; Intercepts; Symmetry
21
Copyright © 2012 Pearson Education, Inc. Publishing as Prentice Hall
Test y-axis symmetry: Let x x = −
( )
( )
4
5
4
5
1
2
1 different2
x y
x
x y x
− +=
−
+=−
Test origin symmetry: Let x x = − and y y= −
( )
( )
4
5
4
5
4
5
1
2
1
2
1 same
2
x y
x
x y
x
x y
x
− +− =
−
+− =
−
+=
Therefore, the graph has origin symmetry.
71. 3 y x =
72. 2 x y=
73. y x =
74. 1
y x
=
75. If the point ( )3,b is on the graph of 4 1 y x = + ,
then we have ( )4 3 1 12 1 13b = + = + =
Thus, 13b = .
76. If the point ( )2,b− is on the graph of
2 3 2 x y+ = , then we have
( ) ( )2 2 3 2
4 3 2
3 6
2
b
b
b
b
− + =
− + =
=
=
Thus, 2b = .
77. If the point ( ), 4a is on the graph of
2 3 y x x = + , then we have
( )( )
2
2
4 3
0 3 4
0 4 1
a a
a a
a a
= +
= + −
= + −
4 0
4
a
a
+ =
= −
or 1 0
1
a
a
− =
=
Thus, 4a = − or 1a = .
8/21/2019 PR 9e ISM 01, Graphs
http://slidepdf.com/reader/full/pr-9e-ism-01-graphs 22/65
Chapter 1: Graphs
22
Copyright © 2012 Pearson Education, Inc. Publishing as Prentice Hall
78. If the point ( ), 5a − is on the graph of
2 6 y x x = + , then we have
( )( )
2
2
5 6
0 6 50 5 1
a a
a aa a
− = +
= + += + +
5 0
5
a
a
+ =
= −
or 1 0
1
a
a
+ =
= −
Thus, 5a = − or 1a = − .
79. For a graph with origin symmetry, if the point
( ),a b is on the graph, then so is the point
( ),a b− − . Since the point ( )1,2 is on the graph
of an equation with origin symmetry, the point
( )1, 2− − must also be on the graph.
80. For a graph with y-axis symmetry, if the point
( ),a b is on the graph, then so is the point
( ),a b− . Since 6 is an x-intercept in this case, the
point ( )6,0 is on the graph of the equation. Due
to the y-axis symmetry, the point ( )6,0− must
also be on the graph. Therefore, 6− is another x -
intercept.
81. For a graph with origin symmetry, if the point
( ),a b is on the graph, then so is the point
( ),a b− − . Since 4− is an x-intercept in this case,
the point ( )4,0− is on the graph of the equation.
Due to the origin symmetry, the point ( )4,0
must also be on the graph. Therefore, 4 isanother x -intercept.
82. For a graph with x -axis symmetry, if the point
( ),a b is on the graph, then so is the point
( ),a b− . Since 2 is a y-intercept in this case, the
point ( )0,2 is on the graph of the equation. Due
to the x -axis symmetry, the point
( )0, 2− must
also be on the graph. Therefore, 2− is another y-intercept.
83. a. ( )2
2 2 2 2 x y x x y+ − = +
x-intercepts:
( )( ) ( )
( )
( )
22 22 2
22 2
4 3 2 2
4 3
3
0 0
22 0
2 0
x x x
x x x
x x x x x x
x x
+ − = +
− =
− + =− =
− =
3 0 or 2 0
0 2
x x
x x
= − =
= =
y-intercepts:
( )( ) ( )
( )
( )
22 22 2
22 2
4 2
4 2
2 2
0 0 0
0
1 0
y y
y y
y y
y y
y y
+ − = +
=
=
− =
− =
2 2
2
0 or 1 0
0 1
1
y y
y y
y
= − =
= =
= ±
The intercepts are ( )0, 0 , ( )2, 0 , ( )0, 1 ,−
and ( )0,1 .
b. Test x-axis symmetry: Let y y= −
( )( ) ( )
( )
2
2 22 2
22 2 2 2 same
x y x x y
x y x x y
+ − − = + −
+ − = +
Test y-axis symmetry: Let x x = −
( ) ( )( ) ( )
( )
22 22 2
22 2 2 2 different
x y x x y
x y x x y
− + − − = − +
+ + = +
Test origin symmetry: Let x x = − and y y= −
( ) ( ) ( )( ) ( ) ( )
( )
22 2 2 2
22 2 2 2 different
x y x x y
x y x x y
− + − − − = − + −
+ + = +
Thus, the graph will have x-axis symmetry.
8/21/2019 PR 9e ISM 01, Graphs
http://slidepdf.com/reader/full/pr-9e-ism-01-graphs 23/65
Section 1.2: Graphs of Equations in Two Variables; Intercepts; Symmetry
23
Copyright © 2012 Pearson Education, Inc. Publishing as Prentice Hall
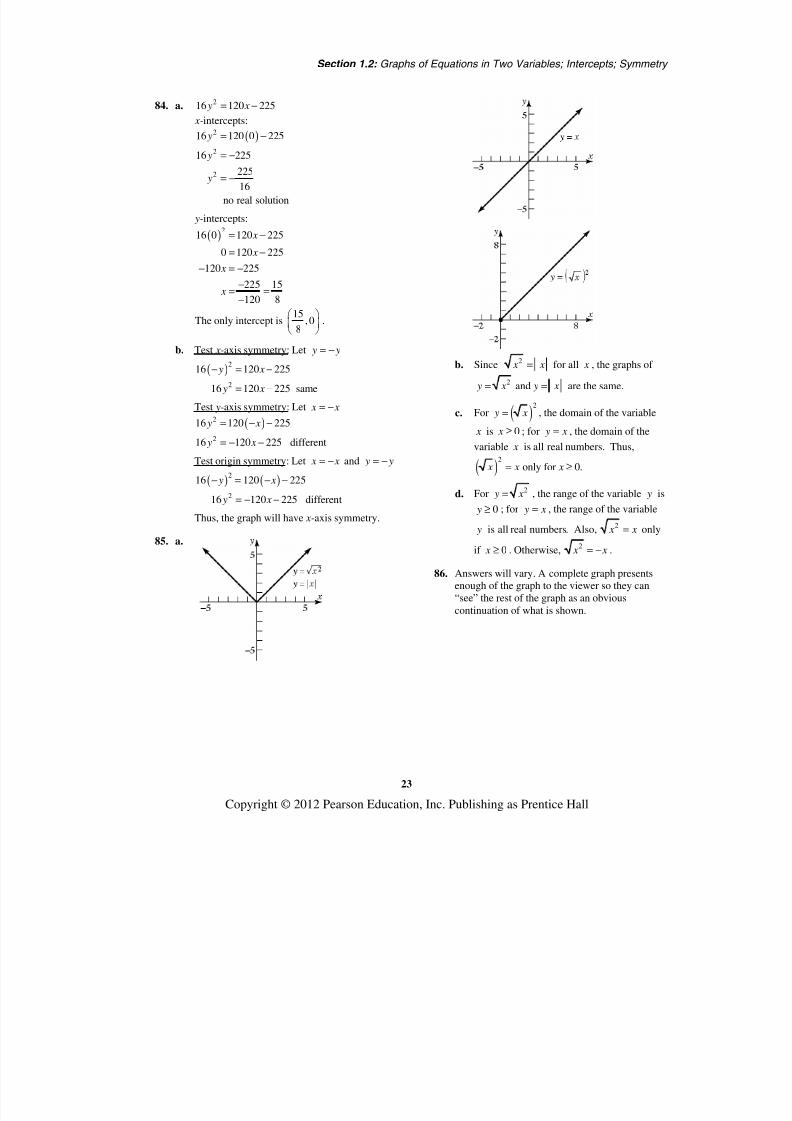
84. a. 216 120 225 y x = −
x-intercepts:
( )2
2
2
16 120 0 225
16 225
225
16
no real solution
y
y
y
= −
= −
= −
y-intercepts:
( )2
16 0 120 225
0 120 225
120 225
225 15
120 8
x
x
x
x
= −
= −
− = −
−= =
−
The only intercept is15
,08
.
b. Test x-axis symmetry: Let y y= −
( )2
2
16 120 225
16 120 225 same
y x
y x
− = −
= −
Test y-axis symmetry: Let x x = −
( )2
2
16 120 225
16 120 225 different
y x
y x
= − −
= − −
Test origin symmetry: Let x x = − and y y= −
( ) ( )2
2
16 120 225
16 120 225 different
y x
y x
− = − −
= − −
Thus, the graph will have x-axis symmetry.
85. a.
b. Since 2 x x = for all x , the graphs of
2 and y x y x = = are the same.
c. For ( )2
y x = , the domain of the variable
x is 0 x ≥ ; for y x = , the domain of the
variable x is all real numbers. Thus,
( )2
only for 0. x x x = ≥
d. For 2 y x = , the range of the variable y is
0 y ≥ ; for y x = , the range of the variable
y is all real numbers. Also, 2 x x = only
if 0 x ≥ . Otherwise,2
x x = − .
86. Answers will vary. A complete graph presentsenough of the graph to the viewer so they can“see” the rest of the graph as an obviouscontinuation of what is shown.

8/21/2019 PR 9e ISM 01, Graphs
http://slidepdf.com/reader/full/pr-9e-ism-01-graphs 24/65
Chapter 1: Graphs
24
Copyright © 2012 Pearson Education, Inc. Publishing as Prentice Hall
87. Answers will vary. One example: y
x
88. Answers will vary
89. Answers will vary
90. Answers will vary.Case 1: Graph has x -axis and y-axis symmetry,show origin symmetry.
( ) ( ), on graph , on graph
(from -axis symmetry)
x y x y
x
→ −
( ) ( )
( )
, on graph , on graph
from -axis symmetry
x y x y
y
− → − −
Since the point ( ), x y− − is also on the graph, the
graph has origin symmetry.
Case 2: Graph has x -axis and origin symmetry,show y-axis symmetry.
( ) ( )
( )
, on graph , on graph
from -axis symmetry
x y x y
x
→ −
( ) ( )
( )
, on graph , on graph
from origin symmetry
x y x y− → −
Since the point ( ), x y− is also on the graph, the
graph has y-axis symmetry.
Case 3: Graph has y-axis and origin symmetry,show x-axis symmetry.
( ) ( )
( )
, on graph , on graph
from -axis symmetry
x y x y
y
→ −
( ) ( )
( )
, on graph , on graph
from origin symmetry
x y x y− → −
Since the point ( ), x y− is also on the graph, thegraph has x -axis symmetry.
91. Answers may vary. The graph must contain the
points ( )2,5− , ( )1,3− , and ( )0,2 . For the
graph to be symmetric about the y-axis, the graph
must also contain the points ( )2,5 and ( )1,3
(note that (0, 2) is on the y-axis).
For the graph to also be symmetric with respectto the x -axis, the graph must also contain the
points ( )2, 5− − , ( )1, 3− − , ( )0, 2− , ( )2, 5− , and
( )1, 3− . Recall that a graph with two of the
symmetries (x-axis, y-axis, origin) willnecessarily have the third. Therefore, if theoriginal graph with y-axis symmetry also has x-axis symmetry, then it will also have originsymmetry.
92 – 94. Interactive Exercises
Section 1.3
1. undefined; 0
2. 3; 2
x-intercept: 2 3(0) 6
2 6
3
x
x
x
+ =
=
=
y-intercept: 2(0) 3 6
3 6
2
y
y
y
+ =
=
=
3. y b= ; y-intercept
4. True
5. False; the slope is 32
.
2 3 5
3 5
2 2
y x
y x
= +
= +
6. True; ( ) ( )?
?
2 1 2 4
2 2 4
4 4 True
+ =
+ =
=
7. 1 2
m m= ; y-intercepts;1 2
1m m⋅ = −
8. 2
9. 1
2−
10. False; perpendicular lines have slopes that areopposite-reciprocals of each other.

8/21/2019 PR 9e ISM 01, Graphs
http://slidepdf.com/reader/full/pr-9e-ism-01-graphs 25/65
Section 1.3: Lines
25
Copyright © 2012 Pearson Education, Inc. Publishing as Prentice Hall
11. a. 1 0 1
Slope2 0 2
−= =
−
b. If x increases by 2 units, y will increase
by 1 unit.
12. a.1 0 1
Slope2 0 2
−= = −
− −
b. If x increases by 2 units, y will decrease
by 1 unit.
13. a. 1 2 1
Slope1 ( 2) 3
−= = −
− −
b. If x increases by 3 units, y will decrease
by 1 unit.
14. a. 2 1 1Slope2 ( 1) 3
−= =
− −
b. If x increases by 3 units, y will increase
by 1 unit.
15. 2 1
2 1
0 3 3Slope
4 2 2
y y
x x
− −= = = −
− −
16. 2 1
2 1
4 2 2Slope 2
3 4 1
y y
x x
− −= = = = −
− − −
17. 2 1
2 1
1 3 2 1Slope
2 ( 2) 4 2
y y
x x
− − −= = = = −
− − −
18. 2 1
2 1
3 1 2Slope
2 ( 1) 3
y y
x x
− −= = =
− − −
19. 2 1
2 1
1 ( 1) 0Slope 0
2 ( 3) 5
y y
x x
− − − −= = = =
− − −
20. 2 1
2 1
2 2 0Slope 0
5 4 9
y y
x x
− −= = = =
− − − −
8/21/2019 PR 9e ISM 01, Graphs
http://slidepdf.com/reader/full/pr-9e-ism-01-graphs 26/65
Chapter 1: Graphs
26
Copyright © 2012 Pearson Education, Inc. Publishing as Prentice Hall
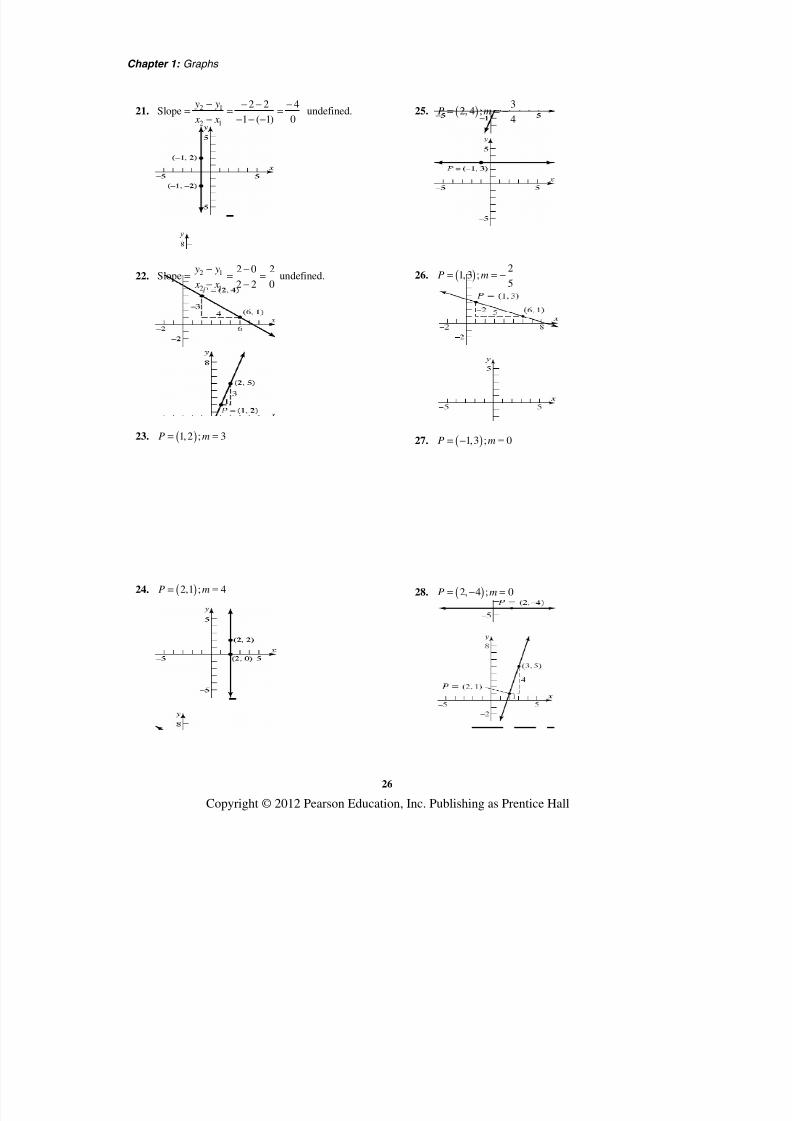
21. 2 1
2 1
2 2 4Slope undefined.
1 ( 1) 0
y y
x x
− − − −= = =
− − − −
22. 2 1
2 1
2 0 2Slope undefined.
2 2 0
y y
x x
− −= = =
− −
23. ( )1,2 ; 3P m= =
24. ( )2,1 ; 4P m= =
25. ( )3
2, 4 ;4
P m= = −
26. ( )2
1, 3 ;5
P m= = −
27. ( )1,3 ; 0P m= − =
28. ( )2, 4 ; 0P m= − =
8/21/2019 PR 9e ISM 01, Graphs
http://slidepdf.com/reader/full/pr-9e-ism-01-graphs 27/65
Section 1.3: Lines
27
Copyright © 2012 Pearson Education, Inc. Publishing as Prentice Hall
29. ( )0,3 ; slope undefinedP =
(note: the line is the y-axis)
30. ( )2,0 ; slope undefinedP = −
31.4
Slope 41
= = ; point: ( )1,2
If x increases by 1 unit, then y increases by 4units.Answers will vary. Three possible points are:
( )
( )
( )
1 1 2 and 2 4 62,6
2 1 3 and 6 4 10
3,10
3 1 4 and 10 4 14
4,14
x y
x y
x y
= + = = + =
= + = = + =
= + = = + =
32.2
Slope 21
= = ; point: ( )2,3−
If x increases by 1 unit, then y increases by 2units.
Answers will vary. Three possible points are:
( )
( )
( )
2 1 1 and 3 2 5
1,5
1 1 0 and 5 2 7
0,7
0 1 1 and 7 2 9
1,9
x y
x y
x y
= − + = − = + =
−
= − + = = + =
= + = = + =
33.3 3
Slope2 2
−= − = ; point: ( )2, 4−
If x increases by 2 units, then y decreases by 3units.Answers will vary. Three possible points are:
( )
( )
( )
2 2 4 and 4 3 7
4, 7
4 2 6 and 7 3 10
6, 10
6 2 8 and 10 3 13
8, 13
x y
x y
x y
= + = = − − = −
−
= + = = − − = −
−
= + = = − − = −
−
34.4
Slope3
= ; point: ( )3,2−
If x increases by 3 units, then y increases by 4units.Answers will vary. Three possible points are:
( )
( )
( )
3 3 0 and 2 4 6
0,6
0 3 3 and 6 4 10
3,10
3 3 6 and 10 4 14
6,14
x y
x y
x y
= − + = = + =
= + = = + =
= + = = + =
35.2
Slope 21
−= − = ; point: ( )2, 3− −
If x increases by 1 unit, then y decreases by 2units.Answers will vary. Three possible points are:
( )
( )
( )
2 1 1 and 3 2 5
1, 5
1 1 0 and 5 2 7
0, 7
0 1 1 and 7 2 9
1, 9
x y
x y
x y
= − + = − = − − = −
− −
= − + = = − − = −
−
= + = = − − = −
−
36.1
Slope 11
−= − = ; point: ( )4,1
If x increases by 1 unit, then y decreases by 1unit.

8/21/2019 PR 9e ISM 01, Graphs
http://slidepdf.com/reader/full/pr-9e-ism-01-graphs 28/65
Chapter 1: Graphs
28
Copyright © 2012 Pearson Education, Inc. Publishing as Prentice Hall
Answers will vary. Three possible points are:
( )
( )
( )
4 1 5 and 1 1 0
5,0
5 1 6 and 0 1 1
6, 1
6 1 7 and 1 1 2
7, 2
x y
x y
x y
= + = = − =
= + = = − = −
−
= + = = − − = −
−
37. (0, 0) and (2, 1) are points on the line.
1 0 1Slope
2 0 2
-intercept is 0; using : y y mx b
−= =
−
= +
10
2
2
0 21
2 0 or2
y x
y x
x y
x y y x
= +
=
= −
− = =
38. (0, 0) and (–2, 1) are points on the line.
1 0 1 1Slope
2 0 2 2
-intercept is 0; using : y y mx b
−= = = −
− − −
= +
10
2
2
2 01
2 0 or2
y x
y x
x y
x y y x
= − +
= −
+ =
+ = = −
39. (–1, 3) and (1, 1) are points on the line.
1 1
1 3 2Slope 1
1 ( 1) 2
Using ( ) y y m x x
− −= = = −
− −
− = −
1 1( 1)
1 1
2
2 or 2
y x
y x
y x
x y y x
− = − −
− = − +
= − +
+ = = − +
40. (–1, 1) and (2, 2) are points on the line.
1 1
2 1 1Slope
2 ( 1) 3
Using ( ) y y m x x
−= =
− −
− = −
( )11 ( 1)3
11 ( 1)
3
1 11
3 3
1 4
3 3
1 43 4 or
3 3
y x
y x
y x
y x
x y y x
− = − −
− = +
− = +
= +
− = − = +
41. 1 1( ), 2 y y m x x m− = − =
3 2( 3)
3 2 6
2 3
2 3 or 2 3
y x
y x
y x
x y y x
− = −
− = −
= −
− = = −
42. 1 1( ), 1 y y m x x m− = − = −
2 1( 1)
2 1
3
3 or 3
y x
y x
y x
x y y x
− = − −
− = − +
= − +
+ = = − +
43. 1 1
1( ),
2 y y m x x m− = − = −
12 ( 1)
2
1 12
2 2
1 5
2 2
1 52 5 or
2 2
y x
y x
y x
x y y x
− = − −
− = − +
= − +
+ = = − +
44.1 1
( ), 1 y y m x x m− = − =
1 1( ( 1))
1 1
2
2 or 2
y x
y x
y x
x y y x
− = − −
− = +
= +
− = − = +

8/21/2019 PR 9e ISM 01, Graphs
http://slidepdf.com/reader/full/pr-9e-ism-01-graphs 29/65
Section 1.3: Lines
29
Copyright © 2012 Pearson Education, Inc. Publishing as Prentice Hall
45. Slope = 3; containing (–2, 3)
1 1( )
3 3( ( 2))
3 3 6
3 93 9 or 3 9
y y m x x
y x
y x
y x
x y y x
− = −
− = − −
− = +
= +
− = − = +
46. Slope = 2; containing the point (4, –3)
1 1( )
( 3) 2( 4)
3 2 8
2 11
2 11 or 2 11
y y m x x
y x
y x
y x
x y y x
− = −
− − = −
+ = −
= −
− = = −
47. Slope =2
3
− ; containing (1, –1)
1 1( )
2( 1) ( 1)
3
2 21
3 3
2 1
3 3
2 12 3 1 or
3 3
y y m x x
y x
y x
y x
x y y x
− = −
− − = − −
+ = − +
= − −
+ = − = − −
48. Slope =1
2 ; containing the point (3, 1)
1 1( )
11 ( 3)
2
1 31
2 2
1 1
2 2
1 12 1 or
2 2
y y m x x
y x
y x
y x
x y y x
− = −
− = −
− = −
= −
− = = −
49. Containing (1, 3) and (–1, 2)
2 3 1 1
1 1 2 2m
− −= = =
− − −
1 1( )
13 ( 1)2
1 13
2 2
1 5
2 2
1 52 5 or
2 2
y y m x x
y x
y x
y x
x y y x
− = −
− = −
− = −
= +
− = − = +
50. Containing the points (–3, 4) and (2, 5)
5 4 1
2 ( 3) 5m
−= =
− −
1 1( )
15 ( 2)
5
1 25
5 5
1 23
5 5
1 235 23 or
5 5
y y m x x
y x
y x
y x
x y y x
− = −
− = −
− = −
= +
− = − = +
51. Slope = –3; y-intercept =3
3 3
3 3 or 3 3
y mx b y x
x y y x
= += − +
+ = = − +
52. Slope = –2; y-intercept = –2
2 ( 2)
2 2 or 2 2
y mx b
y x
x y y x
= +
= − + −
+ = − = − −
53. x-intercept = 2; y-intercept = –1Points are (2,0) and (0,–1)
1 0 1 1
0 2 2 2m
− − −= = =
− −
11
2
12 2 or 1
2
y mx b
y x
x y y x
= +
= −
− = = −

8/21/2019 PR 9e ISM 01, Graphs
http://slidepdf.com/reader/full/pr-9e-ism-01-graphs 30/65
Chapter 1: Graphs
30
Copyright © 2012 Pearson Education, Inc. Publishing as Prentice Hall
54. x-intercept = –4; y-intercept = 4Points are (–4, 0) and (0, 4)
4 0 41
0 ( 4) 4m
−= = =
− −
1 4
4
4 or 4
y mx b y x
y x
x y y x
= += +
= +
− = − = +
55. Slope undefined; containing the point (2, 4)This is a vertical line.
2 No slope-intercept form. x =
56. Slope undefined; containing the point (3, 8)This is a vertical line.
3 No slope-intercept form. x =
57. Horizontal lines have slope 0m = and take theform y b= . Therefore, the horizontal line
passing through the point ( )3,2− is 2 y = .
58. Vertical lines have an undefined slope and takethe form x a= . Therefore, the vertical line
passing through the point ( )4, 5− is 4 x = .
59. Parallel to 2 y x = ; Slope = 2
Containing (–1, 2)
1 1( )
2 2( ( 1))
2 2 2 2 4
2 4 or 2 4
y y m x x
y x
y x y x
x y y x
− = −
− = − −
− = + → = +
− = − = +
60. Parallel to 3 y x = − ; Slope = –3; Containing the
point (–1, 2)
1 1( )
2 3( ( 1))
2 3 3 3 1
3 1 or 3 1
y y m x x
y x
y x y x
x y y x
− = −
− = − − −
− = − − → = − −
+ = − = − −
61. Parallel to 2 2 x y− = − ; Slope = 2
Containing the point (0, 0)
1 1( )
0 2( 0)
22 0 or 2
y y m x x
y x
y x
x y y x
− = −
− = −
=
− = =
62. Parallel to 2 5 x y− = − ;
( )1
Slope ; Containing the point 0,02
=
1 1( )
1 10 ( 0)
2 2
12 0 or
2
y y m x x
y x y x
x y y x
− = −
− = − → =
− = =
63. Parallel to 5 x = ; Containing (4,2)
This is a vertical line.
4 No slope-intercept form. x =
64. Parallel to 5 y = ; Containing the point (4, 2)
This is a horizontal line. Slope = 02 y =
65. Perpendicular to1
4;2
y x = + Containing (1, –2)
Slope of perpendicular = –2
1 1
( )
( 2) 2( 1)
2 2 2 2
2 0 or 2
y y m x x
y x
y x y x
x y y x
− = −
− − = − −
+ = − + → = −
+ = = −
66. Perpendicular to 2 3 y x = − ; Containing the
point (1, –2)
1Slope of perpendicular
2= −
1 1( )
1( 2) ( 1)
2
1 1 1 32
2 2 2 2
1 32 3 or
2 2
y y m x x
y x
y x y x
x y y x
− = −
− − = − −
+ = − + → = − −
+ = − = − −

8/21/2019 PR 9e ISM 01, Graphs
http://slidepdf.com/reader/full/pr-9e-ism-01-graphs 31/65
Section 1.3: Lines
31
Copyright © 2012 Pearson Education, Inc. Publishing as Prentice Hall
67. Perpendicular to 2 2 x y+ = ; Containing the
point (–3, 0)
1Slope of perpendicular
2=
1 1( )1 1 3
0 ( ( 3))2 2 2
1 32 3 or
2 2
y y m x x
y x y x
x y y x
− = −
− = − − → = +
− = − = +
68. Perpendicular to 2 5 x y− = − ; Containing the
point (0, 4)Slope of perpendicular = –2
2 4
2 4 or 2 4
y mx b
y x
x y y x
= +
= − +
+ = = − +
69. Perpendicular to 8 x = ; Containing (3, 4)
Slope of perpendicular = 0 (horizontal line)4 y =
70. Perpendicular to 8 y = ;
Containing the point (3, 4)Slope of perpendicular is undefined (verticalline). 3 x = No slope-intercept form.
71. 2 3 y x = + ; Slope = 2; y-intercept = 3
72. 3 4 y x = − + ; Slope = –3; y-intercept = 4
73.1
12
y x = − ; 2 2 y x = −
Slope = 2; y-intercept = –2
74.1
23 x y+ = ;
12
3 y x = − +
1Slope
3
= − ; y-intercept = 2
75.1
22
y x = + ;1
Slope2
= ; y-intercept = 2
76.1
22
y x = + ; Slope = 2;1
-intercept2
y =

8/21/2019 PR 9e ISM 01, Graphs
http://slidepdf.com/reader/full/pr-9e-ism-01-graphs 32/65
Chapter 1: Graphs
32
Copyright © 2012 Pearson Education, Inc. Publishing as Prentice Hall
77. 2 4 x y+ = ;1
2 4 22
y x y x = − + → = − +
1Slope
2= − ; y-intercept = 2
78. 3 6 x y− + = ;1
3 6 23
y x y x = + → = +
1Slope3
= ; y-intercept = 2
79. 2 3 6 x y− = ; 23 2 6 23
y x y x − = − + → = −
2Slope
3= ; y-intercept = –2
80. 3 2 6 x y+ = ;3
2 3 6 32
y x y x = − + → = − +
3Slope
2= − ; y-intercept = 3
81. 1 x y+ = ; 1 y x = − +
Slope = –1; y-intercept = 1
82. 2 x y− = ; 2 y x = −
Slope = 1; y-intercept = –2
83. 4 x = − ; Slope is undefined
y-intercept - none

8/21/2019 PR 9e ISM 01, Graphs
http://slidepdf.com/reader/full/pr-9e-ism-01-graphs 33/65
Section 1.3: Lines
33
Copyright © 2012 Pearson Education, Inc. Publishing as Prentice Hall
84. 1 y = − ; Slope = 0; y-intercept = –1
85. 5 y = ; Slope = 0; y-intercept = 5
86. 2 x = ; Slope is undefined
y-intercept - none
87. 0 y x − = ; y x =
Slope = 1; y-intercept = 0
88. 0 x y+ = ; y x = −
Slope = –1; y-intercept = 0
89. 2 3 0 y x − = ;3
2 32
y x y x = → =
3Slope
2= ; y-intercept = 0
90. 3 2 0 x y+ = ;3
2 32
y x y x = − → = −
3Slope2
= − ; y-intercept = 0

8/21/2019 PR 9e ISM 01, Graphs
http://slidepdf.com/reader/full/pr-9e-ism-01-graphs 34/65
Chapter 1: Graphs
34
Copyright © 2012 Pearson Education, Inc. Publishing as Prentice Hall
91. a. x -intercept: ( )2 3 0 6
2 6
3
x
x
x
+ =
=
=
The point ( )3,0 is on the graph.
y-intercept: ( )2 0 3 6
3 6
2
y
y
y
+ =
=
=
The point ( )0,2 is on the graph.
b. y
x
5
5−5
−5
(3, 0)
(0, 2)
92. a. x -intercept: ( )3 2 0 6
3 6
2
x
x
x
− =
=
=
The point ( )2,0 is on the graph.
y-intercept: ( )3 0 2 6
2 6
3
y
y
y
− =
− =
= −
The point ( )0, 3− is on the graph.
b.
(0, −3)
y
x
5
5−5
−5
(2, 0)
93. a. x -intercept: ( )4 5 0 40
4 40
10
x
x
x
− + =
− =
= −
The point ( )10,0− is on the graph.
y-intercept: ( )4 0 5 40
5 40
8
y
y
y
− + =
=
=
The point ( )0,8 is on the graph.
b.
94. a. x -intercept: ( )6 4 0 24
6 24
4
x
x
x
− =
=
=
The point ( )4,0 is on the graph.
y-intercept: ( )6 0 4 24
4 24
6
y
y
y
− =
− =
= −
The point ( )0, 6− is on the graph.
b.
8/21/2019 PR 9e ISM 01, Graphs
http://slidepdf.com/reader/full/pr-9e-ism-01-graphs 35/65
Section 1.3: Lines
35
Copyright © 2012 Pearson Education, Inc. Publishing as Prentice Hall
95. a. x -intercept: ( )7 2 0 21
7 21
3
x
x
x
+ =
=
=
The point ( )3,0 is on the graph.
y-intercept: ( )7 0 2 21
2 21
21
2
y
y
y
+ =
=
=
The point21
0,2
is on the graph.
b.
96. a. x -intercept: ( )5 3 0 18
5 18
18
5
x
x
x
+ =
=
=
The point18
,0
5
is on the graph.
y-intercept: ( )5 0 3 18
3 18
6
y
y
y
+ =
=
=
The point ( )0,6 is on the graph.
b.
97. a. x -intercept: ( )1 1
0 12 3
11
2
2
x
x
x
+ =
=
=
The point ( )2,0 is on the graph.
y-intercept: ( )1 1
0 12 3
11
3
3
y
y
y
+ =
=
=
The point ( )0,3 is on the graph.
b.
98. a. x -intercept: ( )2
0 43
4
x
x
− =
=
The point ( )4,0 is on the graph.
y-intercept: ( ) 20 4
3
24
3
6
y
y
y
− =
− =
= −
The point ( )0, 6− is on the graph.
b.
8/21/2019 PR 9e ISM 01, Graphs
http://slidepdf.com/reader/full/pr-9e-ism-01-graphs 36/65
Chapter 1: Graphs
36
Copyright © 2012 Pearson Education, Inc. Publishing as Prentice Hall
99. a. x -intercept: ( )0.2 0.5 0 1
0.2 1
5
x
x
x
− =
=
=
The point ( )5,0 is on the graph.
y-intercept: ( )0.2 0 0.5 1
0.5 1
2
y
y
y
− =
− =
= −
The point ( )0, 2− is on the graph.
b.
100. a. x -intercept: ( )0.3 0.4 0 1.2
0.3 1.2
4
x
x
x
− + =
− =
= −
The point ( )4,0− is on the graph.
y-intercept: ( )0.3 0 0.4 1.2
0.4 1.2
3
y
y
y
− + =
=
=
The point ( )0,3 is on the graph.
b.
101. The equation of the x-axis is 0 y = . (The slope
is 0 and the y-intercept is 0.)
102. The equation of the y-axis is 0 x = . (The slope
is undefined.)
103. The slopes are the same but the y-intercepts aredifferent. Therefore, the two lines are parallel.
104. The slopes are opposite-reciprocals. That is, theirproduct is 1− . Therefore, the lines areperpendicular.
105. The slopes are different and their product does
not equal 1− . Therefore, the lines are neitherparallel nor perpendicular.
106. The slopes are different and their product doesnot equal 1− (in fact, the signs are the same sothe product is positive). Therefore, the lines areneither parallel nor perpendicular.
107. Intercepts: ( )0,2 and ( )2,0− . Thus, slope = 1.
2 or 2 y x x y= + − = −
108. Intercepts: ( )0,1 and ( )1,0 . Thus, slope = –1.
1 or 1 y x x y= − + + =
109. Intercepts: ( )3,0 and ( )0,1 . Thus, slope =1
3− .
11 or 3 3
3 y x x y= − + + =
110. Intercepts: ( )0, 1− and ( )2,0− . Thus,
slope =1
2− .
11 or 2 2
2 y x x y= − − + = −
111. ( )1 2,5P = − , ( )2 1,3P = : 1
5 3 2 2
2 1 3 3m
−= = = −
− − −
( )2 1,3P = , ( )3 1,0P = − :( )
2
3 0 3
1 1 2m
−= =
− −
Since 1 2 1m m⋅ = − , the line segments 1 2P P and
2 3P P are perpendicular. Thus, the points 1P , 2P ,
and 3P are vertices of a right triangle.
112. ( )1 1, 1P = − , ( )2 4,1P = , ( )3 2,2P = , ( )4 5,4P =
( )12 1 1 24 1 3
m − −= =−
; 24 4 1 35 4
m −= =−
;
34
4 2 2
5 2 3m
−= =
−;
( )13
2 13
2 1m
− −= =
−
Each pair of opposite sides are parallel (sameslope) and adjacent sides are not perpendicular.Therefore, the vertices are for a parallelogram.
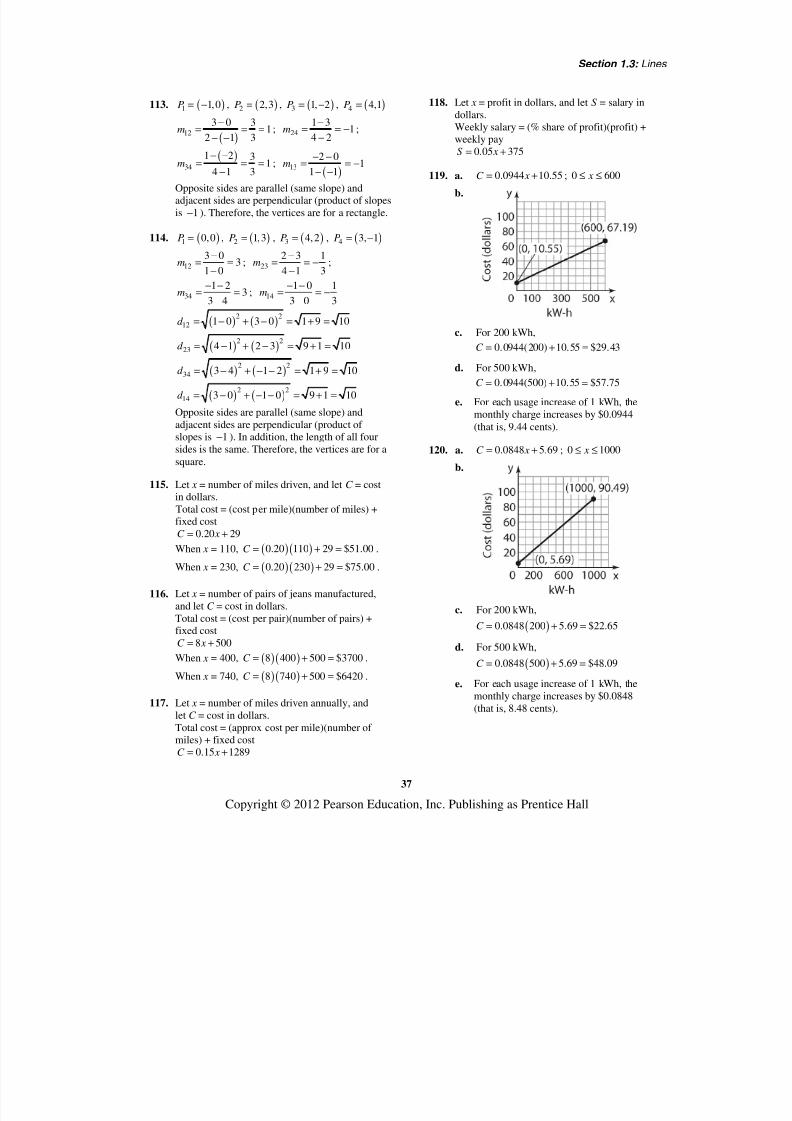
8/21/2019 PR 9e ISM 01, Graphs
http://slidepdf.com/reader/full/pr-9e-ism-01-graphs 37/65
Section 1.3: Lines
37
Copyright © 2012 Pearson Education, Inc. Publishing as Prentice Hall
113. ( )1 1,0P = − , ( )2 2,3P = , ( )3 1, 2P = − , ( )4 4,1P =
( )12
3 0 31
2 1 3m
−= = =
− −; 24
1 31
4 2m
−= = −
−;
( )34
1 2 314 1 3m
− −
= = =− ; ( )13
2 011 1m
− −= = −− −
Opposite sides are parallel (same slope) andadjacent sides are perpendicular (product of slopesis 1− ). Therefore, the vertices are for a rectangle.
114. ( )1 0,0P = , ( )2 1,3P = , ( )3 4,2P = , ( )4 3, 1P = −
12
3 03
1 0m
−= =
−; 23
2 3 1
4 1 3m
−= = −
−;
34
1 23
3 4m
− −= =
−; 14
1 0 1
3 0 3m
− −= = −
−
( ) ( )
2 2
121 0 3 0 1 9 10d = − + − = + =
( ) ( )2 2
23 4 1 2 3 9 1 10d = − + − = + =
( ) ( )2 2
34 3 4 1 2 1 9 10d = − + − − = + =
( ) ( )2 2
14 3 0 1 0 9 1 10d = − + − − = + =
Opposite sides are parallel (same slope) andadjacent sides are perpendicular (product ofslopes is 1− ). In addition, the length of all foursides is the same. Therefore, the vertices are for asquare.
115. Let x = number of miles driven, and let C = costin dollars.Total cost = (cost per mile)(number of miles) +fixed cost
0.20 29C x = +
When x = 110, ( )( )0.20 110 29 $51.00C = + = .
When x = 230, ( )( )0.20 230 29 $75.00C = + = .
116. Let x = number of pairs of jeans manufactured,and let C = cost in dollars.Total cost = (cost per pair)(number of pairs) +fixed cost
8 500C x = +
When x = 400, ( )( )8 400 500 $3700C = + = .
When x = 740, ( )( )8 740 500 $6420C = + = .
117. Let x = number of miles driven annually, andlet C = cost in dollars.Total cost = (approx cost per mile)(number ofmiles) + fixed cost
0.15 1289C x = +
118. Let x = profit in dollars, and let S = salary indollars.Weekly salary = (% share of profit)(profit) +weekly pay
0.05 375S x = +
119. a. 0.0944 10.55C x = + ; 0 600 x ≤ ≤
b.
c. For 200 kWh,
0.0944(200) 10.55 $29.43C = + =
d. For 500 kWh,
0.0944(500) 10.55 $57.75C = + =
e. For each usage increase of 1 kWh, themonthly charge increases by $0.0944(that is, 9.44 cents).
120. a. 0.0848 5.69C x = + ; 0 1000 x ≤ ≤
b.
c. For 200 kWh,
( )0.0848 200 5.69 $22.65C = + =
d. For 500 kWh,
( )0.0848 500 5.69 $48.09C = + =
e. For each usage increase of 1 kWh, themonthly charge increases by $0.0848(that is, 8.48 cents).

8/21/2019 PR 9e ISM 01, Graphs
http://slidepdf.com/reader/full/pr-9e-ism-01-graphs 38/65
Chapter 1: Graphs
38
Copyright © 2012 Pearson Education, Inc. Publishing as Prentice Hall
121. ( , ) (0, 32); ( , ) (100, 212)C F C F ° ° = ° ° =
212 32 180 9slope
100 0 100 5
932 ( 0)
59
32 ( )5
5( 32)
9
F C
F C
C F
−= = =
−
° − = ° −
° − = °
° = ° −
If 70F ° = , then
5 5(70 32) (38)
9 9
21.1
C
C
° = − =
° ≈ °
122. a. º 273K C = +
b. 5º (º 32)9
C F = −
( )
5( 32) 273
9
5 160º 273
9 9
5 2297º
9 9
15 2297
9
K F
K F
K F
K F
= ° − +
= − +
= +
= ° +
123. a. The y-intercept is (0, 30), so b = 30. Since
the ramp drops 2 inches for every 25 inches
of run, the slope is2 2
25 25m
−= = − . Thus,
the equation is2
3025
y x = − + .
b. Let y = 0.
( )
20 30
25
230
25
25 2 2530
2 25 2375
x
x
x
x
= − +
=
=
=
The x -intercept is (375, 0). This means thatthe ramp meets the floor 375 inches (or31.25 feet) from the base of the platform.
c. No. From part (b), the run is 31.25 feet whichexceeds the required maximum of 30 feet.
d. First, design requirements state that themaximum slope is a drop of 1 inch for each
12 inches of run. This means1
12m ≤ .
Second, the run is restricted to be no morethan 30 feet = 360 inches. For a rise of 30inches, this means the minimum slope is
30 1
360 12= . That is,
1
12m ≥ . Thus, the
only possible slope is1
12m = . The
diagram indicates that the slope is negative.Therefore, the only slope that can be used toobtain the 30-inch rise and still meet design
requirements is1
12m = − . In words, for
every 12 inches of run, the ramp must dropexactly 1 inch.
124. a. The year 1996 corresponds to x = 0, and theyear 2006 corresponds to x = 10. Therefore,the points (0, 22.2) and (7, 12.2) are on the
line. Thus,10 0 10
112.2 22.2 10
m −
= = − = −−
.
The y-intercept is 22.2, so b = 22.2 and theequation is 22.2 y x = − +
b. x -intercept: 0 22.2
22.2
x
x
= − +
=
y-intercept: ( )0 22.2 22.2 y = − + =
The intercepts are (22.2, 0) and (0, 22.2).
c. The y-intercept represents the percentage oftwelfth graders in 1996 who had reporteddaily use of cigarettes. The x -interceptrepresents the number of years after 1996when 0% of twelfth graders will havereported daily use of cigarettes.
d. The year 2016 corresponds to x = 20.
( )20 22.2 2.2 y = − + =
This prediction is reasonable.
125. a. Let x = number of boxes to be sold, and A = money, in dollars, spent on advertising.We have the points
1 1( , ) (100, 000, 40, 000); x A =

8/21/2019 PR 9e ISM 01, Graphs
http://slidepdf.com/reader/full/pr-9e-ism-01-graphs 39/65
Section 1.3: Lines
39
Copyright © 2012 Pearson Education, Inc. Publishing as Prentice Hall
2 2( , ) (200,000, 60,000) x A =
( )
60,000 40,000slope
200,000 100,000
20,000 1
100, 000 5
140,000 100,000
5
140,000 20,000
5
120,000
5
A x
A x
A x
−=
−
= =
− = −
− = −
= +
b. If x = 300,000, then
( )1
300, 000 20, 000 $80, 0005
A = + =
c. Each additional box sold requires anadditional $0.20 in advertising.
126. Find the slope of the line containing ( ),a b and
( ),b a :
slope 1a b
b a
−= = −
−
The slope of the line y x = is 1.
Since 1 1 1− ⋅ = − , the line containing the points
( , ) and ( , )a b b a is perpendicular to the line
y x = .
The midpoint of ( , ) and ( , )a b b a is
,2 2
a b b a M
+ + =
.
Since the coordinates are the same, the midpointlies on the line y x = .
Note:2 2
a b b a+ +=
127. 2 x y C − =
Graph the lines:2 4
2 0
2 2
x y
x y
x y
− = −
− =
− =
All the lines have the same slope, 2. The lines
are parallel.
128. Refer to Figure 47.
( )
( )
( )
21
22
1 2
length of , 1
length of , 1
length of ,
OA d O A m
OB d O B m
AB d A B m m
= = +
= = +
= = −
Now consider the equation
( ) ( ) ( )2 2
22 21 2 1 21 1m m m m+ + + = −
If this equation is valid, then AOB∆ is a right
triangle with right angle at vertex O.
( ) ( ) ( )2 2
22 21 2 1 2
2 2 2 21 2 1 1 2 2
2 2 2 21 2 1 1 2 2
1 1
1 1 2
2 2
m m m m
m m m m m m
m m m m m m
+ + + = −
+ + + = − +
+ + = − +
But we are assuming that 1 2 1m m = − , so wehave
( )2 2 2 21 2 1 2
2 2 2 21 2 1 2
2 2 1
2 2
0 0
m m m m
m m m m
+ + = − − +
+ + = + +
=
Therefore, by the converse of the PythagoreanTheorem, AOB∆ is a right triangle with right
angle at vertex O. Thus Line 1 is perpendicularto Line 2.
129. (b), (c), (e) and (g)The line has positive slope and positive
y-intercept.
130. (a), (c), and (g)The line has negative slope and positive y-intercept.

8/21/2019 PR 9e ISM 01, Graphs
http://slidepdf.com/reader/full/pr-9e-ism-01-graphs 40/65
Chapter 1: Graphs
40
Copyright © 2012 Pearson Education, Inc. Publishing as Prentice Hall
131. (c) The equation 2 x y− = − has slope 1 and y-
intercept (0, 2). The equation 1 x y− = has
slope 1 and y-intercept (0, 1).− Thus, the lines
are parallel with positive slopes. One line has apositive y-intercept and the other with a negative y-intercept.
132. (d)The equation 2 2 y x − = has slope 2 and y-
intercept (0, 2). The equation 2 1 x y+ = − has
slope1
2− and y-intercept
10, .
2
−
The lines
are perpendicular since1
2 12
− = −
. One line
has a positive y-intercept and the other with a
negative y-intercept.
133 – 135. Answers will vary.
136. No, the equation of a vertical line cannot bewritten in slope-intercept form because the slopeis undefined.
137. No, a line does not need to have both an x-
intercept and a y-intercept. Vertical andhorizontal lines have only one intercept (unlessthey are a coordinate axis). Every line must haveat least one intercept.
138. Two lines with equal slopes and equal y-intercepts are coinciding lines (i.e. the same).
139. Two lines that have the same x -intercept and y-
intercept (assuming the x -intercept is not 0) arethe same line since a line is uniquely defined bytwo distinct points.
140. No. Two lines with the same slope and different x-
intercepts are distinct parallel lines and have nopoints in common.
Assume Line 1 has equation 1 y mx b= + and Line
2 has equation 2 y mx b= + ,
Line 1 has x-intercept 1b
m− and y-intercept 1b .
Line 2 has x-intercept 2b
m− and y-intercept 2b .
Assume also that Line 1 and Line 2 have unequal x-intercepts.
If the lines have the same y-intercept, then 1 2b b= .
1 2 1 21 2
b b b bb b
m m m m= = − = −
But 1 2b b
m m− = − Line 1 and Line 2 have the
same x-intercept, which contradicts the originalassumption that the lines have unequal x-intercepts.Therefore, Line 1 and Line 2 cannot have the same y-intercept.
141. Yes. Two distinct lines with the same y-intercept,but different slopes, can have the same x -interceptif the x -intercept is 0 x = .
Assume Line 1 has equation 1 y m x b= + and Line
2 has equation 2 y m x b= + ,
Line 1 has x-intercept1
b
m− and y-intercept b .
Line 2 has x-intercept2
bm
− and y-intercept b .
Assume also that Line 1 and Line 2 have unequal
slopes, that is 1 2m m≠ .
If the lines have the same x-intercept, then
1 2
b b
m m− = − .
1 2
2 1
2 1 0
b b
m m
m b m b
m b m b
− = −
− = −
− + =
( )2 1 1 2
1 2 1 2
But 0 0
0
or 0
m b m b b m m
b
m m m m
− + = − =
=
− = =
Since we are assuming that 1 2m m≠ , the only way
that the two lines can have the same x-intercept is
if 0.b =
142. Answers will vary.
143.( )
2 1
2 1
4 2 6 3
4 21 3
y ym
x x
− − − −= = = = −
− − −
It appears that the student incorrectly found theslope by switching the direction of one of thesubtractions.
144. Interactive Exercise

8/21/2019 PR 9e ISM 01, Graphs
http://slidepdf.com/reader/full/pr-9e-ism-01-graphs 41/65
Section 1.4: Circles
41
Copyright © 2012 Pearson Education, Inc. Publishing as Prentice Hall
Section 1.4
1. add; ( )21
210 25⋅ =
2. ( )
2
2 92 9
2 3
2 3
x x
x
x
− =− = ±
− = ±
= ±
5 or 1 x x = = −
The solution set is { 1, 5}.−
3. False. For example, 2 2 2 2 8 0 x y x y+ + + + =
is not a circle. It has no real solutions.
4. radius
5. True; 2 9 3r r = → =
6. False; the center of the circle
( ) ( )2 2
3 2 13 x y+ + − = is ( )3,2− .
7. Center = (2, 1)
2 2
Radius distance from (0,1) to (2,1)
(2 0) (1 1) 4 2
=
= − + − = =
Equation: 2 2( 2) ( 1) 4 x y− + − =
8. Center = (1, 2)
2 2
Radius distance from (1,0) to (1,2)
(1 1) (2 0) 4 2
=
= − + − = =
Equation: 2 2( 1) ( 2) 4 x y− + − =
9. Center = midpoint of (1, 2) and (4, 2)
( ) ( )1 4 2 2 52 2 2
, , 2+ +
= =
( )2
2
52
Radius distance from ,2 to (4,2)
5 9 34 (2 2)
2 4 2
=
= − + − = =
Equation:
225 9
( 2)
2 4
x y
− + − =
10. Center = midpoint of (0, 1) and (2, 3)
( )0 2 1 3
, 1, 22 2
+ + = =
( )
( )2 2
Radius distance from 1, 2 to (2,3)
2 1 (3 2) 2
=
= − + − =
Equation: ( )2 21 ( 2) 2 x y− + − =
11.2 2 2( ) ( ) x h y k r − + − =
2 2 2
2 2
( 0) ( 0) 2
4
x y
x y
− + − =
+ =
General form: 2 2 4 0 x y+ − =
12.2 2 2( ) ( ) x h y k r − + − =
2 2 2
2 2
( 0) ( 0) 3
9
x y
x y
− + − =
+ =
General form: 2 2 9 0 x y+ − =
13.2 2 2( ) ( ) x h y k r − + − =
2 2 2
2 2
( 0) ( 2) 2
( 2) 4
x y
x y
− + − =
+ − =
General form: 2 2
2 2
4 4 4
4 0
x y y
x y y
+ − + =
+ − =

8/21/2019 PR 9e ISM 01, Graphs
http://slidepdf.com/reader/full/pr-9e-ism-01-graphs 42/65
Chapter 1: Graphs
42
Copyright © 2012 Pearson Education, Inc. Publishing as Prentice Hall
14. 2 2 2( ) ( ) x h y k r − + − =
2 2 2
2 2
( 1) ( 0) 3
( 1) 9
x y
x y
− + − =
− + =
General form:
2 2
2 22 1 9
2 8 0 x x y x y x
− + + =+ − − =
15. 2 2 2( ) ( ) x h y k r − + − =
2 2 2
2 2
( 4) ( ( 3)) 5
( 4) ( 3) 25
x y
x y
− + − − =
− + + =
General form:2 2
2 2
8 16 6 9 25
8 6 0
x x y y
x y x y
− + + + + =
+ − + =
16.2 2 2( ) ( ) x h y k r − + − =
2 2 2
2 2
( 2) ( ( 3)) 4
( 2) ( 3) 16
x y
x y
− + − − =
− + + =
General form: 2 2
2 2
4 4 6 9 16
4 6 3 0
x x y y
x y x y
− + + + + =
+ − + − =
17. 2 2 2( ) ( ) x h y k r − + − =
( ) 2 2 2
2 2
( 2 ) ( 1) 4
( 2) ( 1) 16
x y
x y
− − + − =
+ + − =
General form:2 2
2 24 4 2 1 16
4 2 11 0 x x y y
x y x y+ + + − + =
+ + − − =
18.2 2 2( ) ( ) x h y k r − + − =
( ) 2 2 2
2 2
( 5 ) ( ( 2)) 7
( 5) ( 2) 49
x y
x y
− − + − − =
+ + + =
General form: 2 2
2 2
10 25 4 4 49
10 4 20 0
x x y y
x y x y
+ + + + + =
+ + + − =
19. 2 2 2( ) ( ) x h y k r − + − =
2 22
22
1 1( 0)
2 2
1 1
2 4
x y
x y
− + − =
− + =
General form: 2 2
2 2
1 1
4 4
0
x x y
x y x
− + + =
+ − =
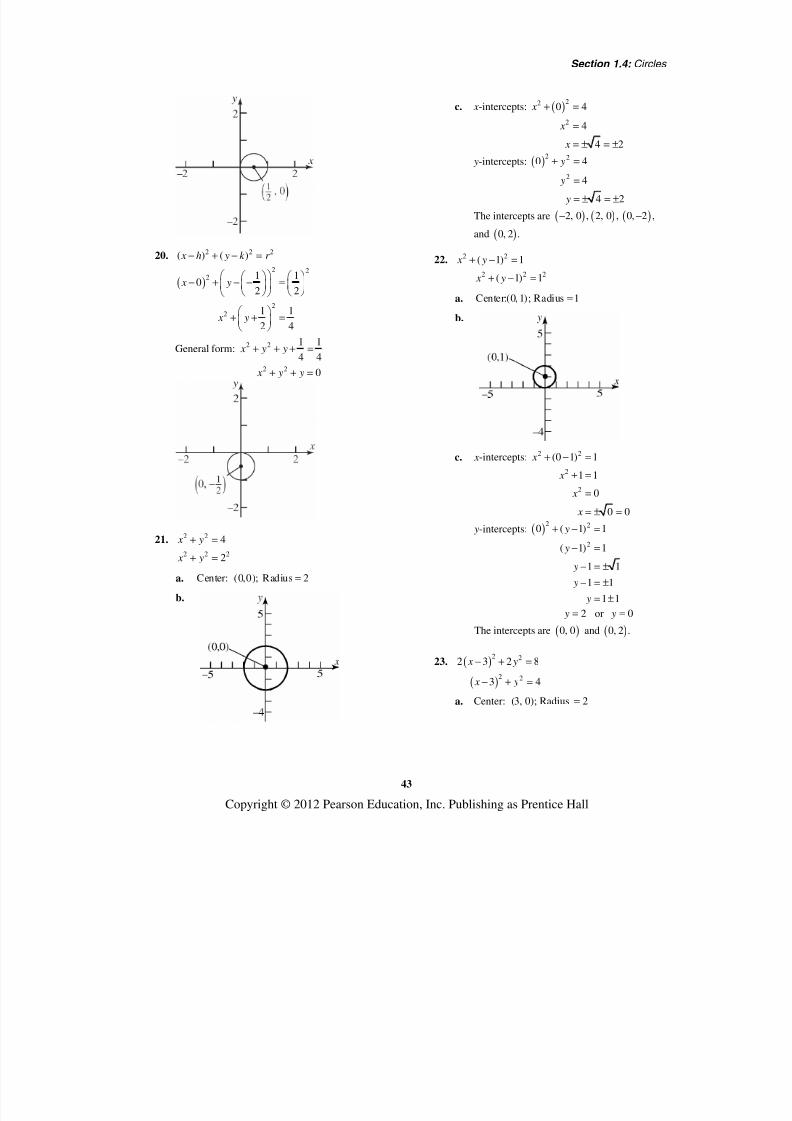
8/21/2019 PR 9e ISM 01, Graphs
http://slidepdf.com/reader/full/pr-9e-ism-01-graphs 43/65
Section 1.4: Circles
43
Copyright © 2012 Pearson Education, Inc. Publishing as Prentice Hall
20. 2 2 2( ) ( ) x h y k r − + − =
( )2 2
2
22
1 10
2 2
1 1
2 4
x y
x y
− + − − =
+ + =
General form: 2 2
2 2
1 1
4 4
0
x y y
x y y
+ + + =
+ + =
21. 2 2 4 x y+ =
2 2 22 x y+ =
a. Center: (0,0); Radius 2=
b.
c. x -intercepts: ( )22
2
0 4
4
4 2
x
x
x
+ =
=
= ± = ±
y-intercepts: ( )2 2
20 4
4
4 2
y
y
y
+ =
=
= ± = ±
The intercepts are ( ) ( )2, 0 , 2, 0 ,− ( )0, 2 ,−
and ( )0, 2 .
22. 2 2( 1) 1 x y+ − =
2 2 2( 1) 1 x y+ − =
a. Center:(0, 1); Radius 1=
b.
c. x -intercepts: 2 2
2
2
(0 1) 1
1 1
0
0 0
x
x
x
x
+ − =
+ =
=
= ± =
y-intercepts: ( )2 2
2
0 ( 1) 1
( 1) 1
1 1
1 1
1 1
y
y
y
y
y
+ − =
− =
− = ±
− = ±
= ±
2 or 0 y y= =
The intercepts are ( )0, 0 and ( )0, 2 .
23. ( )2 22 3 2 8 x y− + =
( )2 23 4 x y− + =
a. Center: (3, 0); Radius 2=
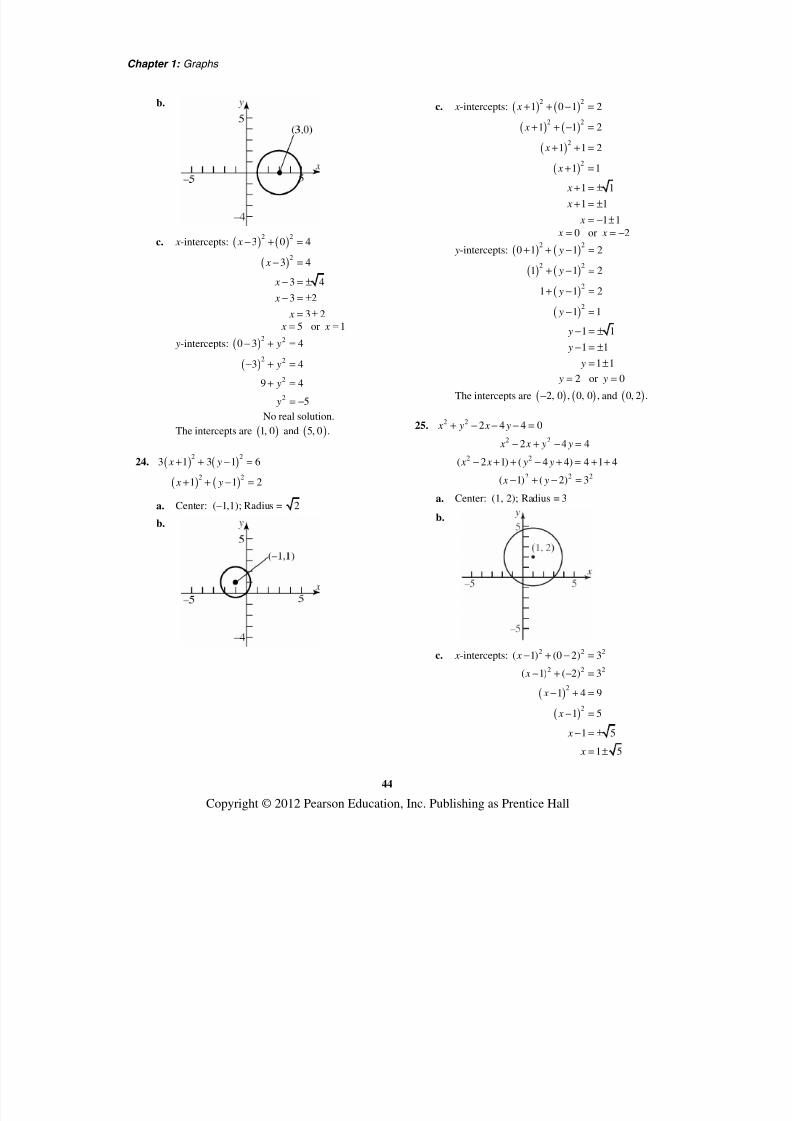
8/21/2019 PR 9e ISM 01, Graphs
http://slidepdf.com/reader/full/pr-9e-ism-01-graphs 44/65
Chapter 1: Graphs
44
Copyright © 2012 Pearson Education, Inc. Publishing as Prentice Hall
b.
c. x -intercepts: ( ) ( )
( )
2 2
2
3 0 4
3 4
3 4
3 2
3 2
x
x
x
x
x
− + =
− =
− = ±
− = ±
= ±
5 or 1 x x = = y-intercepts: ( )
( )
2 2
2 2
2
2
0 3 4
3 4
9 4
5
y
y
y
y
− + =
− + =
+ =
= −
No real solution.
The intercepts are ( )1, 0 and ( )5, 0 .
24. ( ) ( )2 2
3 1 3 1 6 x y+ + − =
( ) ( )2 2
1 1 2 x y+ + − =
a. Center: (–1,1); Radius = 2
b.
c. x -intercepts: ( ) ( )
( ) ( )
( )
( )
2 2
2 2
2
2
1 0 1 2
1 1 2
1 1 2
1 1
1 1
1 1
1 1
x
x
x
x
x
x
x
+ + − =
+ + − =
+ + =
+ =
+ = ±
+ = ±
= − ±
0 or 2 x x = = −
y-intercepts: ( ) ( )
( ) ( )
( )
( )
2 2
2 2
2
2
0 1 1 2
1 1 2
1 1 2
1 1
1 1
1 1
1 1
y
y
y
y
y
y
y
+ + − =
+ − =
+ − =
− =
− = ±
− = ±
= ±
2 or 0 y y= =
The intercepts are ( ) ( )2, 0 , 0, 0 ,− and ( )0, 2 .
25. 2 2 2 4 4 0 x y x y+ − − − =
2 2
2 2
2 2 2
2 4 4
( 2 1) ( 4 4) 4 1 4
( 1) ( 2) 3
x x y y
x x y y
x y
− + − =
− + + − + = + +
− + − =
a. Center: (1, 2); Radius = 3
b.
c. x -intercepts:
( )
( )
2 2 2
2 2 2
2
2
( 1) (0 2) 3
( 1) ( 2) 3
1 4 9
1 5
1 5
1 5
x
x
x
x
x
x
− + − =
− + − =
− + =
− =
− = ±
= ±

8/21/2019 PR 9e ISM 01, Graphs
http://slidepdf.com/reader/full/pr-9e-ism-01-graphs 45/65
Section 1.4: Circles
45
Copyright © 2012 Pearson Education, Inc. Publishing as Prentice Hall
y-intercepts:
( )
( )
2 2 2
2 2 2
2
2
(0 1) ( 2) 3
( 1) ( 2) 3
1 2 9
2 8
2 8
2 2 2
2 2 2
y
y
y
y
y
y
y
− + − =
− + − =
+ − =
− =
− = ±
− = ±
= ±
The intercepts are ( ) ( )1 5, 0 , 1 5, 0 ,− +
( )0, 2 2 2 ,− and ( )0, 2 2 2 .+
26.2 2 4 2 20 0 x y x y+ + + − =
2 2
2 2
2 2 2
4 2 20
( 4 4) ( 2 1) 20 4 1
( 2) ( 1) 5
x x y y
x x y y
x y
+ + + =
+ + + + + = + +
+ + + =
a. Center: (–2,–1); Radius = 5
b.
c. x -intercepts: 2 2 2
2
2
( 2) (0 1) 5
( 2) 1 25
( 2) 24
2 24
2 2 6
2 2 6
x
x
x
x
x
x
+ + + =
+ + =
+ =
+ = ±
+ = ±
= − ±
y-intercepts: 2 2 2
2
2
(0 2) ( 1) 5
4 ( 1) 25
( 1) 21
1 21
1 21
y
y
y
y
y
+ + + =
+ + =
+ =
+ = ±
= − ±
The intercepts are ( )2 2 6, 0 ,− −
( )2 2 6, 0 ,− + ( )0, 1 21 ,− − and
( )0, 1 21 .− +
27. 2 2
2 2
2 2
2 2 2
4 4 1 0
4 4 1
( 4 4) ( 4 4) 1 4 4
( 2) ( 2) 3
x y x y
x x y y
x x y y
x y
+ + − − =
+ + − =
+ + + − + = + +
+ + − =
a. Center: (–2, 2); Radius = 3
b. y
x −5 5
5
−5
(−2, 2)
c. x -intercepts: 2 2 2
2
2
( 2) (0 2) 3
( 2) 4 9
( 2) 5
2 5
2 5
x
x
x
x
x
+ + − =
+ + =
+ =
+ = ±
= − ±
y-intercepts: 2 2 2
2
2
(0 2) ( 2) 3
4 ( 2) 9
( 2) 5
2 5
2 5
y
y
y
y
y
+ + − =
+ − =
− =
− = ±
= ±
The intercepts are ( )2 5, 0 ,− −
( )2 5, 0 ,− + ( )0, 2 5 ,− and ( )0, 2 5 .+
28.2 2
2 2
2 2
2 2 2
6 2 9 0
6 2 9
( 6 9) ( 2 1) 9 9 1
( 3) ( 1) 1
x y x y
x x y y
x x y y
x y
+ − + + =
− + + = −
− + + + + = − + +
− + + =
a. Center: (3, –1); Radius = 1
b.
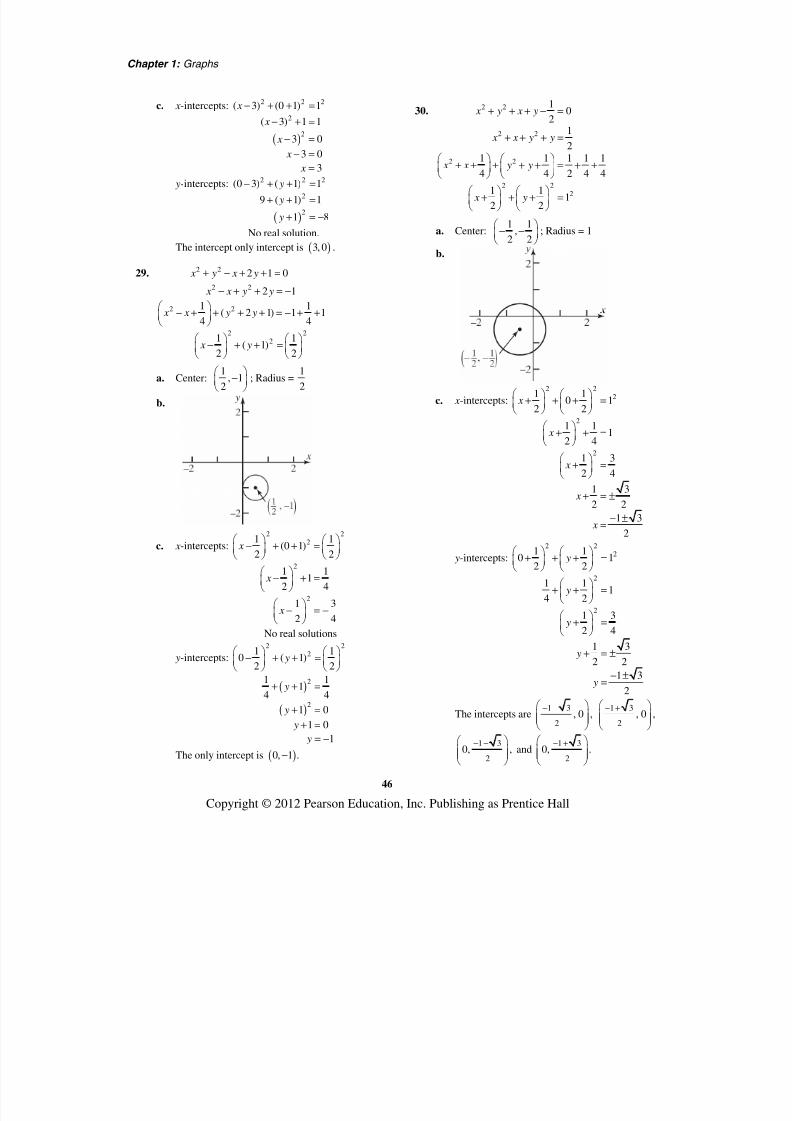
8/21/2019 PR 9e ISM 01, Graphs
http://slidepdf.com/reader/full/pr-9e-ism-01-graphs 46/65
Chapter 1: Graphs
46
Copyright © 2012 Pearson Education, Inc. Publishing as Prentice Hall
c. x -intercepts:
( )
2 2 2
2
2
( 3) (0 1) 1
( 3) 1 1
3 0
3 0
3
x
x
x
x
x
− + + =
− + =
− =
− =
=
y-intercepts:
( )
2 2 2
2
2
(0 3) ( 1) 1
9 ( 1) 1
1 8
y
y
y
− + + =
+ + =
+ = −
No real solution.
The intercept only intercept is ( )3, 0 .
29. 2 2 2 1 0 x y x y+ − + + =
2 2
2 2
2 22
2 1
1 1( 2 1) 1 1
4 4
1 1( 1)
2 2
x x y y
x x y y
x y
− + + = −
− + + + + = − + +
− + + =
a. Center:1
, 12
−
; Radius =
1
2
b.
c. x -intercepts:
2 22
2
2
1 1(0 1)
2 2
1 11
2 4
1 3
2 4
x
x
x
− + + =
− + =
− = −
No real solutions
y-intercepts:
( )
( )
2 2
2
2
2
1 10 ( 1)2 2
1 11
4 4
1 0
1 0
1
y
y
y
y
y
− + + =
+ + =
+ =
+ =
= −
The only intercept is ( )0, 1 .−
30.2 2
2 2
2 2
2 22
10
21
2
1 1 1 1 14 4 2 4 4
1 11
2 2
x y x y
x x y y
x x y y
x y
+ + + − =
+ + + =
+ + + + + = + +
+ + + =
a. Center:1 1
,2 2
− −
; Radius = 1
b.
c. x -intercepts:
2 22
2
2
1 10 1
2 2
1 11
2 4
1 3
2 4
1 32 2
1 3
2
x
x
x
x
x
+ + + =
+ + =
+ =
+ = ±
− ±=
y-intercepts:
2 22
2
2
1 10 1
2 2
1 11
4 2
1 3
2 4
1 3
2 2
1 3
2
y
y
y
y
y
+ + + =
+ + =
+ =
+ = ±
− ±=
The intercepts are1 3
2, 0 ,
− −
1 3
2, 0 ,
− +
1 3
20, ,
− −
and1 3
20, .
− +

8/21/2019 PR 9e ISM 01, Graphs
http://slidepdf.com/reader/full/pr-9e-ism-01-graphs 47/65
Section 1.4: Circles
47
Copyright © 2012 Pearson Education, Inc. Publishing as Prentice Hall
31. 2 2
2 2
2 2
2 2
2 2 2
2 2 12 8 24 0
6 4 12
6 4 12
( 6 9) ( 4 4) 12 9 4( 3) ( 2) 5
x y x y
x y x y
x x y y
x x y y x y
+ − + − =
+ − + =
− + + =
− + + + + = + +− + + =
a. Center: (3,–2); Radius = 5
b.
c. x -intercepts:
( )
( )
2 2 2
2
2
( 3) (0 2) 5
3 4 25
3 21
3 21
3 21
x
x
x
x
x
− + + =
− + =
− =
− = ±
= ±
y-intercepts:
( )
( )
2 2 2
2
2
(0 3) ( 2) 5
9 2 25
2 162 4
2 4
y
y
y y
y
− + + =
+ + =
+ =+ = ±
= − ±
2 or 6 y y= = −
The intercepts are ( )3 21, 0 ,− ( )3 21, 0 ,+
( )0, 6 ,− and ( )0, 2 .
32. a.2 22 2 8 7 0 x y x + + + =
2 2
2 2
2 2
2 2
2
2 2
2 8 2 7
74
2
7( 4 4) 42
1( 2)
2
2( 2)
2
x x y
x x y
x x y
x y
x y
+ + = −
+ + = −
+ + + = − +
+ + =
+ + =
Center: (–2, 0); Radius =2
2
b.
c. x -intercepts: ( )
( )
22
2
1( 2) 0
21
22
12
2
222
22
2
x
x
x
x
x
+ + =
+ =
+ = ±
+ = ±
= − ±
y-intercepts: 2 2
2
2
1(0 2)
21
42
7
2
y
y
y
+ + =
+ =
= −
No real solutions.
The intercepts are2
2 , 02
− −
and
22 , 0 .
2
− +
33.
( )
2 2
2 2
2 2
2 2 2
2 8 2 0
4 0
4 4 0 4
2 2
x x y
x x y
x x y
x y
+ + =
+ + =
+ + + = +
+ + =
a. Center: ( )2,0− ; Radius: 2r =
b.

8/21/2019 PR 9e ISM 01, Graphs
http://slidepdf.com/reader/full/pr-9e-ism-01-graphs 48/65
Chapter 1: Graphs
48
Copyright © 2012 Pearson Education, Inc. Publishing as Prentice Hall
c. x -intercepts: ( ) ( )
( )
2 2 2
2
2
2 0 2
( 2) 4
2 4
2 22 2
x
x
x
x x
+ + =
+ =
+ = ±
+ = ±= − ±
0 or 4 x x = = −
y-intercepts: ( )2 2 2
2
2
0 2 2
4 4
0
0
y
y
y
y
+ + =
+ =
=
=
The intercepts are ( )4, 0− and ( )0, 0 .
34.
( )
2 2
2 2
2 2
22
3 3 12 0
4 04 4 0 4
2 4
x y y
x y y
x y y
x y
+ − =
+ − =
+ − + = +
+ − =
a. Center: ( )0,2 ; Radius: 2r =
b.
c. x -intercepts: ( )22
2
2
0 2 4
4 4
0
0
x
x
x
x
+ − =
+ =
=
=
y-intercepts: ( )
( )
22
2
0 2 4
2 4
2 4
2 2
2 2
y
y
y
y
y
+ − =
− =
− = ±
− = ±
= ±
4 or 0 y y= =
The intercepts are ( )0, 0 and ( )0, 4 .
35. Center at (0, 0); containing point (–2, 3).
( ) ( )2 2
2 0 3 0 4 9 13r = − − + − = + =
Equation: ( )2
2 2
2 2
( 0) ( 0) 13
13
x y
x y
− + − =
+ =
36. Center at (1, 0); containing point (–3, 2).
( ) ( )2 2
3 1 2 0 16 4 20 2 5r = − − + − = + = =
Equation: ( )2
2 2
2 2
( 1) ( 0) 20
( 1) 20
x y
x y
− + − =
− + =
37. Center at (2, 3); tangent to the x-axis.3r =
Equation: 2 2 2
2 2
( 2) ( 3) 3
( 2) ( 3) 9
x y
x y
− + − =
− + − =
38. Center at (–3, 1); tangent to the y-axis.3r =
Equation: 2 2 2
2 2
( 3) ( 1) 3
( 3) ( 1) 9
x y
x y
+ + − =
+ + − =
39. Endpoints of a diameter are (1, 4) and (–3, 2).The center is at the midpoint of that diameter:
Center: ( )1 ( 3) 4 2
, 1,32 2
+ − + = −
Radius:
2 2
(1 ( 1)) (4 3) 4 1 5r = − − + − = + =
Equation: ( )2
2 2
2 2
( ( 1)) ( 3) 5
( 1) ( 3) 5
x y
x y
− − + − =
+ + − =
40. Endpoints of a diameter are (4, 3) and (0, 1).The center is at the midpoint of that diameter:
Center: ( )4 0 3 1
, 2, 22 2
+ + =
Radius: 2 2(4 2) (3 2) 4 1 5r = − + − = + =
Equation: ( )2
2 2
2 2
( 2) ( 2) 5
( 2) ( 2) 5
x y
x y
− + − =
− + − =
8/21/2019 PR 9e ISM 01, Graphs
http://slidepdf.com/reader/full/pr-9e-ism-01-graphs 49/65
Section 1.4: Circles
49
Copyright © 2012 Pearson Education, Inc. Publishing as Prentice Hall
41. Center at (–1, 3); tangent to the line y = 2.This means that the circle contains the point(–1, 2), so the radius is r = 1.
Equation: 2 2 2
2 2
( 1) ( 3) (1)
( 1) ( 3) 1
x y
x y
+ + − =
+ + − =
42. Center at (4, –2); tangent to the line x = 1.This means that the circle contains the point(1, –2), so the radius is r = 3.
Equation: 2 2 2
2 2
( 4) ( 2) (3)
( 4) ( 2) 9
x y
x y
− + + =
− + + =
43. (c); Center: ( )1, 2− ; Radius = 2
44. (d) ; Center: ( )3,3− ; Radius = 3
45. (b) ; Center: ( )1,2− ; Radius = 2
46. (a) ; Center: ( )3,3− ; Radius = 3
47. Let the upper-right corner of the square be the
point ( ), x y . The circle and the square are both
centered about the origin. Because of symmetry,we have that x y= at the upper-right corner of
the square. Therefore, we get2 2
2 2
2
2
9
9
2 99
2
9 3 2
2 2
x y
x x
x
x
x
+ =
+ =
=
=
= =
The length of one side of the square is 2 x . Thus,
the area is
( )2
22 3 2
2 3 2 182
A s
= = ⋅ = =
square units.
48. The area of the shaded region is the area of the
circle, less the area of the square. Let the upper-right corner of the square be the point ( ), x y .
The circle and the square are both centered aboutthe origin. Because of symmetry, we have that x y= at the upper-right corner of the square.
Therefore, we get
2 2
2 2
2
2
36
36
2 36
18
3 2
x y
x x
x
x
x
+ =
+ =
=
=
=
The length of one side of the square is 2 x . Thus,
the area of the square is ( )2
2 3 2 72⋅ = square
units. From the equation of the circle, we have6r = . The area of the circle is
( )22 6 36r π π π = = square units.
Therefore, the area of the shaded region is
36 72 A π = − square units.
49. The diameter of the Ferris wheel was 250 feet, so
the radius was 125 feet. The maximum heightwas 264 feet, so the center was at a height of264 125 139− = feet above the ground. Since the
center of the wheel is on the y-axis, it is the point(0, 139). Thus, an equation for the wheel is:
( ) ( )
( )
2 2 2
22
0 139 125
139 15,625
x y
x y
− + − =
+ − =
50. The diameter of the wheel is 150 meters, so theradius is 75 meters. The maximum height is 165meters, so the center of the wheel is at a heightof 167 75 90− = meters above the ground. Since
the center of the wheel is on the y-axis, it is thepoint (0, 90). Thus, an equation for the wheel is:
( ) ( )
( )
2 2 2
22
0 90 75
90 5625
x y
x y
− + − =
+ − =
51.2 2 2 4 4091 0 x y x y+ + + − =
( ) ( )
2 2
2 2
2 2
2 4 4091 0
2 1 4 4 4091 5
1 2 4096
x x y y
x x y y
x y
+ + + − =
+ + + + + = +
+ + + =
The circle representing Earth has center ( )1, 2− −
and radius = 4096 64= .
So the radius of the satellite’s orbit is64 0.6 64.6+ = units.
The equation of the orbit is
( ) ( ) ( )2 2 2
2 2
1 2 64.6
2 4 4168.16 0
x y
x y x y
+ + + =
+ + + − =
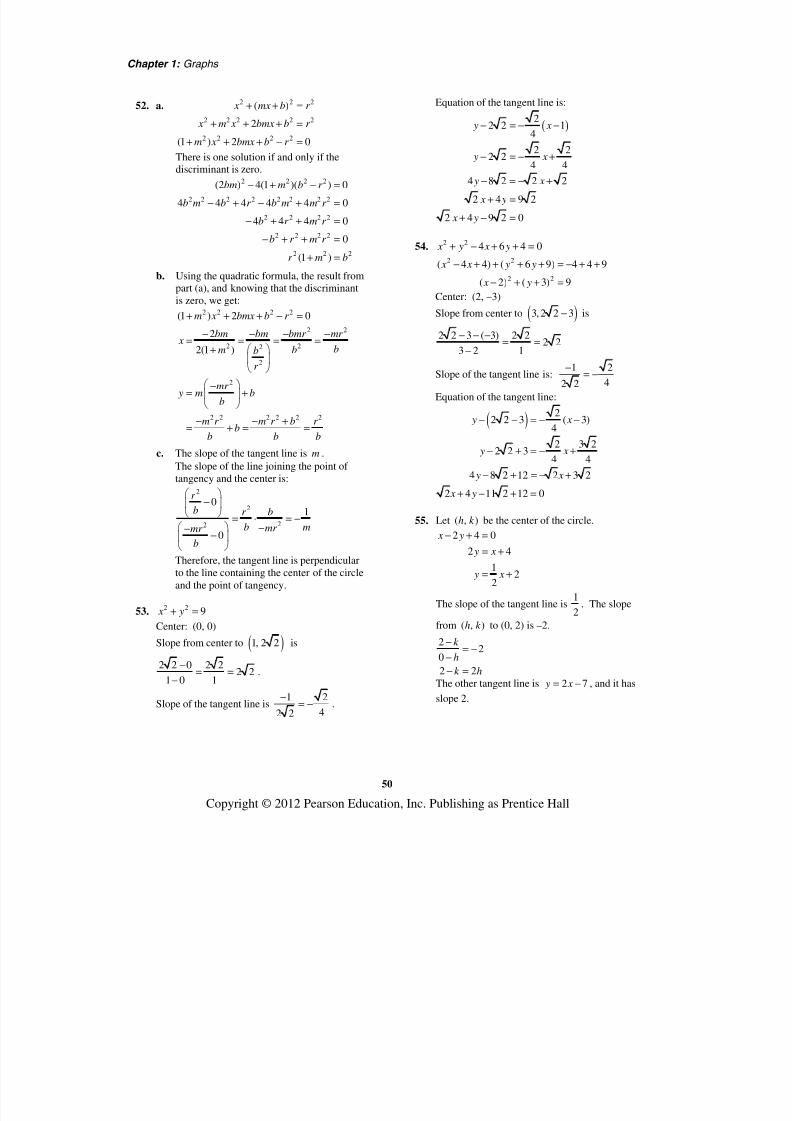
8/21/2019 PR 9e ISM 01, Graphs
http://slidepdf.com/reader/full/pr-9e-ism-01-graphs 50/65
Chapter 1: Graphs
50
Copyright © 2012 Pearson Education, Inc. Publishing as Prentice Hall
52. a. 2 2 2
2 2 2 2 2
2 2 2 2
( )
2
(1 ) 2 0
x mx b r
x m x bmx b r
m x bmx b r
+ + =
+ + + =
+ + + − =
There is one solution if and only if thediscriminant is zero.
2 2 2 2
2 2 2 2 2 2 2 2
2 2 2 2
2 2 2 2
2 2 2
(2 ) 4(1 )( ) 0
4 4 4 4 4 0
4 4 4 0
0
(1 )
bm m b r
b m b r b m m r
b r m r
b r m r
r m b
− + − =
− + − + =
− + + =
− + + =
+ =
b. Using the quadratic formula, the result frompart (a), and knowing that the discriminantis zero, we get:
2 2 2 2(1 ) 2 0m x bmx b r + + + − =
2 2
2 22
2
2
2 2 2 2 2 2
2
2(1 )
bm bm bmr mr x
bm bb
r
mr y m b
b
m r m r b r b
b b b
− − − −= = = =
+
−= +
− − += + = =
c. The slope of the tangent line is m .
The slope of the line joining the point oftangency and the center is:
2
2
22
01
0
r
b r b
b mmr mr
b
−
= ⋅ = −
−−−
Therefore, the tangent line is perpendicularto the line containing the center of the circleand the point of tangency.
53.2 2 9 x y+ =
Center: (0, 0)
Slope from center to ( )1, 2 2 is
2 2 0 2 22 2
1 0 1
−= =
−.
Slope of the tangent line is1 2
42 2
−= − .
Equation of the tangent line is:
( )2
2 2 14
2 22 2
4 4
4 8 2 2 2
2 4 9 2
2 4 9 2 0
y x
y x
y x
x y
x y
− = − −
− = − +
− = − +
+ =
+ − =
54.2 2 4 6 4 0 x y x y+ − + + =
2 2
2 2
( 4 4) ( 6 9) 4 4 9
( 2) ( 3) 9
x x y y
x y
− + + + + = − + +
− + + =
Center: (2, –3)
Slope from center to ( )3, 2 2 3− is
2 2 3 ( 3) 2 22 2
3 2 1
− − −= =
−
Slope of the tangent line is:1 2
42 2
−= −
Equation of the tangent line:
( )2
2 2 3 ( 3)4
2 3 22 2 3
4 4
4 8 2 12 2 3 2
2 4 11 2 12 0
y x
y x
y x
x y
− − = − −
− + = − +
− + = − +
+ − + =
55. Let ( , )h k be the center of the circle.
2 4 0
2 4
12
2
x y
y x
y x
− + =
= +
= +
The slope of the tangent line is1
2. The slope
from ( , )h k to (0, 2) is –2.
2
202 2
k
h
k h
−
= −−
− =
The other tangent line is 2 7 y x = − , and it has
slope 2.

8/21/2019 PR 9e ISM 01, Graphs
http://slidepdf.com/reader/full/pr-9e-ism-01-graphs 51/65
Section 1.4: Circles
51
Copyright © 2012 Pearson Education, Inc. Publishing as Prentice Hall
The slope from ( , )h k to (3, –1) is1
2− .
1 1
3 2
2 2 32 1
1 2
k
h
k hk h
h k
− −= −
−
+ = −= −
= −
Solve the two equations in andh k :
2 2(1 2 )
2 2 4
3 0
0
k k
k k
k
k
− = −
− = −
=
=
1 2(0) 1h = − =
The center of the circle is (1, 0).
56. Find the centers of the two circles:2 2
2 2
2 2
4 6 4 0
( 4 4) ( 6 9) 4 4 9
( 2) ( 3) 9
x y x y
x x y y
x y
+ − + + =
− + + + + = − + +
− + + =
Center: ( )2, 3−
2 2
2 2
2 2
6 4 9 0
( 6 9) ( 4 4) 9 9 4
( 3) ( 2) 4
x y x y
x x y y
x y
+ + + + =
+ + + + + = − + +
+ + + =
Center: ( )3, 2− −
Find the slope of the line containing the centers:
2 ( 3) 1
3 2 5m
− − −= = −
− −
Find the equation of the line containing thecenters:
13 ( 2)
5
5 15 2
5 13
5 13 0
y x
y x
x y
x y
+ = − −
+ = − +
+ = −
+ + =
57. Consider the following diagram:
(2,2)
Therefore, the path of the center of the circle hasthe equation 2 y = .
58. 2
6 2
6 2
2 2
3
C r
r
r
r
π
π π
π π
π π
=
=
=
=
The radius is 3 units long.
59. (b), (c), (e) and (g)
We need , 0h k > and ( )0,0 on the graph.
60. (b), (e) and (g)
We need 0h < , 0k = , and h r > .
61. Answers will vary.
62. The student has the correct radius, but the signsof the coordinates of the center are incorrect. Thestudent needs to write the equation in the
standard form ( ) ( )2 2 2
x h y k r − + − = .
( ) ( )
( )( ) ( )
2 2
2 2 2
3 2 16
3 2 4
x y
x y
+ + − =
− − + − =
Thus, ( ) ( ), 3, 2h k = − and 4r = .
63. Set the axes so that the field’s maximum
dimension is along the x-axis.
Let 2h width= , 2k height = , therefore the point
farthest from the origin has coordinates ( ),P h k .
So the distance from the origin to point P is
2 2 the radius of the circler h k = + = .
Using 1 sprinkler arm:
If we place the sprinkler at the origin, we get a circle
equation 2 2 2 x y r + = , where 2 2
r h k = + . So how
excess land is being watered ? The area of the field =
4F A hk = .
P(h,k )
hk
r

8/21/2019 PR 9e ISM 01, Graphs
http://slidepdf.com/reader/full/pr-9e-ism-01-graphs 52/65
Chapter 1: Graphs
52
Copyright © 2012 Pearson Education, Inc. Publishing as Prentice Hall
The area of the circular water pattern
( ) ( )2
2 2 2 2 2C A r h k h k π π π = = + = + .
Therefore the amount of excess land being
watered = ( )2 2 4C F A A h k hk π − = + − .
Using 2 sprinkler arms:
We want to place the sprinklers so that theyoverlap as little as possible while watering theentire field. The equation of the circle withcenter on the positive x -axis that passes through
the point ( ),P h k and ( )0,Q k is
22 2 21
2 4
h x y h k
− + = +
, since the center is
,02
h
, and the radius is 2 21
4h k + .
The case for the other side is similar. Thus, the
sprinklers should have their centers at ,02
h −
and ,02
h
, with the arm lengths set at
2 214
h k + .
Each sprinkler waters the same area, so the totalarea watered is
2
2 2 2 2 21 12 2 2
4 4C A r h k h k π π π
= = + = +
.
The amount of excess land being watered is
2 212 4
4C F A A h k hk π
− = + −
.
Comparison:
In order to determine when to switch from 1sprinkler to 2 sprinklers, we want to determinewhen 2 sprinklers water less excess land than 1sprinkler waters. That is, we want to solve:
( )2 2 2 212 4 4
4h k hk h k hk π π
+ − < + −
.
( )
2 2 2 2
2 2 2 2
2 2 2 2
2 2 2 2
2 2
12 4 4
4
2 4 42
22
12
2
1
2
1
2
2
h k hk h k hk
h k hk h k hk
h k h k
h k h k
k h
k h
h k
π π
π π π π
π π π π
+ − < + −
+ − < + −
+ < +
+ < +
<
<
>
So 2 sprinklers is the better choice when thelonger dimension of the rectangle exceeds theshorter dimension by a factor of more than
2 1.414≈ .
64 – 65. Interactive Exercises.
Chapter 1 Review Exercises
1. ( ) ( )1 20,0 and 4,2P P= =
a. ( ) ( ) ( )2 2
1 2, 4 0 2 0
16 4 20 2 5
d P P = − + −
= + = =
b. The coordinates of the midpoint are:
( )
1 2 1 2( , ) ,2 2
0 4 0 2 4 2, , 2,1
2 2 2 2
x x y y x y
+ + =
+ + = = =
c. 2 0 2 1
slope4 0 4 2
y
x
∆ −= = = =
∆ −
d. For each run of 2, there is a rise of 1.
2. ( ) ( )1 20,0 and 4,6P P= = −
a. ( ) ( ) ( )2 2
1 2, 4 0 6 0
16 36 52 2 13
d P P = − − + −
= + = =
Q(0,k ) P(h,k )

8/21/2019 PR 9e ISM 01, Graphs
http://slidepdf.com/reader/full/pr-9e-ism-01-graphs 53/65
Chapter 1 Review Exercises
53
Copyright © 2012 Pearson Education, Inc. Publishing as Prentice Hall
b. The coordinates of the midpoint are:
( )
( )
1 2 1 2( , ) ,2 2
0 4 0 6 4 6
, , 2,32 2 2 2
x x y y x y
+ + =
+ − + −
= = = −
c. 6 0 6 3
slope4 0 4 2
y
x
∆ −= = = = −
∆ − − −
d. For each run of 2, there is a rise of 3.−
3. ( ) ( )1 21, 1 and 2, 3P P= − = −
a. ( ) ( ) ( )( )22
1 2, 2 1 3 1
9 16 25 5
d P P = − − + − −
= + = =
b. The coordinates of the midpoint are:
( )
1 2 1 2( , ) ,2 2
1 2 1 3,
2 2
1 2 1, ,1
2 2 2
x x y y x y + + =
+ − − +=
− = = −
c. ( )3 1 4 4
slope2 1 3 3
y
x
− −∆= = = = −
∆ − − −
d. For each run of 3, there is a rise of 4.−
4. ( ) ( )1 22,2 and 1,4P P= − =
a. ( ) ( )( ) ( )2 2
1 2, 1 2 4 2
9 4 13
d P P = − − + −
= + =
b. 1 2 1 2( , ) ,2 2
2 1 2 4,
2 2
1 6 1, ,3
2 2 2
x x y y x y
+ + =
− + + =
= − = −
c. ( )
4 2 2slope1 2 3
y x
∆ −= = =∆ − −
d. For each run of 3, there is a rise of 2.
5. ( ) ( )1 24, 4 and 4, 8P P= − =
a. ( ) ( ) ( )( )22
1 2, 4 4 8 4
0 144 144 12
d P P = − + − −
= + = =
b. The coordinates of the midpoint are:
( )
1 2 1 2( , ) ,2 2
4 4 4 8 8 4, , 4,2
2 2 2 2
x x y y x y
+ + =
+ − + = = =
c. ( )8 4 12
slope , undefined4 4 0
y
x
− −∆= = =
∆ −
d. An undefined slope means the points lie on avertical line. There is no change in x .
6. ( ) ( )1 23,4 and 2,4P P= − =
a. ( ) ( )( ) ( )2 2
1 2, 2 3 4 4
25 0 25 5
d P P = − − + −
= + = =
b. The coordinates of the midpoint are:
1 2 1 2( , ) ,2 2
3 2 4 4 1 8 1, , , 4
2 2 2 2 2
x x y y x y
+ + =
− + + = = − = −
c. ( )
4 4 0slope 0
2 3 5
y
x
∆ −= = = =
∆ − −
d. A slope of zero means the points lie on ahorizontal line. There is no change in y.
7. 2 4 y x = + y
x −5 5
9
−1
(0, 4)
(1, 5)
(2, 8)
(−1, 5)
(−2, 8)
8. x-intercepts: 4, 0, 2− ; y-intercepts: 2 ,0 ,2−
Intercepts: ( 4, 0), (0, 0), (2,0), (0, 2), (0, 2)− −
9. 22 3 x y= x-intercepts: y-intercepts:
22 3(0)
2 0
0
x
x
x
=
=
=
2
2
2(0) 3
0
0
y
y
y
=
=
=
The only intercept is (0, 0).

8/21/2019 PR 9e ISM 01, Graphs
http://slidepdf.com/reader/full/pr-9e-ism-01-graphs 54/65
Chapter 1: Graphs
54
Copyright © 2012 Pearson Education, Inc. Publishing as Prentice Hall
Test x-axis symmetry: Let y y= −
2
2
2 3( )
2 3 same
x y
x y
= −
=
Test y-axis symmetry: Let x x = −
2
2
2( ) 3
2 3 different
x y
x y
− =
− =
Test origin symmetry: Let x x = − and y y= − .
2
2
2( ) 3( )
2 3 different
x y
x y
− = −
− =
Therefore, the graph will have x-axis symmetry.
10. 5 y x =
x-intercepts: y-intercepts:
0 5
0
x
x
=
=
( )5 0
0
y
y
=
=
The only intercept is (0, 0).
Test x-axis symmetry: Let y y= −
5
5 different
y x
y x
− =
= −
Test y-axis symmetry: Let x x = −
5( )
5 different
y x
y x
= −
= −
Test origin symmetry: Let x x = − and y y= − .
5( )
5 same
y x
y x
− = −
=
Therefore, the graph will have origin symmetry.
11. 2 2+4 =16 x y
x-intercepts: y-intercepts:
( )22
2
+4 0 =16
16
4
x
x
x
=
= ±
( )2 2
2
2
0 +4 =16
4 16
4
2
y
y
y
y
=
=
= ±
The intercepts are ( 4,0), (4,0), (0, 2),− − and
(0,2).
Test x-axis symmetry: Let y y= −
( )22
2 2
4 =16
4 =16 same
x y
x y
+ −
+
Test y-axis symmetry: Let x x = −
( )2 2
2 2
4 =16
4 =16 same
x y
x y
− +
+
Test origin symmetry: Let x x = − and y y= − .
( ) ( )2 2
2 2
4 =16
+4 =16 same
x y
x y
− + −
Therefore, the graph will have x-axis, y-axis, andorigin symmetry.
12. 2 29 =9 x y−
x-intercepts: y-intercepts:2 2
2
2
9 (0) 9
9 9
1
1
x
x
x
x
− =
=
=
= ±
2 2
2
2
9(0) 9
9
9
no real solutions
y
y
y
− =
− =
= −
The intercepts are ( 1,0)− and (1, 0).
Test x-axis symmetry: Let y y= −
( )22
2 2
9 9
9 9 same
x y
x y
− − =
− =
Test y-axis symmetry: Let x x = −
( )2 2
2 2
9 9
9 9 same
x y
x y
− − =
− =
Test origin symmetry: Let x x = − and y y= − .
( ) ( )2 2
2 2
9 9
9 9 same
x y
x y
− − − =
− =
Therefore, the graph will have x-axis, y-axis, and
origin symmetry.
13. 4 2+2 +1 y x x =
x-intercepts: y-intercepts:
( ) ( )
4 2
2 2
2
2
0 +2 +1
0 1 1
1 0
1
x x
x x
x
x
=
= + +
+ =
= −
4 2(0) +2(0) +1
1
y =
=
no real solutionsThe only intercept is (0, 1).
Test x-axis symmetry: Let y y= −
4 2
4 2
2 1
2 1 different
y x x
y x x
− = + +
= − − −
Test y-axis symmetry: Let x x = −
( ) ( )4 2
4 2
2 1
2 1 same
y x x
y x x
= − + − +
= + +
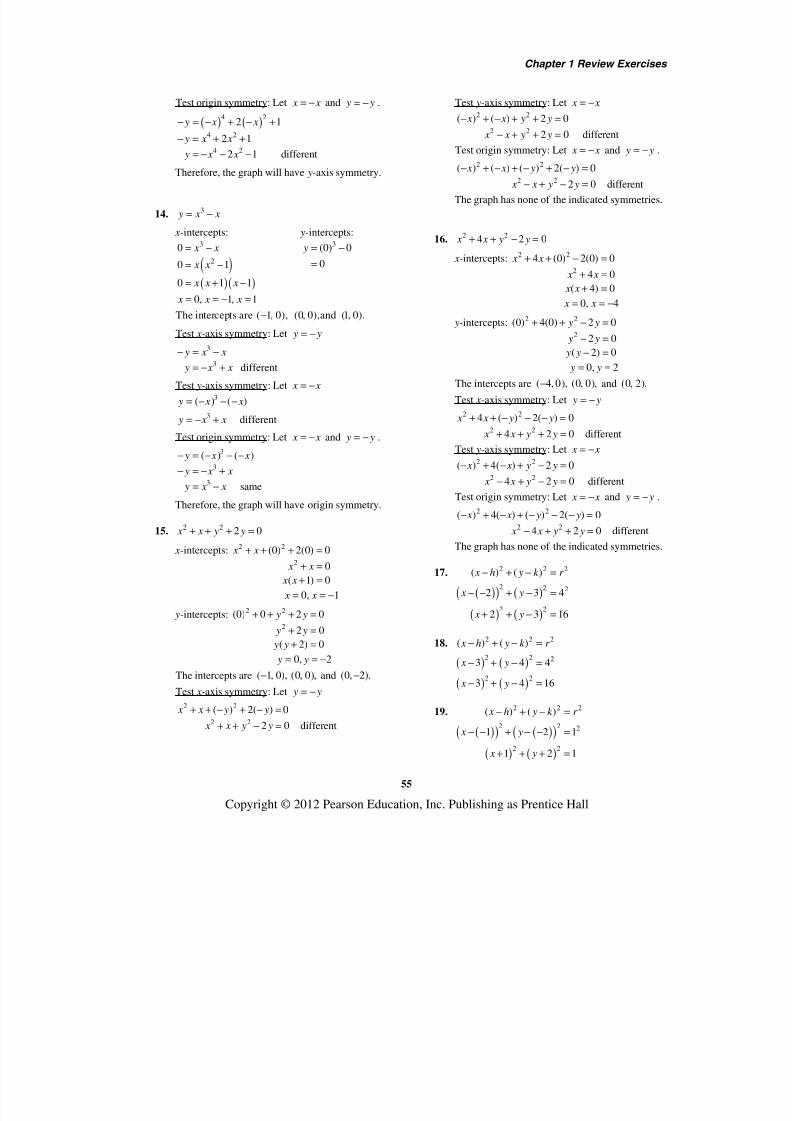
8/21/2019 PR 9e ISM 01, Graphs
http://slidepdf.com/reader/full/pr-9e-ism-01-graphs 55/65
Chapter 1 Review Exercises
55
Copyright © 2012 Pearson Education, Inc. Publishing as Prentice Hall
Test origin symmetry: Let x x = − and y y= − .
( ) ( )4 2
4 2
4 2
2 1
2 1
2 1 different
y x x
y x x
y x x
− = − + − +
− = + +
= − − −
Therefore, the graph will have y-axis symmetry.
14. 3 y x x = −
x-intercepts: y-intercepts:
( )( )( )
3
2
0
0 1
0 1 1
x x
x x
x x x
= −
= −
= + −
3(0) 0
0
y = −
=
0, 1, 1 x x x = = − =
The intercepts are ( 1, 0),− (0, 0),and (1, 0).
Test x-axis symmetry: Let y y= −
3
3 different
y x x
y x x
− = −
= − +
Test y-axis symmetry: Let x x = − 3
3
( ) ( )
different
y x x
y x x
= − − −
= − +
Test origin symmetry: Let x x = − and y y= − .
3
3
3
( ) ( )
same
y x x
y x x
y x x
− = − − −
− = − +
= −
Therefore, the graph will have origin symmetry.
15. 2 2 2 0 x x y y+ + + =
x-intercepts: 2 2
2
(0) 2(0) 0
0
( 1) 0
x x
x x
x x
+ + + =
+ =
+ =
0, 1 x x = = −
y-intercepts: 2 2
2
(0) 0 2 0
2 0
( 2) 0
y y
y y
y y
+ + + =
+ =
+ =
0, 2 y y= = −
The intercepts are ( 1, 0),− (0, 0), and (0, 2).−
Test x-axis symmetry: Let y y= −
2 2
2 2
( ) 2( ) 0
2 0 different
x x y y
x x y y
+ + − + − =
+ + − =
Test y-axis symmetry: Let x x = − 2 2
2 2
( ) ( ) 2 0
2 0 different
x x y y
x x y y
− + − + + =
− + + =
Test origin symmetry: Let x x = − and y y= − .
2 2
2 2
( ) ( ) ( ) 2( ) 0
2 0 different
x x y y
x x y y
− + − + − + − =
− + − =
The graph has none of the indicated symmetries.
16. 2 24 2 0 x x y y+ + − =
x-intercepts: 2 2
2
4 (0) 2(0) 0
4 0
( 4) 0
x x
x x
x x
+ + − =
+ =
+ =
0, 4 x x = = −
y-intercepts:
2 2
2(0) 4(0) 2 02 0
( 2) 0
y y y y
y y
+ + − =− =
− =
0, 2 y y= =
The intercepts are ( 4, 0),− (0, 0), and (0, 2).
Test x-axis symmetry: Let y y= −
2 2
2 2
4 ( ) 2( ) 0
4 2 0 different
x x y y
x x y y
+ + − − − =
+ + + =
Test y-axis symmetry: Let x x = − 2 2
2 2
( ) 4( ) 2 0
4 2 0 different
x x y y
x x y y
− + − + − =
− + − =
Test origin symmetry: Let x x = − and y y= − .
2 2
2 2
( ) 4( ) ( ) 2( ) 0
4 2 0 different
x x y y
x x y y
− + − + − − − =
− + + =
The graph has none of the indicated symmetries.
17.
( )( ) ( )
( ) ( )
2 2 2
2 2 2
2 2
( ) ( )
2 3 4
2 3 16
x h y k r
x y
x y
− + − =
− − + − =
+ + − =
18.
( ) ( )
( ) ( )
2 2 2
2 2 2
2 2
( ) ( )
3 4 4
3 4 16
x h y k r
x y
x y
− + − =
− + − =
− + − =
19.
( )( ) ( )( )
( ) ( )
2 2 2
2 2 2
2 2
( ) ( )
1 2 1
1 2 1
x h y k r
x y
x y
− + − =
− − + − − =
+ + + =

8/21/2019 PR 9e ISM 01, Graphs
http://slidepdf.com/reader/full/pr-9e-ism-01-graphs 56/65
Chapter 1: Graphs
56
Copyright © 2012 Pearson Education, Inc. Publishing as Prentice Hall
20.
( ) ( )( )
( ) ( )
2 2 2
22 2
2 2
( ) ( )
2 4 3
2 4 9
x h y k r
x y
x y
− + − =
− + − − =
− + + =
21. ( )
( )
22
22 2
1 4
1 2
x y
x y
+ − =
+ − =
Center: (0,1); Radius = 2
x -intercepts: ( )22
2
2
0 1 4
1 4
3
3
x
x
x
x
+ − =
+ =
=
= ±
y-intercepts: ( )22
2
0 1 4
( 1) 4
1 2
1 2
y
y
y
y
+ − =
− =
− = ±
= ±
3 or 1 y y= = −
The intercepts are ( )3, 0 ,− ( )3, 0 , ( )0, 1 ,−
and ( )0, 3 .
22. ( )
( )
2 2
2 2 2
2 9
2 3
x y
x y
+ + =
+ + =
Center: (–2, 0); Radius = 3
x -intercepts: ( )
( )
2 2
2
2 0 9
2 9
2 3
2 3
x
x
x
x
+ + =
+ =
+ = ±
= − ±
1 or 5 x x = = −
y-intercepts: ( )2 2
2
2
0 2 9
4 9
5
5
y
y
y
y
+ + =
+ =
=
= ±
The intercepts are ( )5, 0 ,− ( )1, 0 , ( )0, 5 ,− and
( )0, 5 .
23.
( ) ( )( ) ( )
2 2
2 2
2 2
2 2 2
2 4 4 0
2 4 42 1 4 4 4 1 4
1 2 3
x y x y
x x y y
x x y y
x y
+ − + − =
− + + =− + + + + = + +
− + + =
Center: (1, –2) Radius = 3
x -intercepts: ( ) ( )
( )
( )
2 2 2
2
2
1 0 2 3
1 4 9
1 5
1 5
1 5
x
x
x
x
x
− + + =
− + =
− =
− = ±
= ±
y-intercepts: ( ) ( )
( )
( )
2 2 2
2
2
0 1 2 3
1 2 9
2 8
2 8
2 2 2
2 2 2
y
y
y
y
y
y
− + + =
+ + =
+ =
+ = ±
+ = ±
= − ±
The intercepts are ( )1 5, 0 ,− ( )1 5, 0 ,+
( )0, 2 2 2 ,− − and ( )0, 2 2 2 .− +

8/21/2019 PR 9e ISM 01, Graphs
http://slidepdf.com/reader/full/pr-9e-ism-01-graphs 57/65
Chapter 1 Review Exercises
57
Copyright © 2012 Pearson Education, Inc. Publishing as Prentice Hall
24.
( ) ( )
( ) ( )
2 2
2 2
2 2
2 2 2
4 4 1 0
4 4 1
4 4 4 4 1 4 4
2 2 3
x y x y
x x y y
x x y y
x y
+ + − − =
+ + − =
+ + + − + = + +
+ + − =
Center: (–2, 2) Radius = 3
x -intercepts: ( ) ( )
( )
( )
2 2 2
2
2
2 0 2 3
2 4 9
2 5
2 5
2 5
x
x
x
x
x
+ + − =
+ + =
+ =
+ = ±
= − ±
y-intercepts: ( ) ( )
( )
( )
2 2 2
2
2
0 2 2 3
4 2 9
2 5
2 5
2 5
y
y
y
y
y
+ + − =
+ − =
− =
− = ±
= ±
The intercepts are ( )2 5, 0 ,− − ( )2 5, 0 ,− +
( )0, 2 5 ,− and ( )0, 2 5 .+
25.
( ) ( )( ) ( ) ( )
2 2
2 2
2 2
2 2
22 2
3 3 6 12 0
2 4 0
2 4 0
2 1 4 4 1 4
1 2 5
x y x y
x y x y
x x y y
x x y y
x y
+ − + =
+ − + =
− + + =
− + + + + = +
− + + =
Center: (1, –2) Radius = 5
x -intercepts: ( ) ( ) ( )
( )
( )
22 2
2
2
1 0 2 5
1 4 5
1 1
1 1
1 1
x
x
x
x
x
− + + =
− + =
− =
− = ±
= ±
2 or 0 x x = =
y-intercepts: ( ) ( ) ( )
( )( )
22 2
2
2
0 1 2 5
1 2 52 4
2 2
2 2
y
y y
y
y
− + + =
+ + =+ =
+ = ±
= − ±
0 or 4 y y= = −
The intercepts are ( )0, 0 , ( )2, 0 , and ( )0, 4 .−
26.
( )( )
2 2
2 2
2 2
2 2
2 2 2
2 2 4 0
2 0
2 0
2 1 1
1 1
x y x
x y x
x x y
x x y
x y
+ − =
+ − =
− + =
− + + =
− + =
Center: (1, 0) Radius = 1

8/21/2019 PR 9e ISM 01, Graphs
http://slidepdf.com/reader/full/pr-9e-ism-01-graphs 58/65
Chapter 1: Graphs
58
Copyright © 2012 Pearson Education, Inc. Publishing as Prentice Hall
x -intercepts: ( )
( )
2 2 2
2
1 0 1
1 1
1 1
1 1
x
x
x
x
− + =
− =
− = ±
= ±
2 or 0 x x = =
y-intercepts: ( )2 2 2
2
2
0 1
1 1
0
0
y y
y
y
y
− + =
+ =
=
=
The intercepts are ( )0, 0 , and ( )2, 0 .
27. Slope = –2; containing (3,–1)
( )
( )
1 1
( 1) 2 3
1 2 6
2 5 or 2 5
y y m x x
y x
y x
y x x y
− = −
− − = − −
+ = − +
= − + + =
28. Slope = 0; containing the point (–5, 4)
( )
( )
1 1
4 0 ( 5)
4 0
4
y y m x x
y x
y
y
− = −
− = − −
− =
=
29. vertical; containing (–3,4)Vertical lines have equations of the form x = a,where a is the x -intercept. Now, a vertical linecontaining the point (–3, 4) must have an x -intercept of –3, so the equation of the line is
3. x = − The equation does not have a slope-
intercept form.
30. x-intercept = 2; containing the point (4, –5)Points are (2, 0) and (4, –5).
5 0 5
4 2 2m
− −= = −
−
( )( )
1 1
50 2
2
55 or 5 2 10
2
y y m x x
y x
y x x y
− = −
− = − −
= − + + =
31. y-intercept = –2; containing (5,–3)Points are (5,–3) and (0,–2)
2 ( 3) 1 1
0 5 5 5m
− − −= = = −
− −
1
2 or 5 105
y mx b
y x x y
= +
= − − + = −
32. Containing the points (3,–4) and (2, 1)
1 ( 4) 55
2 3 1m
− −= = = −
− −
( )
( )
1 1
( 4) 5 3
4 5 15
5 11 or 5 11
y y m x x
y x
y x
y x x y
− = −
− − = − −
+ = − +
= − + + =
33. Parallel to 2 3 4 x y− = −
2 3 4
3 2 4
3 2 4
3 3
2 4
3 3
x y
y x
y x
y x
− = −
− = − −
− − −=
− −
= +
2Slope ; containing (–5,3)
3=
( )
( )
( )
1 1
23 ( 5)
32
3 53
2 103
3 3
2 19 or 2 3 19
3 3
y y m x x
y x
y x
y x
y x x y
− = −
− = − −
− = +
− = +
= + − = −
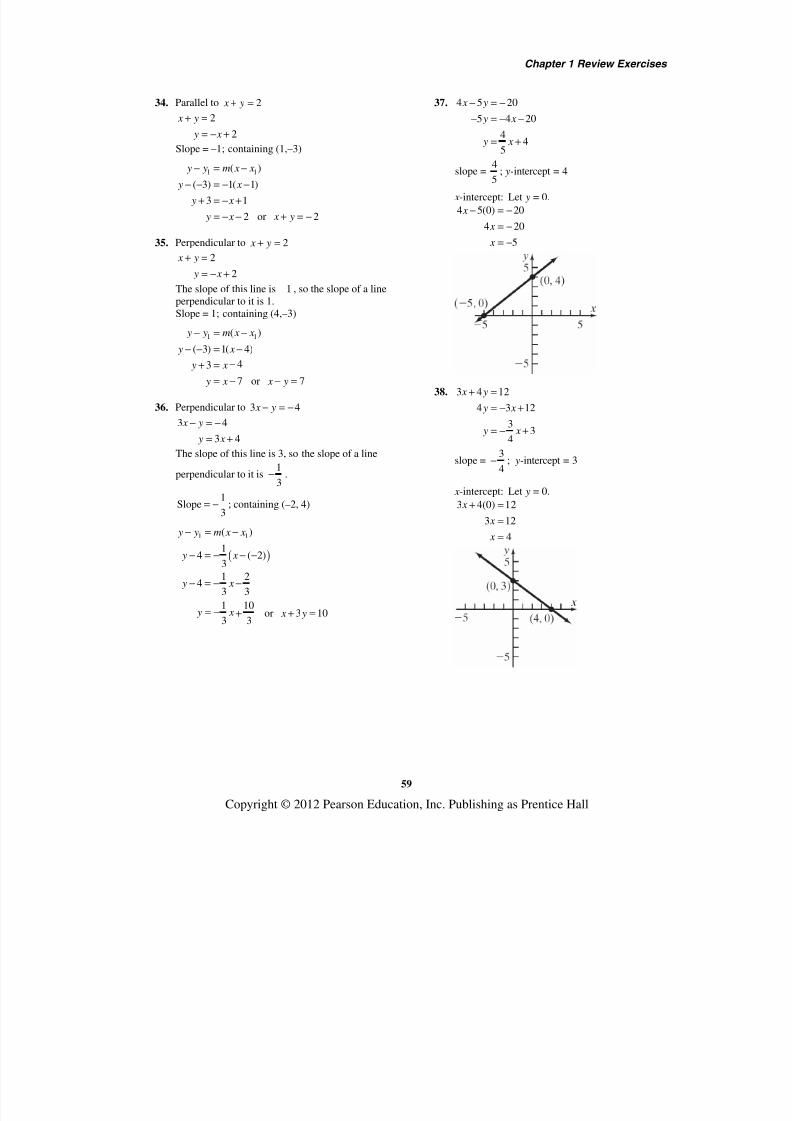
8/21/2019 PR 9e ISM 01, Graphs
http://slidepdf.com/reader/full/pr-9e-ism-01-graphs 59/65
Chapter 1 Review Exercises
59
Copyright © 2012 Pearson Education, Inc. Publishing as Prentice Hall
34. Parallel to 2 x y+ =
2
2
x y
y x
+ =
= − +
Slope = –1; containing (1,–3)
1 1( )
( 3) 1( 1)
3 1
2 or 2
y y m x x
y x
y x
y x x y
− = −
− − = − −
+ = − +
= − − + = −
35. Perpendicular to 2 x y+ =
2
2
x y
y x
+ =
= − +
The slope of this line is 1− , so the slope of a lineperpendicular to it is 1.Slope = 1; containing (4,–3)
1 1( )
( 3) 1( 4)
43
7 or 7
y y m x x
y x
y x
y x x y
− = −
− − = −
−+ =
= − − =
36. Perpendicular to 3 4 x y− = −
3 4
3 4
x y
y x
− = −
= +
The slope of this line is 3, so the slope of a line
perpendicular to it is1
3− .
1Slope
3= − ; containing (–2, 4)
( )
1 1( )
14 ( 2)
3
1 24
3 3
1 10 or 3 10
3 3
y y m x x
y x
y x
y x x y
− = −
− = − − −
− = − −
= − + + =
37. 4 5 20
5 4 20
44
5
x y
y x
y x
− = −
− = − −
= +
slope = 45
; y-intercept = 4
x -intercept: Let y = 0.
4 5(0) 20
4 20
5
x
x
x
− = −
= −
= −
38. 3 4 12
4 3 12
33
4
x y
y x
y x
+ =
= − +
= − +
slope =3
4− ; y-intercept = 3
x -intercept: Let y = 0.3 4(0) 12
3 12
4
x
x
x
+ =
=
=
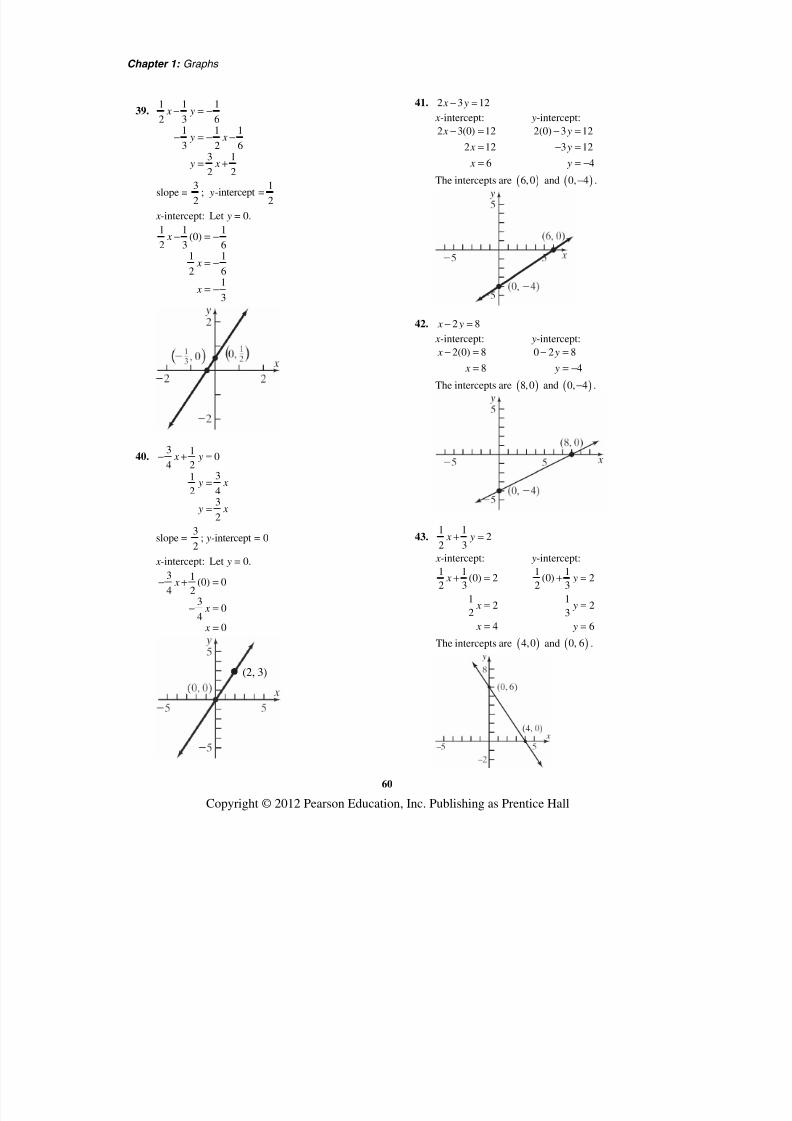
8/21/2019 PR 9e ISM 01, Graphs
http://slidepdf.com/reader/full/pr-9e-ism-01-graphs 60/65
Chapter 1: Graphs
60
Copyright © 2012 Pearson Education, Inc. Publishing as Prentice Hall
39. 1 1 1
2 3 61 1 1
3 2 63 1
2 2
x y
y x
y x
− = −
− = − −
= +
slope =3
2;
1-intercept
2 y =
x -intercept: Let y = 0.
1 1 1(0)
2 3 61 1
2 61
3
x
x
x
− = −
= −
= −
40. 3 1
04 2
31
2 43
2
x y
y x
y x
− + =
=
=
slope =3
2; y-intercept = 0
x -intercept: Let y = 0.
3 1(0) 0
4 23
04
0
x
x
x
− + =
− =
=
(2, 3)
41. 2 3 12 x y− =
x-intercept: y-intercept:
2 3(0) 12
2 12
6
x
x
x
− =
=
=
2(0) 3 12
3 12
4
y
y
y
− =
− =
= −
The intercepts are ( )6,0 and ( )0, 4− .
42. 2 8 x y− = x-intercept: y-intercept:
2(0) 8
8
x
x
− =
=
0 2 8
4
y
y
− =
= −
The intercepts are ( )8,0 and ( )0, 4− .
43.1 1
22 3
x y+ =
x-intercept: y-intercept:
1 1(0) 2
2 3
12
2
4
x
x
x
+ =
=
=
1 1
(0) 22 3
12
3
6
y
y
y
+ =
=
=
The intercepts are ( )4,0 and ( )0, 6 .
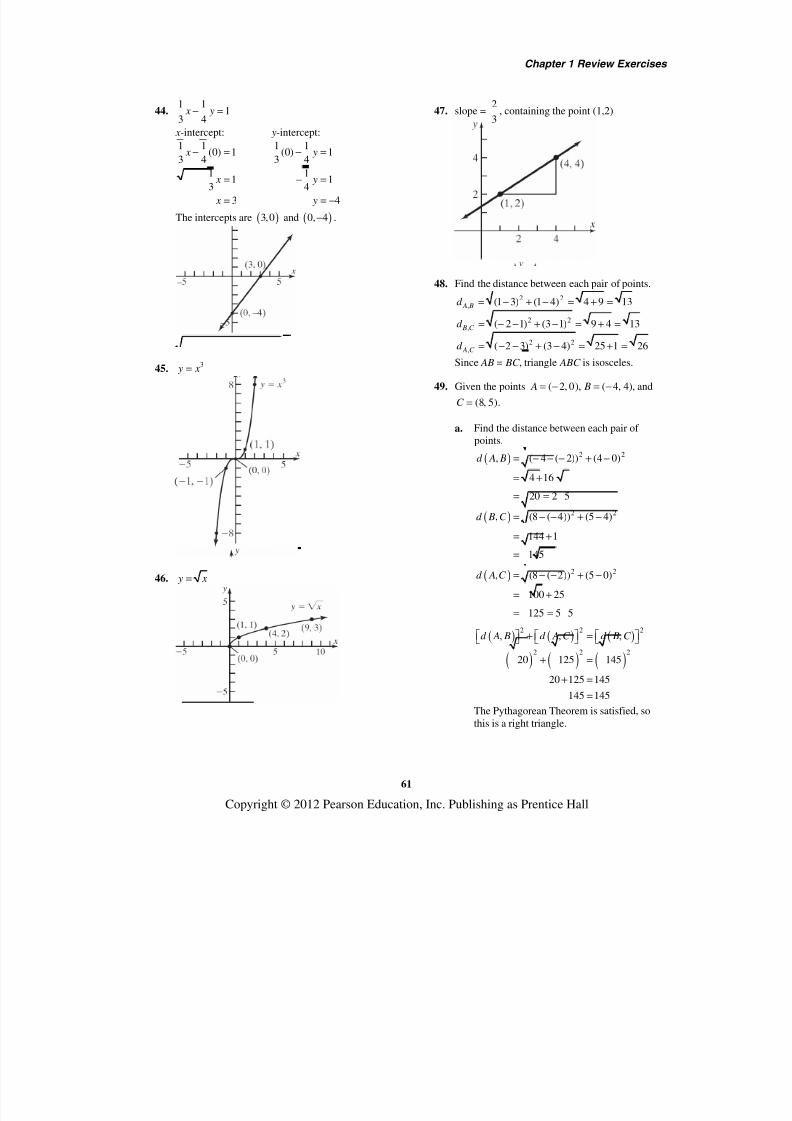
8/21/2019 PR 9e ISM 01, Graphs
http://slidepdf.com/reader/full/pr-9e-ism-01-graphs 61/65
Chapter 1 Review Exercises
61
Copyright © 2012 Pearson Education, Inc. Publishing as Prentice Hall
44.1 1
13 4 x y− =
x-intercept: y-intercept:
1 1(0) 1
3 41
13
3
x
x
x
− =
=
=
1 1
(0) 1
3 41
14
4
y
y
y
− =
− =
= −
The intercepts are ( )3,0 and ( )0, 4− .
45. 3 y x =
46. y x =
47. slope =2
3, containing the point (1,2)
48. Find the distance between each pair of points.
2 2,
2 2
,
2 2,
(1 3) (1 4) 4 9 13
( 2 1) (3 1) 9 4 13
( 2 3) (3 4) 25 1 26
A B
B C
A C
d
d
d
= − + − = + =
= − − + − = + =
= − − + − = + =
Since AB = BC , triangle ABC is isosceles.
49. Given the points ( 2, 0), ( 4, 4), A B= − = − and
(8, 5).C =
a. Find the distance between each pair ofpoints.
( )
( )
( )
2 2
2 2
2 2
, ( 4 ( 2)) (4 0)
4 16
20 2 5
, (8 ( 4)) (5 4)
144 1
145
, (8 ( 2)) (5 0)
100 25
125 5 5
d A B
d B C
d A C
= − − − + −
= +
= =
= − − + −
= +
=
= − − + −
= +
= =
( ) ( ) ( )
( ) ( ) ( )
2 2 2
2 2 2
, , ,
20 125 145
20 125 145
145 145
d A B d A C d B C + =
+ =
+ =
=
The Pythagorean Theorem is satisfied, sothis is a right triangle.

8/21/2019 PR 9e ISM 01, Graphs
http://slidepdf.com/reader/full/pr-9e-ism-01-graphs 62/65
Chapter 1: Graphs
62
Copyright © 2012 Pearson Education, Inc. Publishing as Prentice Hall
b. Find the slopes:
( )
( )
4 0 42
4 ( 2) 2
5 4 18 4 12
5 0 5 1
8 2 10 2
AB
BC
AC
m
m
m
−= = = −
− − − −
−= =− −
−= = =
− −
Since1
2 12
AB AC m m⋅ = − ⋅ = − , the sides AB
and AC are perpendicular and the triangle isa right triangle.
50. Endpoints of the diameter are (–3, 2) and (5,–6).The center is at the midpoint of the diameter:
Center:
( )
( )
2 63 5
, 1, 22 2
+ − − +
= −
Radius: 2 2(1 ( 3)) ( 2 2)
16 16
32 4 2
r = − − + − −
= +
= =
Equation: ( ) ( ) ( )
( ) ( )
22 2
2 2
1 2 4 2
1 2 32
x y
x y
− + + =
− + + =
51. 1 5
slope of 1
6 21 5
slope of 18 2
1 1slope of 1
8 6
AB
AC
BC
−= = −
−− −
= = −−
− −= = −
−
Therefore, the points lie on a line.
52. Answers will vary.
53. a. The graph of 0 x = is a vertical line passing
through the origin. That is, 0 x = is the
equation of the y-axis.
b. The grapy of 0 y = is a horizontal linepassing through the origin. That is, 0 y = is
the equation of the x-axis.
c. 0 x y
y x
+ =
= −
The graph of 0 x y+ = is line passing
through the origin with slope = –1.
d. 0
0 or 0
xy
y x
=
= =
The graph of 0 xy = consists of the
coordinate axes.
e. 2 2 0
0 and 0
x y
y x
+ =
= =
The graph of 2 2 0 x y+ = is consists of the
origin.
Chapter 1 Test
1. ( ) ( )
( )
2 2
1 2
22
( , ) 5 ( 1) 1 3
6 436 16
52 2 13
d P P = − − + − −
= + −= +
= =
2. The coordinates of the midpoint are:
( )
1 2 1 2( , ) ,2 2
3 ( 1)1 5,
2 2
4 2,
2 2
2,1
x x y y x y
+ + =
+ −− + =
=
=
3. a. 2 1
2 1
1 3 4 2
5 ( 1) 6 3
y ym
x x
− − − −= = = = −
− − −
b. If x increases by 3 units, y will decrease
by 2 units.

8/21/2019 PR 9e ISM 01, Graphs
http://slidepdf.com/reader/full/pr-9e-ism-01-graphs 63/65
Chapter 1 Test
63
Copyright © 2012 Pearson Education, Inc. Publishing as Prentice Hall
4. 2 9 y x = −
5. 2 y x =
y
x 10
5
−5
(1, 1)
(0, 0)
(9, 3)(4, 2)
2 y x =
(1,−1)(4,−2)
(9,−3)
6. 2 9 x y+ =
x-intercepts: y-intercept:2
2
0 9
9
3
x
x
x
+ =
=
= ±
2(0) 9
9
y
y
+ =
=
The intercepts are ( )3, 0 ,− ( )3,0 , and ( )0, 9 .Test x-axis symmetry: Let y y= −
( )2
2
9
9 different
x y
x y
+ − =
− =
Test y-axis symmetry: Let x x = −
( )2
2
9
9 same
x y
x y
− + =
+ =
Test origin symmetry: Let x x = − and y y= −
( ) ( )2
2
9
9 different
x y
x y
− + − =
− =
Therefore, the graph will have y-axis symmetry.
7. Slope = 2− ; containing (3, 4)−
1 1( )
( 4) 2( 3)
4 2 6
2 2
y y m x x
y x
y x
y x
− = −
− − = − −
+ = − +
= − +
8.2 2 2( ) ( ) x h y k r − + − =
( ) ( )
( ) ( )
2 2 2
2 2
4 ( 3) 5
4 3 25
x y
x y
− + − − =
− + + =
General form: ( ) ( )2 2
2 2
2 2
4 3 25
8 16 6 9 25
8 6 0
x y
x x y y
x y x y
− + + =
− + + + + =
+ − + =
9.2 2
2 2
2 2
2 2 2
4 2 4 0
4 2 4
( 4 4) ( 2 1) 4 4 1
( 2) ( 1) 3
x y x y
x x y y
x x y y
x y
+ + − − =
+ + − =
+ + + − + = + +
+ + − =
Center: (–2, 1); Radius = 3
y
x −5 5
5
−5
(−2, 1)

8/21/2019 PR 9e ISM 01, Graphs
http://slidepdf.com/reader/full/pr-9e-ism-01-graphs 64/65
Chapter 1: Graphs
64
Copyright © 2012 Pearson Education, Inc. Publishing as Prentice Hall
10. 2 3 6
3 2 6
22
3
x y
y x
y x
+ =
= − +
= − +
Parallel lineAny line parallel to 2 3 6 x y+ = has slope
2
3m = − . The line contains (1, 1)− :
1 1( )
2( 1) ( 1)
3
2 21
3 3
2 1
3 3
y y m x x
y x
y x
y x
− = −
− − = − −
+ = − +
= − −
Perpendicular line
Any line perpendicular to 2 3 6 x y+ = has slope
3
2m = . The line contains (0, 3) :
1 1( )
33 ( 0)
2
33
2
33
2
y y m x x
y x
y x
y x
− = −
− = −
− =
= +
Chapter 1 Projects
1. Men: Let ( ) ( )1 1, 1992, 2.22 x y = and
( ) ( )2 2, 1996, 2.21 . x y =
2 1
2 1
2.21 2.22 0.010.0025
1996 1992 4
y ym
x x
− − −= = = = −
− −
( )
( )
1 1
2.22 0.0025 19922.22 0.0025 4.98
0.0025 7.20
y y m x x
y x
y x
y x
− = −
− = − −
− = − +
= − +
Women: Let ( ) ( )1 1, 1992, 2.54 x y = and
( ) ( )2 2, 1996, 2.43 . x y =
2 1
2 1
2.43 2.54 0.110.0275
1996 1992 4
y ym
x x
− − −= = = = −
− −
( )
( )1 1
2.54 0.0275 1992
2.54 0.0275 54.78
0.0275 57.32
y y m x x
y x
y x
y x
− = −
− = − −
− = − +
= − +
2. Men: The slope 0.0025m = − indicates that the
winning times for men in the Olympic marathonare decreasing at an average rate of 0.0025 hourper year.
Women: The slope 0.0275m = − indicates that
the winning times for women in the Olympicmarathon are decreasing at an average rate of0.0275 hour per year.
The y-intercepts do not have reasonableinterpretations. In this case, the y-interceptswould indicate the winning times of themarathons in the year 0, which is not reasonablebecause it is too far away from the data on whichour equations are based.
3. Men: If x = 2004, then
0.0025(2004) 7.20 2.19 y = − + = hours. This
compares reasonably well to the actual result of2.18 hours.
Women: If x = 2004, then0.0275(2004) 57.32 2.21 y = − + = hours. This
does not compare well to the actual result of 2.44hours.
4. (1) Men: Let ( ) ( )1 1, 1996, 2.21 x y = and
( ) ( )2 2, 2000, 2.17 . x y =
2 1
2 1
2.17 2.21 0.040.01
2000 1996 4
y ym
x x
− − −= = = = −
− −
( )
( )1 1
2.21 0.01 1996
2.21 0.01 19.960.01 22.17
y y m x x
y x
y x y x
− = −
− = − −
− = − += − +

8/21/2019 PR 9e ISM 01, Graphs
http://slidepdf.com/reader/full/pr-9e-ism-01-graphs 65/65
Chapter 1 Projects
Women: Let ( ) ( )1 1, 1996, 2.43 x y = and
( ) ( )2 2, 2000, 2.39 . x y =
2 1
2 1
2.39 2.43 0.040.01
2000 1996 4
y ym
x x
− − −= = = = −
− −
( )
( )1 1
2.39 0.01 1996
2.39 0.01 19.96
0.01 22.35
y y m x x
y x
y x
y x
− = −
− = − −
− = − +
= − +
(2) Men: The slope 0.01m = − indicates that
the winning times for men in the Olympicmarathon are decreasing at a rate of 0.01hour per year.
Women: The slope 0.01m = − indicates
that the winning times for women in the
Olympic marathon are decreasing at a rateof 0.01 hour per year.
The y-intercepts do not have reasonableinterpretations. In this case, the y-interceptswould indicate the winning times of themarathons in the year 0, which is notreasonable because it is too far away fromthe data on which our equations are based.
(3) Men: If x = 2004, then
0.01(2004) 22.17 2.13 y = − + = hours. This
prediction is not extremely accurate, but itdoes compare reasonably well to the actual
result of 2.18 hours.Women: If x = 2004, then
0.01(2004) 22.35 2.31 y = − + = hours. This
does not compare well to the actual result of2.44 hours.
5. No. The year 2104 is too far away from the dataon which our equations are based.
6. Answers will vary.


![Management 9e [Bateman]](https://img.pdfslide.us/doc/110x75/55cf9cbe550346d033aae180/management-9e-bateman.jpg)
