Embed Size (px)
Citation preview
cィ。イ。」エ・イゥコ。エゥッョ@ッヲ@dゥヲヲ・イ・ョエ@cィ・ュゥ」。ャ@bャッキゥョァ@aァ・ョエウ@。ョ、@tィ・ゥイ@aーーャゥ」。「ゥャゥエケ@エッpイッ、オ」・@pッャケHl。」エゥ」@a」ゥ、I@fッ。ュウ@「ケ@eクエイオウゥッョ
kュ・エエケ@NL@lゥエ。オウコォゥ@kNL@r←エゥ@dN
a」」・ーエ・、@ヲッイ@ーオ「ャゥ」。エゥッョ@ゥョ@aーーャゥ・、@s」ゥ・ョ」・ウpオ「ャゥウィ・、@ゥョ@RPQX
doiZ@QPNSSYPO。ーーXQPQYVP
Powered by TCPDF (www.tcpdf.org)
applied sciences
Article
Characterization of Different Chemical BlowingAgents and Their Applicability to ProducePoly(Lactic Acid) Foams by Extrusion
Ákos Kmetty 1,2,* , Katalin Litauszki 1 and Dániel Réti 1
1 Department of Polymer Engineering, Faculty of Mechanical Engineering, Budapest University of
Technology and Economics, Muegyetem rkp. 3., H-1111 Budapest, Hungary; [email protected] (K.L.);
[email protected] (D.R.)2 MTA–BME Research Group for Composite Science and Technology, Muegyetem rkp. 3.,
H-1111 Budapest, Hungary
* Correspondence: [email protected]; Tel.: +36-1-463-2004
Received: 25 September 2018; Accepted: 11 October 2018; Published: 17 October 2018�����������������
Abstract: This study presents the applicability of different types (exothermic and endothermic) of
chemical blowing agents (CBAs) in the case of poly(lactic acid) (PLA). The amount of foaming agent
is a fixed 2 wt%. We used a twin-screw extruder and added the individual components in the
form of dry mixture through the hopper of the extruder. We characterized the PLA matrix and the
chemical blowing agents with different testing methods. In case of the produced foams we carried out
morphological and mechanical tests and used scanning electron microscopy to examine cell structure.
We showed that PLA can be successfully foamed with the use of chemical blowing agents. The best
results were achieved with an exothermic CBA and with PLA type 8052D. The cell population density
of PLA foams produced this way was 4.82 × 10⁵ cells/cm3, their expansion was 2.36, their density
0.53 g/cm3 and their void fraction was 57.61%.
Keywords: chemical blowing agent; poly(lactic acid) foam; foam extrusion
1. Introduction
Nowadays the number and amount of polymers produced from renewable resources are
increasing considerably. These polymers are also readily available [1]. Global market forecasts
predict a fourfold increase until 2019 (7.8 million ton/year) [2]. Polymer foams nowadays are mostly
produced from petroleum-based materials. Foamed products, made by physical [3], chemical [4] and
bead foaming techniques [5], in addition there are innovative examples of metallic foams as well [6].
Although physical foaming technique produce a lower foam density (density reduction up to 80%),
chemical foaming agents can be used without modifying the extruder [7]. Foaming can be divided into
four sections. In the initial phase, the gas enters the polymer matrix and the two phases mix. In the
next section, the matrix material is saturated with the foaming gas at an elevated temperature and
pressure. In the third section, the homogeneous system expands as the pressure decreases. In the final
section, the structure stabilizes [8]. An important foaming method is chemical foaming, when the
foaming agent requires certain conditions to decompose and in the process a gas phase is generated as
a result of a chemical change. It is important to choose the decomposition temperature range of the
foaming agent to match the processing temperature of the matrix polymer. Chemical blowing agents
can be used in different temperature ranges. Their decomposition products are various gases. The most
important is the gas that is produced in the largest quantity [9]. Foaming agents can be endothermic
and exothermic. The most often used exothermic foaming agent is azodicarbonamide (ADCA),
even though ADCA decomposes at a relatively high temperature, at 230 ◦C. When 5% 4,4′-oxybis
Appl. Sci. 2018, 8, 1960; doi:10.3390/app8101960 www.mdpi.com/journal/applsci
Appl. Sci. 2018, 8, 1960 2 of 17
(benzenesulfonylhydrazide) (OBSH) is added, it reduces the initial temperature of decomposition
to 205 ◦C. However, this temperature is still higher than the processing temperature of some very
common polymers (e.g., P-PVC, U-PVC, EVA and PLA). With the use of activators (zinc stearate,
zinc oxide, naphthenate, urea or benozate), the decomposition temperature range can be reduced to as
low as 40 ◦C. The decomposition process typically yields 220 cm3/g gas. Its decomposition products
are nitrogen (N2) 65%, carbon monoxide (CO) 24%, carbon dioxide (CO2) 5% and ammonia (NH3)
5% [10,11]. It can produce larger cells, greatly reduce density from 1.24 g/cm3 to 0.599 g/cm3 (in
case of neat, extruded PLA) but the yellowish colour of the foaming agent affects the colour of the
product [12]. The most often used endothermic foaming agent is a mixture of sodium bicarbonate and
citric acid. It is typically whitish, can produce finer cells and less reduction in density from 1.24 g/cm3
to 0.645 g/cm3 in case of neat, extruded PLA [12–16]. Sodium bicarbonate starts to decompose at
around 160 ◦C, while citric acid only starts decomposing at around 210 ◦C. About 120 cm3/g of gas is
produced. Foaming agents working in different temperature ranges can be produced by mixing the
two components at different ratios [17,18]. Such CBAs typically have water among their decomposition
products. If the polymer matrix is sensitive to moisture (e.g., polycarbonates or polyesters), a CBA
should be chosen which does not have water among its decomposition products (or only a very small
amount) because the water can hydrolyse the polymer [9].
A great disadvantage of petroleum-based polymeric materials and products made from them is
that they are difficult and costly to recycle, cannot be decomposed biologically and are a considerable
load on the environment after they lose their function. Renewable resource-based and biodegradable
polymers offer an environmentally friendly alternative. Of all biopolymers, poly(lactic acid) (PLA)
receives the most attention nowadays [19]. PLA can be foamed in many ways (extrusion foaming,
foam injection moulding, bead foaming) but currently the application of supercritical fluid state carbon
dioxide receives the most attention [20,21].
Foaming this biopolymer with chemical blowing agents is not fully researched yet. Commercially
available CBAs are mostly designed for the foaming of petroleum-based polymers and their
applicability with biodegradable polymers needs more research [22]. Our goal was to analyse a
wide range of commercially widely available conventional exothermic and endothermic foaming
agents so we selected two endothermic, one exothermic CBAs recommended for polyesters and a new
endothermic CBA specially designed for the foaming of PLA. Such a CBA, especially recommended
for PLA, has never been examined in the literature. We characterized these CBAs and investigated
their applicability for PLA in detail, using continuous extrusion as manufacturing technology.
2. Materials and Methods
2.1. Material
We used poly(lactic acid) type 2003D (4.3 mol% D-lactide content) and 8052D (4.5 mol% D-lactide
content), (Ingeo™ Biopolymer, NatureWorks© LLC, Minnetonka, MN, USA). The PLAs have a melting
temperature of 150.9 ◦C and of 153.3 ◦C (determined by DSC from the first melting curve, 5 ◦C/min),
a Melt Flow Index of 2 g/10 min and 7 g/10 min (CEAST 7027.000, 2.16 kg, 190 ◦C), respectively,
as measured by the authors. The number average molecular weight was 100,422 Da, the weight average
molecular weight was 180,477 Da, the polydispersity index was 1.79, the number average molecular
weight was 85,562 Da, the weight average molecular weight 153,235 Da and the polydispersity index
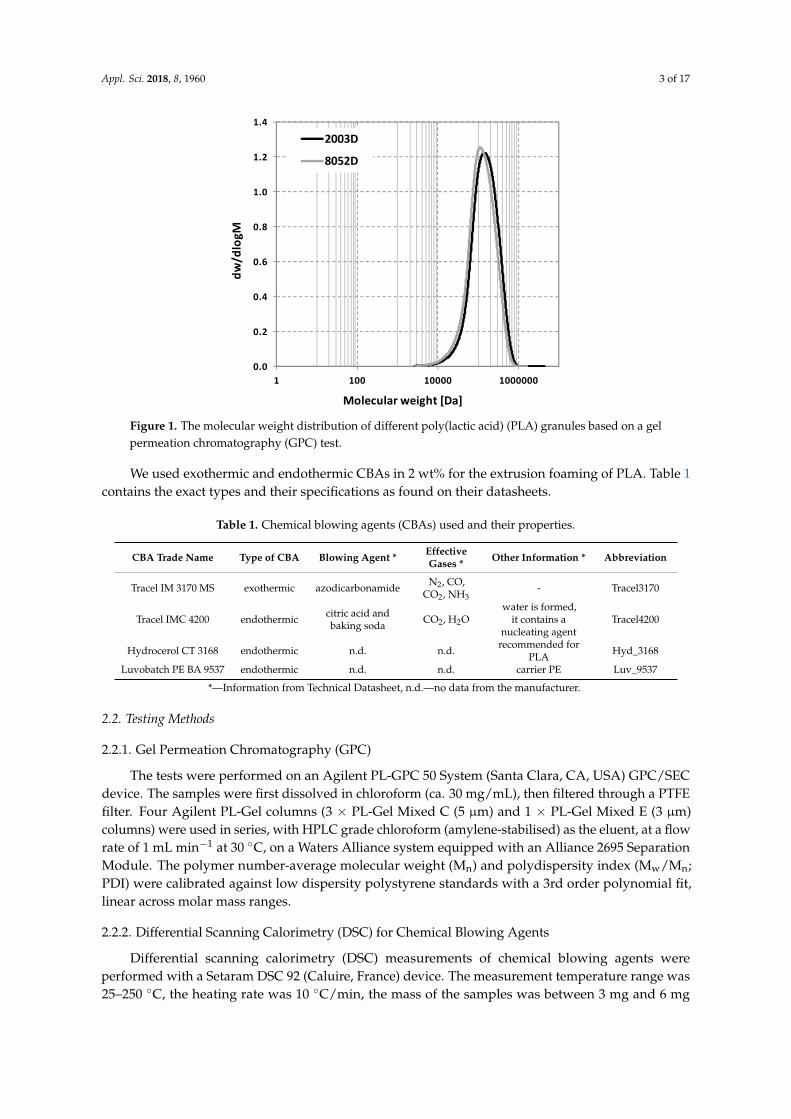
was 1.79 (Figure 1, determined by gel permeation chromatography (GPC) measurements).
Appl. Sci. 2018, 8, 1960 3 of 17
The molecular weight distribution of different poly(lactic acid) (PLA) gra
μ μ
−
.
.
.
.
.8
.
.
.
dw/d
logM
Molecular weight [Da]
D8 D
Figure 1. The molecular weight distribution of different poly(lactic acid) (PLA) granules based on a gel
permeation chromatography (GPC) test.
We used exothermic and endothermic CBAs in 2 wt% for the extrusion foaming of PLA. Table 1
contains the exact types and their specifications as found on their datasheets.
Table 1. Chemical blowing agents (CBAs) used and their properties.
CBA Trade Name Type of CBA Blowing Agent *EffectiveGases *
Other Information * Abbreviation
Tracel IM 3170 MS exothermic azodicarbonamideN2, CO,
CO2, NH3- Tracel3170
Tracel IMC 4200 endothermiccitric acid andbaking soda
CO2, H2Owater is formed,
it contains anucleating agent
Tracel4200
Hydrocerol CT 3168 endothermic n.d. n.d.recommended for
PLAHyd_3168
Luvobatch PE BA 9537 endothermic n.d. n.d. carrier PE Luv_9537
*—Information from Technical Datasheet, n.d.—no data from the manufacturer.
2.2. Testing Methods
2.2.1. Gel Permeation Chromatography (GPC)
The tests were performed on an Agilent PL-GPC 50 System (Santa Clara, CA, USA) GPC/SEC
device. The samples were first dissolved in chloroform (ca. 30 mg/mL), then filtered through a PTFE
filter. Four Agilent PL-Gel columns (3 × PL-Gel Mixed C (5 µm) and 1 × PL-Gel Mixed E (3 µm)
columns) were used in series, with HPLC grade chloroform (amylene-stabilised) as the eluent, at a flow
rate of 1 mL min−1 at 30 ◦C, on a Waters Alliance system equipped with an Alliance 2695 Separation
Module. The polymer number-average molecular weight (Mn) and polydispersity index (Mw/Mn;
PDI) were calibrated against low dispersity polystyrene standards with a 3rd order polynomial fit,
linear across molar mass ranges.
2.2.2. Differential Scanning Calorimetry (DSC) for Chemical Blowing Agents
Differential scanning calorimetry (DSC) measurements of chemical blowing agents were
performed with a Setaram DSC 92 (Caluire, France) device. The measurement temperature range was
25–250 ◦C, the heating rate was 10 ◦C/min, the mass of the samples was between 3 mg and 6 mg
Appl. Sci. 2018, 8, 1960 4 of 17
and the tests were performed in nitrogen protective gas (20 mL/min) and with a nitrogen measuring
atmosphere (20 mL/min).
2.2.3. Differential Scanning Calorimetry (DSC) for Biopolymer Foams
Differential scanning calorimetry (DSC) measurements of biopolymer foams were carried out
with a TA Instruments Q2000 (New Castle, DE, USA) automatic sampling device. The measurement
temperature range was 0–200 ◦C, the heating rate was 5 ◦C/min, the mass of the samples was between
3 mg and 6 mg and the tests were performed in nitrogen protective gas (20 mL/min) and with a
nitrogen measuring atmosphere (20 mL/min). The degree of crystallinity (χc) was calculated according
to Equation 1, where ∆Hm is the crystallization enthalpies. The degree of crystallinity (χcf) created
via foam processing was calculated according to Equation (2), where ∆Hm is the melt and ∆Hc is the
crystallization enthalpy. PLA100% is the theoretical melting enthalpy of 100% crystalline PLA, which is
93 J/g [23].
χc =∆Hm
PLA100%x 100 [%], (1)
χcf =∆Hm − |∆Hc|
PLA100%x 100 [%], (2)
2.2.4. Thermogravimetric Analysis-Fourier-Transform Infrared Spectrometry (TGA-FTIR)
In the TGA-FTIR test, the two devices were connected so that the gas phases released in the TGA
test travel through the sensors of the FTIR device. The gases went through a silicon tube; flow was
maintained with nitrogen background gas. The FTIR test can determine the chemical composition of
the gas from the TGA test. With this method, the composition of the gas can be determined across
the whole temperature range. The TGA-FTIR measurements were performed with a TA Instruments
Q5000 (New Castle, DE, USA) automatic sampling device. The measurement temperature range was
40–800 ◦C, the heating rate was 10 ◦C/min, the mass of the samples was between 1 mg and 4 mg
and the tests were performed in nitrogen protective gas (25 mL/min) and with nitrogen measuring
atmosphere (50 mL/min). The TGA device was connected to a Bruker Tensor 37 FTIR (Billerica,
MA, USA) device. Gas was released at different temperatures in the case of the different CBAs and
the spectrum was evaluated at the maximum of effective gas generation in each case (in the case
of Tracel3170 it was 190 ◦C, in the case of Tracel4200 it was 175 ◦C, in the case of Luv_9537 it was
157 ◦C, while in the case of Hyd_3168 it was 232 ◦C). We took into account the effective gases which
are generated below manufacturing temperature.
2.2.5. Thermogravimetric Analysis Performed in Isothermal Conditions
TGA measurements were performed with a TA Instruments Q500 (New Castle, DE, USA)
automatic sampling device. The measurement temperature was 190 ◦C, the heating rate was
100 ◦C/min, the mass of the samples was between 1 mg and 4 mg and the tests were performed
in nitrogen protective gas (40 mL/min) and with industrial air measuring atmosphere (60 mL/min).
These conditions are closer to those in an extruder. The isothermal temperature was chosen to be
190 ◦C because this is a usual processing temperature during the extrusion of PLA. The background
gas was chosen to be air, because the CBA may get into contact with air during the manufacturing
process. The samples reached the isothermal 190 ◦C in 3 min and they were kept at this temperature
for another 330 s.
2.2.6. Scanning Electron Microscopy (SEM)
Scanning electron micrographs were taken from fracture surfaces with a Jeol JSM-6380LA (Tokyo,
Japan) SEM with an acceleration voltage of 10 kV. Prior to the test, the samples were sputter-coated
with a gold/palladium alloy.
Appl. Sci. 2018, 8, 1960 5 of 17
2.2.7. Foam Characterisation
The volume of foam structures was measured with a 10 mL glass cylinder (accuracy 0.1 cm3);
the measuring medium was distilled water. Mass was measured with a Sartorius BP121S type balance
(Göttingen, Germany). Its range is 120 g, its measuring accuracy is 0.1 mg and its resolution is 0.1 mg.
Density was calculated according to Equation (3).
ρfoam =mfoam
Vfoam, (3)
Void fraction was calculated according to Equation (4) [24].
Vf = 1 −ρfoam
ρpolymer, (4)
where Vf [-] is void fraction, ρfoam is the density of the foamed polymer and ρpolymer is the density of
unfoamed polymer.
Cell population density was calculated based on the SEM images, according to Equation (5),
where n is the number of cells counted in the recorded image, A [cm2] is the cross section area of the
sample, M [-] is the magnification factor and ER [-] is the expansion ratio [24].
Nc =
(
n ∗ M2
A
)32
x1
1 − Vf, (5)
The expansion ratio was calculated with Equation (6), where ER is the rate of expansion, ρfoam is
the density of the foamed polymer, ρpolymer is the density of unfoamed polymer and Vf is the void
fraction [16].
ER =ρpolymer
ρfoam=
1
1 − Vf, (6)
2.2.8. Measuring Foam Strength
Foam compressive strength tests were performed with a Zwick Z005 (Ulm, Germany) universal
testing machine (in compression mode). A Mess & Regeltechnik KAP-TC (Dresden, Germany) type
load cell was used (measuring range 0–5000 N, preload 1 N). The measurement speed applied was
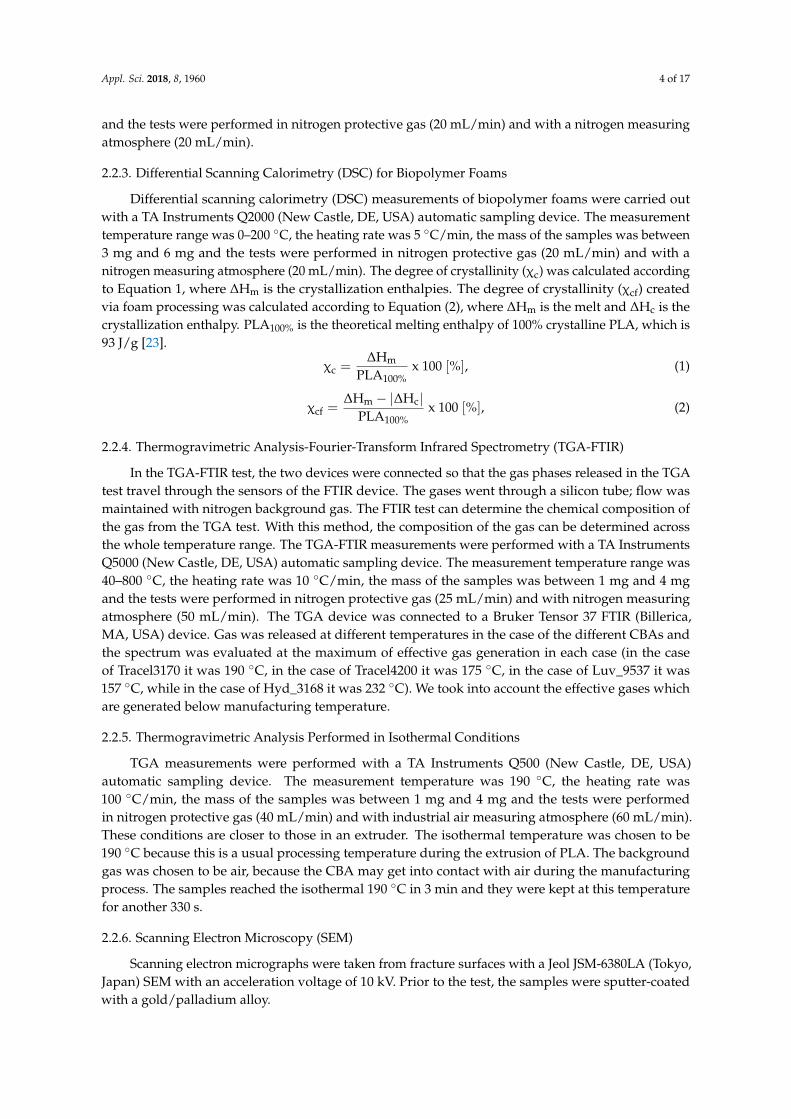
2 mm/min. The specimens were cylindrical, with a diameter of 3 mm and a height of 10 mm (Figure 2).
The test was continued until a deformation of 10% was reached. Five samples were tested and the
average of the results was taken. Foam compressive strength was calculated in accordance with
Equation (7).
σ10% =F10%
Afoam, (7)
where compressive strength [MPa] is the compression strength at 10% deformation, F10% [N] is the
force at 10% deformation and Afoam [mm2] is the cross-sectional area of the foam specimen.
Extrusion foaming was carried out with a Teach-line ZK25T (Collin GmbH, Ebersberg, Germany)
twin-screw extruder (screw diameter: 25 mm, L/D = 24). The temperature profiles of the five
zones starting from the hopper were 155 ◦C, 160 ◦C, 175 ◦C, 190 ◦C and 190 ◦C. Screw speed was
10 revolutions per minute, the residence time of the polymer was 330 s, pressure drop [MPa] was
calculated according to Equation (8), where pmelt [MPa] is the pressure that we measured during
extrusion in the die, patm [MPa] is the standard atmospheric pressure, 0,1 MPa. The extrusion die was
a rod type with a circular cross section and with a nominal diameter of 3 mm. All foaming agents
were added to the PLA granules during extrusion in an amount of 2 wt%, by dry mixing. Prior to
manufacturing, the PLA granules were dried at 80 ◦C for 6 h in a WGL-45B type drying oven.
Pressure drop = pmelt − patm (8)
Appl. Sci. 2018, 8, 1960 6 of 17
ppPressure drop = p − p
Figure 2. Measurement layout of measuring foam strength.
3. Results of the Investigation of the Foaming Agents
3.1. The Thermal and Morphological Properties of CBAs, TGA, TGA-FTIR, DSC
First, we examined the decomposition temperature ranges of chemical foaming agents by TGA.
The test showed the mass fraction of the CBAs, the fraction of the gas producer useful from the aspect
of foaming and what is the proportion of carrier polymer and other residual materials. The samples
were measured with two background gases, so it was possible to compare the processes occurring
in the different media. We used a nitrogen (N2) atmosphere to get measurement results from an
inert atmosphere, while air was used because that is what is present during extrusion; therefore,
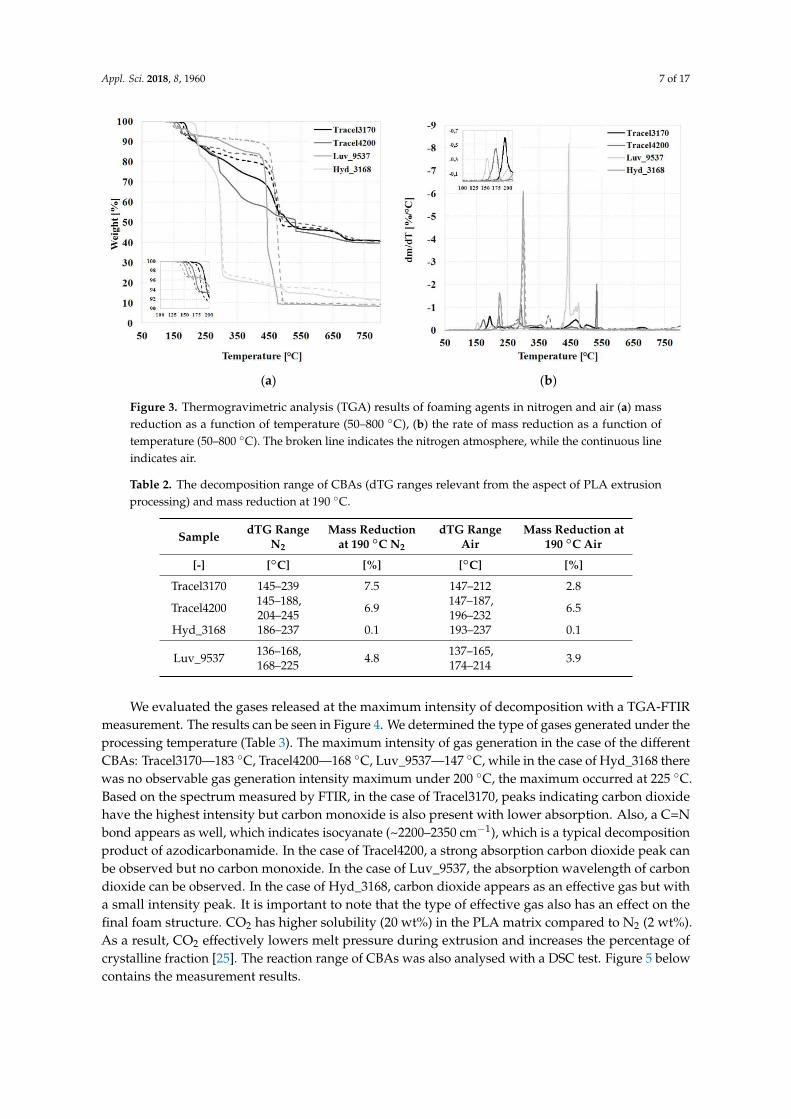
the measurement approximates real-life extrusion better. Figure 3 shows that the decomposition of
CBAs occurred in several steps. In the case of Luv_9537, mass reduction starts at 136 ◦C, this CBA is
followed by Tracel4200, then Tracel3170. While in the case of the exothermic Tracel3170, mass reduction
occurs in one step up to 200 ◦C, the endothermic Tracel4200 and Luv_9537 exhibit mass reduction
in two steps. Between 150–250 ◦C during the thermal decomposition of CBAs probably effective
gases, taking an active part in foaming are released, above this temperature it is likely that the carrier
materials decompose. In the case of Hyd_3168 and Luv_9537, a great reduction of mass can be observed
at 300 ◦C and 444 ◦C, while in the case of Tracel3170 and 4200, an extended gradual decrease can
be observed at low intensity. Comparing the same measurements in N2 and air, we can conclude
that gas formation occurs in the same temperature range. In air, the curve is continuously sloping,
while in nitrogen the decomposition ranges separate; the degradation of the carrier polymer and the
accompanying mass reduction only starts at around 400 ◦C. Table 2 contains the measurement results:
the decomposition temperature ranges based on dTG and the percentage ratio of mass reduction at
190 ◦C. The data indicate that in the case of the investigated CBAs, in nitrogen and air atmosphere,
at 190 ◦C, mass reduction was nearly the same. There is a greater difference only in the case of
Tracel3170; in nitrogen mass reduction was 7.5%, while in air it was only 2.8%. The greatest mass
reduction in nitrogen was observed in the case of Tracel3170 (7.5%), it is followed by Tracel4200 (6.9%),
Luv_9537 (4.8%) and Hyd_3168 (0.1%). The data indicate that Hyd_3168 probably cannot produce a
foam at 190 ◦C, the characteristic processing temperature of PLA. All four foaming agents produced
residual mass at 800 ◦C, which is probably a nucleating agent.
Appl. Sci. 2018, 8, 1960 7 of 17
(a) (b)
Figure 3. Thermogravimetric analysis (TGA) results of foaming agents in nitrogen and air (a) mass
−
Figure 3. Thermogravimetric analysis (TGA) results of foaming agents in nitrogen and air (a) mass
reduction as a function of temperature (50–800 ◦C), (b) the rate of mass reduction as a function of
temperature (50–800 ◦C). The broken line indicates the nitrogen atmosphere, while the continuous line
indicates air.
Table 2. The decomposition range of CBAs (dTG ranges relevant from the aspect of PLA extrusion
processing) and mass reduction at 190 ◦C.
SampledTG Range
N2
Mass Reductionat 190 ◦C N2
dTG RangeAir
Mass Reduction at190 ◦C Air
[-] [◦C] [%] [◦C] [%]
Tracel3170 145–239 7.5 147–212 2.8
Tracel4200145–188,204–245
6.9147–187,196–232
6.5
Hyd_3168 186–237 0.1 193–237 0.1
Luv_9537136–168,168–225
4.8137–165,174–214
3.9
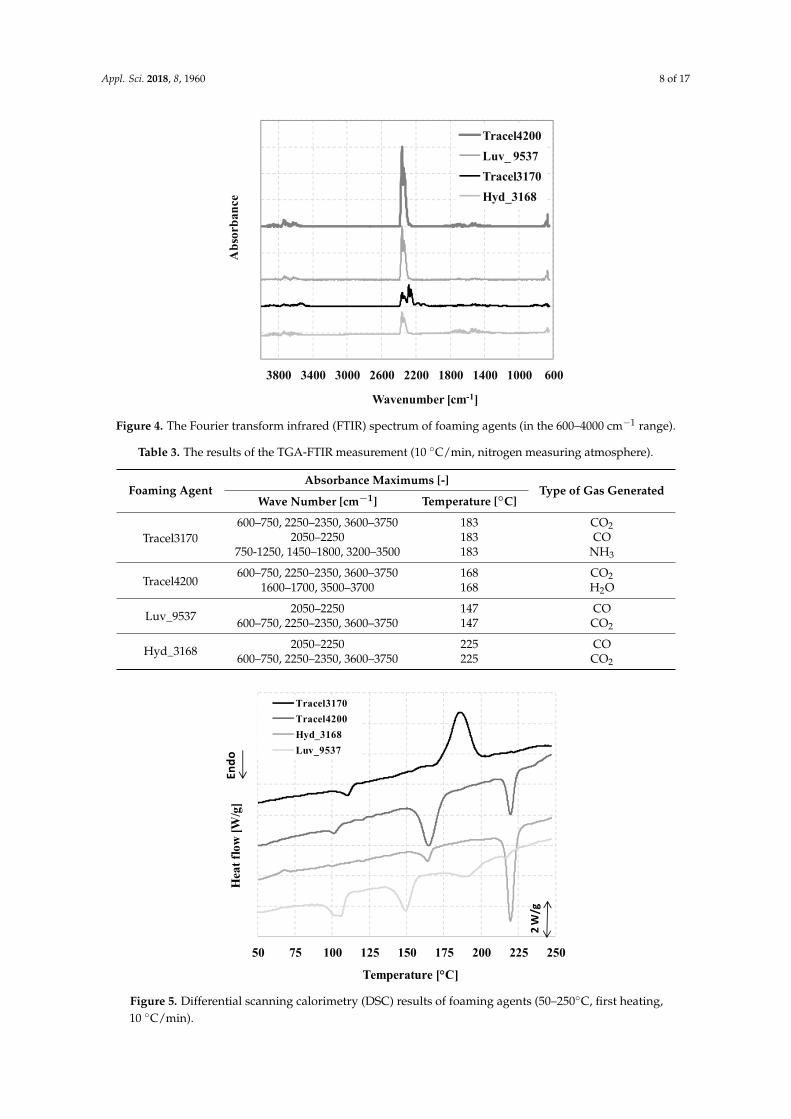
We evaluated the gases released at the maximum intensity of decomposition with a TGA-FTIR
measurement. The results can be seen in Figure 4. We determined the type of gases generated under the
processing temperature (Table 3). The maximum intensity of gas generation in the case of the different
CBAs: Tracel3170—183 ◦C, Tracel4200—168 ◦C, Luv_9537—147 ◦C, while in the case of Hyd_3168 there
was no observable gas generation intensity maximum under 200 ◦C, the maximum occurred at 225 ◦C.
Based on the spectrum measured by FTIR, in the case of Tracel3170, peaks indicating carbon dioxide
have the highest intensity but carbon monoxide is also present with lower absorption. Also, a C=N
bond appears as well, which indicates isocyanate (~2200–2350 cm−1), which is a typical decomposition
product of azodicarbonamide. In the case of Tracel4200, a strong absorption carbon dioxide peak can
be observed but no carbon monoxide. In the case of Luv_9537, the absorption wavelength of carbon
dioxide can be observed. In the case of Hyd_3168, carbon dioxide appears as an effective gas but with
a small intensity peak. It is important to note that the type of effective gas also has an effect on the
final foam structure. CO2 has higher solubility (20 wt%) in the PLA matrix compared to N2 (2 wt%).
As a result, CO2 effectively lowers melt pressure during extrusion and increases the percentage of
crystalline fraction [25]. The reaction range of CBAs was also analysed with a DSC test. Figure 5 below
contains the measurement results.
Appl. Sci. 2018, 8, 1960 8 of 17
The Fourier transform infrared (FTIR) spectrum of foaming agents (in the 600 −
−
60010001400180022002600300034003800
Abs
orba
nce
Wavenumber [cm-1]
Tracel4200Luv_ 9537Tracel3170Hyd_3168
Figure 4. The Fourier transform infrared (FTIR) spectrum of foaming agents (in the 600–4000 cm−1 range).
Table 3. The results of the TGA-FTIR measurement (10 ◦C/min, nitrogen measuring atmosphere).
Foaming AgentAbsorbance Maximums [-]
Type of Gas GeneratedWave Number [cm−1] Temperature [◦C]
Tracel3170
600–750, 2250–2350, 3600–3750 183 CO2
2050–2250 183 CO750-1250, 1450–1800, 3200–3500 183 NH3
Tracel4200600–750, 2250–2350, 3600–3750 168 CO2
1600–1700, 3500–3700 168 H2O
Luv_95372050–2250 147 CO
600–750, 2250–2350, 3600–3750 147 CO2
Hyd_31682050–2250 225 CO
600–750, 2250–2350, 3600–3750 225 CO2
ifferential scanning calorimetry (DSC) results of foaming agents (50–250°C, f
50 75 100 125 150 175 200 225 250
Hea
t flo
w [W
/g]
Temperature [°C]
Tracel3170Tracel4200Hyd_3168Luv_9537
W/g
Endo
Figure 5. Differential scanning calorimetry (DSC) results of foaming agents (50–250◦C, first heating,
10 ◦C/min).
Appl. Sci. 2018, 8, 1960 9 of 17
We compared the absorbance spectrum of generated effective gases with the intensity peaks of
the spectra of materials in the IR database of the National Institute of Standards and Technology [26].
Figure 5 shows that Tracel3170 has an exothermic conversion peak, while in the case of Tracel4200,
Luv_9537 and Hyd_3168, more endothermic reaction occurred. The conversion temperatures measured
by DSC can be compared to the temperature ranges measured by TGA and this provides more accurate
information concerning the temperature range of the decomposition process. Table 4 contains these
data. The initial chemical change temperature of DSC is nearly the same as the beginning of the
decomposition range measured by TGA but the end of the decomposition range (according to dTG)
falls a little after the end of the changing temperature range registered by DSC. This is because the DSC
data describe the changing process of the foaming agent and only the beginning part of this process is
the same as TGA. TGA, on the other hand, does not show the energy change before and after the start
of decomposition; it only registers the mass reduction effect of the decomposition product released in
the gas phase, which continues after the reaction, as well.
Table 4. Comparison of decomposition processes registered with DSC and TGA tests.
SampleDecomposition Range
According to dTG *N2
Decomposition RangeAccording to dTG *
Air
State Change **N2
[-] [◦C] [◦C] [◦C]
Tracel3170 145–239 147–212 165–200
Tracel4200145–188,204–245
147–187,196–232
150–180,210–225
Hyd_3168 186–237 193–237153–169,208–229
Luv_9537136–168,168–225
137–165,174–214
136–160,175–200
* TGA measurement, ** DSC measurement.
3.2. Isothermal Thermogravimetric Analysis
Foaming agents have to produce effective gas at the processing temperature of PLA. In the
previous tests, a constant heating rate was used (10 ◦C/min) but thermal conditions are different
during actual manufacturing. Therefore, as a next step, we investigated decomposition by TGA at
a constant temperature, 190 ◦C. Figure 6a,b show the results of the isothermal TGA test. Figure 5
shows that as a result of constant temperature, decomposition also occurs. For evaluation, however,
the results must be compared to the previous results so that any possible differences could be seen.
Table 5 contains the numerical data. Comparing the TGA and isothermal TGA measurement data,
we can draw conclusions about the behaviour of foaming agents. There is no big difference between the
results of the two types of measurement but mass reduction was greater in the case of the isothermal
process. The biggest difference was observed in the case of Tracel3170, where isothermal mass reduction
was 4.9%, which is 2.1% greater than in the case of a constant heating rate. There is a difference in the
case of the other three foaming agents too but it is smaller.
Appl. Sci. 2018, 8, 1960 10 of 17
(a) (b)
Figure 6. TGA decomposition of foaming agents at 190 °C in isothermal conditions in a measuring
Figure 6. TGA decomposition of foaming agents at 190 ◦C in isothermal conditions in a measuring
atmosphere of air (a) mass reduction as a function of time, (b) dTG as a function of time (the blue line
shows the moment of reaching 190 ◦C).
Table 5. The decomposition range of CBAs at an isothermal temperature.
SampleMass Reduction
(10 ◦C/min, 190 ◦C) AirMass Reduction
(Isothermal, 190 ◦C, 330 s) Air
[-] [%] [%]
Tracel3170 2.8 4.9Tracel4200 6.5 6.8Luv_9537 3.9 5.4Hyd_3168 0.1 0.9
4. Chemical Foaming of Poly(Lactic Acid)
Foaming, Processing
The temperature parameters of extrusion foaming were selected based on the typical processing
temperature of PLA; technical datasheets recommend processing at 190–200 ◦C. Table 6 contains the
designations of the manufactured specimens and Table 7 contains the manufacturing parameters.
We experienced during manufacturing that in the case of 8052_4200 and 2003_4200, melt pressure
decreased drastically from the initial 74 to 43 bar and the viscosity of the melt changed considerably
when it exited the die and in the case of 8052_Hyd_3168 and 2003_Hyd_3168, we did not see signs of
successful cell formation in the material flow exiting the die – the sample continued to be transparent,
only its colour became whiter. The extruded reference rod is basically smooth and transparent. Figure 7
shows that in the case of 8052_4200, 2003_4200 and 8052_3170, 2003_3170, foaming produced a different
surface on the specimens. Tracel4200 produced a surface similar to PLA but with a little whitening
and the cells are visible. Tracel3170 produced a coarser surface and the cells can be felt on the surface.
Although Tracel3170 is an AZO type foaming agent, 8052_3170, 2003_3170 show only a very small
yellowish tint. Foaming agents that can produce effective gases at 190 ◦C reduced melt viscosity
during extrusion.
Appl. Sci. 2018, 8, 1960 11 of 17
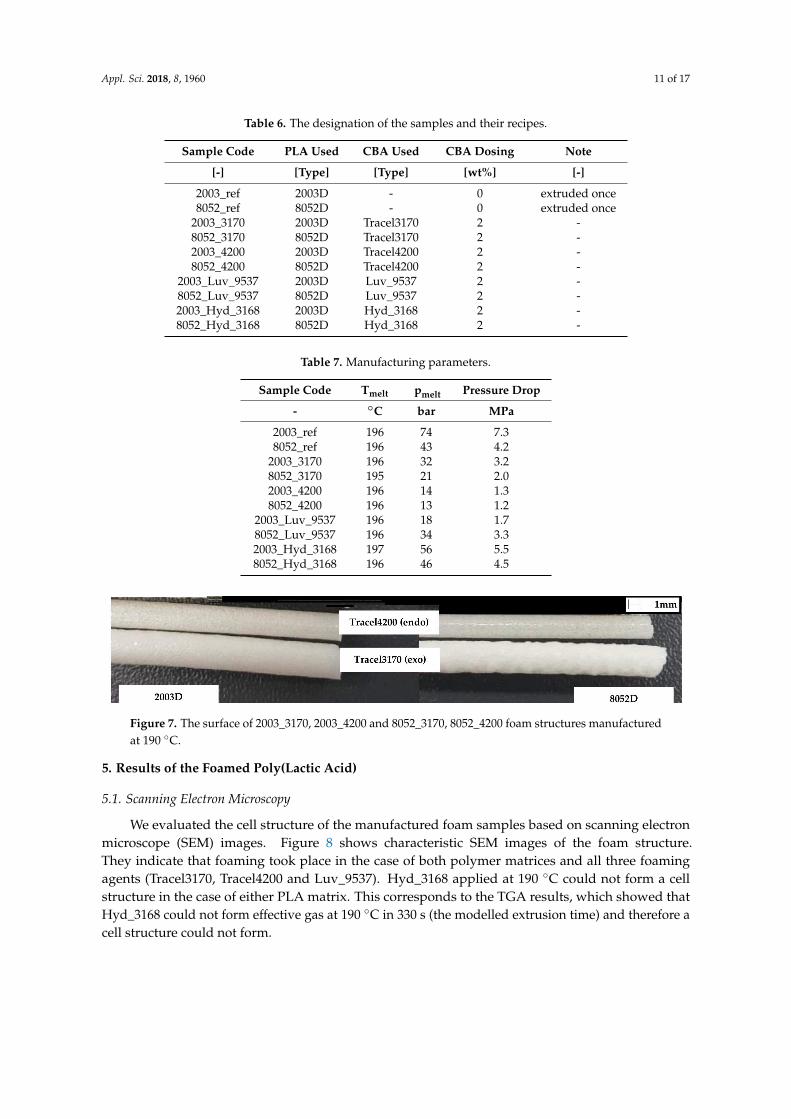
Table 6. The designation of the samples and their recipes.
Sample Code PLA Used CBA Used CBA Dosing Note
[-] [Type] [Type] [wt%] [-]
2003_ref 2003D - 0 extruded once8052_ref 8052D - 0 extruded once
2003_3170 2003D Tracel3170 2 -8052_3170 8052D Tracel3170 2 -2003_4200 2003D Tracel4200 2 -8052_4200 8052D Tracel4200 2 -
2003_Luv_9537 2003D Luv_9537 2 -8052_Luv_9537 8052D Luv_9537 2 -2003_Hyd_3168 2003D Hyd_3168 2 -8052_Hyd_3168 8052D Hyd_3168 2 -
Table 7. Manufacturing parameters.
Sample Code Tmelt pmelt Pressure Drop
- ◦C bar MPa
2003_ref 196 74 7.38052_ref 196 43 4.2
2003_3170 196 32 3.28052_3170 195 21 2.02003_4200 196 14 1.38052_4200 196 13 1.2
2003_Luv_9537 196 18 1.78052_Luv_9537 196 34 3.32003_Hyd_3168 197 56 5.58052_Hyd_3168 196 46 4.5
Figure 7. The surface of 2003_3170, 2003_4200 and 8052_3170, 8052_4200 foam structures
pFigure 7. The surface of 2003_3170, 2003_4200 and 8052_3170, 8052_4200 foam structures manufactured
at 190 ◦C.
5. Results of the Foamed Poly(Lactic Acid)
5.1. Scanning Electron Microscopy
We evaluated the cell structure of the manufactured foam samples based on scanning electron
microscope (SEM) images. Figure 8 shows characteristic SEM images of the foam structure.
They indicate that foaming took place in the case of both polymer matrices and all three foaming
agents (Tracel3170, Tracel4200 and Luv_9537). Hyd_3168 applied at 190 ◦C could not form a cell
structure in the case of either PLA matrix. This corresponds to the TGA results, which showed that
Hyd_3168 could not form effective gas at 190 ◦C in 330 s (the modelled extrusion time) and therefore a
cell structure could not form.
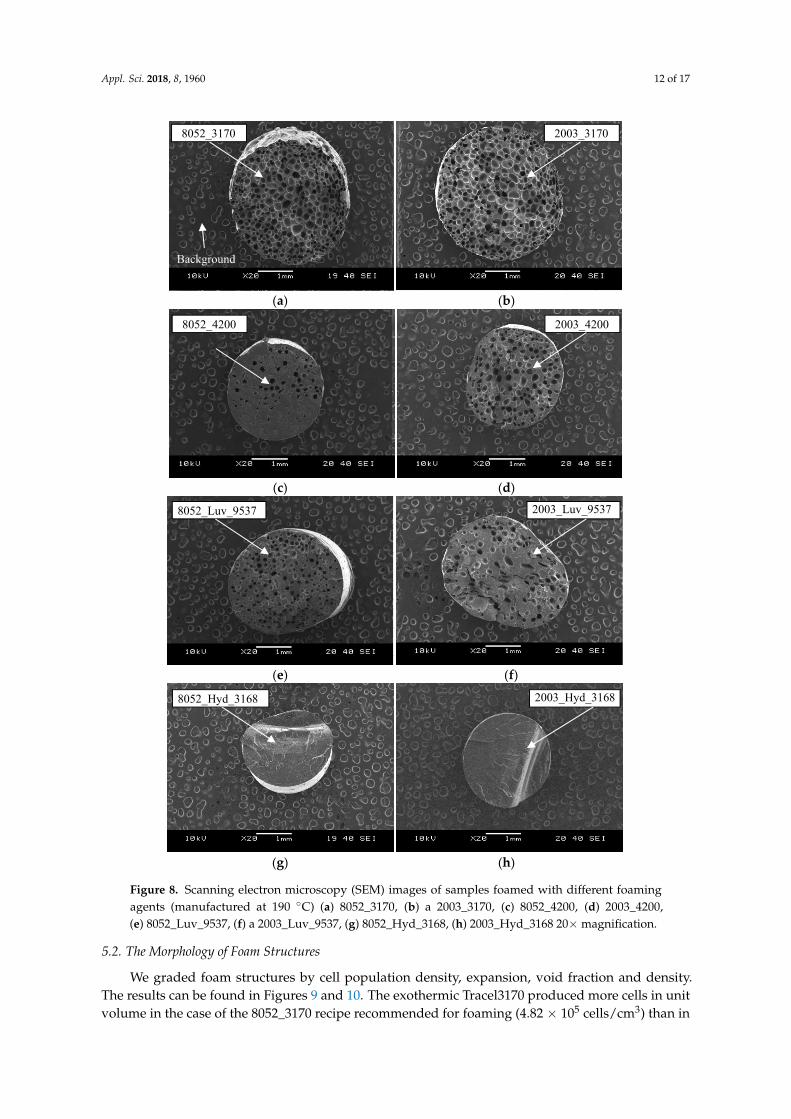
Appl. Sci. 2018, 8, 1960 12 of 17
(a) (b)
(c) (d)
(e) (f)
(g) (h)
Figure 8. Scanning electron microscopy (SEM) images of samples foamed with different foaming
8052_3170 2003_3170
8052_4200 2003_4200
8052_Luv_9537 2003_Luv_9537
8052_Hyd_3168 2003_Hyd_3168
Background
Figure 8. Scanning electron microscopy (SEM) images of samples foamed with different foaming
agents (manufactured at 190 ◦C) (a) 8052_3170, (b) a 2003_3170, (c) 8052_4200, (d) 2003_4200,
(e) 8052_Luv_9537, (f) a 2003_Luv_9537, (g) 8052_Hyd_3168, (h) 2003_Hyd_3168 20× magnification.
5.2. The Morphology of Foam Structures
We graded foam structures by cell population density, expansion, void fraction and density.
The results can be found in Figures 9 and 10. The exothermic Tracel3170 produced more cells in unit
volume in the case of the 8052_3170 recipe recommended for foaming (4.82 × 10⁵ cells/cm3) than in
Appl. Sci. 2018, 8, 1960 13 of 17
the case of 2003_3170 (4.17 × 10⁵ cells/cm3). The 8052D polymer not only produces a higher number
of cells but the expansion of the cells is also higher, 2.36, as opposed 2.18 in the case the 2003_3170.
As a result, density with 8052_3170 was lower, 0.53 g/cm3, while in the case of 2003_3170, it was
0.57 g/cm3. This means that a void fraction of 57.61% was achieved in the case of the 8052_3170 recipe
(considering that the density of PLA is 1.24 g/cm3. The good results can be attributed to the nucleating
agent Tracel3170 contained based on the manufacturer’s data and the TGA results (residual material
content of 40.96% at 800 ◦C).
(a) (b)
Figure 9. Foamed sample (a) expansion values (b) density values (manufacturing temperature 190 °C).
0.00.20.40.60.81.01.21.41.61.82.02.22.42.6
Exp
ansio
n ra
tio [-
]
Type of CBA
2003
8052
Tracel3170 Tracel4200 Luv_ 9537 PLA0.00.10.20.30.40.50.60.70.80.91.01.11.21.31.4
Den
sity
[g/c
m3 ]
Type of CBA
2003
8052
Tracel3170 Tracel4200 Luv_9537 PLA
Figure 9. Foamed sample (a) expansion values (b) density values (manufacturing temperature 190 ◦C).
(a) (b)
Figure 10. (a) Cell population density and (b) porosity in the case of the different foaming agent types
α α αα
α′ α
0
10
20
30
40
50
60
70
80
90
100
Voi
d fr
actio
n [%
]
Type of CBA
2003D
8052D
Tracel3170 Tracel4200 Luv_ 9537 PLA
Figure 10. (a) Cell population density and (b) porosity in the case of the different foaming agent types
(manufacturing temperature 190 ◦C).
The endothermic Tracel4200 produced fewer cells per unit volume in the case of the 8052_4200
recipe recommended for foaming (5.58 × 10⁴ cells/cm3) than in the case of the 2003_4200 recipe
(1.91 × 10⁵ cells/cm3). In the case of the 2003D the expansion of the cells is also better, 1.53, as opposed
to 1.24 in the case of the 8052_4200. This is because the decomposition products of Tracel4200 include
water, which probably hydrolysed the PLA, causing its melt pressure, viscosity and melt strength to
decrease during the foaming process. Since the Mw of 8052D is lower (153,235 Da) than that of 2003D
(180,477 Da), it resisted degradation by hydrolysis and produced better cell population density and
expansion than the 8052D type PLA. The density of foam structures manufactured with Tracel4200
Appl. Sci. 2018, 8, 1960 14 of 17
was 1.00 g/cm3 in the case of the 8052_4200, while 0.81 g/cm3 in the case of the 2003_4200, which is
less than the density reduction achieved with Tracel3170.
The endothermic Luv_9537 foaming agent produced more cells per unit volume in the case of
the 8052_Luv_9537 recipe recommended for foaming (1.67 × 10⁵ cells/cm3) than in the case of the
2003_Luv_9537 recipe (5.51 × 10⁴ cells/cm3). Although the cells expanded, expansion in the case
of the 2003D polymer was 1.22 and in the case of the 8052_Luv_9537 recipe, it was 1.23, which is
quite little in both cases. The SEM images show that the size and shape of the cells in the case of the
8052_Luv_9537 are not homogeneous. The densities of PLA foams made with the Luv_9537 foaming
agent are about 1 g/cm3 in both cases. In the case of 2003_Luv_9537, density is 1.02 g/cm3, while in
the case of 8052_Luv_9537, it is 1.01 g/cm3.
We did not characterize the 2003_Hyd_3168 and 8052_Hyd_3168 recipes with the methods used
for the characterization of foam structures, since no foam structure was formed during manufacturing.
Only the PLA matrix formed a blend with the carrier of the CBA without the effective gases being able
to form a gas phase and nucleate cells.
In the case of exothermic foaming, PLA foamed to a much greater degree than in the case of
endothermic foaming and so densities were lower. This is due to the type of the endothermic reaction
products on the one hand and to the effective gas formation temperature ranges unfavourable for PLA
and the foaming agent fraction of the CBA granules.
5.3. Differential Scanning Calorimetry
We examined the morphology that formed after foaming process, using differential scanning
calorimetry, the results of which can be seen in Figure 11 and Table 8. Figure 11 shows the DSC curves
of the single-processed reference poly(lactic acid) (extruded granules, processed similarly to foamed
samples 2003_ref and 8052_ref) and the foamed samples in the case of the first heating curve. In the
case of foams manufactured with the same processing conditions, the glass transition temperature of
the polymer (Tg), which is the first registered endothermic change in the DSC curve, was not different
from the reference value in the case of the Tracel4200 foaming agent and the 8052_3170 recipe. On the
other hand, in the case of the other foaming agents Tg decreased by 2–4 ◦C (Table 8). A change in
the second registered heat flow is the exothermic phenomenon of cold crystallization, which, in the
case of foam structures, shifts considerably to lower temperatures. The foaming agent causes cold
crystallization to happen at a much lower temperature than in the case of neat PLA. The second,
bigger endothermic peak is the crystalline fraction melting range. It can be observed that the extruded
foam samples are capable of cold crystallization during the DSC test, which is an exothermic reaction.
This is because after processing, due to fast cooling, the crystalline fraction cannot fully form, since
the molecular chains do not have time to get ordered. During the DSC test, due to the relatively slow
temperature rise (5 ◦C/min), the molecular chains can become more ordered, which is accompanied
by the release of heat. These crystalline fractions melt later, at a higher temperature and the polymer
melts. In the case of 8052D, two crystalline melting peaks can be observed. Frackowiak et al. [27]
provided the explanation that crystals with lower melting temperatures are smaller and formed during
cold crystallization, while, crystal types with a higher melting temperature formed during the primary
crystallization process, therefore, in our case, they are created by the technology. Therefore, foaming
agents influence the crystalline structure that forms in the polymer. The crystalline melting range
has two peaks and is composed of two different crystalline types: the α and α’ types. The α’ type
has a lower melting temperature, while the α type has a higher melting temperature and is also
thermodynamically more stable. The range between the melting of the two phases is called α′–α phase
transition [27]. The crystalline fraction forming during manufacturing is typically low, due to the
cooling of the polymer in open air (<5%). The foam structure with the highest population density and
highest expansion has the highest crystalline fraction from manufacturing (4.3%). Crystalline fraction
was typically higher than that of reference PLA; the nucleating agents in the CBAs probably had a
beneficial effect on the forming of crystalline nuclei. Thus, the foaming agent affected the crystalline
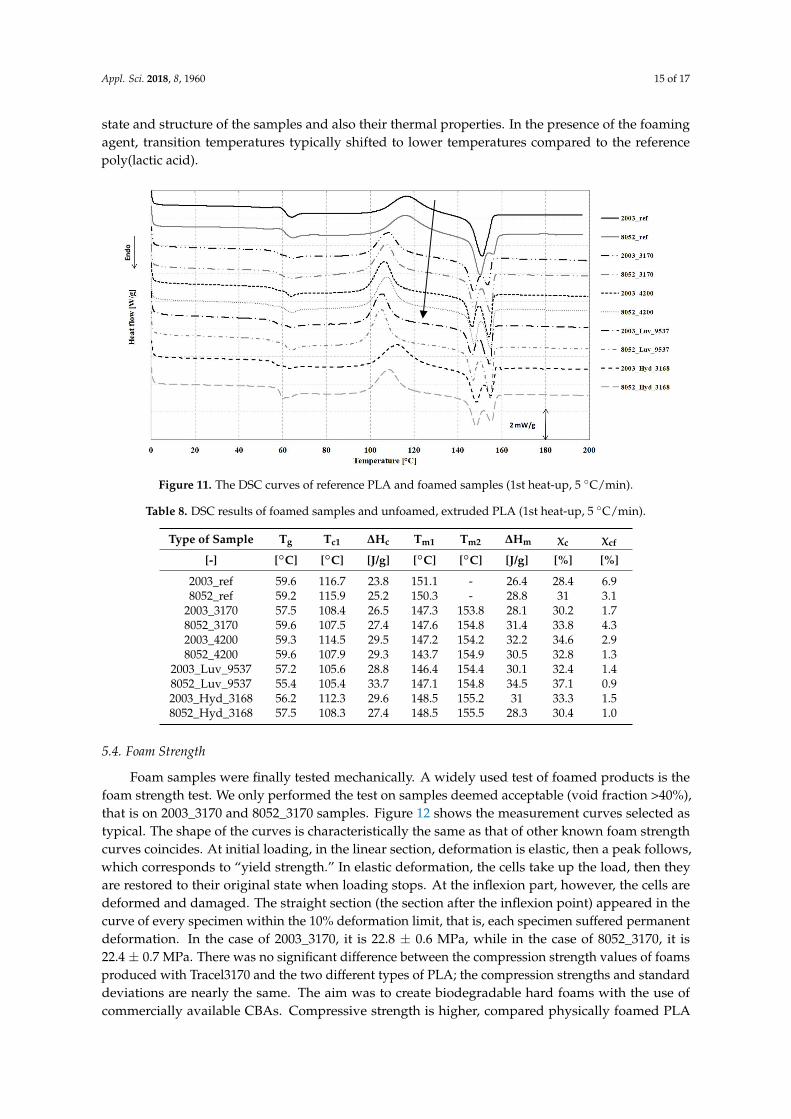
Appl. Sci. 2018, 8, 1960 15 of 17
state and structure of the samples and also their thermal properties. In the presence of the foaming
agent, transition temperatures typically shifted to lower temperatures compared to the reference
poly(lactic acid).
�� �� � ��
Figure 11. The DSC curves of reference PLA and foamed samples (1st heat-up, 5 ◦C/min).
Table 8. DSC results of foamed samples and unfoamed, extruded PLA (1st heat-up, 5 ◦C/min).
Type of Sample Tg Tc1 ∆Hc Tm1 Tm2 ∆Hm χc χcf
[-] [◦C] [◦C] [J/g] [◦C] [◦C] [J/g] [%] [%]
2003_ref 59.6 116.7 23.8 151.1 - 26.4 28.4 6.98052_ref 59.2 115.9 25.2 150.3 - 28.8 31 3.1
2003_3170 57.5 108.4 26.5 147.3 153.8 28.1 30.2 1.78052_3170 59.6 107.5 27.4 147.6 154.8 31.4 33.8 4.32003_4200 59.3 114.5 29.5 147.2 154.2 32.2 34.6 2.98052_4200 59.6 107.9 29.3 143.7 154.9 30.5 32.8 1.3
2003_Luv_9537 57.2 105.6 28.8 146.4 154.4 30.1 32.4 1.48052_Luv_9537 55.4 105.4 33.7 147.1 154.8 34.5 37.1 0.92003_Hyd_3168 56.2 112.3 29.6 148.5 155.2 31 33.3 1.58052_Hyd_3168 57.5 108.3 27.4 148.5 155.5 28.3 30.4 1.0
5.4. Foam Strength
Foam samples were finally tested mechanically. A widely used test of foamed products is the
foam strength test. We only performed the test on samples deemed acceptable (void fraction >40%),
that is on 2003_3170 and 8052_3170 samples. Figure 12 shows the measurement curves selected as
typical. The shape of the curves is characteristically the same as that of other known foam strength
curves coincides. At initial loading, in the linear section, deformation is elastic, then a peak follows,
which corresponds to “yield strength.” In elastic deformation, the cells take up the load, then they
are restored to their original state when loading stops. At the inflexion part, however, the cells are
deformed and damaged. The straight section (the section after the inflexion point) appeared in the
curve of every specimen within the 10% deformation limit, that is, each specimen suffered permanent
deformation. In the case of 2003_3170, it is 22.8 ± 0.6 MPa, while in the case of 8052_3170, it is
22.4 ± 0.7 MPa. There was no significant difference between the compression strength values of foams
produced with Tracel3170 and the two different types of PLA; the compression strengths and standard
deviations are nearly the same. The aim was to create biodegradable hard foams with the use of
commercially available CBAs. Compressive strength is higher, compared physically foamed PLA
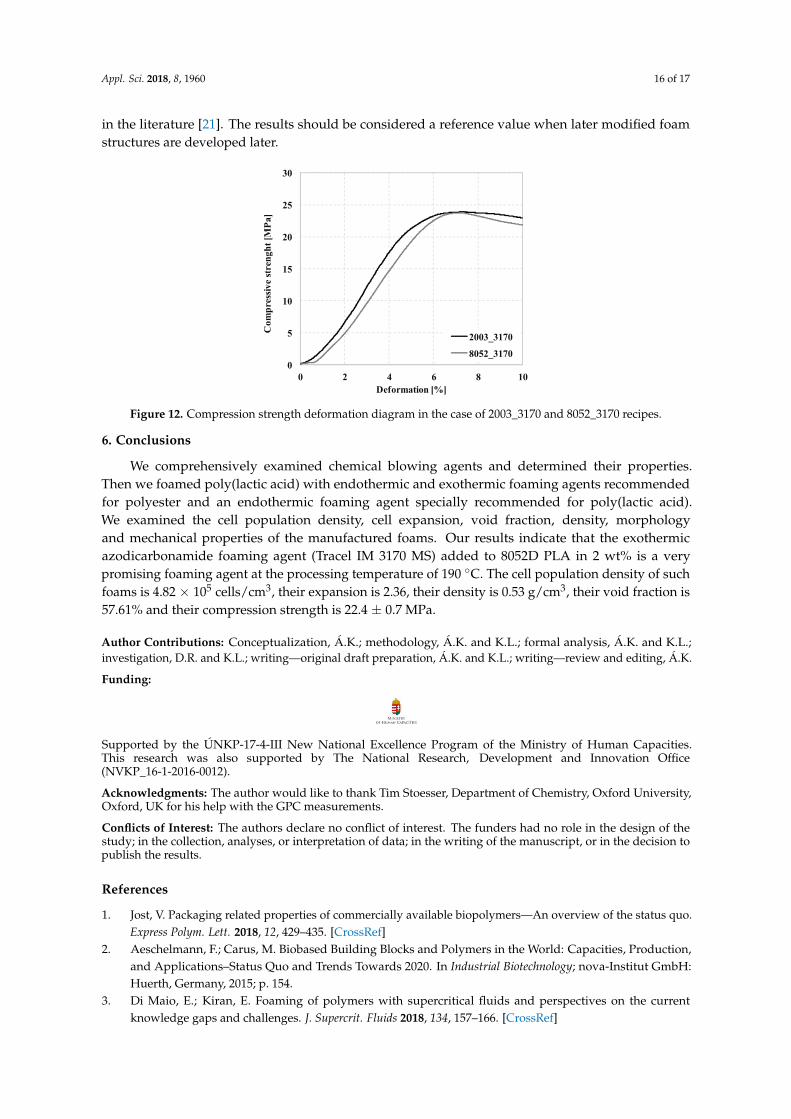
Appl. Sci. 2018, 8, 1960 16 of 17
in the literature [21]. The results should be considered a reference value when later modified foam
structures are developed later.
mpression strength deformation diagram in the case of 2003_3170 and
0
5
10
15
20
25
30
0 2 4 6 8 10
Com
pres
sive
stre
nght
[MPa
]
Deformation [%]
2003_31708052_3170
Figure 12. Compression strength deformation diagram in the case of 2003_3170 and 8052_3170 recipes.
6. Conclusions
We comprehensively examined chemical blowing agents and determined their properties.
Then we foamed poly(lactic acid) with endothermic and exothermic foaming agents recommended
for polyester and an endothermic foaming agent specially recommended for poly(lactic acid).
We examined the cell population density, cell expansion, void fraction, density, morphology
and mechanical properties of the manufactured foams. Our results indicate that the exothermic
azodicarbonamide foaming agent (Tracel IM 3170 MS) added to 8052D PLA in 2 wt% is a very
promising foaming agent at the processing temperature of 190 ◦C. The cell population density of such
foams is 4.82 × 10⁵ cells/cm3, their expansion is 2.36, their density is 0.53 g/cm3, their void fraction is
57.61% and their compression strength is 22.4 ± 0.7 MPa.
Author Contributions: Conceptualization, Á.K.; methodology, Á.K. and K.L.; formal analysis, Á.K. and K.L.;
investigation, D.R. and K.L.; writing—original draft preparation, Á.K. and K.L.; writing—review and editing, Á.K.
Funding:
ing:
an Capacities. This
0
5
10
15
20
25
30
0 2 4 6 8 10
Com
pres
sive
stre
nght
[MPa
]
Deformation [%]
2003_31708052_3170
Supported by the ÚNKP-17-4-III New National Excellence Program of the Ministry of Human Capacities.This research was also supported by The National Research, Development and Innovation Office(NVKP_16-1-2016-0012).
Acknowledgments: The author would like to thank Tim Stoesser, Department of Chemistry, Oxford University,Oxford, UK for his help with the GPC measurements.
Conflicts of Interest: The authors declare no conflict of interest. The funders had no role in the design of thestudy; in the collection, analyses, or interpretation of data; in the writing of the manuscript, or in the decision topublish the results.
References
1. Jost, V. Packaging related properties of commercially available biopolymers—An overview of the status quo.
Express Polym. Lett. 2018, 12, 429–435. [CrossRef]
2. Aeschelmann, F.; Carus, M. Biobased Building Blocks and Polymers in the World: Capacities, Production,
and Applications–Status Quo and Trends Towards 2020. In Industrial Biotechnology; nova-Institut GmbH:
Huerth, Germany, 2015; p. 154.
3. Di Maio, E.; Kiran, E. Foaming of polymers with supercritical fluids and perspectives on the current
knowledge gaps and challenges. J. Supercrit. Fluids 2018, 134, 157–166. [CrossRef]
Appl. Sci. 2018, 8, 1960 17 of 17
4. Wypych, G. Handbook of Foaming and Blowing Agents; ChemTec Publishing: Toronto, ON, Canada, 2017;
Volume 1.
5. Raps, D.; Hossieny, N.; Park, C.B.; Altstädt, V. Past and present developments in polymer bead foams and
bead foaming technology. Polymer 2015, 56, 5–19. [CrossRef]
6. Orbulov, I.; Katona, B. Structural Damages in Syntactic Metal Foams Caused by Monotone or Cyclic
Compression. Periodica Polytech. Mech. Eng. 2017, 61, 146–152.
7. Okolieocha, C.; Raps, D.; Subramaniam, K.; Altstädt, V. Microcellular to nanocellular polymer foams:
Progress (2004–2015) and future directions—A review. Eur. Polym. J. 2015, 73, 500–519. [CrossRef]
8. Lee, S.-T.; Park, C.B.; Ramesh, N.S. Polymeric Foams: Science and Technology; Taylor and Francis Groupe:
Boca Raton, FL, USA, 2007.
9. Lee, S.-T. Foam Extrusion, 2nd ed.; CRC Press: Boca Raton, FL, USA, 2014.
10. Lee, S.-T. Polymer Foams Innovations in Processes, Technologies, and Products; CRC Press: Boca Raton, FL,
USA, 2017.
11. Khemani, K.C. Polymeric Foams Science and Technology; American Chemical Society: Washington, DC,
USA, 1997.
12. Eaves, D. Polymer Foams Trends in Use and Technology; Rapra Technology Limited: Shawbury, UK, 2001.
13. Ludwiczak, J.; Kozlowski, M. Foaming of Polylactide in the Presence of Chain Extender. J. Polym. Environ.
2014, 23, 137. [CrossRef]
14. Julien, J.M.; Quantin, J.-C.; Bénézet, J.-C.; Bergeret, A.; Lacrampe, M.F.; Krawczak, P. Chemical foaming
extrusion of poly(lactic acid) with chain-extenders: Physical and morphological characterizations. Eur. Polym.
J. 2015, 67, 40–49. [CrossRef]
15. Julien, J.-M.; Bénézet, J.-C.; Lafranche, E.; Quantin, J.-C.; Bergeret, A.; Lacrampe, M.-F.; Krawczak, P.
Development of poly(lactic acid) cellular materials: Physical and morphological characterizations. Polymer
2012, 53, 5885–5895. [CrossRef]
16. Matuana, M.L.; Faruk, O.; Diaz, C.A. Cell morphology of extrusion foamed poly(lactic acid) using
endothermic chemical foaming agent. Bioresour. Technol. 2009, 100, 5947–5954. [CrossRef] [PubMed]
17. Tramaco Vertrieb und Verarbeitung von Chemieprodukten GmbH; Chemical Foaming Agents: Pinneberg,
Germany, 2014.
18. Yuan, H.; Liu, Z.; Ren, J. Preparation, Characterization, and Foaming Behavior of Poly(lactic acid)/
Poly(butylene adipate-co-butylene terephthalate) Blend. Polym. Eng. Sci. 2009, 49, 1004–1012. [CrossRef]
19. Niaounakis, M. Biopolymers: Applications and Trends; PDL Handbook Series; William Andrew: Chadds Ford,
PA, USA, 2015.
20. Nofar, M.; Park, C.B. Poly (lactic acid) foaming. Prog. Polym. Sci. 2014, 39, 1721–1741. [CrossRef]
21. Bocz, K.; Tábi, T.; Vadas, D.; Sauceau, M.; Fages, J.; Marosi, G. Characterisation of natural fibre reinforced
PLA foams prepared by supercritical CO2 assisted extrusion. Express Polym. Lett. 2016, 10, 3144. [CrossRef]
22. Wypych, G. Databook of Blowing and Auxiliary Agent; ChemTech Publishing: Toronto, ON, Canada, 2016.
23. Tábi, T.; Hajba, S.; Kovács, J.G. Effect of crystalline forms (α′ and α) of poly(lactic acid) on its mechanical,
thermo-mechanical, heat deflection temperature and creep properties. Eur. Polym. J. 2016, 82, 232–243.
[CrossRef]
24. Xu, X.; Park, C.B.; Xu, D.; Pop-Iliev, R. Effects of Die Geometry on Cell Nucleation of PS Foams Blown With
CO2. Polym. Eng. Sci. 2003, 43, 1378–1390. [CrossRef]
25. Li, G.; Li, H.; Turng, L.S.; Gong, S.; Zhang, C. Measurement of gas solubility and diffusivity in polylactide.
Fluid Phase Equilib. 2006, 246, 158–166. [CrossRef]
26. National Institute of Standards and Technology IR Database. Available online: https://webbook.nist.gov/
chemistry (accessed on 15 December 2017).
27. Frackowiak, S.; Ludwiczak, J.; Leluk, K.; Orzechowski, K.; Kozlowski, M. Foamed poly(lactic acid)
composites with carbonaceous fillers for electromagnetic shielding. Mater. Des. 2015, 65, 749–756. [CrossRef]
© 2018 by the authors. Licensee MDPI, Basel, Switzerland. This article is an open access
article distributed under the terms and conditions of the Creative Commons Attribution
(CC BY) license (http://creativecommons.org/licenses/by/4.0/).


![¹ B>0>7 º>/>0 v 7? Ý z0£ ¾ , z0£ ' #ã gO ÞC3 BョCg4k>オ]メ s g4k>オャ 13,185 O ÞB « è 2912,045 O ÞC ½ ß M 0 ¹B ý é ã g4 kC 10,997 O ÞB « è 2910,391 O ÞC](https://img.pdfslide.us/doc/110x75/5ecbfbb392853043470e0d97/-b07-0-v-7-z0-z0-g-o-c3-bicg4kii.jpg)


![u I8 ì ^ ] î 8 ) W S5 !l ì>&4# d q ±0d b2 0£#ì>' >& ç ô>1 ... · gwg2gcgcg2g6g;g#リ'シf'、ih>>>d h)2;4 ⦆f58f5*hhhh gメ+瓰)p'ヌf渹レfヤfgfクcfワ¥#リf5!l1"8檳)*(ワf瓱gffヤgfケ](https://img.pdfslide.us/doc/110x75/60fa6f5b424ac074ba14b2b7/u-i8-8-w-s5-l-4-d-q-0d-b2-0-1.jpg)


![Hypolito セゥエ・オ セ セB@ Themeroteca.ciasc.sc.gov.br/jornais/oolhosemanario/OL... · 2016-11-23 · ⦅MセBB]G Mi M ェNNMMGMMG cTャャQMGャ BZZ ーゥZゥュ・ゥゥNッ](https://img.pdfslide.us/doc/110x75/5f8895082ed72267030d9519/hypolito-iiiii-i-ibi-2016-11-23-imibbg-mi-m-innmmgmmg-ctiiqmgi.jpg)


![r h iA ;:JJ :::J i · P^ケ'_フ{i`トrノ!アツ「ナAネコフニィヘ1"B. ニ "U!1 'tJI^g. N^ f @ モ. K): Meiil Seika. t7J}ノ]゚エ ⦆リnネオ . 50 ~ネコ. 50 ~F-600 ~ネコ](https://img.pdfslide.us/doc/110x75/5f74031a453eb130a612f3b6/r-h-ia-jj-j-i-piioeiiriiiiiaiiioeiii1b.jpg)
![(305}) . ¥4,000 ¥3,0002019/08/24 · (305}) . ¥4,000 ¥3,000 Title 繧ッ繝ュ繧ケ繝翫ン繝壹・繧ケ(繧ウ繝シ繝・8) [譖エ譁ー貂医∩] Author komatsukenshi](https://img.pdfslide.us/doc/110x75/60f73a4db36dda66ee003e9d/305-4000-3-20190824-305-4000-3000-title-ciciciccfcfcicicicf8.jpg)


![ケHュフソフノキZp、Jュ - MLIT...vg^Cv]ソホ タアャァ カVXeEイクハ dvロホ}:0: ¥ハA: ュ¥ 3:ヨAソフア ミQフネヌA 80 フ⦆゙E⦆WEmF ケH}jAネヌA 40](https://img.pdfslide.us/doc/110x75/5fad8b9a56a551655116de3c/ihiioeiioeiizpiji-mlit-vgcvii-iiii-ivxeeiii.jpg)