Embed Size (px)
Citation preview
Page 1 of 20
13 January 2014
HLIB Research
PP 9484/12/2012 (031413)
Telecommunications (Neutral )
INDUSTRY INSIGHT 13 January 2014 13 January 2014
2014 Outlook
Highlights
Yield compression euphoria – absent in 2013 and would not
repeat in 2014 without the confluence of unfavorable external
macroeconomic factors and domestic political risk.
Commitment to APT’s 700 MHz harmonization is a long term
catalyst for the sector. However, this is highly dependent on
DTTB project under Puncak Semangat’s implementation.
The prolonged deliberation and pending decision on 900MHz
and 1800MHz reallocation have undoubtedly created risks
buoyed amongst the telcos as guessing game continues to
predict the ultimate beneficiaries.
3G QoS under regulatory scrutiny but should be a concern.
Electricity tariff revision would not impact telcos materially as
it only accounted for 3%-5% of overall cost base.
Expectation of OPR hike of 25bps in 2H14 would exert
pressure on share price while FOREX volatility would send
telcos with USD debt exposures into doldrums.
GST – positive but may not enjoy the full boost due to lower
MOU, intensified competition and regulated pricing.
Budget 2014 – win-win but TM is the major beneficiary.
2014 smartphone penetration expected to reach 44.5% as
ASP plummet and continue to drive data revenue. Newer
smartphone models also stimulate higher data usage.
Device subsidy erodes earnings while there is no sign of
cellcos improving data monetization.
OTT threat gaining traction and SMS became the first
casualty with traffic plunging below 20bn SMS per quarter.
G.fast – 1Gbps over traditional copper network suggests
great potential and value in TM.
Sector’s next phase of growth lies in IoT / M2M and telcos
has begun to tap into the market.
LTE yet to be a catalyst due to unfavorable market
dynamics, absence of 4G service premium, lack of
awareness, limited availability of affordable devices and
opportunity eroded by HSBB and WiFi.
Emphasis on cost thanks to technological advancement.
Outsourcing is a more sustainable business model.
Catalysts Cost savings from partnerships.
Managed services / outsourcing.
Increased demand for wholesale bandwidth.
Risks Irrational competition, regulation of tariffs, FOREX.
Forecasts Unchanged.
Rating Neutral ()
Positives – Low beta, defensive, strong cash-generation and
dividends should underpin the share price.
Negatives – Potential irrational competition, regulatory risks,
unable to monetize data, dumb pipes.
Top Picks Prefer fixed over mobile as it is an inevitable pre-requisite to
cellcos who are seeking growth in data.
Fixed has healthy market landscape - monopoly in retail
segment and duopoly in wholesale and enterprise segment.
TdC (BUY, TP: RM4.03) and TM (BUY, TP: RM5.82).
Tan J Young
(603) 2168 1082
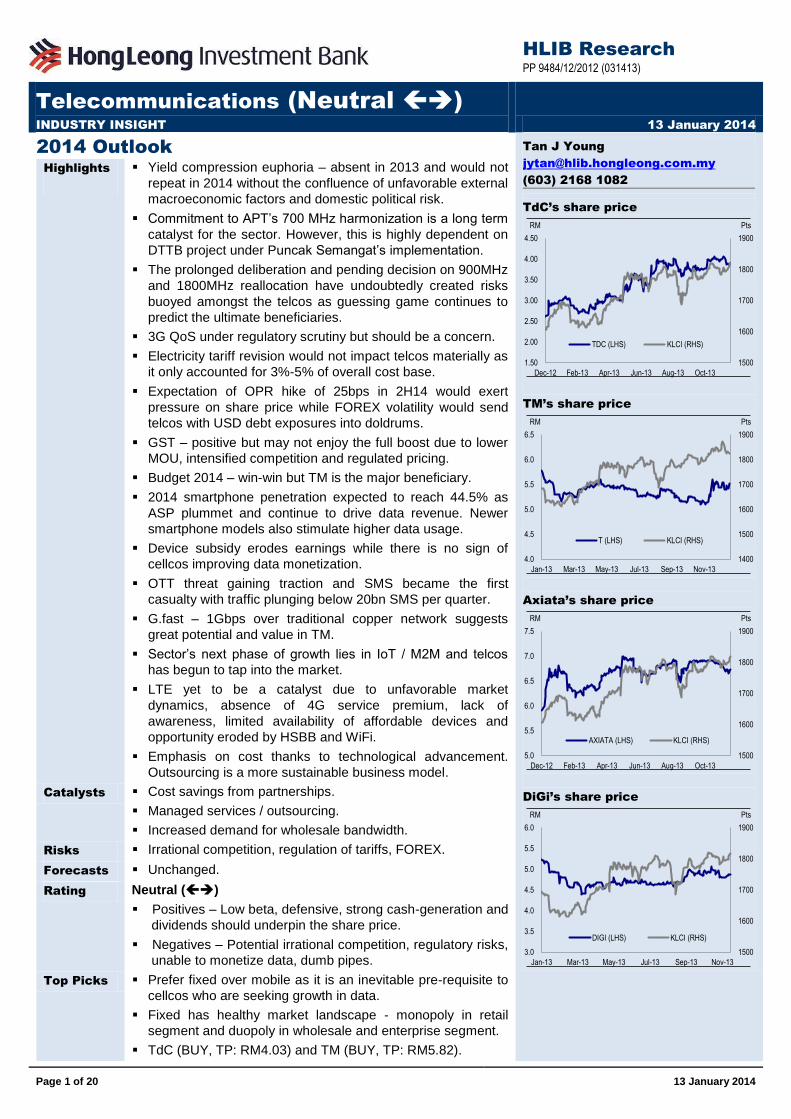
TdC’s share price
1500
1600
1700
1800
1900
1.50
2.00
2.50
3.00
3.50
4.00
4.50
Dec-12 Feb-13 Apr-13 Jun-13 Aug-13 Oct-13
PtsRM
TDC (LHS) KLCI (RHS)
TM’s share price
1400
1500
1600
1700
1800
1900
4.0
4.5
5.0
5.5
6.0
6.5
Jan-13 Mar-13 May-13 Jul-13 Sep-13 Nov-13
PtsRM
T (LHS) KLCI (RHS)
Axiata’s share price
1500
1600
1700
1800
1900
5.0
5.5
6.0
6.5
7.0
7.5
Dec-12 Feb-13 Apr-13 Jun-13 Aug-13 Oct-13
PtsRM
AXIATA (LHS) KLCI (RHS)
DiGi’s share price
1500
1600
1700
1800
1900
3.0
3.5
4.0
4.5
5.0
5.5
6.0
Jan-13 Mar-13 May-13 Jul-13 Sep-13 Nov-13
PtsRM
DIGI (LHS) KLCI (RHS)

HLIB Research | Telecommunications
www.hlebroking.com
Page 2 of 20
13 January 2014
Introduction
In the absence of the yield compression euphoria, telcos’ share price performances throughout 2013 were less bullish and volatile compared to 2012. All 5 stocks under our coverage ended 2013 mixed unlike in 2012 where all appreciated by an average of 23.8%, outpacing the broader KLCI index’s 10.3% (see Figure #1). Without the confluence of unfavorable external macroeconomic factors including European debt crisis, fears of China’s hard landing, slowdown of the US economy as well as domestic political risk (speculation of general election), the rush over yield dissipated in 2013 and we believe that history (of yield searching) would not repeat itself in 2014.
Figure #1 Telcos’ Share Price Performances in 2012 and 2013
Year End Closing Price (RM) Change (%)
2011 2012 2013 2012 2013
KLCI 1,530.73 1,688.95 1,866.96 10.34 10.54
Axiata 5.14 6.59 6.90 28.21 4.70
DiGi 3.88 5.29 4.96 36.34 -6.24
Maxis 5.48 6.65 7.27 21.35 9.32
TM 4.96 6.04 5.55 21.77 -8.11
TdC 0.73 3.95 3.55 11.27* 18.23**
Average 23.79 3.58
* Adjusted for 5:1 share consolidation. ** Adjusted for dividend-in-specie of DiGi shares. HLIB
Nonetheless, 2013 was still a remarkable year for the telcos with each achieving important corporate milestones which would lead to sustainable business prospect: Axiata – Acquisition of Axis and 4G collaboration with Altel. DiGi – Completion of network modernization. Maxis – Organizational restructuring and workforce rationalization. TM – HSBB phase 2, wholesale bandwidth collaborative deal with Celcom-DiGi, sport
content leasing with Astro and potential entry into LTE. TdC – Implementation of Asia Pacific Gateway (APG). Operationally, telcos continue to compete rationally in this oversaturated market with more emphasis on cost management. They remain profitable and generating strong operating cash flows enabling telcos to consistently rewarding shareholders with generous yields. Therefore, as a sector, telco’s defensiveness in nature is promoted as a safe haven to investors when uncertainty emerges. Following our tradition of sector outlook report, telco’s environmental scanning will be discussed using PEST analysis, complete with political / regulatory, economic and social perspectives.
Political / Regulatory Factors
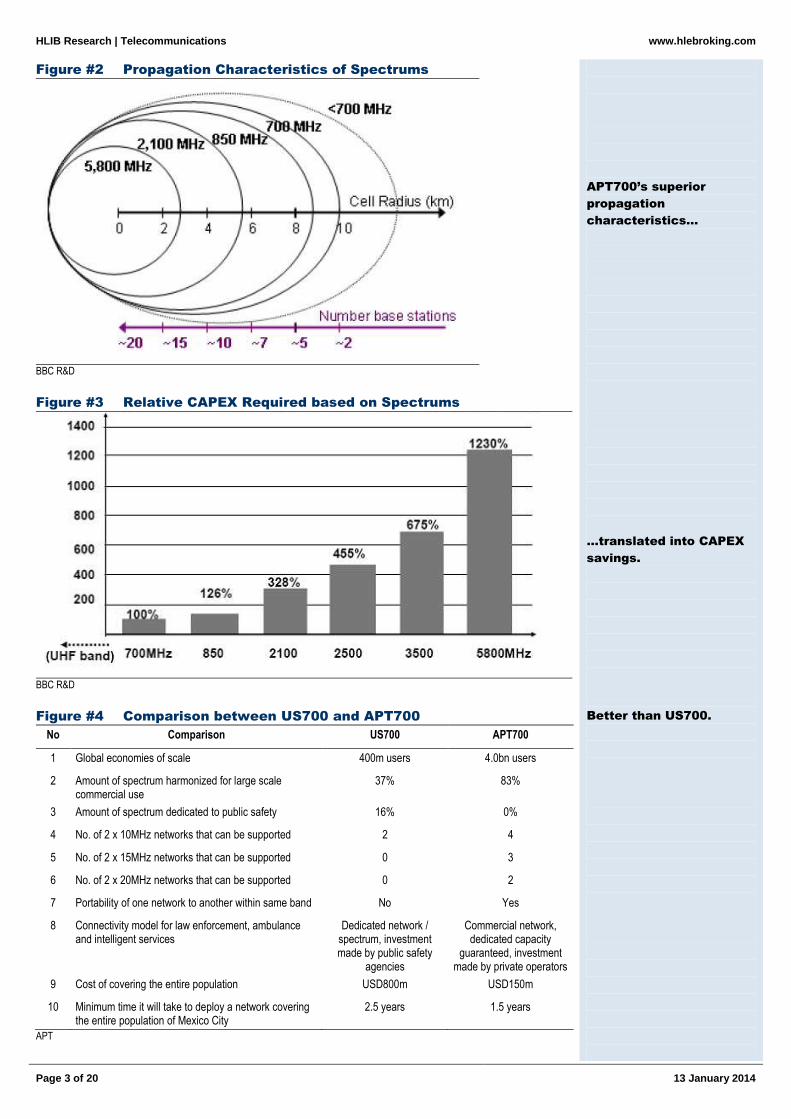
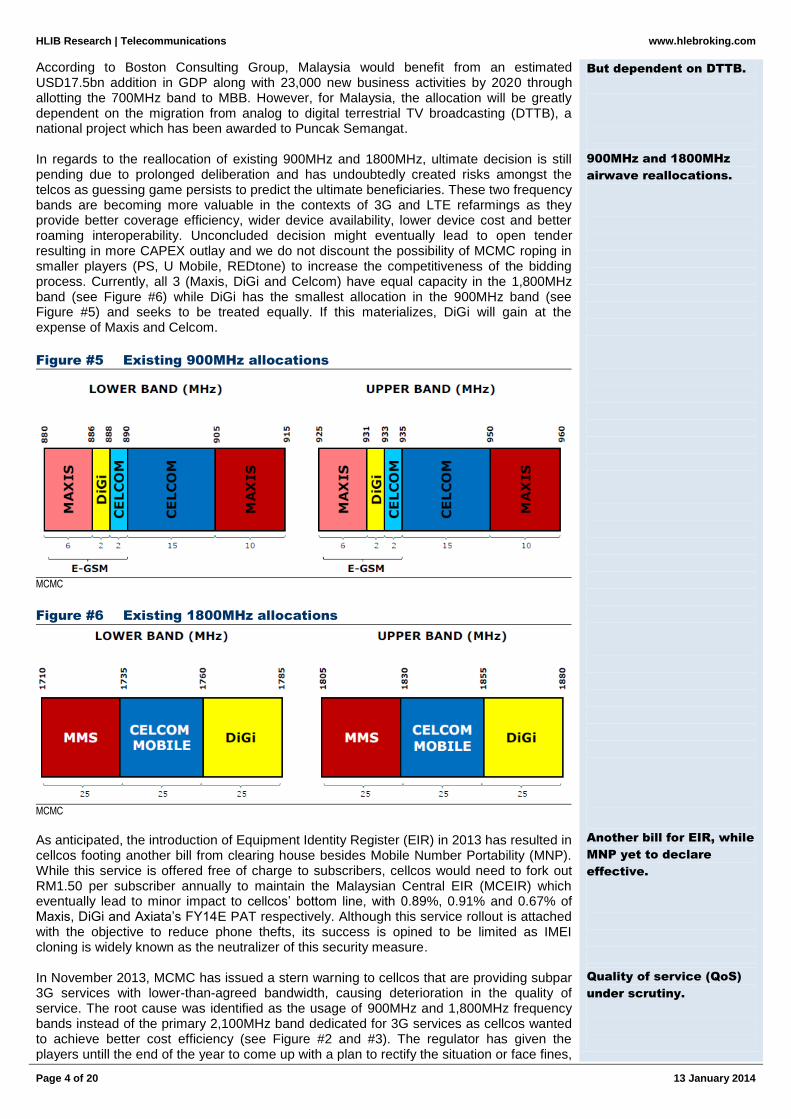
In telco, radio frequencies are the most scarce and valuable resources. With MCMC’s pledge to harmonize the 700MHz band according to the Asia Pacific Telecommunity (APT) plan in June 2013, we see a long term catalyst in the sector by paving a roadmap to meet the demand for mobile broadband (MBB), improve regional mobile roaming and provide more competitive MBB services. Low frequency spectrum is crucial due to its superior propagation characteristics (see Figure #2) which would entail technological advantages including wider coverage, improved indoor quality, as a global universal 4G spectrum enhancing services roaming, device availability compatibility and economy of scale. In turn, these benefits would help telcos to reduce CAPEX and OPEX significantly (see Figure #3). Currently, there are two harmonized band plan in place for 700MHz, namely APT700 and US’s 700 Band Plan. The comparison between the two exhibits that APT700 is the superior solution (see Figure #4).
Without yield
compression euphoria,
2013 were less bullish
and volatile…
…would not repeat in
2014.
But, 2013 was still
remarkable.
Telcos remain defensive
in nature.
APT’s 700MHz
harmonization is a long
term catalyst.
HLIB Research | Telecommunications
www.hlebroking.com
Page 3 of 20
13 January 2014
Figure #2 Propagation Characteristics of Spectrums
BBC R&D
Figure #3 Relative CAPEX Required based on Spectrums
BBC R&D
Figure #4 Comparison between US700 and APT700
No Comparison US700 APT700
1 Global economies of scale 400m users 4.0bn users
2 Amount of spectrum harmonized for large scale commercial use
37% 83%
3 Amount of spectrum dedicated to public safety 16% 0%
4 No. of 2 x 10MHz networks that can be supported 2 4
5 No. of 2 x 15MHz networks that can be supported 0 3
6 No. of 2 x 20MHz networks that can be supported 0 2
7 Portability of one network to another within same band No Yes
8 Connectivity model for law enforcement, ambulance and intelligent services
Dedicated network / spectrum, investment made by public safety
agencies
Commercial network, dedicated capacity
guaranteed, investment made by private operators
9 Cost of covering the entire population USD800m USD150m
10 Minimum time it will take to deploy a network covering the entire population of Mexico City
2.5 years 1.5 years
APT
APT700’s superior
propagation
characteristics…
…translated into CAPEX
savings.
Better than US700.
HLIB Research | Telecommunications
www.hlebroking.com
Page 4 of 20
13 January 2014
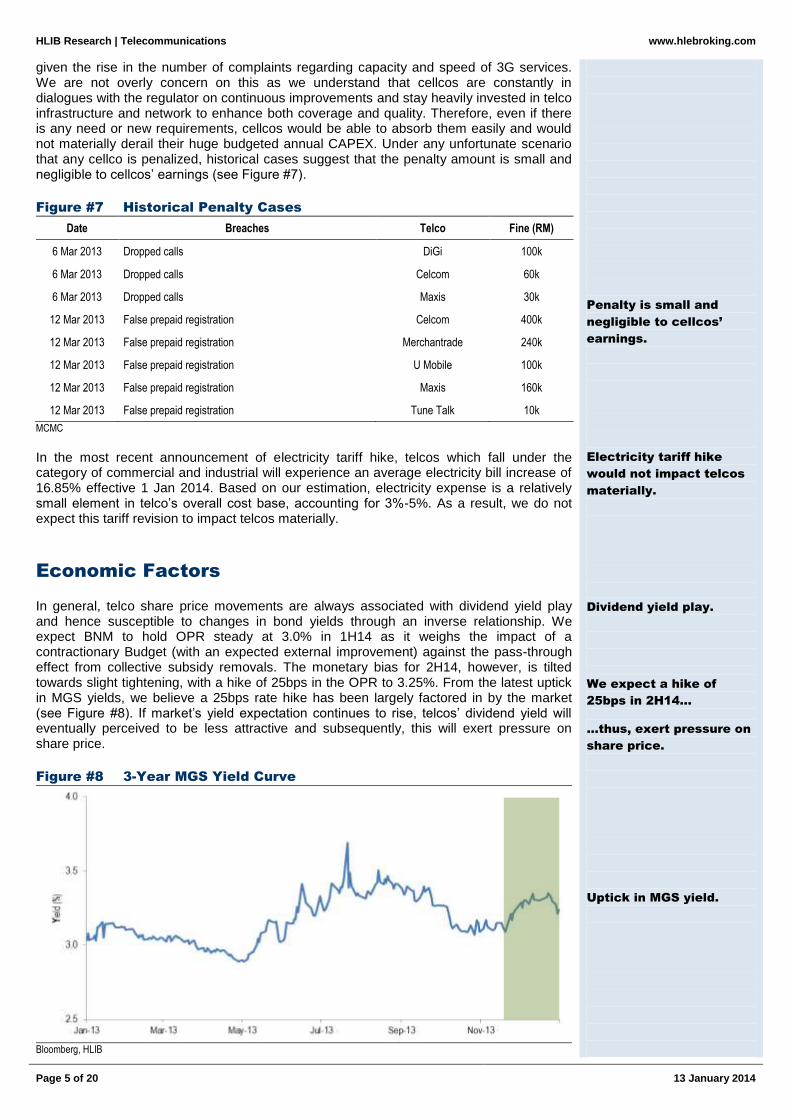
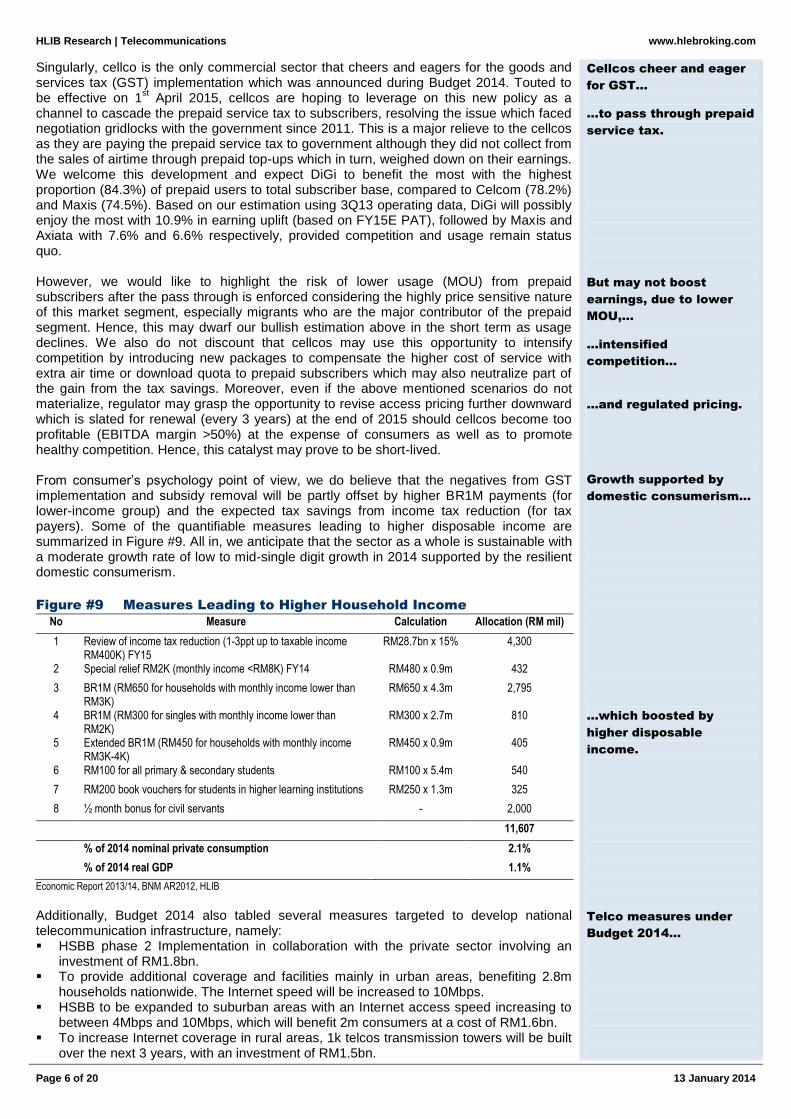
According to Boston Consulting Group, Malaysia would benefit from an estimated USD17.5bn addition in GDP along with 23,000 new business activities by 2020 through allotting the 700MHz band to MBB. However, for Malaysia, the allocation will be greatly dependent on the migration from analog to digital terrestrial TV broadcasting (DTTB), a national project which has been awarded to Puncak Semangat. In regards to the reallocation of existing 900MHz and 1800MHz, ultimate decision is still pending due to prolonged deliberation and has undoubtedly created risks amongst the telcos as guessing game persists to predict the ultimate beneficiaries. These two frequency bands are becoming more valuable in the contexts of 3G and LTE refarmings as they provide better coverage efficiency, wider device availability, lower device cost and better roaming interoperability. Unconcluded decision might eventually lead to open tender resulting in more CAPEX outlay and we do not discount the possibility of MCMC roping in smaller players (PS, U Mobile, REDtone) to increase the competitiveness of the bidding process. Currently, all 3 (Maxis, DiGi and Celcom) have equal capacity in the 1,800MHz band (see Figure #6) while DiGi has the smallest allocation in the 900MHz band (see Figure #5) and seeks to be treated equally. If this materializes, DiGi will gain at the expense of Maxis and Celcom.
Figure #5 Existing 900MHz allocations
MCMC
Figure #6 Existing 1800MHz allocations
MCMC
As anticipated, the introduction of Equipment Identity Register (EIR) in 2013 has resulted in cellcos footing another bill from clearing house besides Mobile Number Portability (MNP). While this service is offered free of charge to subscribers, cellcos would need to fork out RM1.50 per subscriber annually to maintain the Malaysian Central EIR (MCEIR) which eventually lead to minor impact to cellcos’ bottom line, with 0.89%, 0.91% and 0.67% of Maxis, DiGi and Axiata’s FY14E PAT respectively. Although this service rollout is attached with the objective to reduce phone thefts, its success is opined to be limited as IMEI cloning is widely known as the neutralizer of this security measure. In November 2013, MCMC has issued a stern warning to cellcos that are providing subpar 3G services with lower-than-agreed bandwidth, causing deterioration in the quality of service. The root cause was identified as the usage of 900MHz and 1,800MHz frequency bands instead of the primary 2,100MHz band dedicated for 3G services as cellcos wanted to achieve better cost efficiency (see Figure #2 and #3). The regulator has given the players untill the end of the year to come up with a plan to rectify the situation or face fines,
But dependent on DTTB.
900MHz and 1800MHz
airwave reallocations.
Another bill for EIR, while
MNP yet to declare
effective.
Quality of service (QoS)
under scrutiny.
HLIB Research | Telecommunications
www.hlebroking.com
Page 5 of 20
13 January 2014
given the rise in the number of complaints regarding capacity and speed of 3G services. We are not overly concern on this as we understand that cellcos are constantly in dialogues with the regulator on continuous improvements and stay heavily invested in telco infrastructure and network to enhance both coverage and quality. Therefore, even if there is any need or new requirements, cellcos would be able to absorb them easily and would not materially derail their huge budgeted annual CAPEX. Under any unfortunate scenario that any cellco is penalized, historical cases suggest that the penalty amount is small and negligible to cellcos’ earnings (see Figure #7).
Figure #7 Historical Penalty Cases
Date Breaches Telco Fine (RM)
6 Mar 2013 Dropped calls DiGi 100k
6 Mar 2013 Dropped calls Celcom 60k
6 Mar 2013 Dropped calls Maxis 30k
12 Mar 2013 False prepaid registration Celcom 400k
12 Mar 2013 False prepaid registration Merchantrade 240k
12 Mar 2013 False prepaid registration U Mobile 100k
12 Mar 2013 False prepaid registration Maxis 160k
12 Mar 2013 False prepaid registration Tune Talk 10k
MCMC
In the most recent announcement of electricity tariff hike, telcos which fall under the category of commercial and industrial will experience an average electricity bill increase of 16.85% effective 1 Jan 2014. Based on our estimation, electricity expense is a relatively small element in telco’s overall cost base, accounting for 3%-5%. As a result, we do not expect this tariff revision to impact telcos materially.
Economic Factors
In general, telco share price movements are always associated with dividend yield play and hence susceptible to changes in bond yields through an inverse relationship. We expect BNM to hold OPR steady at 3.0% in 1H14 as it weighs the impact of a contractionary Budget (with an expected external improvement) against the pass-through effect from collective subsidy removals. The monetary bias for 2H14, however, is tilted towards slight tightening, with a hike of 25bps in the OPR to 3.25%. From the latest uptick in MGS yields, we believe a 25bps rate hike has been largely factored in by the market (see Figure #8). If market’s yield expectation continues to rise, telcos’ dividend yield will eventually perceived to be less attractive and subsequently, this will exert pressure on share price.
Figure #8 3-Year MGS Yield Curve
Bloomberg, HLIB
Penalty is small and
negligible to cellcos’
earnings.
Electricity tariff hike
would not impact telcos
materially.
Dividend yield play.
We expect a hike of
25bps in 2H14…
…thus, exert pressure on
share price.
Uptick in MGS yield.
HLIB Research | Telecommunications
www.hlebroking.com
Page 6 of 20
13 January 2014
Singularly, cellco is the only commercial sector that cheers and eagers for the goods and services tax (GST) implementation which was announced during Budget 2014. Touted to be effective on 1
st April 2015, cellcos are hoping to leverage on this new policy as a
channel to cascade the prepaid service tax to subscribers, resolving the issue which faced negotiation gridlocks with the government since 2011. This is a major relieve to the cellcos as they are paying the prepaid service tax to government although they did not collect from the sales of airtime through prepaid top-ups which in turn, weighed down on their earnings. We welcome this development and expect DiGi to benefit the most with the highest proportion (84.3%) of prepaid users to total subscriber base, compared to Celcom (78.2%) and Maxis (74.5%). Based on our estimation using 3Q13 operating data, DiGi will possibly enjoy the most with 10.9% in earning uplift (based on FY15E PAT), followed by Maxis and Axiata with 7.6% and 6.6% respectively, provided competition and usage remain status quo. However, we would like to highlight the risk of lower usage (MOU) from prepaid subscribers after the pass through is enforced considering the highly price sensitive nature of this market segment, especially migrants who are the major contributor of the prepaid segment. Hence, this may dwarf our bullish estimation above in the short term as usage declines. We also do not discount that cellcos may use this opportunity to intensify competition by introducing new packages to compensate the higher cost of service with extra air time or download quota to prepaid subscribers which may also neutralize part of the gain from the tax savings. Moreover, even if the above mentioned scenarios do not materialize, regulator may grasp the opportunity to revise access pricing further downward which is slated for renewal (every 3 years) at the end of 2015 should cellcos become too profitable (EBITDA margin >50%) at the expense of consumers as well as to promote healthy competition. Hence, this catalyst may prove to be short-lived. From consumer’s psychology point of view, we do believe that the negatives from GST implementation and subsidy removal will be partly offset by higher BR1M payments (for lower-income group) and the expected tax savings from income tax reduction (for tax payers). Some of the quantifiable measures leading to higher disposable income are summarized in Figure #9. All in, we anticipate that the sector as a whole is sustainable with a moderate growth rate of low to mid-single digit growth in 2014 supported by the resilient domestic consumerism.
Figure #9 Measures Leading to Higher Household Income
No Measure Calculation Allocation (RM mil)
1 Review of income tax reduction (1-3ppt up to taxable income RM400K) FY15
RM28.7bn x 15% 4,300
2 Special relief RM2K (monthly income <RM8K) FY14 RM480 x 0.9m 432
3 BR1M (RM650 for households with monthly income lower than RM3K)
RM650 x 4.3m 2,795
4 BR1M (RM300 for singles with monthly income lower than RM2K)
RM300 x 2.7m 810
5 Extended BR1M (RM450 for households with monthly income RM3K-4K)
RM450 x 0.9m 405
6 RM100 for all primary & secondary students RM100 x 5.4m 540
7 RM200 book vouchers for students in higher learning institutions RM250 x 1.3m 325
8 ½ month bonus for civil servants - 2,000
11,607
% of 2014 nominal private consumption 2.1%
% of 2014 real GDP 1.1%
Economic Report 2013/14, BNM AR2012, HLIB
Additionally, Budget 2014 also tabled several measures targeted to develop national telecommunication infrastructure, namely: HSBB phase 2 Implementation in collaboration with the private sector involving an
investment of RM1.8bn. To provide additional coverage and facilities mainly in urban areas, benefiting 2.8m
households nationwide. The Internet speed will be increased to 10Mbps. HSBB to be expanded to suburban areas with an Internet access speed increasing to
between 4Mbps and 10Mbps, which will benefit 2m consumers at a cost of RM1.6bn. To increase Internet coverage in rural areas, 1k telcos transmission towers will be built
over the next 3 years, with an investment of RM1.5bn.
Cellcos cheer and eager
for GST…
…to pass through prepaid
service tax.
But may not boost
earnings, due to lower
MOU,…
…intensified
competition…
…and regulated pricing.
Growth supported by
domestic consumerism…
…which boosted by
higher disposable
income.
Telco measures under
Budget 2014…
HLIB Research | Telecommunications
www.hlebroking.com
Page 7 of 20
13 January 2014
To increase Internet coverage in Sabah and Sarawak, new underwater cables will be laid within 3 years, at a cost of RM850m.
Expanding internet in schools especially in rural areas with an allocation of RM168m. Holistic evaluation leads us to opine that the measures augur well with the current progress and direction of the industry which is heading towards data era and creating a win-win scenario for all telcos. Having said that, we inevitably notice that TM stands out as the major beneficiary of all these proposals. Leveraging on its success story of HSBB phase 1, TM is the logical forerunner to win phase 2. With CAPEX co-funded by the government, this will definitely heighten TM’s growth with data as the key driver in both retail and wholesale segments. TM is also favored for the submarine cable contract. Lastly, we expect MYR to remain volatile throughout 2014 as the improvement in economic fundamentals is offset by unexciting growth outlook. We believe MYR weakness has been largely priced in given mild pace of Fed tapering (max US$10bn per FOMC meeting) as well as improvement in economic fundamentals. Our house view calls for a range of RM3.15-3.30/US$ for 2014, with a mid-point forecast of RM3.20/US$. We opine that the risk tends to lean towards intermittent weakness as and when US Fed decides to scale back its stimulus programme throughout 2014. Hence, we do foresee that FOREX risk could be a possible de-rating catalyst, especially for telcos with substantial debts dominated in greenback, such as Axiata and TM.
Social Factors
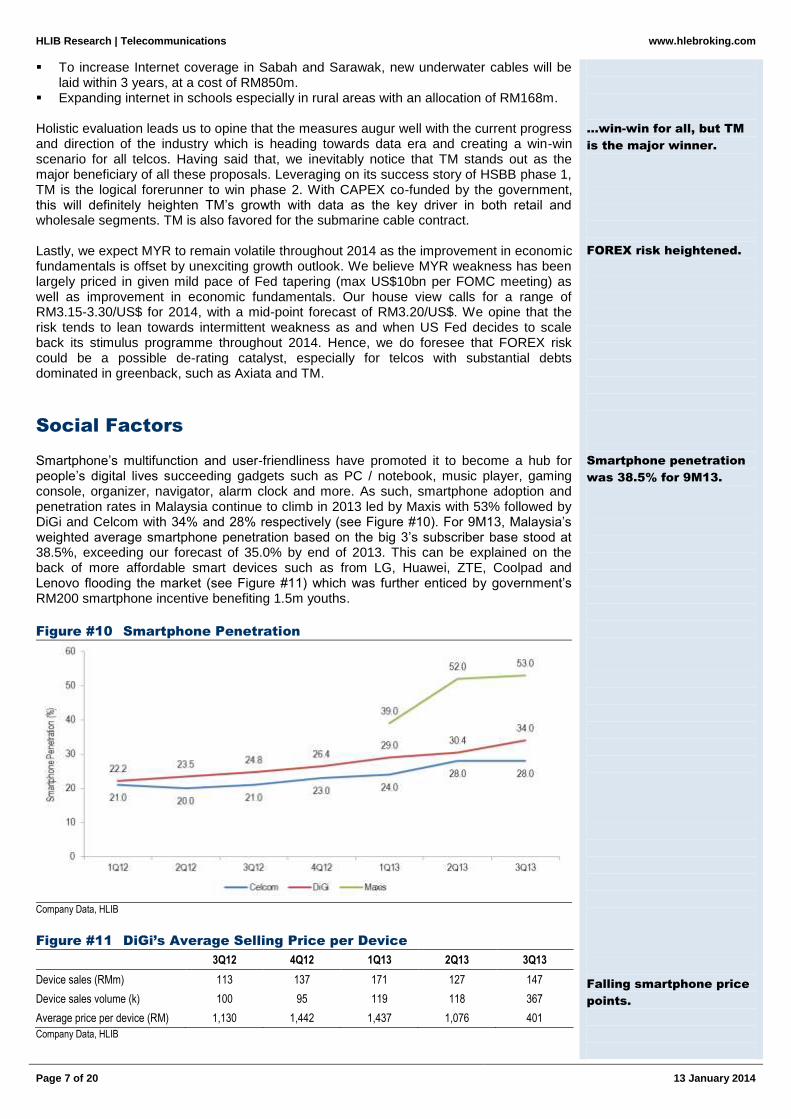
Smartphone’s multifunction and user-friendliness have promoted it to become a hub for people’s digital lives succeeding gadgets such as PC / notebook, music player, gaming console, organizer, navigator, alarm clock and more. As such, smartphone adoption and penetration rates in Malaysia continue to climb in 2013 led by Maxis with 53% followed by DiGi and Celcom with 34% and 28% respectively (see Figure #10). For 9M13, Malaysia’s weighted average smartphone penetration based on the big 3’s subscriber base stood at 38.5%, exceeding our forecast of 35.0% by end of 2013. This can be explained on the back of more affordable smart devices such as from LG, Huawei, ZTE, Coolpad and Lenovo flooding the market (see Figure #11) which was further enticed by government’s RM200 smartphone incentive benefiting 1.5m youths.
Figure #10 Smartphone Penetration
Company Data, HLIB
Figure #11 DiGi’s Average Selling Price per Device
3Q12 4Q12 1Q13 2Q13 3Q13
Device sales (RMm) 113 137 171 127 147
Device sales volume (k) 100 95 119 118 367
Average price per device (RM) 1,130 1,442 1,437 1,076 401
Company Data, HLIB
…win-win for all, but TM
is the major winner.
FOREX risk heightened.
Smartphone penetration
was 38.5% for 9M13.
Falling smartphone price
points.
HLIB Research | Telecommunications
www.hlebroking.com
Page 8 of 20
13 January 2014
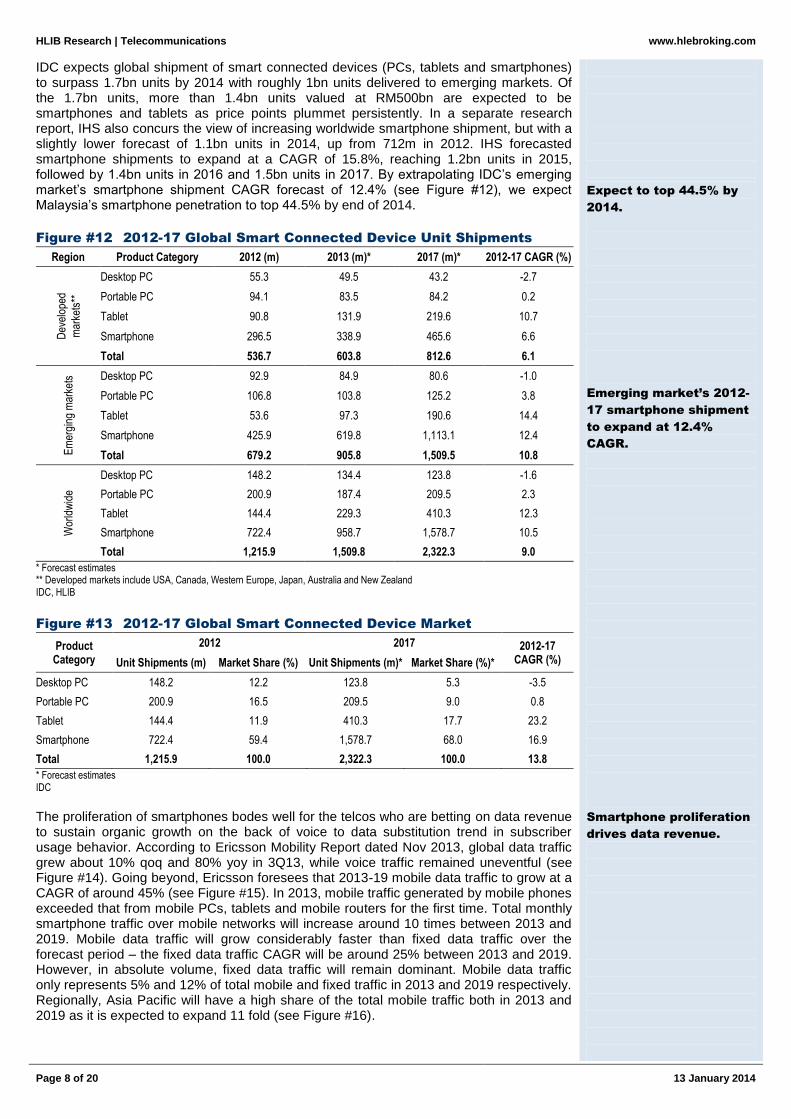
IDC expects global shipment of smart connected devices (PCs, tablets and smartphones) to surpass 1.7bn units by 2014 with roughly 1bn units delivered to emerging markets. Of the 1.7bn units, more than 1.4bn units valued at RM500bn are expected to be smartphones and tablets as price points plummet persistently. In a separate research report, IHS also concurs the view of increasing worldwide smartphone shipment, but with a slightly lower forecast of 1.1bn units in 2014, up from 712m in 2012. IHS forecasted smartphone shipments to expand at a CAGR of 15.8%, reaching 1.2bn units in 2015, followed by 1.4bn units in 2016 and 1.5bn units in 2017. By extrapolating IDC’s emerging market’s smartphone shipment CAGR forecast of 12.4% (see Figure #12), we expect Malaysia’s smartphone penetration to top 44.5% by end of 2014.
Figure #12 2012-17 Global Smart Connected Device Unit Shipments
Region Product Category 2012 (m) 2013 (m)* 2017 (m)* 2012-17 CAGR (%)
Dev
elop
ed
mar
kets
**
Desktop PC 55.3 49.5 43.2 -2.7
Portable PC 94.1 83.5 84.2 0.2
Tablet 90.8 131.9 219.6 10.7
Smartphone 296.5 338.9 465.6 6.6
Total 536.7 603.8 812.6 6.1
Em
ergi
ng m
arke
ts Desktop PC 92.9 84.9 80.6 -1.0
Portable PC 106.8 103.8 125.2 3.8
Tablet 53.6 97.3 190.6 14.4
Smartphone 425.9 619.8 1,113.1 12.4
Total 679.2 905.8 1,509.5 10.8
Wor
ldw
ide
Desktop PC 148.2 134.4 123.8 -1.6
Portable PC 200.9 187.4 209.5 2.3
Tablet 144.4 229.3 410.3 12.3
Smartphone 722.4 958.7 1,578.7 10.5
Total 1,215.9 1,509.8 2,322.3 9.0
* Forecast estimates ** Developed markets include USA, Canada, Western Europe, Japan, Australia and New Zealand IDC, HLIB
Figure #13 2012-17 Global Smart Connected Device Market
Product Category
2012 2017 2012-17 CAGR (%) Unit Shipments (m) Market Share (%) Unit Shipments (m)* Market Share (%)*
Desktop PC 148.2 12.2 123.8 5.3 -3.5
Portable PC 200.9 16.5 209.5 9.0 0.8
Tablet 144.4 11.9 410.3 17.7 23.2
Smartphone 722.4 59.4 1,578.7 68.0 16.9
Total 1,215.9 100.0 2,322.3 100.0 13.8
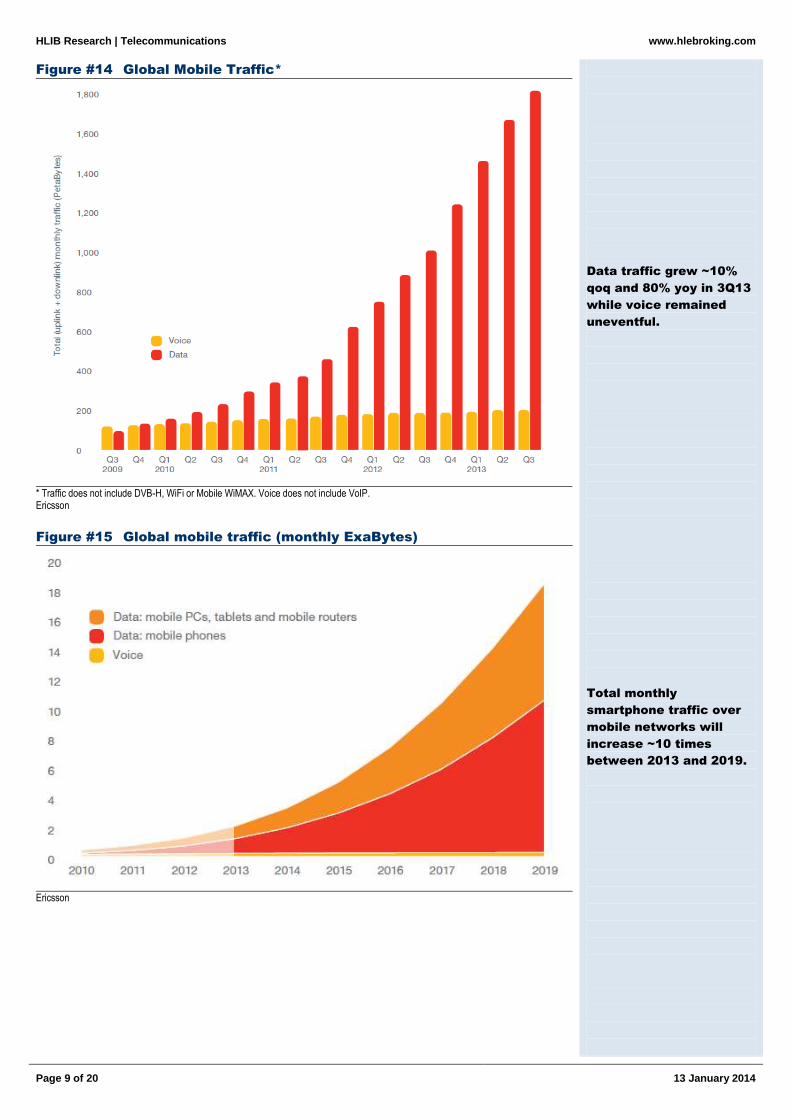
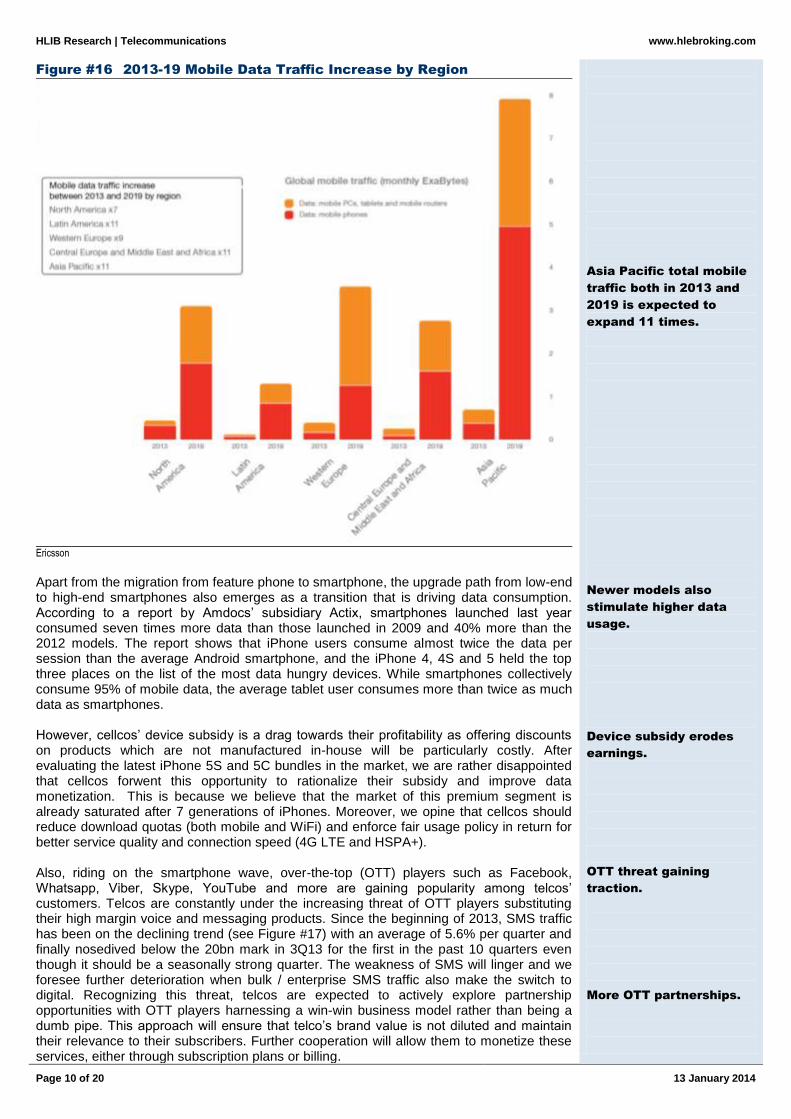
* Forecast estimates IDC The proliferation of smartphones bodes well for the telcos who are betting on data revenue to sustain organic growth on the back of voice to data substitution trend in subscriber usage behavior. According to Ericsson Mobility Report dated Nov 2013, global data traffic grew about 10% qoq and 80% yoy in 3Q13, while voice traffic remained uneventful (see Figure #14). Going beyond, Ericsson foresees that 2013-19 mobile data traffic to grow at a CAGR of around 45% (see Figure #15). In 2013, mobile traffic generated by mobile phones exceeded that from mobile PCs, tablets and mobile routers for the first time. Total monthly smartphone traffic over mobile networks will increase around 10 times between 2013 and 2019. Mobile data traffic will grow considerably faster than fixed data traffic over the forecast period – the fixed data traffic CAGR will be around 25% between 2013 and 2019. However, in absolute volume, fixed data traffic will remain dominant. Mobile data traffic only represents 5% and 12% of total mobile and fixed traffic in 2013 and 2019 respectively. Regionally, Asia Pacific will have a high share of the total mobile traffic both in 2013 and 2019 as it is expected to expand 11 fold (see Figure #16).
Expect to top 44.5% by
2014.
Emerging market’s 2012-
17 smartphone shipment
to expand at 12.4%
CAGR.
Smartphone proliferation
drives data revenue.
HLIB Research | Telecommunications
www.hlebroking.com
Page 9 of 20
13 January 2014
Figure #14 Global Mobile Traffic*
* Traffic does not include DVB-H, WiFi or Mobile WiMAX. Voice does not include VoIP. Ericsson
Figure #15 Global mobile traffic (monthly ExaBytes)
Ericsson
Data traffic grew ~10%
qoq and 80% yoy in 3Q13
while voice remained
uneventful.
Total monthly
smartphone traffic over
mobile networks will
increase ~10 times
between 2013 and 2019.
HLIB Research | Telecommunications
www.hlebroking.com
Page 10 of 20
13 January 2014
Figure #16 2013-19 Mobile Data Traffic Increase by Region
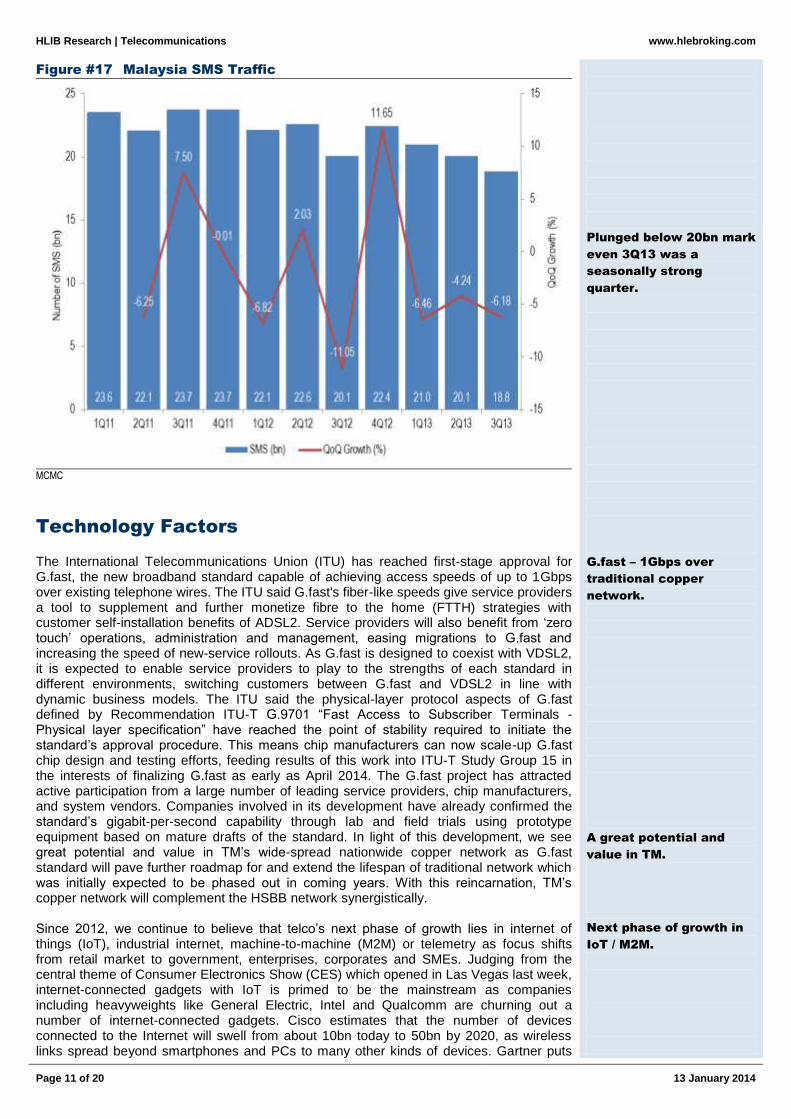
Ericsson Apart from the migration from feature phone to smartphone, the upgrade path from low-end to high-end smartphones also emerges as a transition that is driving data consumption. According to a report by Amdocs’ subsidiary Actix, smartphones launched last year consumed seven times more data than those launched in 2009 and 40% more than the 2012 models. The report shows that iPhone users consume almost twice the data per session than the average Android smartphone, and the iPhone 4, 4S and 5 held the top three places on the list of the most data hungry devices. While smartphones collectively consume 95% of mobile data, the average tablet user consumes more than twice as much data as smartphones. However, cellcos’ device subsidy is a drag towards their profitability as offering discounts on products which are not manufactured in-house will be particularly costly. After evaluating the latest iPhone 5S and 5C bundles in the market, we are rather disappointed that cellcos forwent this opportunity to rationalize their subsidy and improve data monetization. This is because we believe that the market of this premium segment is already saturated after 7 generations of iPhones. Moreover, we opine that cellcos should reduce download quotas (both mobile and WiFi) and enforce fair usage policy in return for better service quality and connection speed (4G LTE and HSPA+). Also, riding on the smartphone wave, over-the-top (OTT) players such as Facebook, Whatsapp, Viber, Skype, YouTube and more are gaining popularity among telcos’ customers. Telcos are constantly under the increasing threat of OTT players substituting their high margin voice and messaging products. Since the beginning of 2013, SMS traffic has been on the declining trend (see Figure #17) with an average of 5.6% per quarter and finally nosedived below the 20bn mark in 3Q13 for the first in the past 10 quarters even though it should be a seasonally strong quarter. The weakness of SMS will linger and we foresee further deterioration when bulk / enterprise SMS traffic also make the switch to digital. Recognizing this threat, telcos are expected to actively explore partnership opportunities with OTT players harnessing a win-win business model rather than being a dumb pipe. This approach will ensure that telco’s brand value is not diluted and maintain their relevance to their subscribers. Further cooperation will allow them to monetize these services, either through subscription plans or billing.
Asia Pacific total mobile
traffic both in 2013 and
2019 is expected to
expand 11 times.
Newer models also
stimulate higher data
usage.
Device subsidy erodes
earnings.
OTT threat gaining
traction.
More OTT partnerships.
HLIB Research | Telecommunications
www.hlebroking.com
Page 11 of 20
13 January 2014
Figure #17 Malaysia SMS Traffic
MCMC
Technology Factors
The International Telecommunications Union (ITU) has reached first-stage approval for G.fast, the new broadband standard capable of achieving access speeds of up to 1Gbps over existing telephone wires. The ITU said G.fast's fiber-like speeds give service providers a tool to supplement and further monetize fibre to the home (FTTH) strategies with customer self-installation benefits of ADSL2. Service providers will also benefit from ‘zero touch’ operations, administration and management, easing migrations to G.fast and increasing the speed of new-service rollouts. As G.fast is designed to coexist with VDSL2, it is expected to enable service providers to play to the strengths of each standard in different environments, switching customers between G.fast and VDSL2 in line with dynamic business models. The ITU said the physical-layer protocol aspects of G.fast defined by Recommendation ITU-T G.9701 “Fast Access to Subscriber Terminals - Physical layer specification” have reached the point of stability required to initiate the standard’s approval procedure. This means chip manufacturers can now scale-up G.fast chip design and testing efforts, feeding results of this work into ITU-T Study Group 15 in the interests of finalizing G.fast as early as April 2014. The G.fast project has attracted active participation from a large number of leading service providers, chip manufacturers, and system vendors. Companies involved in its development have already confirmed the standard’s gigabit-per-second capability through lab and field trials using prototype equipment based on mature drafts of the standard. In light of this development, we see great potential and value in TM’s wide-spread nationwide copper network as G.fast standard will pave further roadmap for and extend the lifespan of traditional network which was initially expected to be phased out in coming years. With this reincarnation, TM’s copper network will complement the HSBB network synergistically. Since 2012, we continue to believe that telco’s next phase of growth lies in internet of things (IoT), industrial internet, machine-to-machine (M2M) or telemetry as focus shifts from retail market to government, enterprises, corporates and SMEs. Judging from the central theme of Consumer Electronics Show (CES) which opened in Las Vegas last week, internet-connected gadgets with IoT is primed to be the mainstream as companies including heavyweights like General Electric, Intel and Qualcomm are churning out a number of internet-connected gadgets. Cisco estimates that the number of devices connected to the Internet will swell from about 10bn today to 50bn by 2020, as wireless links spread beyond smartphones and PCs to many other kinds of devices. Gartner puts
Plunged below 20bn mark
even 3Q13 was a
seasonally strong
quarter.
G.fast – 1Gbps over
traditional copper
network.
A great potential and
value in TM.
Next phase of growth in
IoT / M2M.
HLIB Research | Telecommunications
www.hlebroking.com
Page 12 of 20
13 January 2014
the number of connected devices at fewer than 30bn, but sees USD309bn in additional revenue for product and service suppliers by 2020 and USD1.9tr in total economic impact from cost savings, improved productivity and other factors. Research firm Ovum tipped that over the next 4 years, Asia Pacific (AP), Middle East and Africa are the fastest growing regions for M2M connections at a CAGR of 22.6% to reach 360.9m in 2018, more than treble from 106.4m in 2012. Ovum predicts that revenues in AP will grow to almost USD15bn at a CAGR of 26.5% between 2012 and 2018. The leading industry verticals in 2018 will be healthcare, manufacturing, energy and utilities, which are forecast to generate revenues of USD7.9bn, USD7.1bn, and USD7bn respectively by 2018. In order to capture this opportunity, telcos would need to re-strategize and transform product offerings from pure connectivity services to end-to-end solutions providing cost effectiveness and efficiencies to business demands. As such, Maxis has pledged that 2014 will be the staging year to reposition itself and establish
the necessary foundations before going aggressive into enterprise market, especially in managed services for corporates in 2015-16.
DiGi to deploy Ericsson device connection platform to manage M2M and consumer electronics devices.
Acquired GTC Global to complement TM’s core competencies as well as broaden its capabilities in ICT (integrated security surveillance systems and broadband solutions) to better serve its range of customers, particularly in the enterprise and government segments.
We reiterate our view that LTE is not a rerating catalyst to the Malaysian telco sector although it can deliver exceptional bandwidth performance and higher spectrum efficiency. We foresee the following challenges and difficulties ahead for the telcos: 8 cellular players, TM may be the 9
th, in the arena are just too crowded assuming that
none of the recipient loan or sell their spectrum allocations. No 4G premium pricing over 3G or any new innovative bundling which could improve
data monetization. With the recent launch by U Mobile offering hassle-free upgrade (no change of plan, no change of SIM card and no additional subscription fee needed), we opine that hiking of differentiating 4G data tariff will be a major uphill task.
Telcos would need to spend more in advertising and promotion to create awareness and educate the market of 4G’s value proposition, especially to differentiate LTE from WiMAX which is already available in the market and coined as 4G solution.
The availability of 4G devices at affordable level will also play an important role in dictating the success of 4G. 4G devices are expected to be costly as they are also embedded with 2G and 3G components in order to be backward compatible. Telcos may need to heavily subsidize them to drive adoption rate.
With HSBB penetration and WiFi hotspot deployment gaining momentum, 4G take up rate is expected to be subdued.
Nonetheless, with demand evolved from voice to data, telcos are facing great challenges in monetizing data usage. We expect telcos to stay invested in IT besides 4G mainly to beef up their charging / billing mechanisms and business intelligence. More insight of customer behaviors will permit subscriber segmentation based on micro granular criteria and subsequently allow telcos to offer a more personalized and targeted services as well as dynamic tariff products which intend to stimulate usage by exploiting price elasticity of demand. Lastly, the continuous technological advancement has empowered telcos to manage cost structure more prudently. Equipment with higher capacity, modular architecture (Advanced Telecommunications Computing Architecture – ATCA), simplified network management (software defined network – SDN and network function virtualization – NFV), standardized protocols, single-RAN (radio access network), unified subscriber depository and more, permitting telco to consolidate network by reducing network nodes leading to lower OPEX in terms of headcounts, maintenance costs and other overheads. While it is yet to be materialized, we always think that outsourcing of telco’s network operations is a catalyst towards a more sustainable business model. Not only it would help telcos to be more focus in business development and customer service, managed services would enable telcos to leap from CAPEX to OPEX model. As such, telcos will be free of chasing after the forever evolving technology, boosting free cash flow for higher dividend distribution.
Telcos has begun to
react.
LTE yet to be a catalyst.
IT investments to
enhance charging / billing
mechanisms and
business intelligence.
Technology driven cost
rationalization.
Outsourcing for more
sustainable business
model.
HLIB Research | Telecommunications
www.hlebroking.com
Page 13 of 20
13 January 2014
Recommendations
Majority of the social and technological factors indicates that telco sector would continue to expand strongly into 2014 driven by insatiable data demand on the back of resiliency of domestic consumerism. However, we deduce that this optimism will somehow be neutralized by the negativity from political and economic factors. Share prices are likely to be volatile dictated by bond yields and FOREX movements while excited by corporate actions including DiGi’s business trust and Axiata’s tower listing. At this juncture, it will be too speculative to make any judgment while even regulatory hurdles are not clarified confidently by respective telcos. All in, due to the lack of rerating catalyst(s) that could significantly boost earnings as well as the rich valuation of Malaysian telco stocks, we reiterate our Neutral rating for the sector. However, we do not deny that telcos enjoys stable recurring revenues strongly supported by resilient domestic demand and are largely seen to be recession-proof. Thus, the high dividend yield characteristic will continue to lure investors especially in this highly volatile market. For 2014, we prefer fixed over mobile telcos. In view of the upbeat mobile data traffic growth, fixed networks as transmission backhaul has groomed to be the inevitable pre-requisite to cellcos. For Malaysia, fixed market outlook is comparatively healthier with only 2 players (a monopoly in retail segment and duopoly in wholesale and enterprise segment). Our top picks in the sector are: 1. TdC (BUY, TP: RM4.03) - exposure to regional data boom and APG which will
commence operation in 1Q15 is expected to fuel future growth. 2. TM (BUY, TP: RM5.82) - Exponential demand for data, HSBB phase 2, strengthening
of ARPU (subscription to higher speed and HyppTV), superior LTE (on 850MHz) to complement HSBB.
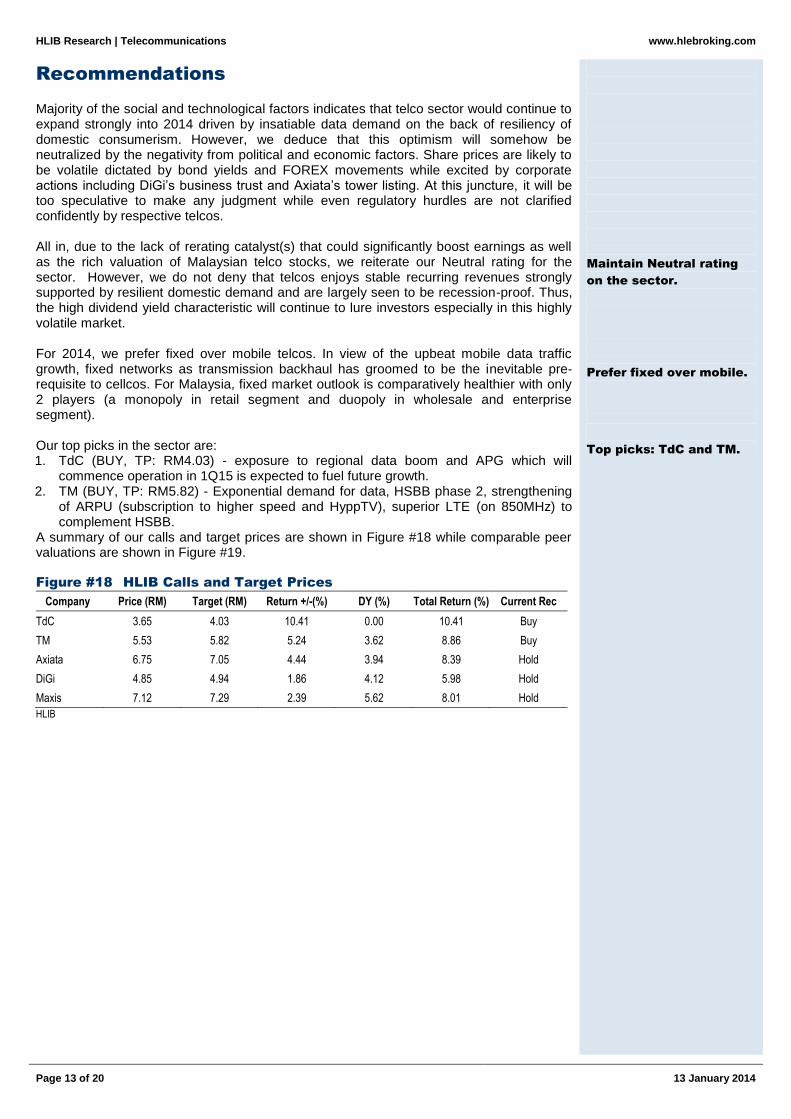
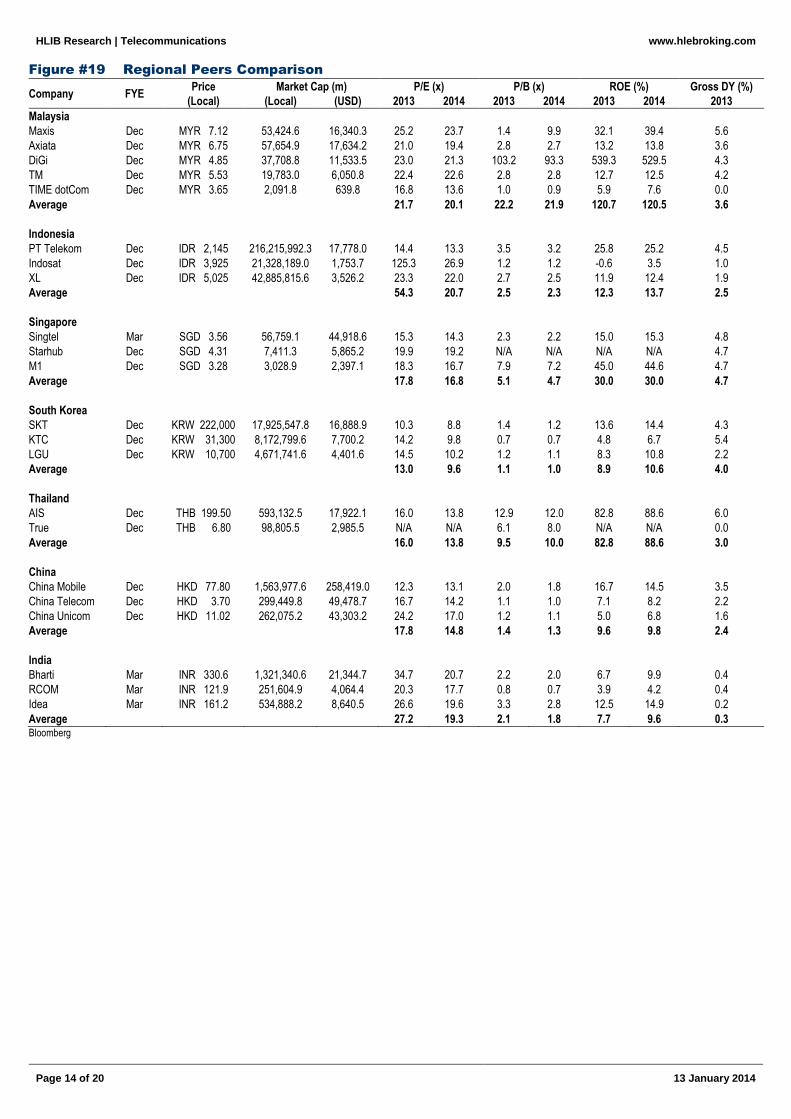
A summary of our calls and target prices are shown in Figure #18 while comparable peer valuations are shown in Figure #19.
Figure #18 HLIB Calls and Target Prices
Company Price (RM) Target (RM) Return +/-(%) DY (%) Total Return (%) Current Rec
TdC 3.65 4.03 10.41 0.00 10.41 Buy
TM 5.53 5.82 5.24 3.62 8.86 Buy
Axiata 6.75 7.05 4.44 3.94 8.39 Hold
DiGi 4.85 4.94 1.86 4.12 5.98 Hold
Maxis 7.12 7.29 2.39 5.62 8.01 Hold
HLIB
Maintain Neutral rating
on the sector.
Prefer fixed over mobile.
Top picks: TdC and TM.
HLIB Research | Telecommunications
www.hlebroking.com
Page 14 of 20
13 January 2014
Figure #19 Regional Peers Comparison
Company FYE Price Market Cap (m) P/E (x) P/B (x) ROE (%) Gross DY (%)
(Local) (Local) (USD) 2013 2014 2013 2014 2013 2014 2013
Malaysia
Maxis Dec MYR 7.12 53,424.6 16,340.3 25.2 23.7 1.4 9.9 32.1 39.4 5.6
Axiata Dec MYR 6.75 57,654.9 17,634.2 21.0 19.4 2.8 2.7 13.2 13.8 3.6
DiGi Dec MYR 4.85 37,708.8 11,533.5 23.0 21.3 103.2 93.3 539.3 529.5 4.3
TM Dec MYR 5.53 19,783.0 6,050.8 22.4 22.6 2.8 2.8 12.7 12.5 4.2
TIME dotCom Dec MYR 3.65 2,091.8 639.8 16.8 13.6 1.0 0.9 5.9 7.6 0.0
Average 21.7 20.1 22.2 21.9 120.7 120.5 3.6
Indonesia
PT Telekom Dec IDR 2,145 216,215,992.3 17,778.0 14.4 13.3 3.5 3.2 25.8 25.2 4.5
Indosat Dec IDR 3,925 21,328,189.0 1,753.7 125.3 26.9 1.2 1.2 -0.6 3.5 1.0
XL Dec IDR 5,025 42,885,815.6 3,526.2 23.3 22.0 2.7 2.5 11.9 12.4 1.9
Average 54.3 20.7 2.5 2.3 12.3 13.7 2.5
Singapore
Singtel Mar SGD 3.56 56,759.1 44,918.6 15.3 14.3 2.3 2.2 15.0 15.3 4.8
Starhub Dec SGD 4.31 7,411.3 5,865.2 19.9 19.2 N/A N/A N/A N/A 4.7
M1 Dec SGD 3.28 3,028.9 2,397.1 18.3 16.7 7.9 7.2 45.0 44.6 4.7
Average 17.8 16.8 5.1 4.7 30.0 30.0 4.7
South Korea
SKT Dec KRW 222,000 17,925,547.8 16,888.9 10.3 8.8 1.4 1.2 13.6 14.4 4.3
KTC Dec KRW 31,300 8,172,799.6 7,700.2 14.2 9.8 0.7 0.7 4.8 6.7 5.4
LGU Dec KRW 10,700 4,671,741.6 4,401.6 14.5 10.2 1.2 1.1 8.3 10.8 2.2
Average 13.0 9.6 1.1 1.0 8.9 10.6 4.0
Thailand
AIS Dec THB 199.50 593,132.5 17,922.1 16.0 13.8 12.9 12.0 82.8 88.6 6.0
True Dec THB 6.80 98,805.5 2,985.5 N/A N/A 6.1 8.0 N/A N/A 0.0
Average 16.0 13.8 9.5 10.0 82.8 88.6 3.0
China
China Mobile Dec HKD 77.80 1,563,977.6 258,419.0 12.3 13.1 2.0 1.8 16.7 14.5 3.5
China Telecom Dec HKD 3.70 299,449.8 49,478.7 16.7 14.2 1.1 1.0 7.1 8.2 2.2
China Unicom Dec HKD 11.02 262,075.2 43,303.2 24.2 17.0 1.2 1.1 5.0 6.8 1.6
Average 17.8 14.8 1.4 1.3 9.6 9.8 2.4
India
Bharti Mar INR 330.6 1,321,340.6 21,344.7 34.7 20.7 2.2 2.0 6.7 9.9 0.4
RCOM Mar INR 121.9 251,604.9 4,064.4 20.3 17.7 0.8 0.7 3.9 4.2 0.4
Idea Mar INR 161.2 534,888.2 8,640.5 26.6 19.6 3.3 2.8 12.5 14.9 0.2
Average 27.2 19.3 2.1 1.8 7.7 9.6 0.3 Bloomberg
HLIB Research | Telecommunications
www.hlebroking.com
Page 15 of 20
13 January 2014
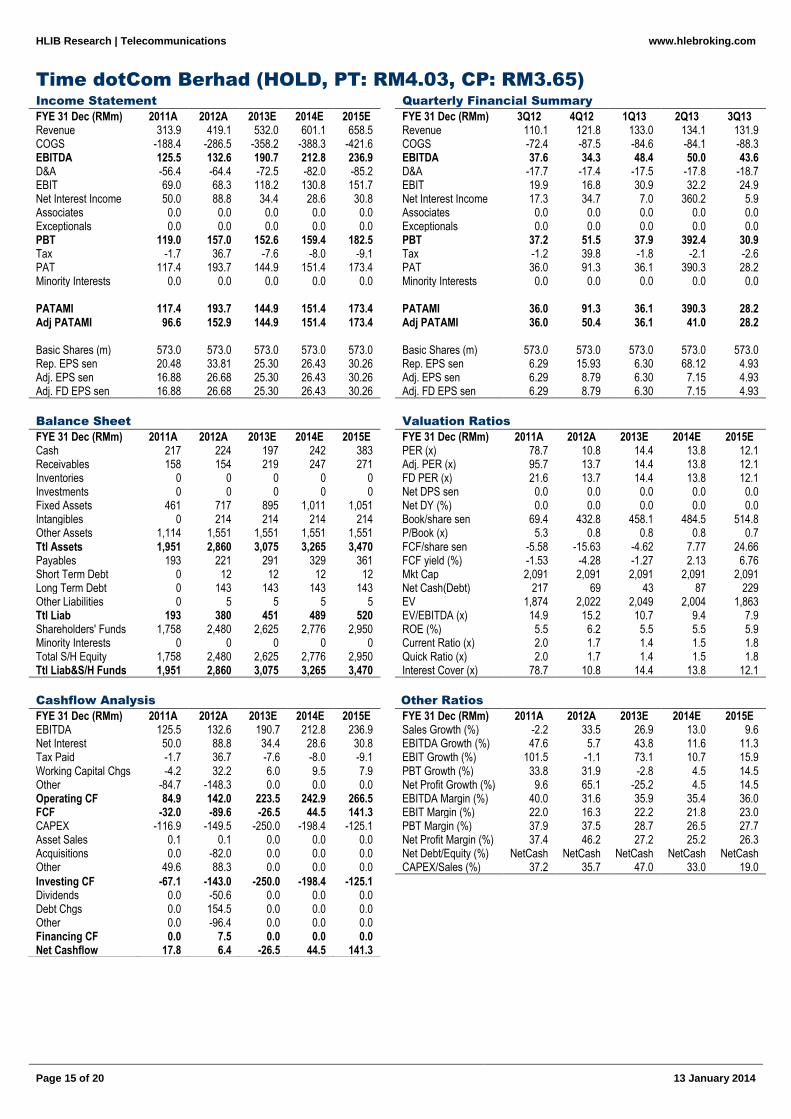
Time dotCom Berhad (HOLD, PT: RM4.03, CP: RM3.65)
Income Statement Quarterly Financial Summary
FYE 31 Dec (RMm) 2011A 2012A 2013E 2014E 2015E FYE 31 Dec (RMm) 3Q12 4Q12 1Q13 2Q13 3Q13 Revenue 313.9 419.1 532.0 601.1 658.5 Revenue 110.1 121.8 133.0 134.1 131.9 COGS -188.4 -286.5 -358.2 -388.3 -421.6 COGS -72.4 -87.5 -84.6 -84.1 -88.3 EBITDA 125.5 132.6 190.7 212.8 236.9 EBITDA 37.6 34.3 48.4 50.0 43.6 D&A -56.4 -64.4 -72.5 -82.0 -85.2 D&A -17.7 -17.4 -17.5 -17.8 -18.7 EBIT 69.0 68.3 118.2 130.8 151.7 EBIT 19.9 16.8 30.9 32.2 24.9 Net Interest Income 50.0 88.8 34.4 28.6 30.8 Net Interest Income 17.3 34.7 7.0 360.2 5.9 Associates 0.0 0.0 0.0 0.0 0.0 Associates 0.0 0.0 0.0 0.0 0.0 Exceptionals 0.0 0.0 0.0 0.0 0.0 Exceptionals 0.0 0.0 0.0 0.0 0.0 PBT 119.0 157.0 152.6 159.4 182.5 PBT 37.2 51.5 37.9 392.4 30.9 Tax -1.7 36.7 -7.6 -8.0 -9.1 Tax -1.2 39.8 -1.8 -2.1 -2.6 PAT 117.4 193.7 144.9 151.4 173.4 PAT 36.0 91.3 36.1 390.3 28.2 Minority Interests 0.0 0.0 0.0 0.0 0.0 Minority Interests 0.0 0.0 0.0 0.0 0.0 PATAMI 117.4 193.7 144.9 151.4 173.4 PATAMI 36.0 91.3 36.1 390.3 28.2 Adj PATAMI 96.6 152.9 144.9 151.4 173.4 Adj PATAMI 36.0 50.4 36.1 41.0 28.2 Basic Shares (m) 573.0 573.0 573.0 573.0 573.0 Basic Shares (m) 573.0 573.0 573.0 573.0 573.0 Rep. EPS sen 20.48 33.81 25.30 26.43 30.26 Rep. EPS sen 6.29 15.93 6.30 68.12 4.93 Adj. EPS sen 16.88 26.68 25.30 26.43 30.26 Adj. EPS sen 6.29 8.79 6.30 7.15 4.93 Adj. FD EPS sen 16.88 26.68 25.30 26.43 30.26 Adj. FD EPS sen 6.29 8.79 6.30 7.15 4.93
Balance Sheet Valuation Ratios
FYE 31 Dec (RMm) 2011A 2012A 2013E 2014E 2015E FYE 31 Dec (RMm) 2011A 2012A 2013E 2014E 2015E Cash 217 224 197 242 383 PER (x) 78.7 10.8 14.4 13.8 12.1 Receivables 158 154 219 247 271 Adj. PER (x) 95.7 13.7 14.4 13.8 12.1 Inventories 0 0 0 0 0 FD PER (x) 21.6 13.7 14.4 13.8 12.1 Investments 0 0 0 0 0 Net DPS sen 0.0 0.0 0.0 0.0 0.0 Fixed Assets 461 717 895 1,011 1,051 Net DY (%) 0.0 0.0 0.0 0.0 0.0 Intangibles 0 214 214 214 214 Book/share sen 69.4 432.8 458.1 484.5 514.8 Other Assets 1,114 1,551 1,551 1,551 1,551 P/Book (x) 5.3 0.8 0.8 0.8 0.7 Ttl Assets 1,951 2,860 3,075 3,265 3,470 FCF/share sen -5.58 -15.63 -4.62 7.77 24.66 Payables 193 221 291 329 361 FCF yield (%) -1.53 -4.28 -1.27 2.13 6.76 Short Term Debt 0 12 12 12 12 Mkt Cap 2,091 2,091 2,091 2,091 2,091 Long Term Debt 0 143 143 143 143 Net Cash(Debt) 217 69 43 87 229 Other Liabilities 0 5 5 5 5 EV 1,874 2,022 2,049 2,004 1,863 Ttl Liab 193 380 451 489 520 EV/EBITDA (x) 14.9 15.2 10.7 9.4 7.9 Shareholders' Funds 1,758 2,480 2,625 2,776 2,950 ROE (%) 5.5 6.2 5.5 5.5 5.9 Minority Interests 0 0 0 0 0 Current Ratio (x) 2.0 1.7 1.4 1.5 1.8 Total S/H Equity 1,758 2,480 2,625 2,776 2,950 Quick Ratio (x) 2.0 1.7 1.4 1.5 1.8 Ttl Liab&S/H Funds 1,951 2,860 3,075 3,265 3,470 Interest Cover (x) 78.7 10.8 14.4 13.8 12.1
Cashflow Analysis Other Ratios
FYE 31 Dec (RMm) 2011A 2012A 2013E 2014E 2015E FYE 31 Dec (RMm) 2011A 2012A 2013E 2014E 2015E EBITDA 125.5 132.6 190.7 212.8 236.9 Sales Growth (%) -2.2 33.5 26.9 13.0 9.6 Net Interest 50.0 88.8 34.4 28.6 30.8 EBITDA Growth (%) 47.6 5.7 43.8 11.6 11.3 Tax Paid -1.7 36.7 -7.6 -8.0 -9.1 EBIT Growth (%) 101.5 -1.1 73.1 10.7 15.9 Working Capital Chgs -4.2 32.2 6.0 9.5 7.9 PBT Growth (%) 33.8 31.9 -2.8 4.5 14.5 Other -84.7 -148.3 0.0 0.0 0.0 Net Profit Growth (%) 9.6 65.1 -25.2 4.5 14.5 Operating CF 84.9 142.0 223.5 242.9 266.5 EBITDA Margin (%) 40.0 31.6 35.9 35.4 36.0 FCF -32.0 -89.6 -26.5 44.5 141.3 EBIT Margin (%) 22.0 16.3 22.2 21.8 23.0 CAPEX -116.9 -149.5 -250.0 -198.4 -125.1 PBT Margin (%) 37.9 37.5 28.7 26.5 27.7 Asset Sales 0.1 0.1 0.0 0.0 0.0 Net Profit Margin (%) 37.4 46.2 27.2 25.2 26.3 Acquisitions 0.0 -82.0 0.0 0.0 0.0 Net Debt/Equity (%) NetCash NetCash NetCash NetCash NetCash Other 49.6 88.3 0.0 0.0 0.0 CAPEX/Sales (%) 37.2 35.7 47.0 33.0 19.0
Investing CF -67.1 -143.0 -250.0 -198.4 -125.1 Dividends 0.0 -50.6 0.0 0.0 0.0 Debt Chgs 0.0 154.5 0.0 0.0 0.0 Other 0.0 -96.4 0.0 0.0 0.0 Financing CF 0.0 7.5 0.0 0.0 0.0 Net Cashflow 17.8 6.4 -26.5 44.5 141.3
HLIB Research | Telecommunications
www.hlebroking.com
Page 16 of 20
13 January 2014
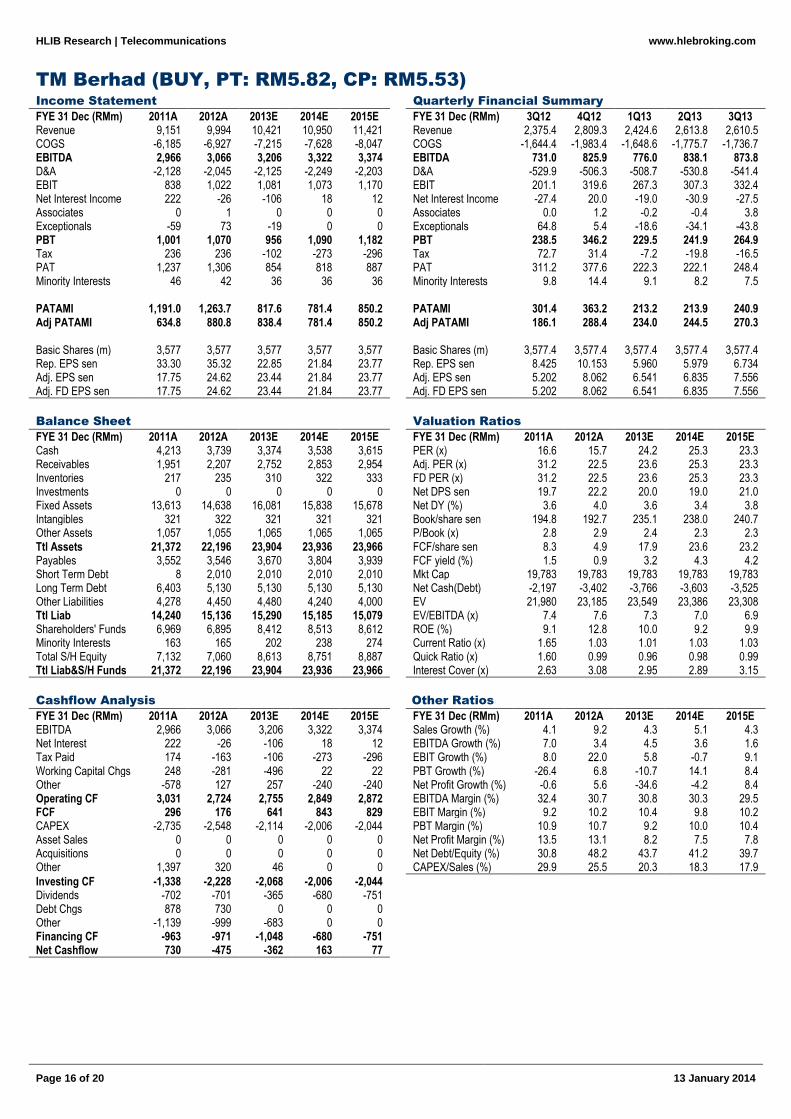
TM Berhad (BUY, PT: RM5.82, CP: RM5.53)
Income Statement Quarterly Financial Summary
FYE 31 Dec (RMm) 2011A 2012A 2013E 2014E 2015E FYE 31 Dec (RMm) 3Q12 4Q12 1Q13 2Q13 3Q13 Revenue 9,151 9,994 10,421 10,950 11,421 Revenue 2,375.4 2,809.3 2,424.6 2,613.8 2,610.5 COGS -6,185 -6,927 -7,215 -7,628 -8,047 COGS -1,644.4 -1,983.4 -1,648.6 -1,775.7 -1,736.7 EBITDA 2,966 3,066 3,206 3,322 3,374 EBITDA 731.0 825.9 776.0 838.1 873.8 D&A -2,128 -2,045 -2,125 -2,249 -2,203 D&A -529.9 -506.3 -508.7 -530.8 -541.4 EBIT 838 1,022 1,081 1,073 1,170 EBIT 201.1 319.6 267.3 307.3 332.4 Net Interest Income 222 -26 -106 18 12 Net Interest Income -27.4 20.0 -19.0 -30.9 -27.5 Associates 0 1 0 0 0 Associates 0.0 1.2 -0.2 -0.4 3.8 Exceptionals -59 73 -19 0 0 Exceptionals 64.8 5.4 -18.6 -34.1 -43.8 PBT 1,001 1,070 956 1,090 1,182 PBT 238.5 346.2 229.5 241.9 264.9 Tax 236 236 -102 -273 -296 Tax 72.7 31.4 -7.2 -19.8 -16.5 PAT 1,237 1,306 854 818 887 PAT 311.2 377.6 222.3 222.1 248.4 Minority Interests 46 42 36 36 36 Minority Interests 9.8 14.4 9.1 8.2 7.5 PATAMI 1,191.0 1,263.7 817.6 781.4 850.2 PATAMI 301.4 363.2 213.2 213.9 240.9 Adj PATAMI 634.8 880.8 838.4 781.4 850.2 Adj PATAMI 186.1 288.4 234.0 244.5 270.3 Basic Shares (m) 3,577 3,577 3,577 3,577 3,577 Basic Shares (m) 3,577.4 3,577.4 3,577.4 3,577.4 3,577.4 Rep. EPS sen 33.30 35.32 22.85 21.84 23.77 Rep. EPS sen 8.425 10.153 5.960 5.979 6.734 Adj. EPS sen 17.75 24.62 23.44 21.84 23.77 Adj. EPS sen 5.202 8.062 6.541 6.835 7.556 Adj. FD EPS sen 17.75 24.62 23.44 21.84 23.77 Adj. FD EPS sen 5.202 8.062 6.541 6.835 7.556
Balance Sheet Valuation Ratios
FYE 31 Dec (RMm) 2011A 2012A 2013E 2014E 2015E FYE 31 Dec (RMm) 2011A 2012A 2013E 2014E 2015E Cash 4,213 3,739 3,374 3,538 3,615 PER (x) 16.6 15.7 24.2 25.3 23.3 Receivables 1,951 2,207 2,752 2,853 2,954 Adj. PER (x) 31.2 22.5 23.6 25.3 23.3 Inventories 217 235 310 322 333 FD PER (x) 31.2 22.5 23.6 25.3 23.3 Investments 0 0 0 0 0 Net DPS sen 19.7 22.2 20.0 19.0 21.0 Fixed Assets 13,613 14,638 16,081 15,838 15,678 Net DY (%) 3.6 4.0 3.6 3.4 3.8 Intangibles 321 322 321 321 321 Book/share sen 194.8 192.7 235.1 238.0 240.7 Other Assets 1,057 1,055 1,065 1,065 1,065 P/Book (x) 2.8 2.9 2.4 2.3 2.3 Ttl Assets 21,372 22,196 23,904 23,936 23,966 FCF/share sen 8.3 4.9 17.9 23.6 23.2 Payables 3,552 3,546 3,670 3,804 3,939 FCF yield (%) 1.5 0.9 3.2 4.3 4.2 Short Term Debt 8 2,010 2,010 2,010 2,010 Mkt Cap 19,783 19,783 19,783 19,783 19,783 Long Term Debt 6,403 5,130 5,130 5,130 5,130 Net Cash(Debt) -2,197 -3,402 -3,766 -3,603 -3,525 Other Liabilities 4,278 4,450 4,480 4,240 4,000 EV 21,980 23,185 23,549 23,386 23,308 Ttl Liab 14,240 15,136 15,290 15,185 15,079 EV/EBITDA (x) 7.4 7.6 7.3 7.0 6.9 Shareholders' Funds 6,969 6,895 8,412 8,513 8,612 ROE (%) 9.1 12.8 10.0 9.2 9.9 Minority Interests 163 165 202 238 274 Current Ratio (x) 1.65 1.03 1.01 1.03 1.03 Total S/H Equity 7,132 7,060 8,613 8,751 8,887 Quick Ratio (x) 1.60 0.99 0.96 0.98 0.99 Ttl Liab&S/H Funds 21,372 22,196 23,904 23,936 23,966 Interest Cover (x) 2.63 3.08 2.95 2.89 3.15
Cashflow Analysis Other Ratios
FYE 31 Dec (RMm) 2011A 2012A 2013E 2014E 2015E FYE 31 Dec (RMm) 2011A 2012A 2013E 2014E 2015E EBITDA 2,966 3,066 3,206 3,322 3,374 Sales Growth (%) 4.1 9.2 4.3 5.1 4.3 Net Interest 222 -26 -106 18 12 EBITDA Growth (%) 7.0 3.4 4.5 3.6 1.6 Tax Paid 174 -163 -106 -273 -296 EBIT Growth (%) 8.0 22.0 5.8 -0.7 9.1 Working Capital Chgs 248 -281 -496 22 22 PBT Growth (%) -26.4 6.8 -10.7 14.1 8.4 Other -578 127 257 -240 -240 Net Profit Growth (%) -0.6 5.6 -34.6 -4.2 8.4 Operating CF 3,031 2,724 2,755 2,849 2,872 EBITDA Margin (%) 32.4 30.7 30.8 30.3 29.5 FCF 296 176 641 843 829 EBIT Margin (%) 9.2 10.2 10.4 9.8 10.2 CAPEX -2,735 -2,548 -2,114 -2,006 -2,044 PBT Margin (%) 10.9 10.7 9.2 10.0 10.4 Asset Sales 0 0 0 0 0 Net Profit Margin (%) 13.5 13.1 8.2 7.5 7.8 Acquisitions 0 0 0 0 0 Net Debt/Equity (%) 30.8 48.2 43.7 41.2 39.7 Other 1,397 320 46 0 0 CAPEX/Sales (%) 29.9 25.5 20.3 18.3 17.9
Investing CF -1,338 -2,228 -2,068 -2,006 -2,044 Dividends -702 -701 -365 -680 -751 Debt Chgs 878 730 0 0 0 Other -1,139 -999 -683 0 0 Financing CF -963 -971 -1,048 -680 -751 Net Cashflow 730 -475 -362 163 77
HLIB Research | Telecommunications
www.hlebroking.com
Page 17 of 20
13 January 2014
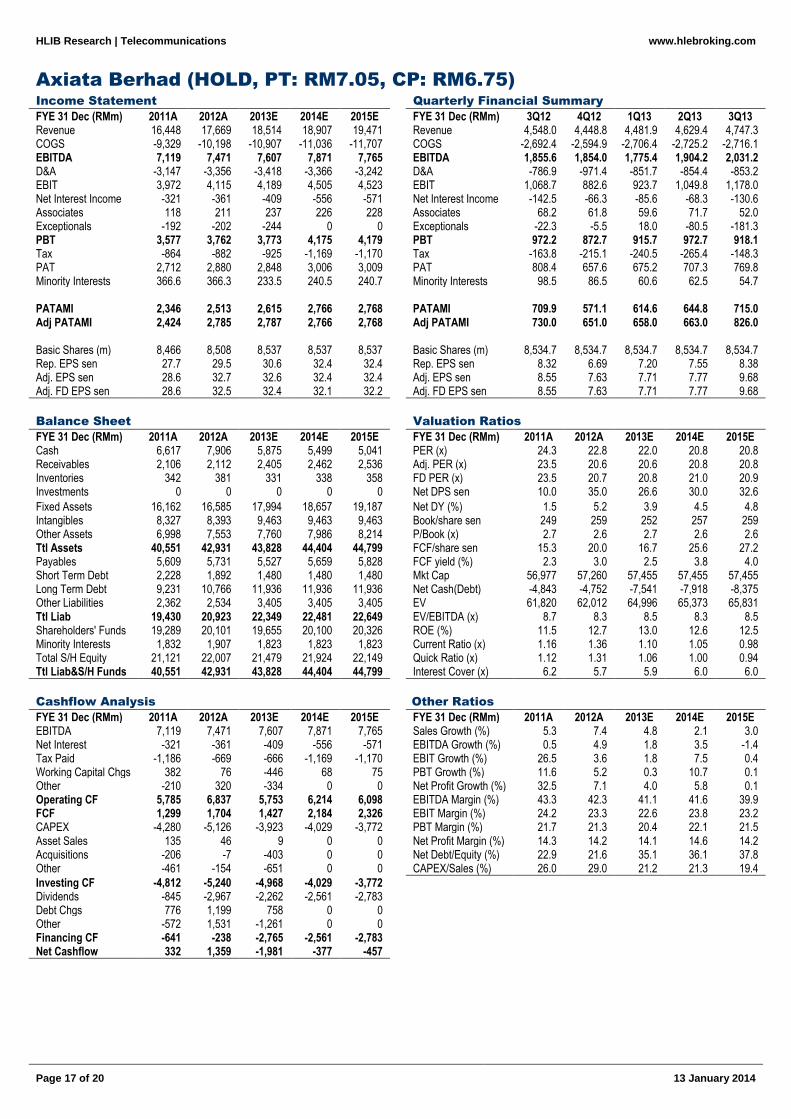
Axiata Berhad (HOLD, PT: RM7.05, CP: RM6.75)
Income Statement Quarterly Financial Summary
FYE 31 Dec (RMm) 2011A 2012A 2013E 2014E 2015E FYE 31 Dec (RMm) 3Q12 4Q12 1Q13 2Q13 3Q13 Revenue 16,448 17,669 18,514 18,907 19,471 Revenue 4,548.0 4,448.8 4,481.9 4,629.4 4,747.3 COGS -9,329 -10,198 -10,907 -11,036 -11,707 COGS -2,692.4 -2,594.9 -2,706.4 -2,725.2 -2,716.1 EBITDA 7,119 7,471 7,607 7,871 7,765 EBITDA 1,855.6 1,854.0 1,775.4 1,904.2 2,031.2 D&A -3,147 -3,356 -3,418 -3,366 -3,242 D&A -786.9 -971.4 -851.7 -854.4 -853.2 EBIT 3,972 4,115 4,189 4,505 4,523 EBIT 1,068.7 882.6 923.7 1,049.8 1,178.0 Net Interest Income -321 -361 -409 -556 -571 Net Interest Income -142.5 -66.3 -85.6 -68.3 -130.6 Associates 118 211 237 226 228 Associates 68.2 61.8 59.6 71.7 52.0 Exceptionals -192 -202 -244 0 0 Exceptionals -22.3 -5.5 18.0 -80.5 -181.3 PBT 3,577 3,762 3,773 4,175 4,179 PBT 972.2 872.7 915.7 972.7 918.1 Tax -864 -882 -925 -1,169 -1,170 Tax -163.8 -215.1 -240.5 -265.4 -148.3 PAT 2,712 2,880 2,848 3,006 3,009 PAT 808.4 657.6 675.2 707.3 769.8 Minority Interests 366.6 366.3 233.5 240.5 240.7 Minority Interests 98.5 86.5 60.6 62.5 54.7 PATAMI 2,346 2,513 2,615 2,766 2,768 PATAMI 709.9 571.1 614.6 644.8 715.0 Adj PATAMI 2,424 2,785 2,787 2,766 2,768 Adj PATAMI 730.0 651.0 658.0 663.0 826.0 Basic Shares (m) 8,466 8,508 8,537 8,537 8,537 Basic Shares (m) 8,534.7 8,534.7 8,534.7 8,534.7 8,534.7 Rep. EPS sen 27.7 29.5 30.6 32.4 32.4 Rep. EPS sen 8.32 6.69 7.20 7.55 8.38 Adj. EPS sen 28.6 32.7 32.6 32.4 32.4 Adj. EPS sen 8.55 7.63 7.71 7.77 9.68 Adj. FD EPS sen 28.6 32.5 32.4 32.1 32.2 Adj. FD EPS sen 8.55 7.63 7.71 7.77 9.68
Balance Sheet Valuation Ratios
FYE 31 Dec (RMm) 2011A 2012A 2013E 2014E 2015E FYE 31 Dec (RMm) 2011A 2012A 2013E 2014E 2015E Cash 6,617 7,906 5,875 5,499 5,041 PER (x) 24.3 22.8 22.0 20.8 20.8 Receivables 2,106 2,112 2,405 2,462 2,536 Adj. PER (x) 23.5 20.6 20.6 20.8 20.8 Inventories 342 381 331 338 358 FD PER (x) 23.5 20.7 20.8 21.0 20.9 Investments 0 0 0 0 0 Net DPS sen 10.0 35.0 26.6 30.0 32.6
Fixed Assets 16,162 16,585 17,994 18,657 19,187 Net DY (%) 1.5 5.2 3.9 4.5 4.8 Intangibles 8,327 8,393 9,463 9,463 9,463 Book/share sen 249 259 252 257 259 Other Assets 6,998 7,553 7,760 7,986 8,214 P/Book (x) 2.7 2.6 2.7 2.6 2.6 Ttl Assets 40,551 42,931 43,828 44,404 44,799 FCF/share sen 15.3 20.0 16.7 25.6 27.2 Payables 5,609 5,731 5,527 5,659 5,828 FCF yield (%) 2.3 3.0 2.5 3.8 4.0 Short Term Debt 2,228 1,892 1,480 1,480 1,480 Mkt Cap 56,977 57,260 57,455 57,455 57,455 Long Term Debt 9,231 10,766 11,936 11,936 11,936 Net Cash(Debt) -4,843 -4,752 -7,541 -7,918 -8,375 Other Liabilities 2,362 2,534 3,405 3,405 3,405 EV 61,820 62,012 64,996 65,373 65,831 Ttl Liab 19,430 20,923 22,349 22,481 22,649 EV/EBITDA (x) 8.7 8.3 8.5 8.3 8.5 Shareholders' Funds 19,289 20,101 19,655 20,100 20,326 ROE (%) 11.5 12.7 13.0 12.6 12.5 Minority Interests 1,832 1,907 1,823 1,823 1,823 Current Ratio (x) 1.16 1.36 1.10 1.05 0.98 Total S/H Equity 21,121 22,007 21,479 21,924 22,149 Quick Ratio (x) 1.12 1.31 1.06 1.00 0.94 Ttl Liab&S/H Funds 40,551 42,931 43,828 44,404 44,799 Interest Cover (x) 6.2 5.7 5.9 6.0 6.0
Cashflow Analysis Other Ratios
FYE 31 Dec (RMm) 2011A 2012A 2013E 2014E 2015E FYE 31 Dec (RMm) 2011A 2012A 2013E 2014E 2015E EBITDA 7,119 7,471 7,607 7,871 7,765 Sales Growth (%) 5.3 7.4 4.8 2.1 3.0 Net Interest -321 -361 -409 -556 -571 EBITDA Growth (%) 0.5 4.9 1.8 3.5 -1.4 Tax Paid -1,186 -669 -666 -1,169 -1,170 EBIT Growth (%) 26.5 3.6 1.8 7.5 0.4 Working Capital Chgs 382 76 -446 68 75 PBT Growth (%) 11.6 5.2 0.3 10.7 0.1 Other -210 320 -334 0 0 Net Profit Growth (%) 32.5 7.1 4.0 5.8 0.1 Operating CF 5,785 6,837 5,753 6,214 6,098 EBITDA Margin (%) 43.3 42.3 41.1 41.6 39.9 FCF 1,299 1,704 1,427 2,184 2,326 EBIT Margin (%) 24.2 23.3 22.6 23.8 23.2 CAPEX -4,280 -5,126 -3,923 -4,029 -3,772 PBT Margin (%) 21.7 21.3 20.4 22.1 21.5 Asset Sales 135 46 9 0 0 Net Profit Margin (%) 14.3 14.2 14.1 14.6 14.2 Acquisitions -206 -7 -403 0 0 Net Debt/Equity (%) 22.9 21.6 35.1 36.1 37.8 Other -461 -154 -651 0 0 CAPEX/Sales (%) 26.0 29.0 21.2 21.3 19.4
Investing CF -4,812 -5,240 -4,968 -4,029 -3,772 Dividends -845 -2,967 -2,262 -2,561 -2,783 Debt Chgs 776 1,199 758 0 0 Other -572 1,531 -1,261 0 0 Financing CF -641 -238 -2,765 -2,561 -2,783 Net Cashflow 332 1,359 -1,981 -377 -457
HLIB Research | Telecommunications
www.hlebroking.com
Page 18 of 20
13 January 2014
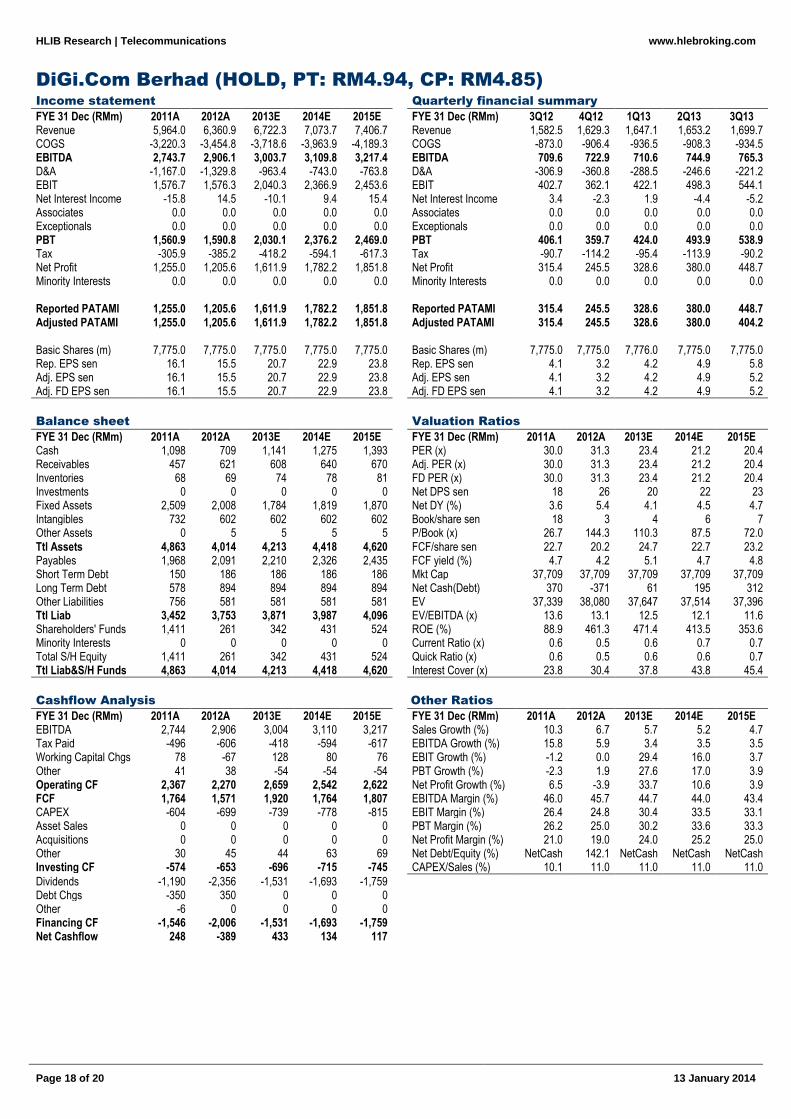
DiGi.Com Berhad (HOLD, PT: RM4.94, CP: RM4.85)
Income statement Quarterly financial summary
FYE 31 Dec (RMm) 2011A 2012A 2013E 2014E 2015E FYE 31 Dec (RMm) 3Q12 4Q12 1Q13 2Q13 3Q13 Revenue 5,964.0 6,360.9 6,722.3 7,073.7 7,406.7 Revenue 1,582.5 1,629.3 1,647.1 1,653.2 1,699.7 COGS -3,220.3 -3,454.8 -3,718.6 -3,963.9 -4,189.3 COGS -873.0 -906.4 -936.5 -908.3 -934.5 EBITDA 2,743.7 2,906.1 3,003.7 3,109.8 3,217.4 EBITDA 709.6 722.9 710.6 744.9 765.3 D&A -1,167.0 -1,329.8 -963.4 -743.0 -763.8 D&A -306.9 -360.8 -288.5 -246.6 -221.2 EBIT 1,576.7 1,576.3 2,040.3 2,366.9 2,453.6 EBIT 402.7 362.1 422.1 498.3 544.1 Net Interest Income -15.8 14.5 -10.1 9.4 15.4 Net Interest Income 3.4 -2.3 1.9 -4.4 -5.2 Associates 0.0 0.0 0.0 0.0 0.0 Associates 0.0 0.0 0.0 0.0 0.0 Exceptionals 0.0 0.0 0.0 0.0 0.0 Exceptionals 0.0 0.0 0.0 0.0 0.0 PBT 1,560.9 1,590.8 2,030.1 2,376.2 2,469.0 PBT 406.1 359.7 424.0 493.9 538.9 Tax -305.9 -385.2 -418.2 -594.1 -617.3 Tax -90.7 -114.2 -95.4 -113.9 -90.2 Net Profit 1,255.0 1,205.6 1,611.9 1,782.2 1,851.8 Net Profit 315.4 245.5 328.6 380.0 448.7 Minority Interests 0.0 0.0 0.0 0.0 0.0 Minority Interests 0.0 0.0 0.0 0.0 0.0 Reported PATAMI 1,255.0 1,205.6 1,611.9 1,782.2 1,851.8 Reported PATAMI 315.4 245.5 328.6 380.0 448.7 Adjusted PATAMI 1,255.0 1,205.6 1,611.9 1,782.2 1,851.8 Adjusted PATAMI 315.4 245.5 328.6 380.0 404.2 Basic Shares (m) 7,775.0 7,775.0 7,775.0 7,775.0 7,775.0 Basic Shares (m) 7,775.0 7,775.0 7,776.0 7,775.0 7,775.0 Rep. EPS sen 16.1 15.5 20.7 22.9 23.8 Rep. EPS sen 4.1 3.2 4.2 4.9 5.8 Adj. EPS sen 16.1 15.5 20.7 22.9 23.8 Adj. EPS sen 4.1 3.2 4.2 4.9 5.2 Adj. FD EPS sen 16.1 15.5 20.7 22.9 23.8 Adj. FD EPS sen 4.1 3.2 4.2 4.9 5.2
Balance sheet Valuation Ratios
FYE 31 Dec (RMm) 2011A 2012A 2013E 2014E 2015E FYE 31 Dec (RMm) 2011A 2012A 2013E 2014E 2015E Cash 1,098 709 1,141 1,275 1,393 PER (x) 30.0 31.3 23.4 21.2 20.4 Receivables 457 621 608 640 670 Adj. PER (x) 30.0 31.3 23.4 21.2 20.4 Inventories 68 69 74 78 81 FD PER (x) 30.0 31.3 23.4 21.2 20.4 Investments 0 0 0 0 0 Net DPS sen 18 26 20 22 23 Fixed Assets 2,509 2,008 1,784 1,819 1,870 Net DY (%) 3.6 5.4 4.1 4.5 4.7 Intangibles 732 602 602 602 602 Book/share sen 18 3 4 6 7 Other Assets 0 5 5 5 5 P/Book (x) 26.7 144.3 110.3 87.5 72.0 Ttl Assets 4,863 4,014 4,213 4,418 4,620 FCF/share sen 22.7 20.2 24.7 22.7 23.2 Payables 1,968 2,091 2,210 2,326 2,435 FCF yield (%) 4.7 4.2 5.1 4.7 4.8 Short Term Debt 150 186 186 186 186 Mkt Cap 37,709 37,709 37,709 37,709 37,709 Long Term Debt 578 894 894 894 894 Net Cash(Debt) 370 -371 61 195 312 Other Liabilities 756 581 581 581 581 EV 37,339 38,080 37,647 37,514 37,396 Ttl Liab 3,452 3,753 3,871 3,987 4,096 EV/EBITDA (x) 13.6 13.1 12.5 12.1 11.6 Shareholders' Funds 1,411 261 342 431 524 ROE (%) 88.9 461.3 471.4 413.5 353.6 Minority Interests 0 0 0 0 0 Current Ratio (x) 0.6 0.5 0.6 0.7 0.7 Total S/H Equity 1,411 261 342 431 524 Quick Ratio (x) 0.6 0.5 0.6 0.6 0.7 Ttl Liab&S/H Funds 4,863 4,014 4,213 4,418 4,620 Interest Cover (x) 23.8 30.4 37.8 43.8 45.4
Cashflow Analysis Other Ratios
FYE 31 Dec (RMm) 2011A 2012A 2013E 2014E 2015E FYE 31 Dec (RMm) 2011A 2012A 2013E 2014E 2015E EBITDA 2,744 2,906 3,004 3,110 3,217 Sales Growth (%) 10.3 6.7 5.7 5.2 4.7 Tax Paid -496 -606 -418 -594 -617 EBITDA Growth (%) 15.8 5.9 3.4 3.5 3.5 Working Capital Chgs 78 -67 128 80 76 EBIT Growth (%) -1.2 0.0 29.4 16.0 3.7 Other 41 38 -54 -54 -54 PBT Growth (%) -2.3 1.9 27.6 17.0 3.9 Operating CF 2,367 2,270 2,659 2,542 2,622 Net Profit Growth (%) 6.5 -3.9 33.7 10.6 3.9 FCF 1,764 1,571 1,920 1,764 1,807 EBITDA Margin (%) 46.0 45.7 44.7 44.0 43.4 CAPEX -604 -699 -739 -778 -815 EBIT Margin (%) 26.4 24.8 30.4 33.5 33.1 Asset Sales 0 0 0 0 0 PBT Margin (%) 26.2 25.0 30.2 33.6 33.3 Acquisitions 0 0 0 0 0 Net Profit Margin (%) 21.0 19.0 24.0 25.2 25.0 Other 30 45 44 63 69 Net Debt/Equity (%) NetCash 142.1 NetCash NetCash NetCash Investing CF -574 -653 -696 -715 -745 CAPEX/Sales (%) 10.1 11.0 11.0 11.0 11.0
Dividends -1,190 -2,356 -1,531 -1,693 -1,759 Debt Chgs -350 350 0 0 0 Other -6 0 0 0 0 Financing CF -1,546 -2,006 -1,531 -1,693 -1,759 Net Cashflow 248 -389 433 134 117
HLIB Research | Telecommunications
www.hlebroking.com
Page 19 of 20
13 January 2014
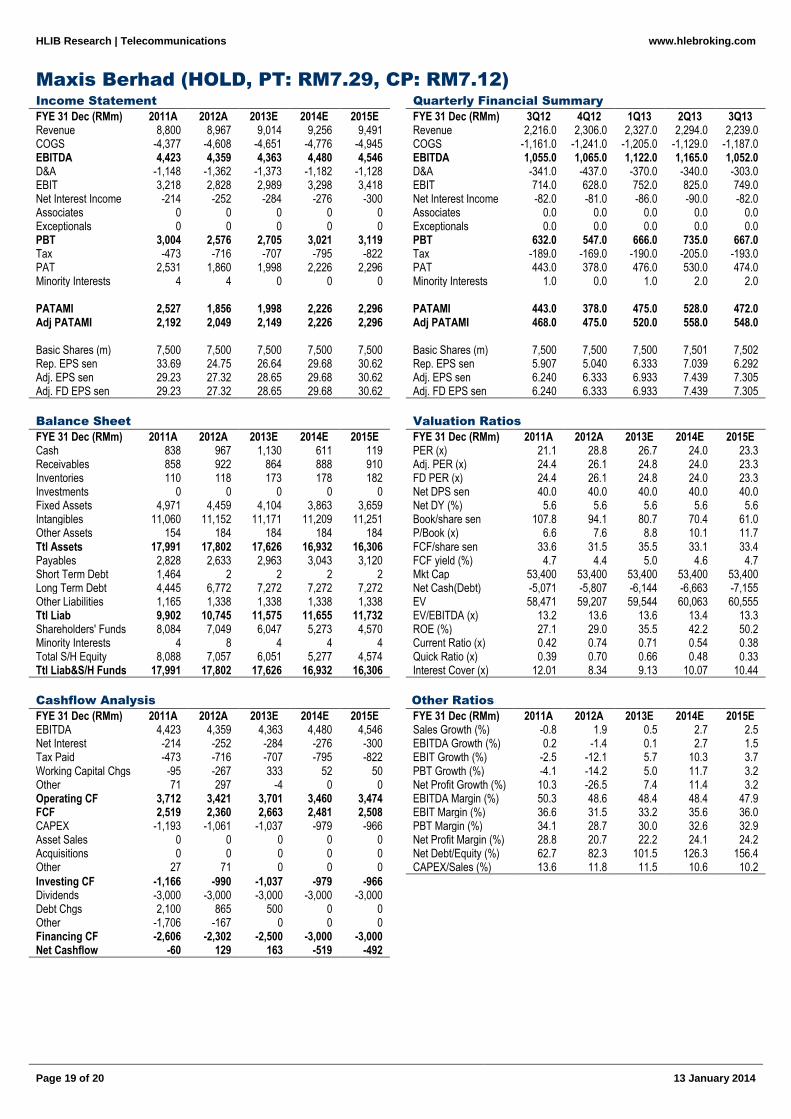
Maxis Berhad (HOLD, PT: RM7.29, CP: RM7.12)
Income Statement Quarterly Financial Summary
FYE 31 Dec (RMm) 2011A 2012A 2013E 2014E 2015E FYE 31 Dec (RMm) 3Q12 4Q12 1Q13 2Q13 3Q13 Revenue 8,800 8,967 9,014 9,256 9,491 Revenue 2,216.0 2,306.0 2,327.0 2,294.0 2,239.0 COGS -4,377 -4,608 -4,651 -4,776 -4,945 COGS -1,161.0 -1,241.0 -1,205.0 -1,129.0 -1,187.0 EBITDA 4,423 4,359 4,363 4,480 4,546 EBITDA 1,055.0 1,065.0 1,122.0 1,165.0 1,052.0 D&A -1,148 -1,362 -1,373 -1,182 -1,128 D&A -341.0 -437.0 -370.0 -340.0 -303.0 EBIT 3,218 2,828 2,989 3,298 3,418 EBIT 714.0 628.0 752.0 825.0 749.0 Net Interest Income -214 -252 -284 -276 -300 Net Interest Income -82.0 -81.0 -86.0 -90.0 -82.0 Associates 0 0 0 0 0 Associates 0.0 0.0 0.0 0.0 0.0 Exceptionals 0 0 0 0 0 Exceptionals 0.0 0.0 0.0 0.0 0.0 PBT 3,004 2,576 2,705 3,021 3,119 PBT 632.0 547.0 666.0 735.0 667.0 Tax -473 -716 -707 -795 -822 Tax -189.0 -169.0 -190.0 -205.0 -193.0 PAT 2,531 1,860 1,998 2,226 2,296 PAT 443.0 378.0 476.0 530.0 474.0 Minority Interests 4 4 0 0 0 Minority Interests 1.0 0.0 1.0 2.0 2.0 PATAMI 2,527 1,856 1,998 2,226 2,296 PATAMI 443.0 378.0 475.0 528.0 472.0 Adj PATAMI 2,192 2,049 2,149 2,226 2,296 Adj PATAMI 468.0 475.0 520.0 558.0 548.0 Basic Shares (m) 7,500 7,500 7,500 7,500 7,500 Basic Shares (m) 7,500 7,500 7,500 7,501 7,502 Rep. EPS sen 33.69 24.75 26.64 29.68 30.62 Rep. EPS sen 5.907 5.040 6.333 7.039 6.292 Adj. EPS sen 29.23 27.32 28.65 29.68 30.62 Adj. EPS sen 6.240 6.333 6.933 7.439 7.305 Adj. FD EPS sen 29.23 27.32 28.65 29.68 30.62 Adj. FD EPS sen 6.240 6.333 6.933 7.439 7.305
Balance Sheet Valuation Ratios
FYE 31 Dec (RMm) 2011A 2012A 2013E 2014E 2015E FYE 31 Dec (RMm) 2011A 2012A 2013E 2014E 2015E Cash 838 967 1,130 611 119 PER (x) 21.1 28.8 26.7 24.0 23.3 Receivables 858 922 864 888 910 Adj. PER (x) 24.4 26.1 24.8 24.0 23.3 Inventories 110 118 173 178 182 FD PER (x) 24.4 26.1 24.8 24.0 23.3 Investments 0 0 0 0 0 Net DPS sen 40.0 40.0 40.0 40.0 40.0 Fixed Assets 4,971 4,459 4,104 3,863 3,659 Net DY (%) 5.6 5.6 5.6 5.6 5.6 Intangibles 11,060 11,152 11,171 11,209 11,251 Book/share sen 107.8 94.1 80.7 70.4 61.0 Other Assets 154 184 184 184 184 P/Book (x) 6.6 7.6 8.8 10.1 11.7 Ttl Assets 17,991 17,802 17,626 16,932 16,306 FCF/share sen 33.6 31.5 35.5 33.1 33.4 Payables 2,828 2,633 2,963 3,043 3,120 FCF yield (%) 4.7 4.4 5.0 4.6 4.7 Short Term Debt 1,464 2 2 2 2 Mkt Cap 53,400 53,400 53,400 53,400 53,400 Long Term Debt 4,445 6,772 7,272 7,272 7,272 Net Cash(Debt) -5,071 -5,807 -6,144 -6,663 -7,155 Other Liabilities 1,165 1,338 1,338 1,338 1,338 EV 58,471 59,207 59,544 60,063 60,555 Ttl Liab 9,902 10,745 11,575 11,655 11,732 EV/EBITDA (x) 13.2 13.6 13.6 13.4 13.3 Shareholders' Funds 8,084 7,049 6,047 5,273 4,570 ROE (%) 27.1 29.0 35.5 42.2 50.2 Minority Interests 4 8 4 4 4 Current Ratio (x) 0.42 0.74 0.71 0.54 0.38 Total S/H Equity 8,088 7,057 6,051 5,277 4,574 Quick Ratio (x) 0.39 0.70 0.66 0.48 0.33 Ttl Liab&S/H Funds 17,991 17,802 17,626 16,932 16,306 Interest Cover (x) 12.01 8.34 9.13 10.07 10.44
Cashflow Analysis Other Ratios
FYE 31 Dec (RMm) 2011A 2012A 2013E 2014E 2015E FYE 31 Dec (RMm) 2011A 2012A 2013E 2014E 2015E EBITDA 4,423 4,359 4,363 4,480 4,546 Sales Growth (%) -0.8 1.9 0.5 2.7 2.5 Net Interest -214 -252 -284 -276 -300 EBITDA Growth (%) 0.2 -1.4 0.1 2.7 1.5 Tax Paid -473 -716 -707 -795 -822 EBIT Growth (%) -2.5 -12.1 5.7 10.3 3.7 Working Capital Chgs -95 -267 333 52 50 PBT Growth (%) -4.1 -14.2 5.0 11.7 3.2 Other 71 297 -4 0 0 Net Profit Growth (%) 10.3 -26.5 7.4 11.4 3.2 Operating CF 3,712 3,421 3,701 3,460 3,474 EBITDA Margin (%) 50.3 48.6 48.4 48.4 47.9 FCF 2,519 2,360 2,663 2,481 2,508 EBIT Margin (%) 36.6 31.5 33.2 35.6 36.0 CAPEX -1,193 -1,061 -1,037 -979 -966 PBT Margin (%) 34.1 28.7 30.0 32.6 32.9 Asset Sales 0 0 0 0 0 Net Profit Margin (%) 28.8 20.7 22.2 24.1 24.2 Acquisitions 0 0 0 0 0 Net Debt/Equity (%) 62.7 82.3 101.5 126.3 156.4 Other 27 71 0 0 0 CAPEX/Sales (%) 13.6 11.8 11.5 10.6 10.2
Investing CF -1,166 -990 -1,037 -979 -966 Dividends -3,000 -3,000 -3,000 -3,000 -3,000 Debt Chgs 2,100 865 500 0 0 Other -1,706 -167 0 0 0 Financing CF -2,606 -2,302 -2,500 -3,000 -3,000 Net Cashflow -60 129 163 -519 -492
HLIB Research | Telecommunications
www.hlebroking.com
Page 20 of 20
13 January 2014
Disclaimer
The information contained in this report is based on data obtained from sources believed to be reliable. However, the data and/or sources have not been independently verified and as such, no representation, express or implied, are made as to the accuracy, adequacy, completeness or reliability of the info or opinions in the report.
Accordingly, neither Hong Leong Investment Bank Berhad nor any of its related companies and associates nor person connected to it accept any liability whatsoever for any direct, indirect or consequential losses (including loss of profits) or damages that may arise from the use or reliance on the info or opinions in this publication.
Any information, opinions or recommendations contained herein are subject to change at any time without prior notice. Hong Leong Investment Bank Berhad has no obligation to update its opinion or the information in this report.
Investors are advised to make their own independent evaluation of the info contained in this report and seek independent financial, legal or other advice regarding the appropriateness of investing in any securites or the investment strategies discussed or recommended in this report. Nothing in this report constitutes investment, legal, accounting or tax advice or a representation that any investment or strategy is suitable or appropriate to your individual circumstances or otherwise represent a personal recommndation to you.
Under no circumstances should this report be considered as an offer to sell or a solicitation of any offer to buy any securities referred to herein.
Hong Leong Investment Bank Berhad and its related companies, their associates, directors, connected parties and/or employeees may, from time to time, own, have positions or be materially interested in any securities mentioned herein or any securites related thereto, and may further act as market maker or have assumed underwriting commitment or deal with such securities and provide advisory, investment or other services for or do business with any companies or entities mentioned in this report. In reviewing the report, investors should be aware that any or all of the foregoing among other things, may give rise to real or potential conflict of interests.
This research report is being supplied to you on a strictly confidential basis solely for your information and is made strictly on the basis that it will remain confidential. All materials presented in this report, unless specifically indicated otherwise, is under copyright to Hong Leong Investment Bank Berhad. This research report and its contents may not be reproduced, stored in a retrieval system, redistributed, transmitted or passed on, direclty or indirectly, to any person or published in whole or in part, or altered in any way, for any purpose.
This report may provide the addresses of, or contain hyperlinks to, websites. Hong Leong Investment Bank Berhad takes no responsibility for the content contained therein. Such addresses or hyperlinks (including addresses or hyperlinks to Hong Leong Investment Bank Berhad own website material) are provided solely for your convenience. The information and the content of the linked site do not in any way form part of this report. Accessing such website or following such link through the report or Hong Leong Investment Bank Berhad website shall be at your own risk. 1. As of 13 January 2014, Hong Leong Investment Bank Berhad has proprietary interest in the following securities covered in this report: (a) -. 2. As of 13 January 2014, the analyst, Tan J Young who prepared this report, has interest in the following securities covered in this report: (a) -.
Published & Printed by
Hong Leong Investment Bank Berhad (10209-W)
Level 23, Menara HLA No. 3, Jalan Kia Peng 50450 Kuala Lumpur Tel 603 2168 1168 / 603 2710 1168 Fax 603 2161 3880
Equity rating definitions
BUY Positive recommendation of stock under coverage. Expected absolute return of more than +10% over 12-months, with low risk of sustained downside. TRADING BUY Positive recommendation of stock not under coverage. Expected absolute return of more than +10% over 6-months. Situational or arbitrage trading opportunity. HOLD Neutral recommendation of stock under coverage. Expected absolute return between -10% and +10% over 12-months, with low risk of sustained downside. TRADING SELL Negative recommendation of stock not under coverage. Expected absolute return of less than -10% over 6-months. Situational or arbitrage trading opportunity. SELL Negative recommendation of stock under coverage. High risk of negative absolute return of more than -10% over 12-months. NOT RATED No research coverage, and report is intended purely for informational purposes.
Industry rating definitions
OVERWEIGHT The sector, based on weighted market capitalization, is expected to have absolute return of more than +5% over 12-months. NEUTRAL The sector, based on weighted market capitalization, is expected to have absolute return between –5% and +5% over 12-months. UNDERWEIGHT The sector, based on weighted market capitalization, is expected to have absolute return of less than –5% over 12-months.