Embed Size (px)
Citation preview

PowerSpout LH Case Study
Installation at
Kearoa Marae
In association with
Te Runanga o Ngati Kea Ngati Tuara
PowerSpout Kearoa marae LH Case Study
© 2014 EcoInnovation Ltd (NZ)
EcoInnovation is very grateful to Te Runanga o Ngati Kea Ngati Tuara for their vision and input throughout the project, and for allowing project details to be shared in this case study. However, this case study does not necessarily reflect the views of the iwi which can be contacted at Te Runanga O Ngati Kea Ngati Tuara Trust
ST: 28 Tarewa Road, Rotorua 3010 PO: P.O Box 716, Rotorua 3040 P: (07) 343 71 53 M: (027) 5437 153 E: [email protected]
PowerSpoutContact details Web: www.powerspout.com PowerSpout is a product proudly designed and manufactured by: EcoInnovation Ltd 671 Kent Road New Plymouth R.D.1 New Zealand 4371 Web: www.ecoinnovation.co.nz If you need to contact EcoInnovation by phone then email first via our web site first and check the local time in NZ if calling from overseas. Notice of Trademark PowerSpout – is a USA registered Trademark Notice of Company Registration EcoInnovation – is a NZ Registered Limited Company Project co-ordination and Case Study compilation by Justin Ford-Robertson Ford-Robertson Initiatives Ltd Rotorua [email protected] Section 7.3 onwards completed by: Michael Lawley EcoInnovation Limited New Plymouth [email protected] Disclaimer UNLESS SPECIFICALLY AGREED TO IN WRITING, ECOINNOVATION LIMITED: (a) MAKES NO WARRANTY AS TO THE ACCURACY, SUFFICIENCY OR SUITABILITY OF ANY TECHNICAL OROTHER INFORMATION PROVIDED IN ITS MANUAL OR OTHER DOCUMENTATION. (b) ASSUMES NO RESPONSIBILITY OR LIABILITY FOR LOSS OR DAMAGE, WHETHER DIRECT,INDIRECT, CONSEQUENTIAL OR INCIDENTAL, WHICH MIGHT ARISE OUT OF THE USE OF SUCHINFORMATION. THE USE OF ANY SUCH INFORMATION WILL BE ENTIRELY AT THE USER’S RISK.
PowerSpout Kearoa marae LH Case Study
© 2014 EcoInnovation Ltd (NZ)
CONTENTS
1. Background .................................................................................................................. 1 1.1. Outcomes and Benefits ............................................................................................ 1
2. Site Description ............................................................................................................ 2 2.1. Water Flow Rates and Demand ................................................................................ 2
3. Proposed Site ............................................................................................................... 3 3.1. Turbines and water return......................................................................................... 4
4. Design .......................................................................................................................... 6 4.1. Headstock ................................................................................................................ 6 4.2. Intake structure ......................................................................................................... 7 4.3. Refining the design ................................................................................................... 7 4.4. Turbines and Power Output ...................................................................................... 8
5. Resource consent ........................................................................................................ 9 5.1. Waikato Regional Council (WRC) ............................................................................. 9
5.1.1. Consultation .................................................................................................. 9 5.1.2. Conditions ..................................................................................................... 9 5.1.3. National Policy Statement for Renewable Generation, 2011 ....................... 10 5.1.4. National Policy Statement for Freshwater Management 2011 ..................... 10 5.1.5. Outcome ..................................................................................................... 10
5.2. Rotorua District Council .......................................................................................... 10
6. Implementation ........................................................................................................... 11 6.1. Digging the channel for the pipe ............................................................................. 11 6.2. Installing the intake ................................................................................................. 12 6.3. Constructing the headstock .................................................................................... 13 6.4. Clearing obstructions in the river ............................................................................ 14 6.5. Site restoration ....................................................................................................... 15 6.6. Installing the turbines – initial trial and testing ......................................................... 15 6.7. Installing the turbines – final install and commissioning tests .................................. 18 6.8. Installed Performance ............................................................................................. 21 6.9. Diversion Pipe Performance ................................................................................... 22 6.10. Flow measurement by NIWA .......................................................................... 23
7. Power connections ..................................................................................................... 23 7.1. Export power: pricing and process .......................................................................... 23 7.2. Power Lines company: access to distribution network ............................................ 24 7.3. Unison consent to connect ..................................................................................... 25 7.4. Compliance ............................................................................................................ 26 7.5. Metering ................................................................................................................. 26 7.6. Certificate of compliance (COC) ............................................................................. 27 7.7. System maintenance .............................................................................................. 27
Figure 1. Aerial view of the site: marae and hydro ................................................................. 2 Figure 2. Normal water flow at the top of the waterfall ........................................................... 3 Figure 3. Flood waters at the top of the waterfall ................................................................... 3 Figure 4. Proposed lay out .................................................................................................... 4 Figure 5. Proposed long section ............................................................................................ 4 Figure 6. Rock overhang and fall to river floor beside main river channel .............................. 5 Figure 7. Concept designs .................................................................................................... 6 Figure 8. Initial design for intake ........................................................................................... 7 Figure 9. Final engineering design ........................................................................................ 8

PowerSpout Kearoa marae LH Case Study
May 2014 © 2014 EcoInnovation Ltd (NZ) Page 1
1. Background
Te Runanga o Ngati Kea Ngati Tuara investigated the feasibility of generating power from the Pokaitu Stream which borders the Kearoa Marae on Apirana Road, Horohoro. It was part of efforts to help clean up the Waikato River, in partnership with Te Arawa River Iwi Trust (TARIT), other river iwi, landowners and the Waikato Regional Council (WRC). Ngati Kea Ngati Tuara are one of three Te Arawa River Iwi that make up Te Arawa River Iwi Trust and the trust has specific legislation regarding the co-management and co-governance of the restoration of the Waikato river. As such projects that build Iwi capacity to be involved in the restoration of the river, including sustainable use of the resource, are a focus of the trust. It is within this kaupapa that the microhydro project fits. In 2012, a feasibility study identified that the flows and fall of the Pokaitu Stream was suitable for a micro-hydro to generate power at Kearoa Marae. In addition to reducing the net import of electricity for use at the marae and associated buildings, it was intended to provide a demonstration of possibilities to iwi members, local farmers and the wider collaborative network of the potential for micro-hydro technology to be more widely utilised in rural New Zealand. Having a power source independent of the electricity grid has additional merit as a civil defence resource where the marae could function as local emergency accommodation and local co-ordination hub. It is important to note that the genesis of this idea was formed at a renewable energy hui held at Kearoa Marae in 2011 and historically the site was used to power a waterwheel for a flax mill, at the turn of last century.
1.1. Outcomes and Benefits
Whilst the primary objective is to produce low cost, renewable energy, the proposed rural marae setting offers a number of other opportunities including;
Potential for the Kearoa marae to act as emergency shelter, particularly if it has its own power generation capability. The potential to establish a local mini-grid will be considered in the future.
The project aligns well with the National Policy Statement on Renewable Electricity generation 2011 and allied Policies/objectives of regional and local government.
Regional councils are also likely to encounter increasing interest in renewable energy. The BOP Energy strategy anticipates this and it is likely that this will also occur in Waikato.
This project could demonstrate potential for micro-hydro in rural areas, and hence be of wide interest to landowners, and rural (farming) organisations.
This project is funded from the TARIT affiliate environmental fund and is intended to demonstrate environmentally sustainable use of the awa (which is a tributary of the Waikato River). The intention is to show that iwi can utilise the awa as a resource whilst minimising environmental impact.
Identified during the Iwi strategic planning process in 2010 was a desire for the marae to be self-sufficient (environmentally re energy and maara kai, culturally re Te reo and tikanga revitlisation and economically re developing income streams) and this project should enable the marae and associated iwi owned farm to generate as much power as it uses, over a typical year.
PowerSpout Kearoa marae LH Case Study
May 2014 © 2014 EcoInnovation Ltd (NZ) Page 2
2. Site Description
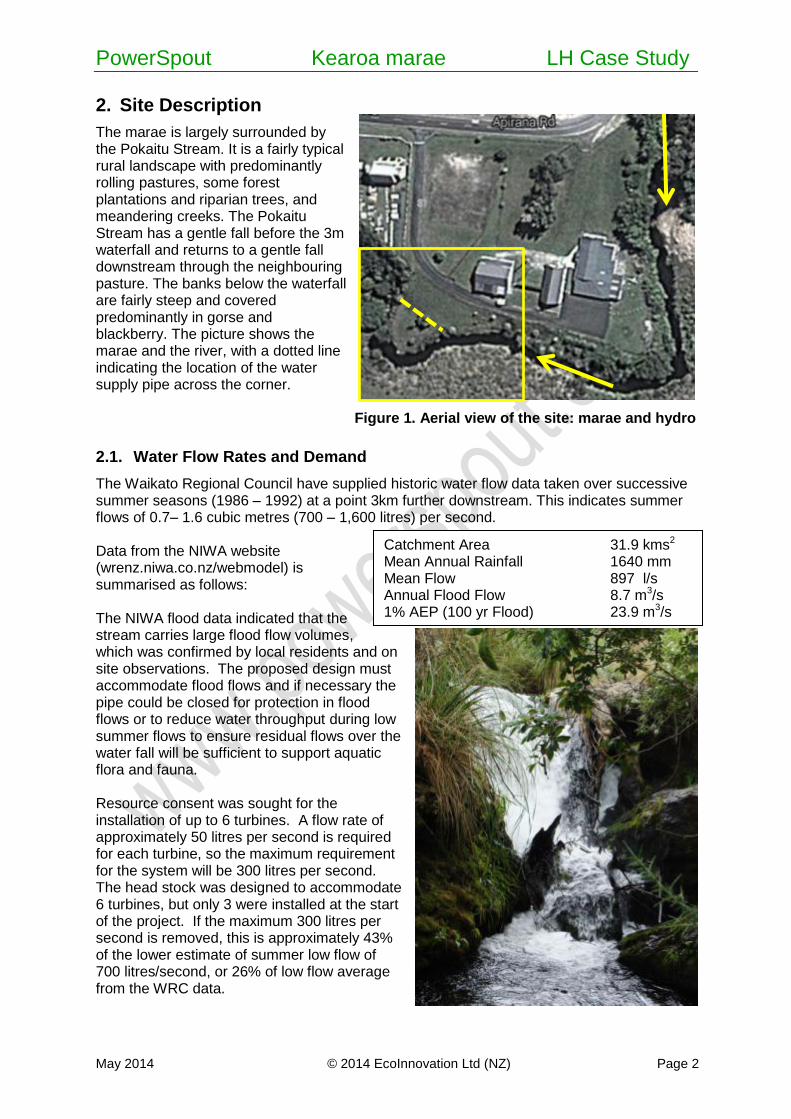
The marae is largely surrounded by the Pokaitu Stream. It is a fairly typical rural landscape with predominantly rolling pastures, some forest plantations and riparian trees, and meandering creeks. The Pokaitu Stream has a gentle fall before the 3m waterfall and returns to a gentle fall downstream through the neighbouring pasture. The banks below the waterfall are fairly steep and covered predominantly in gorse and blackberry. The picture shows the marae and the river, with a dotted line indicating the location of the water supply pipe across the corner.
Figure 1. Aerial view of the site: marae and hydro
2.1. Water Flow Rates and Demand
The Waikato Regional Council have supplied historic water flow data taken over successive summer seasons (1986 – 1992) at a point 3km further downstream. This indicates summer flows of 0.7– 1.6 cubic metres (700 – 1,600 litres) per second. Data from the NIWA website (wrenz.niwa.co.nz/webmodel) is summarised as follows: The NIWA flood data indicated that the stream carries large flood flow volumes, which was confirmed by local residents and on site observations. The proposed design must accommodate flood flows and if necessary the pipe could be closed for protection in flood flows or to reduce water throughput during low summer flows to ensure residual flows over the water fall will be sufficient to support aquatic flora and fauna. Resource consent was sought for the installation of up to 6 turbines. A flow rate of approximately 50 litres per second is required for each turbine, so the maximum requirement for the system will be 300 litres per second. The head stock was designed to accommodate 6 turbines, but only 3 were installed at the start of the project. If the maximum 300 litres per second is removed, this is approximately 43% of the lower estimate of summer low flow of 700 litres/second, or 26% of low flow average from the WRC data.
Catchment Area 31.9 kms2 Mean Annual Rainfall 1640 mm Mean Flow 897 l/s Annual Flood Flow 8.7 m3/s 1% AEP (100 yr Flood) 23.9 m3/s
PowerSpout Kearoa marae LH Case Study
May 2014 © 2014 EcoInnovation Ltd (NZ) Page 3
3. Proposed Site
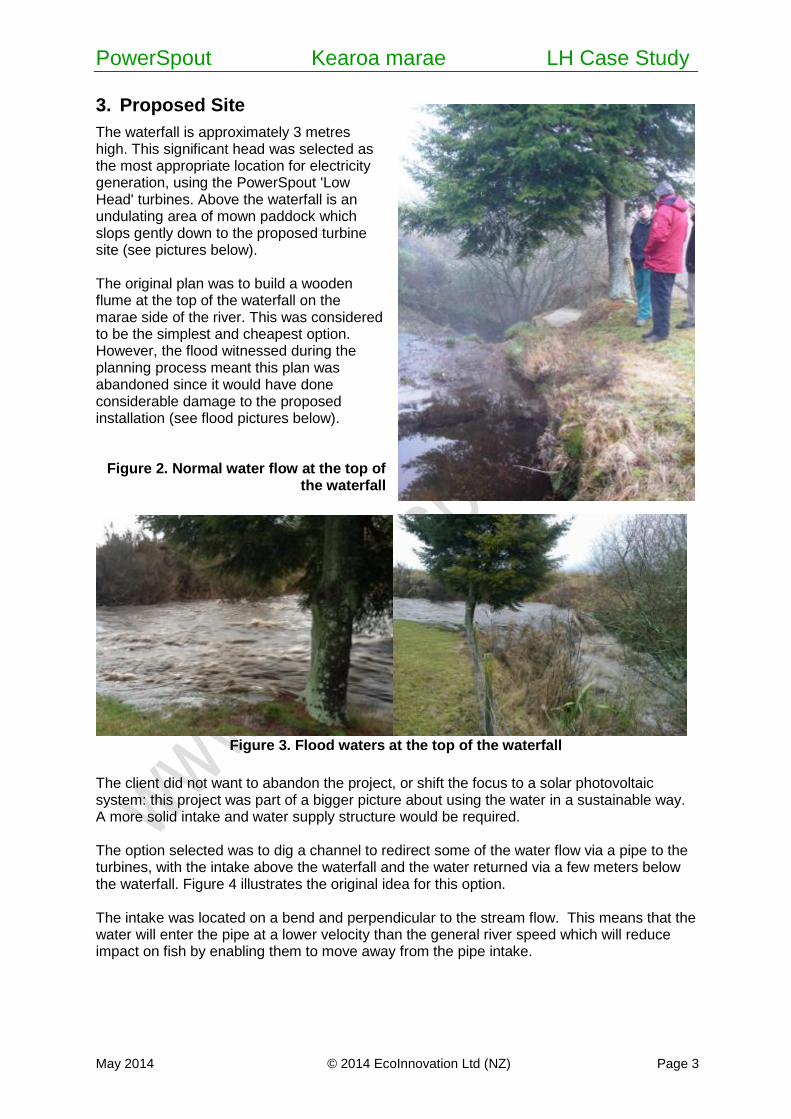
The waterfall is approximately 3 metres high. This significant head was selected as the most appropriate location for electricity generation, using the PowerSpout 'Low Head' turbines. Above the waterfall is an undulating area of mown paddock which slops gently down to the proposed turbine site (see pictures below). The original plan was to build a wooden flume at the top of the waterfall on the marae side of the river. This was considered to be the simplest and cheapest option. However, the flood witnessed during the planning process meant this plan was abandoned since it would have done considerable damage to the proposed installation (see flood pictures below).
Figure 2. Normal water flow at the top of the waterfall
Figure 3. Flood waters at the top of the waterfall
The client did not want to abandon the project, or shift the focus to a solar photovoltaic system: this project was part of a bigger picture about using the water in a sustainable way. A more solid intake and water supply structure would be required. The option selected was to dig a channel to redirect some of the water flow via a pipe to the turbines, with the intake above the waterfall and the water returned via a few meters below the waterfall. Figure 4 illustrates the original idea for this option. The intake was located on a bend and perpendicular to the stream flow. This means that the water will enter the pipe at a lower velocity than the general river speed which will reduce impact on fish by enabling them to move away from the pipe intake.
PowerSpout Kearoa marae LH Case Study
May 2014 © 2014 EcoInnovation Ltd (NZ) Page 4
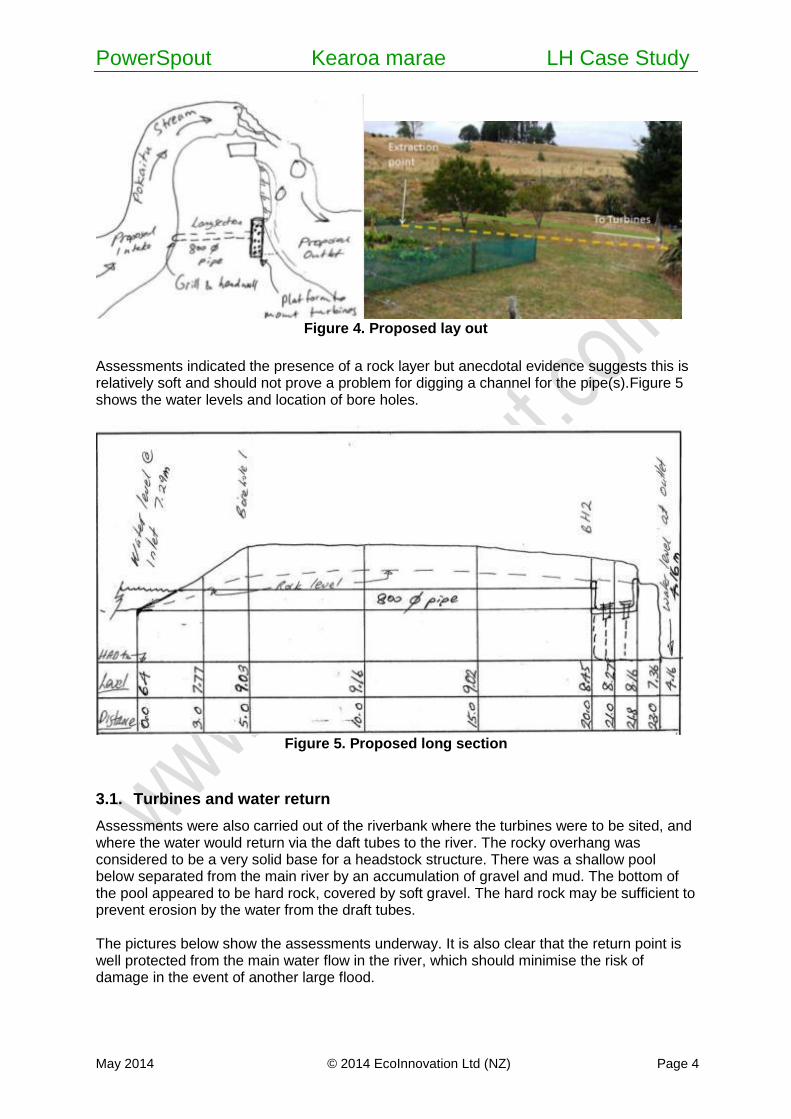
Figure 4. Proposed lay out
Assessments indicated the presence of a rock layer but anecdotal evidence suggests this is relatively soft and should not prove a problem for digging a channel for the pipe(s).Figure 5 shows the water levels and location of bore holes.
Figure 5. Proposed long section
3.1. Turbines and water return
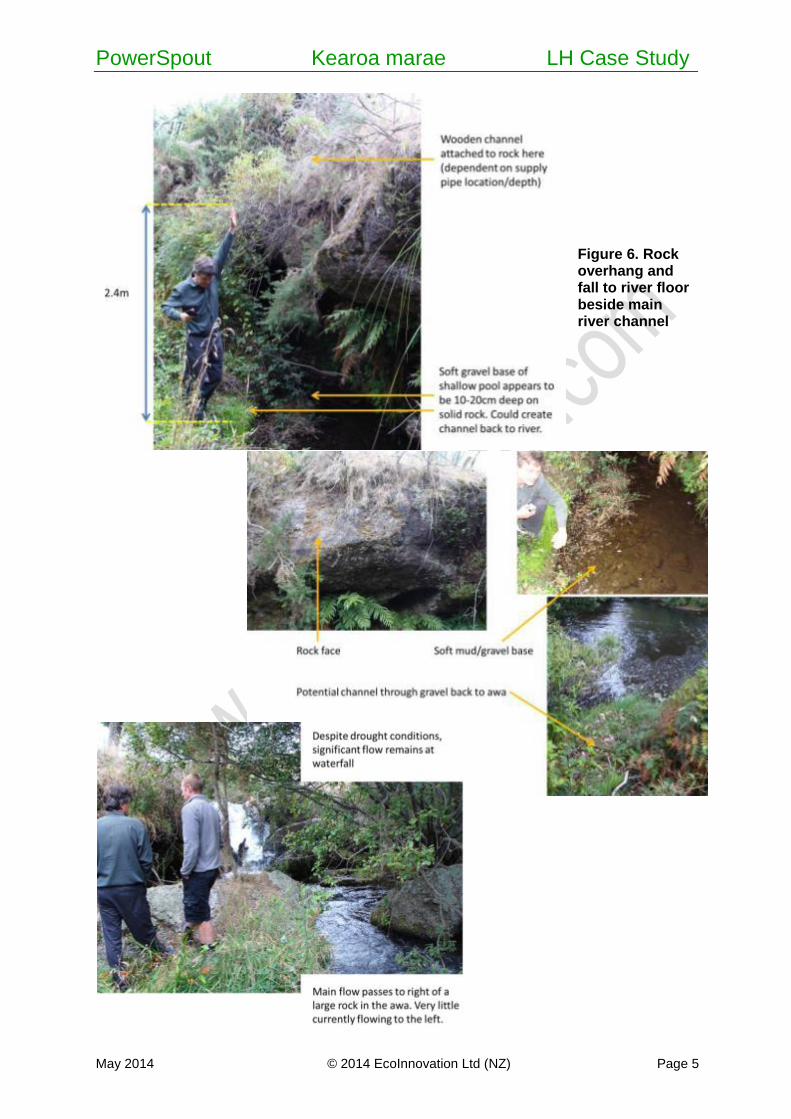
Assessments were also carried out of the riverbank where the turbines were to be sited, and where the water would return via the daft tubes to the river. The rocky overhang was considered to be a very solid base for a headstock structure. There was a shallow pool below separated from the main river by an accumulation of gravel and mud. The bottom of the pool appeared to be hard rock, covered by soft gravel. The hard rock may be sufficient to prevent erosion by the water from the draft tubes. The pictures below show the assessments underway. It is also clear that the return point is well protected from the main water flow in the river, which should minimise the risk of damage in the event of another large flood.
PowerSpout Kearoa marae LH Case Study
May 2014 © 2014 EcoInnovation Ltd (NZ) Page 5
Figure 6. Rock overhang and fall to river floor beside main river channel
PowerSpout Kearoa marae LH Case Study
May 2014 © 2014 EcoInnovation Ltd (NZ) Page 6
4. Design
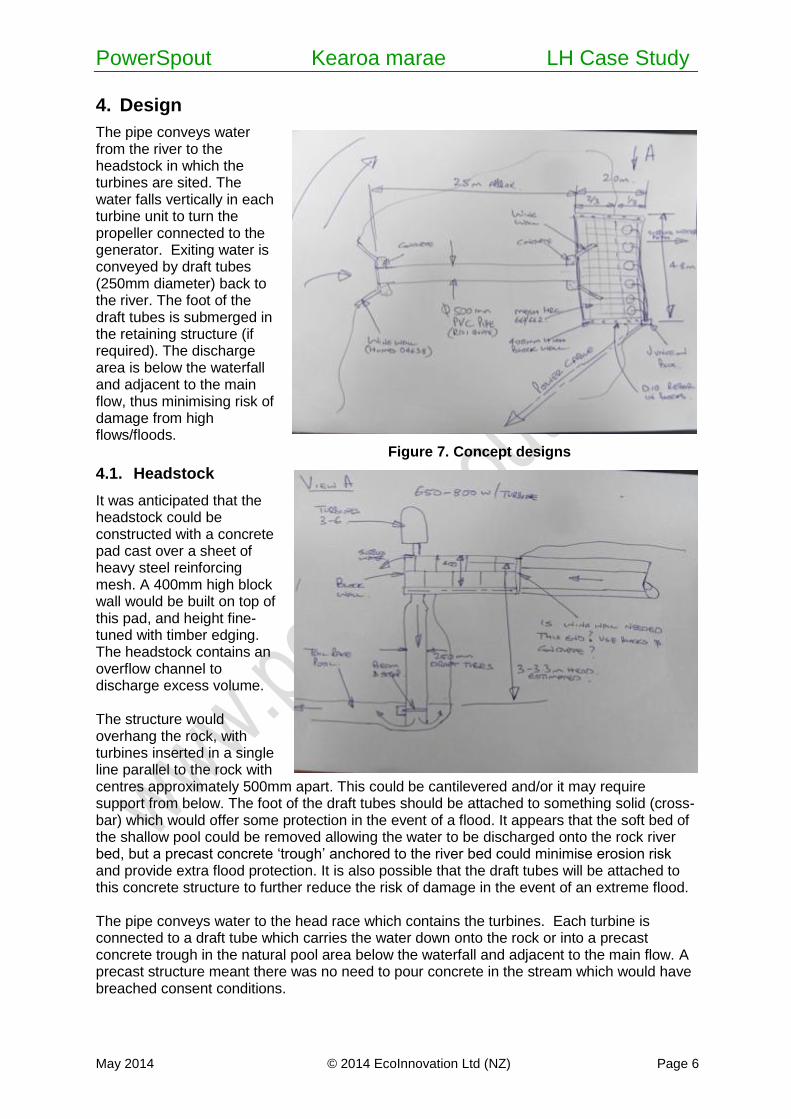
The pipe conveys water from the river to the headstock in which the turbines are sited. The water falls vertically in each turbine unit to turn the propeller connected to the generator. Exiting water is conveyed by draft tubes (250mm diameter) back to the river. The foot of the draft tubes is submerged in the retaining structure (if required). The discharge area is below the waterfall and adjacent to the main flow, thus minimising risk of damage from high flows/floods. Figure 7. Concept designs
4.1. Headstock
It was anticipated that the headstock could be constructed with a concrete pad cast over a sheet of heavy steel reinforcing mesh. A 400mm high block wall would be built on top of this pad, and height fine-tuned with timber edging. The headstock contains an overflow channel to discharge excess volume. The structure would overhang the rock, with turbines inserted in a single line parallel to the rock with centres approximately 500mm apart. This could be cantilevered and/or it may require support from below. The foot of the draft tubes should be attached to something solid (cross-bar) which would offer some protection in the event of a flood. It appears that the soft bed of the shallow pool could be removed allowing the water to be discharged onto the rock river bed, but a precast concrete ‘trough’ anchored to the river bed could minimise erosion risk and provide extra flood protection. It is also possible that the draft tubes will be attached to this concrete structure to further reduce the risk of damage in the event of an extreme flood. The pipe conveys water to the head race which contains the turbines. Each turbine is connected to a draft tube which carries the water down onto the rock or into a precast concrete trough in the natural pool area below the waterfall and adjacent to the main flow. A precast structure meant there was no need to pour concrete in the stream which would have breached consent conditions.
PowerSpout Kearoa marae LH Case Study
May 2014 © 2014 EcoInnovation Ltd (NZ) Page 7
4.2. Intake structure
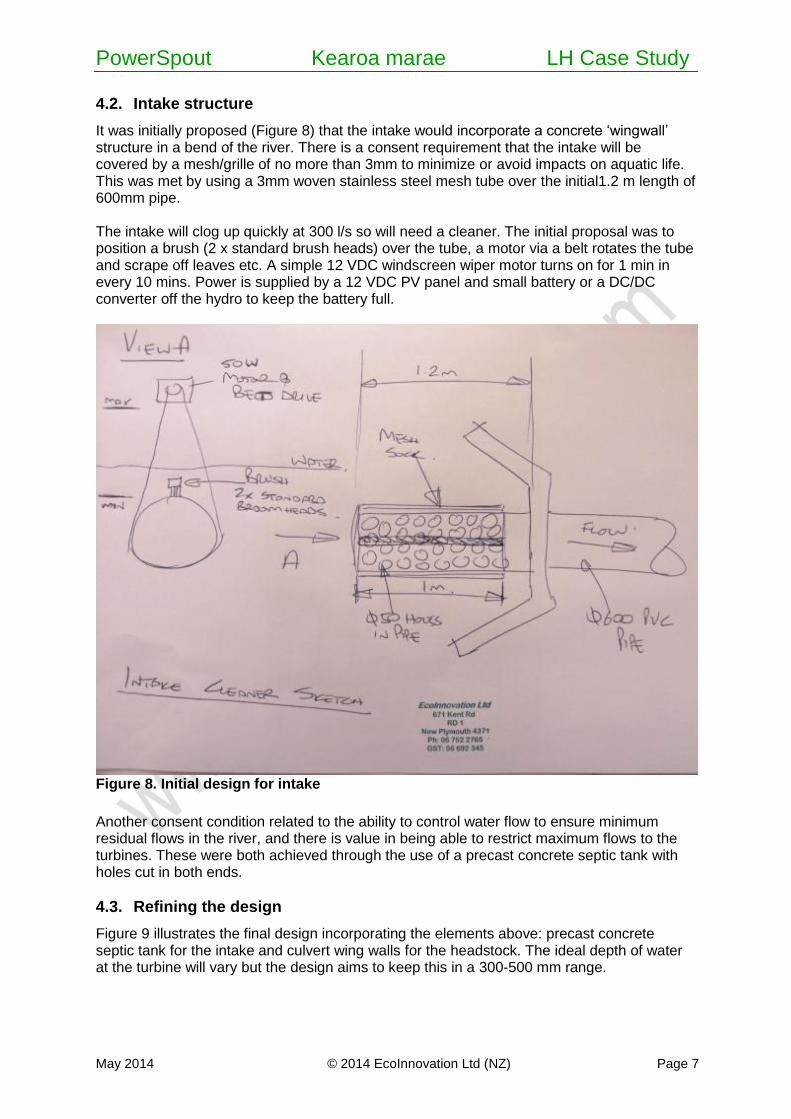
It was initially proposed (Figure 8) that the intake would incorporate a concrete ‘wingwall’ structure in a bend of the river. There is a consent requirement that the intake will be covered by a mesh/grille of no more than 3mm to minimize or avoid impacts on aquatic life. This was met by using a 3mm woven stainless steel mesh tube over the initial1.2 m length of 600mm pipe. The intake will clog up quickly at 300 l/s so will need a cleaner. The initial proposal was to position a brush (2 x standard brush heads) over the tube, a motor via a belt rotates the tube and scrape off leaves etc. A simple 12 VDC windscreen wiper motor turns on for 1 min in every 10 mins. Power is supplied by a 12 VDC PV panel and small battery or a DC/DC converter off the hydro to keep the battery full.
Figure 8. Initial design for intake
Another consent condition related to the ability to control water flow to ensure minimum residual flows in the river, and there is value in being able to restrict maximum flows to the turbines. These were both achieved through the use of a precast concrete septic tank with holes cut in both ends.
4.3. Refining the design
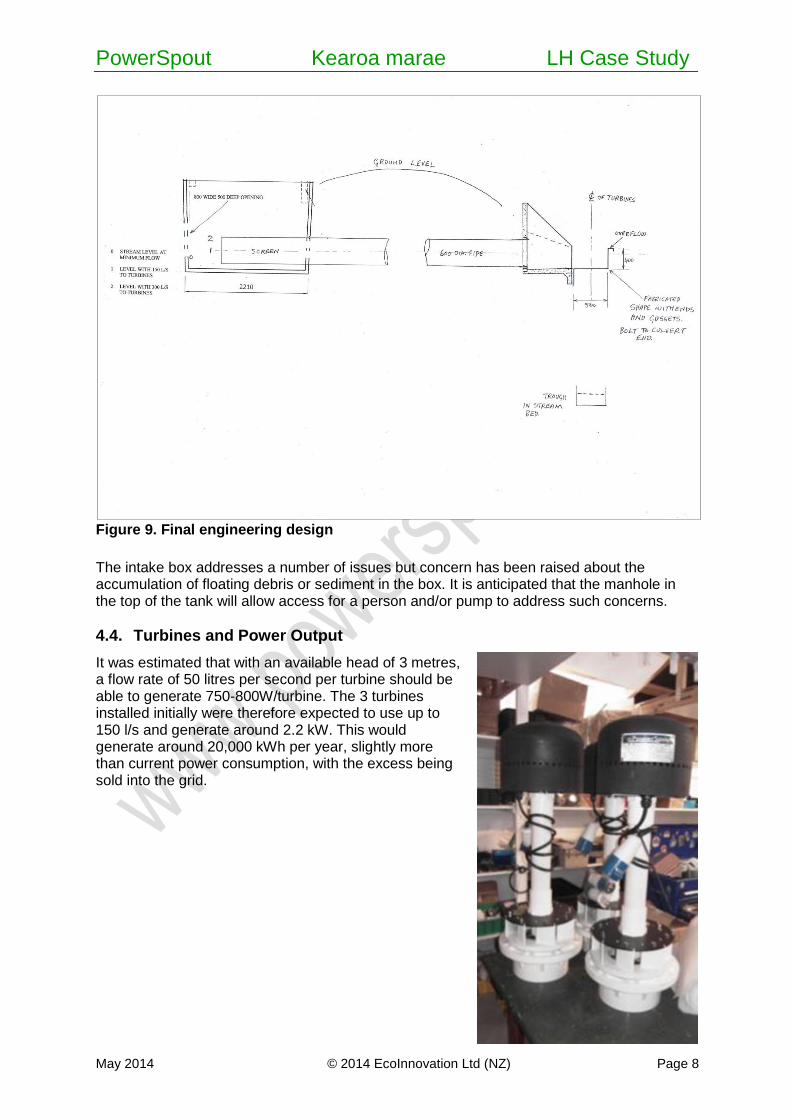
Figure 9 illustrates the final design incorporating the elements above: precast concrete septic tank for the intake and culvert wing walls for the headstock. The ideal depth of water at the turbine will vary but the design aims to keep this in a 300-500 mm range.
PowerSpout Kearoa marae LH Case Study
May 2014 © 2014 EcoInnovation Ltd (NZ) Page 8
Figure 9. Final engineering design
The intake box addresses a number of issues but concern has been raised about the accumulation of floating debris or sediment in the box. It is anticipated that the manhole in the top of the tank will allow access for a person and/or pump to address such concerns.
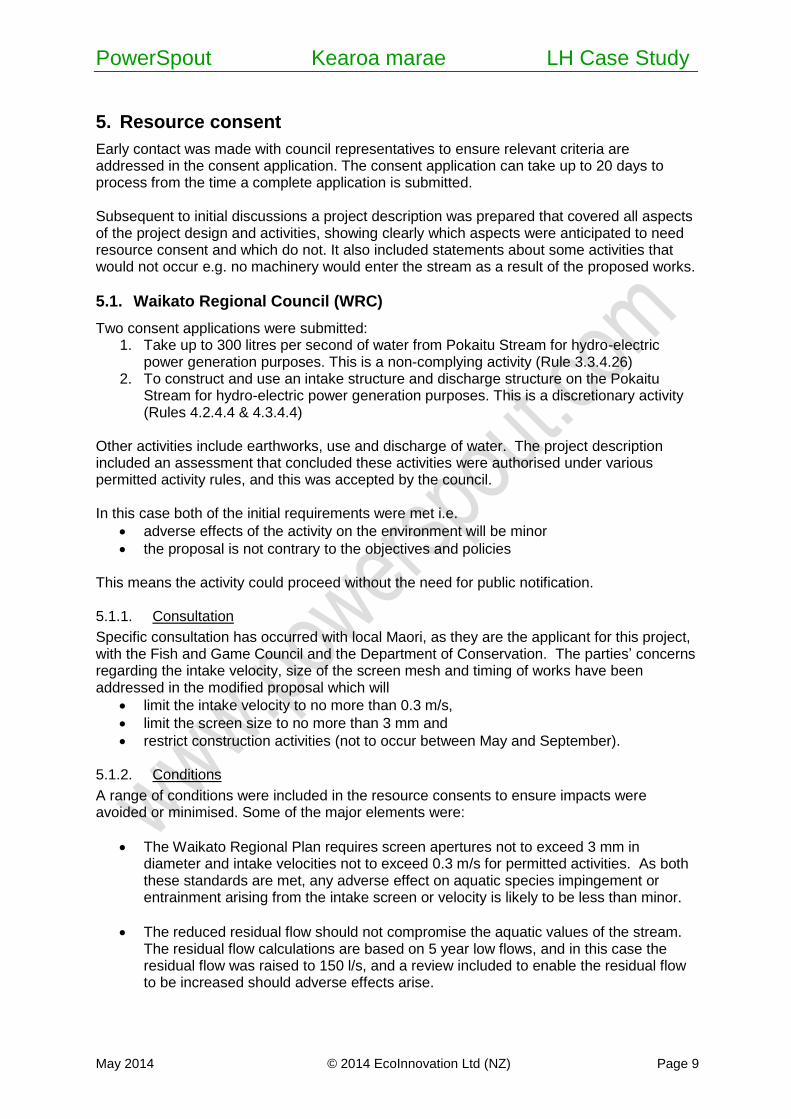
4.4. Turbines and Power Output
It was estimated that with an available head of 3 metres, a flow rate of 50 litres per second per turbine should be able to generate 750-800W/turbine. The 3 turbines installed initially were therefore expected to use up to 150 l/s and generate around 2.2 kW. This would generate around 20,000 kWh per year, slightly more than current power consumption, with the excess being sold into the grid.
PowerSpout Kearoa marae LH Case Study
May 2014 © 2014 EcoInnovation Ltd (NZ) Page 9
5. Resource consent
Early contact was made with council representatives to ensure relevant criteria are addressed in the consent application. The consent application can take up to 20 days to process from the time a complete application is submitted. Subsequent to initial discussions a project description was prepared that covered all aspects of the project design and activities, showing clearly which aspects were anticipated to need resource consent and which do not. It also included statements about some activities that would not occur e.g. no machinery would enter the stream as a result of the proposed works.
5.1. Waikato Regional Council (WRC)
Two consent applications were submitted: 1. Take up to 300 litres per second of water from Pokaitu Stream for hydro-electric
power generation purposes. This is a non-complying activity (Rule 3.3.4.26) 2. To construct and use an intake structure and discharge structure on the Pokaitu
Stream for hydro-electric power generation purposes. This is a discretionary activity (Rules 4.2.4.4 & 4.3.4.4)
Other activities include earthworks, use and discharge of water. The project description included an assessment that concluded these activities were authorised under various permitted activity rules, and this was accepted by the council. In this case both of the initial requirements were met i.e.
adverse effects of the activity on the environment will be minor
the proposal is not contrary to the objectives and policies This means the activity could proceed without the need for public notification. 5.1.1. Consultation
Specific consultation has occurred with local Maori, as they are the applicant for this project, with the Fish and Game Council and the Department of Conservation. The parties’ concerns regarding the intake velocity, size of the screen mesh and timing of works have been addressed in the modified proposal which will
limit the intake velocity to no more than 0.3 m/s,
limit the screen size to no more than 3 mm and
restrict construction activities (not to occur between May and September). 5.1.2. Conditions
A range of conditions were included in the resource consents to ensure impacts were avoided or minimised. Some of the major elements were:
The Waikato Regional Plan requires screen apertures not to exceed 3 mm in diameter and intake velocities not to exceed 0.3 m/s for permitted activities. As both these standards are met, any adverse effect on aquatic species impingement or entrainment arising from the intake screen or velocity is likely to be less than minor.
The reduced residual flow should not compromise the aquatic values of the stream. The residual flow calculations are based on 5 year low flows, and in this case the residual flow was raised to 150 l/s, and a review included to enable the residual flow to be increased should adverse effects arise.
PowerSpout Kearoa marae LH Case Study
May 2014 © 2014 EcoInnovation Ltd (NZ) Page 10
All structures that are in, on or over the bed of the stream would be precast or pre-constructed so that physical works would not occur over the stream. The consent holder shall take all practicable steps to minimise the disturbance of the stream bed during the construction activities and to minimise the release of sediment.
Any sections of the stream bank or its adjacent surfaces which are disturbed during construction of the intake or discharge structures shall be immediately stabilised upon completion of works to prevent erosion
5.1.3. National Policy Statement for Renewable Generation, 2011
The installation is consistent with the objective of this NPS i.e. “To recognise the national significance of renewable electricity generation activities by providing for the development, operation, maintenance and upgrading of new and existing renewable electricity generation activities.” 5.1.4. National Policy Statement for Freshwater Management 2011
This NPS is primarily concerned with water quality and water quantity. The activity is for a non-consumptive take and thus allowing it would not impact on the overall quantity of water in the stream, apart for the small section (24 metres) of the stream between the take and discharge locations. Hence the installation would not be inconsistent with the requirements of this NPS. 5.1.5. Outcome
Consents were granted for 35 years, with the option to conduct a 5-yearly review to ensure conditions were being met. Within three months from the date when this resource consent is first exercised, the consent holder is also required provide the Waikato Regional Council with documented evidence from a suitably qualified person that the installation can continuously comply with conditions relating to intake velocity and residual flows. The consent holder shall also provide as-built plans of the structures within 3 months of the completion of this stage of the project.
5.2. Rotorua District Council
RDC first classed the activity as a hydro development like a new power station, but then decided the WRC consent was sufficient.
“The rules in the utilities chapter does refer to power stations requiring consent, however, I do not consider this activity to qualify as a power station. Your application states that consent is required from the regional council and that should cover the issues relating to ecology and water take.”
However, they also cautioned that the Proposed District Plan (not yet in effect) does require a consent for small scale hydro power generators.
PowerSpout Kearoa marae LH Case Study
May 2014 © 2014 EcoInnovation Ltd (NZ) Page 11
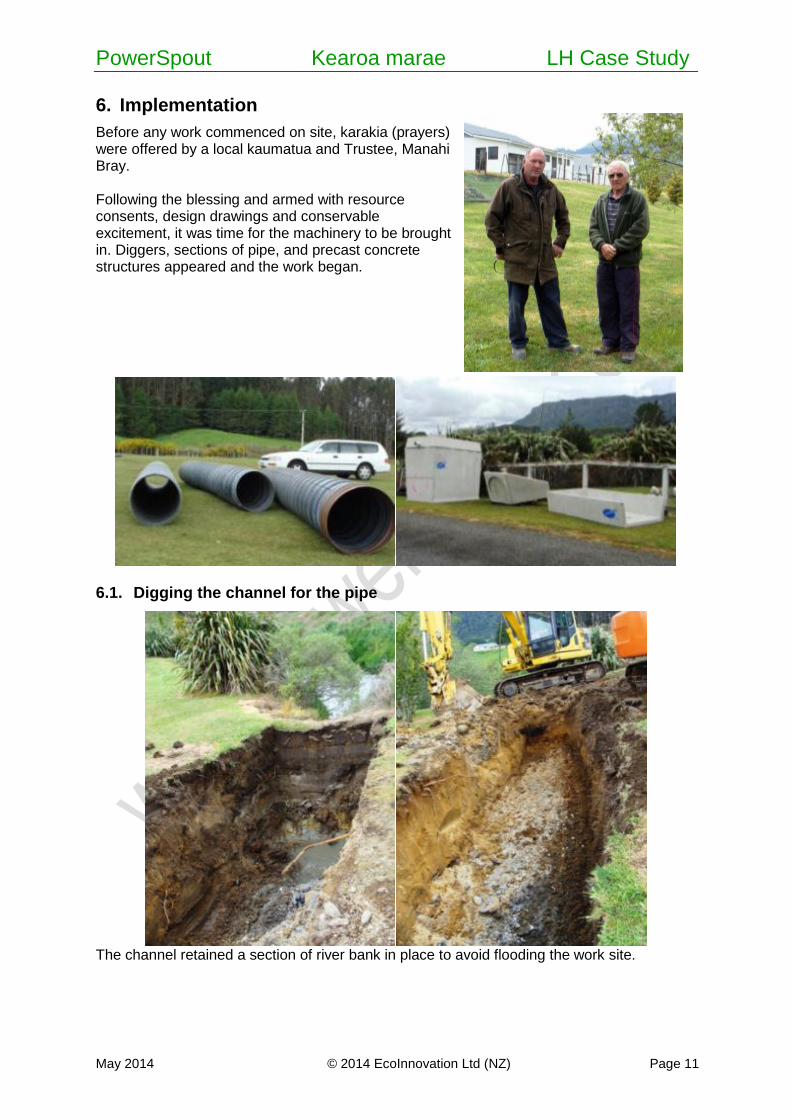
6. Implementation
Before any work commenced on site, karakia (prayers) were offered by a local kaumatua and Trustee, Manahi Bray. Following the blessing and armed with resource consents, design drawings and conservable excitement, it was time for the machinery to be brought in. Diggers, sections of pipe, and precast concrete structures appeared and the work began.
6.1. Digging the channel for the pipe
The channel retained a section of river bank in place to avoid flooding the work site.
PowerSpout Kearoa marae LH Case Study
May 2014 © 2014 EcoInnovation Ltd (NZ) Page 12
6.2. Installing the intake
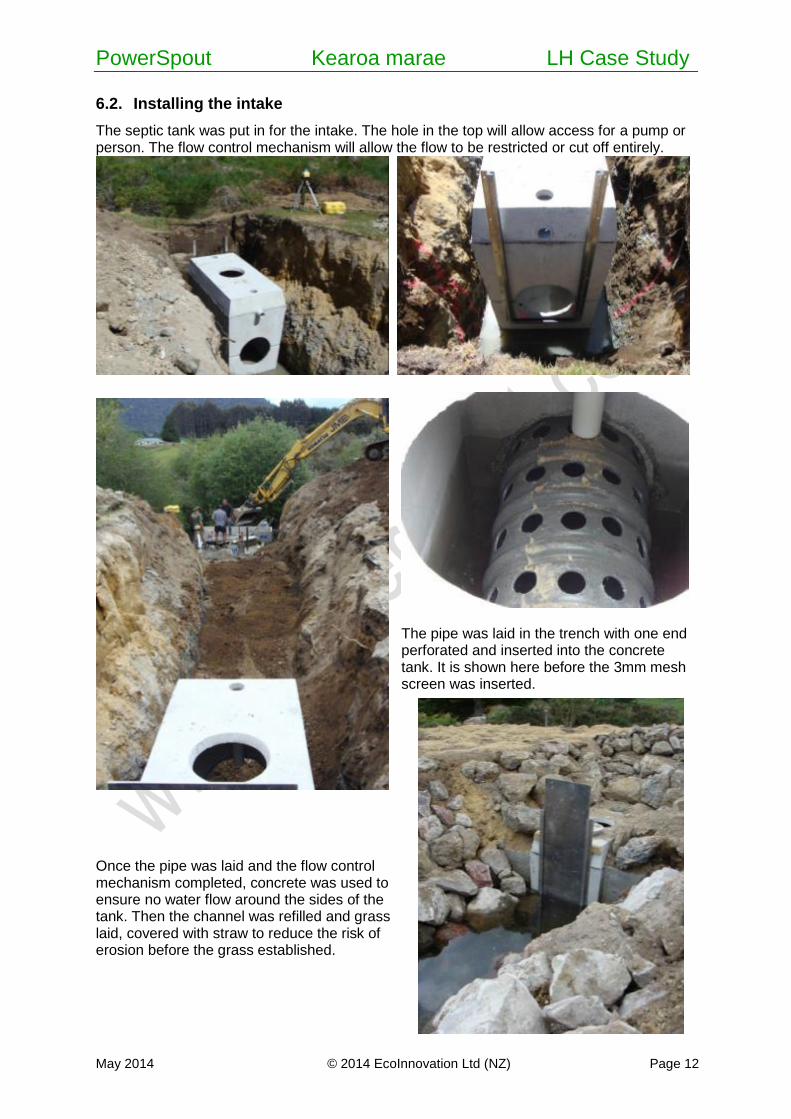
The septic tank was put in for the intake. The hole in the top will allow access for a pump or person. The flow control mechanism will allow the flow to be restricted or cut off entirely.
The pipe was laid in the trench with one end perforated and inserted into the concrete tank. It is shown here before the 3mm mesh screen was inserted.
Once the pipe was laid and the flow control mechanism completed, concrete was used to ensure no water flow around the sides of the tank. Then the channel was refilled and grass laid, covered with straw to reduce the risk of erosion before the grass established.

PowerSpout Kearoa marae LH Case Study
May 2014 © 2014 EcoInnovation Ltd (NZ) Page 13
The intake was surrounded by large rocks to minimise erosion. With the control gate almost closed the water flow and velocity into the pipe is very low.
6.3. Constructing the headstock
The first stage addressed the water return to the river. A trough was laid as planned, but it was discovered that the rock below was very hard. Water could be returned directly onto the rock without erosion issues. This would mean the bottom of the draft tubes would be about 400mm below the river level. Considerable care was taken to ensure no works affected the river. Note the water still crystal clear i.e. no sediment issues.
The headstock construction included steel girders set in concrete at the end of the channel, attached to support poles in the river bank below. The precast trough (450 mm deep) was laid on the girders such that the top of the trough was 50 mm below the intake water level. Holes were cut in the base of the trough to accommodate the turbines. All 6 holes were cut and the PowerSpout seals inserted; initially 3 turbines will be inserted and the other holes blocked off. A section of the trough wall was removed to allow the wingwall to be inserted. This will help to ensure that the water spreads even across the trough.
PowerSpout Kearoa marae LH Case Study
May 2014 © 2014 EcoInnovation Ltd (NZ) Page 14
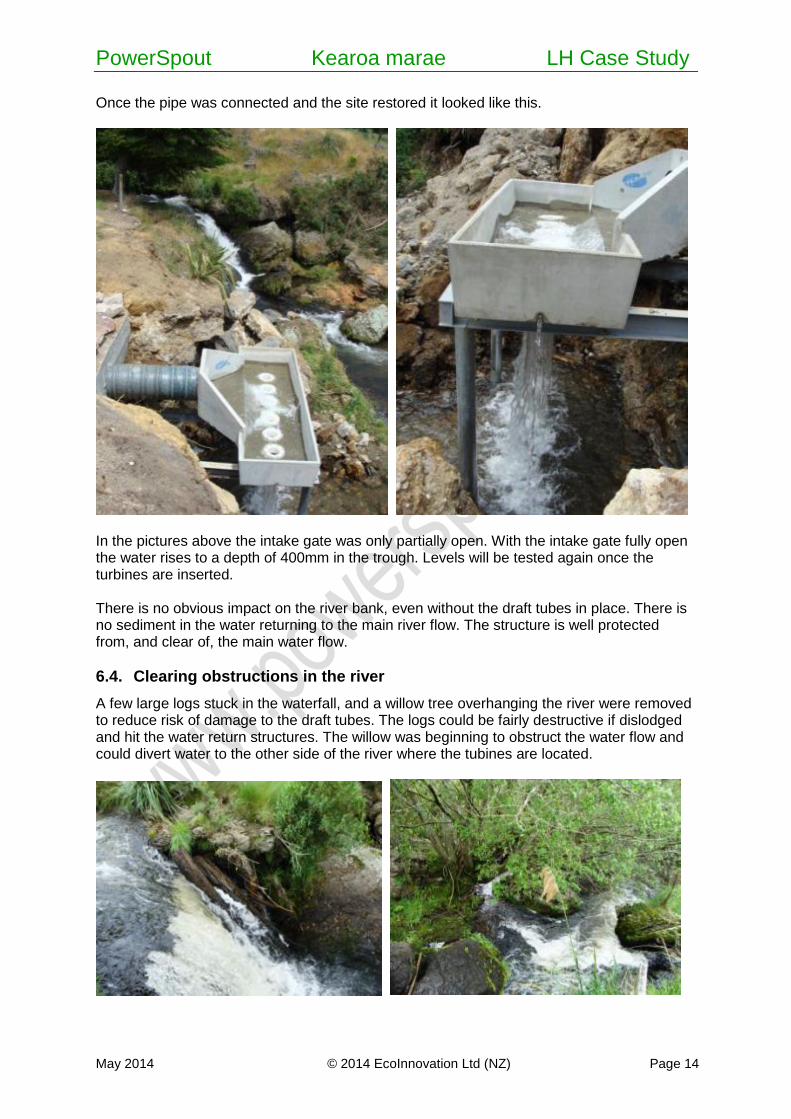
Once the pipe was connected and the site restored it looked like this.
In the pictures above the intake gate was only partially open. With the intake gate fully open the water rises to a depth of 400mm in the trough. Levels will be tested again once the turbines are inserted. There is no obvious impact on the river bank, even without the draft tubes in place. There is no sediment in the water returning to the main river flow. The structure is well protected from, and clear of, the main water flow.
6.4. Clearing obstructions in the river
A few large logs stuck in the waterfall, and a willow tree overhanging the river were removed to reduce risk of damage to the draft tubes. The logs could be fairly destructive if dislodged and hit the water return structures. The willow was beginning to obstruct the water flow and could divert water to the other side of the river where the tubines are located.
PowerSpout Kearoa marae LH Case Study
May 2014 © 2014 EcoInnovation Ltd (NZ) Page 15
6.5. Site restoration
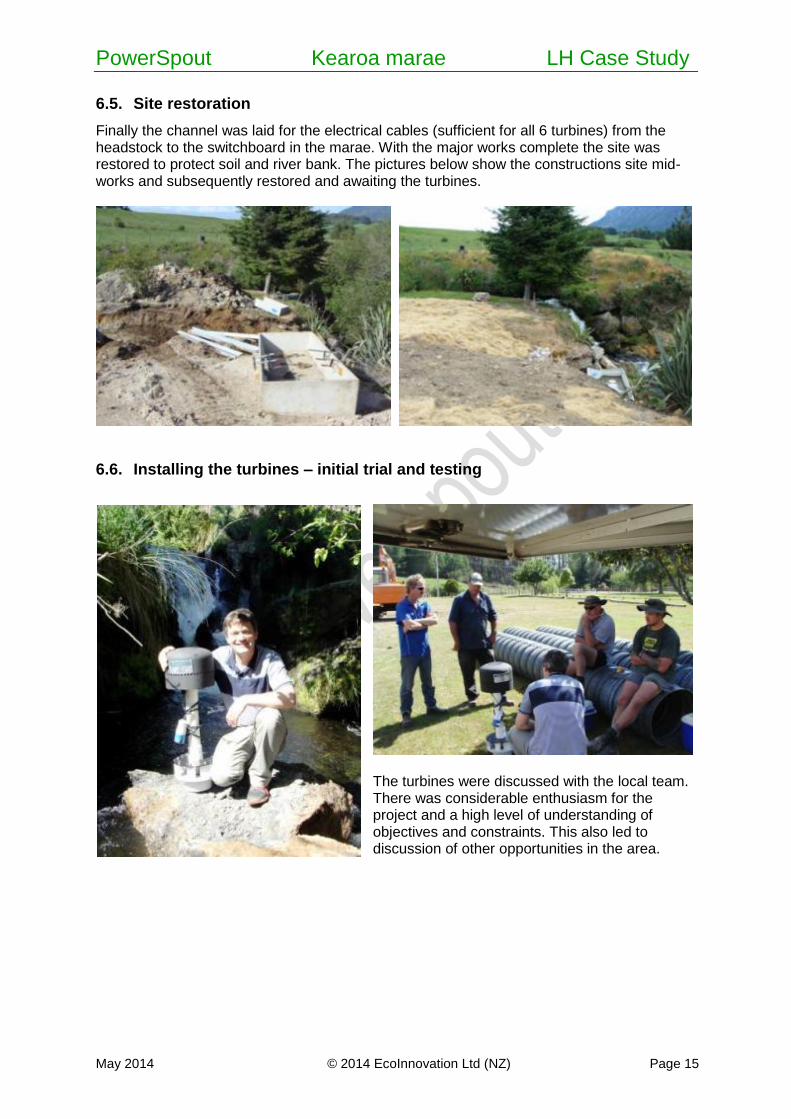
Finally the channel was laid for the electrical cables (sufficient for all 6 turbines) from the headstock to the switchboard in the marae. With the major works complete the site was restored to protect soil and river bank. The pictures below show the constructions site mid-works and subsequently restored and awaiting the turbines.
6.6. Installing the turbines – initial trial and testing
The turbines were discussed with the local team. There was considerable enthusiasm for the project and a high level of understanding of objectives and constraints. This also led to discussion of other opportunities in the area.
PowerSpout Kearoa marae LH Case Study
May 2014 © 2014 EcoInnovation Ltd (NZ) Page 16
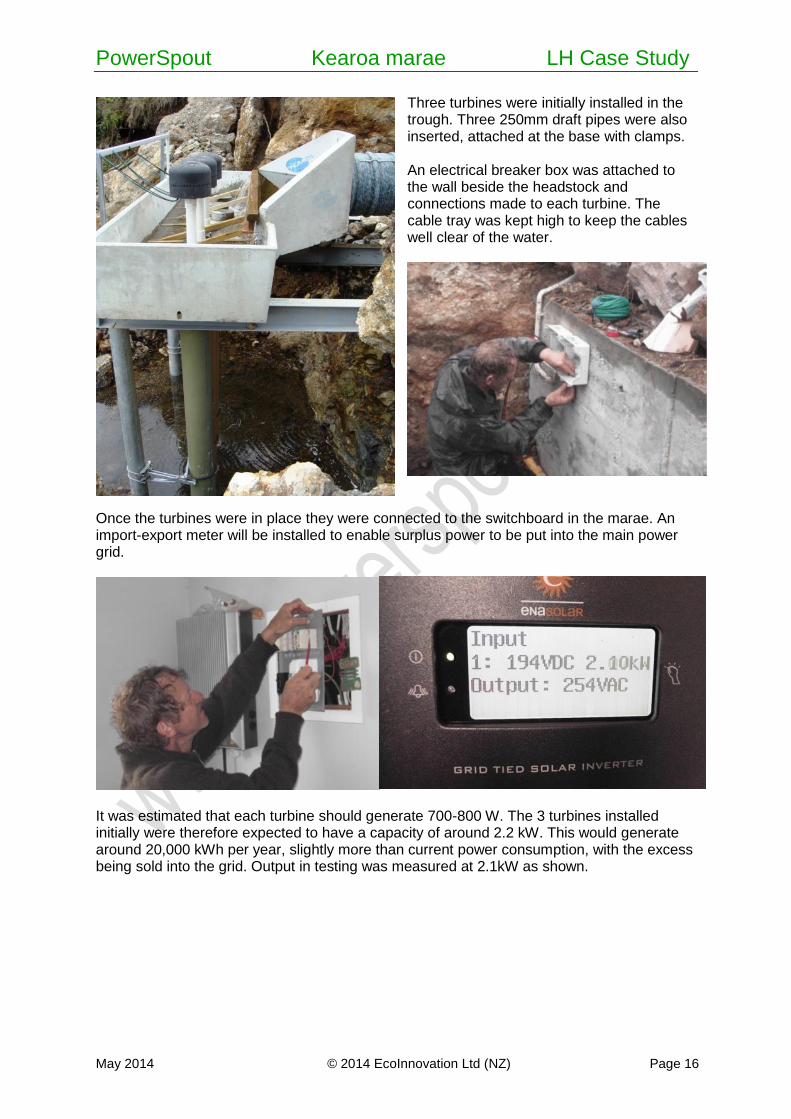
Three turbines were initially installed in the trough. Three 250mm draft pipes were also inserted, attached at the base with clamps. An electrical breaker box was attached to the wall beside the headstock and connections made to each turbine. The cable tray was kept high to keep the cables well clear of the water.
Once the turbines were in place they were connected to the switchboard in the marae. An import-export meter will be installed to enable surplus power to be put into the main power grid.
It was estimated that each turbine should generate 700-800 W. The 3 turbines installed initially were therefore expected to have a capacity of around 2.2 kW. This would generate around 20,000 kWh per year, slightly more than current power consumption, with the excess being sold into the grid. Output in testing was measured at 2.1kW as shown.
PowerSpout Kearoa marae LH Case Study
May 2014 © 2014 EcoInnovation Ltd (NZ) Page 17
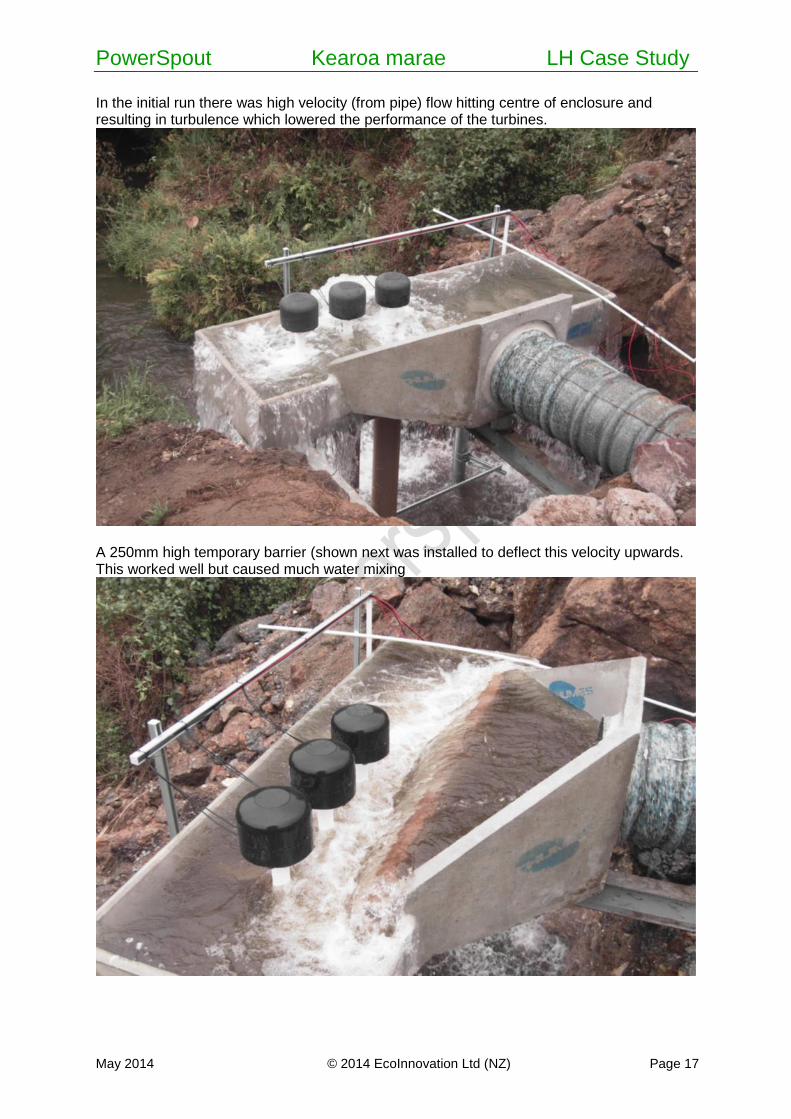
In the initial run there was high velocity (from pipe) flow hitting centre of enclosure and resulting in turbulence which lowered the performance of the turbines.
A 250mm high temporary barrier (shown next was installed to deflect this velocity upwards. This worked well but caused much water mixing
PowerSpout Kearoa marae LH Case Study
May 2014 © 2014 EcoInnovation Ltd (NZ) Page 18
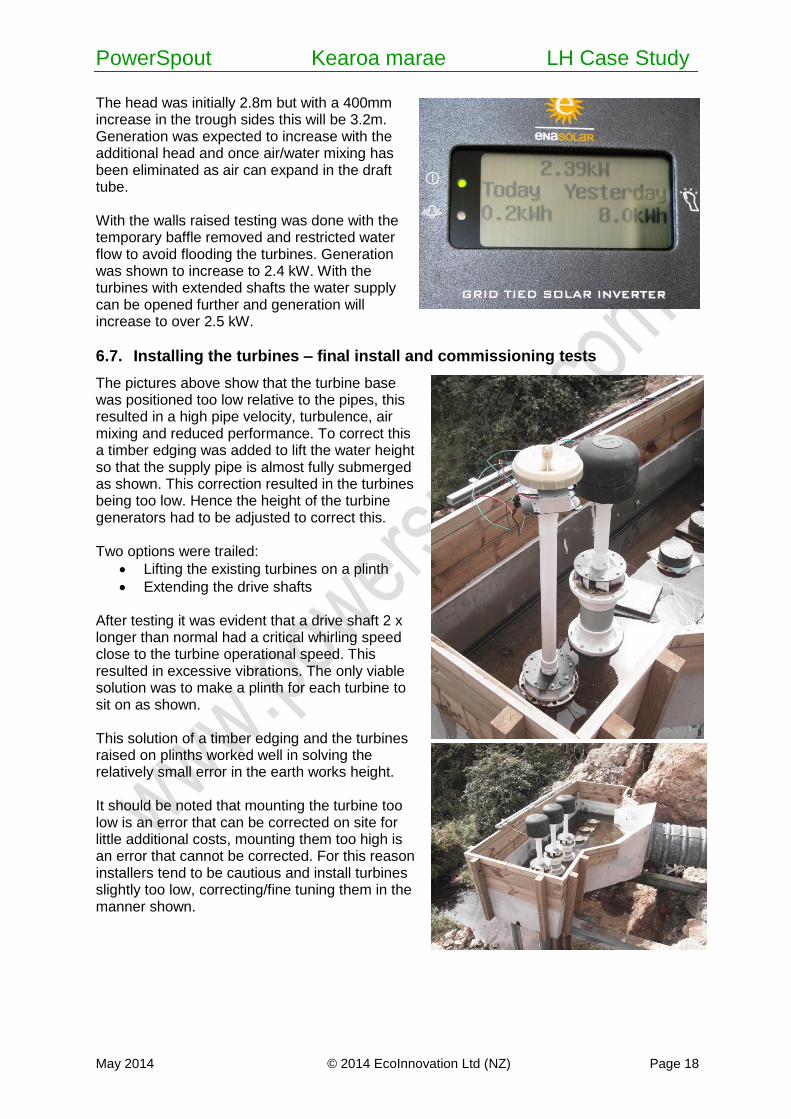
The head was initially 2.8m but with a 400mm increase in the trough sides this will be 3.2m. Generation was expected to increase with the additional head and once air/water mixing has been eliminated as air can expand in the draft tube. With the walls raised testing was done with the temporary baffle removed and restricted water flow to avoid flooding the turbines. Generation was shown to increase to 2.4 kW. With the turbines with extended shafts the water supply can be opened further and generation will increase to over 2.5 kW.
6.7. Installing the turbines – final install and commissioning tests
The pictures above show that the turbine base was positioned too low relative to the pipes, this resulted in a high pipe velocity, turbulence, air mixing and reduced performance. To correct this a timber edging was added to lift the water height so that the supply pipe is almost fully submerged as shown. This correction resulted in the turbines being too low. Hence the height of the turbine generators had to be adjusted to correct this. Two options were trailed:
Lifting the existing turbines on a plinth
Extending the drive shafts After testing it was evident that a drive shaft 2 x longer than normal had a critical whirling speed close to the turbine operational speed. This resulted in excessive vibrations. The only viable solution was to make a plinth for each turbine to sit on as shown. This solution of a timber edging and the turbines raised on plinths worked well in solving the relatively small error in the earth works height. It should be noted that mounting the turbine too low is an error that can be corrected on site for little additional costs, mounting them too high is an error that cannot be corrected. For this reason installers tend to be cautious and install turbines slightly too low, correcting/fine tuning them in the manner shown.
PowerSpout Kearoa marae LH Case Study
May 2014 © 2014 EcoInnovation Ltd (NZ) Page 19
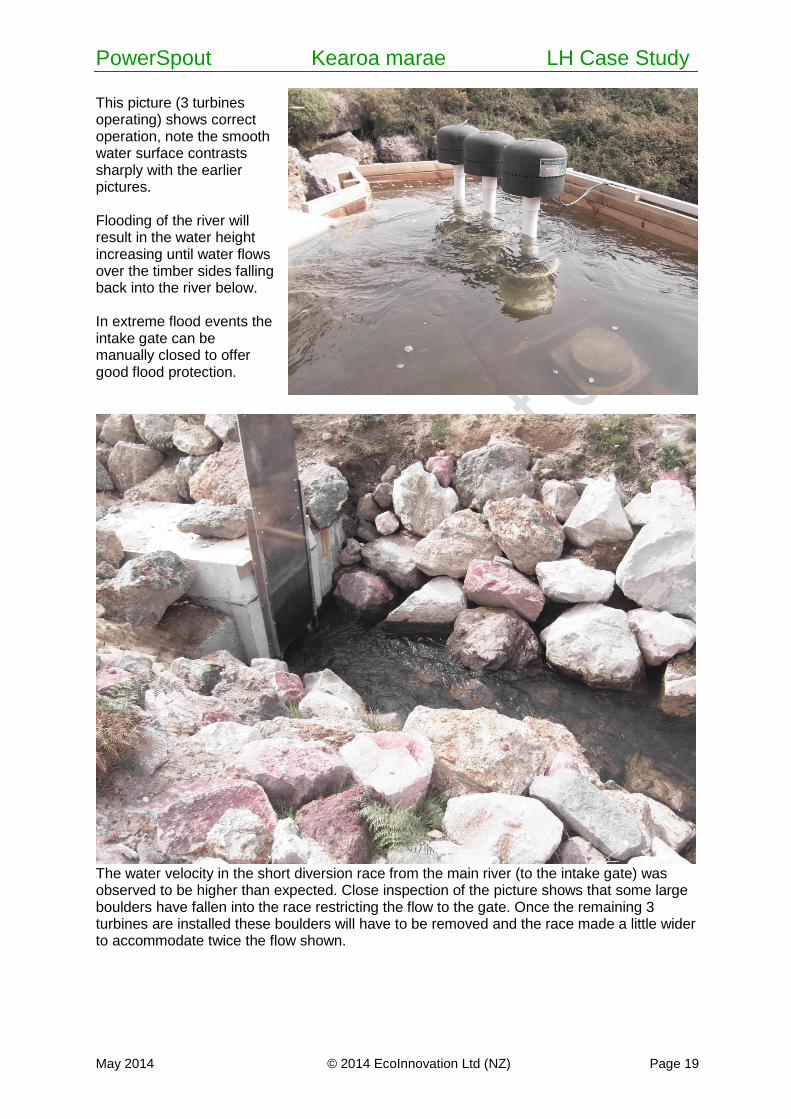
This picture (3 turbines operating) shows correct operation, note the smooth water surface contrasts sharply with the earlier pictures. Flooding of the river will result in the water height increasing until water flows over the timber sides falling back into the river below. In extreme flood events the intake gate can be manually closed to offer good flood protection.
The water velocity in the short diversion race from the main river (to the intake gate) was observed to be higher than expected. Close inspection of the picture shows that some large boulders have fallen into the race restricting the flow to the gate. Once the remaining 3 turbines are installed these boulders will have to be removed and the race made a little wider to accommodate twice the flow shown.
PowerSpout Kearoa marae LH Case Study
May 2014 © 2014 EcoInnovation Ltd (NZ) Page 20
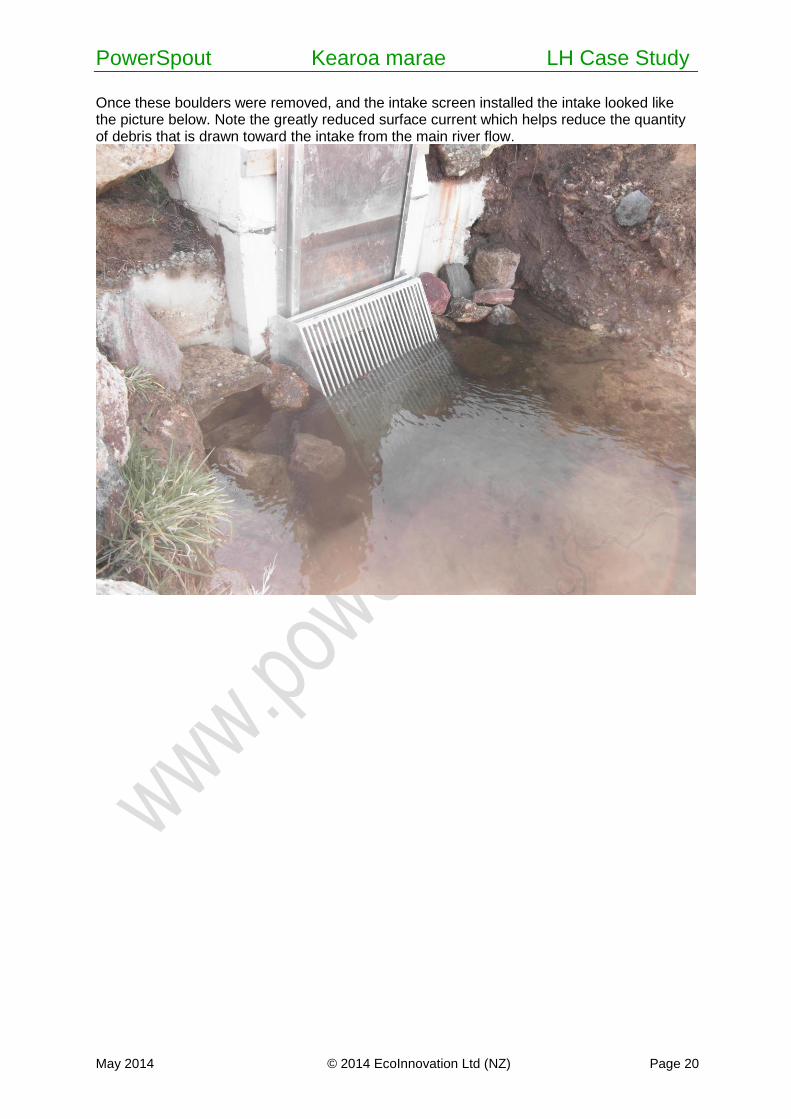
Once these boulders were removed, and the intake screen installed the intake looked like the picture below. Note the greatly reduced surface current which helps reduce the quantity of debris that is drawn toward the intake from the main river flow.
PowerSpout Kearoa marae LH Case Study
May 2014 © 2014 EcoInnovation Ltd (NZ) Page 21
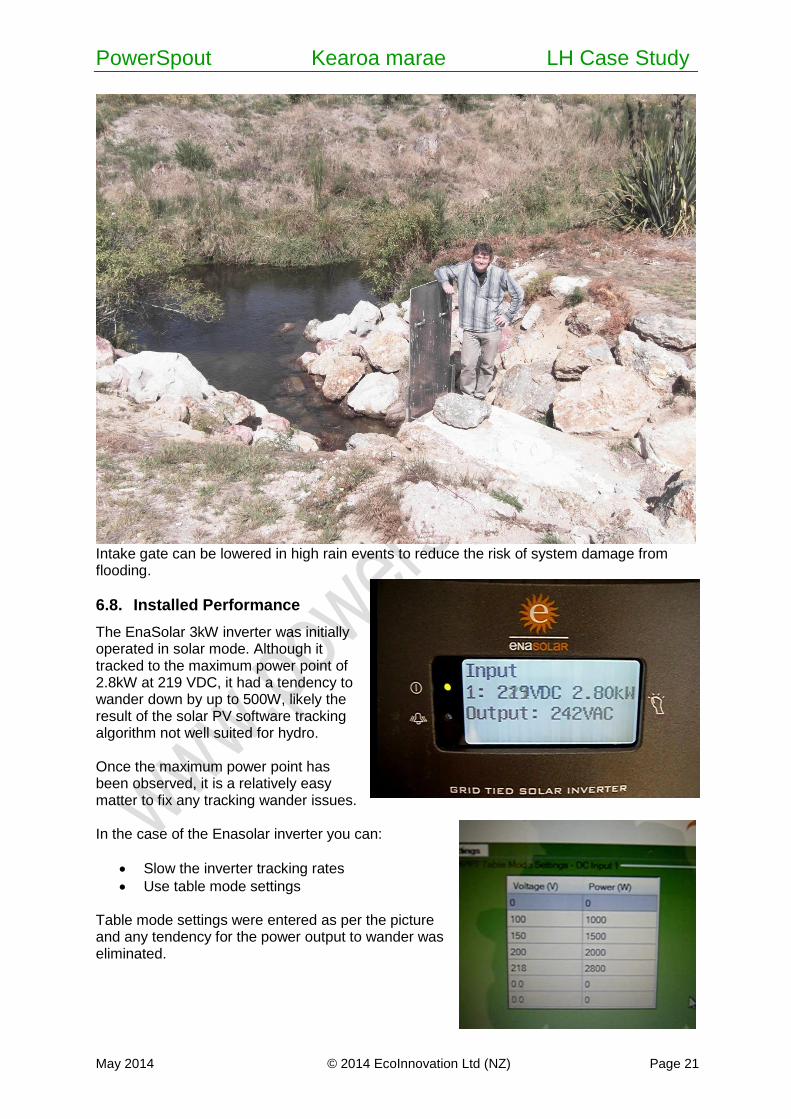
Intake gate can be lowered in high rain events to reduce the risk of system damage from flooding.
6.8. Installed Performance
The EnaSolar 3kW inverter was initially operated in solar mode. Although it tracked to the maximum power point of 2.8kW at 219 VDC, it had a tendency to wander down by up to 500W, likely the result of the solar PV software tracking algorithm not well suited for hydro. Once the maximum power point has been observed, it is a relatively easy matter to fix any tracking wander issues. In the case of the Enasolar inverter you can:
Slow the inverter tracking rates
Use table mode settings Table mode settings were entered as per the picture and any tendency for the power output to wander was eliminated.
PowerSpout Kearoa marae LH Case Study
May 2014 © 2014 EcoInnovation Ltd (NZ) Page 22
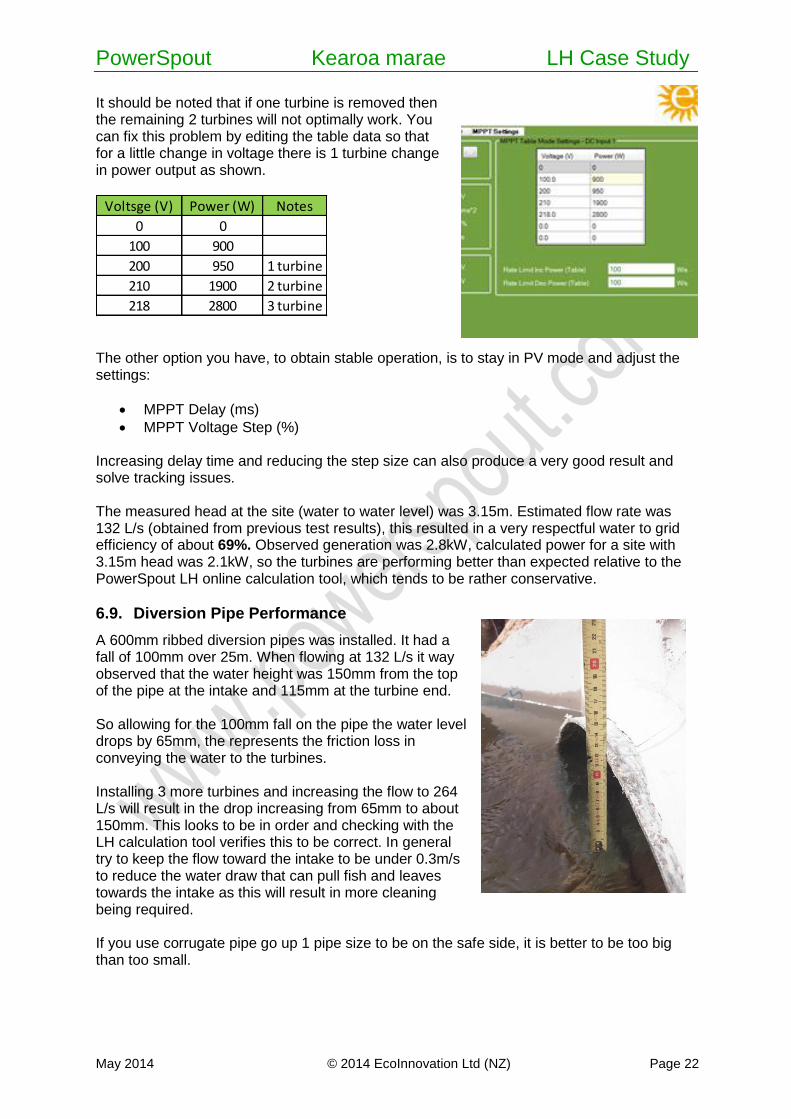
It should be noted that if one turbine is removed then the remaining 2 turbines will not optimally work. You can fix this problem by editing the table data so that for a little change in voltage there is 1 turbine change in power output as shown.
The other option you have, to obtain stable operation, is to stay in PV mode and adjust the settings:
MPPT Delay (ms)
MPPT Voltage Step (%) Increasing delay time and reducing the step size can also produce a very good result and solve tracking issues. The measured head at the site (water to water level) was 3.15m. Estimated flow rate was 132 L/s (obtained from previous test results), this resulted in a very respectful water to grid efficiency of about 69%. Observed generation was 2.8kW, calculated power for a site with 3.15m head was 2.1kW, so the turbines are performing better than expected relative to the PowerSpout LH online calculation tool, which tends to be rather conservative.
6.9. Diversion Pipe Performance
A 600mm ribbed diversion pipes was installed. It had a fall of 100mm over 25m. When flowing at 132 L/s it way observed that the water height was 150mm from the top of the pipe at the intake and 115mm at the turbine end. So allowing for the 100mm fall on the pipe the water level drops by 65mm, the represents the friction loss in conveying the water to the turbines. Installing 3 more turbines and increasing the flow to 264 L/s will result in the drop increasing from 65mm to about 150mm. This looks to be in order and checking with the LH calculation tool verifies this to be correct. In general try to keep the flow toward the intake to be under 0.3m/s to reduce the water draw that can pull fish and leaves towards the intake as this will result in more cleaning being required. If you use corrugate pipe go up 1 pipe size to be on the safe side, it is better to be too big than too small.
Voltsge (V) Power (W) Notes
0 0
100 900
200 950 1 turbine
210 1900 2 turbine
218 2800 3 turbine
PowerSpout Kearoa marae LH Case Study
May 2014 © 2014 EcoInnovation Ltd (NZ) Page 23
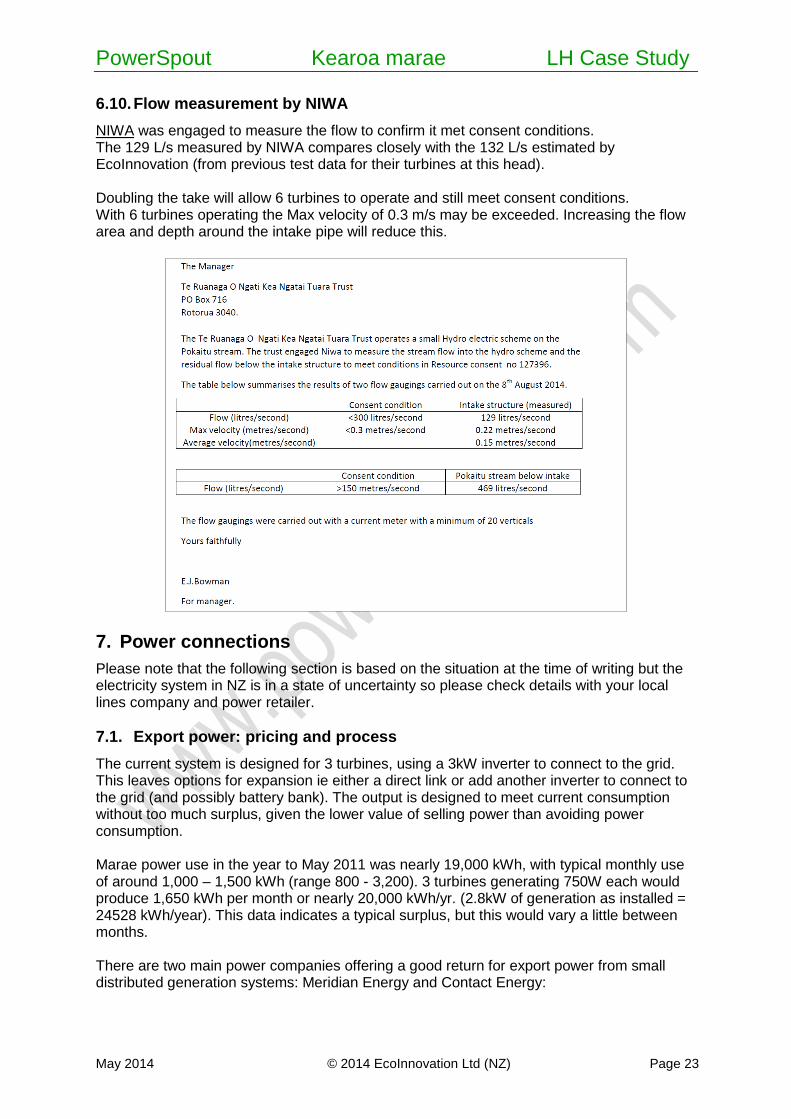
6.10. Flow measurement by NIWA
NIWA was engaged to measure the flow to confirm it met consent conditions. The 129 L/s measured by NIWA compares closely with the 132 L/s estimated by EcoInnovation (from previous test data for their turbines at this head). Doubling the take will allow 6 turbines to operate and still meet consent conditions. With 6 turbines operating the Max velocity of 0.3 m/s may be exceeded. Increasing the flow area and depth around the intake pipe will reduce this.
7. Power connections
Please note that the following section is based on the situation at the time of writing but the electricity system in NZ is in a state of uncertainty so please check details with your local lines company and power retailer.
7.1. Export power: pricing and process
The current system is designed for 3 turbines, using a 3kW inverter to connect to the grid. This leaves options for expansion ie either a direct link or add another inverter to connect to the grid (and possibly battery bank). The output is designed to meet current consumption without too much surplus, given the lower value of selling power than avoiding power consumption. Marae power use in the year to May 2011 was nearly 19,000 kWh, with typical monthly use of around 1,000 – 1,500 kWh (range 800 - 3,200). 3 turbines generating 750W each would produce 1,650 kWh per month or nearly 20,000 kWh/yr. (2.8kW of generation as installed = 24528 kWh/year). This data indicates a typical surplus, but this would vary a little between months. There are two main power companies offering a good return for export power from small distributed generation systems: Meridian Energy and Contact Energy:

PowerSpout Kearoa marae LH Case Study
May 2014 © 2014 EcoInnovation Ltd (NZ) Page 24
Meridian export energy is based on a stepped plan: 25 cents per kWh (plus GST if registered for GST) for the first 5kWh per day (e.g. 150 kWh for a 30-day billing cycle) and 10 cents per kWh (plus GST if registered) thereafter.
Contact Energy offer a flat rate of 17.3 cents per kWh providing the installed capacity is below 10 kW; above this I believe it drops to 7 cents per kWh
If the export energy is as anticipated then the higher rate offered by Meridian is most attractive. If power export climbs above 300 kWh per month then the Contact Energy rate begins to look a better deal. Meridian was chosen in this instance and steps taken to change to them from the current provider, and seek agreement to install the scheme and sell surplus power. Once installed change energy retailer in nor a major undertaking and this remains an option at this site. 7.1.1. Meridian process guide Meridian (online guidance) requests customers follow these steps in setting up a renewable generation scheme which has a rated capacity of 10 kW or less:
1. Select the supplier who stocks the system you wish to install. Make sure that your chosen supplier provides you with certificated evidence that the system you want complies fully with the AS4777 standards, and has also been tested to that standard by an independent test organisation in either New Zealand or Australia.
2. Select an electricity specialist to help you, such as an electrician, an electrical engineer or a suitably qualified electrical contractor.
3. Contact your local network company to get an application form (for example, Orion or Wellington Electricity Lines). Submit the form and wait for their written response. This can take up to 20 business days.
4. Advise us you are installing a turbine or solar panel. You can email us at [email protected] or call us on 0800 496 496.
5. If you're not a Meridian customer, you’ll need to join us so we can give you pricing options. You’ll also need to request an upgrade of your meter so it can record import and export electricity flows. As delays in meter upgrades can occur, please advise us as soon as possible when your project gets underway.
6. Your electrician needs to advise Meridian whether the supply to the meter-board is single-phase or three-phase in order for us to install the correct meter type.
7. Arrange for your chosen supplier to install your turbine or solar panel system.
7.2. Power Lines company: access to distribution network
The local lines company, Unison,also provide information, including application to use their distribution network, at http://www.unison.co.nz/235/ Once the application is submitted, Unison advise within 5 working days whether the application is complete and within 30 working days whether approval to connect is granted. If Unison does not grant approval, a letter outlining why your application was declined will be sent to you and you may remedy these issues and re-apply. An administration charge is payable to Unison for the connection. Unison require a certificate of compliance from the electrician to certify that the installation meets AS4777.1-2005. This ensures there is no risk to safety and damage does not occur to the Unison network. Once the generator receives the approval to connect the Distributed Generation, the generator must give Unison notice of their intention to proceed within 10 working days.
PowerSpout Kearoa marae LH Case Study
May 2014 © 2014 EcoInnovation Ltd (NZ) Page 25
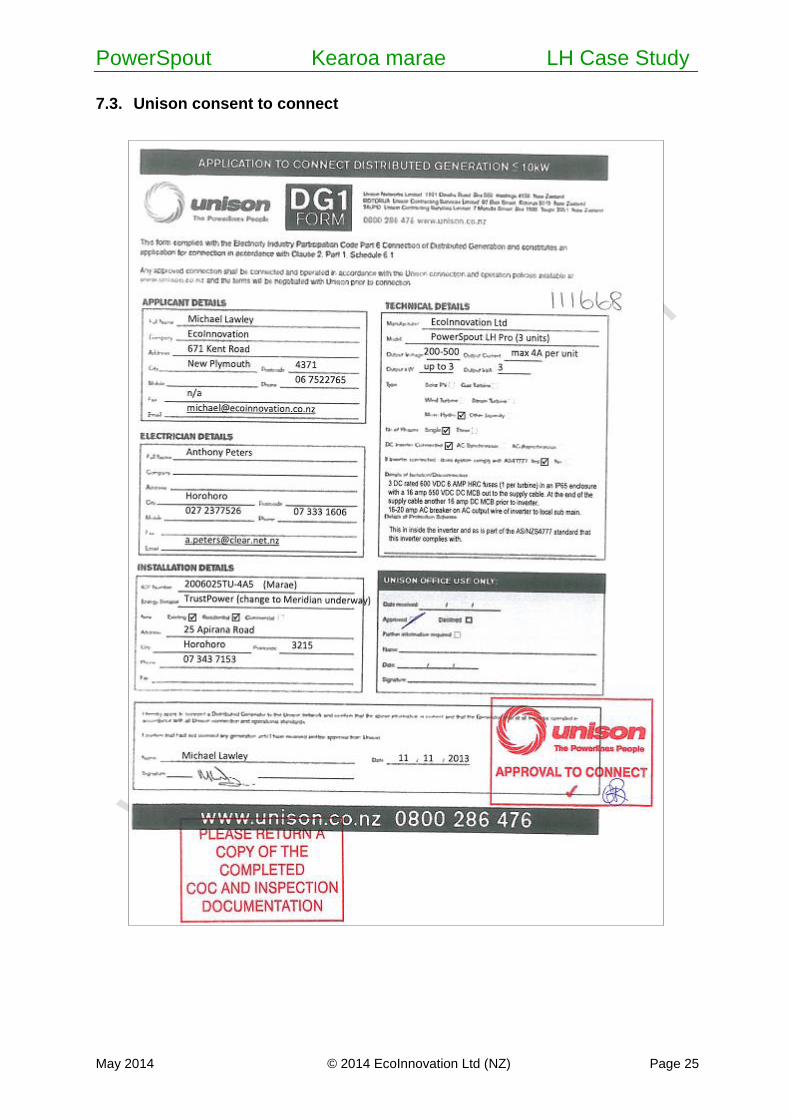
7.3. Unison consent to connect
PowerSpout Kearoa marae LH Case Study
May 2014 © 2014 EcoInnovation Ltd (NZ) Page 26
7.4. Compliance
For such installations NZ law requires equipment used in such installations to comply with a accepted standards. These include:
Inverter: AS4777, CE and C-tick compliance
Turbines: C-tick and CE
Noark DC Breaker: CE
Solar Cable used: PV1-F These documents can normally be located on the suppliers web site. In addition to these document you should keep on file the Certificate of Compliance (issued by the site electrician) any certificates of Electrical Inspection if/as required.
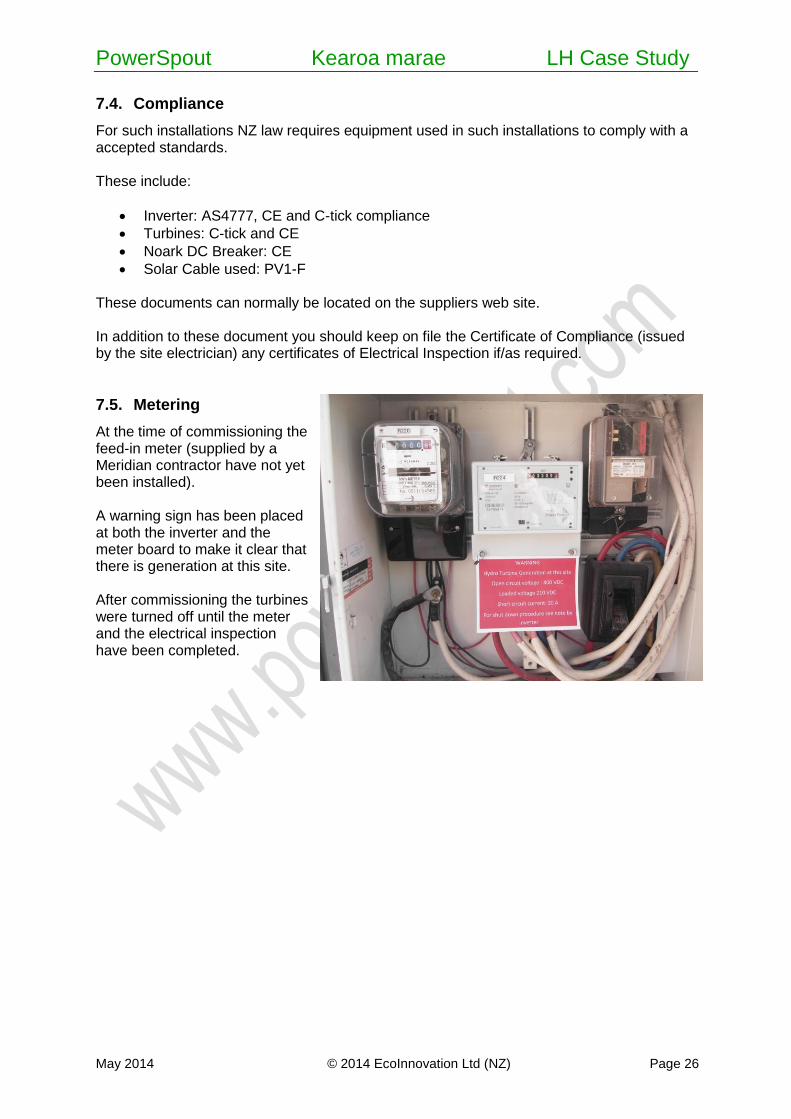
7.5. Metering
At the time of commissioning the feed-in meter (supplied by a Meridian contractor have not yet been installed). A warning sign has been placed at both the inverter and the meter board to make it clear that there is generation at this site. After commissioning the turbines were turned off until the meter and the electrical inspection have been completed.
PowerSpout Kearoa marae LH Case Study
May 2014 © 2014 EcoInnovation Ltd (NZ) Page 27
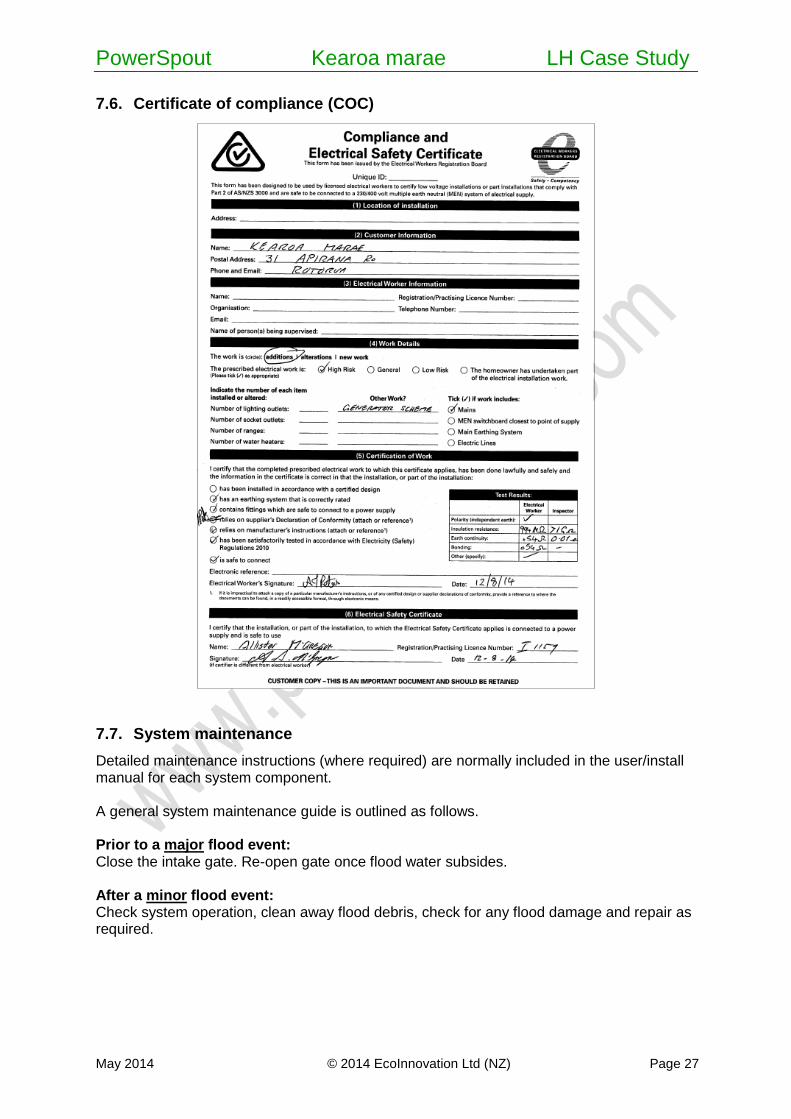
7.6. Certificate of compliance (COC)
7.7. System maintenance
Detailed maintenance instructions (where required) are normally included in the user/install manual for each system component. A general system maintenance guide is outlined as follows. Prior to a major flood event: Close the intake gate. Re-open gate once flood water subsides. After a minor flood event: Check system operation, clean away flood debris, check for any flood damage and repair as required.
PowerSpout Kearoa marae LH Case Study
May 2014 © 2014 EcoInnovation Ltd (NZ) Page 28
Inverter: Check for any red lights on the display which might mean:
Earth fault detected – call electrician
AC power turned off (no AC warning on inverter display)
DC power turned off or intake gate closed (no DC warning on inverter display) If the inverter shows no red lights and the generation display shows over 2.5kW, then all is well. We have noticed at this site that the AC in the building has been turned off by accident (in order to save power). Please ensure this does not happen and that building users are advised to leave the power on. There is no routine maintenance required for the inverter other than keeping the front heat-sink clean of dust. Intake screen:
Keep clean of debris, check every 1-2 weeks and clean as needed, more cleaning may be needed after floods, high winds and during Autumn.
PowerSpout LH turbines:
Replace auto grease canister even 12 months - refer to manual.
Check upper and lower bearing every 12 month - replace if required
Clean intake guide vents and propeller Periodic maintenance (modified from AS/NZS5033:2012):
Every year:
Clean site as required
Check safety signs are still in place
Periodic inspections should be carried out to check wiring integrity, electrical connections, corrosion and mechanical protection of wiring.
Check hydro mounting structure for any flood damage and repair
Test operation of switches/breakers
Every 5 year:
Verify mechanical integrity of conduits and outside breaker enclosures, tightness of connections, water accumulation/build-up, integrity of lid seals, integrity of cable entrance and/or conduit sealing, integrity of clamping devices.