Embed Size (px)
Citation preview


2
Region Surface Water
Shortage
Additional Groundwater
Use (maf/yr)
Additional Groundwater
Cost ($ Million/yr)
Sacramento Valley 1.8 0.9 35.4
San Joaquin Valley 1.8 1.5 71.9
Tulare Lake Basin 3.0 2.6 340.3
Central Valley subtotal 6.5 5.0 447.6 Central Coast 0.0 0.0 0.3
South Coast 0.1 0.1 0.0
Colorado River Region 0.0 0.0 6.0
Statewide Total 6.6 5.1 6.3

Drought impact Loss Quantity Water supply impacts, 2014 drought
Surface water reduction 6.6 million acre-feet Groundwater pumping increase 5 million acre-feet Net water shortage 1.6 million acre-feet
Statewide agricultural impacts, 2014 drought Crop revenue loss $810 million Additional pumping cost $454 million Livestock and dairy revenue loss $203 million Total direct losses 1.5 billion
Total economic cost $2.2 billion Total job losses 17,100
3

Price changes for California specialty crops
Satellite measures of fallowed acres Socio-economic impact indicators
4

5
Consumer Price Indexes Trend % change 2014 All food 2.7 Food away from home 2.5 Food at home 2.9 Meats, poultry, and fish 8.8 Meats 11.8 Poultry 1.7 Eggs 9.7 Dairy products 4.4 Fats and oils 1.1 Fruits and vegetables 0.1
Fresh fruits & vegetables 0.3
Processed fruits & vegetables -0.4
Source: http://www.ers.usda.gov/data-products/food-price-outlook.aspx#.VCuPIhawWSo (September 2014)

6

7
8
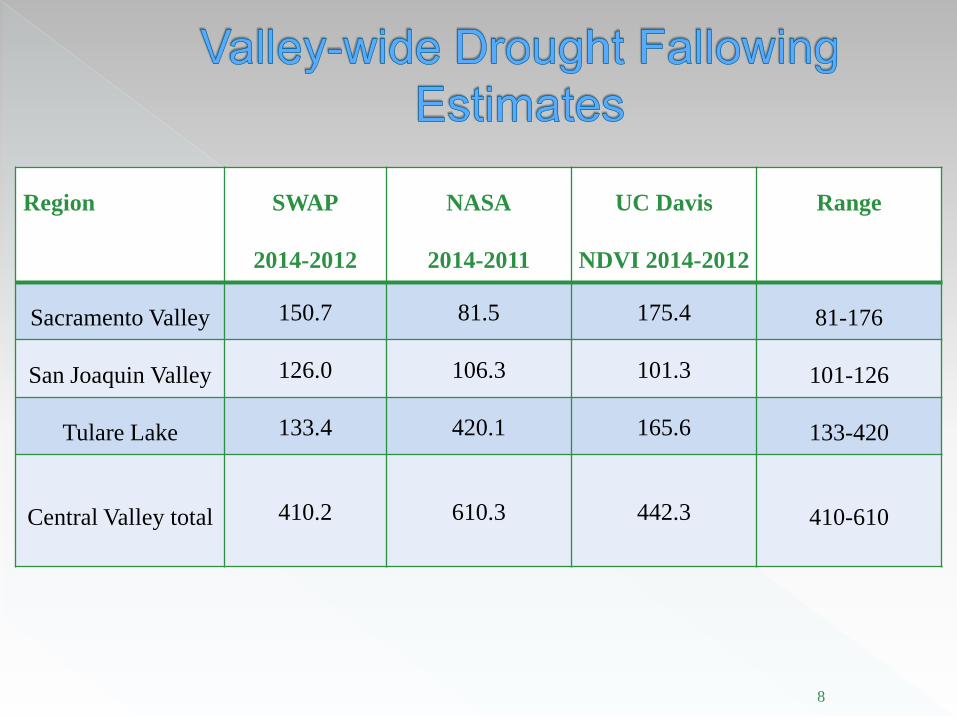
Region SWAP
2014-2012
NASA
2014-2011
UC Davis
NDVI 2014-2012
Range
Sacramento Valley 150.7 81.5 175.4 81-176
San Joaquin Valley 126.0 106.3 101.3 101-126
Tulare Lake 133.4 420.1 165.6 133-420
Central Valley total 410.2 610.3 442.3 410-610

Number of boxes by IMPLAN region
Job losses by region in 4 brackets
Food boxes were delivered to regions with job losses
Tulare Lake Basin is the most seriously affected
9

10
1. Water systems and the societies they serve are always changing.
2. Droughts bring attention to needs for change
3. This drought is painful, but also is helping improve water management
4. Every generation needs at least a threatening drought, and a threatening flood

11
2014: 8th driest in 106 years

12

13

14

15
Probability next yearSacramento Valley San Joaquin Valley
Next Year Historical Critical now Historical Critical nowCritical 0.13 0.29 0.18 0.55Dry 0.21 0.35 0.14 0Below Normal 0.18 0.07 0.16 0.15C,D 0.34 0.64 0.32 0.55C,D, BN 0.52 0.71 0.48 0.7AN, W 0.48 0.29 0.52 0.3

16 ENSO Index
Ann
ual R
unof
f, m
af

17
• Droughts are inevitable • Portfolio approach • Groundwater • Water markets • Need for state agencies to work better together • Information
• Better water and water use data, made more available with better modeling
• Potential of remote sensing estimates • Retrospective assessment of drought