Embed Size (px)
Citation preview

FY 2017Preliminary Results12 months to 30 June 2017
18 September 2017
Driving Forward
Important Notice
• These Presentation Materials are being supplied to you by Petra Diamonds Limited (the “Company”) solely for your information and use at thispresentation. These Presentation Materials may contain information that is confidential, legally privileged or otherwise protected by law. ThesePresentation Materials may not be reproduced in any form, redistributed or passed on, directly or indirectly, to any person or published, in whole or in part,by any medium or for any purpose. Failure to comply with this restriction may constitute a violation of applicable securities law.
• These Presentation Materials are exclusively for the purposes of raising awareness about the Company. These Presentation Materials are not intendedto solicit the dealing in securities or securities financing nor do they form part of any invitation, offer for sale or subscription or any solicitation for any offerto buy or subscribe for any securities in the Company (“Company Securities”) nor shall they or any part of them form the basis of, or be relied upon inconnection therewith or act as any inducement to enter into, any contract or commitment with respect to Company Securities.
• These Presentation Materials must not be used or relied upon for the purpose of making any investment decision or engaging in an investment activity.Accordingly, neither the Company nor any of its subsidiary undertakings (as defined in the Bermuda Companies Act 2006) (together, the “Group”), norany of their respective directors, employees, agents or advisors makes any representation or warranty in respect of the contents of the PresentationMaterials or otherwise in relation to the Group or any of its businesses.
• The information contained in the Presentation Materials is subject to amendment, revision and updating, and such information may change materially. Noperson is under any obligation to update, or keep current, the information contained in these Presentation Materials, and any opinions expressed inrelation thereto are subject to change without notice. The Presentation Materials contain forward-looking statements which involve risk and uncertaintiesand actual results and developments may differ materially from those expressed or implied by these statements depending on a variety of factors. ThePresentation Materials have not been independently verified and no representation or warranty, express or implied, is made as to the fairness, accuracy orcompleteness of the information or opinions contained herein. The forward-looking information contained in these Presentation Materials is expresslyqualified by this cautionary statement.
• The delivery of these Presentation Materials shall not at any time or in any circumstance create any implication that there has been no adverse change, orany event reasonably likely to involve any adverse change, in the condition (financial or otherwise) of the Company or any other member of the Groupsince the date of these Presentation Materials.
• Any securities mentioned herein have not been and will not be registered under the United States Securities Act of 1933, as amended (the “SecuritiesAct”) or under the securities laws of any state or other jurisdiction of the United States and may not be offered, sold, resold or delivered, directly orindirectly, in or into the United States absent registration except pursuant to an exemption from, or in a transaction not subject to, the registrationrequirements of the Securities Act and applicable states securities laws. The distribution of these Presentation Materials in other jurisdictions may also berestricted by law, and persons into whose possession these materials come should inform themselves about, and observe, any such restrictions. Nopublic offering of securities is being made in the United States or any other jurisdiction.
• By attending this presentation or by accepting a copy of the Presentation Materials, you agree to be bound by the foregoing limitations and conditions.
2
FY 2017 – Driving Forward
Continued production growth to 4 Mcts
• Disappointing not to achieve guidance but Petra ended the Year at run rates to support guided FY 2018 production levels
Major development work achieved in FY 2017
• Completion of 11.4 km development (out of a total 63.3 km to date) and start of significant build up of tonnes from new underground caves
• Plant modifications at Williamson and KEM JV
• Cullinan Plant commissioning started
Transformation in production profile underway in FY 2017
• Undiluted ore: 750,000 kcts from Finsch
• Undiluted ore: 940,000 kcts from Cullinan
• Finsch ROM grade +28% and Cullinan ROM grade +29%
• Finsch US$/ct +14% and Cullinan US$/ct +4% (excl. Exceptionals)
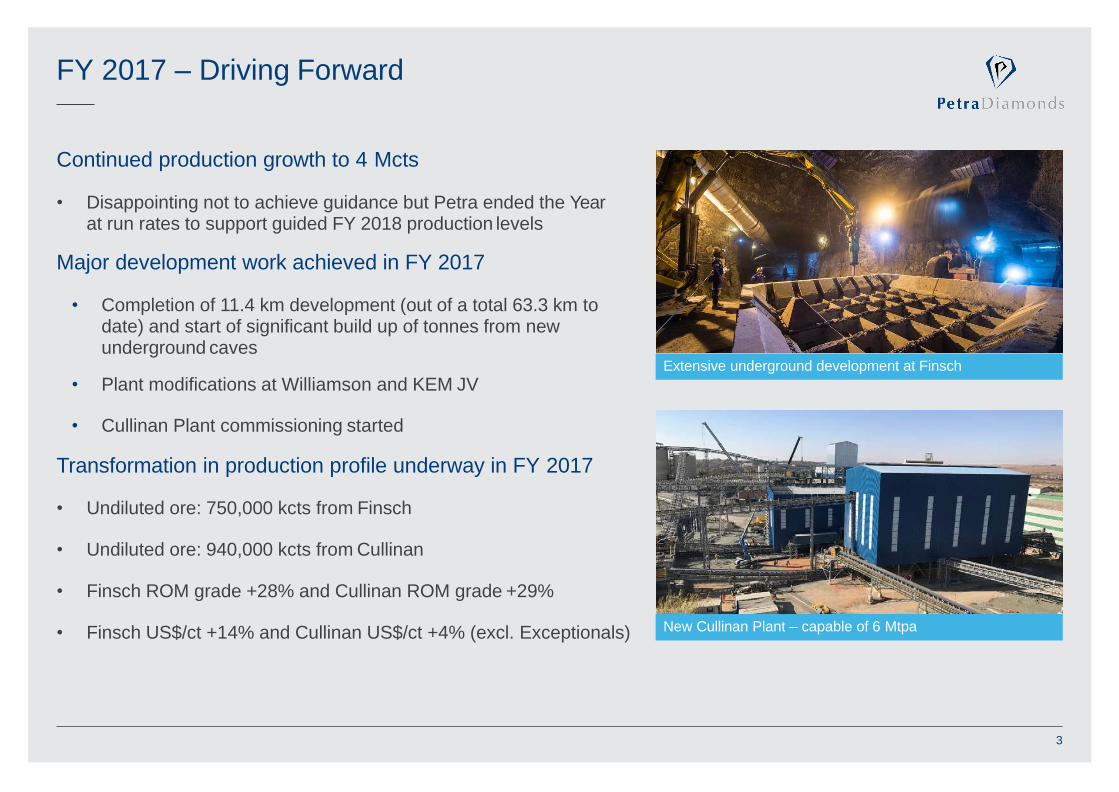
Extensive underground development at Finsch
New Cullinan Plant – capable of 6 Mtpa
3
FY 2017 – Key Performance Indicators
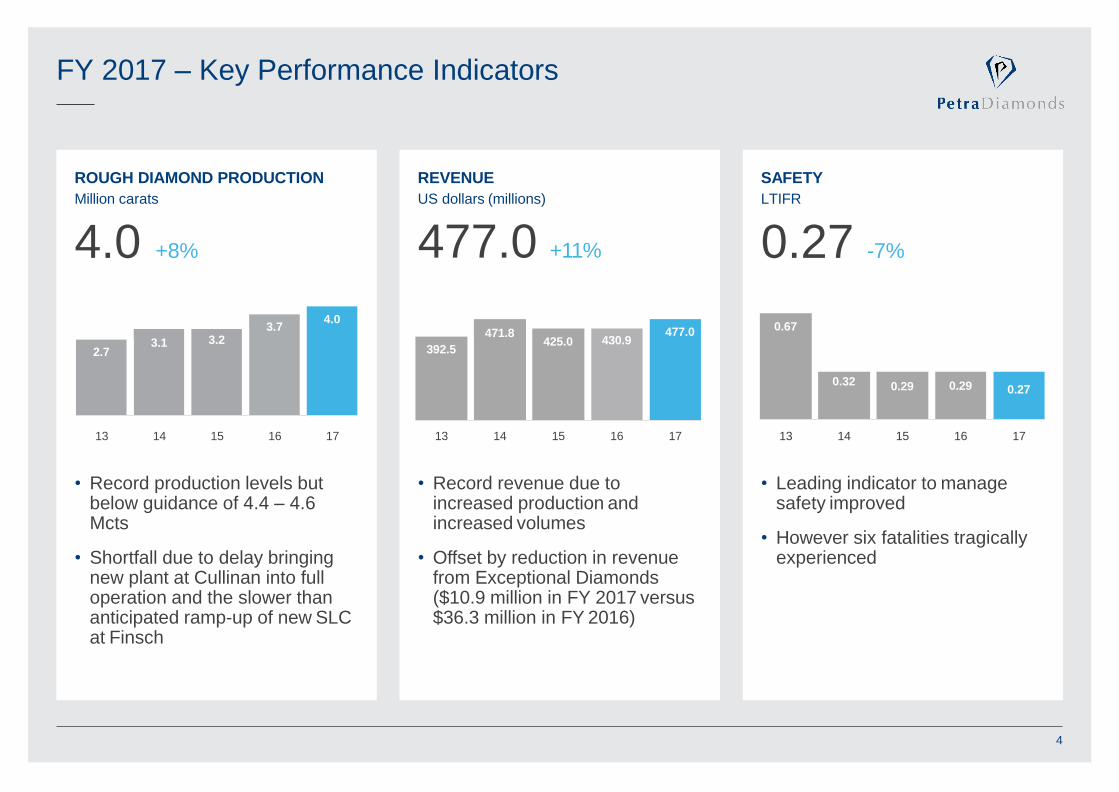
ROUGH DIAMOND PRODUCTION
Million carats
4.0 +8%
4.03.7
3.1 3.22.7
13 14 15 16 17
• Record production levels but below guidance of 4.4 – 4.6 Mcts
• Shortfall due to delay bringing new plant at Cullinan into full operation and the slower than anticipated ramp-up of new SLC at Finsch
REVENUE
US dollars (millions)
477.0 +11%
471.8 477.0425.0 430.9
392.5
13 14 15 16 17
• Record revenue due to increased production and increased volumes
• Offset by reduction in revenue from Exceptional Diamonds ($10.9 million in FY 2017 versus$36.3 million in FY 2016)
SAFETY
LTIFR
0.27 -7%
0.67
0.32 0.29 0.29 0.27
13 14 15 16 17
• Leading indicator to manage safety improved
• However six fatalities tragically experienced
4
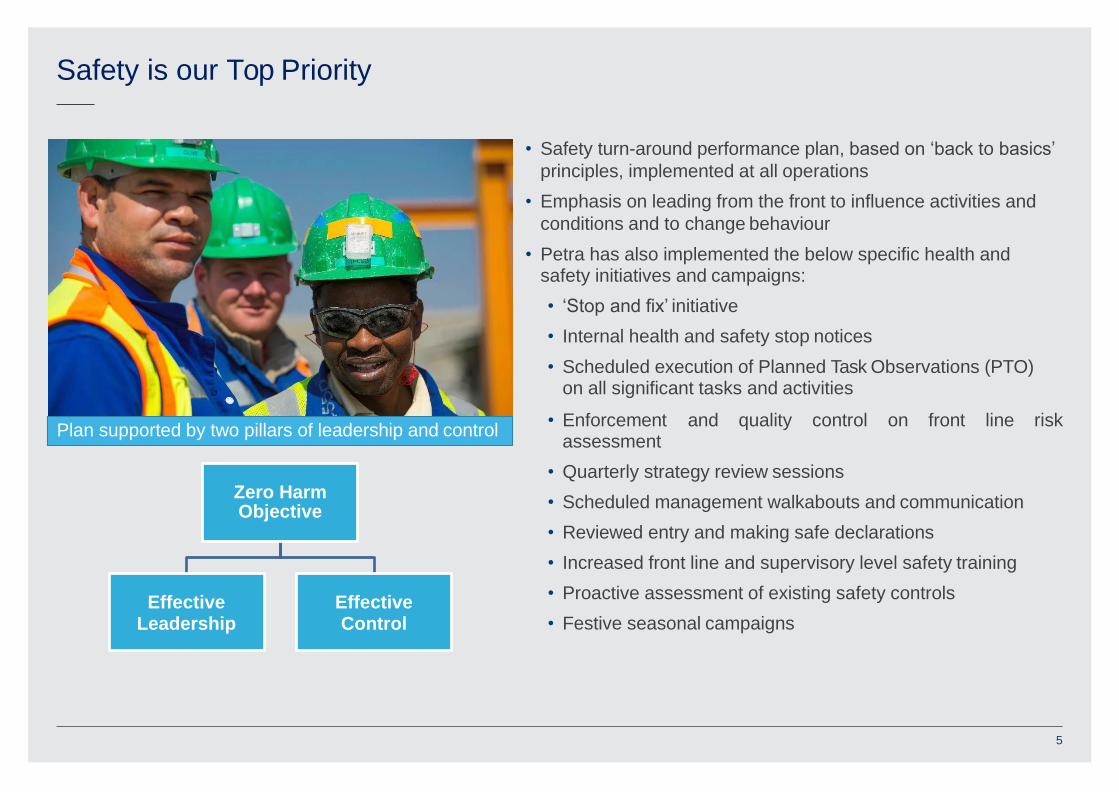
Safety is our Top Priority
• Safety turn-around performance plan, based on ‘back to basics’
principles, implemented at all operations
• Emphasis on leading from the front to influence activities and
conditions and to change behaviour
• Petra has also implemented the below specific health and safety initiatives and campaigns:
• ‘Stop and fix’ initiative
• Internal health and safety stop notices
• Scheduled execution of Planned Task Observations (PTO) on all significant tasks and activities
risk• Enforcement and quality control on front line assessment
• Quarterly strategy review sessions
• Scheduled management walkabouts and communication
• Reviewed entry and making safe declarations
• Increased front line and supervisory level safety training
• Proactive assessment of existing safety controls
• Festive seasonal campaigns
Plan supported by two pillars of leadership and control
5
Zero Harm Objective
Effective Leadership
Effective Control
FY 2017 – Key Performance Indicators
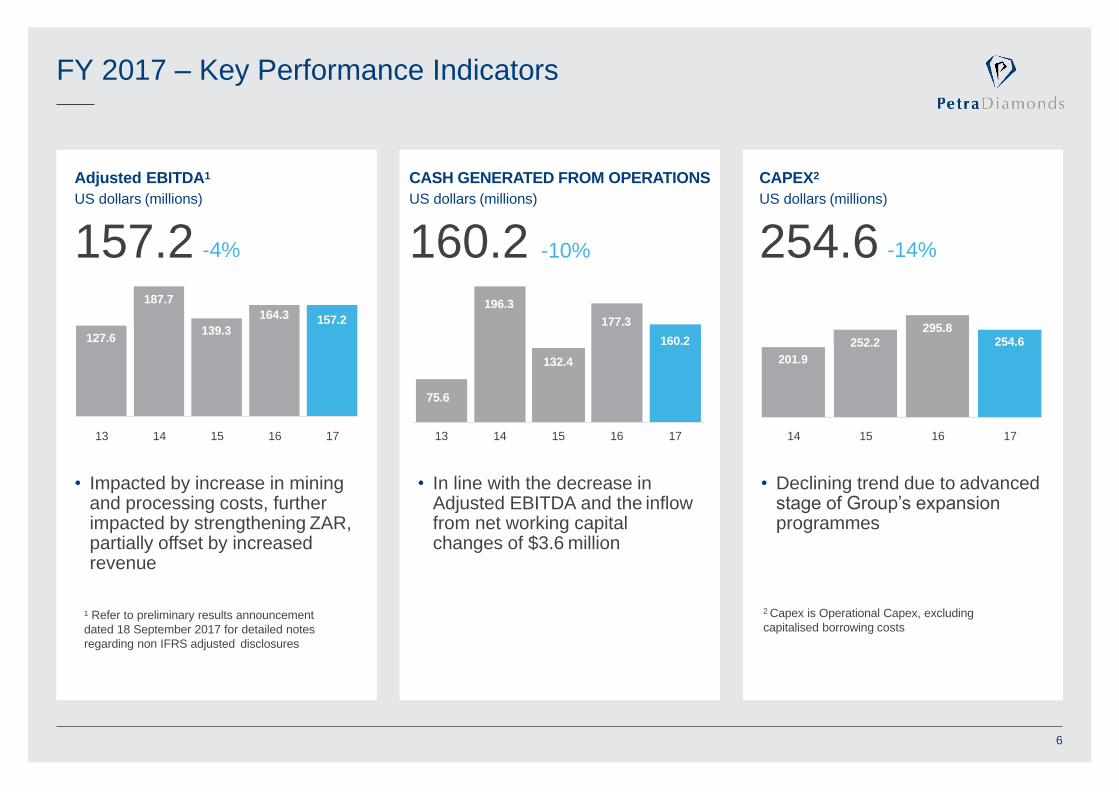
Adjusted EBITDA1
US dollars (millions)
157.2 -4%
187.7
164.3 157.2139.3
127.6
13 14 15 16 17
• Impacted by increase in mining and processing costs, further impacted by strengthening ZAR, partially offset by increased revenue
CASH GENERATED FROM OPERATIONS
US dollars (millions)
160.2 -10%
75.6
196.3
132.4
177.3
160.2
13 14 15 16 17
• In line with the decrease in Adjusted EBITDA and the inflow from net working capital changes of $3.6 million
• Declining trend due to advanced stage of Group’s expansion programmes
CAPEX2
US dollars (millions)
254.6 -14%
295.8
252.2 254.6
201.9
14 15 16 17
¹ Refer to preliminary results announcement
dated 18 September 2017 for detailed notes
regarding non IFRS adjusted disclosures
6
2 Capex is Operational Capex, excluding
capitalised borrowing costs

Financial Position
Unit 30 June 2017 30 June 2016
Closing exchange rate used for conversion R13.05:US$1 R14.68:US$1
Cash at bank US$m 203.7 48.7
Diamond debtors US$m 41.5 63.4
Diamond inventoriesCarats
US$m
570,264
50.2
549,620
43.6
US$300 million loan notes (issued May 2015) US$m - 300.0
US$650 million loan notes (issued April 2017) US$m 650.0 -
Bank loans and borrowings US$m 109.0 131.5
Net debt¹ US$m 555.3 382.8
Bank facilities undrawn and available US$m 5.6 110.0
1. Net debt is the US$ loan notes and bank loans and borrowings net of cash at bank, but does not include ‘Diamond debtors’ which relate to the June 2017 tenders and were settled shortly after Year end
• The Group’s forecasts show that Petra has sufficient liquidity to meet its working capital and capital development
requirements
• The Company maintains headroom against its financial covenants going forward based on its forecasts
• Refer Slide 18 ‘Risks to Outlook and Guidance’ for risk disclosure
7

Operating Costs
Group on-mine US$ cash costs increased 17% due to:
• Inclusion of Kimberley Ekapa Mining JV for the full Year (4% increase)
• Inflationary increases, including the impact of electricity and labour costs (7% increase)
• The effect of translating South African operations’ ZAR denominated costs at a stronger ZAR/USD exchange rate (6% increase)
40%
40%
FY 2017 On-mine cash cost breakdown (South Africa operations)
consumables and stores
Labour
Contractors,
Power
Other
9%13%
On-mine cash
costs
US$m
Diamond
royalties
US$m
Diamond
inventory and
stockpile
movement
US$m
Group
technical,
support and
marketing
costs
US$m
Adjusted
mining and
processing
costs
US$m
Depreciation
US$m
Share based
expense
US$m
Total mining
and processing
costs (IFRS)
US$m
FY 2017 287.3 4.7 (2.6) 21.9 311.3 78.7 0.1 390.1FY 2016 246.4 5.4 (14.1) 20.0 257.7 51.0 1.6 310.3
8
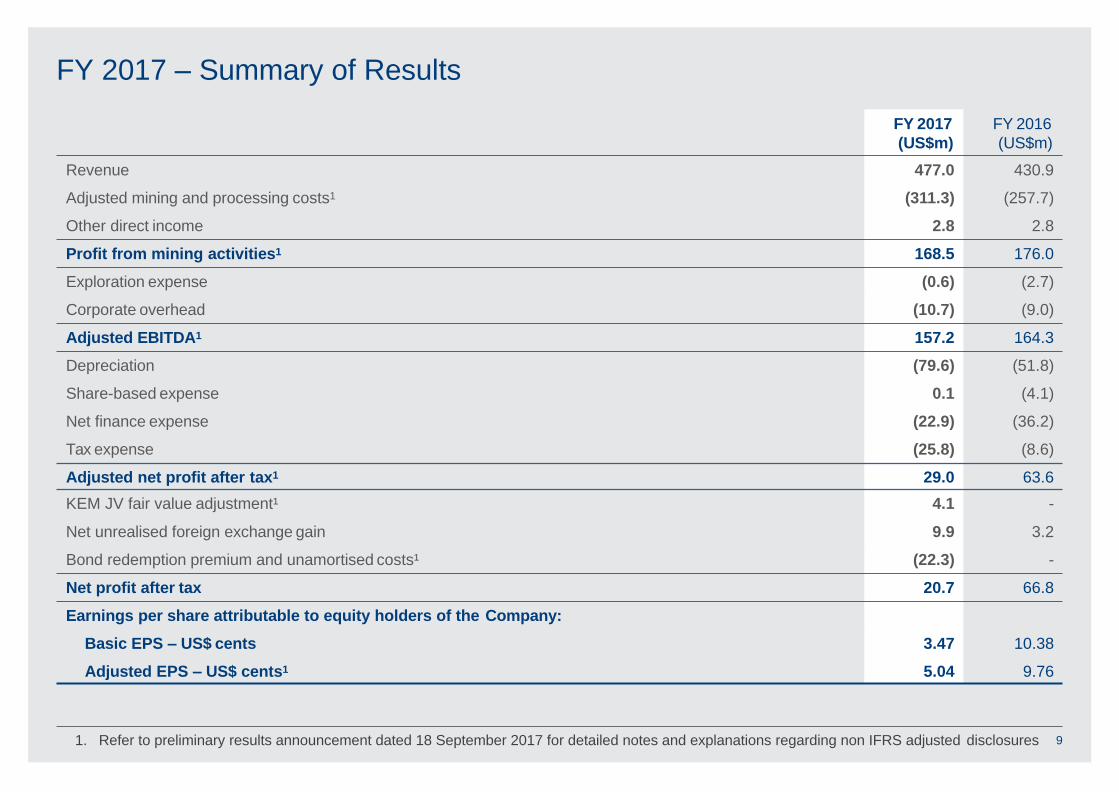
FY 2017 – Summary of Results
FY 2017
(US$m)
FY 2016
(US$m)
Revenue 477.0 430.9
Adjusted mining and processing costs1 (311.3) (257.7)
Other direct income 2.8 2.8
Profit from mining activities1 168.5 176.0
Exploration expense (0.6) (2.7)
Corporate overhead (10.7) (9.0)
Adjusted EBITDA1 157.2 164.3
Depreciation (79.6) (51.8)
Share-based expense 0.1 (4.1)
Net finance expense (22.9) (36.2)
Tax expense (25.8) (8.6)
Adjusted net profit after tax1 29.0 63.6
KEM JV fair value adjustment¹ 4.1 -
Net unrealised foreign exchange gain 9.9 3.2
Bond redemption premium and unamortised costs¹ (22.3) -
Net profit after tax 20.7 66.8
Earnings per share attributable to equity holders of the Company:
Basic EPS – US$ cents 3.47 10.38
Adjusted EPS – US$ cents1 5.04 9.76
1. Refer to preliminary results announcement dated 18 September 2017 for detailed notes and explanations regarding non IFRS adjusted disclosures 9
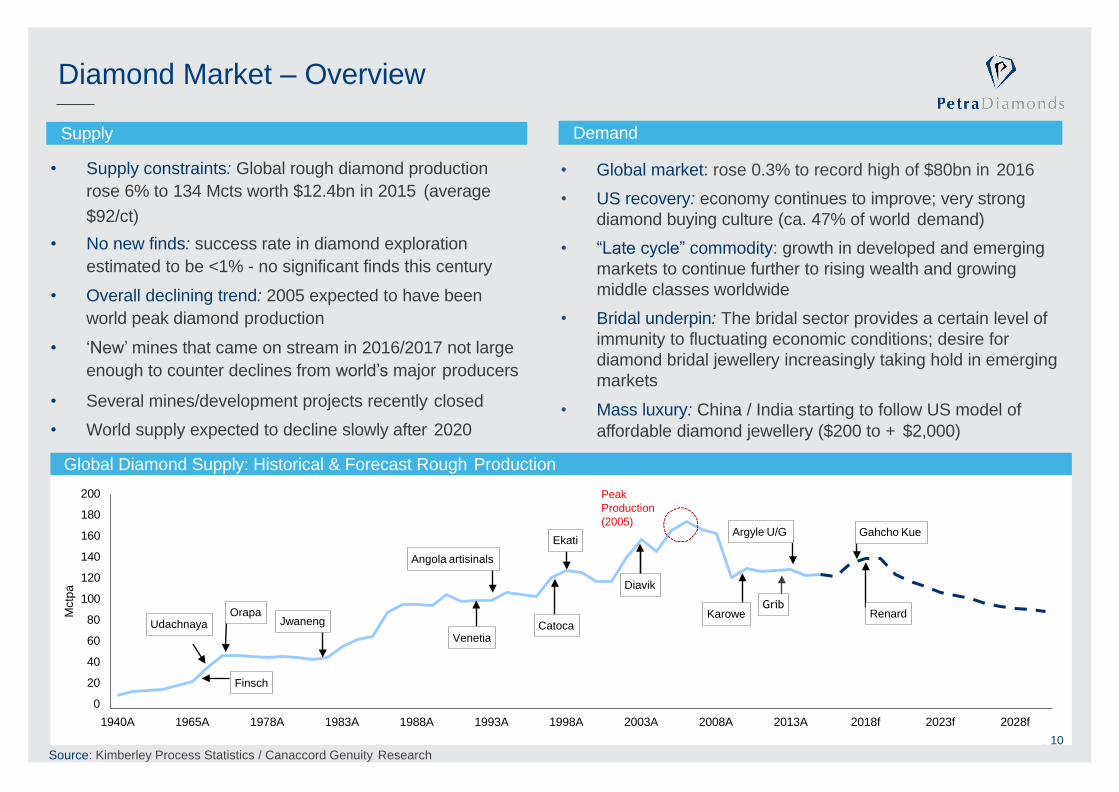
Demand
• Global market: rose 0.3% to record high of $80bn in 2016
• US recovery: economy continues to improve; very strong
diamond buying culture (ca. 47% of world demand)
• “Late cycle” commodity: growth in developed and emerging
markets to continue further to rising wealth and growing
middle classes worldwide
• Bridal underpin: The bridal sector provides a certain level of
immunity to fluctuating economic conditions; desire for
diamond bridal jewellery increasingly taking hold in emerging
markets
• Mass luxury: China / India starting to follow US model of
affordable diamond jewellery ($200 to + $2,000)
Diamond Market – Overview
10
Supply
Global Diamond Supply: Historical & Forecast Rough Production
• Supply constraints: Global rough diamond production
rose 6% to 134 Mcts worth $12.4bn in 2015 (average
$92/ct)
• No new finds: success rate in diamond exploration
estimated to be <1% - no significant finds this century
• Overall declining trend: 2005 expected to have been
world peak diamond production
• ‘New’ mines that came on stream in 2016/2017 not large
enough to counter declines from world’s major producers
• Several mines/development projects recently closed
• World supply expected to decline slowly after 2020
200
180
160
140
120
100
80
60
40
20
0
Mctp
a
Udachnaya
Finsch
OrapaJwaneng
Venetia
Angola artisinals
Catoca
Ekati
Diavik
Peak
Production
(2005)Argyle U/G
KaroweGrib
Gahcho Kue
Renard
1940A 1965A 1978A 1983A 1988A 1993A 1998A 2003A 2008A 2013A 2018f 2023f 2028f
10
Source: Kimberley Process Statistics / Canaccord Genuity Research
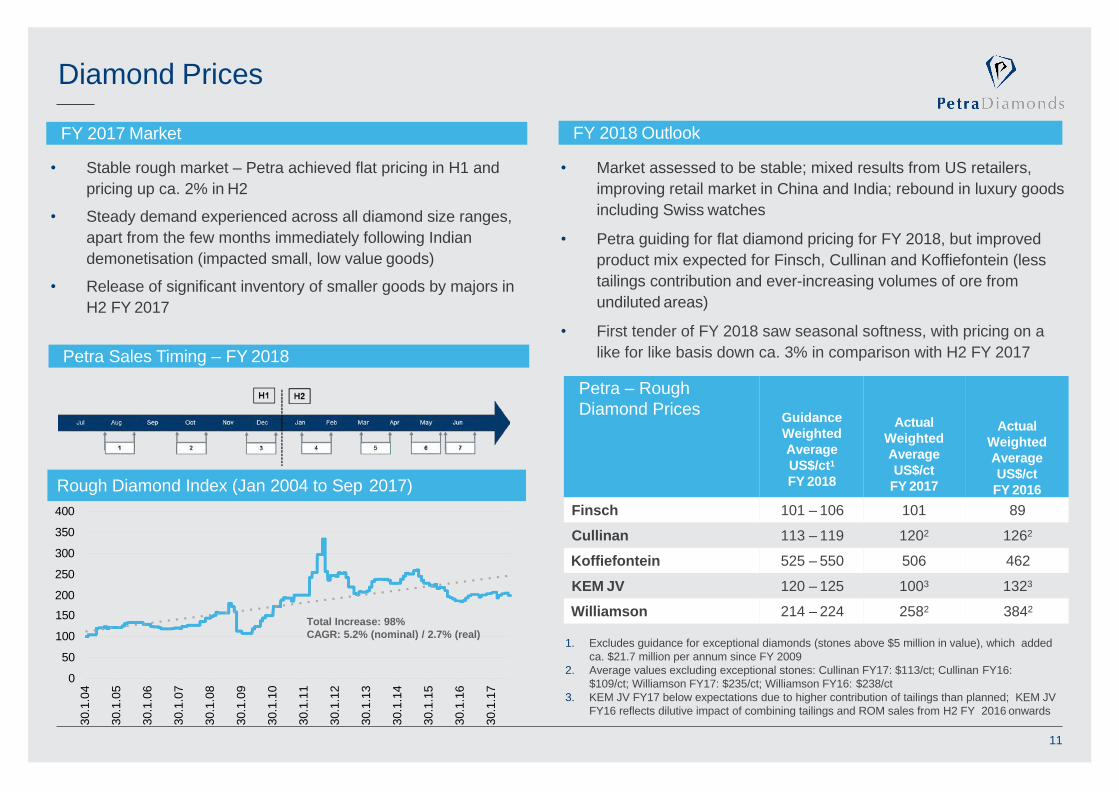
FY 2018 Outlook
• Market assessed to be stable; mixed results from US retailers,
improving retail market in China and India; rebound in luxury goods
including Swiss watches
• Petra guiding for flat diamond pricing for FY 2018, but improved
product mix expected for Finsch, Cullinan and Koffiefontein (less
tailings contribution and ever-increasing volumes of ore from
undiluted areas)
• First tender of FY 2018 saw seasonal softness, with pricing on a
like for like basis down ca. 3% in comparison with H2 FY 2017
Diamond Prices
FY 2017 Market
• Stable rough market – Petra achieved flat pricing in H1 and
pricing up ca. 2% in H2
• Steady demand experienced across all diamond size ranges,
apart from the few months immediately following Indian
demonetisation (impacted small, low value goods)
• Release of significant inventory of smaller goods by majors in
H2 FY 2017
Petra Sales Timing – FY 2018
Rough Diamond Index (Jan 2004 to Sep 2017)
Petra – Rough
Diamond PricesGuidance
Weighted
Average
US$/ct1
FY 2018
Actual
Weighted
Average
US$/ct
FY 2017
Actual
Weighted
Average
US$/ct
FY 2016
Finsch 101 – 106 101 89
Cullinan 113 – 119 1202 1262
Koffiefontein 525 – 550 506 462
KEM JV 120 – 125 1003 1323
Williamson 214 – 224 2582 3842
1. Excludes guidance for exceptional diamonds (stones above $5 million in value), which added
ca. $21.7 million per annum since FY 2009
2. Average values excluding exceptional stones: Cullinan FY17: $113/ct; Cullinan FY16:
$109/ct; Williamson FY17: $235/ct; Williamson FY16: $238/ct
3. KEM JV FY17 below expectations due to higher contribution of tailings than planned; KEM JV
FY16 reflects dilutive impact of combining tailings and ROM sales from H2 FY 2016 onwards
150
100
50
0
11
400
350
300
250
200
30.1
.04
30.1
.05
30.1
.06
30.1
.07
30.1
.08
30.1
.09
30.1
.10
30.1
.11
30.1
.12
30.1
.13
30.1
.14
30.1
.15
30.1
.16
30.1
.17
Total Increase: 98%
CAGR: 5.2% (nominal) / 2.7% (real)
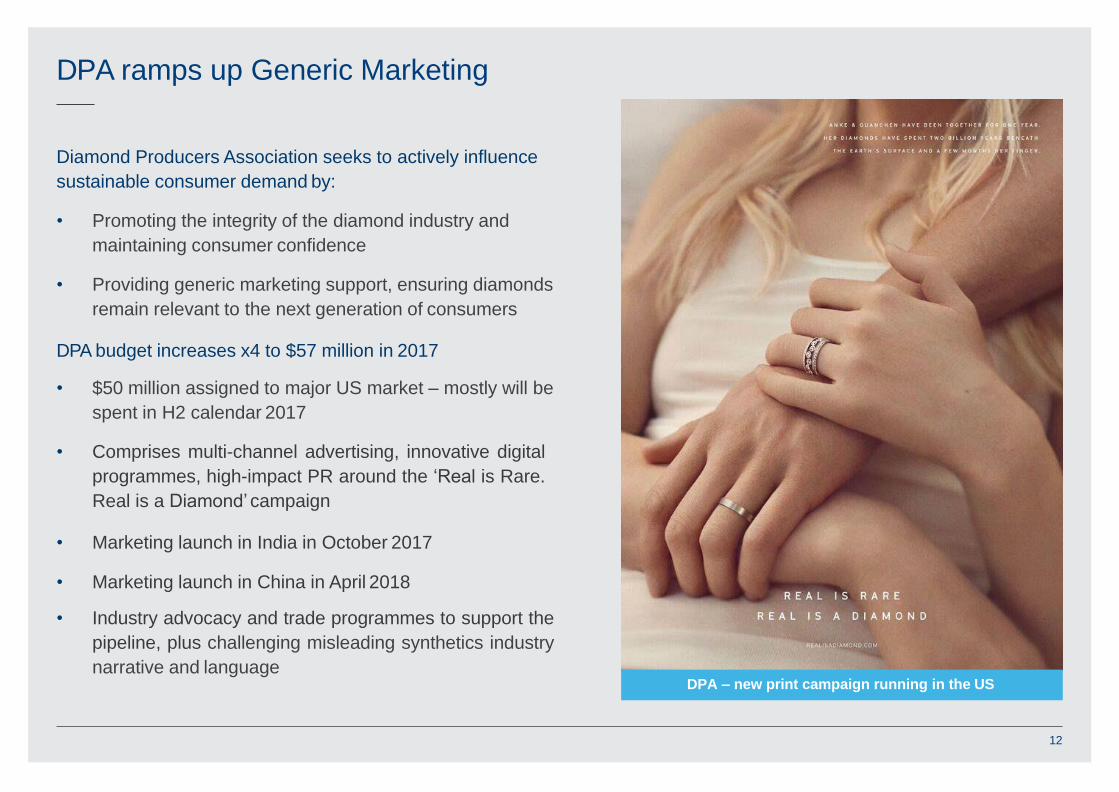
DPA ramps up Generic Marketing
12
DPA – new print campaign running in the US
Diamond Producers Association seeks to actively influence
sustainable consumer demand by:
• Promoting the integrity of the diamond industry and
maintaining consumer confidence
• Providing generic marketing support, ensuring diamonds
remain relevant to the next generation of consumers
DPA budget increases x4 to $57 million in 2017
• $50 million assigned to major US market – mostly will be
spent in H2 calendar 2017
• Comprises multi-channel advertising, innovative digital
programmes, high-impact PR around the ‘Real is Rare.
Real is a Diamond’campaign
• Marketing launch in India in October 2017
• Marketing launch in China in April 2018
• Industry advocacy and trade programmes to support the
pipeline, plus challenging misleading synthetics industry
narrative and language
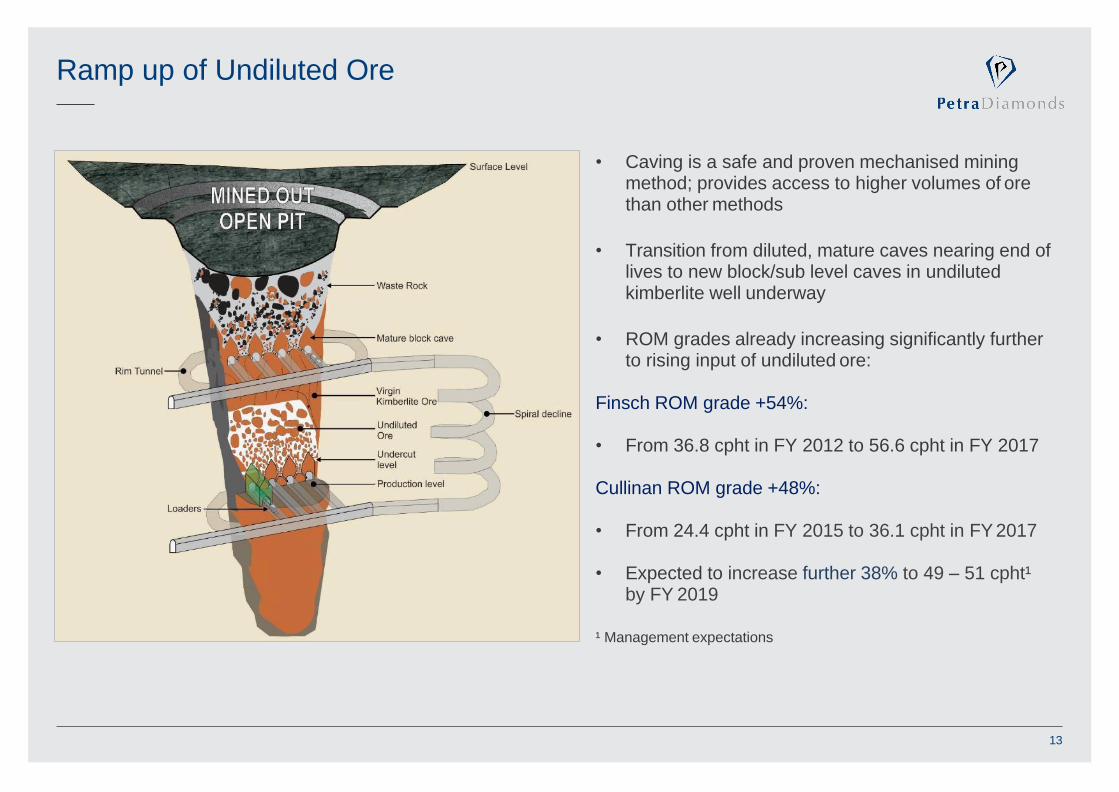
Ramp up of Undiluted Ore
• Caving is a safe and proven mechanised mining method; provides access to higher volumes of ore than other methods
• Transition from diluted, mature caves nearing end of lives to new block/sub level caves in undiluted kimberlite well underway
• ROM grades already increasing significantly further to rising input of undiluted ore:
Finsch ROM grade +54%:
• From 36.8 cpht in FY 2012 to 56.6 cpht in FY 2017
Cullinan ROM grade +48%:
• From 24.4 cpht in FY 2015 to 36.1 cpht in FY 2017
• Expected to increase further 38% to 49 – 51 cpht¹ by FY 2019
¹ Management expectations
13

Capex Operating cashflow Revenue Production (RHS) Tonnes treated (RHS)
1. All forecasts for Capex, revenue and production are management estimates; Capex is in nominal terms; diamond prices are calculated using a 4% pa real price increase from FY
2019 onwards
2. Capex, production, adj. operating cashflow and revenue relating to KEM JV stated at 75.9% Petra attributable terms; production forecasts include Williamson in normal operation
Transformation Underway
0
1
2
3
4
5
0
500
1000
20
09A
20
10A
20
11A
20
12A
20
13A
20
14A
20
15A
20
16A
20
17A
20
18F
20
19F
20
20F
• Replacement of poorer quality tonnes with better quality tonnes will
significantly grow production and margins due to less waste dilution, higher
grades and improved product mix
US
$m
Cara
tpro
duction
(mill
ion
cara
ts)
FY 2017
production of
4.0 Mcts;
revenue of
$477m
FY 2009
production
of 1.1 Mcts;
revenue of
$69m
Significant
decline in Capex
from FY 2018
Tonnes
treate
d(M
t)24
18
12
6
0
30
36
FY 2020
production
guidance of
5.0 - 5.0 Mcts;
revenue of ca. 6$0.75 bn
FY 2018
production
guidance of
4.8 - 5.0 Mcts
Peak Capex
14
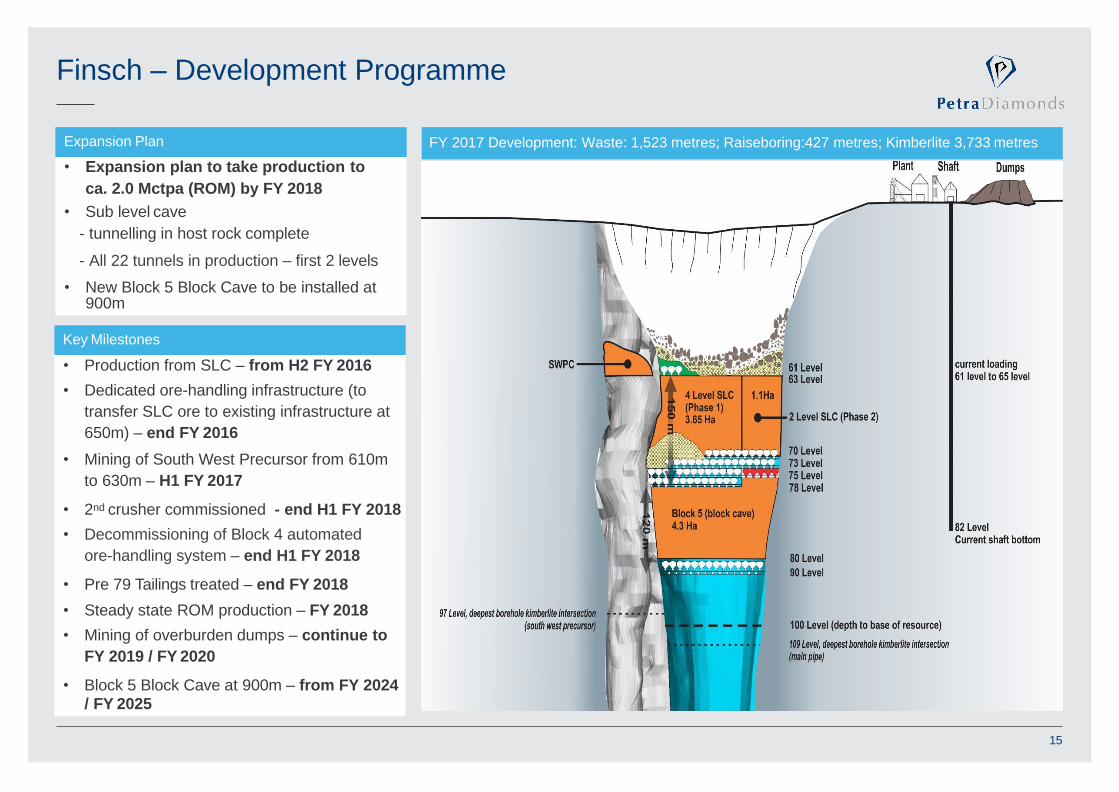
Finsch – Development Programme
• Expansion plan to take production to
ca. 2.0 Mctpa (ROM) by FY 2018
• Sub level cave
- tunnelling in host rock complete
- All 22 tunnels in production – first 2 levels
• New Block 5 Block Cave to be installed at 900m
FY 2017 Development: Waste: 1,523 metres; Raiseboring:427 metres; Kimberlite 3,733 metresExpansion Plan
• Production from SLC – from H2 FY 2016
• Dedicated ore-handling infrastructure (to
transfer SLC ore to existing infrastructure at
650m) – end FY 2016
• Mining of South West Precursor from 610m
to 630m – H1 FY 2017
• 2nd crusher commissioned - end H1 FY 2018
• Decommissioning of Block 4 automated
ore-handling system – end H1 FY 2018
• Pre 79 Tailings treated – end FY 2018
• Steady state ROM production – FY 2018
• Mining of overburden dumps – continue to
FY 2019 / FY 2020
• Block 5 Block Cave at 900m – from FY 2024/ FY 2025
Key Milestones
15
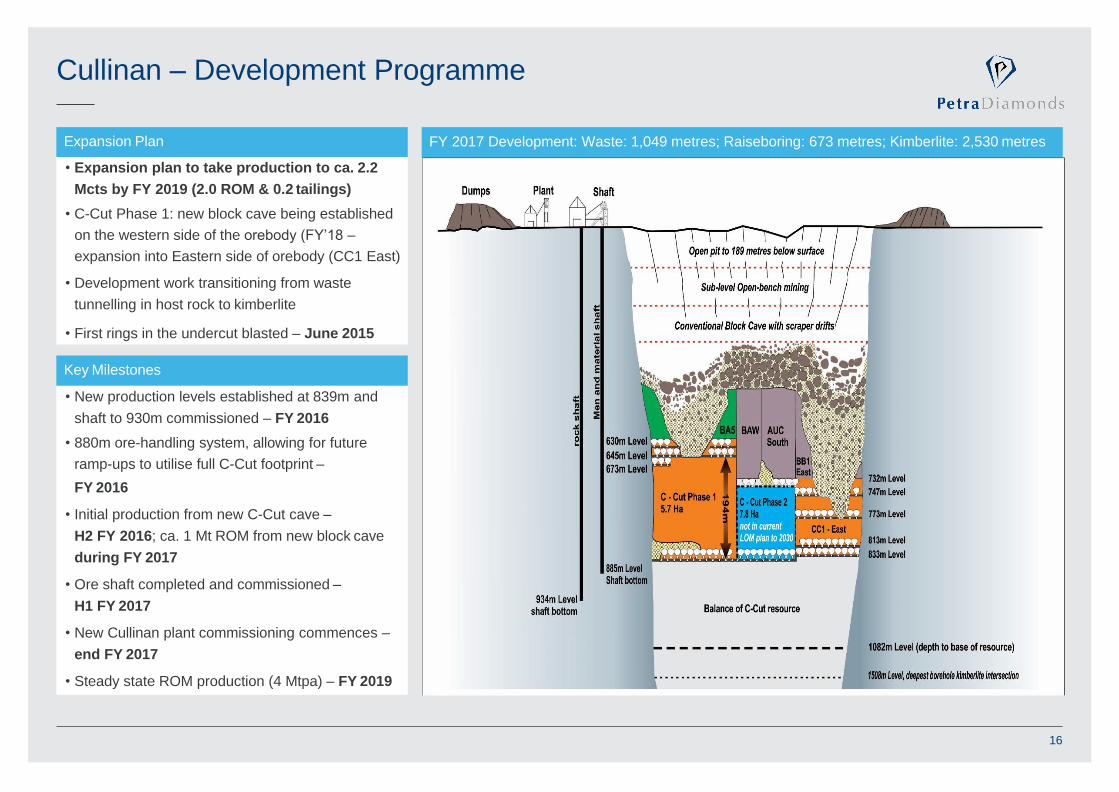
Cullinan – Development Programme
• Expansion plan to take production to ca. 2.2
Mcts by FY 2019 (2.0 ROM & 0.2 tailings)
• C-Cut Phase 1: new block cave being established
on the western side of the orebody (FY’18 –
expansion into Eastern side of orebody (CC1 East)
• Development work transitioning from waste
tunnelling in host rock to kimberlite
• First rings in the undercut blasted – June 2015
FY 2017 Development: Waste: 1,049 metres; Raiseboring: 673 metres; Kimberlite: 2,530 metresExpansion Plan
• New production levels established at 839m and
shaft to 930m commissioned – FY 2016
• 880m ore-handling system, allowing for future
ramp-ups to utilise full C-Cut footprint –
FY 2016
• Initial production from new C-Cut cave –
H2 FY 2016; ca. 1 Mt ROM from new block cave
during FY 2017
• Ore shaft completed and commissioned –
H1 FY 2017
• New Cullinan plant commissioning commences –
end FY 2017
• Steady state ROM production (4 Mtpa) – FY 2019
Key Milestones
16

New Cullinan Plant
Autogenous milling – inter-particle crushing
Sorthouse top floor – primary sort & re-sortBV X-Ray Machines
• Plant delay in FY 2017 due to
contractor labour disruptions /
commissioning issues
• Now fully operational except
for Large Diamond Recovery
section (all 4 modules to be
operational by end September)
• Processing rates already at
60% of nameplate capacity (6
Mtpa); plant set to deliver
Cullinan’s production and
treatment plan for FY 2018
• Grade performing in line with
expectations given current
commissioning phase; further
optimisation to improve
recovery efficiencies
17
New plant uses AG milling, HPGR, XRL
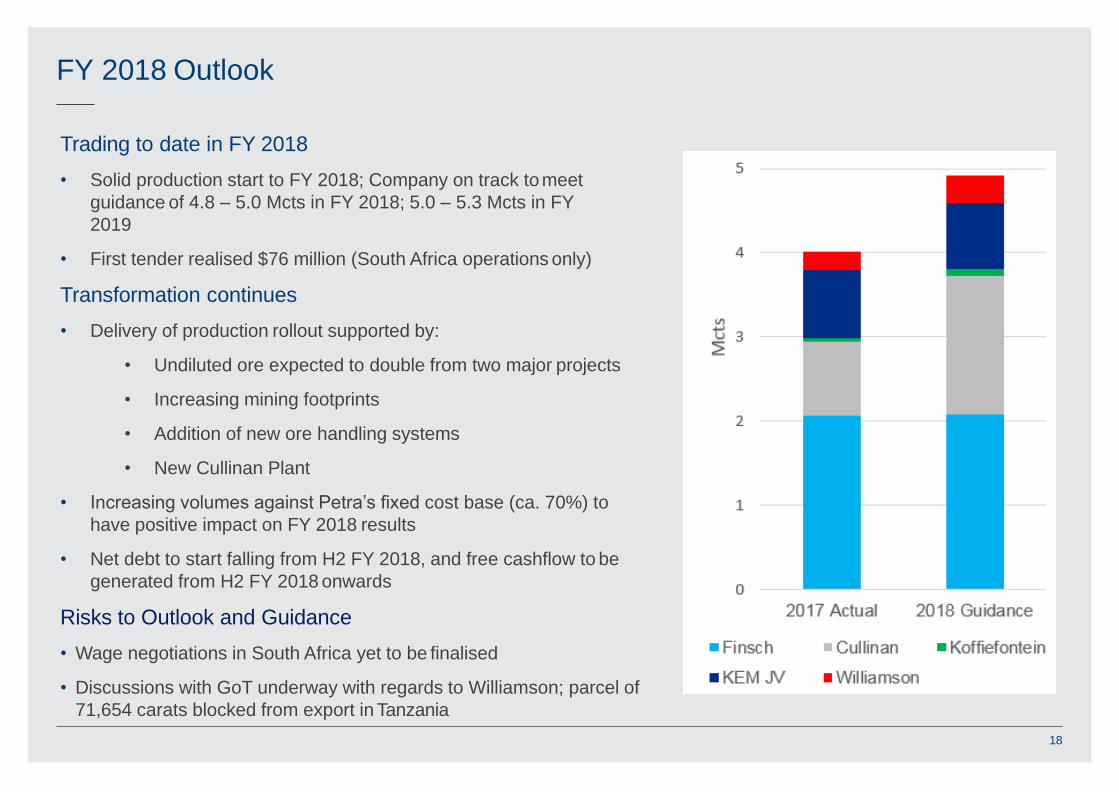
FY 2018 Outlook
Trading to date in FY 2018
• Solid production start to FY 2018; Company on track tomeet
guidance of 4.8 – 5.0 Mcts in FY 2018; 5.0 – 5.3 Mcts in FY
2019
• First tender realised $76 million (South Africa operations only)
Transformation continues
• Delivery of production rollout supported by:
• Undiluted ore expected to double from two major projects
• Increasing mining footprints
• Addition of new ore handling systems
• New Cullinan Plant
• Increasing volumes against Petra’s fixed cost base (ca. 70%) to
have positive impact on FY 2018 results
• Net debt to start falling from H2 FY 2018, and free cashflow to be
generated from H2 FY 2018 onwards
Risks to Outlook and Guidance
• Wage negotiations in South Africa yet to be finalised
• Discussions with GoT underway with regards to Williamson; parcel of
71,654 carats blocked from export in Tanzania
18
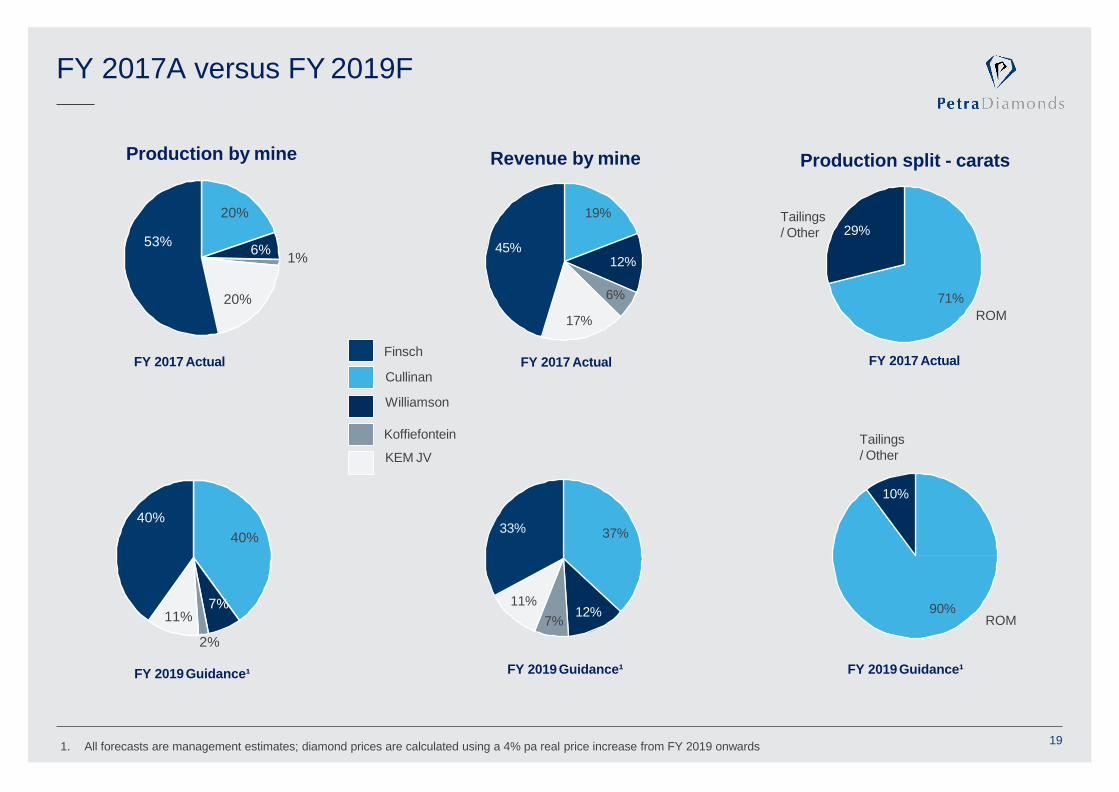
37%
12%7%
11%
33%40%
7%
2%
11%
40%
FY 2017A versus FY 2019F
19
20%
6%1%
20%
53%
19%
12%
6%
17%
45%
Koffiefontein
KEM JV
Finsch
Cullinan
Williamson
Production by mine Revenue by mine
71%
29%
Production split - carats
Tailings
/ Other
ROM
90%
10%
FY 2017 Actual FY 2017 Actual FY 2017 Actual
FY 2019Guidance¹ FY 2019 Guidance¹ FY 2019Guidance¹
Tailings
/ Other
ROM
1. All forecasts are management estimates; diamond prices are calculated using a 4% pa real price increase from FY 2019 onwards
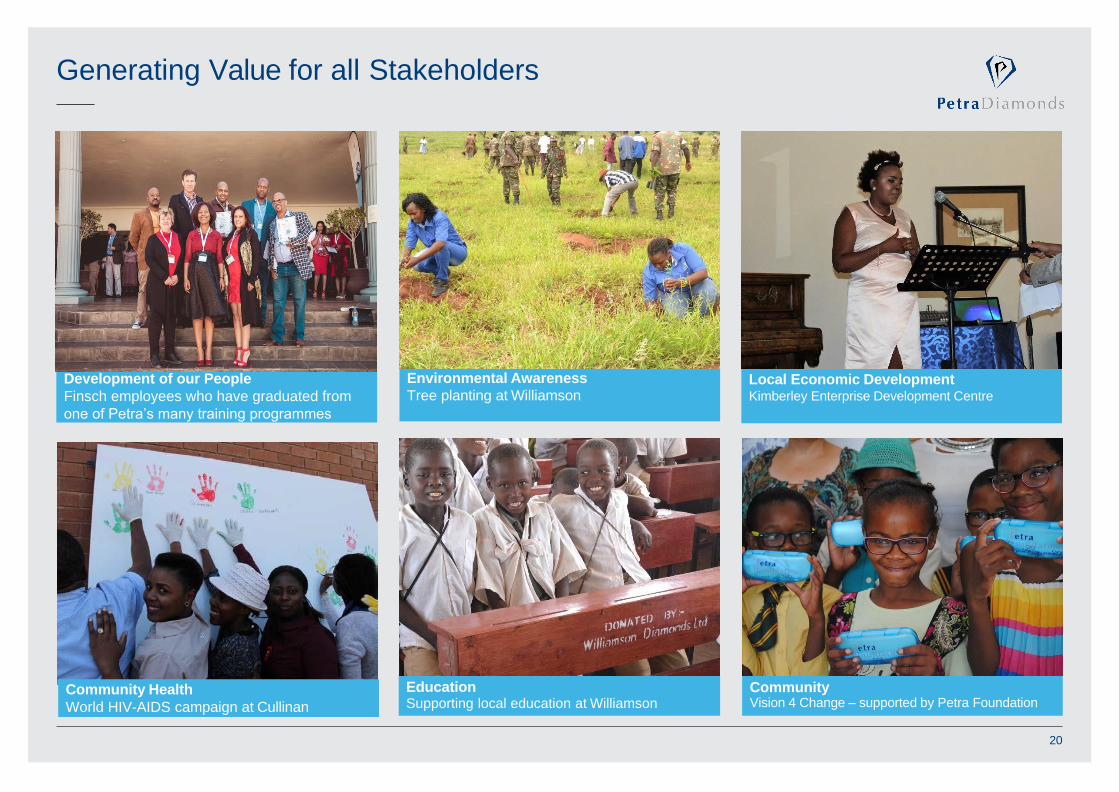
Generating Value for all Stakeholders
20
Local Economic DevelopmentKimberley Enterprise Development Centre
Environmental Awareness
Tree planting at Williamson
CommunityVision 4 Change – supported by Petra Foundation
EducationSupporting local education at Williamson
Development of our People
Finsch employees who have graduated from
one of Petra’s many training programmes
Community Health
World HIV-AIDS campaign at Cullinan

Appendix
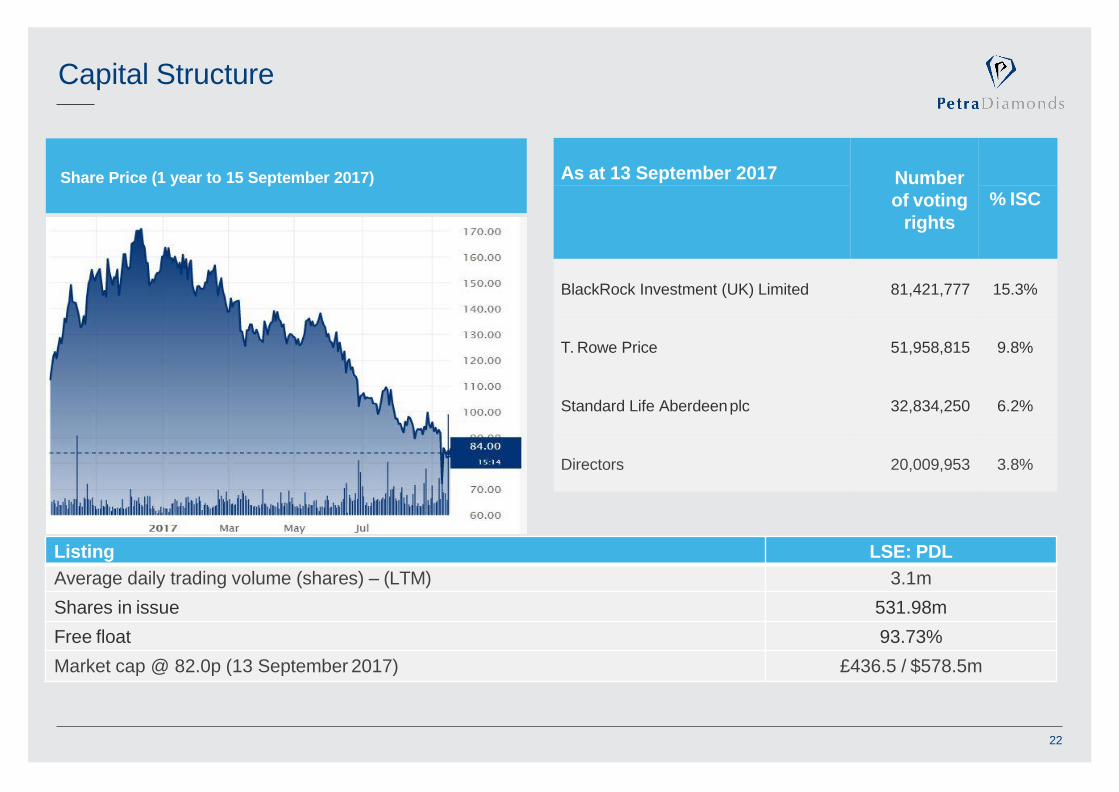
Capital Structure
Share Price (1 year to 15 September 2017) As at 13 September 2017 Number
of voting
rights
% ISC
BlackRock Investment (UK) Limited 81,421,777 15.3%
T. Rowe Price 51,958,815 9.8%
Standard Life Aberdeenplc 32,834,250 6.2%
Directors 20,009,953 3.8%
Listing LSE: PDL
Average daily trading volume (shares) – (LTM) 3.1m
Shares in issue 531.98m
Free float 93.73%
Market cap @ 82.0p (13 September 2017) £436.5 / $578.5m
22
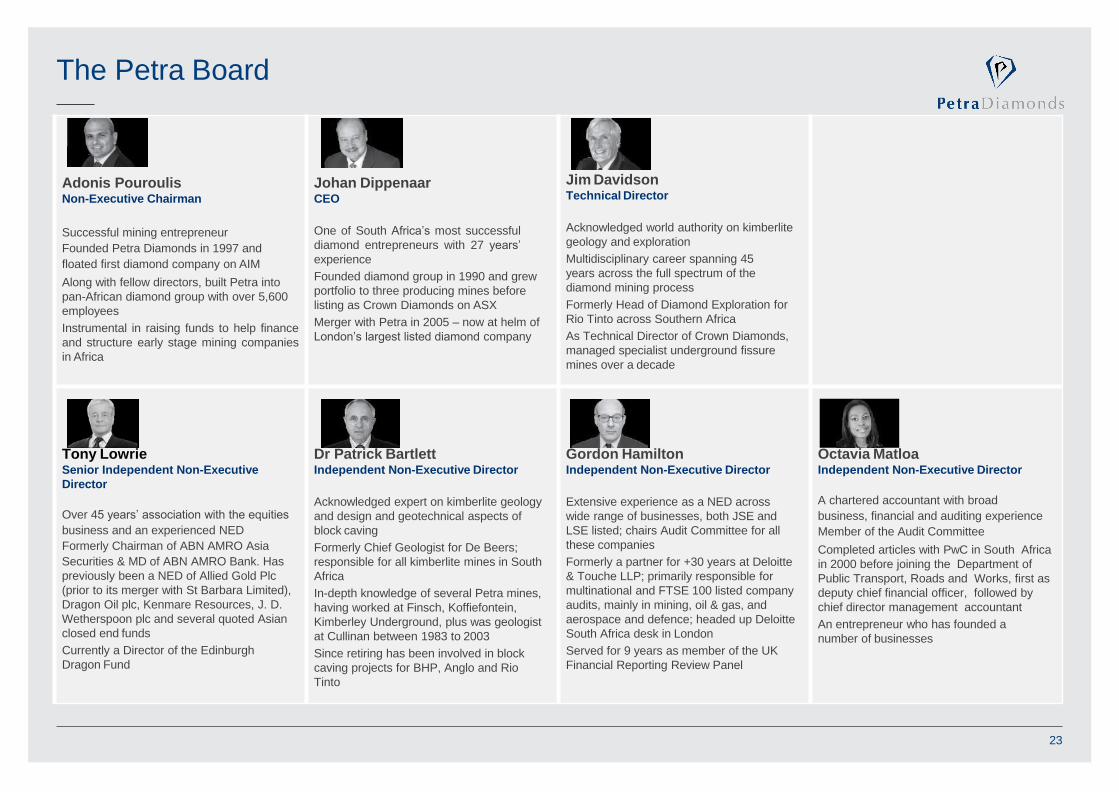
The Petra Board
Adonis PouroulisNon-Executive Chairman
Successful mining entrepreneur
Founded Petra Diamonds in 1997 and
floated first diamond company on AIM
Along with fellow directors, built Petra into
pan-African diamond group with over 5,600
employees
Instrumental in raising funds to help finance
and structure early stage mining companies
in Africa
Johan DippenaarCEO
One of South Africa’s most successful
diamond entrepreneurs with 27 years’
experience
Founded diamond group in 1990 and grew
portfolio to three producing mines before
listing as Crown Diamonds on ASX
Merger with Petra in 2005 – now at helm of
London’s largest listed diamond company
Jim DavidsonTechnical Director
Acknowledged world authority on kimberlite
geology and exploration
Multidisciplinary career spanning 45
years across the full spectrum of the
diamond mining process
Formerly Head of Diamond Exploration for
Rio Tinto across Southern Africa
As Technical Director of Crown Diamonds,
managed specialist underground fissure
mines over a decade
Tony LowrieSenior Independent Non-Executive
Director
Over 45 years’ association with the equities
business and an experienced NED
Formerly Chairman of ABN AMRO Asia
Securities & MD of ABN AMRO Bank. Has
previously been a NED of Allied Gold Plc
(prior to its merger with St Barbara Limited),
Dragon Oil plc, Kenmare Resources, J. D.
Wetherspoon plc and several quoted Asian
closed end funds
Currently a Director of the Edinburgh
Dragon Fund
Dr Patrick BartlettIndependent Non-Executive Director
Acknowledged expert on kimberlite geology
and design and geotechnical aspects of
block caving
Formerly Chief Geologist for De Beers;
responsible for all kimberlite mines in South
Africa
In-depth knowledge of several Petra mines,
having worked at Finsch, Koffiefontein,
Kimberley Underground, plus was geologist
at Cullinan between 1983 to 2003
Since retiring has been involved in block
caving projects for BHP, Anglo and Rio
Tinto
Gordon HamiltonIndependent Non-Executive Director
Extensive experience as a NED across
wide range of businesses, both JSE and
LSE listed; chairs Audit Committee for all
these companies
Formerly a partner for +30 years at Deloitte
& Touche LLP; primarily responsible for
multinational and FTSE 100 listed company
audits, mainly in mining, oil & gas, and
aerospace and defence; headed up Deloitte
South Africa desk in London
Served for 9 years as member of the UK
Financial Reporting Review Panel
Octavia MatloaIndependent Non-Executive Director
A chartered accountant with broad
business, financial and auditing experience
Member of the Audit Committee
Completed articles with PwC in South Africa
in 2000 before joining the Department of
Public Transport, Roads and Works, first as
deputy chief financial officer, followed by
chief director management accountant
An entrepreneur who has founded a
number of businesses
23
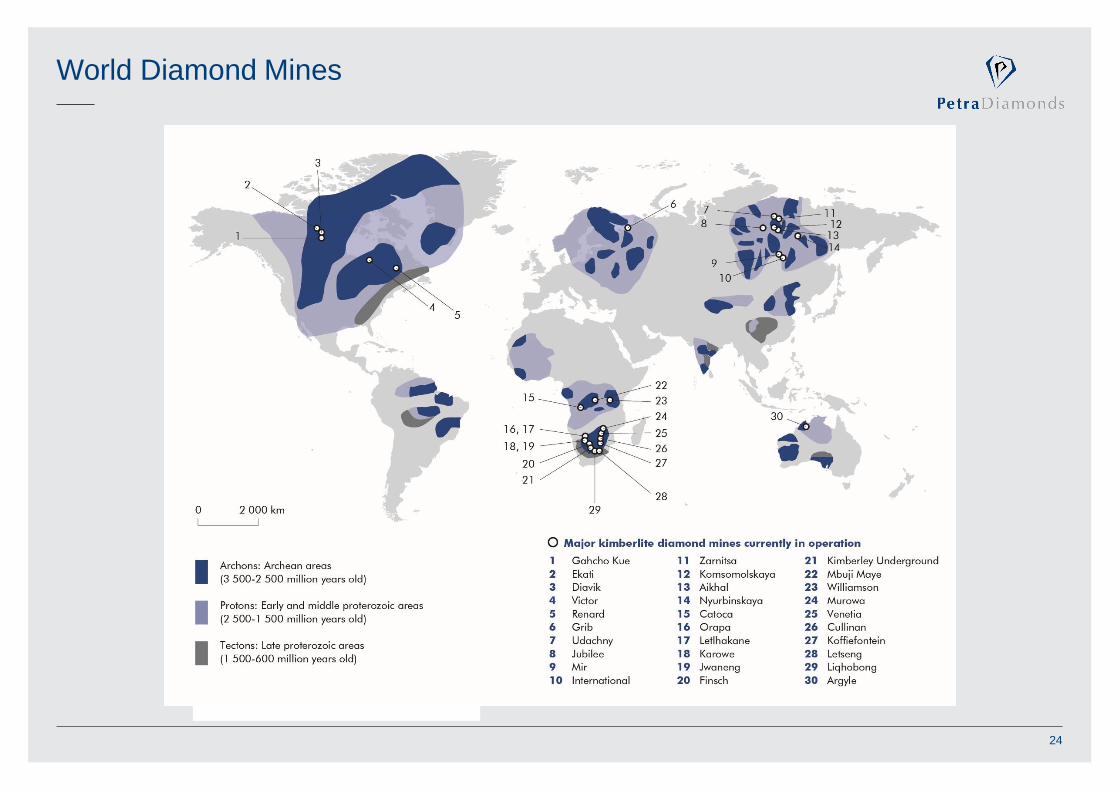
World Diamond Mines
24
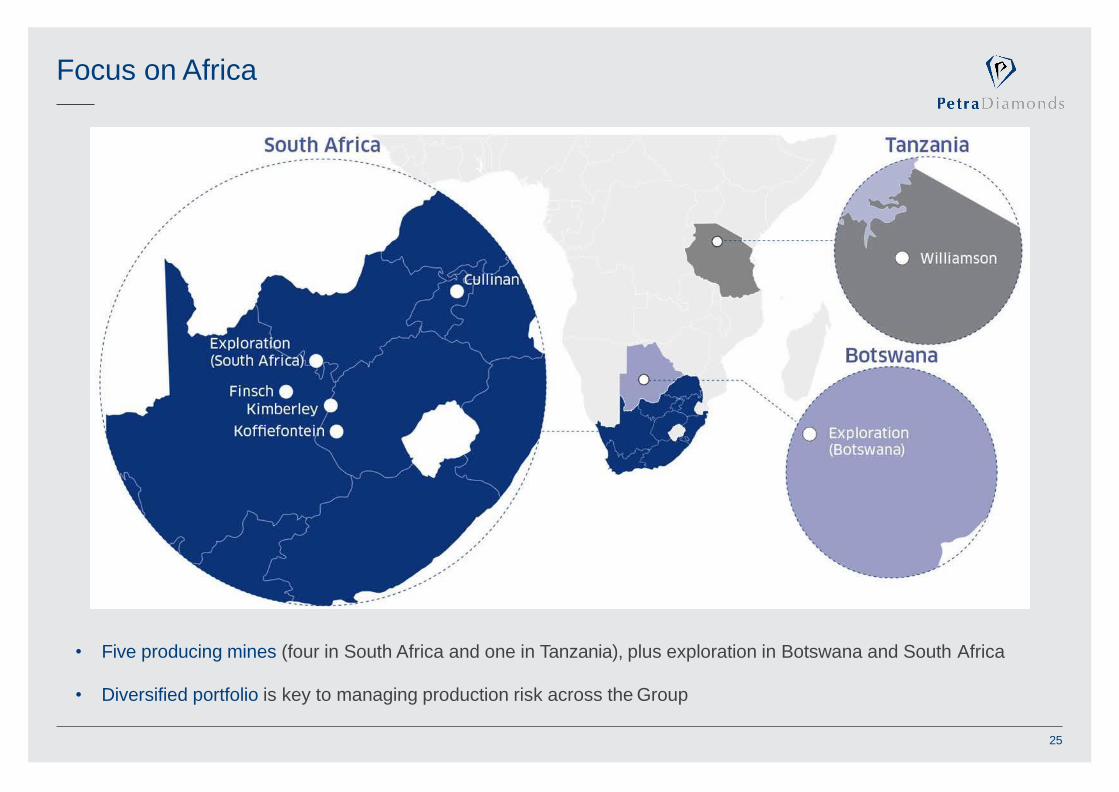
Focus on Africa
• Five producing mines (four in South Africa and one in Tanzania), plus exploration in Botswana and South Africa
• Diversified portfolio is key to managing production risk across the Group
25
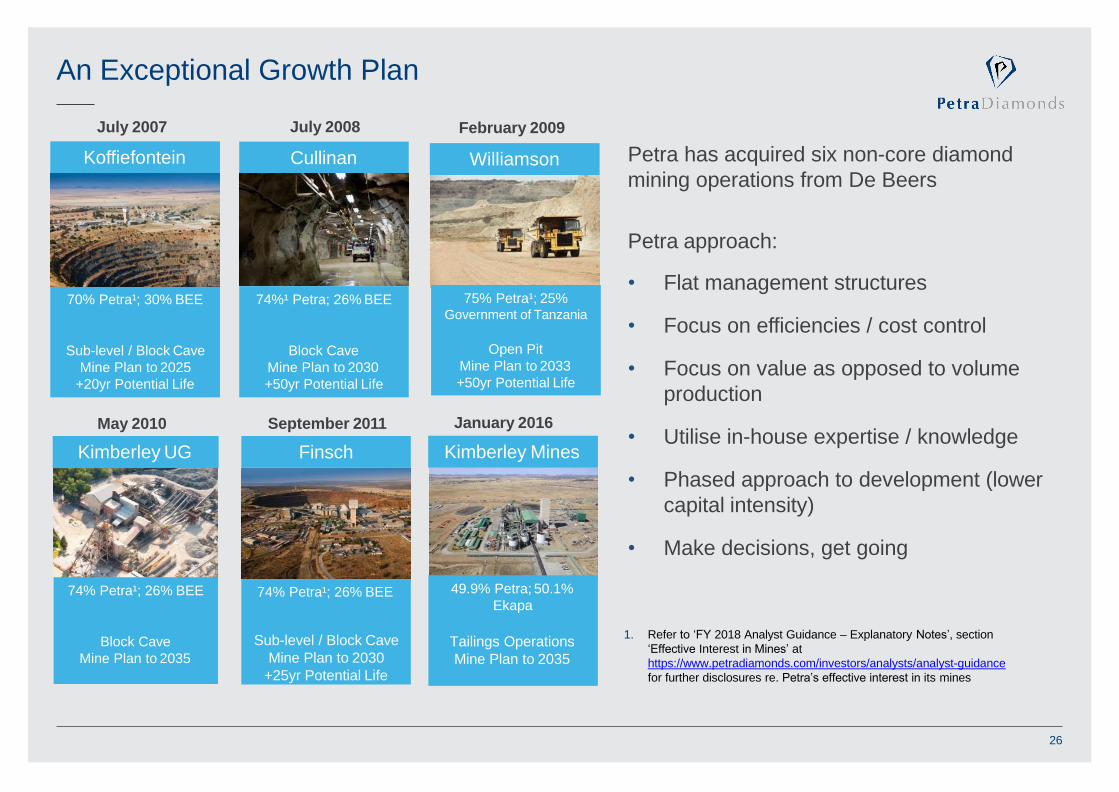
An Exceptional Growth Plan
Petra has acquired six non-core diamond
mining operations from De Beers
Petra approach:
• Flat management structures
• Focus on efficiencies / cost control
• Focus on value as opposed to volume
production
• Utilise in-house expertise / knowledge
• Phased approach to development (lower
capital intensity)
• Make decisions, get going
Cullinan
July 2008
74%¹ Petra; 26% BEE
Block Cave
Mine Plan to 2030
+50yr Potential Life
Williamson
February 2009
Kimberley UG
May 2010
Finsch
74% Petra¹; 26% BEE
Sub-level / Block Cave
Mine Plan to 2030
+25yr Potential Life
Koffiefontein
July 2007
70% Petra¹; 30% BEE
Sub-level / Block Cave
Mine Plan to 2025
+20yr Potential Life
September 2011
74% Petra¹; 26% BEE
Block Cave
Mine Plan to 2035
75% Petra¹; 25%Government of Tanzania
Open Pit
Mine Plan to 2033
+50yr Potential Life
1. Refer to ‘FY 2018 Analyst Guidance – Explanatory Notes’, section
‘Effective Interest in Mines’ at
https://www.petradiamonds.com/investors/analysts/analyst-guidance
for further disclosures re. Petra’s effective interest in its mines
January 2016
Kimberley Mines
49.9% Petra; 50.1%
Ekapa
Tailings Operations
Mine Plan to 2035
26
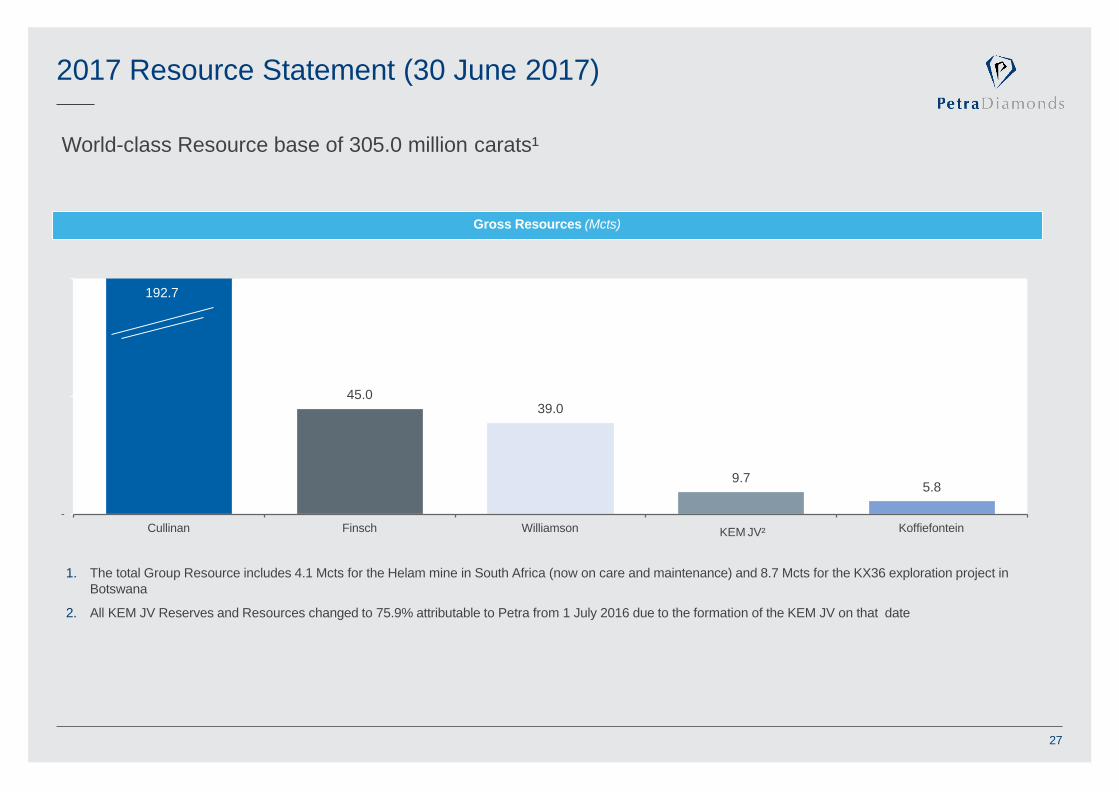
2017 Resource Statement (30 June 2017)
World-class Resource base of 305.0 million carats¹
Gross Resources (Mcts)
45.039.0
9.75.8
-
Cullinan Finsch Williamson Kimberley Operations KoffiefonteinKEM JV²
1. The total Group Resource includes 4.1 Mcts for the Helam mine in South Africa (now on care and maintenance) and 8.7 Mcts for the KX36 exploration project in
Botswana
2. All KEM JV Reserves and Resources changed to 75.9% attributable to Petra from 1 July 2016 due to the formation of the KEM JV on that date
192.7
27
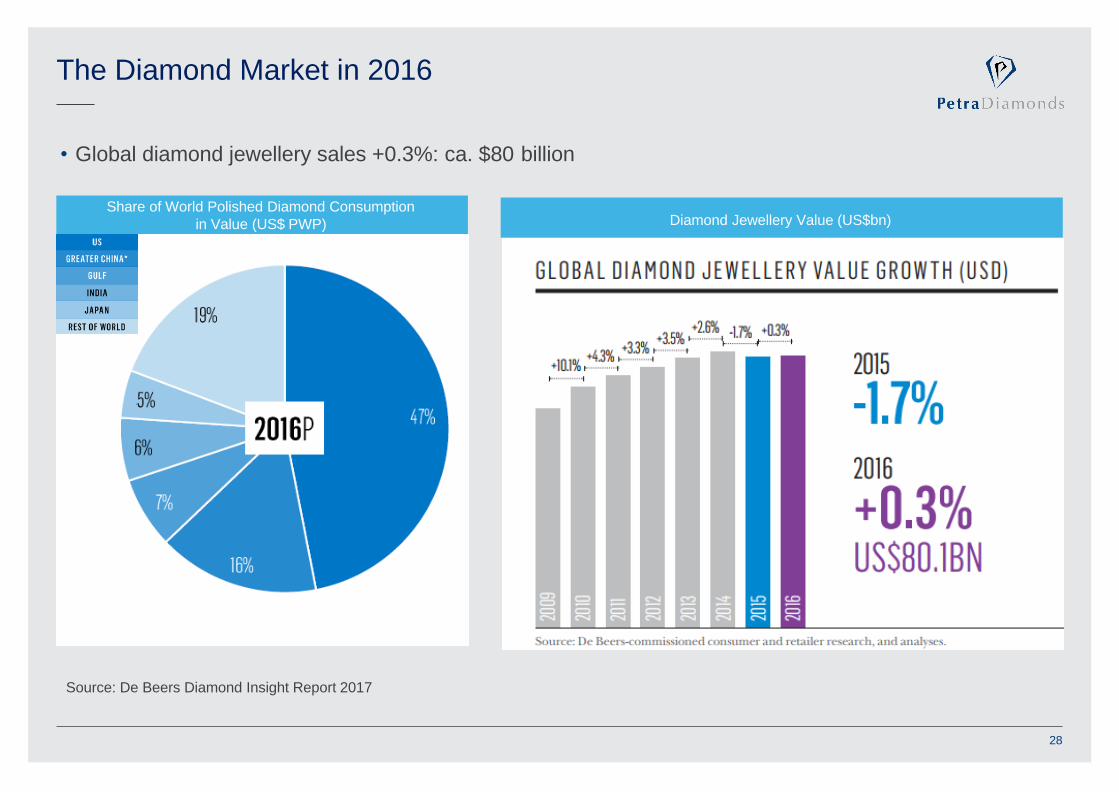
The Diamond Market in 2016
• Global diamond jewellery sales +0.3%: ca. $80 billion
Share of World Polished Diamond Consumption
in Value (US$ PWP)
Source: De Beers Diamond Insight Report 2017
Diamond Jewellery Value (US$bn)
28
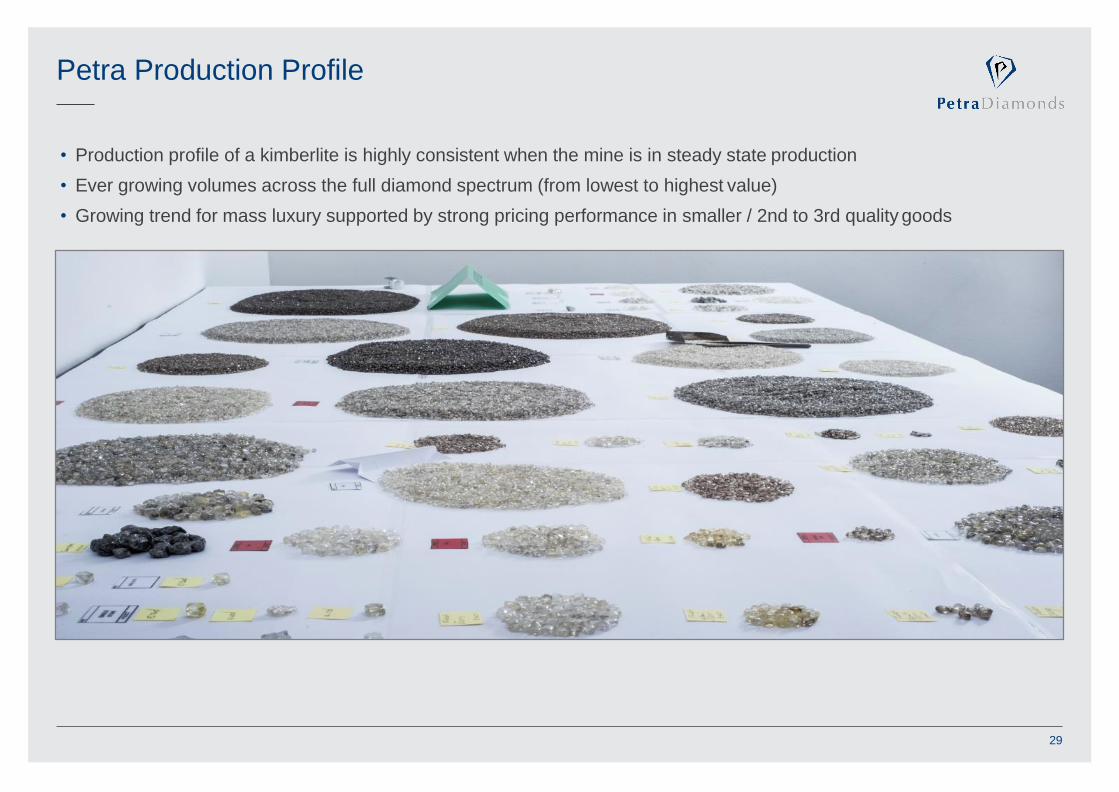
Petra Production Profile
• Production profile of a kimberlite is highly consistent when the mine is in steady state production
• Ever growing volumes across the full diamond spectrum (from lowest to highest value)
• Growing trend for mass luxury supported by strong pricing performance in smaller / 2nd to 3rd quality goods
29
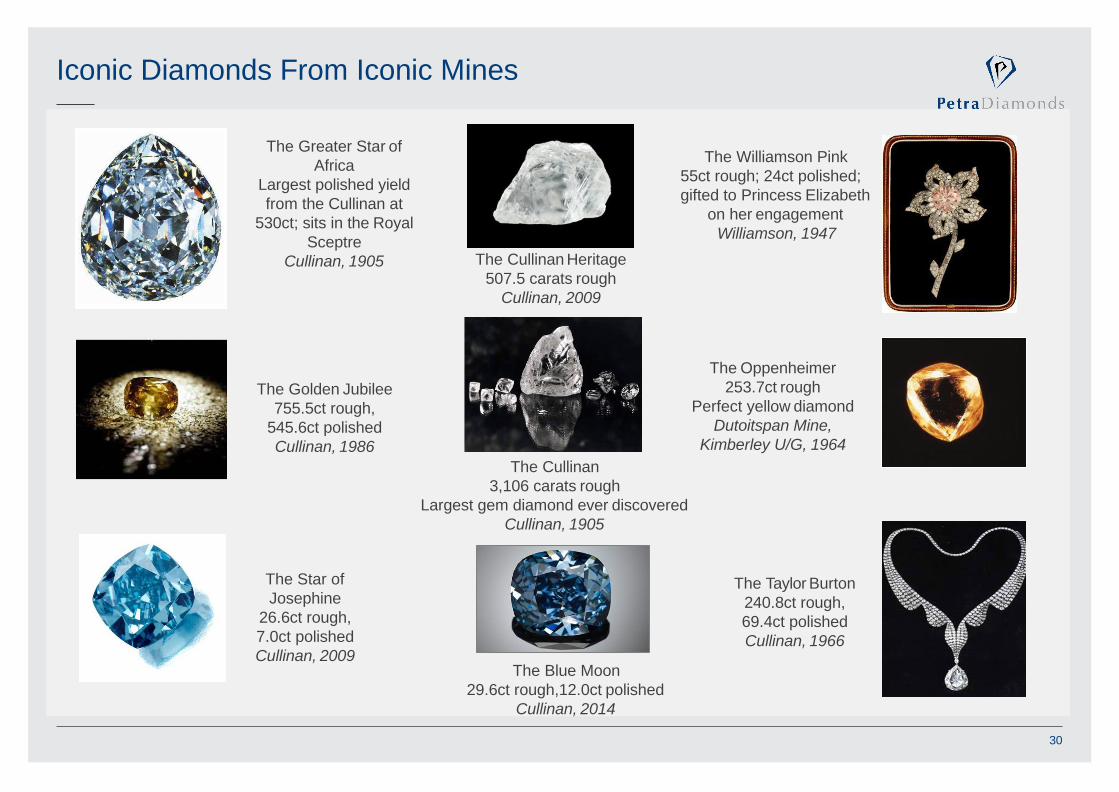
Iconic Diamonds From Iconic Mines
The Star of
Josephine
26.6ct rough,
7.0ct polished
Cullinan, 2009
The Golden Jubilee
755.5ct rough,
545.6ct polished
Cullinan, 1986
The Taylor Burton
240.8ct rough,
69.4ct polished
Cullinan, 1966
The Cullinan Heritage
507.5 carats rough
Cullinan, 2009
The Oppenheimer
253.7ct rough
Perfect yellow diamond
Dutoitspan Mine,
Kimberley U/G, 1964
The Cullinan
3,106 carats rough
Largest gem diamond ever discovered
Cullinan, 1905
The Greater Star of
Africa
Largest polished yield
from the Cullinan at
530ct; sits in the Royal
Sceptre
Cullinan, 1905
The Blue Moon
29.6ct rough,12.0ct polished
Cullinan, 2014
The Williamson Pink
55ct rough; 24ct polished;
gifted to Princess Elizabeth
on her engagement
Williamson, 1947
30

The Most Highly Concentrated Form of Wealth
The 14.62ct
Oppenheimer
Blue diamond
Sold for $57.7m
$3.9m per carat,
18 May 2016
The 12.03ct Blue
Moon of
Josephine
diamond
Sold for $48.4m
$4.0m per carat,
12 November 2015
The 24.18ct
Cullinan Dream
diamond
Sold for $25.4m
$1.1m per carat,
9 June 2016
The 59.60ct
Pink Star
diamond
Sold for $71.2m
$1.2m per carat,
4 April 2017
Examples of recent polished coloured diamond sales at auction
31
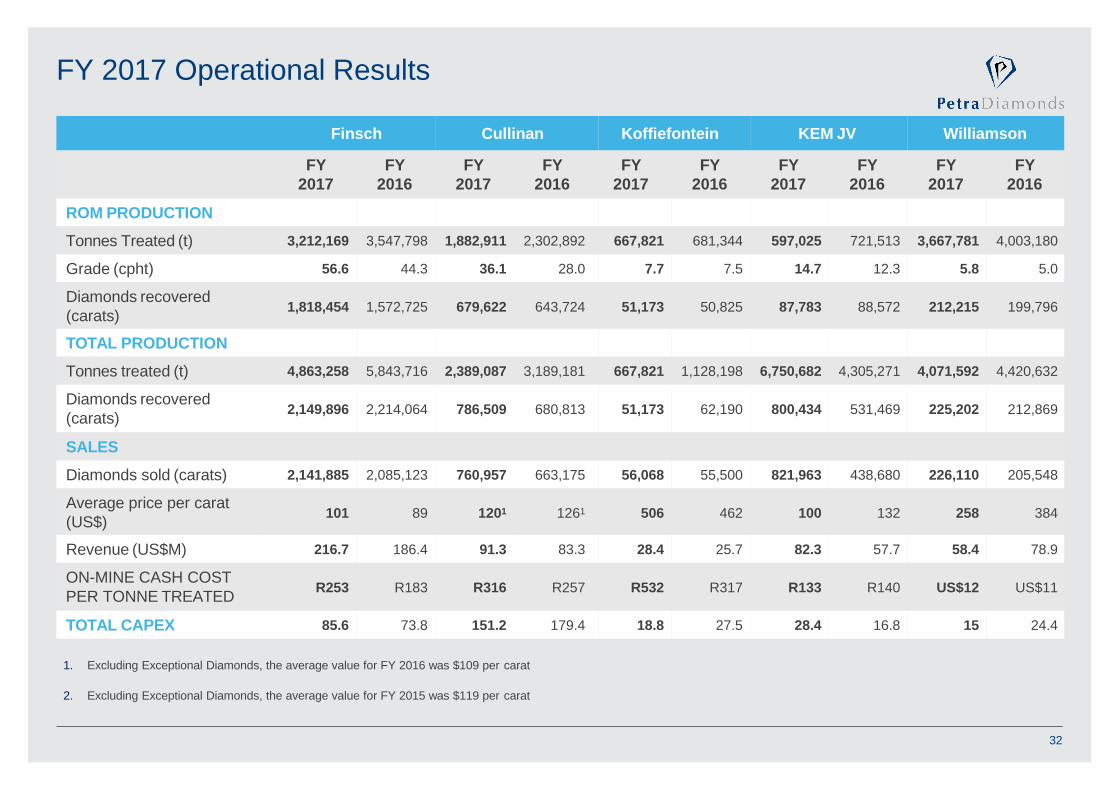
FY 2017 Operational Results
Finsch Cullinan Koffiefontein KEM JV Williamson
FY
2017
FY
2016
FY
2017
FY
2016
FY
2017
FY
2016
FY
2017
FY
2016
FY
2017
FY
2016
ROM PRODUCTION
Tonnes Treated (t) 3,212,169 3,547,798 1,882,911 2,302,892 667,821 681,344 597,025 721,513 3,667,781 4,003,180
Grade (cpht) 56.6 44.3 36.1 28.0 7.7 7.5 14.7 12.3 5.8 5.0
Diamonds recovered
(carats)1,818,454 1,572,725 679,622 643,724 51,173 50,825 87,783 88,572 212,215 199,796
TOTAL PRODUCTION
Tonnes treated (t) 4,863,258 5,843,716 2,389,087 3,189,181 667,821 1,128,198 6,750,682 4,305,271 4,071,592 4,420,632
Diamonds recovered
(carats)2,149,896 2,214,064 786,509 680,813 51,173 62,190 800,434 531,469 225,202 212,869
SALES
Diamonds sold (carats) 2,141,885 2,085,123 760,957 663,175 56,068 55,500 821,963 438,680 226,110 205,548
Average price per carat
(US$)101 89 1201 1261 506 462 100 132 258 384
Revenue (US$M) 216.7 186.4 91.3 83.3 28.4 25.7 82.3 57.7 58.4 78.9
ON-MINE CASH COST
PER TONNE TREATEDR253 R183 R316 R257 R532 R317 R133 R140 US$12 US$11
TOTAL CAPEX 85.6 73.8 151.2 179.4 18.8 27.5 28.4 16.8 15 24.4
1. Excluding Exceptional Diamonds, the average value for FY 2016 was $109 per carat
2. Excluding Exceptional Diamonds, the average value for FY 2015 was $119 per carat
32

Finsch Production Profile
• ROM production to rise from 3.2 Mt in FY 2017 to ca. 3.5 Mt in FY 2018
• Tailings production to cease to reduce from 1.7 Mt in FY 2017 to ca. 0.35 Mt in FY 2018 and 0 Mtfrom FY 2019 onwards
0
15
30
45
60
75
0.0
1.5
3.0
4.5
6.0
7.5
cp
ht
Millio
nto
nn
es
Tonnes treated and grades
2013 2014 2015 2016 2017 2018 2019 2020
ROM tonnes Tailings tonnes
ROM grade (RHS) Tailings grade (RHS)
50
100
150
0.0
1.5
3.0
$/c
t
Millio
ncara
ts
Carat production and average diamond values
2013 2014 2015 2016 2017 2018 2019 2020
Tailings carats Average price per carat
ROM carats
1. Forecasts for average value per carat calculated using FY 2017 guided prices, and 4%
annual real price increase from FY 2019 onwards
33
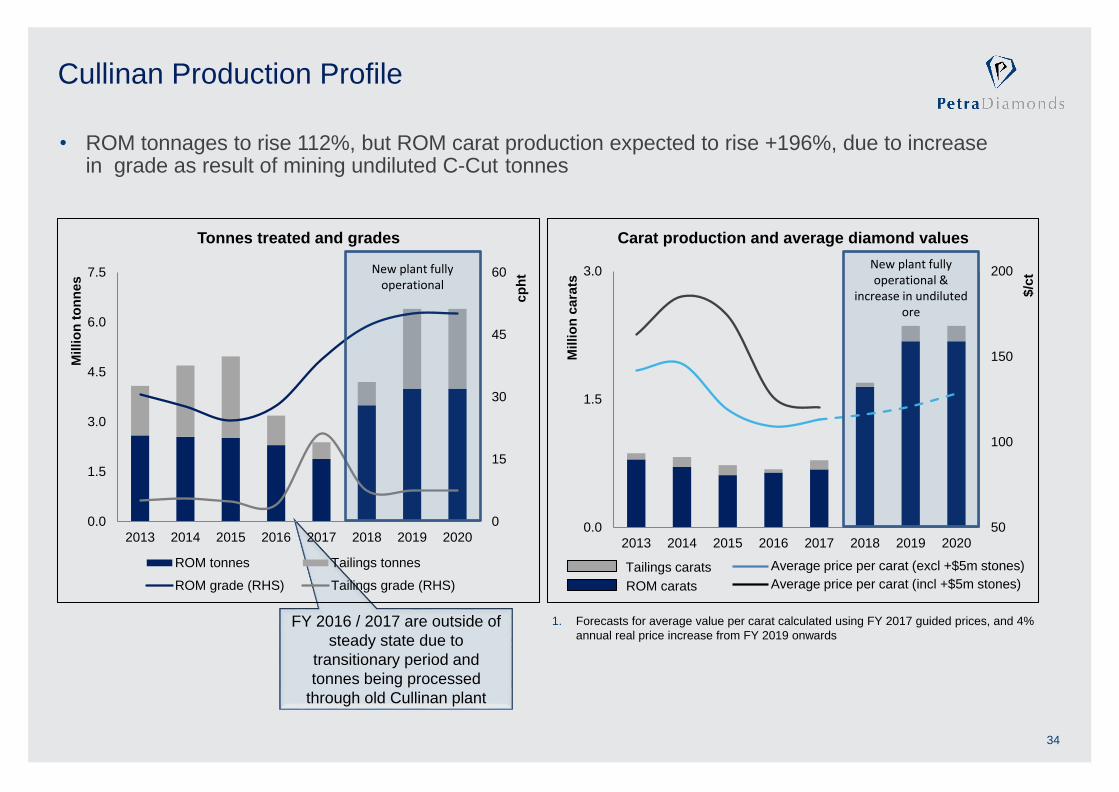
FY 2016 / 2017 are outside of
steady state due to
transitionary period and
tonnes being processed
through old Cullinan plant
Cullinan Production Profile
34
0
15
30
45
60
0.0
1.5
3.0
4.5
6.0
7.5
2013 2014 2015 2016 2017 2018 2019 2020
cp
ht
Millio
n t
on
ne
s
Tonnes treated and grades
ROM tonnes Tailings tonnes
ROM grade (RHS) Tailings grade (RHS)
50
100
150
200
0.0
1.5
3.0
2013 2014 2015 2016 2017 2018 2019 2020
$/c
t
Millio
n c
ara
ts
Carat production and average diamond values
Tailings carats
ROM carats
Average price per carat (excl +$5m stones)
Average price per carat (incl +$5m stones)
1. Forecasts for average value per carat calculated using FY 2017 guided prices, and 4%
annual real price increase from FY 2019 onwards
New plant fully operational
New plant fully operational &
increase in undiluted ore
• ROM tonnages to rise 112%, but ROM carat production expected to rise +196%, due to increase in grade as result of mining undiluted C-Cut tonnes
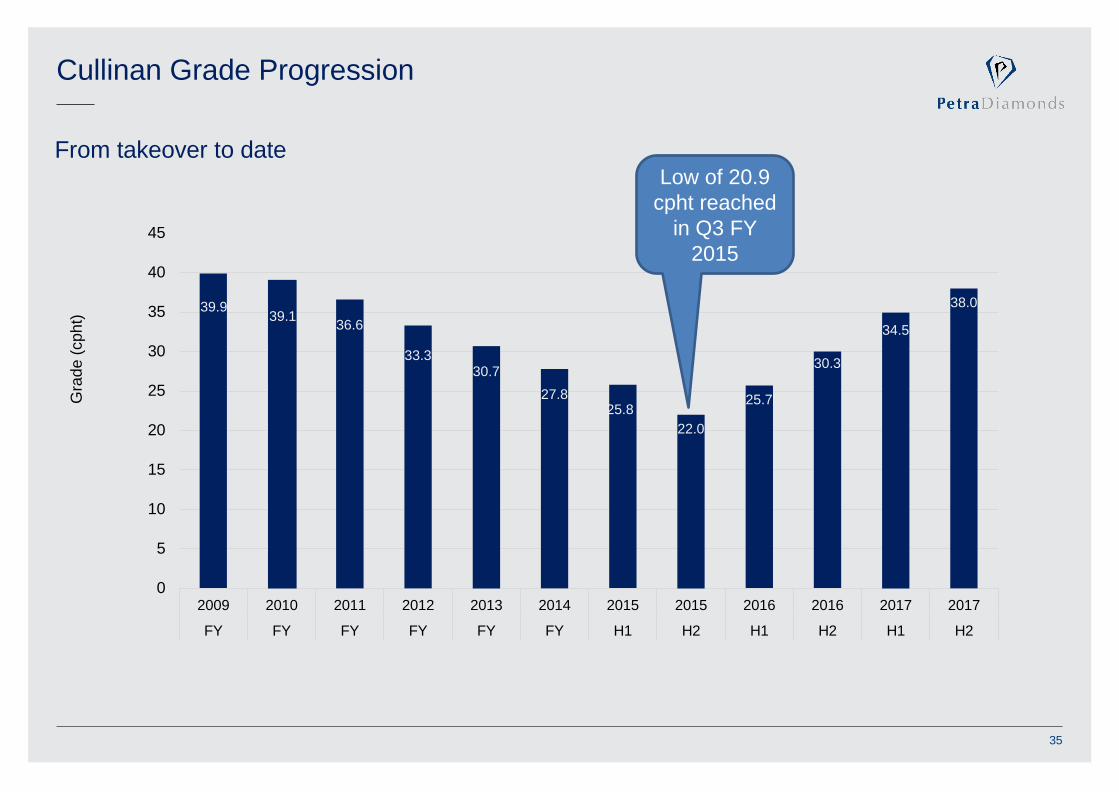
Cullinan Grade Progression
39.939.1
36.6
33.330.7
27.825.8
22.0
25.7
30.3
34.5
38.0
0
5
10
15
20
25
30
35
40
45
2009
FY
2010
FY
2011
FY
2012
FY
2013
FY
2014
FY
2015
H1
2015
H2
2016
H1
2016
H2
2017
H1
2017
H2
Gra
de
(cpht)
From takeover to date
35
Low of 20.9
cpht reached
in Q3 FY
2015
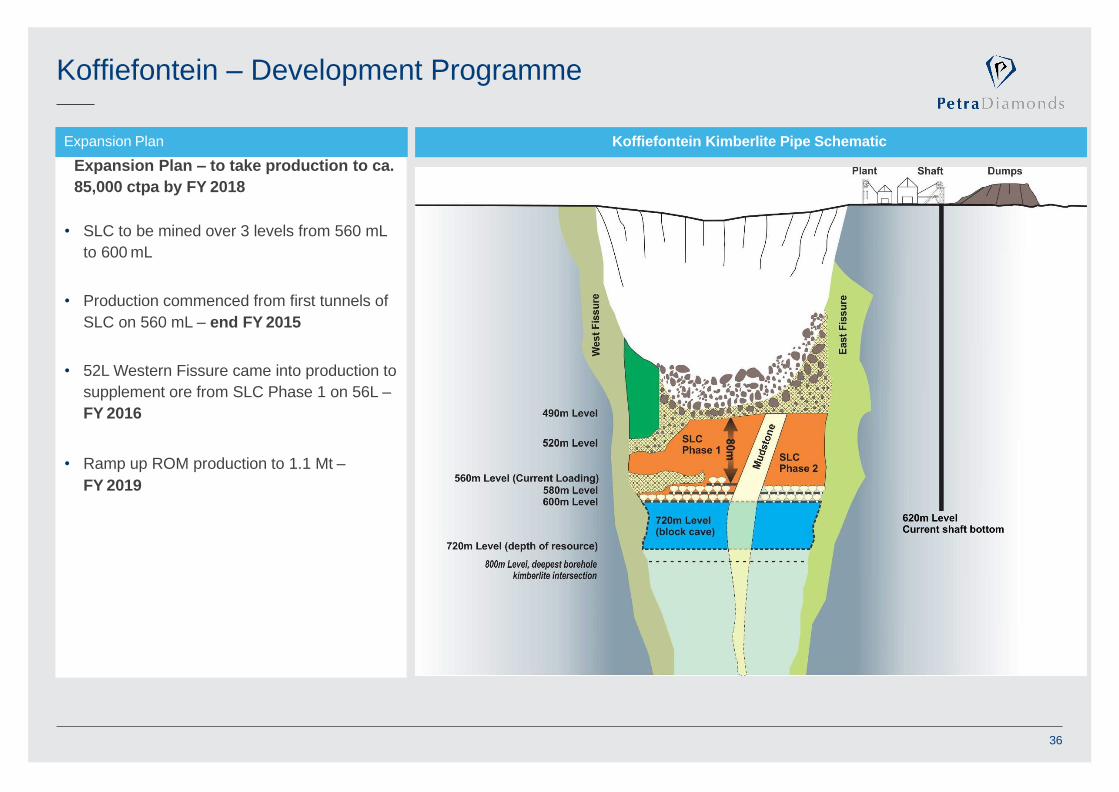
Koffiefontein – Development Programme
Expansion Plan – to take production to ca.
85,000 ctpa by FY 2018
• SLC to be mined over 3 levels from 560 mL
to 600 mL
• Production commenced from first tunnels of
SLC on 560 mL – end FY 2015
• 52L Western Fissure came into production to
supplement ore from SLC Phase 1 on 56L –
FY 2016
• Ramp up ROM production to 1.1 Mt –
FY 2019
Koffiefontein Kimberlite Pipe SchematicExpansion Plan
36
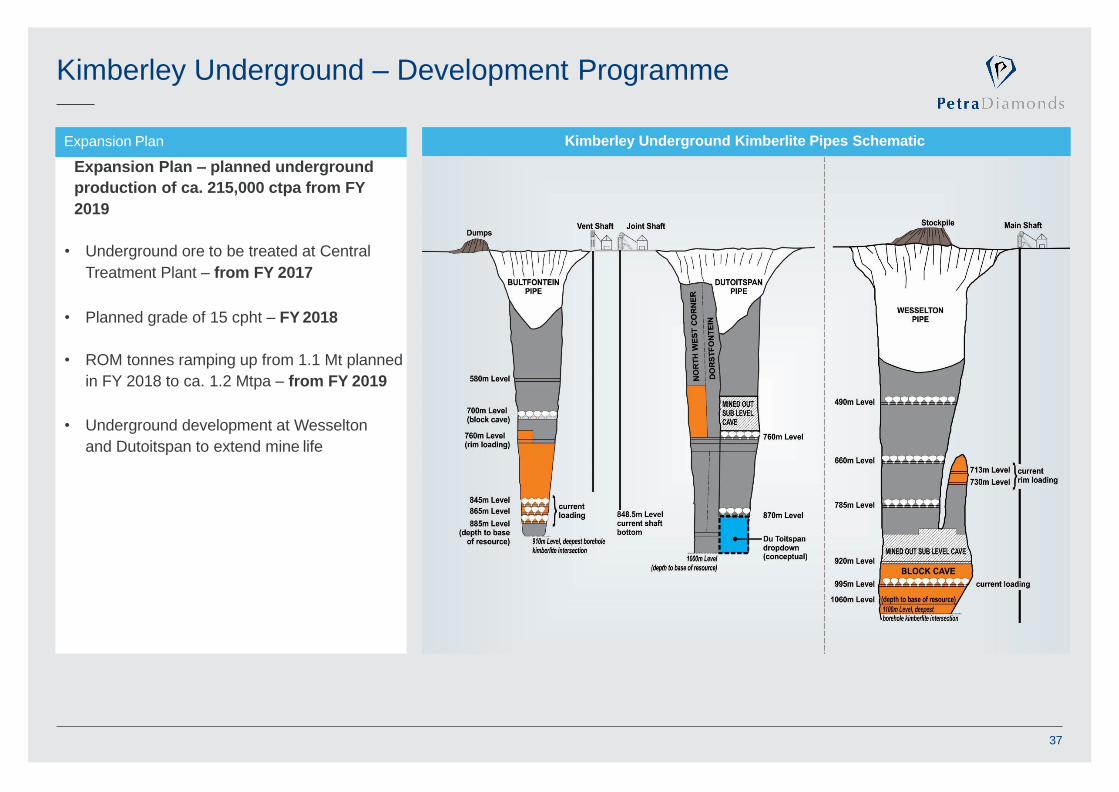
Kimberley Underground – Development Programme
Expansion Plan – planned underground
production of ca. 215,000 ctpa from FY
2019
• Underground ore to be treated at Central
Treatment Plant – from FY 2017
• Planned grade of 15 cpht – FY 2018
• ROM tonnes ramping up from 1.1 Mt planned
in FY 2018 to ca. 1.2 Mtpa – from FY 2019
• Underground development at Wesselton
and Dutoitspan to extend mine life
Kimberley Underground Kimberlite Pipes SchematicExpansion Plan
37
Williamson – Development Programme
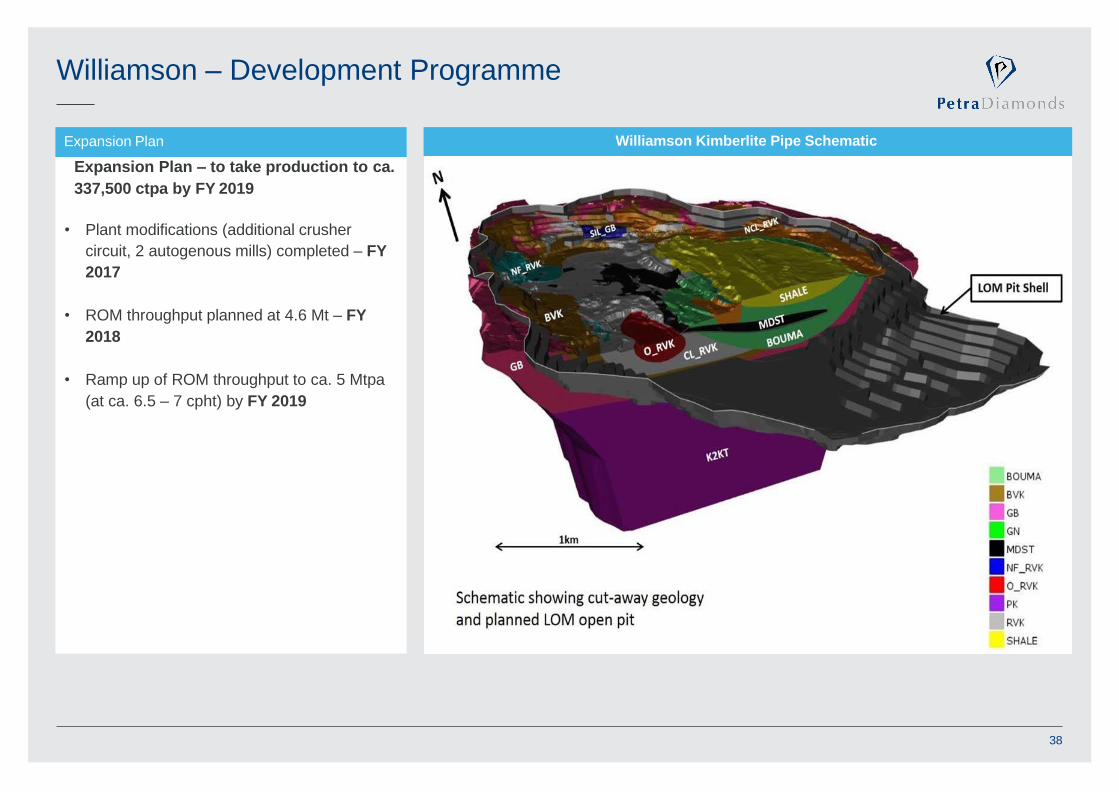
Expansion Plan – to take production to ca.
337,500 ctpa by FY 2019
• Plant modifications (additional crusher
circuit, 2 autogenous mills) completed – FY
2017
• ROM throughput planned at 4.6 Mt – FY
2018
• Ramp up of ROM throughput to ca. 5 Mtpa
(at ca. 6.5 – 7 cpht) by FY 2019
Williamson Kimberlite Pipe SchematicExpansion Plan
38
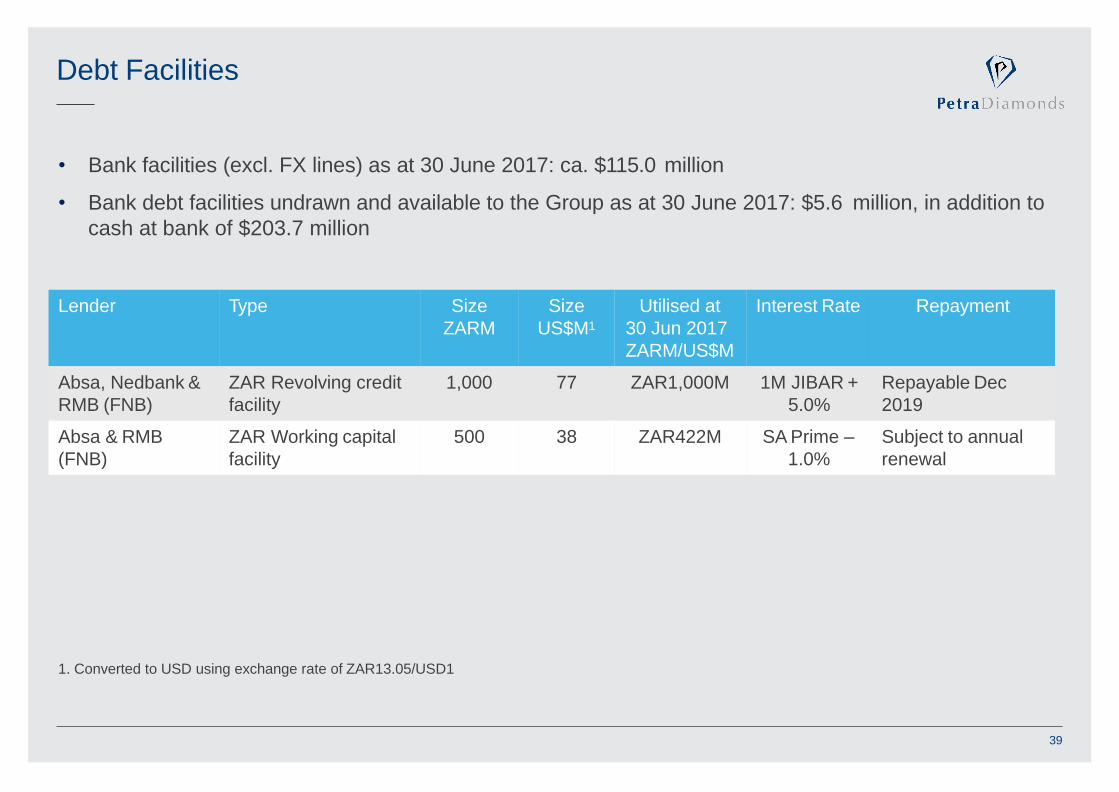
Debt Facilities
Lender Type Size
ZARM
Size
US$M1
Utilised at
30 Jun 2017
ZARM/US$M
Interest Rate Repayment
Absa, Nedbank &
RMB (FNB)
ZAR Revolving credit
facility
1,000 77 ZAR1,000M 1M JIBAR +
5.0%
Repayable Dec
2019
Absa & RMB
(FNB)
ZAR Working capital
facility
500 38 ZAR422M SA Prime – Subject to annual
1.0% renewal
• Bank facilities (excl. FX lines) as at 30 June 2017: ca. $115.0 million
• Bank debt facilities undrawn and available to the Group as at 30 June 2017: $5.6 million, in addition to
cash at bank of $203.7 million
1. Converted to USD using exchange rate of ZAR13.05/USD1
39
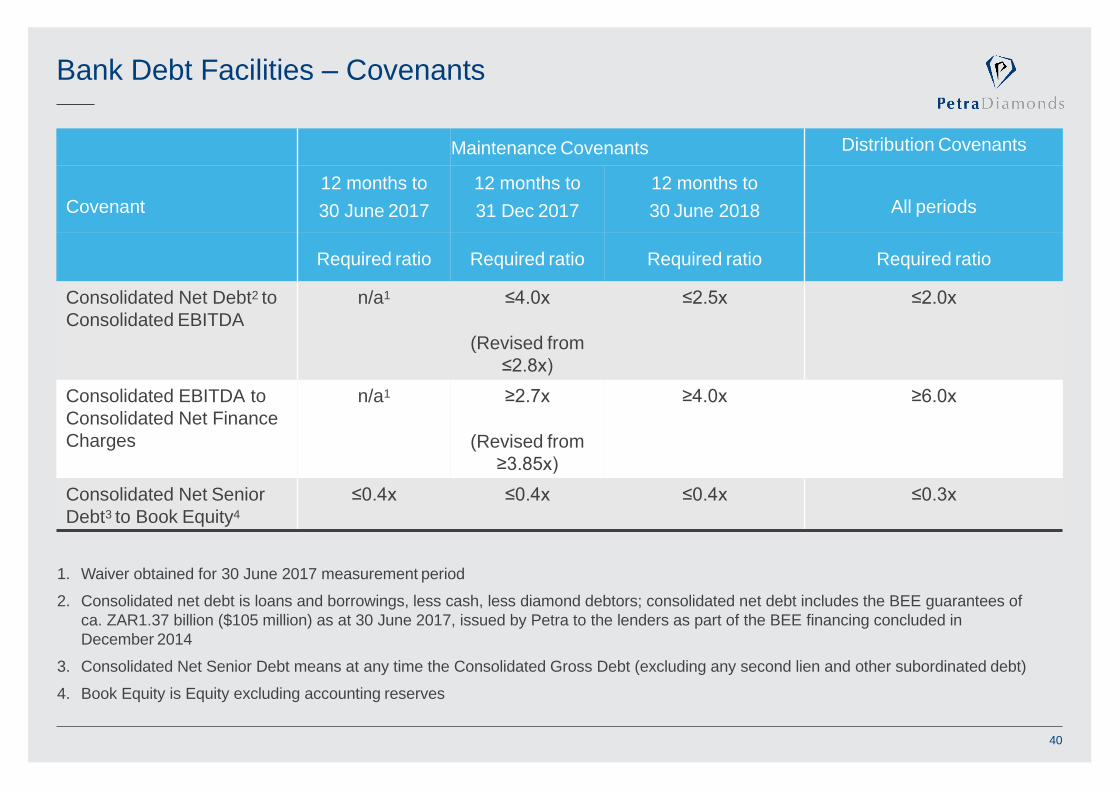
Bank Debt Facilities – Covenants
1. Waiver obtained for 30 June 2017 measurement period
2. Consolidated net debt is loans and borrowings, less cash, less diamond debtors; consolidated net debt includes the BEE guarantees of
ca. ZAR1.37 billion ($105 million) as at 30 June 2017, issued by Petra to the lenders as part of the BEE financing concluded in
December 2014
3. Consolidated Net Senior Debt means at any time the Consolidated Gross Debt (excluding any second lien and other subordinated debt)
4. Book Equity is Equity excluding accounting reserves
Maintenance Covenants Distribution Covenants
Covenant
12 months to
30 June 2017
12 months to
31 Dec 2017
12 months to
30 June 2018 All periods
Required ratio Required ratio Required ratio Required ratio
Consolidated Net Debt2 to
Consolidated EBITDA
n/a1 ≤4.0x
(Revised from
≤2.8x)
≤2.5x ≤2.0x
Consolidated EBITDA to
Consolidated Net Finance
Charges
n/a1 ≥2.7x
(Revised from
≥3.85x)
≥4.0x ≥6.0x
Consolidated Net Senior
Debt3 to Book Equity4
≤0.4x ≤0.4x ≤0.4x ≤0.3x
40
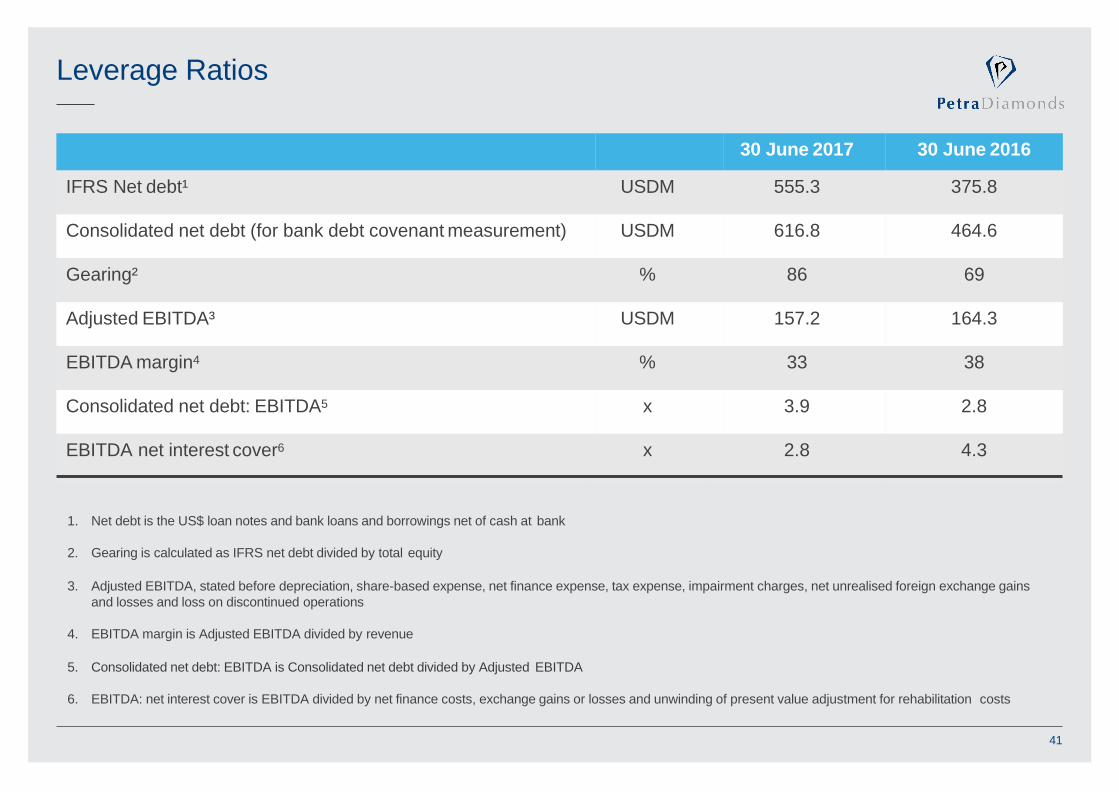
Leverage Ratios
30 June 2017 30 June 2016
IFRS Net debt¹ USDM 555.3 375.8
Consolidated net debt (for bank debt covenant measurement) USDM 616.8 464.6
Gearing² % 86 69
Adjusted EBITDA³ USDM 157.2 164.3
EBITDA margin4 % 33 38
Consolidated net debt: EBITDA5 x 3.9 2.8
EBITDA net interest cover6 x 2.8 4.3
1. Net debt is the US$ loan notes and bank loans and borrowings net of cash at bank
2. Gearing is calculated as IFRS net debt divided by total equity
3. Adjusted EBITDA, stated before depreciation, share-based expense, net finance expense, tax expense, impairment charges, net unrealised foreign exchange gains
and losses and loss on discontinued operations
4. EBITDA margin is Adjusted EBITDA divided by revenue
5. Consolidated net debt: EBITDA is Consolidated net debt divided by Adjusted EBITDA
6. EBITDA: net interest cover is EBITDA divided by net finance costs, exchange gains or losses and unwinding of present value adjustment for rehabilitation costs
41
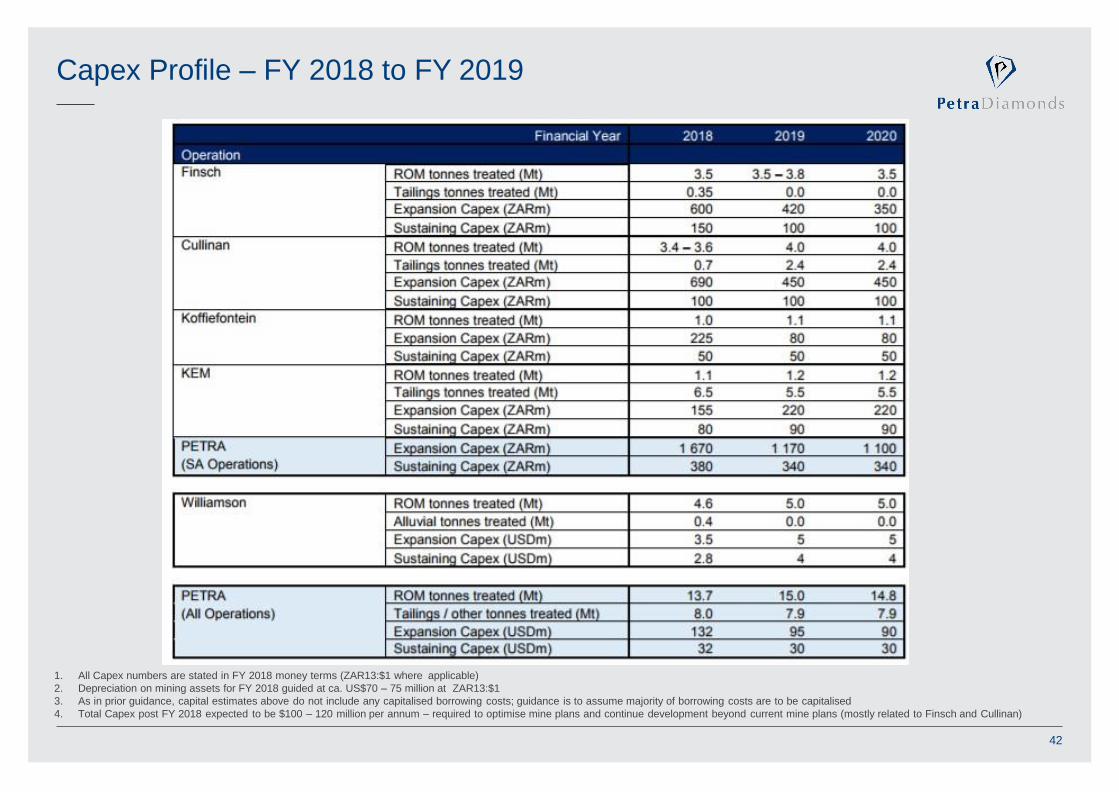
Capex Profile – FY 2018 to FY 2019
1. All Capex numbers are stated in FY 2018 money terms (ZAR13:$1 where applicable)
2. Depreciation on mining assets for FY 2018 guided at ca. US$70 – 75 million at ZAR13:$1
3. As in prior guidance, capital estimates above do not include any capitalised borrowing costs; guidance is to assume majority of borrowing costs are to be capitalised
4. Total Capex post FY 2018 expected to be $100 – 120 million per annum – required to optimise mine plans and continue development beyond current mine plans (mostly related to Finsch and Cullinan)
42
Thank You
Further enquiries: Petra Diamonds Cathy MalinsCorporate Communications [email protected]+44 20 7494 8203www.petradiamonds.com