Embed Size (px)
Citation preview
Page 1 of 31
22 February 2010 AIM: PDL
Petra Diamonds Limited (“Petra Diamonds”, “Petra”, “the Company” or “the Group”)
Interim results for the six months to 31 December 2009
Petra Diamonds Limited announces its interim results (unaudited) for the six months to 31 December 2009 (“the Period”). Highlights
Gross mine revenue up 32% to US$62.4 million (H1 2008: US$47.3 million) Group attributable mine revenue¹ up 43% to US$48.4 million (H1 2008: US$33.8 million) Profit from mining activity (before depreciation)²: US$8.0 million (H1 2008: US$10.2 million) EBITDA3: US$38.1 million after Cullinan fair value adjustment of US$31.0 million (H1 2008:
US$6.2 million loss) Profit after tax: US$37.9 million (H1 2008: US$88.0 million loss) Fund raising of US$120 million completed December 2009 Increase of direct ownership in the Cullinan mine from 37% to 74% Cash position at 31 December 2009 of US$65.0 million (H1 2008: US$10.5 million)
Johan Dippenaar, Chief Executive Officer, comments: “These strong trading results demonstrate that Petra Diamonds has made significant progress during the period, with increased diamond production in a rough diamond market that continues to strengthen. The Company is in a robust financial position, combining profitable mining operations with a well-capitalised balance sheet. Our priority now is to deliver on our core objective to expand production at each mining asset, taking annual production from one million to over three million carats, and further enhance our profile as the unique growth opportunity in the diamond sector.” Analyst presentation and webcast A presentation for analysts will be held at 9:30am GMT on 22 February 2010 at the offices of Buchanan Communications, 45 Moorfields, London EC2Y 9AE. A live webcast of the analyst presentation will be available on Petra’s website at www.petradiamonds.com and a recording of this will be available on the website thereafter.
Page 2 of 31
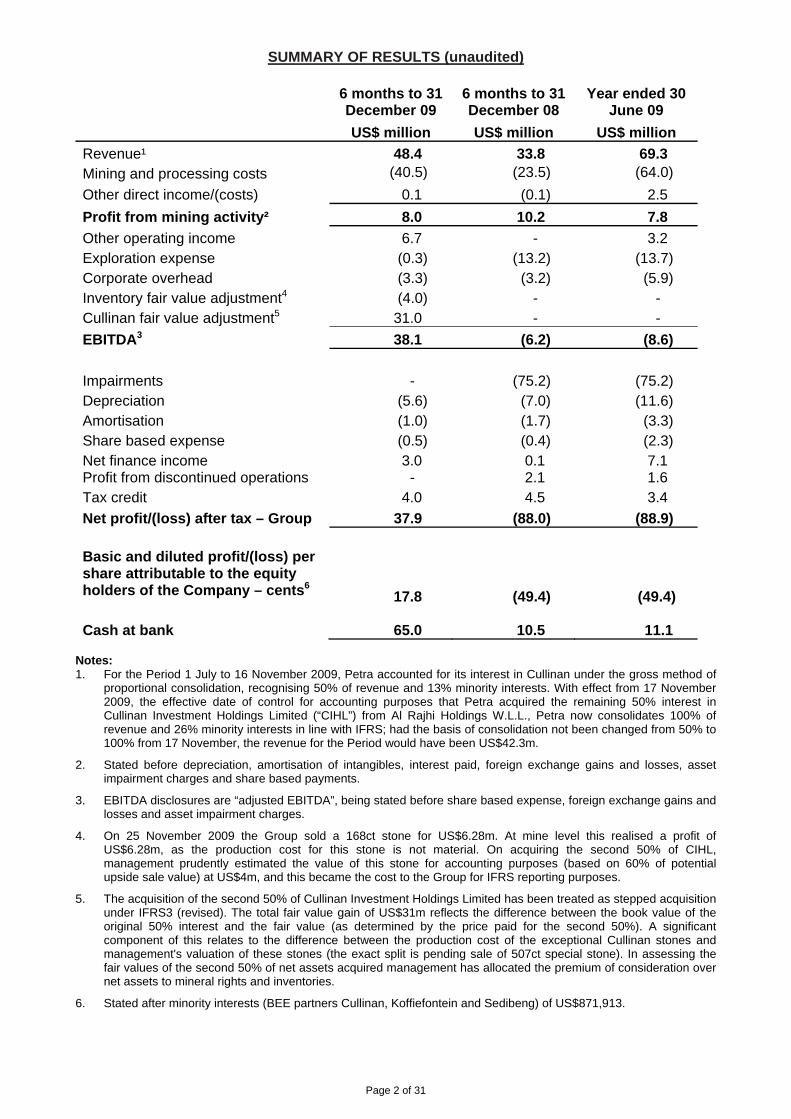
SUMMARY OF RESULTS (unaudited) 6 months to 31 December 09
6 months to 31 December 08
Year ended 30 June 09
US$ million US$ million US$ million
Revenue¹ 48.4 33.8 69.3 Mining and processing costs (40.5) (23.5) (64.0)
Other direct income/(costs) 0.1 (0.1) 2.5
Profit from mining activity² 8.0 10.2 7.8
Other operating income 6.7 - 3.2 Exploration expense (0.3) (13.2) (13.7) Corporate overhead (3.3) (3.2) (5.9) Inventory fair value adjustment4 (4.0) - - Cullinan fair value adjustment5 31.0 - -
EBITDA3 38.1 (6.2) (8.6)
Impairments - (75.2) (75.2) Depreciation (5.6) (7.0) (11.6) Amortisation (1.0) (1.7) (3.3) Share based expense (0.5) (0.4) (2.3) Net finance income 3.0 0.1 7.1 Profit from discontinued operations - 2.1 1.6 Tax credit 4.0 4.5 3.4
Net profit/(loss) after tax – Group 37.9 (88.0) (88.9)
Basic and diluted profit/(loss) per share attributable to the equity holders of the Company – cents6 17.8 (49.4) (49.4) Cash at bank 65.0 10.5 11.1
Notes: 1. For the Period 1 July to 16 November 2009, Petra accounted for its interest in Cullinan under the gross method of
proportional consolidation, recognising 50% of revenue and 13% minority interests. With effect from 17 November 2009, the effective date of control for accounting purposes that Petra acquired the remaining 50% interest in Cullinan Investment Holdings Limited (“CIHL”) from Al Rajhi Holdings W.L.L., Petra now consolidates 100% of revenue and 26% minority interests in line with IFRS; had the basis of consolidation not been changed from 50% to 100% from 17 November, the revenue for the Period would have been US$42.3m.
2. Stated before depreciation, amortisation of intangibles, interest paid, foreign exchange gains and losses, asset impairment charges and share based payments.
3. EBITDA disclosures are “adjusted EBITDA”, being stated before share based expense, foreign exchange gains and losses and asset impairment charges.
4. On 25 November 2009 the Group sold a 168ct stone for US$6.28m. At mine level this realised a profit of US$6.28m, as the production cost for this stone is not material. On acquiring the second 50% of CIHL, management prudently estimated the value of this stone for accounting purposes (based on 60% of potential upside sale value) at US$4m, and this became the cost to the Group for IFRS reporting purposes.
5. The acquisition of the second 50% of Cullinan Investment Holdings Limited has been treated as stepped acquisition under IFRS3 (revised). The total fair value gain of US$31m reflects the difference between the book value of the original 50% interest and the fair value (as determined by the price paid for the second 50%). A significant component of this relates to the difference between the production cost of the exceptional Cullinan stones and management's valuation of these stones (the exact split is pending sale of 507ct special stone). In assessing the fair values of the second 50% of net assets acquired management has allocated the premium of consideration over net assets to mineral rights and inventories.
6. Stated after minority interests (BEE partners Cullinan, Koffiefontein and Sedibeng) of US$871,913.
Page 3 of 31
For further information, please contact: Cathy Roberts Telephone: +44 20 7318 0452 Petra Diamonds, London [email protected] Bobby Morse / Katharine Sutton Telephone: +44 20 7466 5000 Buchanan Communications [email protected]
Nicola Taylor Telephone: +27 11 880 3924 Russell & Associates [email protected] Mike Jones / Ryan Gaffney Telephone: +44 20 7050 6500 Canaccord Adams (NOMAD and Joint Broker)
[email protected] [email protected]
Joshua Critchley / Martin Eales Telephone: +44 20 7653 4000 RBC Capital Markets (Joint Broker)
[email protected] [email protected]
About Petra Diamonds Petra Diamonds is a leading supplier of rough diamonds, with a gross resource base of 262 million carats. The Company offers a unique growth profile within the diamond sector, increasing its annual production fivefold in the year to June 2009 to over 1 million carats, and with firm plans in place to grow production to over 3 million carats. In South Africa, Petra has interests in five producing mines – Cullinan, Koffiefontein, Helam, Sedibeng and Star - and has also agreed to acquire the Kimberley Underground mines from De Beers (this acquisition is expected to complete soon). In Tanzania, Petra has an interest in the Williamson mine. Petra conducts all its operations according to the highest ethical standards, and will only work in countries which are members of the Kimberley Process. The Company is quoted on the AIM market of the London Stock Exchange (AIM: PDL). www.petradiamonds.com
Page 4 of 31
CHAIRMAN’S STATEMENT Petra experienced strong trading results in the first half of the financial year, recording significant production and revenue growth set against the backdrop of a sustained recovery to the rough diamond market. There were a number of key achievements for the Period. In September 2009, a 507 carat diamond was recovered at the Cullinan mine. This remarkable stone was found in the same production series as three other special diamonds, of 168, 58 and 53 carats, and these three diamonds together sold for a combined revenue of US$9.1 million. The 507 carat diamond, which was recently named The Cullinan Heritage to reflect its illustrious origins and its recovery on South Africa’s Heritage Day, is currently on tender and we expect to announce the outcome of the tender on 26 February 2010. Cullinan is now the source of four of the top 20 largest gem diamonds ever found, and with the re-commissioning of the large diamond recovery plant achieved on time at the end of 2009 we believe there is increased potential for further important finds. In December 2009 the Company completed a US$120 million fund-raising, which was subject to strong demand from institutional investors. In addition to strengthening the Company’s balance sheet, the funds raised were applied to acquire an additional 37% of Cullinan from Al Rajhi Holdings W.L.L. (“Al Rajhi”), taking Petra’s direct ownership of the mine to 74%. At the same time, we restructured the debt owing to Al Rajhi, arising from the original purchase of the mine. Cullinan is our flagship asset, currently contributing over 70% of our production, and a key driver for our revenue and production growth going forward. Following consolidation of the Cullinan ownership, cashflows from the mine now flow directly to Petra. The Period saw steadily improving rough diamond prices, a return of liquidity to the pipeline and commensurately higher levels of confidence restored to our industry. Whilst we remain cautiously optimistic about the short to medium term prospects for our market, the long term fundamentals are very positive, with all commentators agreeing that demand is set to outstrip supply. Our commitment therefore remains first and foremost to continue with the roll-out of the capital expansion programmes at each of our mines, with the stated objective to treble Group production to three million carats by 2019. Finally, I am delighted to welcome Dr. Omar Kamal to the Board of Petra as Non-Executive Director. As a Managing Director of Al Rajhi, our largest shareholder, Dr. Kamal is already intimately involved with the Petra Group and we believe he will add great value to our Board. At the same time, I would like to thank Volker Ruffer, who simultaneously stepped down as Non-Executive Director, for his valued input over Petra’s formative years. FINANCIAL RESULTS Revenue Gross revenue of US$62.4 million was recorded for the Period, an increase of 32% on the US$47.3 million recorded in the six months to 31 December 2008. Group attributable revenue was up 43% to US$48.4 million, against the US$33.8 million recorded in the six months to 31 December 2008. A direct comparison of Group revenues between the periods is complicated due to the increased interest in Cullinan acquired during the Period. Had this not occurred, the Group revenue for the Period would have been US$42.3 million, still a considerable increase on the six months to 31 December 2008. For future reporting periods, Petra will now consolidate 100% of the results for the Cullinan mine and this will further significantly increase revenue and EBITDA. Mining and processing costs Mining and processing costs (before depreciation) for the South African operations increased in ZAR terms by approximately 11% due to upwards pressure on electricity and labour costs experienced for the Period. In US$ reporting terms, mining and processing costs have increased further due to the strengthening of the Rand during the Period by approximately 13.5%, the
Page 5 of 31
consolidation of 100% of the mining and processing costs for Cullinan from 17 November 2009, and the inclusion of Williamson for the full six month period. Mining profit A profit on mining activity of US$8.0 million was recorded for the Period, against a profit of US$10.2 million for the corresponding period. Rough diamond prices only began to strengthen midway through the Period and therefore the stronger prices now being achieved at Petra’s tenders, the sale of the 507 carat diamond this month and the full consolidation of Cullinan’s earnings from November 2007 will bode well for the profit from mining activities in the six months to June 2010. Other income As at 1 July 2009, the Company had written down to zero the carrying value of the plant and equipment that remained in Angola following its withdrawal from the Alto Cuilo and Luangue projects. These assets were sold during the Period for US$3.8 million cash and a profit on disposal of the assets of US$3.8 million is included within other income. Given that the Company’s withdrawal from Angola is now complete, provisions for withdrawal and associated costs of US$2 million were no longer required and were therefore credited to the income statement within other income. The sale of assets and reversal of provisions are once-off incomes and there will be no further financial impact with regards to the Angolan withdrawals. Exploration and corporate expenses Petra Diamonds is focused primarily on production, but it has retained some exposure to exploration whilst minimising funding commitments. The Group’s modest annual exploration budget is now focused in Botswana, which is considered to offer a highly attractive operating environment, and expenditure (excluding amortisation charges) was US$0.3m for the Period. Corporate overhead remains tightly controlled at US$3.3 million for the Period. Cullinan fair value adjustment The Cullinan fair value adjustment of US$31 million arises due to the acquisition of the second 50% of Cullinan Investment Holdings Limited (“CIHL”), which has been treated as a stepped acquisition under IFRS3 (revised). The fair value gain reflects the difference between the book value of the original 50% interest in CIHL and the fair value (as determined by the price paid for the second 50%). A significant component of this relates to the difference between the production cost of the exceptional Cullinan stones and management's valuation of these stones (the exact split is pending the sale of the 507 carat special stone). In assessing the fair values of the second 50% of net assets acquired, management has allocated the premium of consideration over net assets to mineral rights and inventories. On 25 November 2009 the Group sold a 168 carat Cullinan diamond for US$6.28 million. At mine level this realised a profit of US$6.28 million, as the production cost for this stone is not material. On acquiring the second 50% of CIHL, management prudently estimated the value of this stone for accounting purposes (based on 60% of potential upside sale value) at US$4 million, and this became the cost to the Group for IFRS reporting purposes. Fund-raising In December 2009, Petra completed a placing, issuing 121,200,000 new shares and raising gross proceeds of US$120 million. The Company decided to undertake this placing for several reasons:
Acquisition of an additional 37% of the Cullinan mine Cullinan is Petra’s key asset in terms of the potential for earnings growth and cashflow generation yet the Company previously only had a 37% interest in the mine. Furthermore, cashflows from the mine were ring-fenced to paying down the US$80 million Al Rajhi loan provided in respect to the original acquisition and financing of the mine. Effective 17 November 2009, the Company increased its interest in the Cullinan mine to 74%, by acquiring the 37% interest held by Al Rajhi. The consideration was satisfied by the issue to Al Rajhi of 36 million new Petra shares and a deferred cash consideration of US$35 million, payable December 2011.
Page 6 of 31
As part of the above transaction, Petra also took over responsibility for the loan due to Al Rajhi. This loan was reduced to US$50.7 million in December 2009 by the issue of 11.4 million new Petra shares to Al Rajhi and the payment of US$15 million cash from the raising proceeds. In early January 2010, a further US$6.8 million was paid to Al Rajhi by Petra from cash balances, further reducing the principal loan balance to US$43.9 million.
Repayment of US$20 million Al Rajhi Convertible Loan Note
In order to trigger the acquisition of the additional 37% interest in Cullinan from Al Rajhi, it was a requirement that the Convertible Loan Note, plus accrued interest, be settled. In December 2009, post the raising, Petra paid Al Rajhi US$20.5 million and fully settled the Convertible.
Strengthening the balance sheet
During the course of 2009 Petra’s debt levels had increased as, during a period of very weak diamond prices, the Company had invested out of its own cash resources in the construction of the plant and the care and maintenance of the underground operations at Kimberley Underground, development work at Cullinan and the bulk sampling programme at Williamson. Management considered it important in terms of Petra’s corporate development to reduce debt to a more appropriate level. Further the ongoing development of Cullinan and the expansion of Williamson will require additional investment and therefore Petra’s treasury needed to be boosted for such funding commitments.
The US$120 million funds raised were therefore applied (pre and post Period end) as follows:
part settlement of the Al Rajhi / Cullinan loan, reducing the loan (including accrued interest and after the issue of new shares to Al Rajhi) from US$89.6 million to US$43.9 million
repayment of the Al Rajhi convertible loan note and accrued interest of US$20.5 million; and
settlement of various Petra short term debt of US$30.2 million. Cash and debt As at 31 December 2009, Petra had cash at bank of US$65.0 million and diamond inventories of US$34.8 million; loans, borrowings, trade creditors and the deferred Cullinan consideration totalled US$128.3 million. Subsequent to the Period end US$30 million was applied to settle December trade creditors and further reduce other group debt. The sale of The Cullinan Heritage will complete on Friday 26 February and is expected to substantially boost Petra’s treasury, leaving the Group in a strong financial position. DIAMOND MARKET The diamond market made a strong recovery over recent months due to a number of positive factors and rough diamond prices are now close to the averages recorded in the 2008 financial year before the global economic slump. This buoyant market is underpinned by strong demand across all rough diamond categories. In particular, it is encouraging to note the increasing demand for the smaller pique (lower quality) material which is typically used for mass market jewellery in the important US market. Whilst there are positive signs of recovery in the US market, the growth in demand for diamonds is primarily being driven by India and China, which overtook Japan in 2009 to become the world’s second largest consumer of diamonds. This rapid growth is exciting for the industry, particularly since the discerning Chinese market tends to favour higher value and better quality diamonds, which are in increasingly scarce supply. On the supply side, the market remains tight due to the cutbacks in supply from the major producers. Whilst global production will gradually increase again this year, market commentators are not forecasting supply to return to the peak production of circa 160 million carats achieved in 2008. This is largely due to the fact that most of the world’s important diamond mines have now
Page 7 of 31
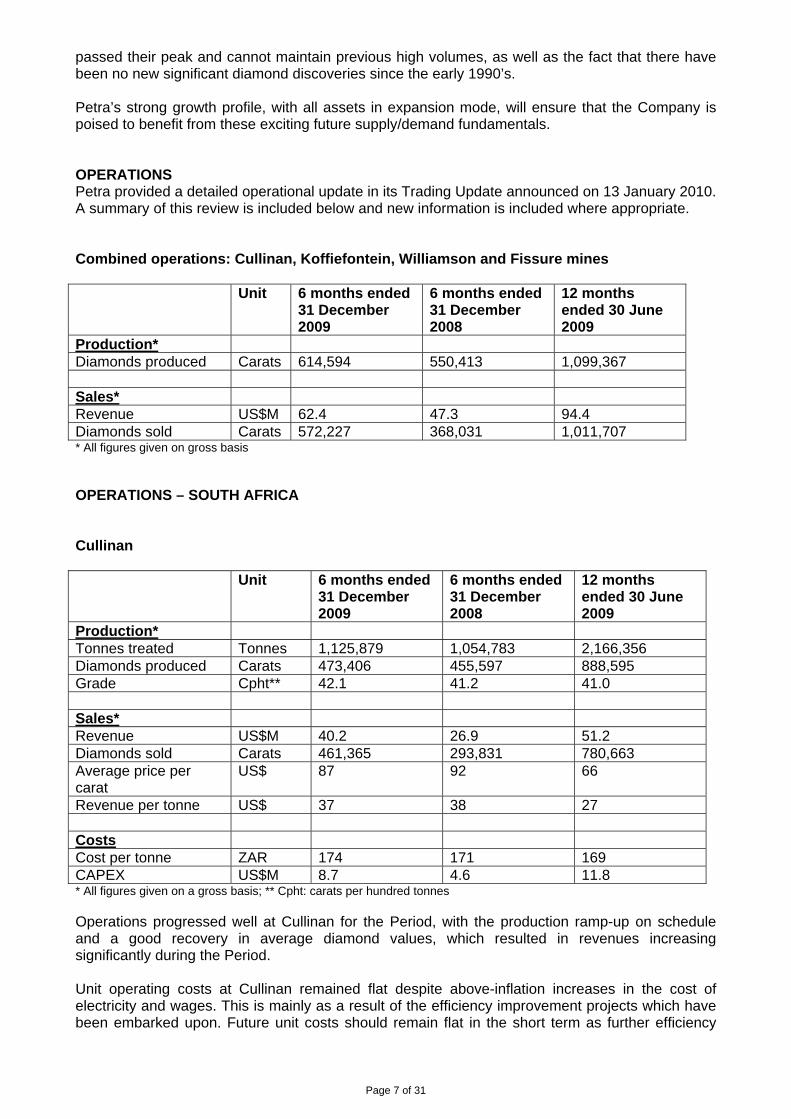
passed their peak and cannot maintain previous high volumes, as well as the fact that there have been no new significant diamond discoveries since the early 1990’s. Petra’s strong growth profile, with all assets in expansion mode, will ensure that the Company is poised to benefit from these exciting future supply/demand fundamentals. OPERATIONS Petra provided a detailed operational update in its Trading Update announced on 13 January 2010. A summary of this review is included below and new information is included where appropriate. Combined operations: Cullinan, Koffiefontein, Williamson and Fissure mines Unit 6 months ended
31 December 2009
6 months ended 31 December 2008
12 months ended 30 June 2009
Production* Diamonds produced Carats 614,594 550,413 1,099,367 Sales* Revenue US$M 62.4 47.3 94.4 Diamonds sold Carats 572,227 368,031 1,011,707 * All figures given on gross basis OPERATIONS – SOUTH AFRICA Cullinan Unit 6 months ended
31 December 2009
6 months ended 31 December 2008
12 months ended 30 June 2009
Production* Tonnes treated Tonnes 1,125,879 1,054,783 2,166,356 Diamonds produced Carats 473,406 455,597 888,595 Grade Cpht** 42.1 41.2 41.0 Sales* Revenue US$M 40.2 26.9 51.2 Diamonds sold Carats 461,365 293,831 780,663 Average price per carat
US$ 87 92 66
Revenue per tonne US$ 37 38 27 Costs Cost per tonne ZAR 174 171 169 CAPEX US$M 8.7 4.6 11.8 * All figures given on a gross basis; ** Cpht: carats per hundred tonnes Operations progressed well at Cullinan for the Period, with the production ramp-up on schedule and a good recovery in average diamond values, which resulted in revenues increasing significantly during the Period. Unit operating costs at Cullinan remained flat despite above-inflation increases in the cost of electricity and wages. This is mainly as a result of the efficiency improvement projects which have been embarked upon. Future unit costs should remain flat in the short term as further efficiency
Page 8 of 31
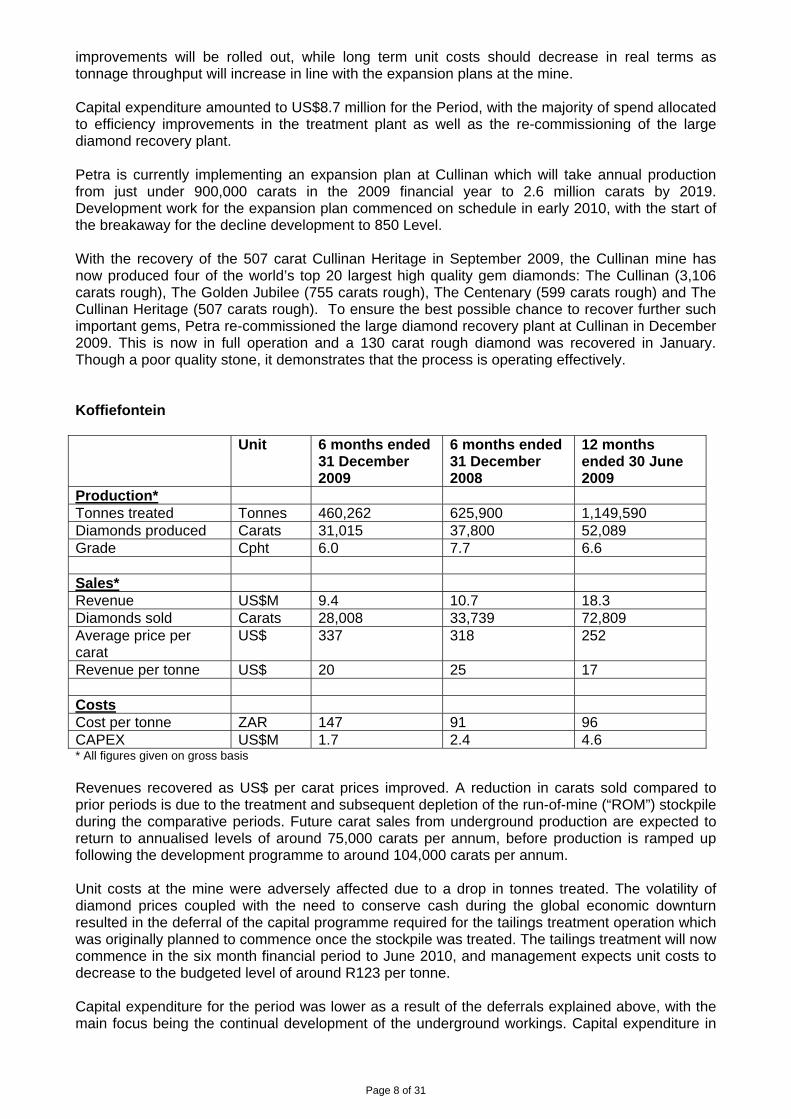
improvements will be rolled out, while long term unit costs should decrease in real terms as tonnage throughput will increase in line with the expansion plans at the mine. Capital expenditure amounted to US$8.7 million for the Period, with the majority of spend allocated to efficiency improvements in the treatment plant as well as the re-commissioning of the large diamond recovery plant. Petra is currently implementing an expansion plan at Cullinan which will take annual production from just under 900,000 carats in the 2009 financial year to 2.6 million carats by 2019. Development work for the expansion plan commenced on schedule in early 2010, with the start of the breakaway for the decline development to 850 Level. With the recovery of the 507 carat Cullinan Heritage in September 2009, the Cullinan mine has now produced four of the world’s top 20 largest high quality gem diamonds: The Cullinan (3,106 carats rough), The Golden Jubilee (755 carats rough), The Centenary (599 carats rough) and The Cullinan Heritage (507 carats rough). To ensure the best possible chance to recover further such important gems, Petra re-commissioned the large diamond recovery plant at Cullinan in December 2009. This is now in full operation and a 130 carat rough diamond was recovered in January. Though a poor quality stone, it demonstrates that the process is operating effectively. Koffiefontein Unit 6 months ended
31 December 2009
6 months ended 31 December 2008
12 months ended 30 June 2009
Production* Tonnes treated Tonnes 460,262 625,900 1,149,590 Diamonds produced Carats 31,015 37,800 52,089 Grade Cpht 6.0 7.7 6.6 Sales* Revenue US$M 9.4 10.7 18.3 Diamonds sold Carats 28,008 33,739 72,809 Average price per carat
US$ 337 318 252
Revenue per tonne US$ 20 25 17 Costs Cost per tonne ZAR 147 91 96 CAPEX US$M 1.7 2.4 4.6 * All figures given on gross basis Revenues recovered as US$ per carat prices improved. A reduction in carats sold compared to prior periods is due to the treatment and subsequent depletion of the run-of-mine (“ROM”) stockpile during the comparative periods. Future carat sales from underground production are expected to return to annualised levels of around 75,000 carats per annum, before production is ramped up following the development programme to around 104,000 carats per annum. Unit costs at the mine were adversely affected due to a drop in tonnes treated. The volatility of diamond prices coupled with the need to conserve cash during the global economic downturn resulted in the deferral of the capital programme required for the tailings treatment operation which was originally planned to commence once the stockpile was treated. The tailings treatment will now commence in the six month financial period to June 2010, and management expects unit costs to decrease to the budgeted level of around R123 per tonne. Capital expenditure for the period was lower as a result of the deferrals explained above, with the main focus being the continual development of the underground workings. Capital expenditure in
Page 9 of 31
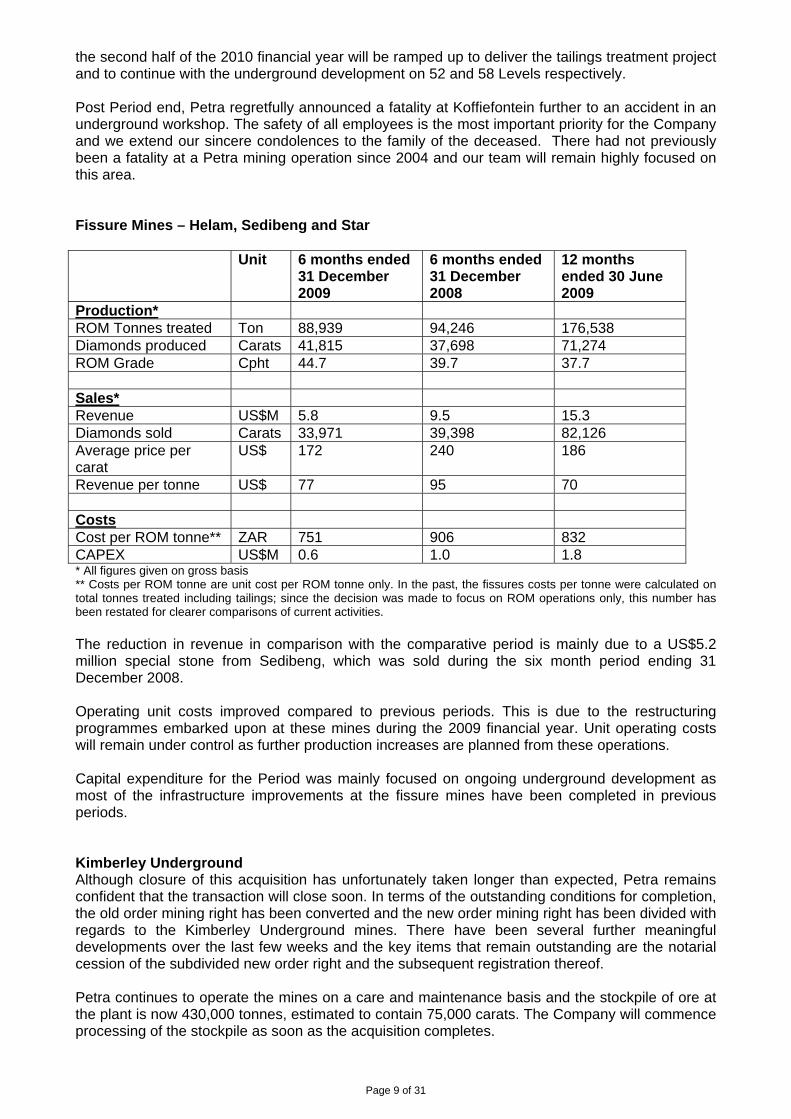
the second half of the 2010 financial year will be ramped up to deliver the tailings treatment project and to continue with the underground development on 52 and 58 Levels respectively. Post Period end, Petra regretfully announced a fatality at Koffiefontein further to an accident in an underground workshop. The safety of all employees is the most important priority for the Company and we extend our sincere condolences to the family of the deceased. There had not previously been a fatality at a Petra mining operation since 2004 and our team will remain highly focused on this area. Fissure Mines – Helam, Sedibeng and Star Unit 6 months ended
31 December 2009
6 months ended 31 December 2008
12 months ended 30 June 2009
Production* ROM Tonnes treated Ton 88,939 94,246 176,538 Diamonds produced Carats 41,815 37,698 71,274 ROM Grade Cpht 44.7 39.7 37.7 Sales* Revenue US$M 5.8 9.5 15.3 Diamonds sold Carats 33,971 39,398 82,126 Average price per carat
US$ 172 240 186
Revenue per tonne US$ 77 95 70 Costs Cost per ROM tonne** ZAR 751 906 832 CAPEX US$M 0.6 1.0 1.8 * All figures given on gross basis ** Costs per ROM tonne are unit cost per ROM tonne only. In the past, the fissures costs per tonne were calculated on total tonnes treated including tailings; since the decision was made to focus on ROM operations only, this number has been restated for clearer comparisons of current activities. The reduction in revenue in comparison with the comparative period is mainly due to a US$5.2 million special stone from Sedibeng, which was sold during the six month period ending 31 December 2008. Operating unit costs improved compared to previous periods. This is due to the restructuring programmes embarked upon at these mines during the 2009 financial year. Unit operating costs will remain under control as further production increases are planned from these operations. Capital expenditure for the Period was mainly focused on ongoing underground development as most of the infrastructure improvements at the fissure mines have been completed in previous periods. Kimberley Underground Although closure of this acquisition has unfortunately taken longer than expected, Petra remains confident that the transaction will close soon. In terms of the outstanding conditions for completion, the old order mining right has been converted and the new order mining right has been divided with regards to the Kimberley Underground mines. There have been several further meaningful developments over the last few weeks and the key items that remain outstanding are the notarial cession of the subdivided new order right and the subsequent registration thereof. Petra continues to operate the mines on a care and maintenance basis and the stockpile of ore at the plant is now 430,000 tonnes, estimated to contain 75,000 carats. The Company will commence processing of the stockpile as soon as the acquisition completes.
Page 10 of 31
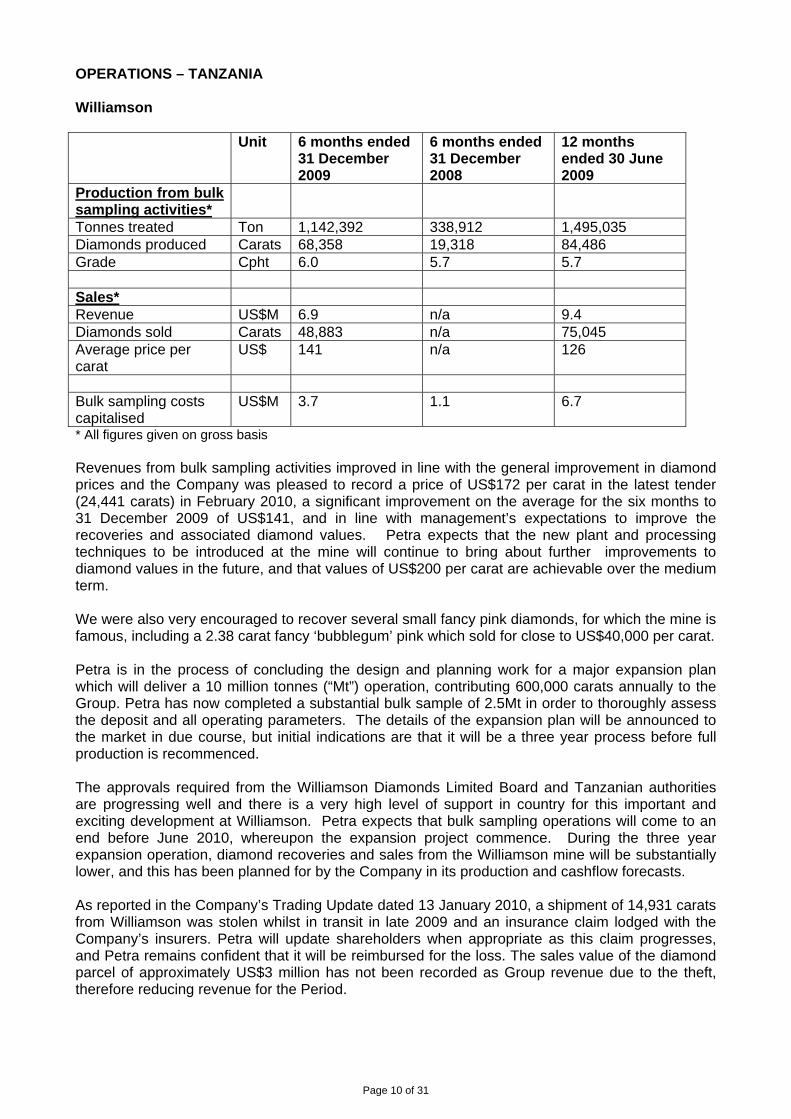
OPERATIONS – TANZANIA Williamson Unit 6 months ended
31 December 2009
6 months ended 31 December 2008
12 months ended 30 June 2009
Production from bulk sampling activities*
Tonnes treated Ton 1,142,392 338,912 1,495,035 Diamonds produced Carats 68,358 19,318 84,486 Grade Cpht 6.0 5.7 5.7 Sales* Revenue US$M 6.9 n/a 9.4 Diamonds sold Carats 48,883 n/a 75,045 Average price per carat
US$ 141 n/a 126
Bulk sampling costs capitalised
US$M 3.7 1.1 6.7
* All figures given on gross basis Revenues from bulk sampling activities improved in line with the general improvement in diamond prices and the Company was pleased to record a price of US$172 per carat in the latest tender (24,441 carats) in February 2010, a significant improvement on the average for the six months to 31 December 2009 of US$141, and in line with management’s expectations to improve the recoveries and associated diamond values. Petra expects that the new plant and processing techniques to be introduced at the mine will continue to bring about further improvements to diamond values in the future, and that values of US$200 per carat are achievable over the medium term. We were also very encouraged to recover several small fancy pink diamonds, for which the mine is famous, including a 2.38 carat fancy ‘bubblegum’ pink which sold for close to US$40,000 per carat. Petra is in the process of concluding the design and planning work for a major expansion plan which will deliver a 10 million tonnes (“Mt”) operation, contributing 600,000 carats annually to the Group. Petra has now completed a substantial bulk sample of 2.5Mt in order to thoroughly assess the deposit and all operating parameters. The details of the expansion plan will be announced to the market in due course, but initial indications are that it will be a three year process before full production is recommenced. The approvals required from the Williamson Diamonds Limited Board and Tanzanian authorities are progressing well and there is a very high level of support in country for this important and exciting development at Williamson. Petra expects that bulk sampling operations will come to an end before June 2010, whereupon the expansion project commence. During the three year expansion operation, diamond recoveries and sales from the Williamson mine will be substantially lower, and this has been planned for by the Company in its production and cashflow forecasts. As reported in the Company’s Trading Update dated 13 January 2010, a shipment of 14,931 carats from Williamson was stolen whilst in transit in late 2009 and an insurance claim lodged with the Company’s insurers. Petra will update shareholders when appropriate as this claim progresses, and Petra remains confident that it will be reimbursed for the loss. The sales value of the diamond parcel of approximately US$3 million has not been recorded as Group revenue due to the theft, therefore reducing revenue for the Period.
Page 11 of 31
EXPLORATION Botswana – Kalahari Diamonds For the Period, Petra’s activities in Botswana largely centered on desktop work such as the identification of ground holdings to be relinquished (20,900km² relinquished in 2009), new ground to be taken up following various prospectivity analyses (19,400km² acquired in 2009), and focused target generation exercises within both existing and newly identified prospecting areas. As of January 2010, Petra’s landholding in Botswana totaled 47,000km², which remains the largest diamond exploration holding in the country. Sierra Leone – Kono Petra recently advised the market that the Kono fissure project, which is at an advanced stage of exploration, is no longer considered core to the Group portfolio and that the Company is in active discussions to sell its share to Stellar Diamonds plc (“Stellar Diamonds”). CURRENT TRADING AND OUTLOOK The Period under review marked a recovery from one of the most difficult trading periods ever encountered by our industry. It is a testament to the quality of Petra’s asset base and our efficient management structures that the Group has weathered this severe downturn and emerged in a robust financial position. Our operations were net cashflow positive even at the very bottom of the cycle and they are now on track to generate strong cashflows in what is a significantly stronger diamond market. Petra’s core strategy is to deliver on our capital rollout, taking production from one million to over three million carats per annum by 2019. We believe this will place the Group in a unique position to capitalise on what we anticipate to be an exciting future for the diamond market. Adonis Pouroulis Chairman 22 February 2010
Page 12 of 31
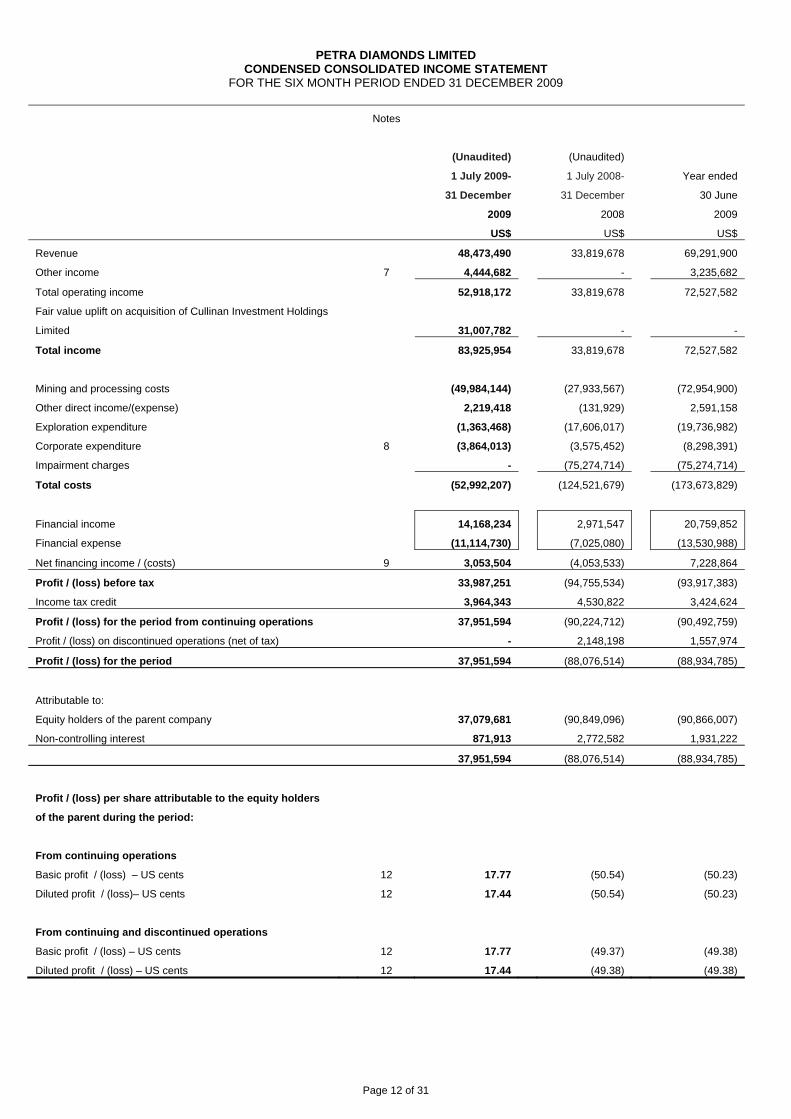
PETRA DIAMONDS LIMITED CONDENSED CONSOLIDATED INCOME STATEMENT
FOR THE SIX MONTH PERIOD ENDED 31 DECEMBER 2009
Notes
(Unaudited)
1 July 2009-
31 December
2009
US$
(Unaudited)
1 July 2008-
31 December
2008
US$
Year ended
30 June
2009
US$
Revenue 48,473,490 33,819,678 69,291,900
Other income 7 4,444,682 - 3,235,682
Total operating income 52,918,172 33,819,678 72,527,582
Fair value uplift on acquisition of Cullinan Investment Holdings
Limited 31,007,782 - -
Total income 83,925,954 33,819,678 72,527,582
Mining and processing costs (49,984,144) (27,933,567) (72,954,900)
Other direct income/(expense) 2,219,418 (131,929) 2,591,158
Exploration expenditure (1,363,468) (17,606,017) (19,736,982)
Corporate expenditure 8 (3,864,013) (3,575,452) (8,298,391)
Impairment charges - (75,274,714) (75,274,714)
Total costs (52,992,207) (124,521,679) (173,673,829)
Financial income 14,168,234 2,971,547 20,759,852
Financial expense (11,114,730) (7,025,080) (13,530,988)
Net financing income / (costs) 9 3,053,504 (4,053,533) 7,228,864
Profit / (loss) before tax 33,987,251 (94,755,534) (93,917,383)
Income tax credit 3,964,343 4,530,822 3,424,624
Profit / (loss) for the period from continuing operations 37,951,594 (90,224,712) (90,492,759)
Profit / (loss) on discontinued operations (net of tax) - 2,148,198 1,557,974
Profit / (loss) for the period 37,951,594 (88,076,514) (88,934,785)
Attributable to:
Equity holders of the parent company 37,079,681 (90,849,096) (90,866,007)
Non-controlling interest 871,913 2,772,582 1,931,222
37,951,594 (88,076,514) (88,934,785)
Profit / (loss) per share attributable to the equity holders
of the parent during the period:
From continuing operations
Basic profit / (loss) – US cents 12 17.77 (50.54) (50.23)
Diluted profit / (loss)– US cents 12 17.44 (50.54) (50.23)
From continuing and discontinued operations
Basic profit / (loss) – US cents 12 17.77 (49.37) (49.38)
Diluted profit / (loss) – US cents 12 17.44 (49.38) (49.38)
Page 13 of 31
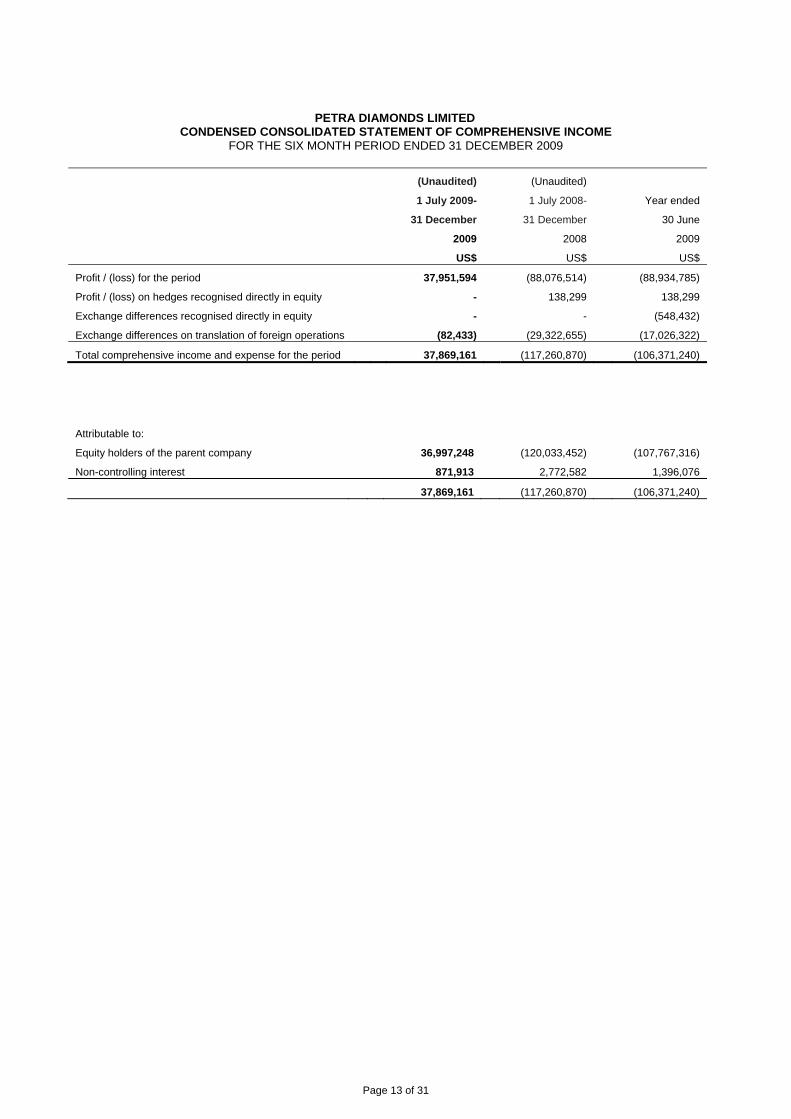
PETRA DIAMONDS LIMITED CONDENSED CONSOLIDATED STATEMENT OF COMPREHENSIVE INCOME
FOR THE SIX MONTH PERIOD ENDED 31 DECEMBER 2009
(Unaudited)
1 July 2009-
31 December
2009
US$
(Unaudited)
1 July 2008-
31 December
2008
US$
Year ended
30 June
2009
US$
Profit / (loss) for the period 37,951,594 (88,076,514) (88,934,785)
Profit / (loss) on hedges recognised directly in equity - 138,299 138,299
Exchange differences recognised directly in equity - - (548,432)
Exchange differences on translation of foreign operations (82,433) (29,322,655) (17,026,322)
Total comprehensive income and expense for the period 37,869,161 (117,260,870) (106,371,240)
Attributable to:
Equity holders of the parent company 36,997,248 (120,033,452) (107,767,316)
Non-controlling interest 871,913 2,772,582 1,396,076
37,869,161 (117,260,870) (106,371,240)
Page 14 of 31
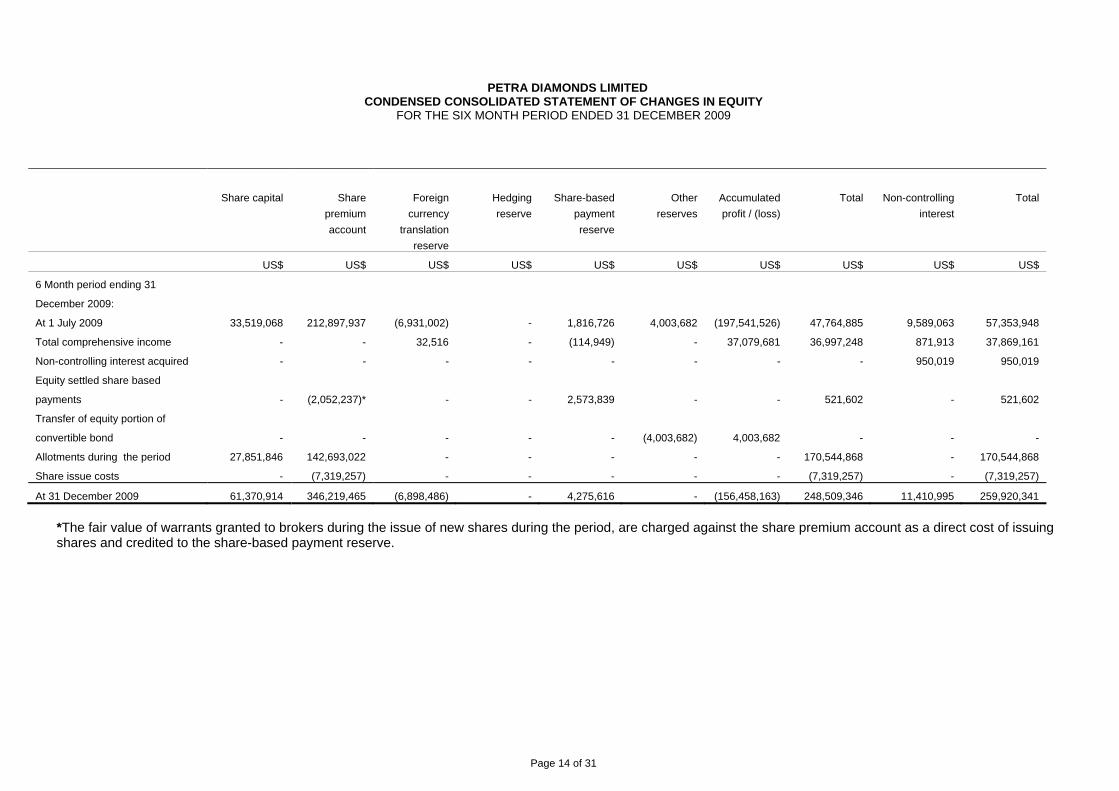
PETRA DIAMONDS LIMITED CONDENSED CONSOLIDATED STATEMENT OF CHANGES IN EQUITY
FOR THE SIX MONTH PERIOD ENDED 31 DECEMBER 2009
Share capital Share
premium
account
Foreign
currency
translation
reserve
Hedging
reserve
Share-based
payment
reserve
Other
reserves
Accumulated
profit / (loss)
Total Non-controlling
interest
Total
US$ US$ US$ US$ US$ US$ US$ US$ US$ US$
6 Month period ending 31
December 2009:
At 1 July 2009 33,519,068 212,897,937 (6,931,002) - 1,816,726 4,003,682 (197,541,526) 47,764,885 9,589,063 57,353,948
Total comprehensive income - - 32,516 - (114,949) - 37,079,681 36,997,248 871,913 37,869,161
Non-controlling interest acquired - - - - - - - - 950,019 950,019
Equity settled share based
payments - (2,052,237)* - - 2,573,839 - - 521,602 - 521,602
Transfer of equity portion of
convertible bond - - - - - (4,003,682) 4,003,682 - - -
Allotments during the period 27,851,846 142,693,022 - - - - - 170,544,868 - 170,544,868
Share issue costs - (7,319,257) - - - - - (7,319,257) - (7,319,257)
At 31 December 2009 61,370,914 346,219,465 (6,898,486) - 4,275,616 - (156,458,163) 248,509,346 11,410,995 259,920,341
*The fair value of warrants granted to brokers during the issue of new shares during the period, are charged against the share premium account as a direct cost of issuing shares and credited to the share-based payment reserve.
Page 15 of 31
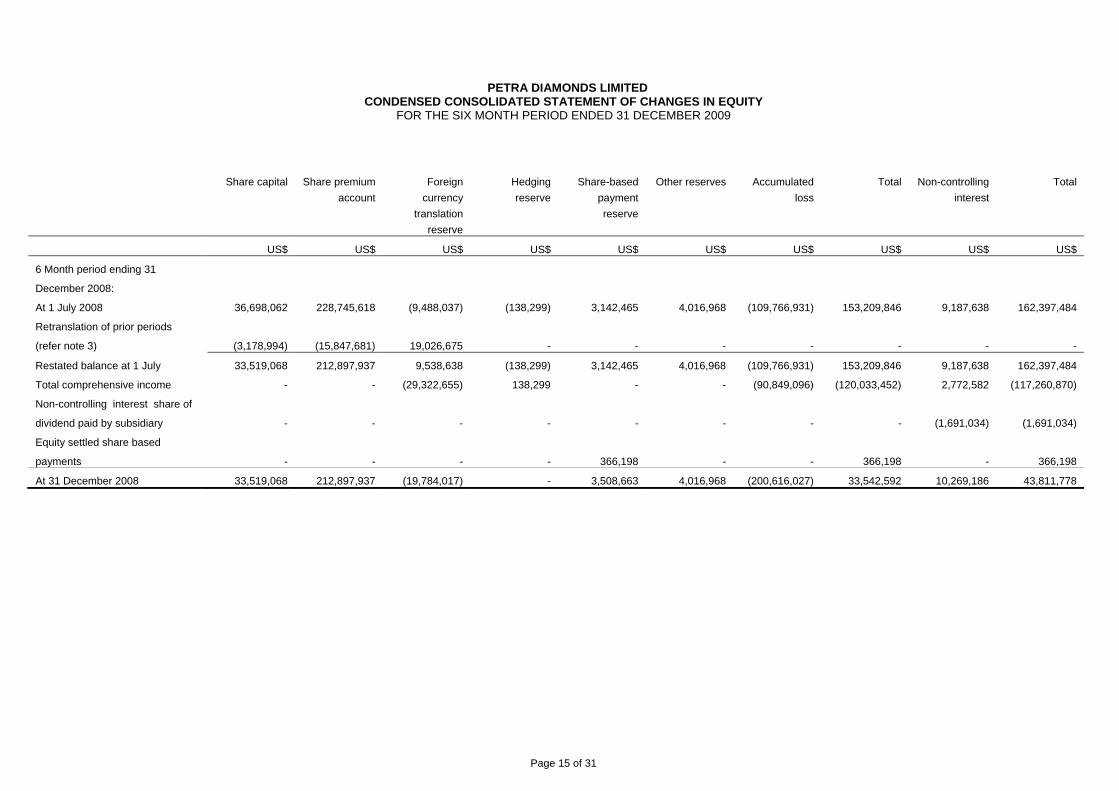
PETRA DIAMONDS LIMITED CONDENSED CONSOLIDATED STATEMENT OF CHANGES IN EQUITY
FOR THE SIX MONTH PERIOD ENDED 31 DECEMBER 2009
Share capital Share premium
account
Foreign
currency
translation
reserve
Hedging
reserve
Share-based
payment
reserve
Other reserves Accumulated
loss
Total Non-controlling
interest
Total
US$ US$ US$ US$ US$ US$ US$ US$ US$ US$
6 Month period ending 31
December 2008:
At 1 July 2008 36,698,062 228,745,618 (9,488,037) (138,299) 3,142,465 4,016,968 (109,766,931) 153,209,846 9,187,638 162,397,484
Retranslation of prior periods
(refer note 3) (3,178,994) (15,847,681) 19,026,675 - - - - - - -
Restated balance at 1 July 33,519,068 212,897,937 9,538,638 (138,299) 3,142,465 4,016,968 (109,766,931) 153,209,846 9,187,638 162,397,484
Total comprehensive income - - (29,322,655) 138,299 - - (90,849,096) (120,033,452) 2,772,582 (117,260,870)
Non-controlling interest share of
dividend paid by subsidiary - - - - - - - - (1,691,034) (1,691,034)
Equity settled share based
payments - - - - 366,198 - - 366,198 - 366,198
At 31 December 2008 33,519,068 212,897,937 (19,784,017) - 3,508,663 4,016,968 (200,616,027) 33,542,592 10,269,186 43,811,778
Page 16 of 31
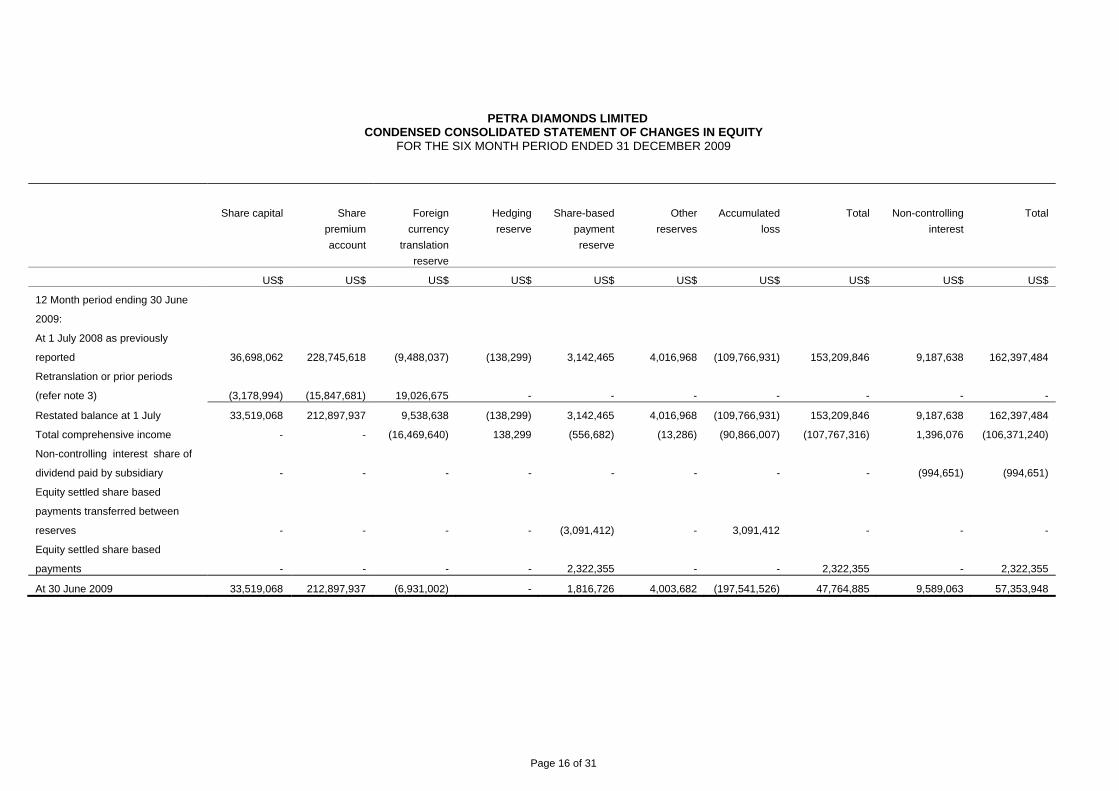
PETRA DIAMONDS LIMITED CONDENSED CONSOLIDATED STATEMENT OF CHANGES IN EQUITY
FOR THE SIX MONTH PERIOD ENDED 31 DECEMBER 2009
Share capital Share
premium
account
Foreign
currency
translation
reserve
Hedging
reserve
Share-based
payment
reserve
Other
reserves
Accumulated
loss
Total Non-controlling
interest
Total
US$ US$ US$ US$ US$ US$ US$ US$ US$ US$
12 Month period ending 30 June
2009:
At 1 July 2008 as previously
reported 36,698,062 228,745,618 (9,488,037) (138,299) 3,142,465 4,016,968 (109,766,931) 153,209,846 9,187,638 162,397,484
Retranslation or prior periods
(refer note 3) (3,178,994) (15,847,681) 19,026,675 - - - - - - -
Restated balance at 1 July 33,519,068 212,897,937 9,538,638 (138,299) 3,142,465 4,016,968 (109,766,931) 153,209,846 9,187,638 162,397,484
Total comprehensive income - - (16,469,640) 138,299 (556,682) (13,286) (90,866,007) (107,767,316) 1,396,076 (106,371,240)
Non-controlling interest share of
dividend paid by subsidiary - - - - - - - - (994,651) (994,651)
Equity settled share based
payments transferred between
reserves - - - - (3,091,412) - 3,091,412 - - -
Equity settled share based
payments - - - - 2,322,355 - - 2,322,355 - 2,322,355
At 30 June 2009 33,519,068 212,897,937 (6,931,002) - 1,816,726 4,003,682 (197,541,526) 47,764,885 9,589,063 57,353,948
Page 17 of 31
PETRA DIAMONDS LIMITED
CONDENSED CONSOLIDATED BALANCE SHEET FOR THE SIX MONTH PERIOD ENDED 31 DECEMBER 2009
(Unaudited)
31 December
2009
US$
(Unaudited)
31 December
2008
US$
30 June
2009
US$
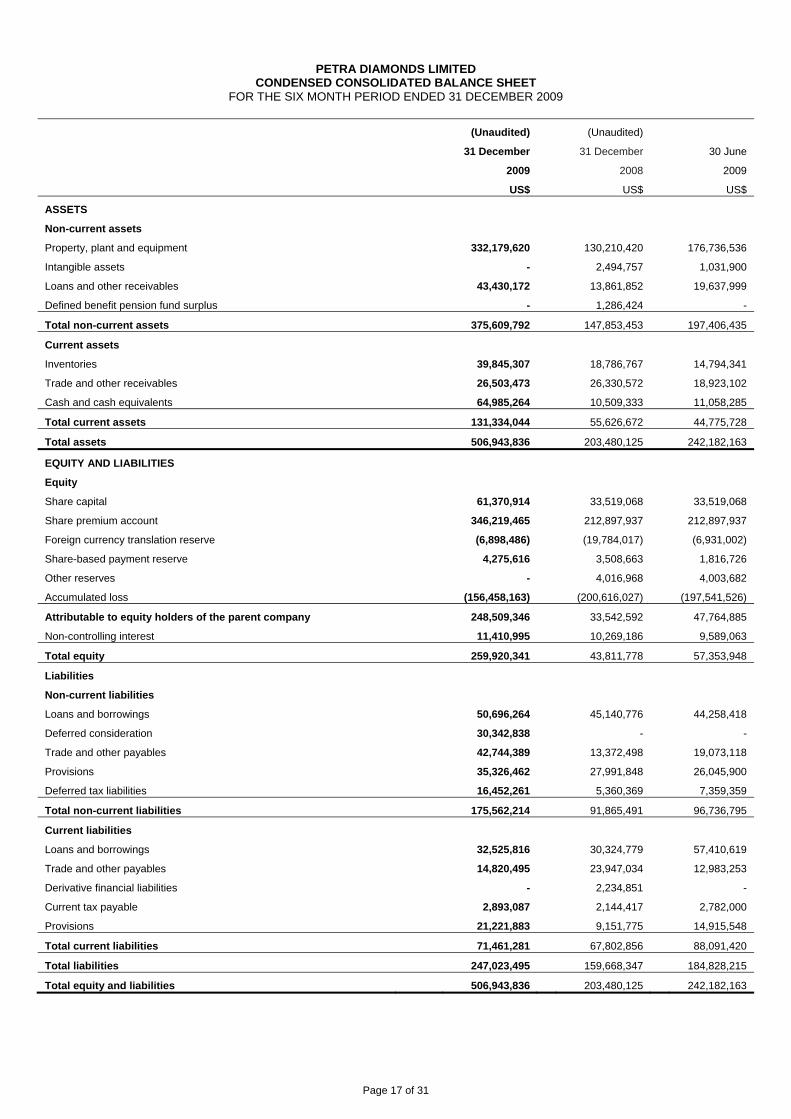
ASSETS
Non-current assets
Property, plant and equipment 332,179,620 130,210,420 176,736,536
Intangible assets - 2,494,757 1,031,900
Loans and other receivables 43,430,172 13,861,852 19,637,999
Defined benefit pension fund surplus - 1,286,424 -
Total non-current assets 375,609,792 147,853,453 197,406,435
Current assets
Inventories 39,845,307 18,786,767 14,794,341
Trade and other receivables 26,503,473 26,330,572 18,923,102
Cash and cash equivalents 64,985,264 10,509,333 11,058,285
Total current assets 131,334,044 55,626,672 44,775,728
Total assets 506,943,836 203,480,125 242,182,163
EQUITY AND LIABILITIES
Equity
Share capital 61,370,914 33,519,068 33,519,068
Share premium account 346,219,465 212,897,937 212,897,937
Foreign currency translation reserve (6,898,486) (19,784,017) (6,931,002)
Share-based payment reserve 4,275,616 3,508,663 1,816,726
Other reserves - 4,016,968 4,003,682
Accumulated loss (156,458,163) (200,616,027) (197,541,526)
Attributable to equity holders of the parent company 248,509,346 33,542,592 47,764,885
Non-controlling interest 11,410,995 10,269,186 9,589,063
Total equity 259,920,341 43,811,778 57,353,948
Liabilities
Non-current liabilities
Loans and borrowings 50,696,264 45,140,776 44,258,418
Deferred consideration 30,342,838 - -
Trade and other payables 42,744,389 13,372,498 19,073,118
Provisions 35,326,462 27,991,848 26,045,900
Deferred tax liabilities 16,452,261 5,360,369 7,359,359
Total non-current liabilities 175,562,214 91,865,491 96,736,795
Current liabilities
Loans and borrowings 32,525,816 30,324,779 57,410,619
Trade and other payables 14,820,495 23,947,034 12,983,253
Derivative financial liabilities - 2,234,851 -
Current tax payable 2,893,087 2,144,417 2,782,000
Provisions 21,221,883 9,151,775 14,915,548
Total current liabilities 71,461,281 67,802,856 88,091,420
Total liabilities 247,023,495 159,668,347 184,828,215
Total equity and liabilities 506,943,836 203,480,125 242,182,163
Page 18 of 31
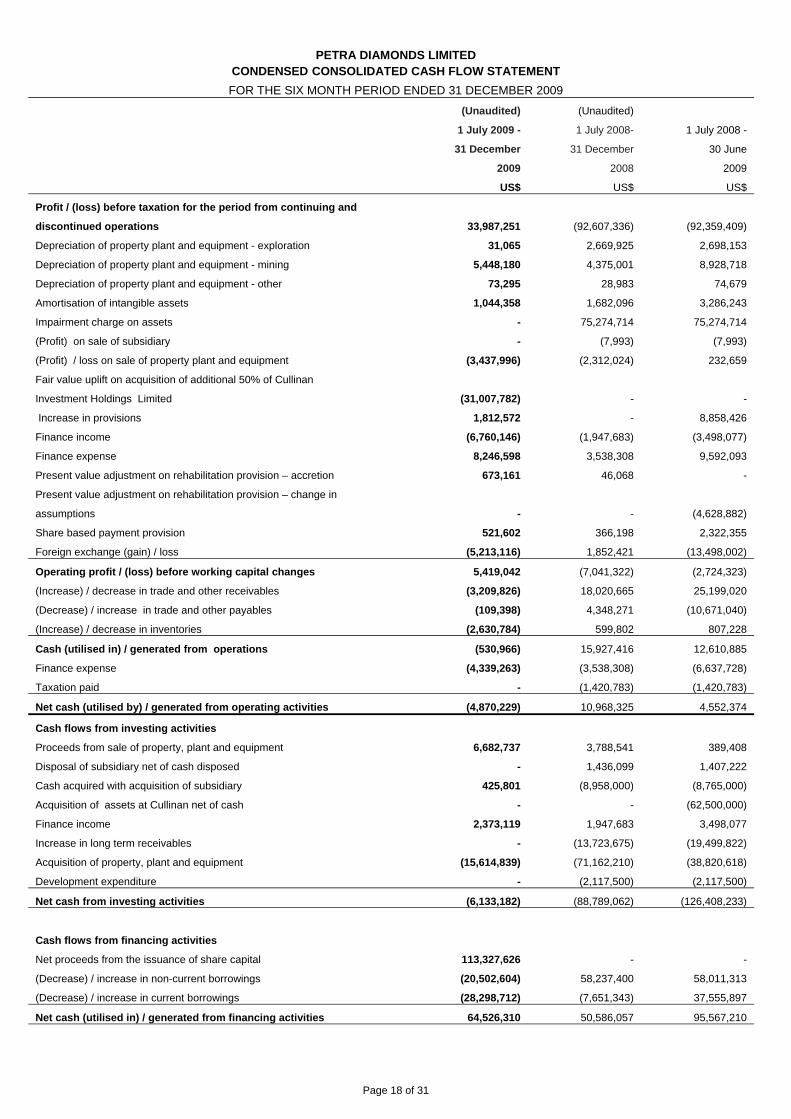
PETRA DIAMONDS LIMITED CONDENSED CONSOLIDATED CASH FLOW STATEMENT
FOR THE SIX MONTH PERIOD ENDED 31 DECEMBER 2009
(Unaudited)
1 July 2009 -
31 December
2009
US$
(Unaudited)
1 July 2008-
31 December
2008
US$
1 July 2008 -
30 June
2009
US$
Profit / (loss) before taxation for the period from continuing and
discontinued operations 33,987,251 (92,607,336) (92,359,409)
Depreciation of property plant and equipment - exploration 31,065 2,669,925 2,698,153
Depreciation of property plant and equipment - mining 5,448,180 4,375,001 8,928,718
Depreciation of property plant and equipment - other 73,295 28,983 74,679
Amortisation of intangible assets 1,044,358 1,682,096 3,286,243
Impairment charge on assets - 75,274,714 75,274,714
(Profit) on sale of subsidiary - (7,993) (7,993)
(Profit) / loss on sale of property plant and equipment (3,437,996) (2,312,024) 232,659
Fair value uplift on acquisition of additional 50% of Cullinan
Investment Holdings Limited (31,007,782) - -
Increase in provisions 1,812,572 - 8,858,426
Finance income (6,760,146) (1,947,683) (3,498,077)
Finance expense 8,246,598 3,538,308 9,592,093
Present value adjustment on rehabilitation provision – accretion 673,161 46,068 -
Present value adjustment on rehabilitation provision – change in
assumptions - - (4,628,882)
Share based payment provision 521,602 366,198 2,322,355
Foreign exchange (gain) / loss (5,213,116) 1,852,421 (13,498,002)
Operating profit / (loss) before working capital changes 5,419,042 (7,041,322) (2,724,323)
(Increase) / decrease in trade and other receivables (3,209,826) 18,020,665 25,199,020
(Decrease) / increase in trade and other payables (109,398) 4,348,271 (10,671,040)
(Increase) / decrease in inventories (2,630,784) 599,802 807,228
Cash (utilised in) / generated from operations (530,966) 15,927,416 12,610,885
Finance expense (4,339,263) (3,538,308) (6,637,728)
Taxation paid - (1,420,783) (1,420,783)
Net cash (utilised by) / generated from operating activities (4,870,229) 10,968,325 4,552,374
Cash flows from investing activities
Proceeds from sale of property, plant and equipment 6,682,737 3,788,541 389,408
Disposal of subsidiary net of cash disposed - 1,436,099 1,407,222
Cash acquired with acquisition of subsidiary 425,801 (8,958,000) (8,765,000)
Acquisition of assets at Cullinan net of cash - - (62,500,000)
Finance income 2,373,119 1,947,683 3,498,077
Increase in long term receivables - (13,723,675) (19,499,822)
Acquisition of property, plant and equipment (15,614,839) (71,162,210) (38,820,618)
Development expenditure - (2,117,500) (2,117,500)
Net cash from investing activities (6,133,182) (88,789,062) (126,408,233)
Cash flows from financing activities
Net proceeds from the issuance of share capital 113,327,626 - -
(Decrease) / increase in non-current borrowings (20,502,604) 58,237,400 58,011,313
(Decrease) / increase in current borrowings (28,298,712) (7,651,343) 37,555,897
Net cash (utilised in) / generated from financing activities 64,526,310 50,586,057 95,567,210
Page 19 of 31
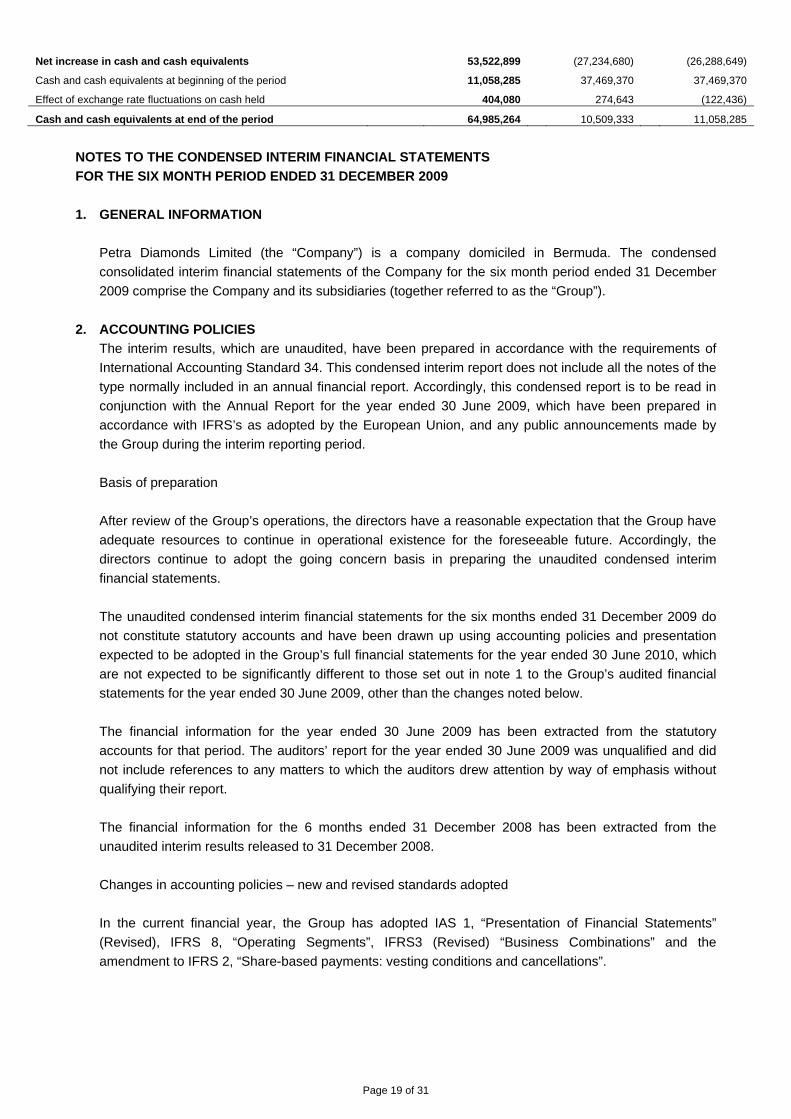
Net increase in cash and cash equivalents 53,522,899 (27,234,680) (26,288,649)
Cash and cash equivalents at beginning of the period 11,058,285 37,469,370 37,469,370
Effect of exchange rate fluctuations on cash held 404,080 274,643 (122,436)
Cash and cash equivalents at end of the period 64,985,264 10,509,333 11,058,285
NOTES TO THE CONDENSED INTERIM FINANCIAL STATEMENTS
FOR THE SIX MONTH PERIOD ENDED 31 DECEMBER 2009
1. GENERAL INFORMATION
Petra Diamonds Limited (the “Company”) is a company domiciled in Bermuda. The condensed
consolidated interim financial statements of the Company for the six month period ended 31 December
2009 comprise the Company and its subsidiaries (together referred to as the “Group”).
2. ACCOUNTING POLICIES
The interim results, which are unaudited, have been prepared in accordance with the requirements of
International Accounting Standard 34. This condensed interim report does not include all the notes of the
type normally included in an annual financial report. Accordingly, this condensed report is to be read in
conjunction with the Annual Report for the year ended 30 June 2009, which have been prepared in
accordance with IFRS’s as adopted by the European Union, and any public announcements made by
the Group during the interim reporting period.
Basis of preparation
After review of the Group’s operations, the directors have a reasonable expectation that the Group have
adequate resources to continue in operational existence for the foreseeable future. Accordingly, the
directors continue to adopt the going concern basis in preparing the unaudited condensed interim
financial statements.
The unaudited condensed interim financial statements for the six months ended 31 December 2009 do
not constitute statutory accounts and have been drawn up using accounting policies and presentation
expected to be adopted in the Group’s full financial statements for the year ended 30 June 2010, which
are not expected to be significantly different to those set out in note 1 to the Group’s audited financial
statements for the year ended 30 June 2009, other than the changes noted below.
The financial information for the year ended 30 June 2009 has been extracted from the statutory
accounts for that period. The auditors’ report for the year ended 30 June 2009 was unqualified and did
not include references to any matters to which the auditors drew attention by way of emphasis without
qualifying their report.
The financial information for the 6 months ended 31 December 2008 has been extracted from the
unaudited interim results released to 31 December 2008.
Changes in accounting policies – new and revised standards adopted
In the current financial year, the Group has adopted IAS 1, “Presentation of Financial Statements”
(Revised), IFRS 8, “Operating Segments”, IFRS3 (Revised) “Business Combinations” and the
amendment to IFRS 2, “Share-based payments: vesting conditions and cancellations”.
Page 20 of 31
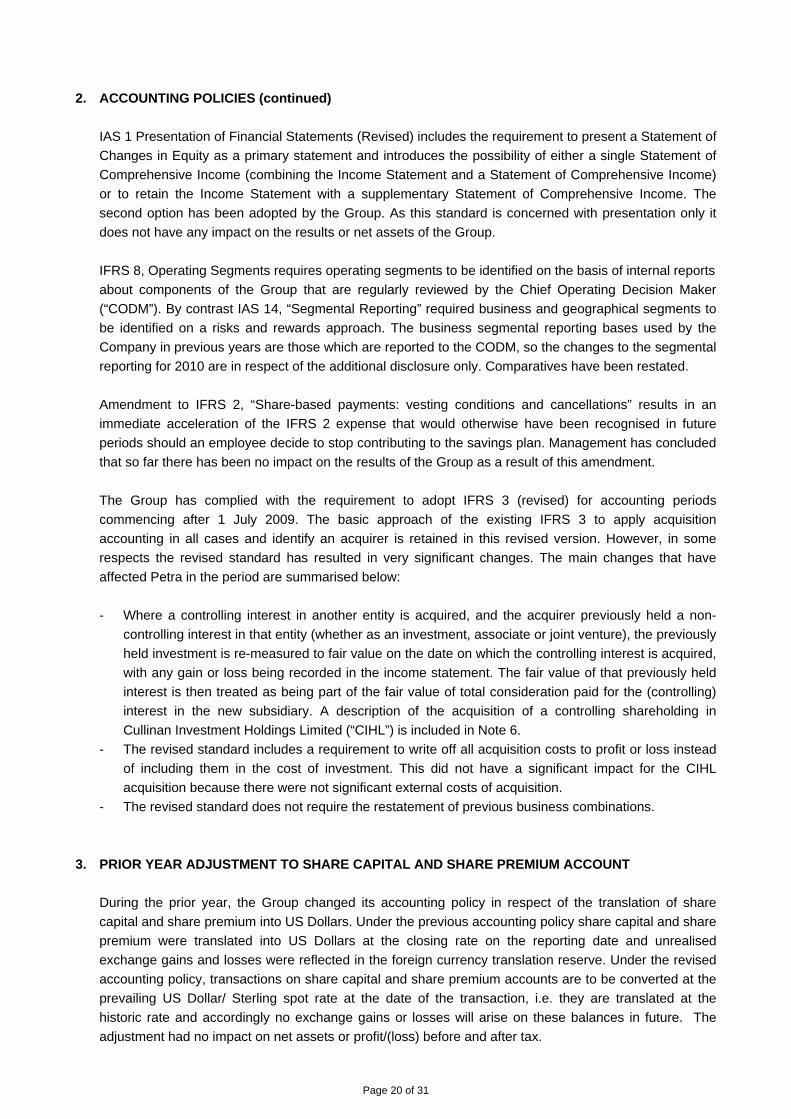
2. ACCOUNTING POLICIES (continued)
IAS 1 Presentation of Financial Statements (Revised) includes the requirement to present a Statement of
Changes in Equity as a primary statement and introduces the possibility of either a single Statement of
Comprehensive Income (combining the Income Statement and a Statement of Comprehensive Income)
or to retain the Income Statement with a supplementary Statement of Comprehensive Income. The
second option has been adopted by the Group. As this standard is concerned with presentation only it
does not have any impact on the results or net assets of the Group.
IFRS 8, Operating Segments requires operating segments to be identified on the basis of internal reports
about components of the Group that are regularly reviewed by the Chief Operating Decision Maker
(“CODM”). By contrast IAS 14, “Segmental Reporting” required business and geographical segments to
be identified on a risks and rewards approach. The business segmental reporting bases used by the
Company in previous years are those which are reported to the CODM, so the changes to the segmental
reporting for 2010 are in respect of the additional disclosure only. Comparatives have been restated.
Amendment to IFRS 2, “Share-based payments: vesting conditions and cancellations” results in an
immediate acceleration of the IFRS 2 expense that would otherwise have been recognised in future
periods should an employee decide to stop contributing to the savings plan. Management has concluded
that so far there has been no impact on the results of the Group as a result of this amendment.
The Group has complied with the requirement to adopt IFRS 3 (revised) for accounting periods
commencing after 1 July 2009. The basic approach of the existing IFRS 3 to apply acquisition
accounting in all cases and identify an acquirer is retained in this revised version. However, in some
respects the revised standard has resulted in very significant changes. The main changes that have
affected Petra in the period are summarised below:
- Where a controlling interest in another entity is acquired, and the acquirer previously held a non-
controlling interest in that entity (whether as an investment, associate or joint venture), the previously
held investment is re-measured to fair value on the date on which the controlling interest is acquired,
with any gain or loss being recorded in the income statement. The fair value of that previously held
interest is then treated as being part of the fair value of total consideration paid for the (controlling)
interest in the new subsidiary. A description of the acquisition of a controlling shareholding in
Cullinan Investment Holdings Limited (“CIHL”) is included in Note 6.
- The revised standard includes a requirement to write off all acquisition costs to profit or loss instead
of including them in the cost of investment. This did not have a significant impact for the CIHL
acquisition because there were not significant external costs of acquisition.
- The revised standard does not require the restatement of previous business combinations.
3. PRIOR YEAR ADJUSTMENT TO SHARE CAPITAL AND SHARE PREMIUM ACCOUNT
During the prior year, the Group changed its accounting policy in respect of the translation of share
capital and share premium into US Dollars. Under the previous accounting policy share capital and share
premium were translated into US Dollars at the closing rate on the reporting date and unrealised
exchange gains and losses were reflected in the foreign currency translation reserve. Under the revised
accounting policy, transactions on share capital and share premium accounts are to be converted at the
prevailing US Dollar/ Sterling spot rate at the date of the transaction, i.e. they are translated at the
historic rate and accordingly no exchange gains or losses will arise on these balances in future. The
adjustment had no impact on net assets or profit/(loss) before and after tax.
Page 21 of 31
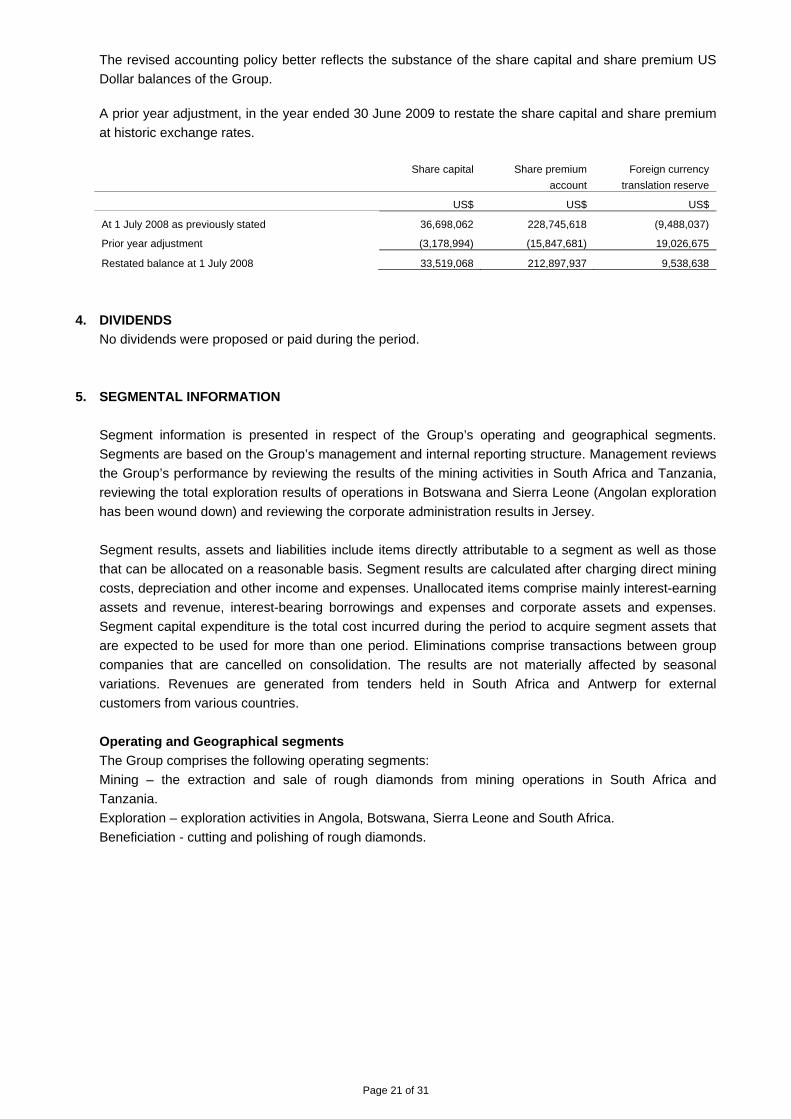
The revised accounting policy better reflects the substance of the share capital and share premium US
Dollar balances of the Group.
A prior year adjustment, in the year ended 30 June 2009 to restate the share capital and share premium
at historic exchange rates.
Share capital Share premium
account
Foreign currency
translation reserve
US$ US$ US$
At 1 July 2008 as previously stated 36,698,062 228,745,618 (9,488,037)
Prior year adjustment (3,178,994) (15,847,681) 19,026,675
Restated balance at 1 July 2008 33,519,068 212,897,937 9,538,638
4. DIVIDENDS
No dividends were proposed or paid during the period.
5. SEGMENTAL INFORMATION
Segment information is presented in respect of the Group’s operating and geographical segments.
Segments are based on the Group’s management and internal reporting structure. Management reviews
the Group’s performance by reviewing the results of the mining activities in South Africa and Tanzania,
reviewing the total exploration results of operations in Botswana and Sierra Leone (Angolan exploration
has been wound down) and reviewing the corporate administration results in Jersey.
Segment results, assets and liabilities include items directly attributable to a segment as well as those
that can be allocated on a reasonable basis. Segment results are calculated after charging direct mining
costs, depreciation and other income and expenses. Unallocated items comprise mainly interest-earning
assets and revenue, interest-bearing borrowings and expenses and corporate assets and expenses.
Segment capital expenditure is the total cost incurred during the period to acquire segment assets that
are expected to be used for more than one period. Eliminations comprise transactions between group
companies that are cancelled on consolidation. The results are not materially affected by seasonal
variations. Revenues are generated from tenders held in South Africa and Antwerp for external
customers from various countries.
Operating and Geographical segments
The Group comprises the following operating segments:
Mining – the extraction and sale of rough diamonds from mining operations in South Africa and
Tanzania.
Exploration – exploration activities in Angola, Botswana, Sierra Leone and South Africa.
Beneficiation - cutting and polishing of rough diamonds.
Page 22 of 31
Operating segments South Africa – Mining activities Tanzania
Mining
activities
Angola,
Botswana,
Sierra Leone
Jersey South Africa
Cullinan
mine
Koffiefontein
mine
Kimberley
Undergound
mine
Fissure
mines
Williamson
mine
Exploration Corporate
administration
Beneficiation Inter-segment Consolidated
(6 month period ended
31 December 2009)
1 July 2009 -
31 December
2009
US$
1 July 2009 -
31 December
2009
US$
1 July 2009 -
31 December
2009
US$
1 July 2009 -
31 December
2009
US$
1 July 2009 -
31 December
2009
US$
1 July 2009 -
31 December
2009
US$
1 July 2009 -
31 December
2009
US$
1 July 2009 -
31 December
2009
US$
1 July 2009 -
31 December
2009
US$
1 July 2009 -
31 December
2009
US$
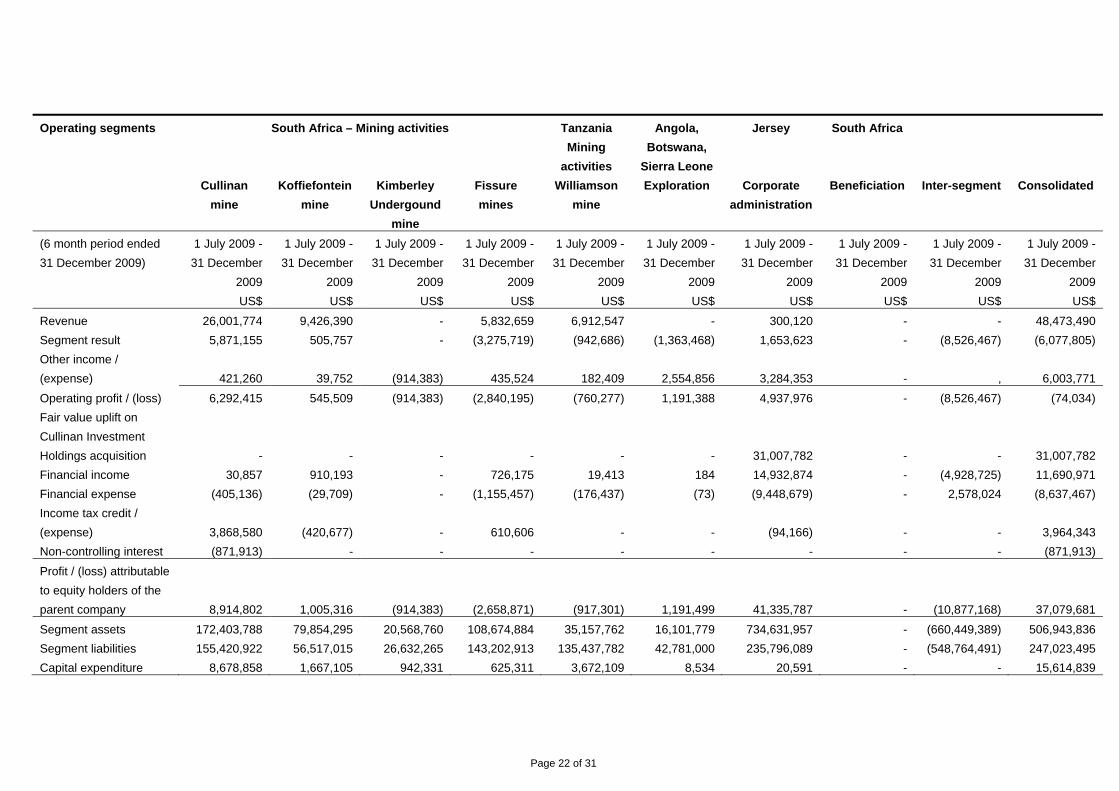
Revenue 26,001,774 9,426,390 - 5,832,659 6,912,547 - 300,120 - - 48,473,490
Segment result 5,871,155 505,757 - (3,275,719) (942,686) (1,363,468) 1,653,623 - (8,526,467) (6,077,805)
Other income /
(expense) 421,260 39,752 (914,383) 435,524 182,409 2,554,856 3,284,353 - , 6,003,771
Operating profit / (loss) 6,292,415 545,509 (914,383) (2,840,195) (760,277) 1,191,388 4,937,976 - (8,526,467) (74,034)
Fair value uplift on
Cullinan Investment
Holdings acquisition - - - - - - 31,007,782 - - 31,007,782
Financial income 30,857 910,193 - 726,175 19,413 184 14,932,874 - (4,928,725) 11,690,971
Financial expense (405,136) (29,709) - (1,155,457) (176,437) (73) (9,448,679) - 2,578,024 (8,637,467)
Income tax credit /
(expense) 3,868,580 (420,677) - 610,606 - - (94,166) - - 3,964,343
Non-controlling interest (871,913) - - - - - - - - (871,913)
Profit / (loss) attributable
to equity holders of the
parent company 8,914,802 1,005,316 (914,383) (2,658,871) (917,301) 1,191,499 41,335,787 - (10,877,168) 37,079,681
Segment assets 172,403,788 79,854,295 20,568,760 108,674,884 35,157,762 16,101,779 734,631,957 - (660,449,389) 506,943,836
Segment liabilities 155,420,922 56,517,015 26,632,265 143,202,913 135,437,782 42,781,000 235,796,089 - (548,764,491) 247,023,495
Capital expenditure 8,678,858 1,667,105 942,331 625,311 3,672,109 8,534 20,591 - - 15,614,839
Page 23 of 31
Operating segments South Africa – Mining activities Tanzania
Mining
activities
Angola,
Botswana,
Sierra Leone
Jersey South Africa
Cullinan
mine
Koffiefontein
mine
Kimberley
Undergound
mine
Fissure
mines
Williamson
mine
Exploration Corporate
administration
Beneficiation Inter-segment Consolidated
(6 month period ended 31
December 2008)
1 July 2008
-
31
December
2008
US$
1 July 2008 -
31 December
2008
US$
1 July 2008 -
31 December
2008
US$
1 July 2008 -
31 December
2008
US$
1 July 2008 -
31 December
2008
US$
1 July 2008 -
31 December
2008
US$
1 July 2008 -
31 December
2008
US$
1 July 2008 -
31 December
2008
US$
1 July 2008 -
31 December
2008
US$
1 July 2008 -
31 December
2008
US$
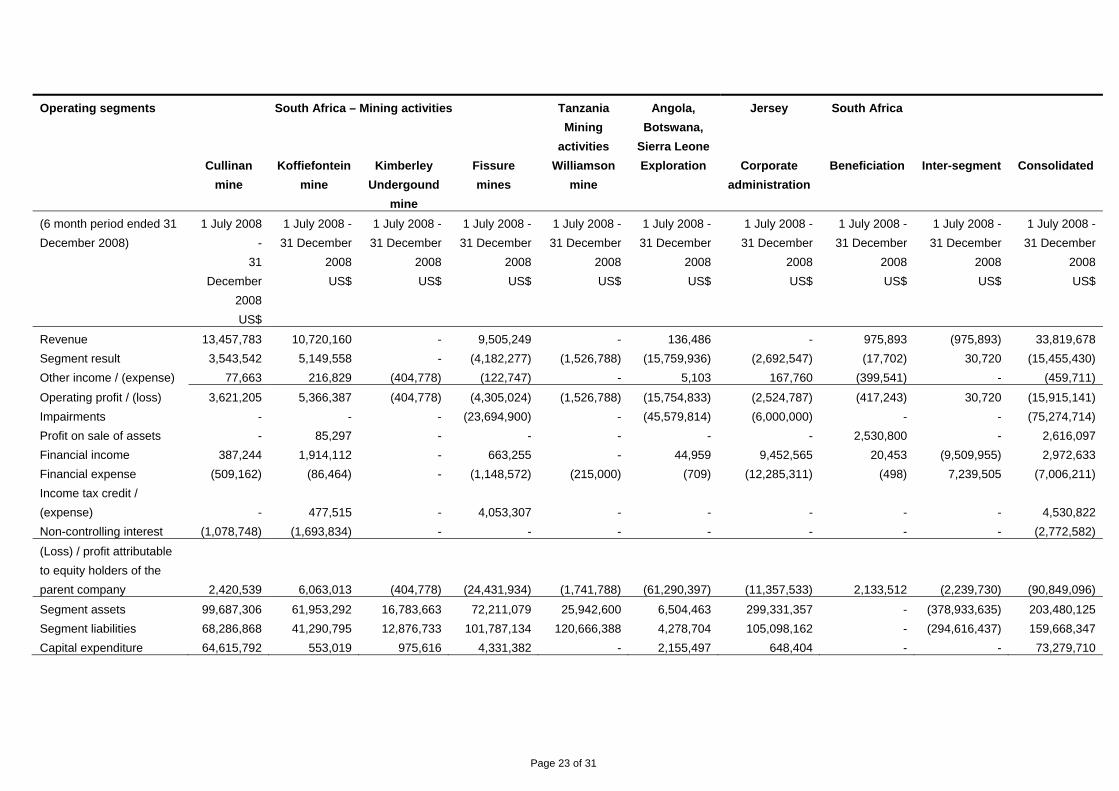
Revenue 13,457,783 10,720,160 - 9,505,249 - 136,486 - 975,893 (975,893) 33,819,678
Segment result 3,543,542 5,149,558 - (4,182,277) (1,526,788) (15,759,936) (2,692,547) (17,702) 30,720 (15,455,430)
Other income / (expense) 77,663 216,829 (404,778) (122,747) - 5,103 167,760 (399,541) - (459,711)
Operating profit / (loss) 3,621,205 5,366,387 (404,778) (4,305,024) (1,526,788) (15,754,833) (2,524,787) (417,243) 30,720 (15,915,141)
Impairments - - - (23,694,900) - (45,579,814) (6,000,000) - - (75,274,714)
Profit on sale of assets - 85,297 - - - - - 2,530,800 - 2,616,097
Financial income 387,244 1,914,112 - 663,255 - 44,959 9,452,565 20,453 (9,509,955) 2,972,633
Financial expense (509,162) (86,464) - (1,148,572) (215,000) (709) (12,285,311) (498) 7,239,505 (7,006,211)
Income tax credit /
(expense) - 477,515 - 4,053,307 - - - - - 4,530,822
Non-controlling interest (1,078,748) (1,693,834) - - - - - - - (2,772,582)
(Loss) / profit attributable
to equity holders of the
parent company 2,420,539 6,063,013 (404,778) (24,431,934) (1,741,788) (61,290,397) (11,357,533) 2,133,512 (2,239,730) (90,849,096)
Segment assets 99,687,306 61,953,292 16,783,663 72,211,079 25,942,600 6,504,463 299,331,357 - (378,933,635) 203,480,125
Segment liabilities 68,286,868 41,290,795 12,876,733 101,787,134 120,666,388 4,278,704 105,098,162 - (294,616,437) 159,668,347
Capital expenditure 64,615,792 553,019 975,616 4,331,382 - 2,155,497 648,404 - - 73,279,710
Page 24 of 31
Operating segments South Africa – Mining activities Tanzania
Mining
activities
Angola,
Botswana,
Sierra Leone
Jersey South Africa
Cullinan
mine
Koffiefontein
mine
Kimberley
Undergound
mine
Fissure
mines
Williamson
mine
Exploration Corporate
administration
Beneficiation Inter-segment Consolidated
(full year ended 30 June
2009)
2009
US$
2009
US$
2009
US$
2009
US$
2009
US$
2009
US$
2009
US$
2009
US$
2009
US$
2009
US$
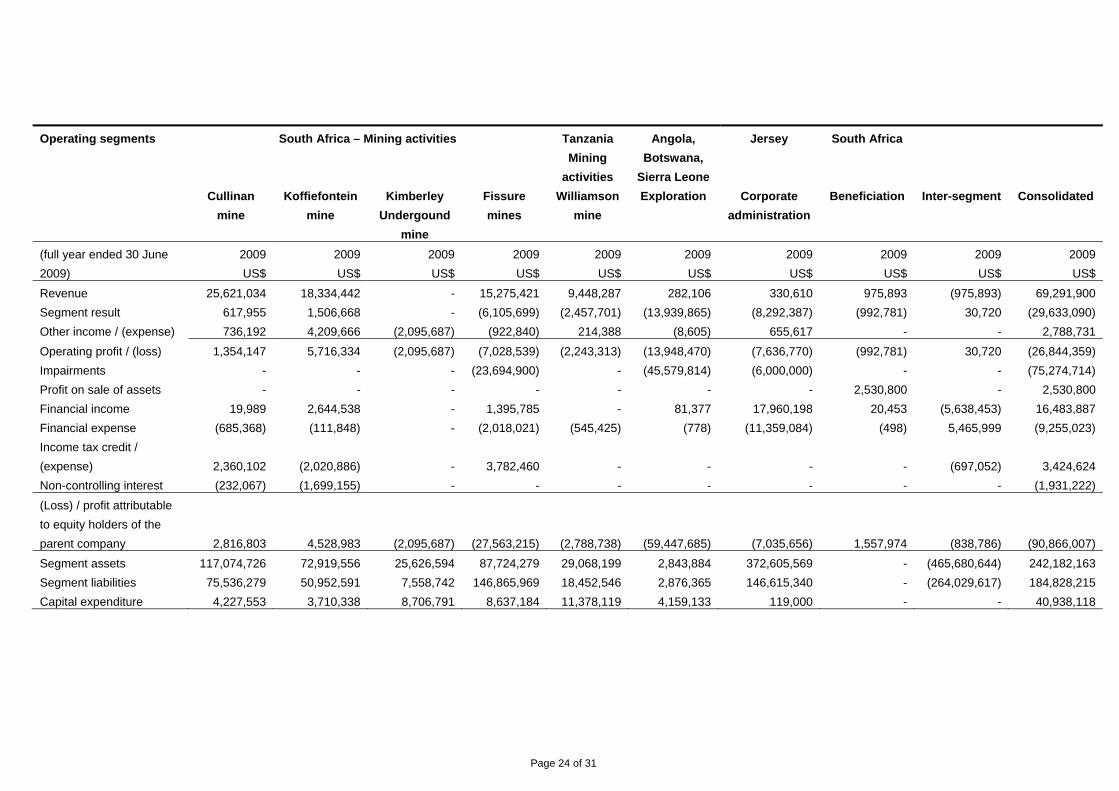
Revenue 25,621,034 18,334,442 - 15,275,421 9,448,287 282,106 330,610 975,893 (975,893) 69,291,900
Segment result 617,955 1,506,668 - (6,105,699) (2,457,701) (13,939,865) (8,292,387) (992,781) 30,720 (29,633,090)
Other income / (expense) 736,192 4,209,666 (2,095,687) (922,840) 214,388 (8,605) 655,617 - - 2,788,731
Operating profit / (loss) 1,354,147 5,716,334 (2,095,687) (7,028,539) (2,243,313) (13,948,470) (7,636,770) (992,781) 30,720 (26,844,359)
Impairments - - - (23,694,900) - (45,579,814) (6,000,000) - - (75,274,714)
Profit on sale of assets - - - - - - - 2,530,800 - 2,530,800
Financial income 19,989 2,644,538 - 1,395,785 - 81,377 17,960,198 20,453 (5,638,453) 16,483,887
Financial expense (685,368) (111,848) - (2,018,021) (545,425) (778) (11,359,084) (498) 5,465,999 (9,255,023)
Income tax credit /
(expense) 2,360,102 (2,020,886) - 3,782,460 - - - - (697,052) 3,424,624
Non-controlling interest (232,067) (1,699,155) - - - - - - - (1,931,222)
(Loss) / profit attributable
to equity holders of the
parent company 2,816,803 4,528,983 (2,095,687) (27,563,215) (2,788,738) (59,447,685) (7,035,656) 1,557,974 (838,786) (90,866,007)
Segment assets 117,074,726 72,919,556 25,626,594 87,724,279 29,068,199 2,843,884 372,605,569 - (465,680,644) 242,182,163
Segment liabilities 75,536,279 50,952,591 7,558,742 146,865,969 18,452,546 2,876,365 146,615,340 - (264,029,617) 184,828,215
Capital expenditure 4,227,553 3,710,338 8,706,791 8,637,184 11,378,119 4,159,133 119,000 - - 40,938,118
Page 25 of 31
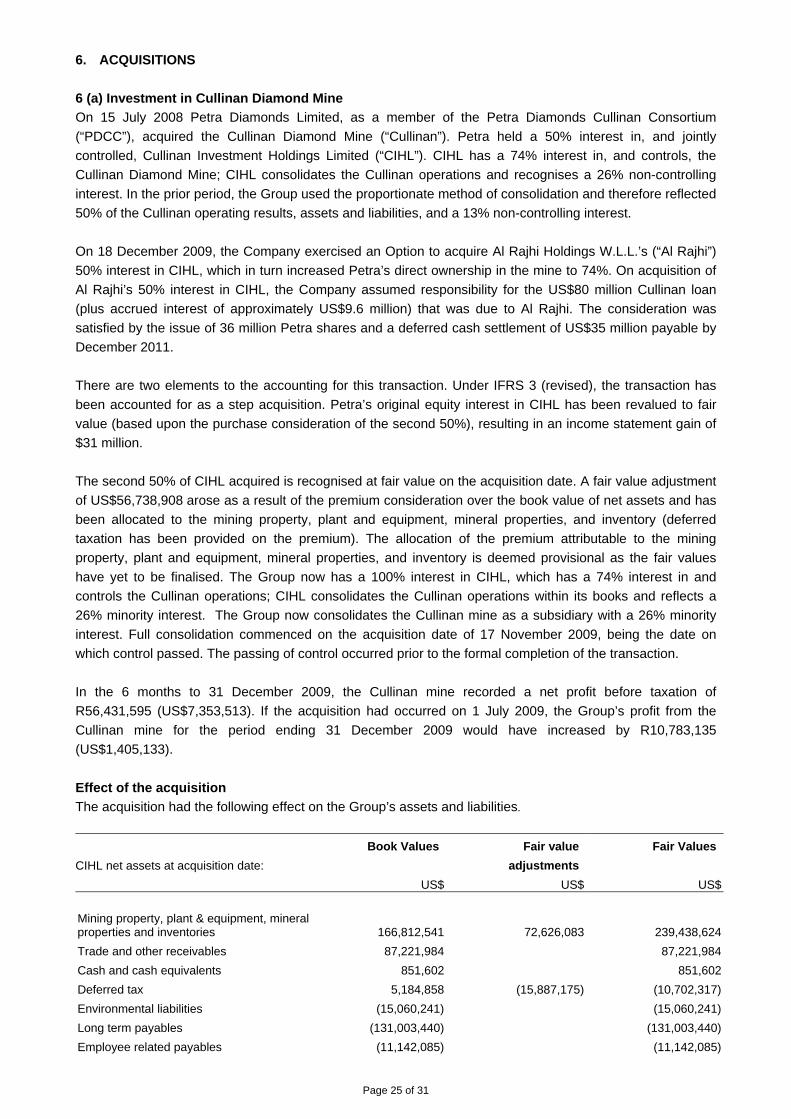
6. ACQUISITIONS
6 (a) Investment in Cullinan Diamond Mine
On 15 July 2008 Petra Diamonds Limited, as a member of the Petra Diamonds Cullinan Consortium
(“PDCC”), acquired the Cullinan Diamond Mine (“Cullinan”). Petra held a 50% interest in, and jointly
controlled, Cullinan Investment Holdings Limited (“CIHL”). CIHL has a 74% interest in, and controls, the
Cullinan Diamond Mine; CIHL consolidates the Cullinan operations and recognises a 26% non-controlling
interest. In the prior period, the Group used the proportionate method of consolidation and therefore reflected
50% of the Cullinan operating results, assets and liabilities, and a 13% non-controlling interest.
On 18 December 2009, the Company exercised an Option to acquire Al Rajhi Holdings W.L.L.’s (“Al Rajhi”)
50% interest in CIHL, which in turn increased Petra’s direct ownership in the mine to 74%. On acquisition of
Al Rajhi’s 50% interest in CIHL, the Company assumed responsibility for the US$80 million Cullinan loan
(plus accrued interest of approximately US$9.6 million) that was due to Al Rajhi. The consideration was
satisfied by the issue of 36 million Petra shares and a deferred cash settlement of US$35 million payable by
December 2011.
There are two elements to the accounting for this transaction. Under IFRS 3 (revised), the transaction has
been accounted for as a step acquisition. Petra’s original equity interest in CIHL has been revalued to fair
value (based upon the purchase consideration of the second 50%), resulting in an income statement gain of
$31 million.
The second 50% of CIHL acquired is recognised at fair value on the acquisition date. A fair value adjustment
of US$56,738,908 arose as a result of the premium consideration over the book value of net assets and has
been allocated to the mining property, plant and equipment, mineral properties, and inventory (deferred
taxation has been provided on the premium). The allocation of the premium attributable to the mining
property, plant and equipment, mineral properties, and inventory is deemed provisional as the fair values
have yet to be finalised. The Group now has a 100% interest in CIHL, which has a 74% interest in and
controls the Cullinan operations; CIHL consolidates the Cullinan operations within its books and reflects a
26% minority interest. The Group now consolidates the Cullinan mine as a subsidiary with a 26% minority
interest. Full consolidation commenced on the acquisition date of 17 November 2009, being the date on
which control passed. The passing of control occurred prior to the formal completion of the transaction.
In the 6 months to 31 December 2009, the Cullinan mine recorded a net profit before taxation of
R56,431,595 (US$7,353,513). If the acquisition had occurred on 1 July 2009, the Group’s profit from the
Cullinan mine for the period ending 31 December 2009 would have increased by R10,783,135
(US$1,405,133).
Effect of the acquisition
The acquisition had the following effect on the Group’s assets and liabilities.
CIHL net assets at acquisition date:
Book Values Fair value
adjustments
Fair Values
US$ US$ US$
Mining property, plant & equipment, mineral properties and inventories 166,812,541 72,626,083 239,438,624
Trade and other receivables 87,221,984 87,221,984
Cash and cash equivalents 851,602 851,602
Deferred tax 5,184,858 (15,887,175) (10,702,317)
Environmental liabilities (15,060,241) (15,060,241)
Long term payables (131,003,440) (131,003,440)
Employee related payables (11,142,085) (11,142,085)
Page 26 of 31
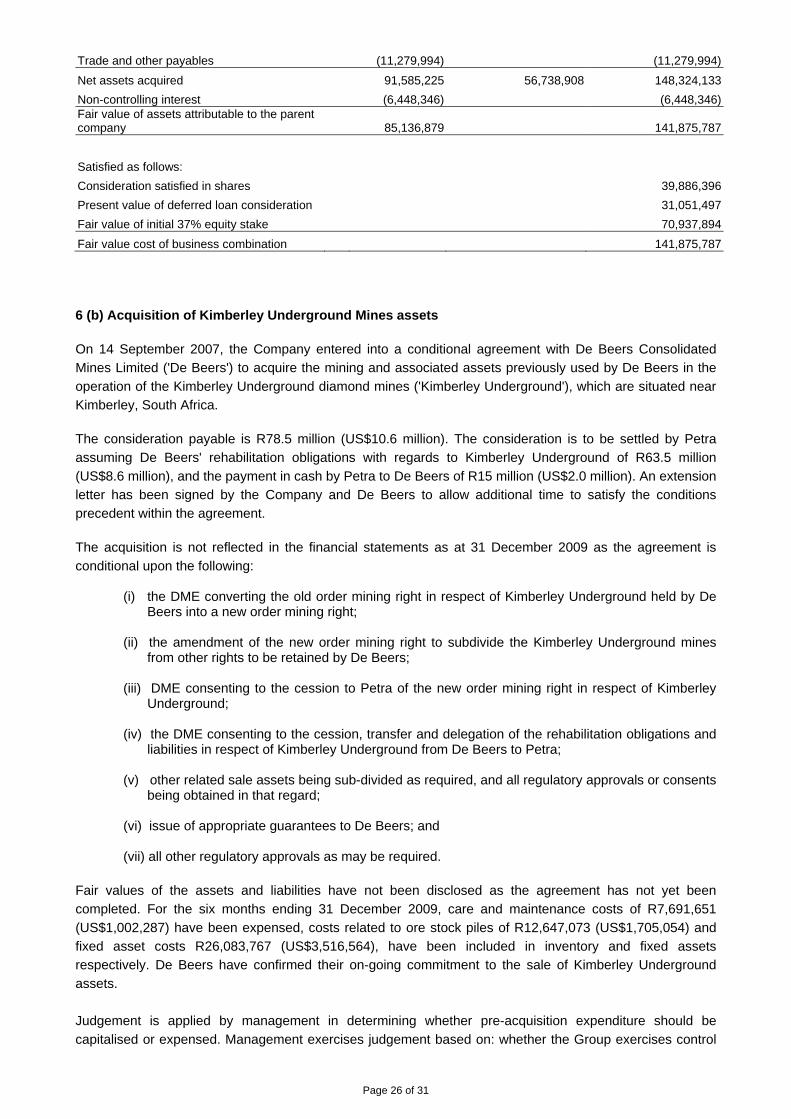
Trade and other payables (11,279,994) (11,279,994)
Net assets acquired 91,585,225 56,738,908 148,324,133
Non-controlling interest (6,448,346) (6,448,346)Fair value of assets attributable to the parent company 85,136,879 141,875,787
Satisfied as follows:
Consideration satisfied in shares 39,886,396
Present value of deferred loan consideration 31,051,497
Fair value of initial 37% equity stake 70,937,894
Fair value cost of business combination 141,875,787
6 (b) Acquisition of Kimberley Underground Mines assets
On 14 September 2007, the Company entered into a conditional agreement with De Beers Consolidated
Mines Limited ('De Beers') to acquire the mining and associated assets previously used by De Beers in the
operation of the Kimberley Underground diamond mines ('Kimberley Underground'), which are situated near
Kimberley, South Africa.
The consideration payable is R78.5 million (US$10.6 million). The consideration is to be settled by Petra
assuming De Beers' rehabilitation obligations with regards to Kimberley Underground of R63.5 million
(US$8.6 million), and the payment in cash by Petra to De Beers of R15 million (US$2.0 million). An extension
letter has been signed by the Company and De Beers to allow additional time to satisfy the conditions
precedent within the agreement.
The acquisition is not reflected in the financial statements as at 31 December 2009 as the agreement is
conditional upon the following:
(i) the DME converting the old order mining right in respect of Kimberley Underground held by De Beers into a new order mining right;
(ii) the amendment of the new order mining right to subdivide the Kimberley Underground mines
from other rights to be retained by De Beers; (iii) DME consenting to the cession to Petra of the new order mining right in respect of Kimberley
Underground; (iv) the DME consenting to the cession, transfer and delegation of the rehabilitation obligations and
liabilities in respect of Kimberley Underground from De Beers to Petra; (v) other related sale assets being sub-divided as required, and all regulatory approvals or consents
being obtained in that regard; (vi) issue of appropriate guarantees to De Beers; and (vii) all other regulatory approvals as may be required.
Fair values of the assets and liabilities have not been disclosed as the agreement has not yet been
completed. For the six months ending 31 December 2009, care and maintenance costs of R7,691,651
(US$1,002,287) have been expensed, costs related to ore stock piles of R12,647,073 (US$1,705,054) and
fixed asset costs R26,083,767 (US$3,516,564), have been included in inventory and fixed assets
respectively. De Beers have confirmed their on-going commitment to the sale of Kimberley Underground
assets.
Judgement is applied by management in determining whether pre-acquisition expenditure should be
capitalised or expensed. Management exercises judgement based on: whether the Group exercises control
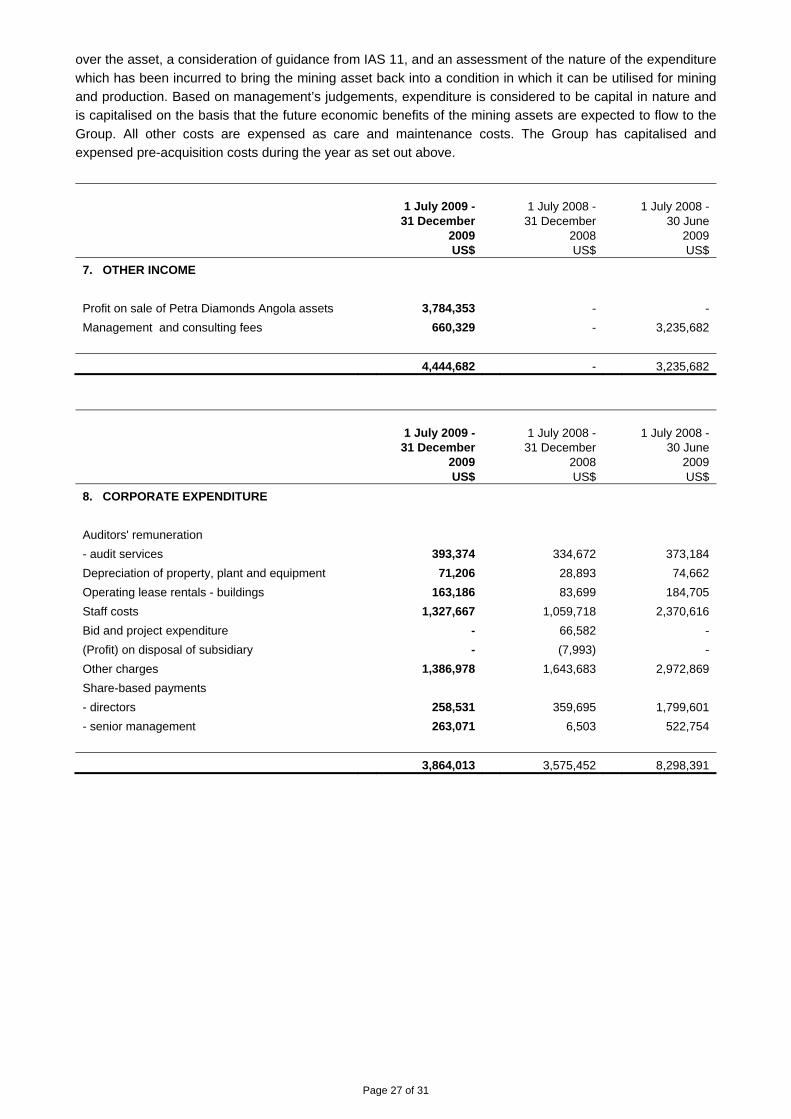
Page 27 of 31
over the asset, a consideration of guidance from IAS 11, and an assessment of the nature of the expenditure
which has been incurred to bring the mining asset back into a condition in which it can be utilised for mining
and production. Based on management’s judgements, expenditure is considered to be capital in nature and
is capitalised on the basis that the future economic benefits of the mining assets are expected to flow to the
Group. All other costs are expensed as care and maintenance costs. The Group has capitalised and
expensed pre-acquisition costs during the year as set out above.
1 July 2009 -
31 December 2009 US$
1 July 2008 - 31 December
2008 US$
1 July 2008 -
30 June 2009 US$
7. OTHER INCOME
Profit on sale of Petra Diamonds Angola assets 3,784,353 - -
Management and consulting fees 660,329 - 3,235,682
4,444,682 - 3,235,682
1 July 2009 -
31 December 2009 US$
1 July 2008 - 31 December
2008 US$
1 July 2008 -
30 June 2009 US$
8. CORPORATE EXPENDITURE
Auditors' remuneration
- audit services 393,374 334,672 373,184
Depreciation of property, plant and equipment 71,206 28,893 74,662
Operating lease rentals - buildings 163,186 83,699 184,705
Staff costs 1,327,667 1,059,718 2,370,616
Bid and project expenditure - 66,582 -
(Profit) on disposal of subsidiary - (7,993) -
Other charges 1,386,978 1,643,683 2,972,869
Share-based payments
- directors 258,531 359,695 1,799,601
- senior management 263,071 6,503 522,754
3,864,013 3,575,452 8,298,391
Page 28 of 31
1 July 2009 - 31 December
2009 US$
1 July 2008 - 31 December
2008 US$
1 July 2008 - 30 June
2009 US$
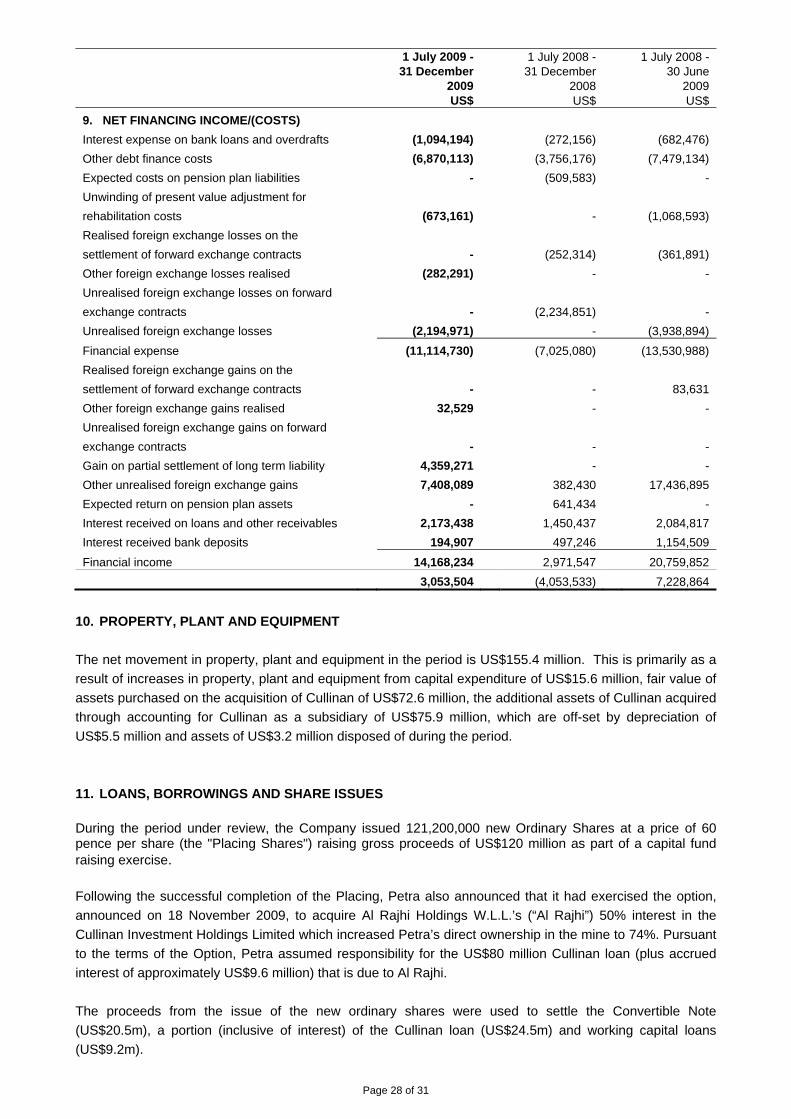
9. NET FINANCING INCOME/(COSTS)
Interest expense on bank loans and overdrafts (1,094,194) (272,156) (682,476)
Other debt finance costs (6,870,113) (3,756,176) (7,479,134)
Expected costs on pension plan liabilities - (509,583) -
Unwinding of present value adjustment for
rehabilitation costs
(673,161) - (1,068,593)
Realised foreign exchange losses on the
settlement of forward exchange contracts
- (252,314) (361,891)
Other foreign exchange losses realised (282,291) - -
Unrealised foreign exchange losses on forward
exchange contracts
- (2,234,851) -
Unrealised foreign exchange losses (2,194,971) - (3,938,894)
Financial expense (11,114,730) (7,025,080) (13,530,988)
Realised foreign exchange gains on the
settlement of forward exchange contracts
- - 83,631
Other foreign exchange gains realised 32,529 - -
Unrealised foreign exchange gains on forward
exchange contracts
- - -
Gain on partial settlement of long term liability 4,359,271 - -
Other unrealised foreign exchange gains 7,408,089 382,430 17,436,895
Expected return on pension plan assets - 641,434 -
Interest received on loans and other receivables 2,173,438 1,450,437 2,084,817
Interest received bank deposits 194,907 497,246 1,154,509
Financial income 14,168,234 2,971,547 20,759,852
3,053,504 (4,053,533) 7,228,864
10. PROPERTY, PLANT AND EQUIPMENT
The net movement in property, plant and equipment in the period is US$155.4 million. This is primarily as a
result of increases in property, plant and equipment from capital expenditure of US$15.6 million, fair value of
assets purchased on the acquisition of Cullinan of US$72.6 million, the additional assets of Cullinan acquired
through accounting for Cullinan as a subsidiary of US$75.9 million, which are off-set by depreciation of
US$5.5 million and assets of US$3.2 million disposed of during the period.
11. LOANS, BORROWINGS AND SHARE ISSUES
During the period under review, the Company issued 121,200,000 new Ordinary Shares at a price of 60 pence per share (the "Placing Shares") raising gross proceeds of US$120 million as part of a capital fund raising exercise. Following the successful completion of the Placing, Petra also announced that it had exercised the option,
announced on 18 November 2009, to acquire Al Rajhi Holdings W.L.L.’s (“Al Rajhi”) 50% interest in the
Cullinan Investment Holdings Limited which increased Petra’s direct ownership in the mine to 74%. Pursuant
to the terms of the Option, Petra assumed responsibility for the US$80 million Cullinan loan (plus accrued
interest of approximately US$9.6 million) that is due to Al Rajhi.
The proceeds from the issue of the new ordinary shares were used to settle the Convertible Note
(US$20.5m), a portion (inclusive of interest) of the Cullinan loan (US$24.5m) and working capital loans
(US$9.2m).

Page 29 of 31
Petra issued an additional 47,363,636 new Ordinary Shares to Al Rajhi, being 36 million shares in respect of
the part consideration for the 50% interest in Cullinan Investment Holdings Limited and 11,363,636 shares to
pay down US$15 million (based on a value agreed between Petra and Al Rajhi of 80 pence per Ordinary
Share) of the Cullinan loan that has been assumed by Petra.
Page 30 of 31
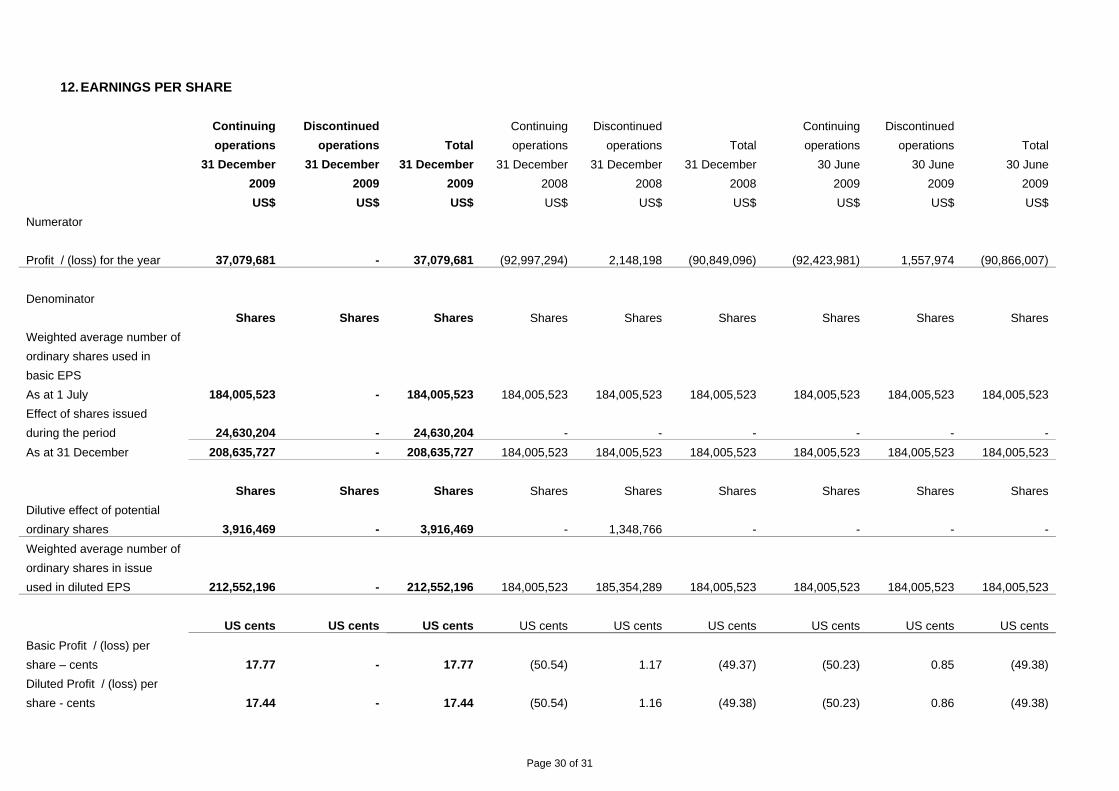
12. EARNINGS PER SHARE
Continuing
operations
31 December
2009
US$
Discontinued
operations
31 December
2009
US$
Total
31 December
2009
US$
Continuing
operations
31 December
2008
US$
Discontinued
operations
31 December
2008
US$
Total
31 December
2008
US$
Continuing
operations
30 June
2009
US$
Discontinued
operations
30 June
2009
US$
Total
30 June
2009
US$
Numerator
Profit / (loss) for the year 37,079,681 - 37,079,681 (92,997,294) 2,148,198 (90,849,096) (92,423,981) 1,557,974 (90,866,007)
Denominator
Shares Shares Shares Shares Shares Shares Shares Shares Shares
Weighted average number of
ordinary shares used in
basic EPS
As at 1 July 184,005,523 - 184,005,523 184,005,523 184,005,523 184,005,523 184,005,523 184,005,523 184,005,523
Effect of shares issued
during the period 24,630,204 - 24,630,204 - - - - - -
As at 31 December 208,635,727 - 208,635,727 184,005,523 184,005,523 184,005,523 184,005,523 184,005,523 184,005,523
Shares Shares Shares Shares Shares Shares Shares Shares Shares
Dilutive effect of potential
ordinary shares 3,916,469 - 3,916,469 - 1,348,766 - - - -
Weighted average number of
ordinary shares in issue
used in diluted EPS 212,552,196 - 212,552,196 184,005,523 185,354,289 184,005,523 184,005,523 184,005,523 184,005,523
US cents US cents US cents US cents US cents US cents US cents US cents US cents
Basic Profit / (loss) per
share – cents 17.77 - 17.77 (50.54) 1.17 (49.37) (50.23) 0.85 (49.38)
Diluted Profit / (loss) per
share - cents 17.44 - 17.44 (50.54) 1.16 (49.38) (50.23) 0.86 (49.38)
Page 31 of 31
The number of potentially dilutive ordinary shares in respect of employee share options and warrants is 23,345,036. These potentially dilutive ordinary shares may
have a dilutive effect on future earnings per share.