Embed Size (px)
Citation preview

Kenya Listed Commercial Banks Analysis
Cytonn Q1’2016 Banking Sector Report
“Transition continues, but to a new and different landscape”
19th June, 2016

22
Table of Contents
I. Overview of the Firm
II. Kenya Economic Review and Outlook
III. Kenya Banking Sector Overview
IV. Cytonn’s Banking Sector Report
A. Executive Summary
B. Banking Sector Report
V. Appendix
A. Metrics Used
B. Tier I Banks
C. Tier II Banks

33
I: Overview of the Firm

44
160 Members, 1 Agenda – The Client

55
Introduction to Cytonn Investments
Cytonn Investments is an independent investments management company
• Our mission is that “we work to deliver innovative & differentiated financial solutions that
speak to our clients needs”
• Cytonn Investments is differentiated in several respects:
1. Independence & Investor Focus: Cytonn is solely focused on serving the interest of clients,
which is best done on an independent investment management platform to minimize conflicts of
interest
2. Alternative Investments: Specialized focus on alternative assets - real estate, private equity,
and structured products
3. Partnerships with Global Institutional Investors: Such as Taaleri of Finland
4. Strong Alignment: Every staff member participates in ownership. When clients do well, the firm
does well; and when the firm does well, staff do well

66
Cytonn’s Corporate Structure – Kshs 73 bn Under Mandate
• Financial Services
• Education
• Technology
• Diaspora platform
connecting investors
in the diaspora with
opportunities in the
East African Region
• Development affiliate
providing investment
grade real estate
development
solutions
Cytonn Investments
Cytonn Investments
Ltd
Cytonn Real Estate
Cytonn Diaspora
Cytonn Investments
LLC
• Independent
investment
management
company, serving
HNW & institutional
clients
• US advisory and
investment
management
company
Kenya United States
Private Equity

77
Board of Directors
The board is comprised of 10 members from diverse backgrounds, each bringing in unique skill-sets
Prof. Daniel Mugendi,
ChairmanAntti – Jussi Ahveninen,
Non-executive Director
Madhav Bhalla,
Non-executive Director
James Maina,
Non-executive Director
Nasser Olwero,
Non-executive Director
Mike Bristow,
Non-executive Director
Edwin H. Dande,
Managing Partner & CEO
Elizabeth N. Nkukuu,
Partner & CIO
Patricia N. Wanjama,
Partner & Head of Legal
Kenneth Ndura
Non-executive Director

88
The Management Team
The team brings in diverse global and local experience in investments, real estate, finance and brand
Edwin H. Dande,
Managing Partner & CEO
Elizabeth N. Nkukuu,
Partner & CIO
Patricia N. Wanjama,
Partner & Head of Legal
Maurice Oduor,
Investment Manager
Johnson Denge,
Real Estate Services Manager
Robert M Mwebi,
Project Manager
Shiv Arora,
Head of Private Equity
Real Estate
Gaurang Chavda,
Head of Private Wealth
Management
Winfred Ndung'u,
Brand & Business
Admin Manager
Beverlyn Naliaka,
PR & CommunicationMartin Gitonga
Project Manager
Kennon Mwiti,
Financial Controller

99
Cytonn Investment Solutions
We offer differentiated investment solutions in four main areas
High Yield Solutions
The Team’s expertise and market knowledge enable us to offer investors higher yields than the market
average
Regular credit analysis, quick dealing capability and the large banking spread in the market allow the
team to capitalize on investment opportunities
Real Estate Investment Solutions
Our unique strategic partnerships with Cytonn Real Estate, our development affiliate, enables us to find,
evaluate, structure and deliver world class real estate investment products for investors
Our platform connects global capital seeking attractive return with institutional grade development
opportunities in the East African region
Private Regular
Investment Solutions
We understand that investors have varying financial goals. Our highly customized and simple to
understand investment products will enable you to achieve your investment objective
We offer solutions to both local investors, and those in the diaspora interested in the investment
opportunities back in Kenya and the region
Private Equity
Cytonn seeks to unearth value by identifying potential companies and growing them through capital
provision and partnering with their management to drive strategy
We primarily invest in the Financial Services, Education and Technology sectors

1010
Cytonn Real Estate’s Unrivalled & Unique Capabilities
Fundraising
MarketResearch & Site Acquisition
Project Management
ConceptDesign
Cytonn has all the necessary capabilities to deliver the very best real estate investment product
• The project management function is a vital part of real estate whose role is to ensure projects are delivered in
the best quality, within scope and the most efficient resource use
• Cytonn boasts of a large PM team with diverse experience in the various aspects of project management to
deliver world class real estate products
• The global market exposure combined with local experience networks have it easier to raise funds
• Our investors comprise of global and local institutions, local high-net-worth investors and Kenyans in the diaspora
• An experienced and passionate team to collect and manage funds, bringing about diverse investment portfolios
with good returns
• Cytonn has unique concept designs that arise from partnerships with global institutions in countries like Dubai
giving superior quality products to the market
• The internal concept team in collaboration with the project management function work tirelessly to deliver the
products of the firm
• Research team is an essential part of any investment, helping identify the highest and best use and concept for
the different land deals received and taken up by the company
• Cytonn has one of the best research teams in the region who carry out intensive market research for internal
use and uses the data to release the data for guidance of external customers as well
• Our Site Acquisition team uses the market research to find the best sites for development given the opportunity
in the economy
• The marketing and brand team have enabled the brand reach great heights and visibility locally and globally by
employing their experience, passion and innovation
• The firm has one of the best distribution teams that ensure our products reach far and wide. Their experience is
backed by success stories of making sales of up to 45% even before start of construction developments
Sales and Marketing

1111
Global view of economic growth determines regions of focus
There is demand from global capital (light colors) looking for attractive returns (dark colors)

1212
Cytonn’s strategy brings three key pillars together
1. Creating Jobs
2. Growing the Economy
3. Improving the standards of living
Financing Capability Development Capability
Landowners

1313
Deal pipeline overview – 85% to low and mid-income housing
Kshs 73 Billion Deal Pipeline
Low to mid-income Housing85%
• Masterplanned Development
• Comprehensive Development
• Low to mid-income Modular Housing
• High Density Integrated Mixed-use
• Gated Communities
Prime Residential and Mixed-use15%

1414
Summary of Projects – Kshs 73 bn Deal Pipeline Details
• Set 1: Projects are in the market, construction phase and being sold
• Set 2: Projects are in design stage
• Set 3: Projects are in acquisition stage
Projects Concept Project Size (Kshs mn)
SET 1
1 Kanzi Plains Site & Service Scheme 395.5
2 Athi Sharpland Site & Service Scheme 644.7
3 Amara Ridge Gated community 1,000.0
4 The Alma Integrated lifestyle development 2,744.0
5 Situ Village Gated masterplanned community 4,500.0
Sub - Total 9,284.2
SET 2
6 The Annex Integrated lifestyle development 522.9
7 Project Kitale Masterplanned development 700.0
8 Rongai Sharpland III Site & Service Scheme 937.4
9 Project Westlands Serviced apartment concept 1,000.7
10 Ruaka III Integrated lifestyle development 2,508.0
11 Project Ridgeways High density mixed-use development 9,317.0
12 NewTown by Cytonn Real Estate Low to mid income masterplanned city 22,500.0
Sub - Total 37,486.0
SET 3
13 Project Kisumu Mixed Used Office complex 500.0
14 Project Mombasa High density mixed-use development 3,750.0
15 Project Hurlingham Mixed Used Office complex 7,000.0
16 Project Upper Hill Mixed used office complex 15,000.0
Sub - Total 26,250.0
GRAND TOTAL 73,020.2

1515
II. Kenya Economic Review and Outlook

1616
Key indicators point to a pick-up in economic performance in 2016. We have only revised our outlook on Interest Rates from “Neutral” to “Positive” as we expect rates to remain on a downward trend that will persist for the better part of the year
Kenya Summary Economic Outlook
Macro-Economic
Indicators2015 Experience 2016 YTD Experience Going Forward Outlook
GDP
Kenya’s 2015 full year GDP came
in at 5.6% despite a tough
macroeconomic environment
Expected to improve with a
conducive and stable
macroeconomic environment and
tea exports and tourism improving
for the year
We project the 2016 GDP to
come in at an average 5.8%Positive
Interest Rates
The CBR increased 300 bps to
11.5% in August 2015 with the
91-day starting the year at a rate
of 11.7% and hitting a high of
21.0%
There has been a downward
pressure on interest rates since
January given the Government
surpassing its borrowing target
The CBR was lowered by 100 bps to
10.5% on account of lower inflation
and a stable currency
Interest rates expected to remain
on downward trend that will
persist for the better part of the
year. As such, we amend our
Outlook from Neutral to Positive
Positive
Inflation(i) December inflation at 8.0%
(highest for year)
Inflation declined from the high of 8.0% in December through January
to May at 5.0%
Expected to remain within the CBK target
Neutral
Exchange Rate
The shilling depreciated 13.0%
against the dollar from 90.70 in
Jan to 102.30 in Dec
The foreign reserves improved to
4.5months by Dec 2015
The shilling has remained stable:
supported by high forex reserves
equal to 5.0 months of import
cover
And the increased in the credit
facility by IMF to USD 1.5 bn
Shilling to remain stable for the
better part of the year on the
back of strong dollar reserve at 5
months import cover. Any
potential impact of the Fed rate
hike have already been priced in
Neutral

1717
Key indicators point to a pick up in economic performance. Our outlook on Corporate Earnings, Foreign Investor Sentiment and Security & Political Environment remain unchanged
Kenya Summary Economic Outlook, continued…
Macro-Economic
Indicators2015 Experience 2016 YTD Experience Going Forward Outlook
Corporate
Earnings
The year experienced weak
earnings from the listed banking
sector with Core EPS growth of
2.8% in 2015. 17 listed and 1
unlisted company issued profit
warnings as a result of a tough
operating environment
The banking sector recorded an
EPS growth of 13.6% in Q1’2016
compared to the 2.8% recorded
in FY’2015
To improve due to the relatively
improving interest rate
environment, stable shilling and
improvement in credit growth
Positive
Foreign Investor
Sentiment
Increased flows out of Kenya
owing to the US interest rate hike
compared to inflows into equity
markets as a result of volatility in
interest rates
Investor sentiment has been
positive with foreign investors
being net buyers in Q1’2016 with
net inflows of Kshs 498.0 mn
Chinese economic slowdown and
devaluation of their currency may
lead to poor performance of
most emerging and frontier
market indices. However, Kenya’s
NSE valuations still remains
attractive to foreign investors
Neutral
Security & Political
Environment
Improvements witnessed in levels
of security with tourism levels
increasing in the month of
December compared to the
previous year and reduced
terrorist attacks
Kenya has received an upgrade in
credit rating by Moody’s as a
positive indicator that the
environment is safe to carry out
business operations
Increased spending on security
equipment and recruitment of
more personnel will enhance the
country’s security, however
heightened tensions/
demonstrations before the
National elections next year will
weigh on the political
environment
Neutral

1818
III. Kenya Banking Sector Overview

1919
• In Kenya there are a total of 42 commercial banks with two banks; Chase bank and Imperial bank in receivership, 1
mortgage finance company, 12 microfinance banks, 8 representative offices of foreign banks, 86 foreign exchange
bureaus, 14 money remittance providers and 3 credit reference bureaus
• All banks are regulated by the Central Bank of Kenya. The Capital Markets Authority has additional oversight over the
listed banks. All banks are required to adhere to certain prudential regulations such as minimum liquidity ratios and
cash reserve ratios with the Central Bank
• We maintain our view that Kenya is over-banked with a relatively high ratio of banks to total population, with 42
commercial banks serving of 44 mn people, compared to Nigeria's 22 for 180 mn and South Africa's 19 for 55 mn
• This overbanked environment has already begun leading to consolidation in the sector, and heightened M&A activity.
Tanzanian Bank, Bank M, was given the go ahead to acquire 51% of Oriental Commercial Bank, GT Bank acquiring Fina
Bank, Mwalimu Holdings acquiring Equatorial and I&M Bank acquiring Giro Bank over the last 2 years
1.0x
0.3x0.1x
0.0x
0.5x
1.0x
1.5x
Kenya South Africa Nigeria
Commercial Banks / Population (Millions)
Kenya’s Banking Sector Overview
Kenya is over-banked, with 42 commercial banks (2 in receivership) serving a population of 44 mn people

2020
Transition continues, but to a new and different landscape
20
13
More Firm & Trusted
Regulator
Summary Effect on Banking Sector
• With the placement of Chase Bank and Imperial Bank in receivership, Central Bank of Kenya (CBK) have demonstrated their commitment to clean up the banking sector and improve their levels of supervision
• In addition, their swift acts to place Chase Bank under the management of KCB Group restored confidence to the market and reduced jitters
• To add further confidence to investors, provisions levels have increased as the regulator targets a more efficient and transparent sector
• The Central Bank Governor, Dr. Patrick Njoroge, said himself that the regulatory capability needs to be improved, and this has already been demonstrated with Chase, Imperial and Dubai Bank
• Increased levels of supervision, and low levels of tolerance, for banks that do not adhere to the highest standards of governance and ethics will lead to closure
• The regulator will look to force consolidation in the sector, ensuring that those institutions that remain and large enough to withstand shocks, also managed well and are more transparent
• We shall continue to see increased levels of provisioning, as asset quality is increased across the sector for a safer banking system
Capital Requirements
• There is a proposal in the 2016 Finance Bill to reintroduce Kshs 5 bn as a banks capital requirement, to ensure all institutions that have a public interest are well capitalized and secure
• In addition, Treasury wishes to amend the Banking Act to be involved before a bank is placed under receivership
• Higher capital levels will create a more stable banking system, and will force consolidation, and banks such as KCB Group & Family Bank already raising capital
• Banks looking to raise capital will have to do so at attractive valuations for investors, and for those banks unable to raise capital from the markets, they will be forced to merge
Transition Area
The sector is undergoing transition. However, key issues such as flight to quality towards Tier I banks, increased requirements for capital,
increased focus on sufficient provisioning, and increased supervision from a stricter regulator will all force consolidation. Those unable to survive
will be bought out, merge or leave. Those that remain will be stronger banks in a more efficient and stable banking sector.
Sector Realignment & Flight to
Quality
• As indicated in our previous banking report, the industry is still divided into the “haves” and “have-nots”, and this difference has caused volatility in the banking sector
• Barclays is looking to exit and is selling 12.2% to a consortium, while Giro and ECB have been acquired
• There is continued consolidation, as witnessed by Oriental Commercial Bank’s purchase by Bank M of Tanzania
• With the jitters in the banking system brought about by isolated incidences of poor corporate governance, the market has seen a flight to quality, with Tier I banks receiving bulk of deposits, and Tier II and III banks being supported by the regulator as confidence gets restored slowly
• Local Tier III banks will all face significant pressures to either sell, merge or raise additional capital to remain competitive
• There is additionally the possibility of seeing large global players enter the market through aggressive buy-out’s e.g. Bob Diamond and Carlyle looking to purchase Barclays Africa
• Especially with the moratorium on bank licenses, we will see increased consolidation and heightened M&A activity, which will create a more stable, attractive and transparent banking system
• With a big flight to quality happening in the Kenyan market, smaller banks will also be forced to consolidate, as they face liquidity pressures and low business volumes; this all will end up in a fewer number of banks, but stronger and more robust banks

2121
Growth in the Banking SectorThe banking sector’s Q1’2016 EPS grew by 13.6% y/y on the back of an improved macroeconomicenvironment, but of note was that loan growth outpaced deposit growth
20
12
20
13
• Banking sector in Kenya experienced growth in Q1’2016 in assets, deposits, profitability and products offering, leveraging
on diversification to alternative channels, supported by favourable macroeconomic environment
• The listed banking sector’s aggregate gross loans and advances grew by 14.6% to Kshs. 1.7 trillion in March 2016 from
Kshs. 1.5 trillion in March 2015 while deposits grew by 11.5% to Kshs. 2.0 trillion in March 2016 from 1.8 trillion in March
2015
• Total assets grew 10.5% in March 2016 to Kshs 2.8 trillion, from Kshs 2.5 trillion in March 2015
• Since 2010 the aggregate of listed banks profit after tax has grown at a CAGR of 13.5%
• Since 2010, deposits have grown at a CAGR of 15.1%, with loans and advances having outpaced deposit growth at a
CAGR of 18.7%
• Growth has mainly been underpinned by:
Banks responding to the needs of the Kenyan market for convenience and efficiency through
alternative banking channels such as mobile, internet and agency banking
Branch network expansion strategy both in Kenya and in the East African community region
Increased use of alternative channels, such agency, mobile and internet banking. Cashless cards use
has also been on the rise

2222
Banking Sector Growth Drivers
Alternative channels, cost containment and expansion support banks’ growth and diversification
20
12
20
13
1) Technology to enhance cost containment initiatives: Banks have embraced integration with mobile application
platforms and internet banking, and this has led to lots of efficiency in distribution, leading to increased uptake of banking
services, particularly in the mass market
2) Adoption of Agency Banking: The agency banking model has reduction of the operating expenses and improve efficiency
and will be a key driver for diversification. This also ensures a much wider reach
3) Growth of the retail segment and the middle class : As the middle-class grows rapidly in Kenya, faster than majority
of the countries in the region, there is an inherent increase in consumption expenditure and an increase in the percentage of
the population which will require banking services
4) Expansion both regionally and domestically: With increased financial inclusion in Kenya at 75%, banks looking to
expand in the less penetrated markets of Tanzania, Uganda, Rwanda, South Sudan and DR Congo are opening up new
channels of revenue in countries with relatively attractive spreads compared to Kenya. However risks present themselves as
witnessed with the recent devaluation of the S. Sudan currency by 84.0%. Most banks bottom lines have not benefited much
by the regional expansions
1) Regulatory Environment: The CBK has tightened its regulations on banks with emphasis on transparency on lending
rates, governance and capitalization. Banks are expected to remain stable and position themselves for stable growth

2323
Recent Developments in the Banking Sector
Interest rates declined; Chase Bank was re-opened under the management of KCB Group
20
12
20
13
1. Decline in Interest Rates: Interest rates have been declining in 2016 after an increase in the fourth quarter of 2015,
with the interbank rate and the 91 day T-bill touching lows of 2.3% and 7.1% from 6.9% and 10.4%, respectively. The
Monetary Policy Committee recently lowered the CBR to 10.5% owing to improved macroeconomic environment
2. Placement of Chase bank under receivership and its subsequent re-opening: Chase bank was placed under
receivership following a ‘bank run’ that was triggered by the restatement of earnings by the bank following the
realization by the auditor that the bank had non - performing insider loans; further to which were way above the
statutory requirement. However, the CBK handled the situation better than they did with Dubai bank and Imperial bank
which led to the reopening of the bank a month later. The bank was put up for a bid which KCB Group won and might
acquire a majority stake in the firm
3. Continued increase in Loan Loss Provisions: As a result of the high interest rate environment in 2015 and with
increased supervision of banks following the closure of Imperial Bank, Dubai Bank and most recently Chase Bank, we
have seen a jump in loss provisions with the most notable being the increase in the listed banks’ loan loss provisions by
167.0% in Q1’2016 following the 85.4% increment in FY’2015

2424
Recent Developments in the Banking Sector, continued…The increase in Private Equity investments in the banking industry indicates foreign confidence in the growth prospects of the industry, with Barclays looking to exit and Bank M acquiring Oriental Commercial Bank
20
12
20
13
4. Private Equity Investments in the Kenya Banking Industry: The banking industry has witnessed increased
private equity investment activity with the most recent deal being Jamii Bora raising Kshs. 1.2 bn from Equator Capital
Partners and Progression Capital Africa Ltd
5. Barclays divesture from the African business - Barclays Plc decided to exit its African operations in order to
refocus the bank on its core UK and US markets. The bank appointed a subcommittee to study how and when to sell its
62.3% stake in Barclays Africa, which is valued at £3.5 bn (USD 4.8bn). Barclays CEO James Staley highlighted that
despite the recognition that Africa is one of Barclay’s genuine growth areas, it is (i) becoming a costly distraction owing
to the devaluation of the South African Rand, and (ii) extra risks of corruption and misconduct in Africa, which would
tarnish the entire African operation if something was to go wrong
6. Corporate Governance issues – Corporate governance issues in the banking sector continued with the culprit this
time being National Bank. The top executives were sent on suspension and subsequently resigned owing to unsafe
practices which included issuance of loans without following due process. This led to a huge spike in NPLs which
resulted to a provision charge of Kshs. 3.7 bn leading and a loss of Kshs. 1.2 bn
7. Mergers & Acquisition – Tanzanian Bank, Bank M, was given the go ahead to acquire 51% of Oriental Commercial
Bank. We are seeing increased consolidation, and M&A activity, including GT Bank acquiring Fina Bank, Mwalimu
Holdings acquiring Equatorial and I&M Bank acquiring Giro Bank over the last 2 years

2525
Listed Banking Sector MetricsDeposits and loan growth is strong, however the growth is slowing down and is currently at a lower levelthan historical 5-year averages
Loans and Advances (Kshs Bn) Deposits (Kshs Bn)
Shareholders Equity (Kshs Bn)
Source: Central Bank of Kenya
Bank Branches
703
927 1,038
1,214
1,466
1,675 1,729
-
200
400
600
800
1,000
1,200
1,400
1,600
1,800
2,000
2010 2011 2012 2013 2014 2015 Q1'2016
969
1,176 1,326
1,499
1,757
2,013 2,025
-
200
400
600
800
1,000
1,200
1,400
1,600
1,800
2,000
2,200
2010 2011 2012 2013 2014 2015 Q1'2016
193 212
269
321
381 419 433
- 50
100 150 200 250 300 350 400 450 500
2010 2011 2012 2013 2014 2015 Q1'2016
653 721
792 848
912 954
1,108
- 100 200 300 400 500 600 700 800 900
1,000 1,100 1,200
2010 2011 2012 2013 2014 2015 Q1'2016
CAGR = 18.7%Q1 2016 = 14.6%*
CAGR = 15.1%Q1 2016 =11.5%*
CAGR = 16.6% CAGR = 10.6%
* Annualised Q1 2016 growth rates

2626
Listed Banking Sector Metrics, continued…
Following a tough year in 2015, 2016 shows signs of recovery despite NPLs still persisting
Cost to Income (%) Loan to Deposits (%)
NPLs to Total Loans (%) Net Interest Margin (%)
Source: Central Bank of Kenya
77.1%
84.1% 84.1%86.2%
90.2%92.4%
89.3%
65.0%
70.0%
75.0%
80.0%
85.0%
90.0%
95.0%
2010 2011 2012 2013 2014 2015 Q1'2016
5.1%
3.8%4.5%
6.5% 6.1% 6.4%
8.7%
0.0%
2.0%
4.0%
6.0%
8.0%
10.0%
2010 2011 2012 2013 2014 2015 Q1'2016
7.2%
7.8%8.0% 8.0%
7.6%7.7%
8.3%
6.5%
7.0%
7.5%
8.0%
8.5%
2010 2011 2012 2013 2014 2015 Q1'2016
55.9%
54.5% 54.4% 54.6%
52.7%
59.4%
54.3%
48.0%
50.0%
52.0%
54.0%
56.0%
58.0%
60.0%
2010 2011 2012 2013 2014 2015 Q1'2016

2727
Listed Banking Sector Metrics, continued…
Kenya’s banking sector Q1’16 core EPS growth was 13.6%, faster than the 8.9% growth in Q1’15
Source: Cytonn Research
Q1'2016 Listed Banking Sector Metrics
BankCore EPS Growth *
Deposit Growth
Loan Growth
Net Interest Margin
NPL RatioCost to
Income**ROaE ROaA
HF Group 47.6% 23.6% 12.1% 6.6% 8.5% 51.2% 10.2% 1.7%
Stanchart 42.7% 12.9% (3.7%) 9.4% 13.4% 39.0% 16.4% 3.1%
Equity Group 19.8% 8.1% 22.4% 11.0% 4.0% 48.9% 27.9% 4.9%
I&M Bank 10.3% 15.7% 11.3% 7.8% 4.9% 30.3% 33.5% 4.8%
DTB Bank 9.5% 26.1% 24.1% 7.4% 4.0% 41.7% 16.0% 2.5%
Co-op Bank 7.7% 11.9% 16.1% 16.9% 4.0% 45.0% 16.5% 2.7%
KCB Group 6.1% 6.6% 16.5% 8.5% 8.8% 48.4% 21.0% 3.2%
CFC Bank 3.0% 3.2% 14.7% 5.9% 5.1% 48.8% 19.5% 2.8%
Barclays Bank 2.6% 8.3% 21.7% 10.4% 5.2% 51.9% 20.5% 3.7%
NIC Bank (0.3%) 14.8% 6.1% 8.1% 12.0% 33.7% 17.5% 3.1%
National Bank (38.4%) 16.6% (5.3%) 6.8% 25.6% 60.9% (27.2%) (1.6%)
Q1'2016 Weighted Average 13.6% 11.0% 15.8% 9.0% 8.7% 45.2% 21.4% 3.6%
Q1'2015 Weighted Average 8.9% 16.5% 21.3% 8.1% 4.9% 49.5% 20.8% 3.0%
*Average is Market cap weighted
**Without Loan Loss Charge

2828
Banking Sector Multiples
Kenya’s banking sector is trading at an average PBV of 1.3x and a PE of 7.3x
Source: NSE, Cytonn Banking Sector Report
* Share prices are as at 14th June, 2016
The Banking sector has become cheaper on a PBV basis having dropped to 1.3x from 1.7x in FY’2015
Bank Share Price * No. of Shares Issued (bns)Market Cap
(bns)PBV P/E
National Bank* 10.5 0.3 3.2 0.6x 9.4x
HF Group 20.0 0.3 7.0 0.6x 5.4x
CFC Bank 85.0 0.4 33.6 1.2x 6.8x
KCB Group 35.5 3.0 107.4 1.3x 5.4x
Barclays Bank 10.1 5.4 54.9 1.3x 6.5x
NIC Bank 36.8 0.6 23.5 1.3x 6.3x
DTB Bank 175.0 0.3 46.6 1.3x 6.9x
Co-op Bank 16.9 4.9 82.4 1.5x 6.9x
I&M Bank 99.0 0.4 38.8 1.6x 9.2x
Standard Chartered 212.0 0.3 65.5 1.6x 9.8x
Equity Group 40.0 3.8 150.9 2.2x 8.3x
Average 1.3x 7.3x
Median 1.3x 6.9x
For P/E calculation for NBK we used normalized earnings over a period of 5 years
2929
Banking Sector Multiples
Listed Insurance companies are a expensive compared to listed Banks based on P/B valuation
Source – Cytonn Research
10 year Price to book value: Banking and Insurance
On a price to book valuation, listed insurance companies are currently expensive than those in the listed banking sector
2.5x 3.1x
3.1x
2.3x
2.0x
2.3x
1.4x 1.5x1.7x
1.9x1.6x
1.3x
1.7x
3.4x
2.5x
1.5x1.3x 1.4x
0.8x1.1x
1.5x
2.3x
1.5x
1.4x
2005 2006 2007 2008 2009 2010 2011 2012 2013 2014 2015 Q1'2016
Banks Insurance

3030
III. Cytonn’s Banking Sector Report

3131
Executive Summary
Cytonn has undertaken this report to offer our investors a comprehensive view of the listed banks
20
12
20
13
• All listed banks in the Kenyan market were analysed by the Cytonn Investment Team
• The analysis was brought about by a need to be able to recommend to our investors which banks are the most stable
from a franchise value and from a future growth opportunity perspective
• The analysis covers the health and future expected performance of the financial institution, by highlighting their
performance using metrics to measure profitability, efficiency, growth, asset quality, liquidity, revenue diversification,
capitalization and intrinsic valuation
• The analysis was undertaken using Q1’2016 results (franchise value) and analyst’s projections of future performance of
the banks (future growth opportunities)
• For banks which are part of a group structure, the financials of the group were utilised to take into consideration the
listed counter which an investor will purchase
• The overall ranking was based on a weighted average ranking of Franchise value (accounting for 40%) and Intrinsic
value (accounting for 60%)
• The top rankings were dominated by Tier 1 banks which performed well in terms of both Franchise and Intrinsic
valuation

3232
Banking Sector Report Results
National Bank Ranked lowest in both franchise and intrinsic score
20
12
20
13
Source: Cytonn Research
• KCB Group emerged top supported by a strong franchise score and total return score
• Diamond Trust Bank fell three positions to position 6, affected by a drop in franchise ranking. This was due to a low Return
on Equity of 16.0% compared to the industry average of 18.6%. It also ranked poorly in diversification where it had a Non
Interest to Revenue of 20.5% against an industry average of 28.7%
• CfC Stanbic declined three positions to position 9, affected by both a poor franchise and total return score. The low
franchise score was due to a low Net Interest Margin of 5.3% against an industry average of 8.3%.
• National Bank was ranked the lowest overall, ranking lowest in both franchise and intrinsic score. NBK has the highest cost
to Income ratio at 60.9% against the industry average of 45.4%. Key to note is that NBK has the largest NPLs to loans at
25.6% against the industry average of 8.7%, with one of lowest NPL coverages at 23.2% against the industry average of
33.4%

3333
Rankings by Franchise Value
Equity Group emerged top in the franchise value rankings, with National Bank coming last
20
12
20
13
Source: Cytonn Research
• The bank ranking assigns a value of 1 for the best performing bank, and a value of 11 for the worst
• The metrics highlighted a bank’s profitability, efficiency, growth, asset quality, liquidity, revenue
diversification, capitalization and soundness
• *LDR- Loan to Deposit Ratio • **CIR- Cost to Income Ratio • ***ROACE - Return on Average Common Equity • ****NIM - Net Interest Margin
Rank BankLDR
*CIR**
ROACE***
NIM****
PEG ratio
P/TBVDeposits/
BranchNPLs/ Loans
NPL Coverage
Tangible Common
Ratio
Non Interest Income/Revenue
Cytonn Camel Rating
Cytonn Corporate
Governance Score
Total
1 Equity Group 5 8 2 1 4 11 11 1 1 5 3 2 5 59
2 Co-operative 2 5 4 4 7 8 7 3 5 4 2 4 7 62
3 KCB Group 1 6 3 5 2 6 8 8 4 6 7 9 1 66
4 I&M Holdings 7 1 1 6 6 10 3 4 10 7 8 1 5 69
5 Barclays 4 10 5 2 10 5 9 6 3 2 5 7 3 71
6 Standard 10 3 8 3 9 9 1 10 6 3 4 6 2 74
7 CfC Stanbic 6 7 6 11 1 4 2 5 8 9 1 3 11 74
8 NIC 9 2 7 8 3 3 4 9 7 1 6 8 9 76
9 DTBK 3 4 9 7 8 7 6 2 2 10 10 5 4 77
10 HF Group 11 9 10 9 5 1 5 7 11 8 11 10 10 107
11 National Bank 8 11 11 10 11 2 10 11 9 11 9 11 8 122
3434
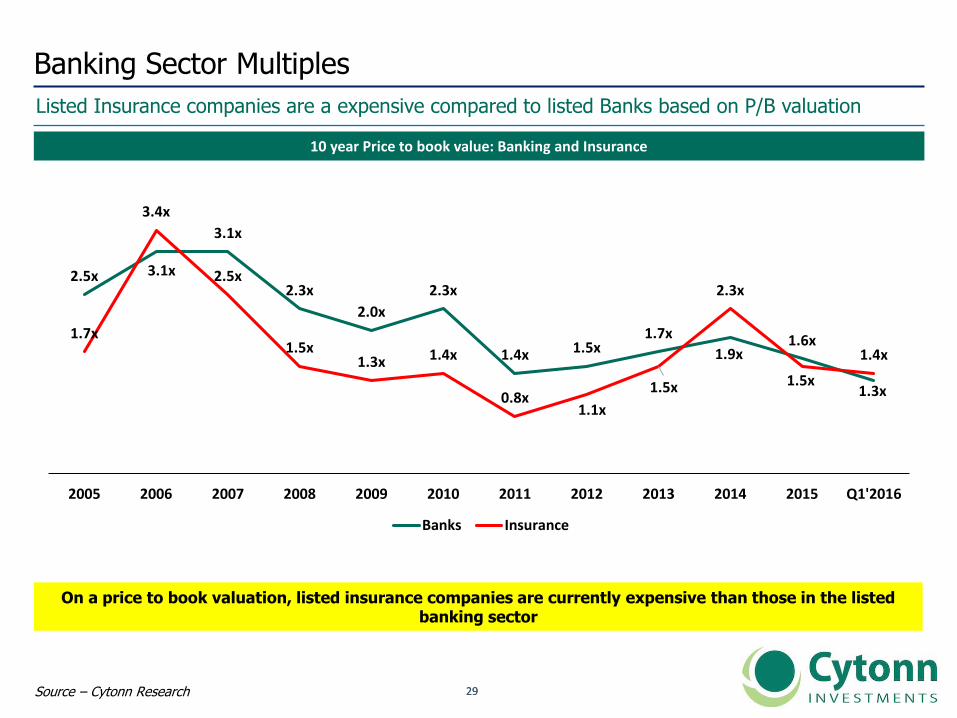
Rankings by Intrinsic Value
KCB Group hold the highest upside with a potential return of 44.2%
• KCB Group and Diamond Trust Bank have the highest upsides at 44.2% and 18.1%, respectively
• National Bank registered the highest downside of 49.0%
Banks Current PriceTarget Price (Valuation)
UpsideDividend
Yield FY16eTotal Potential
Return
KCB Group 35.5 49.4 38.6% 5.6% 44.2%
DTBK 175.0 204.2 16.7% 1.4% 18.1%
Barclays Bank 10.1 10.9 7.9% 9.7% 17.6%
HF Group 20.0 21.6 8.0% 7.5% 15.5%
I&M Holdings 99.0 109.5 10.6% 3.5% 14.1%
Equity Group 40.0 42.1 5.3% 5.4% 10.7%
Standard Chartered 212.0 208.6 (1.6%) 5.9% 4.3%
NIC Bank 36.8 35.7 (2.9%) 2.7% (0.2%)
Co-operative 16.9 16.0 (4.8%) 4.7% (0.1%)
CfC Stanbic Bank 85.0 83.6 (1.7%) 0.0% (1.7%)
National Bank 10.5 5.4 (49.0%) 0.0% (49.0%)

3535
Composite Bank Ranking
Overall KCB Group ranks highest supported by a high total return score
• In FY’2015, franchise value was assigned a weighting of 40% while the intrinsic value was assigned 60% weight, same as
in Q3’2015
• KCB maintains its top position on the back of a strong franchise and return score. Additionally KCB sored highly on
corporate governance emerging top
CYTONN’S Q1'2016 BANKING REPORT RANKINGS
Banks Franchise Value
Total ScoreTotal Return
ScoreWeighted Q1'2016
ScoreQ1'2016 rank FY’2015 rank
KCB Group 66.0 1.0 27.0 1 1
Equity Group 59.0 6.0 27.2 2 2
Co-operative bank 62.0 9.0 30.2 3 5
Barclays 71.0 3.0 30.2 4 7
I&M 69.0 5.0 30.6 5 4
DTBK 77.0 2.0 32.0 6 3
Standard Chartered 74.0 7.0 33.8 7 9
NIC 76.0 8.0 35.2 8 8
CfC Stanbic 74.0 10.0 35.6 9 6
HF Group 107.0 4.0 45.2 10 10
National Bank 122.0 11.0 55.4 11 11

3636
Appendix

3737
A. Metrics Used

3838
Banking Sector Report – Metrics Used
Cytonn has undertaken analysis of the listed banks in Kenya using 13 key metrics
20
12
20
13
1. Net Interest Margin - A bank’s net interest margin (NIM), is the difference between the interest paid on deposits and
the interest earned on loans, relative to the amount of interest-earning assets with higher net interest margins translating
into higher profits
Output:
Majority of Bank’s funding is towards the issuing of loans rather than the purchase of government securities. Equity had
the highest NIM at 11.0%, with the lowest for CfC Stanbic at 5.3%
2. Return on Average Common Equity - A bank’s return on average common equity (ROACE), is the amount of profit
the bank earns as a percentage of average common shareholders’ equity. It’s a profitability measure that shows how much a
company generates with the money shareholders have invested
Output:
Banks with higher ROACEs are better at utilizing capital to generate profits. I&M has the highest ROACE at 33.5%, which
was much above the industry average of the listed banks of 18.6%, while National Bank had the lowest at (20.5%)
following the bank registering a loss in the full year results

3939
Banking Sector Report – Metrics Used, continued…
Cytonn has undertaken analysis of the listed banks in Kenya using 13 key metrics
20
12
20
13
3. Price/Earnings to Growth Ratio - The price/earnings to growth (PEG) ratio is the stock’s market price to earnings
ratio divided by its growth in earnings for a specified period of time. The PEG ratio is used to determine the value of a stock
while taking into account its growth rate, with lower PEG ratios showing the stock is undervalued given the growth in its
earnings
Output:
To obtain this ratio, we estimated each bank’s 5-year growth rate based on analysis of (i) bank’s fundamentals, (ii)
projections using each bank’s models and (iii) management’s input on a bank’s strategy going forward. CfC Stanbic had the
lowest PEG ratio at 0.3x, while Barclays was the most overvalued at 2.2x
4. Deposits per Branch - A bank’s deposits per branch shows the amount of deposits a bank collects from each of its
branches, hence a measure of efficiency. Banks with higher deposits per branch are preferred, as it shows for each unit cost
of capital expenditure required to open new branches and their subsequent operating costs, a bank receives more in
deposits.
Output:
CFC Stanbic and Standard Chartered have the highest deposits per branch at 4.5 bn and 4.6 bn, respectively, while Equity
Group and National bank have the lowest deposits per branch at 1.2 bn and 1.3 bn, respectively. This is due to the large
corporate book of CfC Stanbic and Standard Chartered that enables them mobilise deposits with fewer branches

4040
Banking Sector Report – Metrics Used, continued…
Cytonn has undertaken analysis of the listed banks in Kenya using 13 key metrics
20
12
20
13
5. Loans to Deposits Ratio - A bank’s loans to deposit ratio (LDR) is a measure of liquidity as it shows how much of a
bank’s loans are being funded by its deposits. Low LDR ratios indicate that the bank may not be earning a lot of interest.
Very high LDR’s indicate that the bank might not have enough liquidity to cover any unforeseen funding requirements, and
ratios above 1 show that the bank supplemented their loan issues with outside borrowing
Output:
Our analysis showed us that in Kenya, the loan to deposit ratio has been steadily increasing, showing increased uptake of
loans and more aggressive use of deposits by banks. Taking a preferred LDR of 85%, we found that KCB Group was closest
to the target at 81.7%, while Housing Finance was the farthest at 130.8%
6. Cost to Income Ratio - The cost to income ratio is a measure of a bank’s efficiency, showing its costs in relation to its
income. A lower ratio is preferred, as it indicates a bank is more profitable. An increase in the ratio often highlights potential
problems as it shows a bank’s costs rose faster than its income; while a fall in the ratio could be brought by management’s
cost cutting measures
Output:
We see many Kenyan banks making an effort to be more efficient. Many Kenyan banks have opted to restructure in a bid to
bring down costs and subsequently this ratio. I&M maintained the lowest cost to income ratio of 30.3%, while National Bank
of Kenya had the highest ratio at 60.9%

4141
Banking Sector Report – Metrics Used, continued…
Cytonn has undertaken analysis of the listed banks in Kenya using 13 key metrics
20
12
20
13
7. Price to Tangible Book Value - This is a valuation ratio that expresses the bank’s market price to its tangible book
value. It shows the price an investor would pay for a unit amount in the event of a liquidation. A ratio of less than one
indicates that the bank’s assets are undervalued in the market while a ratio greater than one signifies overvaluation
Output:
We find Housing Finance as the most undervalued bank as per this metric at 0.7x, while Equity bank is still the most
overvalued at 2.2x
8. Tangible Common Equity Ratio - This is the ratio of a bank’s common equity less intangible assets to its tangible
assets. It is a common indicator of a bank’s risk and capitalization and measures how much losses a bank can take before
shareholder’s equity is wiped out, hence solvency
Output:
NIC is the most solvent with a tangible common ratio of 18.4%, while National Bank was the least solvent at 3.8%
9. Non-Performing Loans to Total Loans Ratio - This is a measure of the percentage of a bank’s issued loans that are
non-performing that is, in default, or close to being in default
Output:
Equity Group had the highest quality loan book with a non-performing loans to total loans ratio of 4.0%, while National
Bank had the highest non-performing loans at 25.6%

4242
Banking Sector Report – Metrics Used, continued…
Cytonn has undertaken analysis of the listed banks in Kenya using 13 key metrics
20
12
20
13
10. Non-Performing Loans Coverage - This is a credit quality metric that measures the credit risks for banks. It shows
the extent to which the NPLs are covered by provisions hence the degree of stability of the bank’s lending base, with higher
ratios preferred
Output:
Equity Bank has the highest provisions to non-performing loans at 56.0%, while Housing Finance Group has the lowest at
11.2%
11. Non-Interest Income to Revenue - The non interest income is the income earned from sources other than loans
and investments. The non-interest income to revenue therefore shows the extent of diversification of a bank’s operations.
High levels are preferred, not exceeding the point where the bank loses focus of its primary business
Output:
We see that Kenyan banks’ non-interest income is set to benefit from new initiatives such as banc-assurance and mobile
banking. CfC Stanbic has the highest non-interest income as a percentage of revenue at 40.7%, while Housing Finance has
the lowest at 19.6%
12. Camel Rating - This is a ranking system that assesses the overall condition of a bank, that is, Capital Adequacy, Asset
Quality, Management Quality, Earnings Quality and Liquidity. We also incorporated a governance score in the ranking

4343
Banking Sector Report – Metrics Used, continued…
Cytonn has undertaken analysis of the listed banks in Kenya using 13 key metrics
20
12
20
13
13. Corporate Governance Score – Given the recent developments in the banking sector, which include Dubai Bank,
Imperial Bank and National Bank, we developed a 13th metric to measure corporate governance This is a ranking system
where we analyse 25 metrics to rank listed companies on their corporate governance. Main areas of analysis are in the
board composition, audit functions, CEO tenor and evaluation, remuneration and transparency
Output:
The score assumes a diffusion index with 50% as the base. Anything below 50% should be flagged as having serious
corporate governance issues while anything above is skewed towards proper governance. However the variance from 100%
gives the risk associated with corporate governance

4444
B. Tier I Banks

4545
Tier 1 Banks Value Drivers and Cons
2013
KCB Group
Value Drivers Cons
• KCB Mpesa, is expected to be a key growth driverin terms of deposits and loans
• Alternative channels including mobile bankingand agency banking
• Exposure to different political, economic andregulatory environments especially the impact ofSouth Sudan operation
• The bank seems to be struggling in utilising its assetbase compared to its peers in generation of returns
Co-op Bank
• It has a large Sacco banking base, and theopportunity to grow upon the model in itsregional expansion strategy
• Co-operative bank is a financial one-stop shopowing to its full range of financial services
• The bank is slow in embracing technology comparedto its peers in deposit mobilisation
• The bank might be losing out in first mover advantagein their expansion strategy
Bank
Equity Group
• Equity Bank is currently the largest insuranceintermediary and Equity Investment Bank is the2nd largest Stockbroker in the country with amarket share of 16%
• Equitel is the fastest growing MVNO
• Cost control: Equity bank has a big challenge tomaintain their cost as they are investing highly in IT
• Expansion Setbacks: Equity bank has encounteredsome setback in their regional expansion where theyhave not been as profitable as in others
Standard Chartered
Barclays Bank
• Custody business will continue providing the bankwith a niche when it comes to wholesale banking
• Strong in SME banking business
• Recently high NPLs have affected the revenues forStandard Chartered Bank.
• Limited to the Kenya as the parent company prefersto operate independently in other markets
• Barclays has historically enjoyed cheaper fundingfrom its parent company and has not hadborrowings historically, this however might haveto change going forward if Barclays Plc exits Africa
• The bank has one of highest net interest marginof 10.8% as at FY’2015
• Stiff competition in the retail and SME banking market• The bank will continue lagging its peers in the capture
of the retail market• Challenges in deposit mobilization compared to its
peers

4646
I. Equity Group Holdings

4747
Financial Statements Extracts
Equity Group’s PAT is expected to grow at a 5 Year CAGR of 17.1%
Income Statement 2013 2014 2015 2016e 2017f 2018f 2019f 2020f CAGRNet Interest Income 26.5 29.2 34.1 36.8 42.6 46.6 51.7 60.0 12.0%Non Funded Income 15.4 18.5 21.9 28.9 34.2 40.5 48.1 58.2 21.6%Loan Loss Provision 2.4 1.6 2.4 3.5 4.0 4.8 5.8 7.1 23.8%Other Operating Expenses 20.3 24.8 29.7 33.3 38.4 43.0 48.9 56.7 13.8%Total Operating Expenses 22.7 26.3 32.1 36.7 42.4 47.8 54.7 63.8 14.7%Profit Before Tax 19.0 22.4 24.0 29.0 34.4 39.3 45.1 54.5 17.9%Profit After tax 13.3 17.2 17.3 20.3 24.1 27.5 31.5 38.2 17.1%% PAT Change YoY 29.2% 1.0% 17.0% 18.7% 14.2% 14.8% 20.9%EPS 3.5 4.5 4.6 5.4 6.4 7.3 8.4 10.1 17.1%DPS 1.5 1.8 2.0 2.1 2.6 2.9 3.3 4.0 15.1%Cost to Income 48.8% 52.0% 52.9% 50.6% 50.1% 49.4% 49.0% 47.9%ROaE 28.1% 29.7% 25.5% 29.3% 32.8% 30.9% 29.6% 29.9%ROaA 5.1% 5.5% 4.5% 4.4% 4.6% 4.7% 4.7% 5.0%
Balance Sheet 2013 2014 2015 2016e 2017f 2018f 2019f 2020f CAGR
Net Loans and Advances 171.4 214.2 269.9 309.5 350.6 387.9 441.0 501.9 13.2%
Government Securities 44.6 48.4 42.8 40.9 45.0 51.0 58.0 66.0 9.1%
Other Assets 61.8 82.0 115.4 134.3 156.3 190.2 218.9 253.1 17.0%
Total Assets 277.8 344.6 428.1 484.6 551.9 629.1 717.9 821.0 13.9%
Customer Deposits 194.6 245.4 302.1 347.7 399.8 459.8 528.8 608.1 15.0%
Other Liabilities 31.6 35.4 53.8 70.7 71.5 72.3 73.1 74.0 6.6%
Total Liabilities 226.2 280.8 355.9 418.4 471.3 532.1 601.9 682.1 13.9%
Shareholders Equity 51.6 63.8 72.1 66.2 80.6 97.1 116.0 138.9 14.0%
Book value Per share 13.7 16.9 19.1 17.5 21.4 25.7 30.7 36.8 14.0%
% Change in BPS YoY 23.7% 13.1% (8.3%) 21.8% 20.5% 19.5% 19.7%

4848
Valuation Summary
Equity Group is undervalued with a total potential return of 10.7%
Cost of Equity Assumptions: 14 – June -16
Risk free rate * 13.0%
Beta 0.8
Country Risk Premium 6.7%
Extra Risk Premium 0.3%
Cost of Equity 18.4%
Terminal Assumptions:Growth rate 5.0%Mature Company Beta 1.0Terminal Cost of Equity 19.7%Return on Average Equity 29.9%Justified PBV 1.7xShareholder Equity – FY20e 138.9Terminal Value-(Year 2020) 235.6
Valuation Summary: Implied Price Weighting Weighted Value
Intrinsic Valuation 45.6 80% 36.5
PBV Multiple 26.1 15% 3.9
PE Multiple 34.4 5% 1.7
Fair Value 42.1
Current Price 40.0
Upside/(Downside) 5.3%
Dividend Yield 5.4%
Total Potential Return 10.7%
* Five years average yields on a 10 year Treasury bond

4949
II. KCB Group

5050
Financial Statements Extracts
KCB Group has a high return on equity at 25.0%
Income Statement 2013 2014 2015 2016e 2017f 2018f 2019f 2020F CAGRNet Interest Income 33.0 35.9 39.2 48.8 56.6 66.2 77.0 89.3 17.9%Non Funded Income 17.1 22.0 23.4 26.4 30.4 35.0 39.3 45.7 14.3%Loan Loss Provision 2.9 5.1 4.7 7.4 6.4 7.4 8.5 9.8 15.7%Other Operating Expenses 27.1 29.1 31.4 37.5 44.9 51.9 59.7 69.0 17.1%Total Operating Expenses 30.0 34.2 36.1 44.9 51.3 59.3 68.2 78.7 16.9%Profit Before Tax 20.1 23.8 26.5 30.3 35.8 41.9 48.2 56.2 16.2%Profit After tax 14.3 16.8 19.6 21.2 25.0 29.3 33.7 39.4 14.9%% PAT Change YoY 17.5% 17.5% 16.5% 8.0% 18.1% 17.1% 15.0% 16.8%EPS 4.6 5.4 6.3 6.8 8.1 9.4 10.9 12.7 14.9%DPS 1.9 2.0 2.0 2.2 2.6 3.0 3.5 4.1 15.2%Cost to Income 59.8% 59.0% 57.6% 59.7% 58.9% 58.6% 58.6% 58.3%ROE 24.4% 24.2% 25.0% 24.2% 24.5% 24.3% 23.7% 23.6%ROA 3.8% 3.8% 3.7% 3.5% 3.6% 3.7% 3.7% 3.8%
Balance Sheet 2013 2014 2015 2016e 2017f 2018f 2019f 2020f CAGR
Net Loans and Advances 227.7 283.7 346.0 395.5 459.4 524.8 607.7 695.4 15.0%
Government Securities 47.5 61.1 57.8 71.7 87.6 100.1 114.4 130.9 17.8%
Other Assets 115.6 145.5 154.3 176.7 192.2 212.8 241.9 273.7 12.1%
Total Assets 390.9 490.3 558.1 643.8 739.2 837.7 964.0 1100.0 14.5%
Customer Deposits 305.7 377.3 424.4 485.5 558.3 642.1 738.4 849.2 14.9%
Other Liabilities 21.8 37.4 52.4 64.6 70.1 65.0 72.0 70.4 6.1%
Total Liabilities 327.5 414.7 476.8 550.1 628.5 707.1 810.4 919.6 14.0%
Shareholders Equity 63.4 75.6 81.3 93.7 110.8 130.7 153.6 180.4 17.3%
Book value Per share 20.4 24.4 26.2 30.2 35.7 42.1 49.5 58.1 17.3%
% Change in BPS YoY 19.4% 7.4% 15.4% 18.2% 18.0% 17.5% 17.4%

5151
Valuation Summary
KCB Group is undervalued with a total potential return of 44.7%
Cost of Equity Assumptions: 14 - June -16
Risk free rate * 13.0%
Beta 0.8
Country Risk Premium 6.7%
Extra Risk Premium 0.5%
Cost of Equity 18.6%
Terminal Assumptions:Growth rate 5.0%Mature Company Beta 1.0Terminal Cost of Equity 20.2%Return on Average Equity 23.6%Justified PBV 1.2xShareholder Equity – FY20e 180.4Terminal Value-(Year 2020) 220.3
Valuation Summary: Implied Price Weighting Weighted Value
Intrinsic Valuation 50.2 80% 40.2
PBV Multiple 44.4 15% 6.7
PE Multiple 50.2 5% 2.5
Fair Value 49.4
Current Price 35.5
Upside/(Downside) 39.0%
Dividend Yield 5.6%
Total Potential Return 44.7%
* Five years average yields on a 10 year Treasury bond

5252
III. Co-operative Bank

5353
Financial Statement Extracts
Co-operative Bank is expected to grow at a 5 Year CAGR of 12.3%
Income Statement 2013 2014 2015 2016e 2017f 2018f 2019f 2020f CAGR
Net Interest Income 18.6 21.3 23.2 24.3 25.6 28.9 33.0 37.0 9.8%
Non Funded Income 9.3 10.8 13.2 15.9 18.4 20.6 23.4 27.2 15.5%
Loan Loss Provision 0.8 1.2 2.0 2.5 2.5 2.8 3.1 3.5 11.6%
Other Operating Expenses 16.6 18.9 19.4 19.4 21.1 23.6 27.0 30.7 9.7%
Total Operating Expenses 17.4 20.1 21.4 21.9 23.6 26.4 30.2 34.2 9.8%
Profit Before Tax 10.9 10.9 15.4 18.3 20.4 23.0 26.3 29.9 14.2%
Profit After tax 9.1 8.0 11.7 12.8 14.3 16.1 18.4 20.9 12.3%
% PAT Change YoY 18.2% (12.0%) 46.0% 9.7% 11.2% 12.9% 14.2% 13.7%
EPS 1.9 1.6 2.4 2.6 2.9 3.3 3.8 4.3 12.3%
DPS 0.4 0.5 0.0 0.7 0.8 0.9 1.1 1.2 13.0%
Cost to Income 62% 63% 58.8% 54.4% 53.7% 53.4% 53.4% 53.4%
ROE 27.4% 20.0% 25.0% 23.1% 21.6% 20.9% 20.5% 20.2%
ROA 4.2% 3.1% 3.7% 3.5% 3.4% 3.5% 3.5% 3.6%
Balance Sheet 2013 2014 2015 2016e 2017f 2018f 2019f 2020f CAGRNet Loans and Advances 137.1 179.5 208.6 239.2 266.2 296.6 330.6 368.7 12.1%Government Securities 14.0 24.6 36.2 25.9 28.8 32.1 35.7 39.9 2.0%Other Assets 80.1 81.3 97.8 127.3 144.1 163.1 184.6 209.0 16.4%Total Assets 231.2 285.4 342.5 392.3 439.1 491.8 551.0 617.6 12.5%Customer Deposits 175.4 217.7 265.4 297.2 332.9 372.8 417.6 467.7 12.0%Other Liabilities 18.7 24.3 27.3 34.6 35.4 36.5 37.7 39.1 7.5%Total Liabilities 194.1 242.0 292.7 331.8 368.3 409.3 455.3 506.8 11.6%Shareholders Equity 36.8 43.3 50.2 61.1 71.4 83.0 96.3 111.3 17.3%Book value Per share 7.5 8.9 10.3 12.5 14.6 17.0 19.7 22.8 17.3%% Change in BPS YoY 23.4% 17.8% 15.9% 21.7% 16.8% 16.3% 16.0% 15.7%

5454
Valuation Summary
Co-operative Bank is fairly valued with a total potential return of (0.1%)
Cost of Equity Assumptions: 14 – June - 16
Risk free rate* 13.0%
Beta 1.0
Country Risk Premium 6.7%
Extra Risk Premium 0.3%
Cost of Equity 20.1%
Terminal Assumptions:Growth rate 5.0%Mature Company Beta 1.0Terminal Cost of Equity 20.0%Return on Average Equity 20.2%Justified Price to Book Value 1.0xShareholder Equity – FY20e 111.3Terminal Value-(Year 2019) 112.9
Valuation Summary: Implied Price Weighting Weighted Value
Intrinsic Valuation 15.6 80% 12.5
PBV Multiple 17.8 15% 2.7
PE Multiple 18.1 5% 0.9
Fair Value 16.0
Current Price 16.9
Upside/(Downside) (4.8%)
Dividend Yield 4.7%
Total Upside/(Downside) (0.1%)
* Five years average yields on a 10 year Treasury bond

5555
IV. Standard Chartered Bank

5656
Financial Statement Extracts
Standard Chartered has a high return on equity of 15.5%
Source – Company Financials
Balance Sheet 2013 2014 2015 2016e 2017f 2018f 2019f 2020f CAGR
Net Loans and Advances 129.7 122.7 115.1 124.7 138.4 152.9 168.2 184.2 8.5%
Government Securities 56.2 58.8 73.6 66.0 73.2 80.9 89.0 97.5 10.7%
Other assets 34.5 41.0 45.2 68.3 73.1 78.6 84.7 91.4 17.4%
Total Assets 220.4 222.5 234.0 258.9 284.8 312.4 341.9 373.1 10.9%
Customer Deposits 154.7 154.1 172.0 191.8 212.9 235.3 258.8 283.4 13.0%
Other Liabilities 29.5 27.8 20.7 22.1 22.5 23.1 23.6 24.3 -2.7%
Total Liabilities 184.2 181.8 192.7 213.9 235.5 258.3 282.4 307.7 11.1%
Shareholders Equity 36.2 40.7 41.3 45.0 49.3 54.1 59.5 65.4 10.0%
Book value Per share 105.4 118.4 120.1 131.1 143.5 157.5 173.2 190.4 10.0%
% Change in BPS YoY 12.3% 1.5% 9.2% 9.4% 9.7% 10.0% 10.0%
Income Statement 2013 2014 2015e 2016e 2017e 2018e 2019e 2020e CAGRNet Interest Income 16.8 17.9 18.1 19.3 20.7 23.1 25.5 28.0 7.7%Non Funded Income 7.1 8.2 7.2 8.0 9.0 9.9 11.0 12.2 6.9%Loan Loss Provision 1.0 1.3 4.9 2.0 2.2 2.5 2.7 3.0 14.8%Other Operating Expenses 9.5 10.4 11.3 11.8 12.2 13.5 14.5 16.0 7.4%Total Operating Expenses 10.5 11.7 16.2 13.9 14.5 15.9 17.3 19.0 8.3%Profit Before Tax 13.4 14.3 9.2 13.5 15.2 17.1 19.3 21.2 6.7%Profit After tax 9.3 10.4 6.3 9.4 10.6 12.0 13.5 14.8 6.0%% PAT Change YoY 14.9% 12.5% (39.2%) 48.7% 12.6% 12.9% 12.4% 10.1%EPS 27.0 30.4 18.5 27.5 30.9 34.9 39.2 43.2 6.0%DPS 13.5 11.5 12.5 16.5 18.6 21.0 23.5 25.9 14.5%Cost to Income 44.0% 45.0% 63.9% 50.7% 48.8% 48.2% 47.3% 47.2%ROaE 27.7% 27.2% 15.5% 21.9% 22.5% 23.2% 23.7% 23.8%ROaA 4.5% 4.7% 2.8% 3.8% 3.9% 4.0% 4.1% 4.2%

5757
Valuation Summary
Standard Chartered Bank is overvalued with a total potential return of 4.3%
Cost of Equity Assumptions: 14 – June - 2016
Risk free rate * 13.0%
Adjusted Beta 0.8
Country Risk Premium 6.7%
Extra Risk Premium 0.0%
Cost of Equity 18.4%
Terminal Assumptions:Growth rate 5.0%Mature Company Beta 1.0
Terminal Cost of Equity 19.7%Return on Average Equity 23.8%
Justified Price to Book Value 1.3x
Shareholder Equity - FY19e 65.4Terminal Value-(Year 2019) 83.5
Valuation Summary: Implied Price Weighting Weighted Value
Intrinsic Valuation 214.0 80.0% 171.2
PBV Multiple 200.9 15.0% 30.1
PE Multiple 144.4 5.0% 7.2
Fair Value 208.6
Current Price 212.0
Upside/(Downside) (1.6%)
Dividend Yield 5.9%
Total Potential Return 4.3%
* Five years average yields on a 10 year Treasury bond

5858
V. Barclays Bank

5959
Financial Statement Extracts
Barclays Bank has a high return on equity of 21.6%
Source – Company Financials
Income Statement 2013 2014 2015 2016e 2017f 2018f 2019f 2020f CAGRNet Interest Income 18.9 19.6 20.4 21.9 22.4 23.4 24.5 25.8 4.8%Non Funded Income 9.1 8.7 9.1 9.6 10.2 10.8 11.5 12.2 6.2%Loan Loss Provision 1.2 1.4 1.8 1.8 1.7 1.8 1.9 2.0 2.3%Other Operating Expenses 14.8 14.5 15.6 17.1 17.8 18.6 19.5 20.5 5.6%Total Operating Expenses 16.0 15.9 17.4 18.8 19.5 20.4 21.4 22.5 5.3%Profit Before Tax 11.1 12.3 12.1 12.6 13.1 13.8 14.6 15.5 5.1%Profit After tax 7.6 8.4 8.4 8.8 9.1 9.6 10.2 10.8 5.2%% PAT Change YoY 10.7% (0.4%) 5.2% 3.5% 5.5% 5.9% 6.0%EPS 1.4 1.6 1.5 1.6 1.7 1.8 1.9 2.0 5.2%DPS 0.7 1.0 1.0 1.0 1.0 1.1 1.1 1.2 45.4%Cost to Income 57.3% 56.4% 59.0% 59.9% 59.8% 59.6% 59.5% 59.3%ROaE 24.6% 23.9% 21.6% 21.1% 21.9% 21.9% 21.5% 21.2%ROaA 3.9% 3.9% 3.6% 3.6% 3.6% 3.8% 3.8% 3.9%
Balance Sheet 2013 2014 2015 2016e 2017f 2018f 2019f 2020f CAGR
Net Loans and Advances 118.4 125.4 145.4 153.1 158.9 166.8 175.2 183.9 4.8%
Government Securities 47.6 57.2 48.1 54.0 56.7 59.6 62.6 65.7 6.5%
Other Assets 40.8 43.3 47.4 49.6 54.0 56.7 59.5 62.5 5.7%
Total Assets 206.8 225.8 240.9 256.8 269.6 283.1 297.3 312.2 5.3%
Customer Deposits 151.1 164.8 165.1 180.2 189.2 198.6 208.5 219.0 5.8%
Other Liabilities 23.2 22.9 36.1 33.0 33.1 33.3 33.4 33.6 -1.4%
Total Liabilities 174.4 187.7 201.2 213.2 222.3 231.9 242.0 252.6 4.7%
Shareholders Equity 32.4 38.2 39.7 43.7 47.3 51.2 55.3 59.6 8.5%
Book value Per share 6.0 7.0 7.3 8.0 8.7 9.4 10.2 11.0 8.5%
% Change in BPS YoY 18.0% 4.0% 9.9% 8.4% 8.1% 8.0% 7.8%

6060
Valuation Summary
Barclays currently is undervalued with a total potential return of 17.6%
Cost of Equity Assumptions: 14 - June -16
Risk free rate * 13.0%
Beta 0.8
Country Risk Premium 6.7%
Extra Risk Premium 0.5%
Cost of Equity 19.0%
Terminal Assumptions:Growth rate 5.0%Mature Company Beta 1.0Terminal Cost of Equity 20.2%Return on Average Equity 21.2%Justified PBV 1.1xShareholder Equity – FY20e 59.6 Terminal Value-(Year 2020) 63.6
Valuation Summary: Implied Price Weighting Weighted Value
Intrinsic Valuation 10.5 80% 8.4
PBV Multiple 12.8 15% 1.9
PE Multiple 11.8 5% 0.6
Fair Value 10.9
Current Price 10.1
Upside/(Downside) 7.9%
Dividend Yield 9.7%
Total Potential Return 17.6%
* Five years average yields on a 10 year Treasury bond

6161
C. Tier II Banks

6262
Tier 2 banks value drivers and cons
2013
NIC Bank
Value Drivers Cons
• Increased investment in digital platforms, NICNow and Internet banking by 29% and 41%,respectively
• NIC bank has maintained its pole positioning inasset financing and curved a niche in the market
• Traditional SME market now being targeted by Tier 1banks, hence it’s market share is under threat
• Exposure to different political, economic andregulatory environments, especially in Kenya with theupcoming elections might slow down business
CfC Stanbic
• The Corporate and Investment banking is a keydriver for revenue as it contribute to 64% of thebanks total income
• Their mobile banking platform is set to reducecosts associated with branch transactions
• Political Instability in the countries they operate. Therecent instability in S.Sudan proved to be a challengeas it affected their overall income
• Their expansion strategy is limited by the presence ofStandard Bank in the region
Bank
National Bank
• Introduction of Islamic Banking that capitalized onthe unbanked Islam community contributing todeposit growth
• The introduction of bancassurance and custodialservices has seen the bank diversify its revenue
• High cost of funds. Despite NBK serving retailcustomers, it has maintained high cost of fundsaveraging 5.3% thus leading to lower NIMs of 7.0%
• Despite being associated with the Government, thebank is slow in county expansion
DTB Bank
I&M Bank
• Strong backing from financing partners, i.e. AgaKhan Fund for Economic Development and Habibbank
• Traditional SME market now being targeted by tier Ibanks hence market share under threat
• Exposure to different political, economic andregulatory environments
• They have consistently been among the mostefficient banks in Kenya from a survey released byThink Business Banking Awards
• They have also fully embraced internet bank inKenya to further help drive their efficiency
• They have not been able to aggressively marketthemselves as a local household bank as Equity, Co-opand KCB
• They face stiff competition for clients from largerexisting tier 1 bank in the SME and Retail sectors
HF Group
• Vibrant real estate market in Kenya with anannual housing supply which does not satisfydemand
• The bank is the market leader in provision ofmortgage financing
• Lack of a vibrant mortgage market in Kenya• Competition from larger banks with Mortgage
facilities poses a risk for growth• Asset liability mismatch which forces the bank to
resort to expensive financing

6363
I. National Bank of Kenya

6464
Financial Statements Extracts
National Bank is expected to grow at a 5 Year CAGR of 8.1%
Source – Company Financials
Income Statement 2013 2014 2015 2016e 2017f 2018f 2019f 2020f CAGRNet Interest Income 5.6 6.8 6.4 4.8 5.1 5.7 6.1 6.7 0.8%Non Funded Income 2.9 3.1 3.2 3.6 4.3 4.8 5.4 5.9 13.4%Loan Loss Provision 0.3 0.5 3.7 1.5 1.7 1.9 2.1 2.3 -9.0%Other Expenses 6.4 7.0 7.5 5.5 6.1 6.9 7.6 8.4 2.2%Total Operating Expenses 6.7 7.5 11.2 7.0 7.9 8.8 9.7 10.7 -0.9%Profit Before Tax 1.8 1.3 (1.6) 1.4 1.5 1.6 1.7 1.9 8.1%Profit After tax 1.1 0.9 (1.2) 1.0 1.1 1.1 1.2 1.3 8.1%% PAT Change YoY 52.5% (21.8%) (232.5%) 185.0% 7.2% 8.3% 7.4% 9.4%EPS 3.6 2.8 (3.7) 3.2 3.4 3.7 4.0 4.3 8.1%DPS - - - - - - - - N/A Cost to Income 75.3% 70.2% 78.2% 65.2% 65.5% 66.2% 66.3% 66.4%ROaE 10.0% 7.2% -9.9% 8.5% 8.4% 8.3% 8.2% 8.3%ROaA 1.4% 0.8% -0.9% 0.7% 0.7% 0.7% 0.7% 0.7%
Balance Sheet 2013 2014 2015 2016e 2017f 2018f 2019f 2020f CAGR
Net Loans and Advances 39.6 65.6 67.8 77.9 87.0 95.7 105.3 115.8 11.3%
Government Securities 27.5 30.3 27.3 30.4 33.5 36.8 40.5 44.5 10.3%
Other Assets 25.5 27.2 30.3 33.4 35.1 38.3 41.8 45.6 8.5%
Total Assets 92.6 123.1 125.4 141.7 155.6 170.8 187.6 206.0 10.4%
Customer Deposits 78.0 104.7 110.6 121.7 133.9 147.2 162.0 178.2 10.0%
Other Liabilities 2.7 6.1 3.8 8.0 8.7 9.4 10.2 11.0 23.9%
Total Liabilities 80.7 110.9 114.4 129.7 142.5 156.6 172.1 189.2 10.6%
Shareholders Equity 11.9 12.2 11.1 12.0 13.1 14.2 15.4 16.8 8.7%
Book value Per share 38.6 39.7 35.9 39.1 42.5 46.2 50.1 54.5 8.7%
% Change in BVPS 2.8% (9.6%) 8.9% 8.7% 8.7% 8.6% 8.7%

6565
Valuation Summary
National Bank is overvalued with a total potential return of (49.0%)
Cost of Equity Assumptions: 14 – June - 2016
Risk free rate * 13.0%
Beta 0.9
Country Risk Premium 6.7%
Extra Risk Premium 4.0%
Cost of Equity 22.6%
Terminal Assumptions:
Growth rate 5.0%
Mature Company Beta 1.0
Terminal Cost of Equity 23.7%
Return on Average Equity 8.3%
Justified Price to Book value per share 0.2x
Preference Shares 5.7
Valuation Summary: Implied Price Weighting Weighted Value
Intrinsic Valuation 2.6 80.0% 2.1
PBV Multiple 19.4 15.0% 2.9
PE Multiple** 7.7 5.0% 0.4
Fair Value 5.4
Current Price 10.5
Upside/(Downside) (49.0%)
Dividend Yield 0.0%
Total Potential Return (49.0%)
*-Five years average yields on a 10 year Treasury bond**- PE is calculated using Normalised Earnings

6666
II. NIC Bank

6767
Financial Statements Extracts
NIC bank has an average return on equity of 18.4%
Income Statement 2013 2014 2015 2016e 2017f 2018f 2019f 2020f CAGRNet Interest Income 7.3 8.0 9.7 11.6 12.6 13.8 15.2 16.7 15.9%Non Funded Income 3.2 3.6 4.0 4.8 5.3 5.8 6.4 7.1 14.7%Loan Loss Provision 1.1 0.3 1.7 2.9 2.9 3.3 3.6 4.0 65.1%Total Operating Expenses 5.5 5.3 7.4 9.3 10.0 11.1 12.3 13.6 20.5%Profit Before Tax 5.0 6.2 6.4 7.2 7.9 8.6 9.4 10.3 10.5%Profit After tax 3.2 4.1 4.5 5.0 5.5 6.0 6.6 7.2 11.8%% PAT Change YoY 6.7% 27.1% 8.8% 12.3% 10.2% 8.5% 9.0% 9.6%EPS 5.1 6.4 7.0 7.9 8.7 9.4 10.2 11.2 11.8%DPS 0.6 1.0 1.0 1.2 1.3 1.4 1.5 1.7 11.0%Cost to Income 52.2% 46.2% 53.6% 56.3% 55.8% 56.3% 56.7% 57.0%ROaE 20.1% 20.6% 18.4% 18.0% 17.2% 16.2% 15.4% 14.9%ROaA 2.8% 3.1% 2.9% 2.8% 2.8% 2.8% 2.8% 2.8%
Balance Sheet 2013 2014 2015 2016e 2017f 2018f 2019f 2020f CAGR
Net Loans and Advances 81.4 102.0 116.0 126.0 141.2 156.7 174.0 193.1 13.6%
Government Securities 18.1 19.2 7.5 8.1 9.0 10.0 11.1 12.3 8.5%
Other Assets 21.5 24.5 42.3 53.1 56.4 61.1 61.4 66.7 22.2%
Total Assets 121.1 145.8 165.8 187.2 206.7 227.9 246.5 272.2 13.3%
Customer Deposits 91.6 100.4 112.4 124.7 138.4 153.7 170.6 189.3 13.5%
Other Assets 11.9 22.0 27.1 32.1 33.1 34.0 30.2 30.9 7.1%
Total Liabilities 103.5 122.4 139.4 156.8 171.5 187.7 200.7 220.3 12.5%
Shareholders Equity 17.2 22.9 25.9 29.9 34.6 39.7 45.3 51.4 17.6%
Book value Per share 3.34 4.45 5.0 5.8 6.7 7.7 8.8 10.0 17.6%
% Change in BPS YoY 33.0% 13.1% 15.6% 15.8% 14.8% 14.0% 13.5%

6868
Valuation Summary
NIC bank is fairly valued with a total potential return of (0.2%)
Cost of Equity Assumptions: 14- June -16
Risk free rate * 13.0%
Beta 1.03
Mature Market Risk Premium 6.7%
Extra Risk Premium 0.0%
Cost of Equity 19.9%
Terminal Assumptions:
Growth rate 5.0%
Mature Company Beta 1.0
Terminal Cost of Equity 19.7%
Return on Average Equity 14.9%
Justified Price to Book value Per Share 0.7x
Shareholder Equity – FY’20e 51.4
Terminal Value-(Year 2020) 34.4
Valuation Summary: Implied Price Weighting Weighted Value
Intrinsic Valuation 33.6 80% 26.9
PBV Multiple 41.6 15% 6.2
PE Multiple 52.1 5% 2.6
Fair Value 35.7
Current Price 36.8
Upside/(Downside) (2.9%)
Dividend Yield 2.7%
Total Potential Return (0.2%)
* Five years average yields on a 10 year Treasury bond

6969
III. CfC Stanbic Bank

7070
Financial Statements Extracts
CfC Stanbic has a return on equity of 13.0%
Income Statement 2013 2014 2015 2016e 2017f 2018f 2019f 2020f CAGRNet Interest Income 7.5 8.5 9.3 10.7 11.7 13.0 14.4 16.0 11.4%Non Funded Income 8.7 8.4 7.6 7.9 8.9 10.1 11.5 13.0 11.2%Loan Loss Provision 0.8 0.7 0.9 1.3 1.5 1.9 2.3 2.6 23.9%Other Operating Expenses 8.2 8.5 8.7 9.4 10.4 11.6 13.0 14.8 11.2%Total Operating Expenses 9.0 9.2 9.6 10.8 11.9 13.5 15.4 17.4 12.7%Profit Before Tax 7.2 7.7 7.4 7.9 8.7 9.5 10.5 11.6 9.4%Profit After tax 5.1 5.7 4.9 5.5 6.1 6.7 7.3 8.1 10.5%% PAT Change YoY 70.3% 10.9% (13.7%) 12.5% 10.5% 9.4% 9.6% 10.5%EPS 13.0 14.4 12.4 14.0 15.4 16.9 18.5 20.5 10.5%DPS - - - - - - - - N/ACost to Income 50.7% 50.2% 51.2% 50.5% 50.5% 50.5% 50.5% 51.0%ROaE 17.2% 16.4% 13.0% 13.4% 13.0% 12.5% 12.1% 11.9%ROaA 3.2% 3.1% 2.5% 2.5% 2.4% 2.4% 2.3% 2.2%
Balance Sheet 2013 2014 2015 2016e 2017f 2018f 2019f 2020f CAGRNet Loans and Advances 103.8 101.2 128.2 141.6 160.5 182.0 206.6 234.6 12.9%Government securities 6.4 4.8 7.8 9.1 10.3 11.7 13.2 15.0 14.0%Other Assets 70.3 74.9 72.5 84.7 94.9 106.3 118.9 133.1 12.9%Total Assets 180.5 181.0 208.5 235.4 265.6 299.9 338.7 382.8 12.9%Customer Deposits 130.3 129.4 153.7 175.9 200.6 228.6 260.7 297.2 14.1%Other Liabilities 17.8 14.7 16.4 15.6 15.1 14.6 14.1 13.6 (3.7%)Total Liabilities 148.1 144.1 170.1 191.5 215.6 243.2 274.7 310.7 12.8%Shareholders Equity 32.4 36.9 38.4 43.9 50.0 56.7 64.0 72.1 13.4%Book value Per share 82.0 93.3 97.0 111.0 126.4 143.3 161.8 182.3 13.4%% Change in BVPS 13.8% 4.0% 14.4% 13.9% 13.4% 12.9% 12.6%

7171
Valuation Summary
CfC Stanbic is fairly valued with a total potential return of (1.7%)
Cost of Equity Assumptions: 14-June-16
Default Spread Adjusted Risk free rate 13.0%
Beta 0.9
Mature Market Risk Premium 6.7%
Extra Risk Premium 0.0%
Cost of Equity 19.0%
Terminal Assumptions:
Growth rate 5.0%
Mature Company Beta 1.0
Terminal Cost of Equity 19.7%
Return on Average Equity 11.9%
Persistency Factor 0.5
Justified Price to Book value per share 0.5x
Valuation Summary: Implied Price Weighting Weighted Value
Intrinsic Valuation 80.7 80% 64.6
PBV Multiple 97.1 15% 14.6
PE Multiple 89.3 5% 4.5
Fair Value 83.6
Current Price 85.0
Upside/(Downside) (1.7%)
Dividend yield 0.0%
Total Potential Return (1.7%)
* Five years average yields on a 10 year Treasury bond

7272
IV. Diamond Trust Bank

7373
Financial Statement Extracts
DTB has an estimated 5-year PAT CAGR of 17.6%
Source – Company Financials
Income Statement 2013 2014 2015 2016e 2017f 2018f 2019f 2020f CAGRNet Interest Income 11.0 12.8 15.2 19.9 23.9 28.8 34.2 39.6 21.1%Non Funded Income 3.4 3.8 4.7 4.2 4.5 6.5 7.8 9.1 14.1%Loan Loss Provision 0.9 0.9 2.2 2.7 3.5 4.2 5.0 5.9 22.1%Other Operating Expenses 6.2 7.2 8.2 10.8 12.5 16.5 19.7 21.7 21.5%Total Operating Expenses 7.2 8.1 10.3 13.5 16.0 20.7 24.7 27.6 21.6%Profit Before Tax 7.2 8.5 9.6 10.7 12.4 14.6 17.3 21.2 17.3%Profit After tax 5.2 5.7 6.6 7.5 8.7 10.2 12.1 14.8 17.6%% PAT Change YoY 9.1% 15.7% 13.0% 16.7% 17.4% 18.7% 22.4%EPS 19.6 21.4 24.8 28.0 32.7 38.4 45.5 55.7 17.6%DPS 1.9 2.2 2.5 2.8 3.3 3.8 4.6 5.6 17.6%Cost to Income 43.3% 43.4% 41.0% 44.7% 43.9% 46.8% 46.8% 44.4%ROaE 27.9% 22.8% 20.9% 18.5% 19.5% 20.5% 21.5% 17.4%ROaA 3.5% 3.0% 2.7% 2.7% 2.8% 2.9% 3.0% 2.6%
Balance Sheet 2013 2014 2015 2016e 2017f 2018f 2019f 2020f CAGR
Net Loans and Advances 110.9 137.7 177.5 213.3 254.4 305.1 361.0 427.5 19.2%
Government Securities 25.4 35.1 47.1 48.6 57.2 67.8 79.2 92.7 14.5%
Total Assets 166.5 211.5 271.6 329.9 385.8 453.7 528.1 616.3 17.8%
Customer Deposits 128.8 161.0 194.1 238.4 286.1 343.3 405.1 478.1 19.8%
Other Liabilities 14.0 18.3 39.3 36.7 37.1 38.5 40.3 42.2 1.5%
Total Liabilities 142.8 179.3 233.3 275.2 323.2 381.9 445.4 520.3 17.4%
Shareholders Equity 21.0 29.0 34.1 50.7 58.5 67.7 78.6 92.0 21.9%
Book value Per share 78.9 108.8 128.2 190.2 219.7 254.2 295.2 345.4 21.9%
% Change in BPS YoY 37.9% 17.9% 48.4% 15.5% 15.7% 16.1% 17.0%

7474
Valuation Summary
DTB’s stock is undervalued with a total potential return of 18.1%
Cost of Equity Assumptions: 14 – June - 16
Risk free rate 13.0%
Beta 0.7
Mature Market Risk Premium 6.7%
Extra Risk Premium 0.0%
Cost of Equity 17.4%
Terminal Assumptions:Growth rate 5.0%Mature Company Beta 1.0Terminal Cost of Equity 19.7%Return on Average Equity 19.1%Justified Price to Book value per share 1.0x
Shareholder Equity - FY20e 97.2
Terminal Value 93.1
Valuation Summary: Implied Price Weighting Weighted ValueIntrinsic Valuation 214.8 80.0% 171.8 PBV Multiple 147.5 15.0% 22.1 PE Multiple 204.0 5.0% 10.2
Fair Value 204.2 Current Price 175.0 Upside / (Downside) 16.7%Dividend Yield 1.4%Total Potential Return 18.1%
* Five years average yields on a 10 year Treasury bond

7575
V. I&M Holdings

7676
Financial Statements Extracts
I&M Holdings has a high return on equity at 24.8%
Income Statement 2013 2014 2015 2016e 2017f 2018f 2019f CAGRNet Interest Income 8.9 10.4 12.6 14.4 16.7 19.2 22.1 16.2%Non Funded Income 3.4 3.8 4.6 4.5 5.0 5.6 6.3 10.3%Loan Loss Provision 0.5 0.9 1.0 1.3 1.2 1.4 1.6 13.4%Other Operating Expenses 4.7 5.3 6.4 6.6 7.5 8.6 9.9 13.2%Total Operating Expenses 5.1 6.2 7.4 7.9 8.7 10.0 11.5 13.2%Profit Before Tax 7.3 8.2 10.2 11.2 13.2 15.0 17.1 15.8%Profit After tax 5.0 5.7 7.1 7.8 9.3 10.5 12.0 15.9%% PAT Change YoY 20.8% 15.3% 24.6% 9.8% 18.0% 13.8% 13.9%EPS 12.7 14.6 18.2 20.0 23.6 26.8 30.6 15.9%DPS 2.1 2.6 3.5 3.6 4.2 4.8 5.5 16.5%Cost to Income 37.9% 37.4% 37.2% 35.1% 34.8% 34.9% 35.0%ROaE 25.1% 23.9% 24.8% 22.6% 22.1% 21.0% 20.2%ROaA 3.8% 3.6% 3.9% 3.7% 3.7% 3.7% 3.6%
Balance Sheet 2013 2014 2015 2016e 2017f 2018f 2019f CAGR
Government Securities 0.0 0.0 0.0 0.0 0.0 0.0 0.0 N/A
Net Loans and Advances 91.9 112.5 127.8 140.0 162.4 186.7 214.7 13.8%
Other Assets 49.3 64.0 63.9 89.8 104.1 120.0 138.1 16.6%
Total Assets 141.2 176.5 191.7 229.8 266.5 306.7 352.9 14.9%
Customer Deposits 97.1 114.2 133.0 155.5 180.4 207.5 238.6 15.9%
Other Liabilities 20.4 34.2 25.0 34.0 38.1 42.5 47.5 6.8%
Total Liabilities 117.5 148.4 158.0 189.5 218.5 249.9 286.1 14.0%
Shareholders Equity 21.9 26.1 31.4 38.0 45.7 54.5 64.5 19.9%
Book value Per share 0.1 0.1 0.1 0.1 0.1 0.1 0.2 19.9%
% BVPS Change YoY 23.9% 18.9% 20.7% 20.9% 20.3% 19.2% 18.3%

7777
Valuation Summary
I&M is undervalued with a total potential return of 14.1%
Cost of Equity Assumptions: 14 – June - 16
Risk free rate * 13.0%
Beta 0.9
Country Risk Premium 6.7%
Extra Risk Premium 0.2%
Cost of Equity 18.9%
Terminal Assumptions:Growth rate 5.0%Mature Company Beta 1.0Terminal Cost of Equity 19.9%Return on Average Equity 19.3%Justified PBV 1.0xShareholder Equity – FY20e 75.7 Terminal Value-(Year 2020) 72.9
Valuation Summary: Implied Price Weighting Weighted Value
Intrinsic Valuation 118.7 80% 95.0
PBV Multiple 72.9 15% 10.9
PE Multiple 72.5 5% 3.6
Fair Value 109.5
Current Price 99.0
Upside/(Downside) 10.6%
Dividend Yield 3.5%
Total Potential Return 14.1%
* Five years average yields on a 10 year Treasury bond

7878
VI. HF Group

7979
Financial Statement Extracts
HF Group’s PAT is expected to grow at a 5 Year CAGR of 11.0%
Source – Company Financials
Income Statement 2013 2014 2015 2016e 2017f 2018f 2019f 2020f CAGRNet Interest Income 2.6 3.0 3.6 4.2 4.8 5.5 6.3 7.3 15.1%Non Funded Income 1.4 0.8 1.2 1.2 1.4 1.5 1.7 1.9 10.1%Loan Loss Provision 0.3 0.6 0.5 0.7 0.8 1.0 1.2 1.5 23.5%Other Operating Expenses 2.2 1.9 2.6 2.9 3.2 3.8 4.3 4.9 13.6%Total Operating Expenses 2.4 2.5 3.1 3.6 4.0 4.7 5.5 6.4 15.5%Profit Before Tax 1.5 1.4 1.8 2.0 2.2 2.4 2.6 2.9 10.4%Profit After tax 1.0 1.0 1.2 1.4 1.6 1.7 1.8 2.0 11.0%% PAT Change YoY (2.0%) 22.7% 15.7% 12.0% 9.4% 8.6% 9.5%EPS 2.9 2.8 3.4 4.0 4.4 4.9 5.3 5.8 11.0%DPS 1.7 1.5 1.3 1.5 1.7 1.8 2.0 2.2 11.1%Cost to Income 55.1% 49.2% 54.5% 52.7% 52.7% 53.2% 53.5% 53.8%ROaE 18.1% 15.7% 13.9% 11.6% 11.3% 11.5% 11.6% 11.8%ROaA 2.3% 1.8% 1.8% 1.8% 1.8% 1.7% 1.7% 1.6%
Balance Sheet 2013 2014 2015 2016e 2017f 2018f 2019f 2020f CAGR
Net Loans and Advances 35.2 45.2 53.0 61.5 69.1 78.8 89.9 103.4 14.3%
Government Securities 0.3 0.3 2.2 2.4 2.8 3.2 3.7 4.3 14.7%
Other Assets 11.9 15.5 16.5 20.4 19.7 21.3 22.8 25.0 8.7%
Total Assets 47.4 61.0 71.7 84.4 91.6 103.4 116.5 132.7 13.1%
Customer Deposits 26.5 36.1 41.7 47.3 54.4 62.6 72.0 82.7 14.7%
Other Liabilities 15.0 18.3 19.4 23.8 23.0 25.6 28.1 32.3 10.7%
Total Liabilities 41.5 54.4 61.0 71.1 77.4 88.1 100.1 115.0 13.5%
Shareholders Equity 5.9 6.6 10.6 13.3 14.2 15.3 16.4 17.7 10.7%
Book value Per share 16.8 18.8 30.4 38.0 40.8 43.8 47.1 50.6 10.7%
% Change in BPS YoY 11.9% 62.0% 24.8% 7.3% 7.4% 7.5% 7.6%

8080
Valuation Summary
HF Group is undervalued with a total potential return of 15.5%
Valuation Summary: Implied Price Weighting Weighted Value
Intrinsic Valuation 18.9 80% 15.1
PBV Multiple 33.9 15% 5.1
PE Multiple 28.5 5% 1.4
Fair Value 21.6
Current Price 20.0
Upside/(Downside) 8.0%
Dividend Yield 7.5%
Total Potential Return 15.5%
Cost of Equity Assumptions: 14 – June - 16
Risk free rate * 13.0%
Beta 1.2
Country Risk Premium 6.7%
Extra Risk Premium 0.0%
Cost of Equity 21.0%
Terminal Assumptions:Growth rate 5.0%Mature Company Beta 1.0Terminal Cost of Equity 19.7%Return on Average Equity 11.8%Justified PBV 0.5xShareholder Equity – FY20e 17.7 Terminal Value-(Year 2020) 8.2
* Five years average yields on a 10 year Treasury bond

8181
Q&A