Embed Size (px)
Citation preview
KenyaListedCommercialBanksAnalysis
CytonnH1’2016BankingSectorReport
“Transitioncontinues,toamoreregulated,yetinnovativeenvironment”
4th September,2016
22
Table of Contents
I. Overview of the Firm
II. Kenya Economic Review and Outlook
III. Kenya Banking Sector Overview
IV. Cytonn’s Banking Sector Report
A. Executive Summary
B. Banking Sector Report
V. Appendix
A. Metrics Used
B. Tier I Banks
C. Tier II Banks

33
I: Overview of the Firm

This image 44
160 Members, 1 Agenda – The Client
This image 55
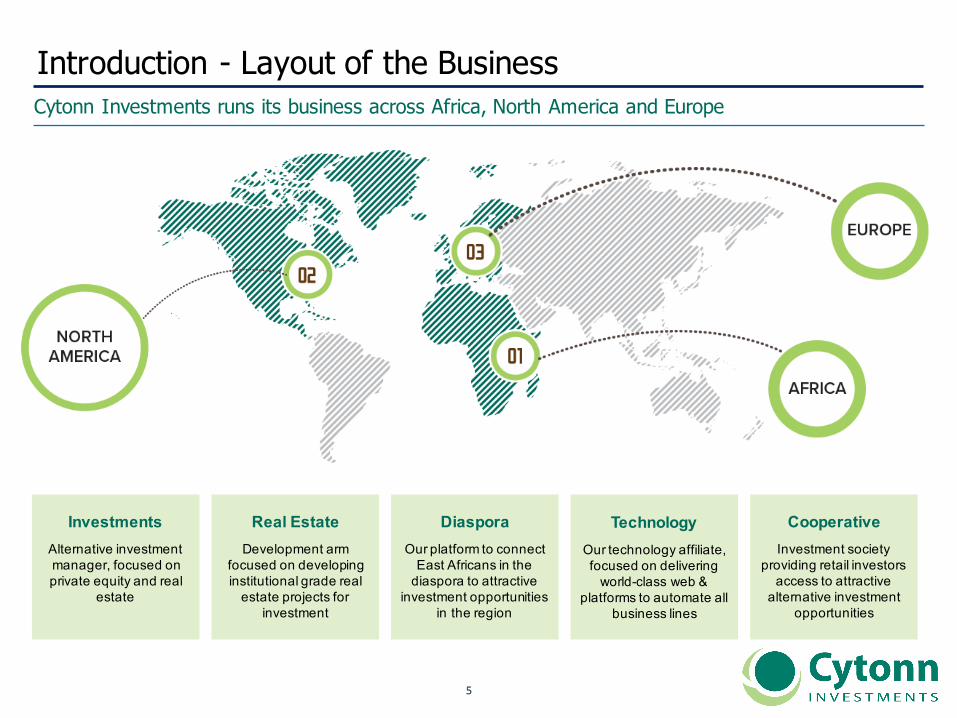
Alternative investment manager, focused on private equity and real
estate
InvestmentsDevelopment arm
focused on developing institutional grade real
estate projects for investment
Real EstateOur platform to connect
East Africans in the diaspora to attractive
investment opportunities in the region
DiasporaOur technology affiliate, focused on delivering
world-class web & platforms to automate all
business lines
TechnologyInvestment society
providing retail investors access to attractive
alternative investment opportunities
Cooperative
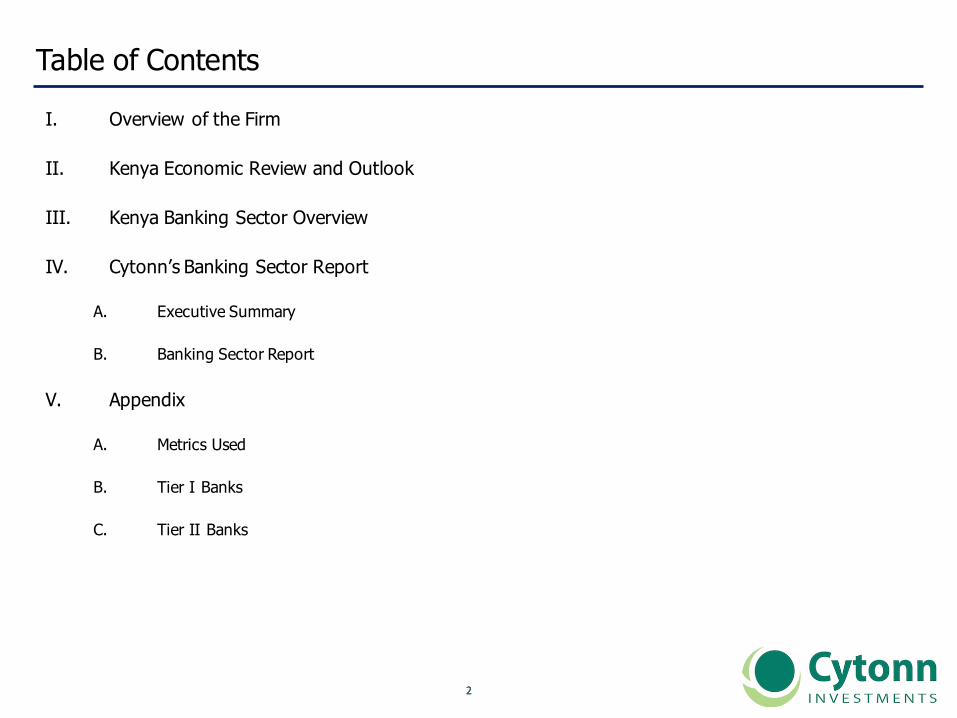
Introduction - Layout of the BusinessCytonn Investments runs its business across Africa, North America and Europe
This image 66
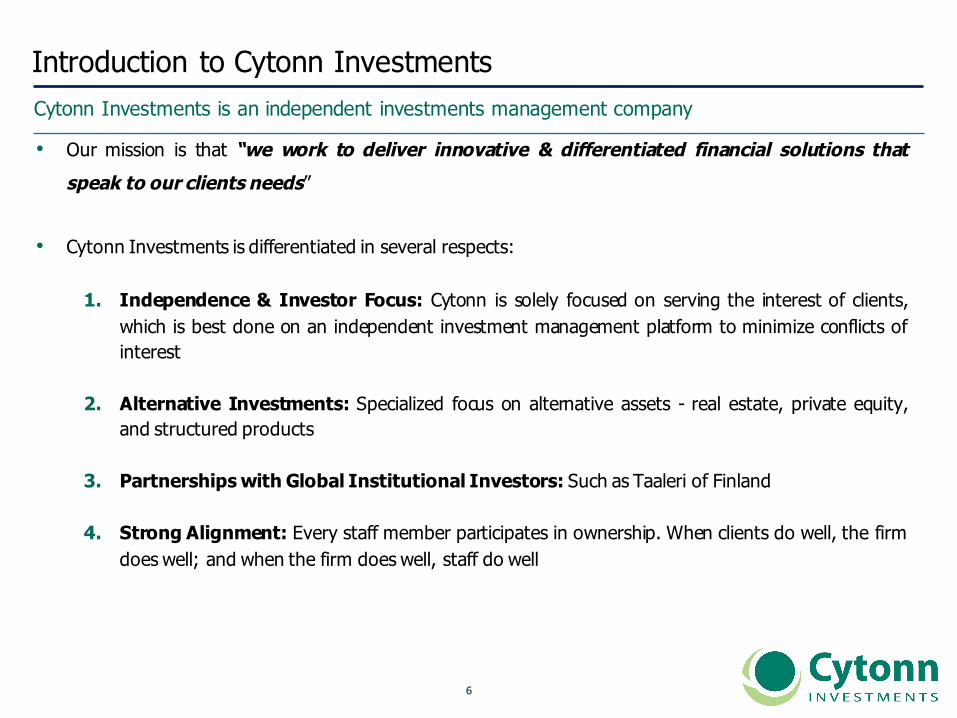
Introduction to Cytonn InvestmentsCytonn Investments is an independent investments management company
• Our mission is that “we work to deliver innovative & differentiated financial solutions thatspeak to our clients needs”
• Cytonn Investments is differentiated in several respects:
1. Independence & Investor Focus: Cytonn is solely focused on serving the interest of clients,which is best done on an independent investment management platform to minimize conflicts ofinterest
2. Alternative Investments: Specialized focus on alternative assets - real estate, private equity,and structured products
3. Partnerships with Global Institutional Investors: Such as Taaleri of Finland
4. Strong Alignment: Every staff member participates in ownership. When clients do well, the firmdoes well; and when the firm does well, staff do well
This image 77
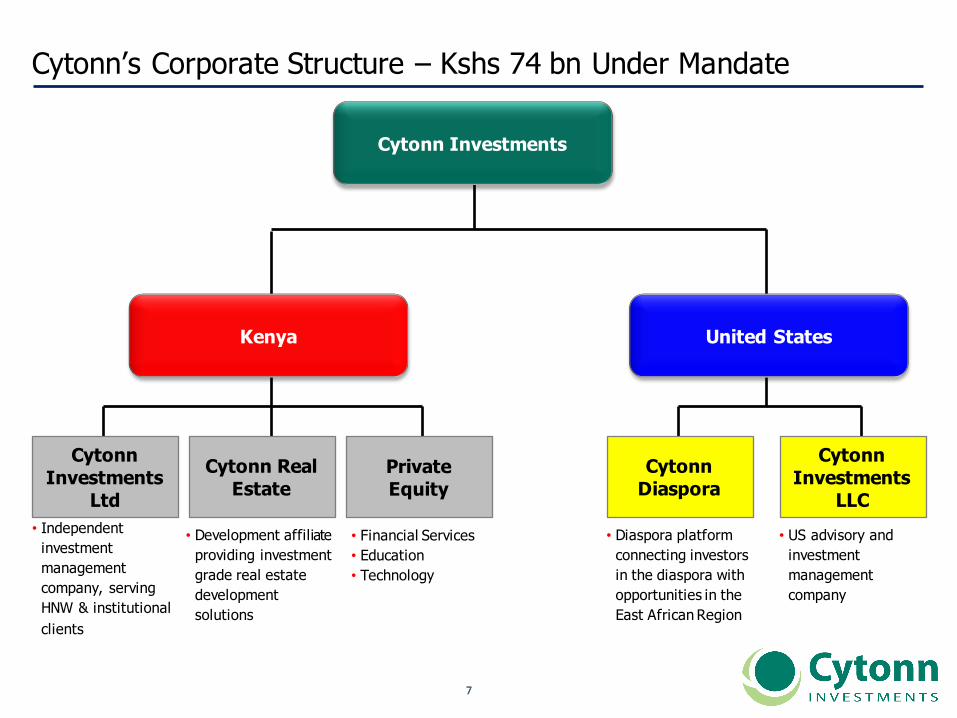
Cytonn’s Corporate Structure – Kshs 74 bn Under Mandate
• Financial Services• Education • Technology
• Diaspora platform connecting investors in the diaspora with opportunities in the East African Region
• Development affiliate providing investment grade real estate development solutions
Cytonn Investments
Cytonn Investments
LtdCytonn Real
EstateCytonn
DiasporaCytonn
Investments LLC
• Independent investment management company, serving HNW & institutional clients
• US advisory and investment management company
Kenya United States
Private Equity

This image 88
Board of Directors The board is comprised of 10 members from diverse backgrounds, each bringing in unique skill-sets
Prof. Daniel Mugendi,Chairman
Antti – Jussi Ahveninen,Non-executive Director
Madhav Bhalla,Non-executive Director
James Maina,Non-executive Director
Nasser Olwero,Non-executive Director
Mike Bristow,Non-executive Director
Edwin H. Dande,Managing Partner & CEO
Elizabeth N. Nkukuu,Partner & CIO
Patricia N. Wanjama,Partner & Head of Legal
Rose Kimotho, M.B.SNon-executive Director

This image 99
The Management Team The team brings in diverse global and local experience in investments, real estate, finance and brand
Edwin H. Dande,Managing Partner & CEO
Elizabeth N. Nkukuu,Partner & CIO
Patricia N. Wanjama,Partner & Head of Legal
Maurice Oduor,Investment Manager
Johnson Denge,Real Estate Services Manager
Shiv Arora,Head of Private Equity Real Estate
Frank Ndubi,Quality Assurance Manager
Josephat Gichimu,Finance Manager

This image 1010
The Management Team The team brings in diverse global and local experience in investments, real estate, finance and brand
Peter Karenju,Project Manager
Gaurang Chavda,Head of Private Wealth Management
Winfred Ndung'u,Brand & Business Admin Manager
Beverlyn Naliaka,PR & Communication
Martin GitongaProject Manager
Robert M Mwebi,Project Manager
Nyambura Kiarie,Real Estate Agency Manager
This image 1111
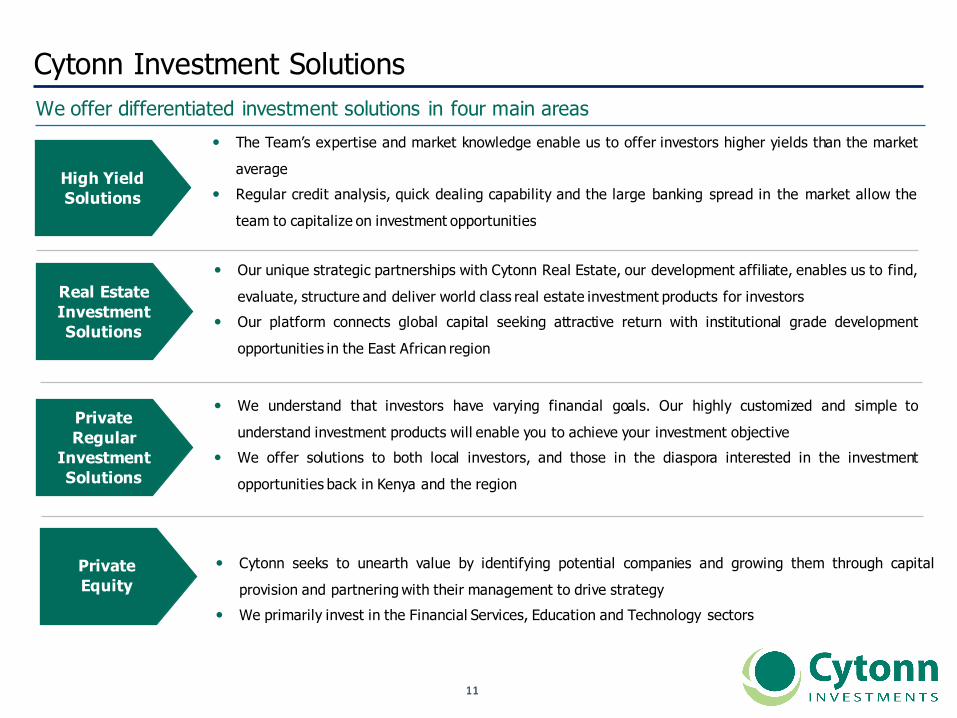
Cytonn Investment Solutions We offer differentiated investment solutions in four main areas
High Yield Solutions
� The Team’s expertise and market knowledge enable us to offer investors higher yields than the market
average� Regular credit analysis, quick dealing capability and the large banking spread in the market allow the
team to capitalize on investment opportunities
Real Estate Investment Solutions
� Our unique strategic partnerships with Cytonn Real Estate, our development affiliate, enables us to find,
evaluate, structure and deliver world class real estate investment products for investors� Our platform connects global capital seeking attractive return with institutional grade development
opportunities in the East African region
Private Regular
Investment Solutions
� We understand that investors have varying financial goals. Our highly customized and simple to
understand investment products will enable you to achieve your investment objective� We offer solutions to both local investors, and those in the diaspora interested in the investment
opportunities back in Kenya and the region
Private Equity
� Cytonn seeks to unearth value by identifying potential companies and growing them through capital
provision and partnering with their management to drive strategy� We primarily invest in the Financial Services, Education and Technology sectors
This image 1212
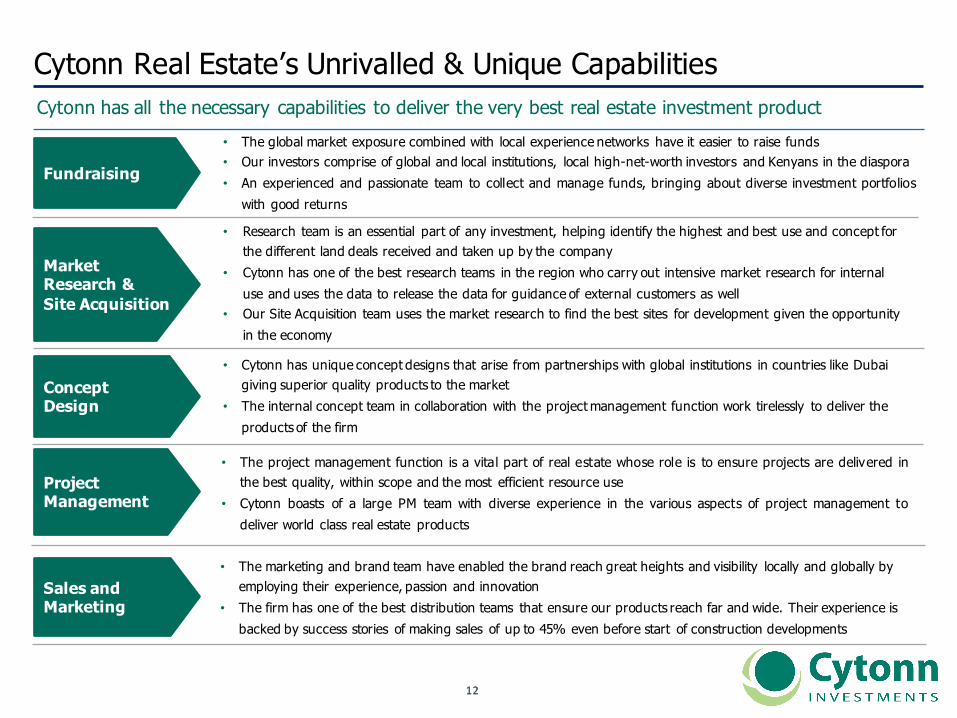
Cytonn Real Estate’s Unrivalled & Unique Capabilities
Fundraising
MarketResearch & Site Acquisition
Project Management
ConceptDesign
Cytonn has all the necessary capabilities to deliver the very best real estate investment product
• The project management function is a vital part of real estate whose role is to ensure projects are delivered inthe best quality, within scope and the most efficient resource use
• Cytonn boasts of a large PM team with diverse experience in the various aspects of project management todeliver world class real estate products
• The global market exposure combined with local experience networks have it easier to raise funds• Our investors comprise of global and local institutions, local high-net-worth investors and Kenyans in the diaspora• An experienced and passionate team to collect and manage funds, bringing about diverse investment portfolios
with good returns
• Cytonn has unique concept designs that arise from partnerships with global institutions in countries like Dubai giving superior quality products to the market
• The internal concept team in collaboration with the project management function work tirelessly to deliver the products of the firm
• Research team is an essential part of any investment, helping identify the highest and best use and concept for the different land deals received and taken up by the company
• Cytonn has one of the best research teams in the region who carry out intensive market research for internal use and uses the data to release the data for guidance of external customers as well
• Our Site Acquisition team uses the market research to find the best sites for development given the opportunity in the economy
• The marketing and brand team have enabled the brand reach great heights and visibility locally and globally by employing their experience, passion and innovation
• The firm has one of the best distribution teams that ensure our products reach far and wide. Their experience is backed by success stories of making sales of up to 45% even before start of construction developments
Sales and Marketing
This image 1313
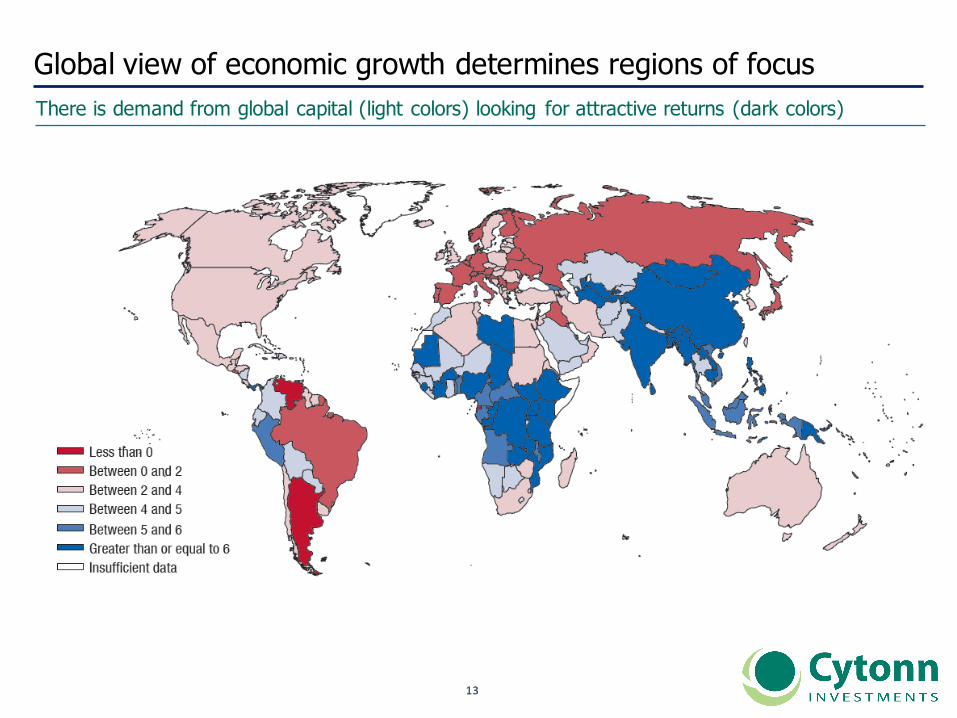
Global view of economic growth determines regions of focus There is demand from global capital (light colors) looking for attractive returns (dark colors)
This image 1414
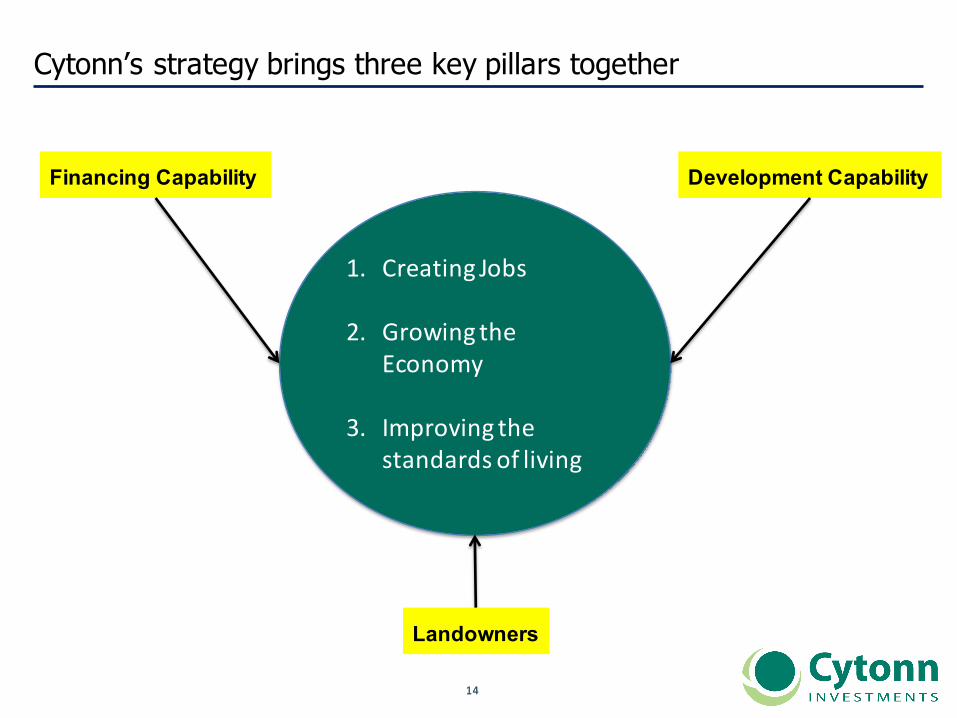
Cytonn’s strategy brings three key pillars together
1. CreatingJobs
2. GrowingtheEconomy
3. Improvingthestandardsofliving
Financing Capability Development Capability
Landowners
This image 1515
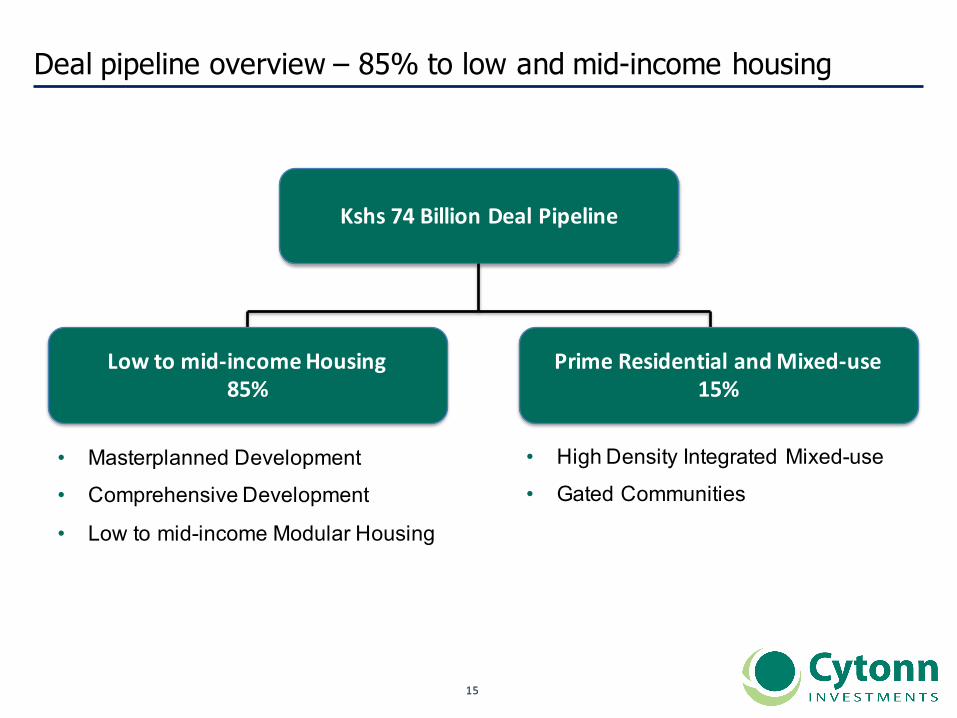
Deal pipeline overview – 85% to low and mid-income housing
Kshs74BillionDealPipeline
Lowtomid-incomeHousing85%
• Masterplanned Development
• Comprehensive Development
• Low to mid-income Modular Housing
• High Density Integrated Mixed-use
• Gated Communities
PrimeResidentialandMixed-use15%
This image 1616
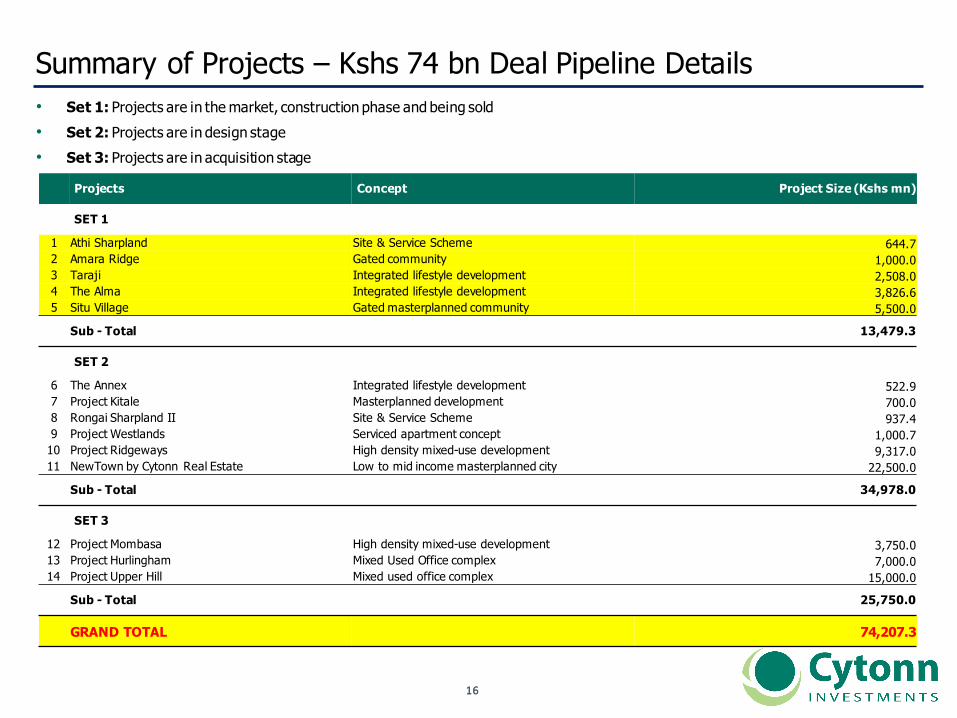
Summary of Projects – Kshs 74 bn Deal Pipeline Details• Set 1: Projects are in the market, construction phase and being sold• Set 2: Projects are in design stage• Set 3: Projects are in acquisition stage
Projects Concept Project Size (Kshs mn)
SET 1
1 Athi Sharpland Site & Service Scheme 644.7 2 Amara Ridge Gated community 1,000.0 3 Taraji Integrated lifestyle development 2,508.04 The Alma Integrated lifestyle development 3,826.6 5 Situ Village Gated masterplanned community 5,500.0
Sub - Total 13,479.3
SET 2
6 The Annex Integrated lifestyle development 522.9 7 Project Kitale Masterplanned development 700.0 8 Rongai Sharpland II Site & Service Scheme 937.4 9 Project Westlands Serviced apartment concept 1,000.7
10 Project Ridgeways High density mixed-use development 9,317.0 11 NewTown by Cytonn Real Estate Low to mid income masterplanned city 22,500.0
Sub - Total 34,978.0
SET 3
12 Project Mombasa High density mixed-use development 3,750.0 13 Project Hurlingham Mixed Used Office complex 7,000.0 14 Project Upper Hill Mixed used office complex 15,000.0
Sub - Total 25,750.0
GRAND TOTAL 74,207.3
1717
II. Kenya Economic Review and Outlook
1818
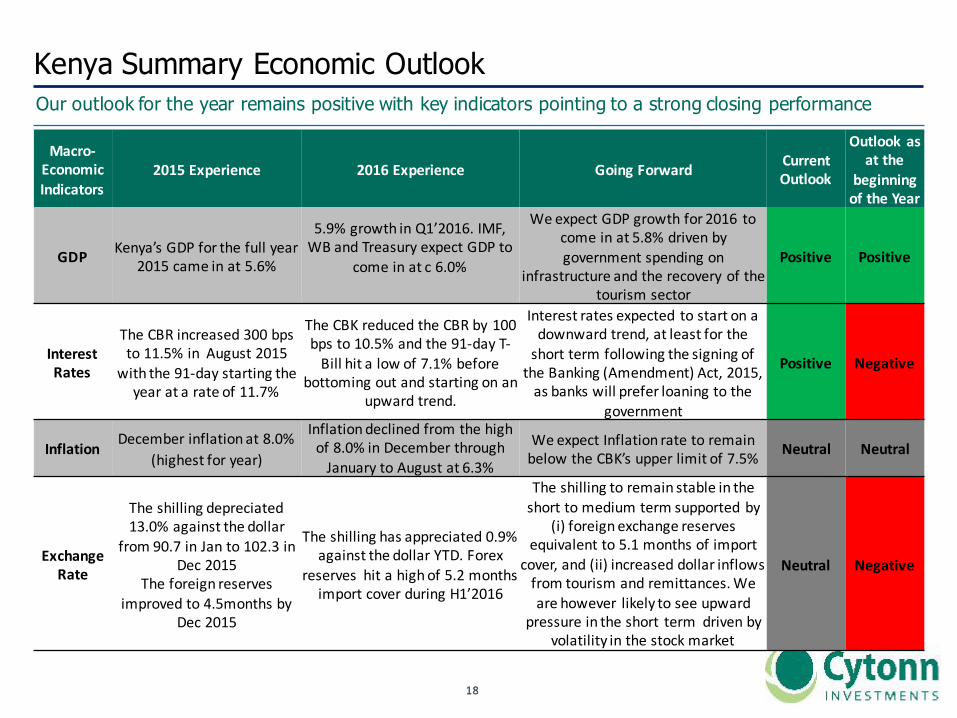
Kenya Summary Economic Outlook Our outlook for the year remains positive with key indicators pointing to a strong closing performance
Macro-EconomicIndicators
2015Experience 2016Experience GoingForward CurrentOutlook
Outlookasatthe
beginningoftheYear
GDP Kenya’sGDPforthefullyear2015cameinat5.6%
5.9%growthinQ1’2016.IMF,WBandTreasuryexpectGDPto
comeinatc6.0%
WeexpectGDPgrowthfor2016 tocomeinat5.8%drivenbygovernmentspendingon
infrastructureandtherecoveryofthetourismsector
Positive Positive
InterestRates
TheCBRincreased300bpsto 11.5%in August2015
with the91-daystarting theyearatarateof11.7%
TheCBKreducedtheCBRby100bpsto10.5%andthe91-dayT-Bill hitalowof7.1%before
bottomingoutandstartingonanupwardtrend.
Interestratesexpected tostartonadownwardtrend,atleastfortheshorttermfollowingthesigningoftheBanking(Amendment)Act,2015,asbankswillpreferloaningtothe
government
Positive Negative
Inflation Decemberinflationat8.0%(highestforyear)
Inflationdeclinedfromthehighof8.0%inDecemberthroughJanuarytoAugustat6.3%
WeexpectInflationratetoremainbelowtheCBK’supperlimitof7.5% Neutral Neutral
ExchangeRate
Theshillingdepreciated13.0%againstthedollar
from90.7inJanto102.3inDec2015
Theforeignreservesimprovedto4.5monthsby
Dec2015
Theshillinghasappreciated0.9%againstthedollar YTD.Forex
reserveshitahighof5.2monthsimportcoverduringH1’2016
Theshillingtoremainstableintheshorttomediumtermsupportedby
(i)foreignexchangereservesequivalentto5.1monthsofimport
cover,and(ii)increased dollarinflowsfromtourismandremittances.Wearehowever likelytoseeupward
pressureintheshort termdrivenbyvolatilityinthestockmarket
Neutral Negative
1919
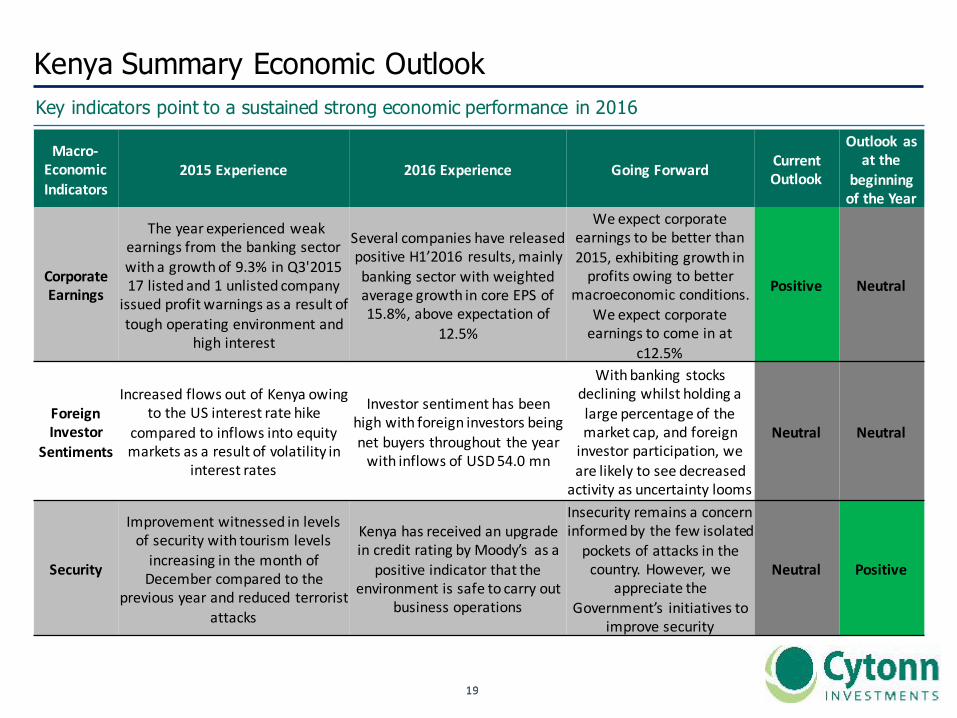
Kenya Summary Economic Outlook Key indicators point to a sustained strong economic performance in 2016
Macro-EconomicIndicators
2015Experience 2016Experience GoingForward CurrentOutlook
Outlookasatthe
beginningoftheYear
CorporateEarnings
Theyearexperiencedweakearningsfromthebankingsectorwithagrowthof9.3%inQ3'201517listedand1unlistedcompanyissuedprofitwarnings asaresultoftoughoperatingenvironmentand
highinterest
Several companieshavereleasedpositiveH1’2016 results,mainlybankingsectorwithweightedaveragegrowthincoreEPSof15.8%,aboveexpectationof
12.5%
Weexpectcorporateearningstobebetterthan2015,exhibitinggrowthinprofitsowingtobetter
macroeconomicconditions.Weexpectcorporateearningstocomeinat
c12.5%
Positive Neutral
ForeignInvestor
Sentiments
IncreasedflowsoutofKenyaowingtotheUSinterestratehike
compared toinflowsintoequitymarketsasaresultofvolatilityin
interestrates
Investorsentimenthas beenhighwithforeigninvestors beingnetbuyersthroughout theyearwithinflowsofUSD54.0mn
Withbankingstocksdecliningwhilstholdingalargepercentageofthemarketcap,andforeigninvestorparticipation,wearelikelytoseedecreasedactivityasuncertaintylooms
Neutral Neutral
Security
Improvement witnessedinlevelsofsecuritywithtourismlevelsincreasinginthemonthofDecembercomparedtothe
previousyearandreduced terroristattacks
Kenyahasreceived anupgradeincreditratingbyMoody’s asa
positiveindicatorthattheenvironmentissafetocarryout
businessoperations
Insecurityremainsaconcerninformedby thefewisolatedpocketsofattacksinthecountry.However,we
appreciatetheGovernment’s initiativesto
improvesecurity
Neutral Positive
2020
III. Kenya Banking Sector Overview
2121
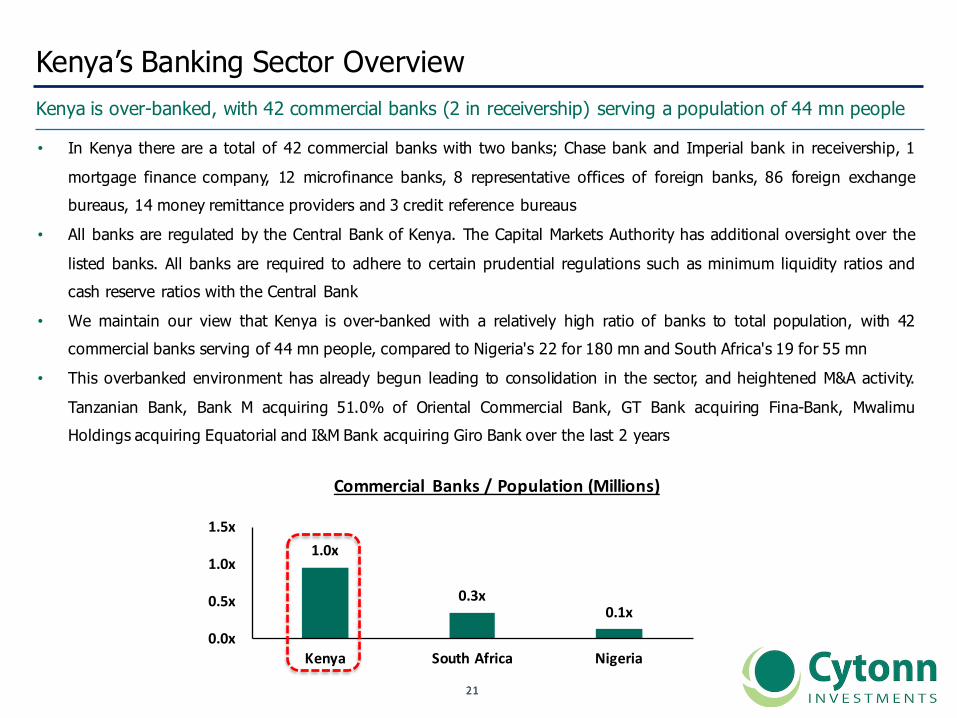
• In Kenya there are a total of 42 commercial banks with two banks; Chase bank and Imperial bank in receivership, 1
mortgage finance company, 12 microfinance banks, 8 representative offices of foreign banks, 86 foreign exchangebureaus, 14 money remittance providers and 3 credit reference bureaus
• All banks are regulated by the Central Bank of Kenya. The Capital Markets Authority has additional oversight over the
listed banks. All banks are required to adhere to certain prudential regulations such as minimum liquidity ratios andcash reserve ratios with the Central Bank
• We maintain our view that Kenya is over-banked with a relatively high ratio of banks to total population, with 42commercial banks serving of 44 mn people, compared to Nigeria's 22 for 180 mn and South Africa's 19 for 55 mn
• This overbanked environment has already begun leading to consolidation in the sector, and heightened M&A activity.
Tanzanian Bank, Bank M acquiring 51.0% of Oriental Commercial Bank, GT Bank acquiring Fina-Bank, MwalimuHoldings acquiring Equatorial and I&M Bank acquiring Giro Bank over the last 2 years
1.0x
0.3x0.1x
0.0x
0.5x
1.0x
1.5x
Kenya SouthAfrica Nigeria
Commercial Banks/Population(Millions)
Kenya’s Banking Sector OverviewKenya is over-banked, with 42 commercial banks (2 in receivership) serving a population of 44 mn people
2222
Transition continues, to a more regulated, yet innovative environment
2013
Summary Effect on Banking Sector
Sector Realignment
Transition Area
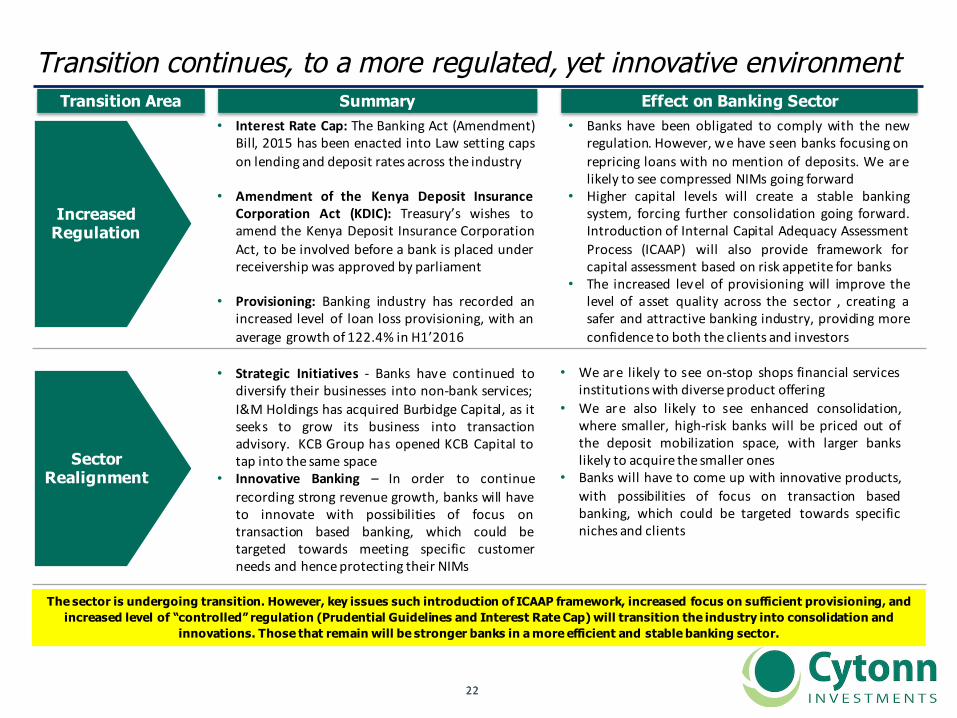
The sector is undergoing transition. However, key issues such introduction of ICAAP framework, increased focus on sufficient provisioning, and increased level of “controlled” regulation (Prudential Guidelines and Interest Rate Cap) will transition the industry into consolidation and
innovations. Those that remain will be stronger banks in a more efficient and stable banking sector.
Increased Regulation
• Interest Rate Cap: The Banking Act (Amendment)Bill, 2015 has been enacted into Law setting capson lending and deposit rates across the industry
• Amendment of the Kenya Deposit InsuranceCorporation Act (KDIC): Treasury’s wishes toamend the Kenya Deposit Insurance CorporationAct, to be involved before a bank is placed underreceivership was approved by parliament
• Provisioning: Banking industry has recorded anincreased level of loan loss provisioning, with anaverage growth of 122.4% in H1’2016
• Strategic Initiatives - Banks have continued todiversify their businesses into non-bank services;I&M Holdings has acquired Burbidge Capital, as itseeks to grow its business into transactionadvisory. KCB Group has opened KCB Capital totap into the same space
• Innovative Banking – In order to continuerecording strong revenue growth, banks will haveto innovate with possibilities of focus ontransaction based banking, which could betargeted towards meeting specific customerneeds and henceprotecting their NIMs
• Banks have been obligated to comply with the newregulation. However, we have seen banks focusing onrepricing loans with no mention of deposits. We arelikely to see compressed NIMs going forward
• Higher capital levels will create a stable bankingsystem, forcing further consolidation going forward.Introduction of Internal Capital Adequacy AssessmentProcess (ICAAP) will also provide framework forcapital assessment based on risk appetite for banks
• The increased level of provisioning will improve thelevel of asset quality across the sector , creating asafer and attractive banking industry, providing moreconfidence to both the clients and investors
• We are likely to see on-stop shops financial servicesinstitutionswith diverseproduct offering
• We are also likely to see enhanced consolidation,where smaller, high-risk banks will be priced out ofthe deposit mobilization space, with larger bankslikely to acquire the smaller ones
• Banks will have to come up with innovative products,with possibilities of focus on transaction basedbanking, which could be targeted towards specificniches and clients
2323
Growth in the Banking SectorListed bank’s H1’2016 EPS grew by 15.8% y/y on the back of an improved macroeconomic environment,but of note was that loan growth outpaced deposit growth
2012
2013
• Banking sector in Kenya experienced growth in H1’2016 in assets, deposits, profitability and products offering, leveraging
on diversification to alternative channels, supported by favourable macroeconomic environment
• The listed banking sector’s aggregate gross loans and advances grew by 6.6% to Kshs. 1.7 trillion in June 2016 from
Kshs. 1.6 trillion in June 2015 while deposits grew by 7.6% to Kshs. 2.1 trillion in June 2016 from Kshs. 2.0 trillion in June
2015
• Total assets grew by 6.3% in June 2016 to Kshs 2.9 trillion, from Kshs 2.7 trillion in June 2015
• Since 2010 the aggregate of listed banks profit after tax has grown at a CAGR of 11.1%
• Since 2010, deposits have grown at a CAGR of 15.2%, with loans and advances having outpaced deposit growth at a
CAGR of 17.9%
• Growth has mainly been underpinned by:
Ø Banks responding to the needs of the Kenyan market for convenience and efficiency throughalternative banking channels such as mobile, internet and agency banking
Ø Branch network expansion strategy both in Kenya and in the East African community region
2424
Banking Sector Growth DriversAlternative channels, cost containment and expansion support banks’ growth and diversification
2012
2013
1) Technology to enhance cost containment initiatives: Banks have embraced integration with mobile application
platforms and internet banking, and this has led to lots of efficiency in distribution, leading to increased uptake of banking
services, particularly in the mass market
2) Adoption of Agency Banking: The agency banking model has reduction of the operating expenses and improve efficiency
and will be a key driver for diversification. This also ensures a much wider reach
3) Growth of the retail segment and the middle class : As the middle-class grows rapidly in Kenya, faster than majority
of the countries in the region, there is an inherent increase in consumption expenditure and an increase in the percentage of
the population which will require banking services
4) Expansion both regionally and domestically: With increased financial inclusion in Kenya at 75%, banks looking to
expand in the less penetrated markets of Tanzania, Uganda, Rwanda, South Sudan and DR Congo are opening up new
channels of revenue in countries with relativel y attractive spreads compared to Kenya. However risks present themselves as
witnessed with the recent political instability in S. Sudan. Most banks bottom lines have not benefited much by the regional
expansions
5) Regulatory Environment: The CBK has tightened its regulations on banks with emphasis on transparency on lending
rates, governance and capitalization. Banks are expected to remain stable and position themselves for stable growth
2525
Recent Developments in the Banking SectorThe Banking Act (Amendment) Bill, 2015 was signed into law setting new stage for pricing of loans & deposits
2012
2013
1. Continued increase in Loan Loss Provisions: With increased supervision of banks following the closure of
Imperial Bank, Dubai Bank and Chase Bank, we have seen a jump in loss provisions with the most notable being theincrease in the non-listed banks’ loan loss provisions by 392.9% in H1’2016 and that of listed banks by 122.4% noting
the increment in the level of credit risk across the whole sector
2. Signing of The Banking Act (Amendment) Bill, 2015: The Bill to amend the Banking Act, 2015 by placingrestrictions on the rate which banks offer on loans and deposits was signed by the President. This amendment will
put a cap on lending rates at 4.0% above the base lending rate and a floor on the deposit rates at 70.0% of the baselending rate. The enactment of this amendment will see banks make changes to their products, clientele focus,
interest rates and expenses
3. Amendment of The Kenya Deposit Insurance Corporation Act: The Parliament has passed a bill that requiresTreasury to be consulted by CBK before a bank is placed under receivership,
4. Internal Capital Adequacy Assessment Process (ICAAP) - The Central Bank of Kenya (CBK) has developeddraft guidelines on ICAAP that seeks to enable banks and mortgage finance institutions in determining the level of
capital adequate to cover for their respective risks. Under the guideline all banks and mortgage finance institutions
are required to formulate their own ICAAP that ensures that overall internal capital levels are adequate and consistentwith their strategies, business plans, risk profiles and operating environments
2626
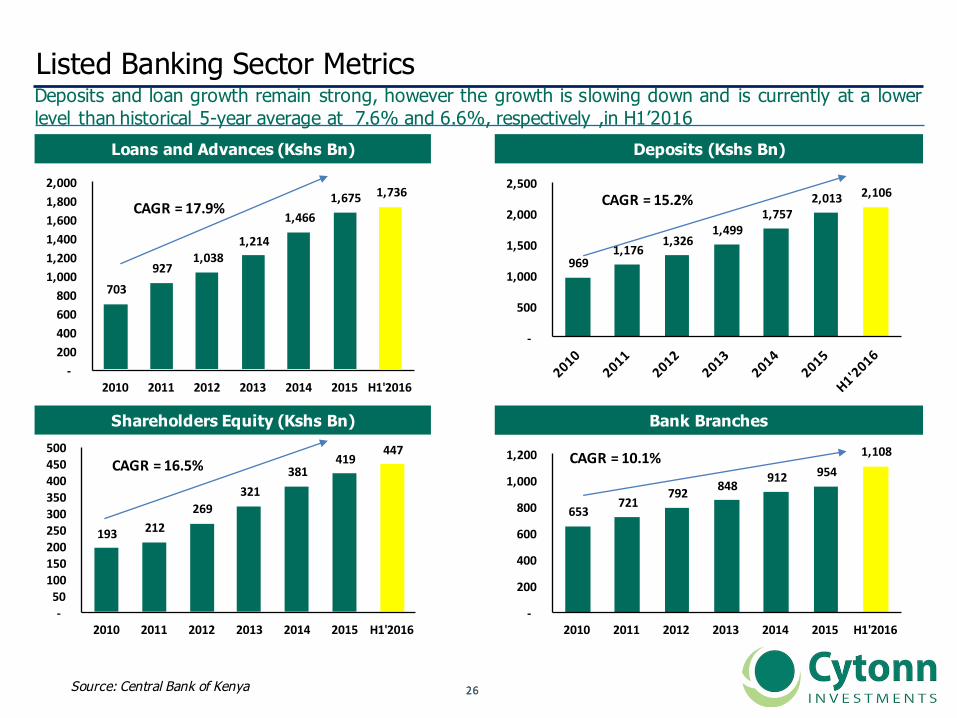
Listed Banking Sector MetricsDeposits and loan growth remain strong, however the growth is slowing down and is currently at a lowerlevel than historical 5-year average at 7.6% and 6.6%, respectively ,in H1’2016
Loans and Advances (Kshs Bn) Deposits (Kshs Bn)
Shareholders Equity (Kshs Bn)
Source: Central Bank of Kenya
Bank Branches
703927
1,0381,214
1,4661,675 1,736
-200400600800
1,0001,2001,4001,6001,8002,000
2010 2011 2012 2013 2014 2015 H1'2016
9691,176
1,3261,499
1,7572,013 2,106
-
500
1,000
1,500
2,000
2,500
193 212269
321381
419447
-50100150200250300350400450500
2010 2011 2012 2013 2014 2015 H1'2016
653721
792 848 912 9541,108
-
200
400
600
800
1,000
1,200
2010 2011 2012 2013 2014 2015 H1'2016
CAGR=17.9% CAGR=15.2%
CAGR=16.5% CAGR=10.1%
2727
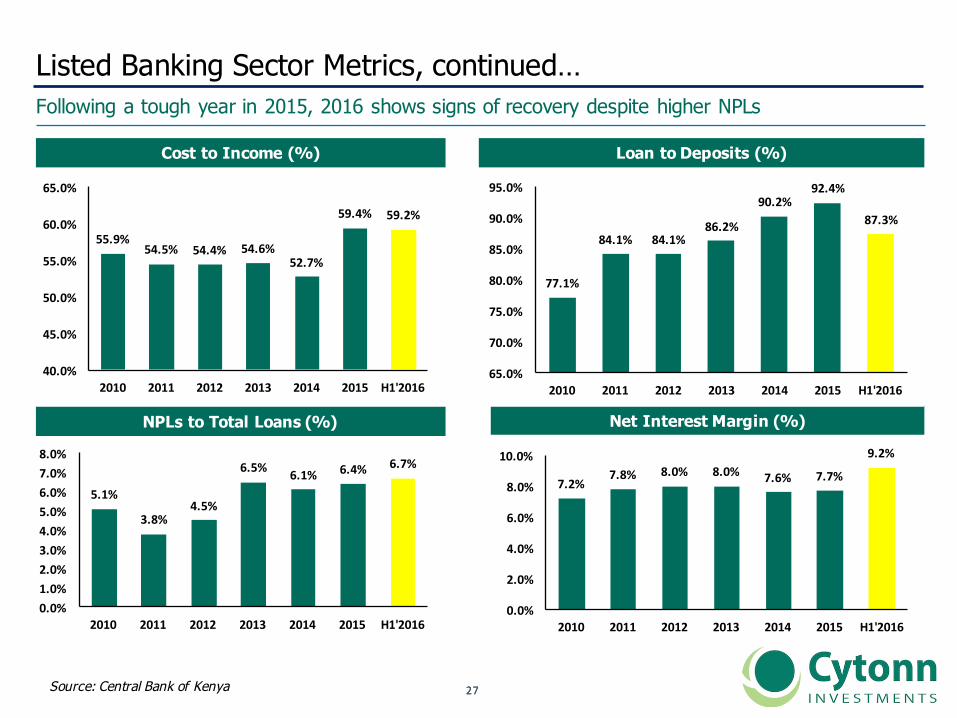
Listed Banking Sector Metrics, continued…Following a tough year in 2015, 2016 shows signs of recovery despite higher NPLs
Cost to Income (%) Loan to Deposits (%)
NPLs to Total Loans (%) Net Interest Margin (%)
Source: Central Bank of Kenya
55.9%54.5% 54.4% 54.6%
52.7%
59.4% 59.2%
40.0%
45.0%
50.0%
55.0%
60.0%
65.0%
2010 2011 2012 2013 2014 2015 H1'2016
77.1%
84.1% 84.1%86.2%
90.2%92.4%
87.3%
65.0%
70.0%
75.0%
80.0%
85.0%
90.0%
95.0%
2010 2011 2012 2013 2014 2015 H1'2016
5.1%
3.8%4.5%
6.5% 6.1% 6.4% 6.7%
0.0%1.0%2.0%3.0%4.0%5.0%6.0%7.0%8.0%
2010 2011 2012 2013 2014 2015 H1'2016
7.2%7.8% 8.0% 8.0% 7.6% 7.7%
9.2%
0.0%
2.0%
4.0%
6.0%
8.0%
10.0%
2010 2011 2012 2013 2014 2015 H1'2016
2828
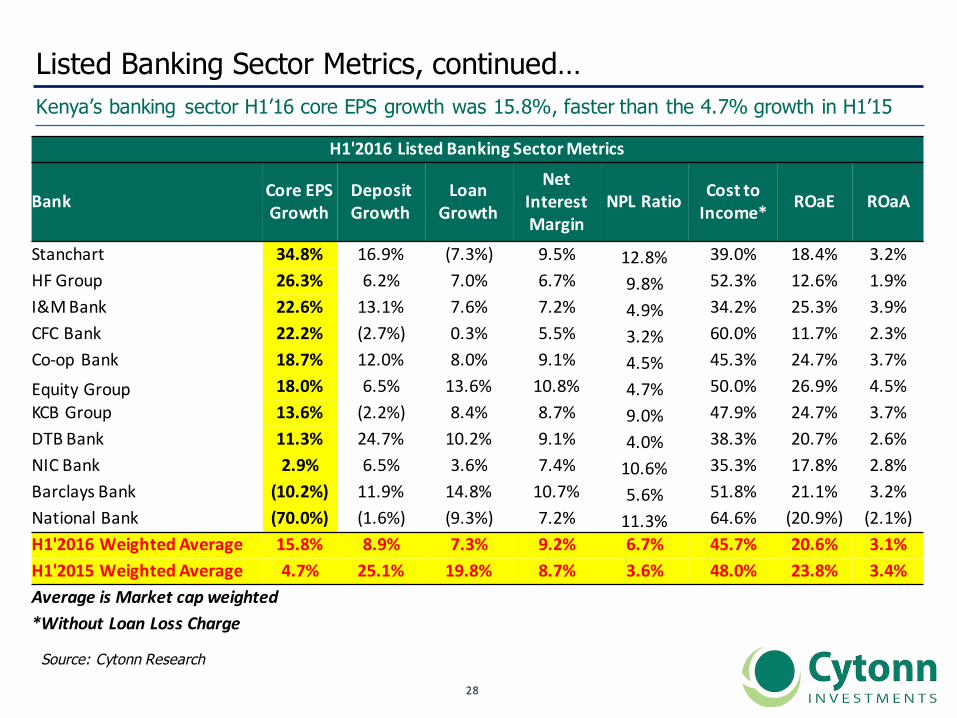
Listed Banking Sector Metrics, continued…Kenya’s banking sector H1’16 core EPS growth was 15.8%, faster than the 4.7% growth in H1’15
Source: Cytonn Research
H1'2016ListedBankingSectorMetrics
Bank CoreEPSGrowth
DepositGrowth
LoanGrowth
NetInterestMargin
NPLRatio CosttoIncome* ROaE ROaA
Stanchart 34.8% 16.9% (7.3%) 9.5% 12.8% 39.0% 18.4% 3.2%HFGroup 26.3% 6.2% 7.0% 6.7% 9.8% 52.3% 12.6% 1.9%I&MBank 22.6% 13.1% 7.6% 7.2% 4.9% 34.2% 25.3% 3.9%CFCBank 22.2% (2.7%) 0.3% 5.5% 3.2% 60.0% 11.7% 2.3%Co-opBank 18.7% 12.0% 8.0% 9.1% 4.5% 45.3% 24.7% 3.7%EquityGroup 18.0% 6.5% 13.6% 10.8% 4.7% 50.0% 26.9% 4.5%KCBGroup 13.6% (2.2%) 8.4% 8.7% 9.0% 47.9% 24.7% 3.7%DTBBank 11.3% 24.7% 10.2% 9.1% 4.0% 38.3% 20.7% 2.6%NICBank 2.9% 6.5% 3.6% 7.4% 10.6% 35.3% 17.8% 2.8%BarclaysBank (10.2%) 11.9% 14.8% 10.7% 5.6% 51.8% 21.1% 3.2%NationalBank (70.0%) (1.6%) (9.3%) 7.2% 11.3% 64.6% (20.9%) (2.1%)H1'2016WeightedAverage 15.8% 8.9% 7.3% 9.2% 6.7% 45.7% 20.6% 3.1%H1'2015WeightedAverage 4.7% 25.1% 19.8% 8.7% 3.6% 48.0% 23.8% 3.4%AverageisMarketcapweighted*WithoutLoanLossCharge
2929
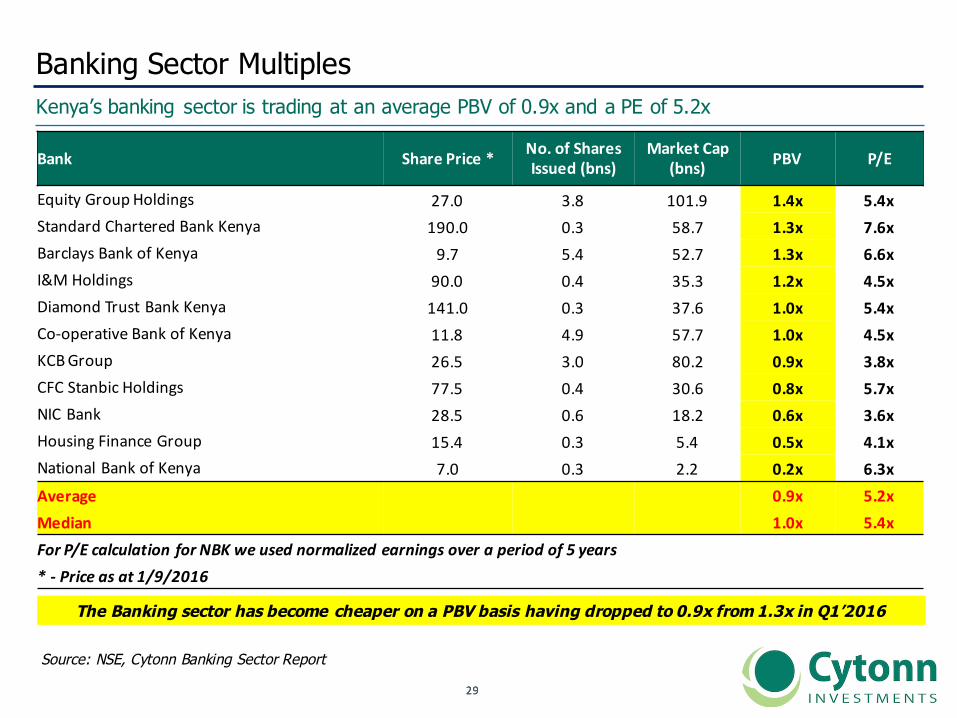
Banking Sector MultiplesKenya’s banking sector is trading at an average PBV of 0.9x and a PE of 5.2x
Source: NSE, Cytonn Banking Sector Report
The Banking sector has become cheaper on a PBV basis having dropped to 0.9x from 1.3x in Q1’2016
Bank SharePrice* No.ofSharesIssued(bns)
MarketCap(bns) PBV P/E
EquityGroupHoldings 27.0 3.8 101.9 1.4x 5.4xStandardCharteredBankKenya 190.0 0.3 58.7 1.3x 7.6xBarclaysBankofKenya 9.7 5.4 52.7 1.3x 6.6xI&MHoldings 90.0 0.4 35.3 1.2x 4.5xDiamondTrustBankKenya 141.0 0.3 37.6 1.0x 5.4xCo-operativeBankofKenya 11.8 4.9 57.7 1.0x 4.5xKCBGroup 26.5 3.0 80.2 0.9x 3.8xCFCStanbicHoldings 77.5 0.4 30.6 0.8x 5.7xNICBank 28.5 0.6 18.2 0.6x 3.6xHousingFinanceGroup 15.4 0.3 5.4 0.5x 4.1xNationalBankofKenya 7.0 0.3 2.2 0.2x 6.3xAverage 0.9x 5.2xMedian 1.0x 5.4xForP/EcalculationforNBKweusednormalizedearningsoveraperiodof5years*- Price as at1/9/2016
3030
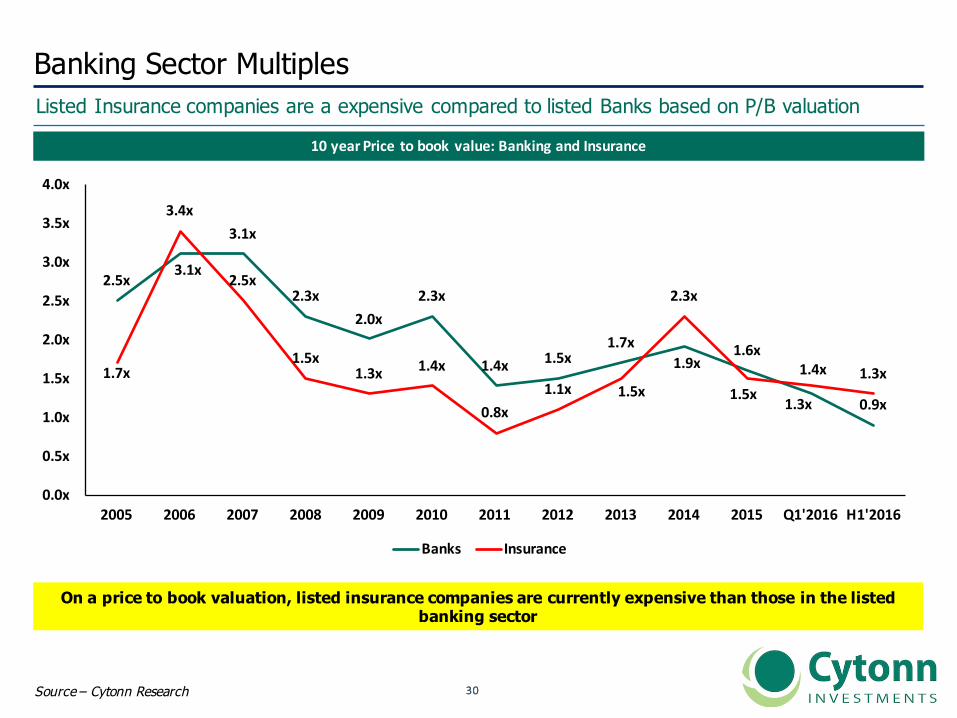
Banking Sector MultiplesListed Insurance companies are a expensive compared to listed Banks based on P/B valuation
Source – Cytonn Research
10yearPrice tobookvalue:BankingandInsurance
On a price to book valuation, listed insurance companies are currently expensive than those in the listed banking sector
2.5x3.1x
3.1x
2.3x2.0x
2.3x
1.4x 1.5x1.7x
1.9x1.6x
1.3x 0.9x
1.7x
3.4x
2.5x
1.5x1.3x 1.4x
0.8x1.1x 1.5x
2.3x
1.5x1.4x 1.3x
0.0x
0.5x
1.0x
1.5x
2.0x
2.5x
3.0x
3.5x
4.0x
2005 2006 2007 2008 2009 2010 2011 2012 2013 2014 2015 Q1'2016 H1'2016
Banks Insurance
3131
Summary of the H1’2016 EarningsThe banking sector remains attractive on a valuation basis
2012
2013
1. Core earnings for 2016 is likely to be higher than 2015 since as at H1’2016, the earnings growth was at 15.8%
compared to the 4.7% recorded in H1’2015. Though there could be some negative effects as result of the interest rate
cap but this is not expected to significantly affect banks’ earnings
2. Deposits grew faster than loans at 7.6% and 6.6%, respectively, but lower than the 5-year averages of 15.2% and
17.9%, respectively
3. The levels of NPLs remains a concern within the banking sector with loan loss provisions growing at 392.9% and
122.4% for the non-listed and listed banks, respectively. We expect the level of provisioning to stabilize going forward
4. Growth for most banks with regional subsidiaries was driven mainly by the Kenyan business as their regional
operations underperformed
5. With a sector valuation of 0.9x price to book and 5.6x price to earnings from 1.6x and 7.9x at the beginning of the
year, respectively, we think that the sector has become fairly attractive for a long-term investor
3232
III. Cytonn’s Banking Sector Report
3333
Executive Summary Cytonn has undertaken this report to offer our investors a comprehensive view of the listed banks
2012
2013
• All listed banks in the Kenyan market were analysed by the Cytonn Investment Team
• The analysis was brought about by a need to be able to recommend to our investors which banks are the most stable
from a franchise value and from a future growth opportunity perspective
• The analysis covers the health and future expected performance of the financial institution, by highlighting their
performance using metrics to measure profitability, efficiency, growth, asset quality, liquidity, revenue diversification,
capitalization and intrinsic valuation
• The analysis was undertaken using H1’2016 results (franchise value) and analyst’s projections of future performance of
the banks (future growth opportunities)
• For banks which are part of a group structure, the financials of the group were utilised to take into consideration the
listed counter which an investor will purchase
• The overall ranking was based on a weighted average ranking of Franchise value (accounting for 40%) and Intrinsic
value (accounting for 60%)
• The top rankings were dominated by Tier 1 banks which performed well in terms of both Franchise and Intrinsic
valuation
3434
Banking Sector Report ResultsNational Bank Ranked lowest in both franchise and intrinsic score
2012
2013
Source: Cytonn Research
• Equity Group emerged top supported by a strong franchise score and total return score
• Barclays Bank fell three positions to position 7, affected by a drop in intrinsic value ranking. This was due to a low
expected future growth rate of 2.8% given high competition in the banking sector with its peers being more competitive
and innovative in their distribution channels and product offering
• NIC bank declined 1 spot to position 9, affected by a poor franchise score. This was due to its low Net Interest Margin
of 7.1% against and industry average of 8.4% and a high loan to deposit ratio of 103.0% against an industry average of
87.3%
• National Bank was ranked the lowest overall, ranking lowest in both franchise and intrinsic score. NBK has the highest
cost to Income ratio at 64.6% against the industry average of 47.1%. Key to note is that NBK has the largest NPLs to
loans at 42.1% against the industry average of 10.6%, with one of lowest NPL coverages at 18.1% against the industry
average of 35.4%
3535
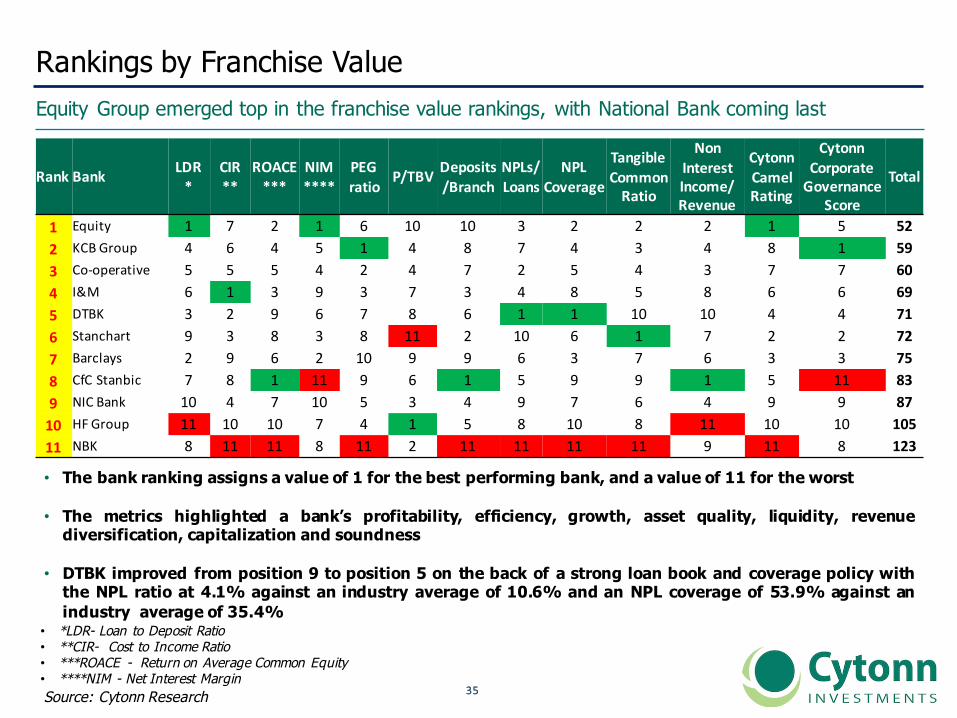
Rankings by Franchise ValueEquity Group emerged top in the franchise value rankings, with National Bank coming last
2012
2013
Source: Cytonn Research
• The bank ranking assigns a value of 1 for the best performing bank, and a value of 11 for the worst
• The metrics highlighted a bank’s profitability, efficiency, growth, asset quality, liquidity, revenuediversification, capitalization and soundness
• DTBK improved from position 9 to position 5 on the back of a strong loan book and coverage policy withthe NPL ratio at 4.1% against an industry average of 10.6% and an NPL coverage of 53.9% against anindustry average of 35.4%
• *LDR- Loan to Deposit Ratio • **CIR- Cost to Income Ratio • ***ROACE - Return on Average Common Equity • ****NIM - Net Interest Margin
Rank Bank LDR*
CIR**
ROACE***
NIM****
PEGratio
P/TBV Deposits/Branch
NPLs/Loans
NPLCoverage
TangibleCommonRatio
NonInterestIncome/Revenue
CytonnCamelRating
CytonnCorporateGovernance
Score
Total
1 Equity 1 7 2 1 6 10 10 3 2 2 2 1 5 522 KCBGroup 4 6 4 5 1 4 8 7 4 3 4 8 1 593 Co-operative 5 5 5 4 2 4 7 2 5 4 3 7 7 604 I&M 6 1 3 9 3 7 3 4 8 5 8 6 6 695 DTBK 3 2 9 6 7 8 6 1 1 10 10 4 4 716 Stanchart 9 3 8 3 8 11 2 10 6 1 7 2 2 727 Barclays 2 9 6 2 10 9 9 6 3 7 6 3 3 758 CfCStanbic 7 8 1 11 9 6 1 5 9 9 1 5 11 839 NICBank 10 4 7 10 5 3 4 9 7 6 4 9 9 8710 HF Group 11 10 10 7 4 1 5 8 10 8 11 10 10 10511 NBK 8 11 11 8 11 2 11 11 11 11 9 11 8 123
3636
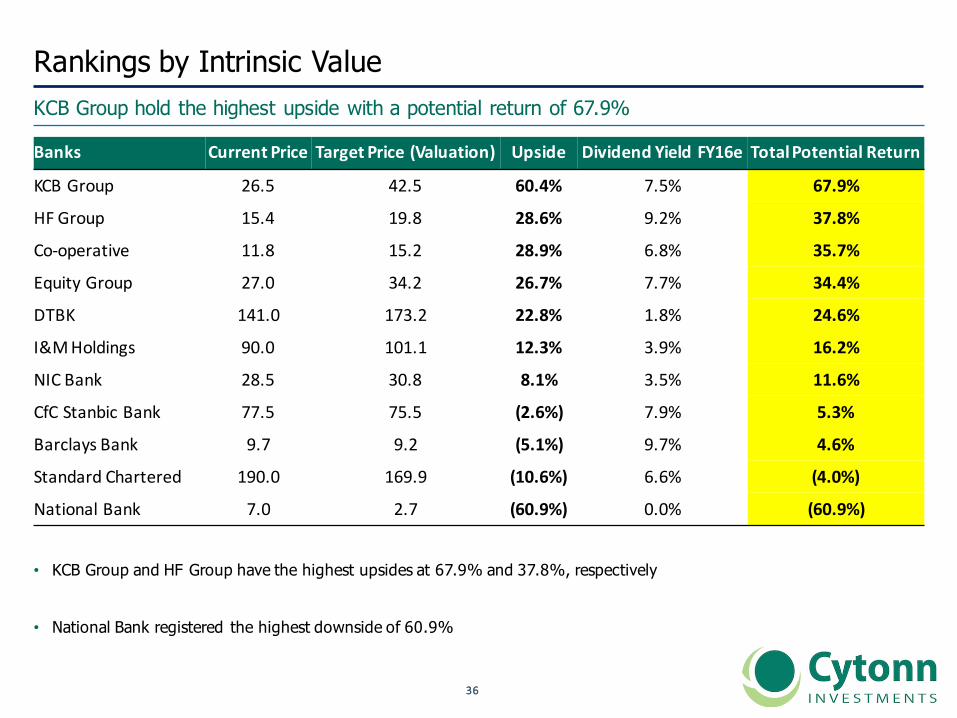
Rankings by Intrinsic ValueKCB Group hold the highest upside with a potential return of 67.9%
• KCB Group and HF Group have the highest upsides at 67.9% and 37.8%, respectively
• National Bank registered the highest downside of 60.9%
Banks CurrentPrice TargetPrice(Valuation) Upside DividendYieldFY16e TotalPotentialReturn
KCBGroup 26.5 42.5 60.4% 7.5% 67.9%
HFGroup 15.4 19.8 28.6% 9.2% 37.8%
Co-operative 11.8 15.2 28.9% 6.8% 35.7%
EquityGroup 27.0 34.2 26.7% 7.7% 34.4%
DTBK 141.0 173.2 22.8% 1.8% 24.6%
I&MHoldings 90.0 101.1 12.3% 3.9% 16.2%
NICBank 28.5 30.8 8.1% 3.5% 11.6%
CfCStanbicBank 77.5 75.5 (2.6%) 7.9% 5.3%
BarclaysBank 9.7 9.2 (5.1%) 9.7% 4.6%
StandardChartered 190.0 169.9 (10.6%) 6.6% (4.0%)
NationalBank 7.0 2.7 (60.9%) 0.0% (60.9%)
3737
Composite Bank RankingOverall Equity Group ranked highest supported by a high franchise score
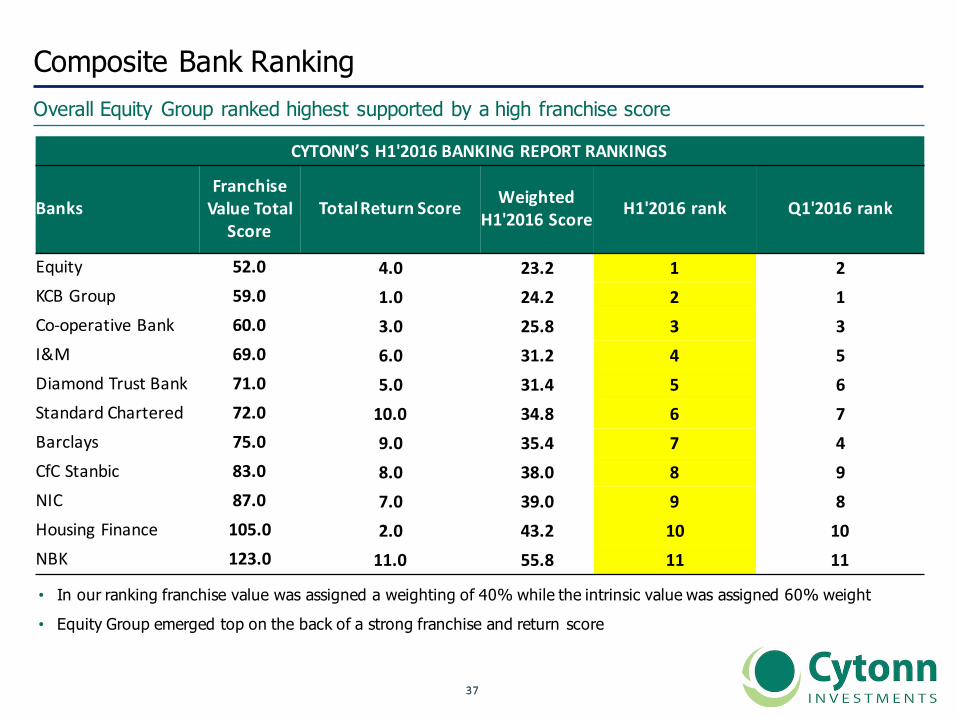
• In our ranking franchise value was assigned a weighting of 40% while the intrinsic value was assigned 60% weight
• Equity Group emerged top on the back of a strong franchise and return score
CYTONN’SH1'2016BANKINGREPORTRANKINGS
BanksFranchiseValueTotal
ScoreTotalReturnScore Weighted
H1'2016Score H1'2016rank Q1'2016rank
Equity 52.0 4.0 23.2 1 2KCBGroup 59.0 1.0 24.2 2 1Co-operativeBank 60.0 3.0 25.8 3 3I&M 69.0 6.0 31.2 4 5DiamondTrustBank 71.0 5.0 31.4 5 6StandardChartered 72.0 10.0 34.8 6 7Barclays 75.0 9.0 35.4 7 4CfCStanbic 83.0 8.0 38.0 8 9NIC 87.0 7.0 39.0 9 8HousingFinance 105.0 2.0 43.2 10 10NBK 123.0 11.0 55.8 11 11

3838
Appendix

3939
A. Metrics Used
4040
Banking Sector Report – Metrics UsedCytonn has undertaken analysis of the listed banks in Kenya using 13 key metrics
2012
2013
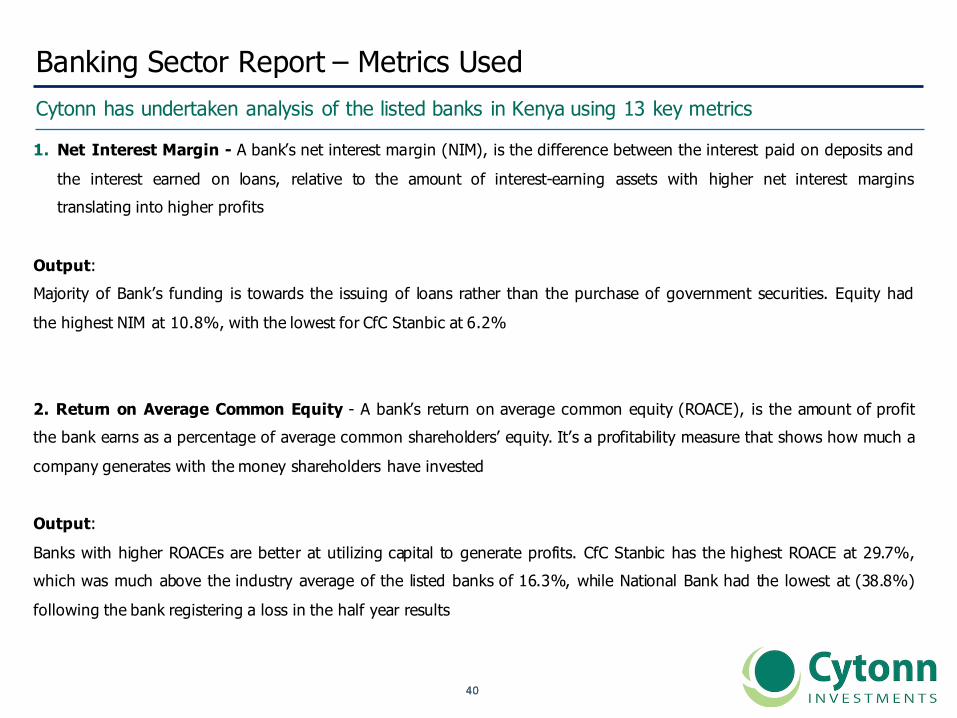
1. Net Interest Margin - A bank’s net interest margin (NIM), is the difference between the interest paid on deposits and
the interest earned on loans, relative to the amount of interest-earning assets with higher net interest marginstranslating into higher profits
Output:Majority of Bank’s funding is towards the issuing of loans rather than the purchase of government securities. Equity had
the highest NIM at 10.8%, with the lowest for CfC Stanbic at 6.2%
2. Return on Average Common Equity - A bank’s return on average common equity (ROACE), is the amount of profitthe bank earns as a percentage of average common shareholders’ equity. It’s a profitability measure that shows how much a
company generates with the money shareholders have invested
Output:Banks with higher ROACEs are better at utilizing capital to generate profits. CfC Stanbic has the highest ROACE at 29.7%,which was much above the industry average of the listed banks of 16.3%, while National Bank had the lowest at (38.8%)
following the bank registering a loss in the half year results
4141
Banking Sector Report – Metrics Used, continued…Cytonn has undertaken analysis of the listed banks in Kenya using 13 key metrics
2012
2013
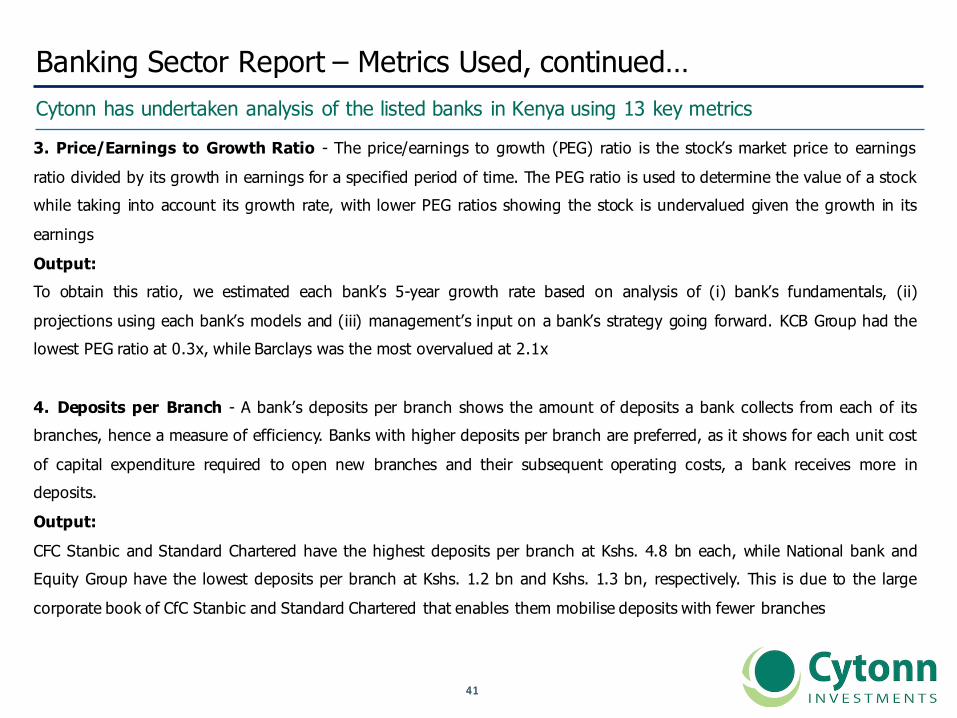
3. Price/Earnings to Growth Ratio - The price/earnings to growth (PEG) ratio is the stock’s market price to earnings
ratio divided by its growth in earnings for a specified period of time. The PEG ratio is used to determine the value of a stockwhile taking into account its growth rate, with lower PEG ratios showing the stock is undervalued given the growth in its
earnings
Output:To obtain this ratio, we estimated each bank’s 5-year growth rate based on analysis of (i) bank’s fundamentals, (ii)
projections using each bank’s models and (iii) management’s input on a bank’s strategy going forward. KCB Group had thelowest PEG ratio at 0.3x, while Barclays was the most overvalued at 2.1x
4. Deposits per Branch - A bank’s deposits per branch shows the amount of deposits a bank collects from each of itsbranches, hence a measure of efficiency. Banks with higher deposits per branch are preferred, as it shows for each unit cost
of capital expenditure required to open new branches and their subsequent operating costs, a bank receives more indeposits.
Output:CFC Stanbic and Standard Chartered have the highest deposits per branch at Kshs. 4.8 bn each, while National bank andEquity Group have the lowest deposits per branch at Kshs. 1.2 bn and Kshs. 1.3 bn, respectively. This is due to the large
corporate book of CfC Stanbic and Standard Chartered that enables them mobilise deposits with fewer branches
4242
Banking Sector Report – Metrics Used, continued…Cytonn has undertaken analysis of the listed banks in Kenya using 13 key metrics
2012
2013
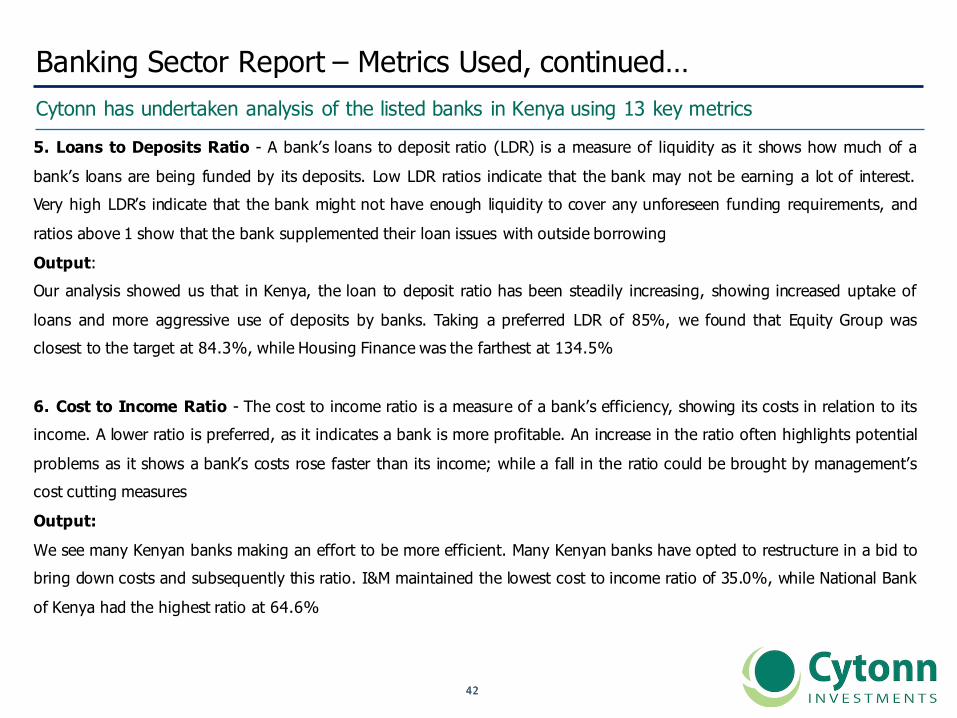
5. Loans to Deposits Ratio - A bank’s loans to deposit ratio (LDR) is a measure of liquidity as it shows how much of a
bank’s loans are being funded by its deposits. Low LDR ratios indicate that the bank may not be earning a lot of interest.Very high LDR’s indicate that the bank might not have enough liquidity to cover any unforeseen funding requirements, and
ratios above 1 show that the bank supplemented their loan issues with outside borrowing
Output:Our analysis showed us that in Kenya, the loan to deposit ratio has been steadily increasing, showing increased uptake of
loans and more aggressive use of deposits by banks. Taking a preferred LDR of 85%, we found that Equity Group wasclosest to the target at 84.3%, while Housing Finance was the farthest at 134.5%
6. Cost to Income Ratio - The cost to income ratio is a measure of a bank’s efficiency, showing its costs in relation to itsincome. A lower ratio is preferred, as it indicates a bank is more profitable. An increase in the ratio often highlights potential
problems as it shows a bank’s costs rose faster than its income; while a fall in the ratio could be brought by management’scost cutting measures
Output:We see many Kenyan banks making an effort to be more efficient. Many Kenyan banks have opted to restructure in a bid tobring down costs and subsequently this ratio. I&M maintained the lowest cost to income ratio of 35.0%, while National Bank
of Kenya had the highest ratio at 64.6%
4343
Banking Sector Report – Metrics Used, continued…Cytonn has undertaken analysis of the listed banks in Kenya using 13 key metrics
2012
2013
7. Price to Tangible Book Value - This is a valuation ratio that expresses the bank’s market price to its tangible book
value. It shows the price an investor would pay for a unit amount in the event of a liquidation. A ratio of less than oneindicates that the bank’s assets are undervalued in the market while a ratio greater than one signifies overvaluation
Output:We find Housing Finance as the most undervalued bank as per this metric at 0.5x, while Equity bank is still the mostovervalued at 1.6x
8. Tangible Common Equity Ratio - This is the ratio of a bank’s common equity less intangible assets to its tangible
assets. It is a common indicator of a bank’s risk and capitalization and measures how much losses a bank can take before
shareholder’s equity is wiped out, hence solvencyOutput:Standard Chartered is the most solvent with a tangible common ratio of 16.2%, while National Bank was the least solvent at3.7%
9. Non-Performing Loans to Total Loans Ratio - This is a measure of the percentage of a bank’s issued loans that arenon-performing that is, in default, or close to being in default
Output:DTBK had the highest quality loan book with a non-performing loans to total loans ratio of 4.1%, while National Bank had
the highest non-performing loans at 42.1%
4444
Banking Sector Report – Metrics Used, continued…Cytonn has undertaken analysis of the listed banks in Kenya using 13 key metrics
2012
2013
10. Non-Performing Loans Coverage - This is a credit quality metric that measures the credit risks for banks. It shows
the extent to which the NPLs are covered by provisions hence the degree of stability of the bank’s lending base, with higherratios preferred
Output:DTBK has the highest provisions to non-performing loans at 53.9%, while Housing Finance Group has the lowest at 18.1%
11. Non-Interest Income to Revenue - The non interest income is the income earned from sources other than loansand investments. The non-interest income to revenue therefore shows the extent of diversification of a bank’s operations.
High levels are preferred, not exceeding the point where the bank loses focus of its primary business
Output:We see that Kenyan banks’ non-interest income is set to benefit from new initiatives such as banc-assurance and mobile
banking. CfC Stanbic has the highest non-interest income as a percentage of revenue at 41.4%, while Housing Finance hasthe lowest at 16.7%
12. Camel Rating - This is a ranking system that assesses the overall condition of a bank, that is, Capital Adequacy, AssetQuality, Management Quality, Earnings Quality and Liquidity. We also incorporated a governance score in the ranking
4545
Banking Sector Report – Metrics Used, continued…Cytonn has undertaken analysis of the listed banks in Kenya using 13 key metrics
2012
2013
13. Corporate Governance Score – Given the recent developments in the banking sector, which include Dubai Bank,
Imperial Bank and National Bank, we developed a 13th metric to measure corporate governance This is a ranking systemwhere we analyse 25 metrics to rank listed companies on their corporate governance. Main areas of analysis are in the
board composition, audit functions, CEO tenor and evaluation, remuneration and transparency
Output:The score assumes a diffusion index with 50% as the base. Anything below 50% should be flagged as having seriouscorporate governance issues while anything above is skewed towards proper governance. However the variance from 100%
gives the risk associated with corporate governance

4646
B. Tier I Banks
4747
Tier 1 Banks Value Drivers and Cons
2013
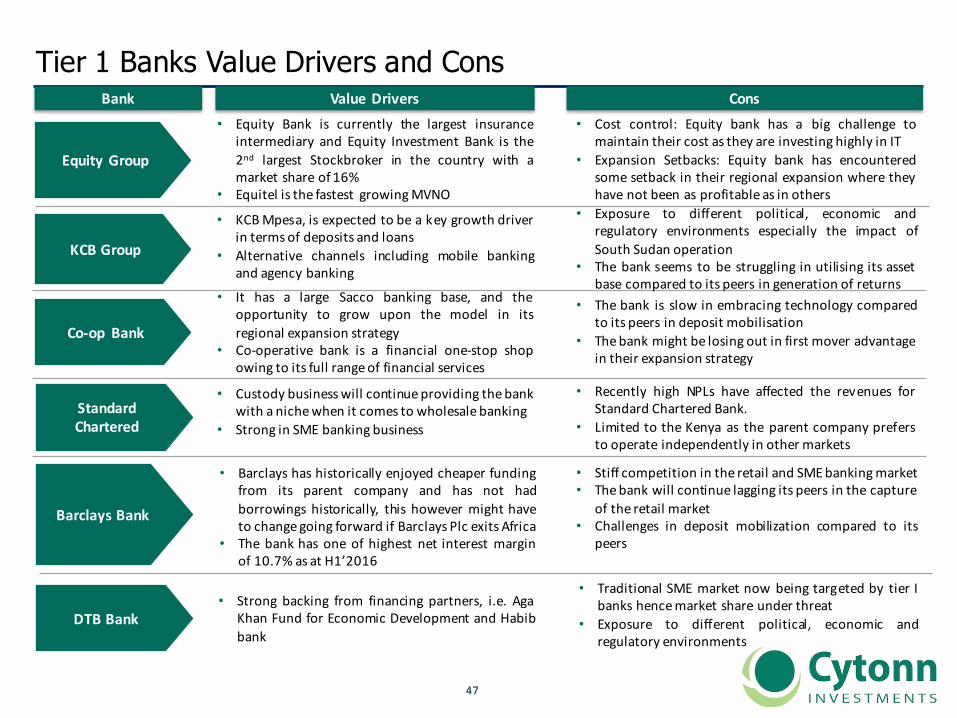
KCBGroup
ValueDrivers Cons
• KCBMpesa, is expected to be a key growth driverin terms of deposits and loans
• Alternative channels including mobile bankingand agency banking
• Exposure to different political, economic andregulatory environments especially the impact ofSouth Sudan operation
• The bank seems to be struggling in utilising its assetbase compared to its peers in generation of returns
Co-op Bank
• It has a large Sacco banking base, and theopportunity to grow upon the model in itsregional expansion strategy
• Co-operative bank is a financial one-stop shopowing to its full rangeof financial services
• The bank is slow in embracing technology comparedto its peers in deposit mobilisation
• Thebank might be losing out in first mover advantagein their expansion strategy
Bank
EquityGroup
• Equity Bank is currently the largest insuranceintermediary and Equity Investment Bank is the2nd largest Stockbroker in the country with amarket share of 16%
• Equitel is the fastest growingMVNO
• Cost control: Equity bank has a big challenge tomaintain their cost as they are investing highly in IT
• Expansion Setbacks: Equity bank has encounteredsome setback in their regional expansion where theyhave not been as profitable as in others
StandardChartered
BarclaysBank
• Custody businesswill continueproviding thebankwith a nichewhen it comes to wholesalebanking
• Strong in SME banking business
• Recently high NPLs have affected the revenues forStandard Chartered Bank.
• Limited to the Kenya as the parent company prefersto operate independently in other markets
• Barclays has historically enjoyed cheaper fundingfrom its parent company and has not hadborrowings historically, this however might haveto changegoing forward if Barclays Plc exits Africa
• The bank has one of highest net interest marginof 10.7% as at H1’2016
• Stiff competition in the retail and SMEbankingmarket• Thebank will continue lagging its peers in the capture
of the retail market• Challenges in deposit mobilization compared to its
peers
DTBBank• Strong backing from financing partners, i.e. Aga
Khan Fund for Economic Development and Habibbank
• Traditional SME market now being targeted by tier Ibanks hencemarket share under threat
• Exposure to different political, economic andregulatory environments
4848
I. Equity Group Holdings
4949
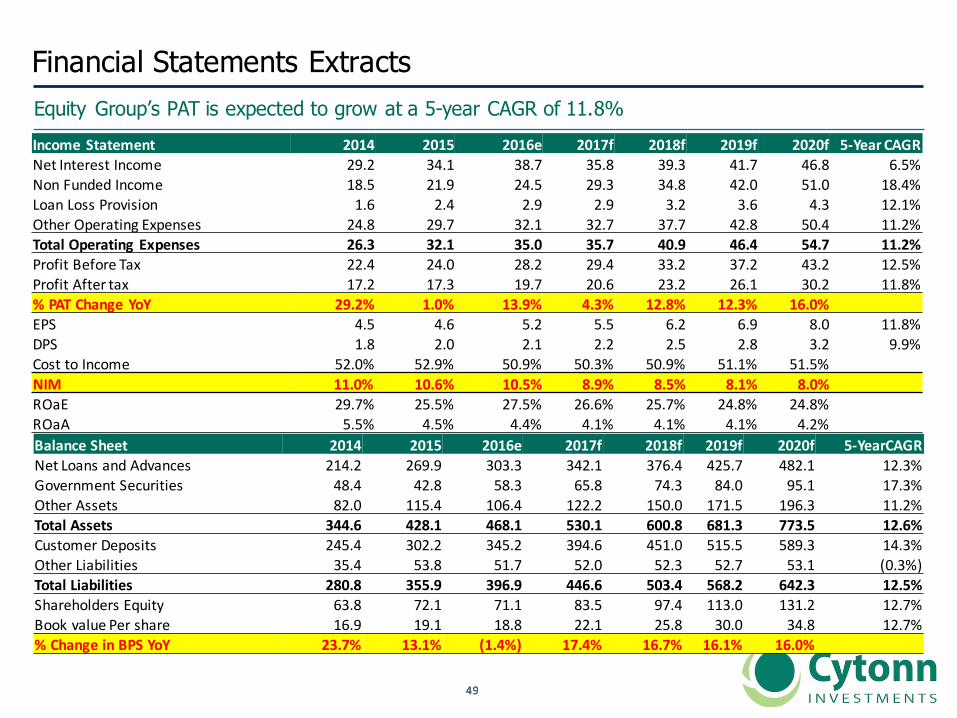
Financial Statements Extracts Equity Group’s PAT is expected to grow at a 5-year CAGR of 11.8%IncomeStatement 2014 2015 2016e 2017f 2018f 2019f 2020f 5-Year CAGRNetInterestIncome 29.2 34.1 38.7 35.8 39.3 41.7 46.8 6.5%NonFundedIncome 18.5 21.9 24.5 29.3 34.8 42.0 51.0 18.4%LoanLossProvision 1.6 2.4 2.9 2.9 3.2 3.6 4.3 12.1%OtherOperatingExpenses 24.8 29.7 32.1 32.7 37.7 42.8 50.4 11.2%TotalOperatingExpenses 26.3 32.1 35.0 35.7 40.9 46.4 54.7 11.2%ProfitBeforeTax 22.4 24.0 28.2 29.4 33.2 37.2 43.2 12.5%ProfitAftertax 17.2 17.3 19.7 20.6 23.2 26.1 30.2 11.8%%PATChangeYoY 29.2% 1.0% 13.9% 4.3% 12.8% 12.3% 16.0%EPS 4.5 4.6 5.2 5.5 6.2 6.9 8.0 11.8%DPS 1.8 2.0 2.1 2.2 2.5 2.8 3.2 9.9%CosttoIncome 52.0% 52.9% 50.9% 50.3% 50.9% 51.1% 51.5%NIM 11.0% 10.6% 10.5% 8.9% 8.5% 8.1% 8.0%ROaE 29.7% 25.5% 27.5% 26.6% 25.7% 24.8% 24.8%ROaA 5.5% 4.5% 4.4% 4.1% 4.1% 4.1% 4.2%BalanceSheet 2014 2015 2016e 2017f 2018f 2019f 2020f 5-YearCAGRNetLoansandAdvances 214.2 269.9 303.3 342.1 376.4 425.7 482.1 12.3%GovernmentSecurities 48.4 42.8 58.3 65.8 74.3 84.0 95.1 17.3%OtherAssets 82.0 115.4 106.4 122.2 150.0 171.5 196.3 11.2%TotalAssets 344.6 428.1 468.1 530.1 600.8 681.3 773.5 12.6%CustomerDeposits 245.4 302.2 345.2 394.6 451.0 515.5 589.3 14.3%OtherLiabilities 35.4 53.8 51.7 52.0 52.3 52.7 53.1 (0.3%)TotalLiabilities 280.8 355.9 396.9 446.6 503.4 568.2 642.3 12.5%ShareholdersEquity 63.8 72.1 71.1 83.5 97.4 113.0 131.2 12.7%BookvaluePershare 16.9 19.1 18.8 22.1 25.8 30.0 34.8 12.7%%ChangeinBPSYoY 23.7% 13.1% (1.4%) 17.4% 16.7% 16.1% 16.0%
5050
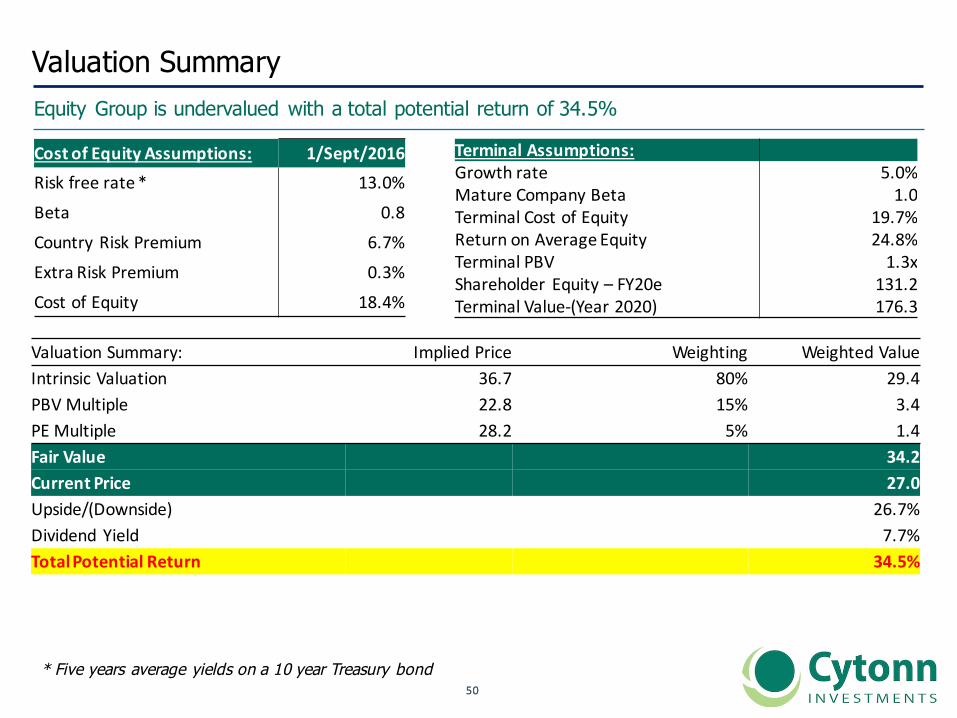
Valuation SummaryEquity Group is undervalued with a total potential return of 34.5%
CostofEquityAssumptions: 1/Sept/2016Riskfreerate* 13.0%Beta 0.8Country RiskPremium 6.7%ExtraRiskPremium 0.3%CostofEquity 18.4%
TerminalAssumptions:Growthrate 5.0%MatureCompanyBeta 1.0TerminalCostofEquity 19.7%ReturnonAverageEquity 24.8%TerminalPBV 1.3xShareholder Equity– FY20e 131.2TerminalValue-(Year2020) 176.3
ValuationSummary: ImpliedPrice Weighting WeightedValueIntrinsicValuation 36.7 80% 29.4PBVMultiple 22.8 15% 3.4PEMultiple 28.2 5% 1.4FairValue 34.2CurrentPrice 27.0Upside/(Downside) 26.7%Dividend Yield 7.7%TotalPotentialReturn 34.5%
* Five years average yields on a 10 year Treasury bond

5151
II. KCB Group
5252
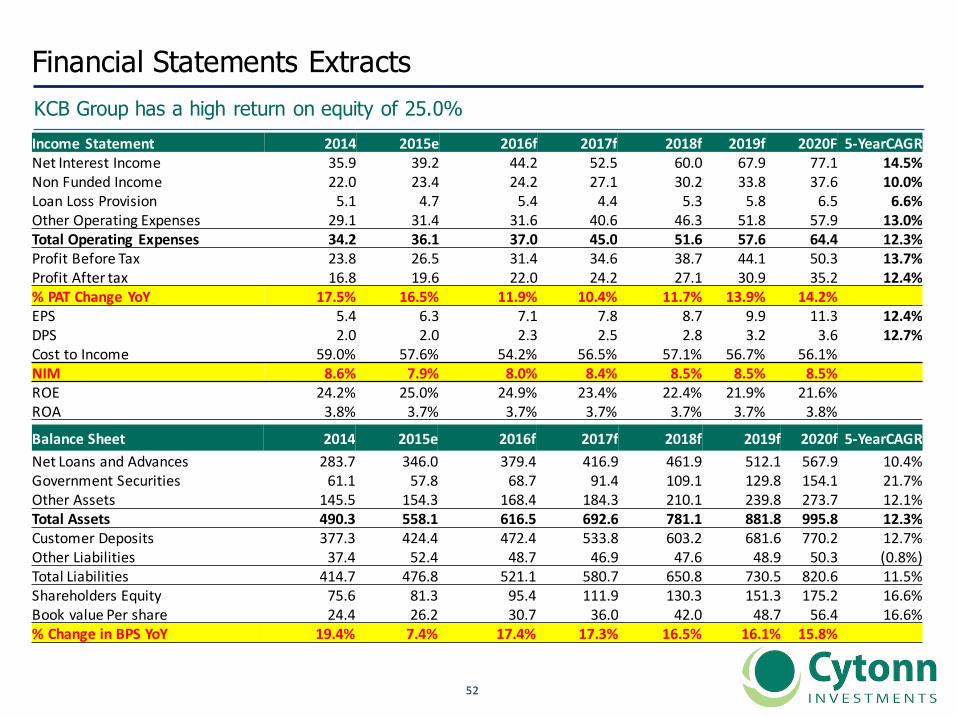
Financial Statements Extracts KCB Group has a high return on equity of 25.0%IncomeStatement 2014 2015e 2016f 2017f 2018f 2019f 2020F 5-YearCAGRNetInterestIncome 35.9 39.2 44.2 52.5 60.0 67.9 77.1 14.5%NonFundedIncome 22.0 23.4 24.2 27.1 30.2 33.8 37.6 10.0%LoanLossProvision 5.1 4.7 5.4 4.4 5.3 5.8 6.5 6.6%OtherOperatingExpenses 29.1 31.4 31.6 40.6 46.3 51.8 57.9 13.0%TotalOperatingExpenses 34.2 36.1 37.0 45.0 51.6 57.6 64.4 12.3%ProfitBeforeTax 23.8 26.5 31.4 34.6 38.7 44.1 50.3 13.7%ProfitAftertax 16.8 19.6 22.0 24.2 27.1 30.9 35.2 12.4%%PATChangeYoY 17.5% 16.5% 11.9% 10.4% 11.7% 13.9% 14.2%EPS 5.4 6.3 7.1 7.8 8.7 9.9 11.3 12.4%DPS 2.0 2.0 2.3 2.5 2.8 3.2 3.6 12.7%CosttoIncome 59.0% 57.6% 54.2% 56.5% 57.1% 56.7% 56.1%NIM 8.6% 7.9% 8.0% 8.4% 8.5% 8.5% 8.5%ROE 24.2% 25.0% 24.9% 23.4% 22.4% 21.9% 21.6%ROA 3.8% 3.7% 3.7% 3.7% 3.7% 3.7% 3.8%
BalanceSheet 2014 2015e 2016f 2017f 2018f 2019f 2020f 5-YearCAGRNetLoansandAdvances 283.7 346.0 379.4 416.9 461.9 512.1 567.9 10.4%GovernmentSecurities 61.1 57.8 68.7 91.4 109.1 129.8 154.1 21.7%OtherAssets 145.5 154.3 168.4 184.3 210.1 239.8 273.7 12.1%TotalAssets 490.3 558.1 616.5 692.6 781.1 881.8 995.8 12.3%CustomerDeposits 377.3 424.4 472.4 533.8 603.2 681.6 770.2 12.7%OtherLiabilities 37.4 52.4 48.7 46.9 47.6 48.9 50.3 (0.8%)TotalLiabilities 414.7 476.8 521.1 580.7 650.8 730.5 820.6 11.5%ShareholdersEquity 75.6 81.3 95.4 111.9 130.3 151.3 175.2 16.6%BookvaluePershare 24.4 26.2 30.7 36.0 42.0 48.7 56.4 16.6%%ChangeinBPSYoY 19.4% 7.4% 17.4% 17.3% 16.5% 16.1% 15.8%
5353
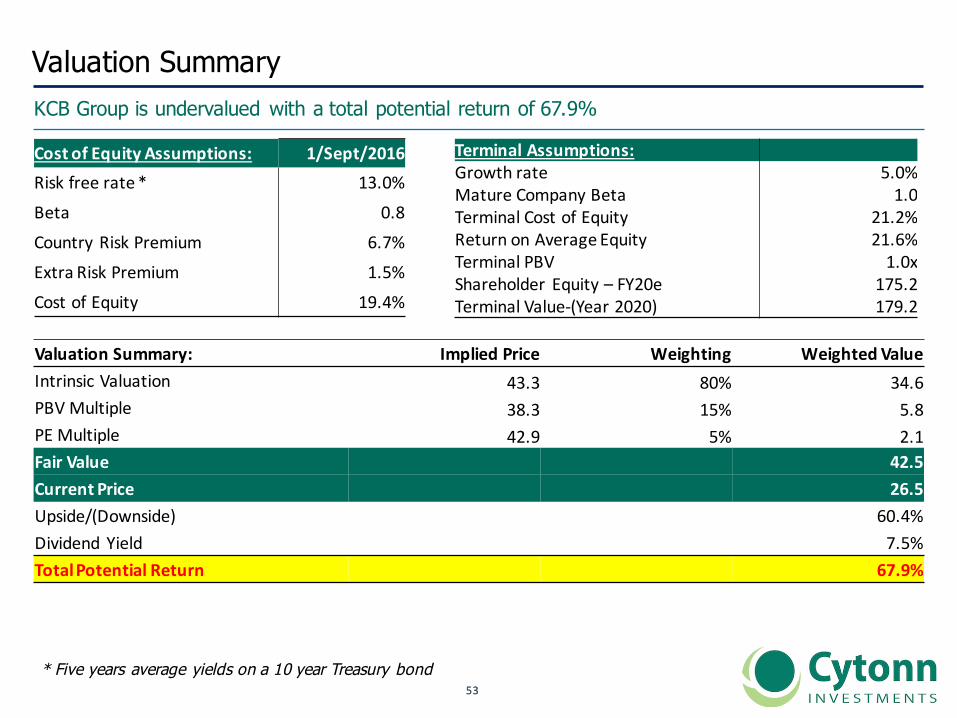
Valuation SummaryKCB Group is undervalued with a total potential return of 67.9%
CostofEquityAssumptions: 1/Sept/2016Riskfreerate* 13.0%Beta 0.8Country RiskPremium 6.7%ExtraRiskPremium 1.5%CostofEquity 19.4%
TerminalAssumptions:Growthrate 5.0%MatureCompanyBeta 1.0TerminalCostofEquity 21.2%ReturnonAverageEquity 21.6%TerminalPBV 1.0xShareholder Equity– FY20e 175.2TerminalValue-(Year2020) 179.2
ValuationSummary: ImpliedPrice Weighting WeightedValueIntrinsicValuation 43.3 80% 34.6PBVMultiple 38.3 15% 5.8PEMultiple 42.9 5% 2.1FairValue 42.5CurrentPrice 26.5Upside/(Downside) 60.4%Dividend Yield 7.5%TotalPotentialReturn 67.9%
* Five years average yields on a 10 year Treasury bond
5454
III. Co-operative Bank
5555
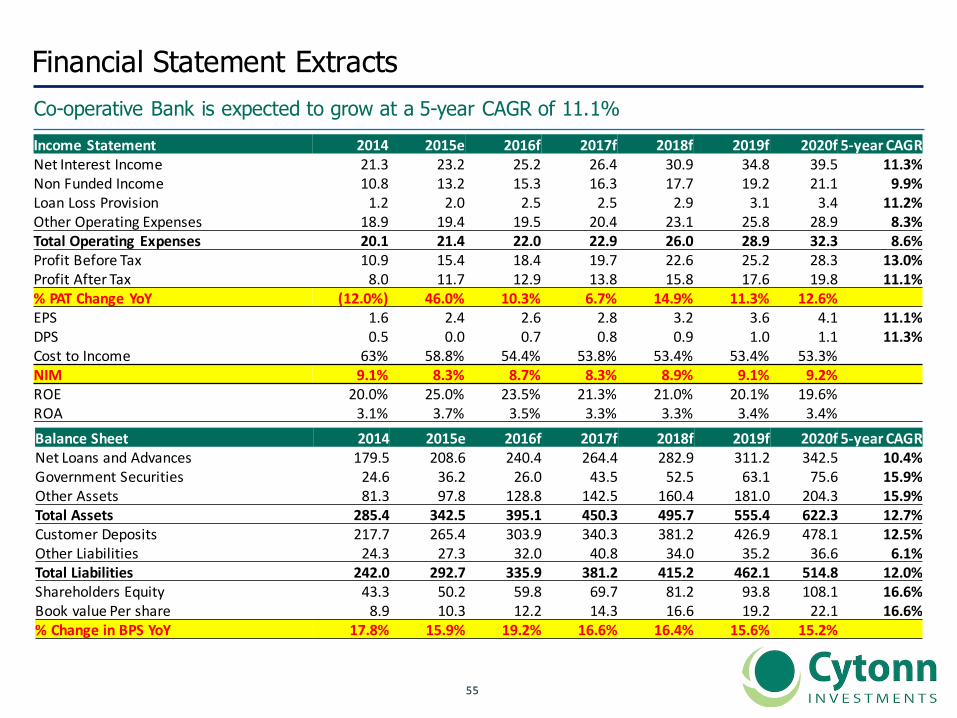
Financial Statement ExtractsCo-operative Bank is expected to grow at a 5-year CAGR of 11.1%IncomeStatement 2014 2015e 2016f 2017f 2018f 2019f 2020f 5-year CAGRNetInterestIncome 21.3 23.2 25.2 26.4 30.9 34.8 39.5 11.3%NonFundedIncome 10.8 13.2 15.3 16.3 17.7 19.2 21.1 9.9%LoanLossProvision 1.2 2.0 2.5 2.5 2.9 3.1 3.4 11.2%OtherOperatingExpenses 18.9 19.4 19.5 20.4 23.1 25.8 28.9 8.3%TotalOperatingExpenses 20.1 21.4 22.0 22.9 26.0 28.9 32.3 8.6%ProfitBeforeTax 10.9 15.4 18.4 19.7 22.6 25.2 28.3 13.0%ProfitAfterTax 8.0 11.7 12.9 13.8 15.8 17.6 19.8 11.1%%PATChangeYoY (12.0%) 46.0% 10.3% 6.7% 14.9% 11.3% 12.6%EPS 1.6 2.4 2.6 2.8 3.2 3.6 4.1 11.1%DPS 0.5 0.0 0.7 0.8 0.9 1.0 1.1 11.3%CosttoIncome 63% 58.8% 54.4% 53.8% 53.4% 53.4% 53.3%NIM 9.1% 8.3% 8.7% 8.3% 8.9% 9.1% 9.2%ROE 20.0% 25.0% 23.5% 21.3% 21.0% 20.1% 19.6%ROA 3.1% 3.7% 3.5% 3.3% 3.3% 3.4% 3.4%BalanceSheet 2014 2015e 2016f 2017f 2018f 2019f 2020f 5-yearCAGRNetLoansandAdvances 179.5 208.6 240.4 264.4 282.9 311.2 342.5 10.4%GovernmentSecurities 24.6 36.2 26.0 43.5 52.5 63.1 75.6 15.9%OtherAssets 81.3 97.8 128.8 142.5 160.4 181.0 204.3 15.9%TotalAssets 285.4 342.5 395.1 450.3 495.7 555.4 622.3 12.7%CustomerDeposits 217.7 265.4 303.9 340.3 381.2 426.9 478.1 12.5%OtherLiabilities 24.3 27.3 32.0 40.8 34.0 35.2 36.6 6.1%TotalLiabilities 242.0 292.7 335.9 381.2 415.2 462.1 514.8 12.0%ShareholdersEquity 43.3 50.2 59.8 69.7 81.2 93.8 108.1 16.6%BookvaluePershare 8.9 10.3 12.2 14.3 16.6 19.2 22.1 16.6%%ChangeinBPSYoY 17.8% 15.9% 19.2% 16.6% 16.4% 15.6% 15.2%
5656
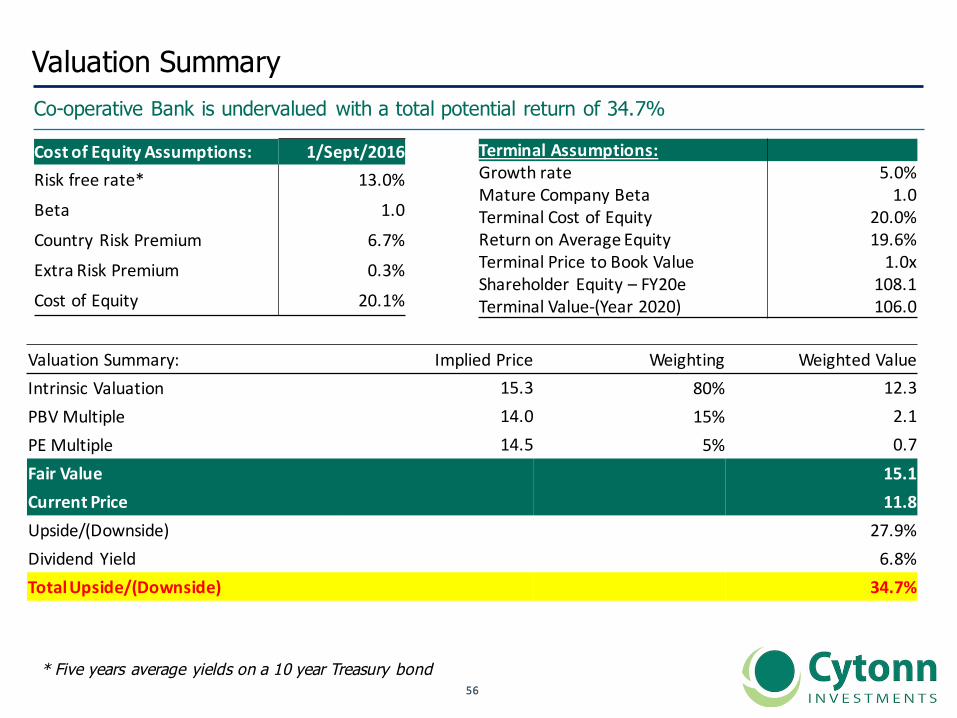
Valuation SummaryCo-operative Bank is undervalued with a total potential return of 34.7%
CostofEquityAssumptions: 1/Sept/2016Riskfreerate* 13.0%
Beta 1.0
Country RiskPremium 6.7%
ExtraRiskPremium 0.3%
CostofEquity 20.1%
TerminalAssumptions:Growthrate 5.0%MatureCompanyBeta 1.0TerminalCostofEquity 20.0%ReturnonAverageEquity 19.6%TerminalPricetoBookValue 1.0xShareholder Equity– FY20e 108.1TerminalValue-(Year2020) 106.0
ValuationSummary: ImpliedPrice Weighting WeightedValueIntrinsic Valuation 15.3 80% 12.3PBVMultiple 14.0 15% 2.1PEMultiple 14.5 5% 0.7FairValue 15.1CurrentPrice 11.8Upside/(Downside) 27.9%Dividend Yield 6.8%TotalUpside/(Downside) 34.7%
* Five years average yields on a 10 year Treasury bond
5757
IV. Standard Chartered Bank
5858
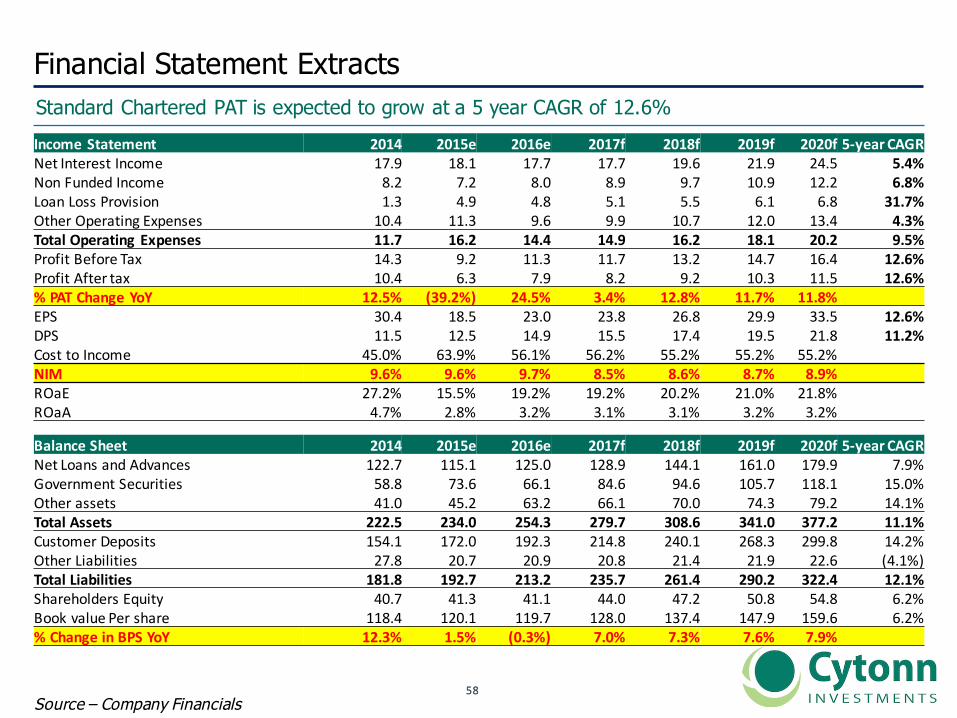
Financial Statement ExtractsStandard Chartered PAT is expected to grow at a 5 year CAGR of 12.6%
Source – Company Financials
IncomeStatement 2014 2015e 2016e 2017f 2018f 2019f 2020f 5-yearCAGRNetInterestIncome 17.9 18.1 17.7 17.7 19.6 21.9 24.5 5.4%NonFundedIncome 8.2 7.2 8.0 8.9 9.7 10.9 12.2 6.8%LoanLossProvision 1.3 4.9 4.8 5.1 5.5 6.1 6.8 31.7%OtherOperatingExpenses 10.4 11.3 9.6 9.9 10.7 12.0 13.4 4.3%TotalOperatingExpenses 11.7 16.2 14.4 14.9 16.2 18.1 20.2 9.5%ProfitBeforeTax 14.3 9.2 11.3 11.7 13.2 14.7 16.4 12.6%ProfitAftertax 10.4 6.3 7.9 8.2 9.2 10.3 11.5 12.6%%PATChangeYoY 12.5% (39.2%) 24.5% 3.4% 12.8% 11.7% 11.8%EPS 30.4 18.5 23.0 23.8 26.8 29.9 33.5 12.6%DPS 11.5 12.5 14.9 15.5 17.4 19.5 21.8 11.2%CosttoIncome 45.0% 63.9% 56.1% 56.2% 55.2% 55.2% 55.2%NIM 9.6% 9.6% 9.7% 8.5% 8.6% 8.7% 8.9%ROaE 27.2% 15.5% 19.2% 19.2% 20.2% 21.0% 21.8%ROaA 4.7% 2.8% 3.2% 3.1% 3.1% 3.2% 3.2%
BalanceSheet 2014 2015e 2016e 2017f 2018f 2019f 2020f 5-yearCAGRNetLoansandAdvances 122.7 115.1 125.0 128.9 144.1 161.0 179.9 7.9%GovernmentSecurities 58.8 73.6 66.1 84.6 94.6 105.7 118.1 15.0%Otherassets 41.0 45.2 63.2 66.1 70.0 74.3 79.2 14.1%TotalAssets 222.5 234.0 254.3 279.7 308.6 341.0 377.2 11.1%CustomerDeposits 154.1 172.0 192.3 214.8 240.1 268.3 299.8 14.2%OtherLiabilities 27.8 20.7 20.9 20.8 21.4 21.9 22.6 (4.1%)TotalLiabilities 181.8 192.7 213.2 235.7 261.4 290.2 322.4 12.1%ShareholdersEquity 40.7 41.3 41.1 44.0 47.2 50.8 54.8 6.2%BookvaluePershare 118.4 120.1 119.7 128.0 137.4 147.9 159.6 6.2%%ChangeinBPSYoY 12.3% 1.5% (0.3%) 7.0% 7.3% 7.6% 7.9%
5959
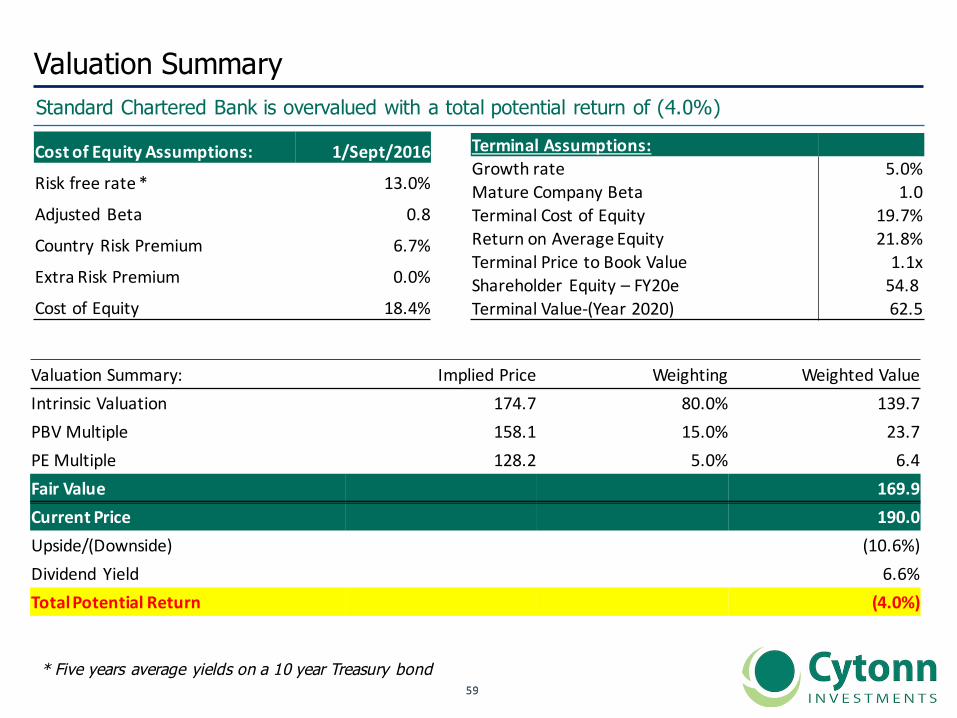
Valuation SummaryStandard Chartered Bank is overvalued with a total potential return of (4.0%)
CostofEquityAssumptions: 1/Sept/2016
Riskfreerate* 13.0%
AdjustedBeta 0.8
Country RiskPremium 6.7%
ExtraRiskPremium 0.0%
CostofEquity 18.4%
TerminalAssumptions:Growthrate 5.0%MatureCompanyBeta 1.0TerminalCostofEquity 19.7%ReturnonAverageEquity 21.8%TerminalPricetoBookValue 1.1xShareholder Equity– FY20e 54.8TerminalValue-(Year2020) 62.5
ValuationSummary: ImpliedPrice Weighting WeightedValueIntrinsicValuation 174.7 80.0% 139.7PBVMultiple 158.1 15.0% 23.7PEMultiple 128.2 5.0% 6.4FairValue 169.9CurrentPrice 190.0Upside/(Downside) (10.6%)Dividend Yield 6.6%TotalPotentialReturn (4.0%)
* Five years average yields on a 10 year Treasury bond

6060
V. Barclays Bank
6161
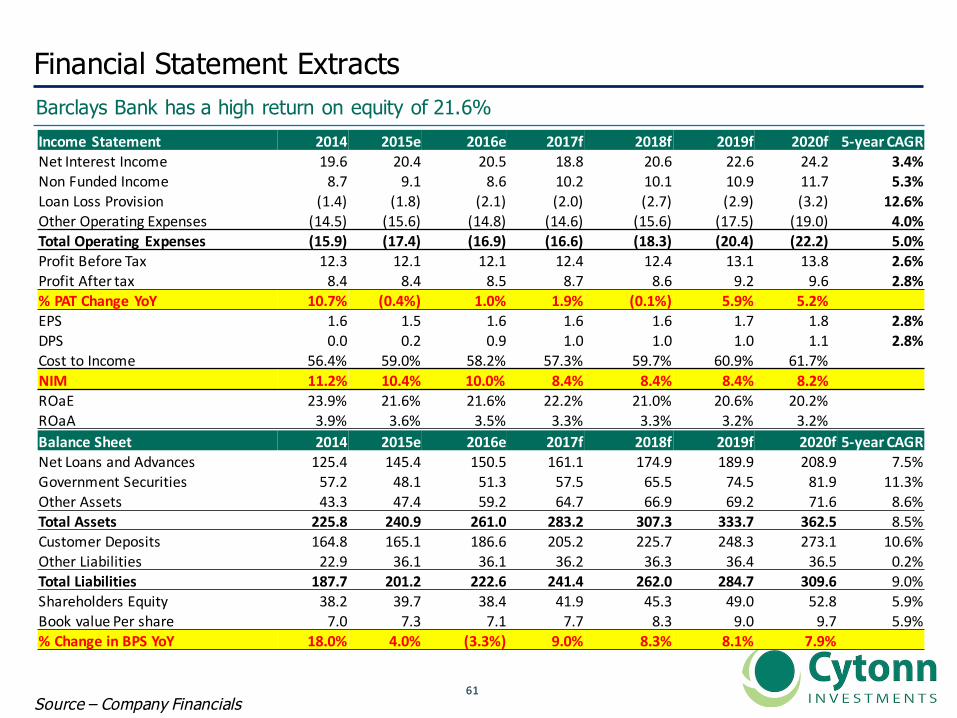
Financial Statement ExtractsBarclays Bank has a high return on equity of 21.6%
Source – Company Financials
IncomeStatement 2014 2015e 2016e 2017f 2018f 2019f 2020f 5-year CAGRNetInterestIncome 19.6 20.4 20.5 18.8 20.6 22.6 24.2 3.4%NonFundedIncome 8.7 9.1 8.6 10.2 10.1 10.9 11.7 5.3%LoanLossProvision (1.4) (1.8) (2.1) (2.0) (2.7) (2.9) (3.2) 12.6%OtherOperatingExpenses (14.5) (15.6) (14.8) (14.6) (15.6) (17.5) (19.0) 4.0%TotalOperatingExpenses (15.9) (17.4) (16.9) (16.6) (18.3) (20.4) (22.2) 5.0%ProfitBeforeTax 12.3 12.1 12.1 12.4 12.4 13.1 13.8 2.6%ProfitAftertax 8.4 8.4 8.5 8.7 8.6 9.2 9.6 2.8%%PATChangeYoY 10.7% (0.4%) 1.0% 1.9% (0.1%) 5.9% 5.2%EPS 1.6 1.5 1.6 1.6 1.6 1.7 1.8 2.8%DPS 0.0 0.2 0.9 1.0 1.0 1.0 1.1 2.8%CosttoIncome 56.4% 59.0% 58.2% 57.3% 59.7% 60.9% 61.7%NIM 11.2% 10.4% 10.0% 8.4% 8.4% 8.4% 8.2%ROaE 23.9% 21.6% 21.6% 22.2% 21.0% 20.6% 20.2%ROaA 3.9% 3.6% 3.5% 3.3% 3.3% 3.2% 3.2%BalanceSheet 2014 2015e 2016e 2017f 2018f 2019f 2020f 5-year CAGRNetLoansandAdvances 125.4 145.4 150.5 161.1 174.9 189.9 208.9 7.5%GovernmentSecurities 57.2 48.1 51.3 57.5 65.5 74.5 81.9 11.3%OtherAssets 43.3 47.4 59.2 64.7 66.9 69.2 71.6 8.6%TotalAssets 225.8 240.9 261.0 283.2 307.3 333.7 362.5 8.5%CustomerDeposits 164.8 165.1 186.6 205.2 225.7 248.3 273.1 10.6%OtherLiabilities 22.9 36.1 36.1 36.2 36.3 36.4 36.5 0.2%TotalLiabilities 187.7 201.2 222.6 241.4 262.0 284.7 309.6 9.0%ShareholdersEquity 38.2 39.7 38.4 41.9 45.3 49.0 52.8 5.9%BookvaluePershare 7.0 7.3 7.1 7.7 8.3 9.0 9.7 5.9%%ChangeinBPSYoY 18.0% 4.0% (3.3%) 9.0% 8.3% 8.1% 7.9%
6262
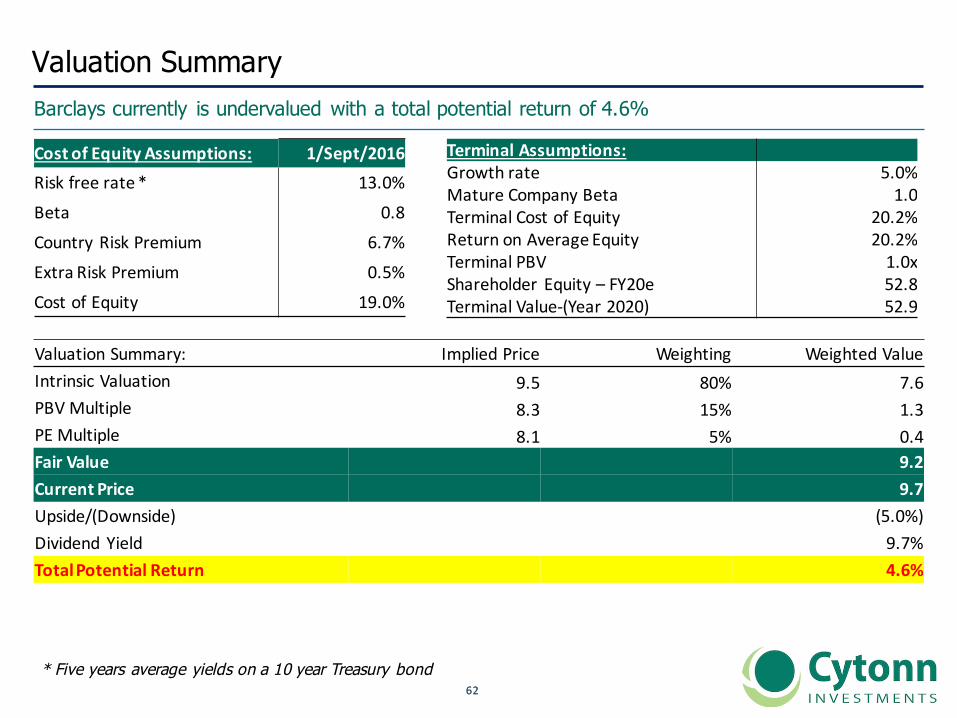
Valuation SummaryBarclays currently is undervalued with a total potential return of 4.6%
CostofEquityAssumptions: 1/Sept/2016Riskfreerate* 13.0%Beta 0.8Country RiskPremium 6.7%ExtraRiskPremium 0.5%CostofEquity 19.0%
TerminalAssumptions:Growthrate 5.0%MatureCompanyBeta 1.0TerminalCostofEquity 20.2%ReturnonAverageEquity 20.2%TerminalPBV 1.0xShareholder Equity– FY20e 52.8TerminalValue-(Year2020) 52.9
ValuationSummary: ImpliedPrice Weighting WeightedValueIntrinsicValuation 9.5 80% 7.6PBVMultiple 8.3 15% 1.3PEMultiple 8.1 5% 0.4FairValue 9.2CurrentPrice 9.7Upside/(Downside) (5.0%)Dividend Yield 9.7%TotalPotentialReturn 4.6%
* Five years average yields on a 10 year Treasury bond

6363
VI. Diamond Trust Bank
6464
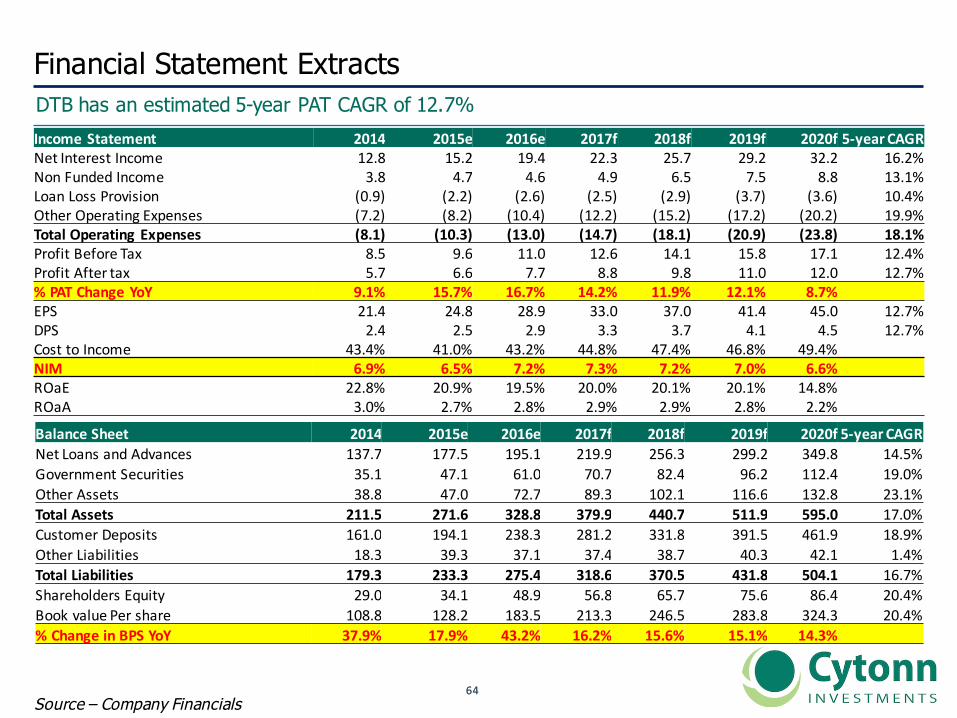
Financial Statement Extracts DTB has an estimated 5-year PAT CAGR of 12.7%
Source – Company Financials
IncomeStatement 2014 2015e 2016e 2017f 2018f 2019f 2020f 5-yearCAGRNetInterestIncome 12.8 15.2 19.4 22.3 25.7 29.2 32.2 16.2%NonFundedIncome 3.8 4.7 4.6 4.9 6.5 7.5 8.8 13.1%LoanLossProvision (0.9) (2.2) (2.6) (2.5) (2.9) (3.7) (3.6) 10.4%OtherOperatingExpenses (7.2) (8.2) (10.4) (12.2) (15.2) (17.2) (20.2) 19.9%TotalOperatingExpenses (8.1) (10.3) (13.0) (14.7) (18.1) (20.9) (23.8) 18.1%ProfitBeforeTax 8.5 9.6 11.0 12.6 14.1 15.8 17.1 12.4%ProfitAftertax 5.7 6.6 7.7 8.8 9.8 11.0 12.0 12.7%%PATChangeYoY 9.1% 15.7% 16.7% 14.2% 11.9% 12.1% 8.7%EPS 21.4 24.8 28.9 33.0 37.0 41.4 45.0 12.7%DPS 2.4 2.5 2.9 3.3 3.7 4.1 4.5 12.7%CosttoIncome 43.4% 41.0% 43.2% 44.8% 47.4% 46.8% 49.4%NIM 6.9% 6.5% 7.2% 7.3% 7.2% 7.0% 6.6%ROaE 22.8% 20.9% 19.5% 20.0% 20.1% 20.1% 14.8%ROaA 3.0% 2.7% 2.8% 2.9% 2.9% 2.8% 2.2%
BalanceSheet 2014 2015e 2016e 2017f 2018f 2019f 2020f 5-yearCAGRNetLoansandAdvances 137.7 177.5 195.1 219.9 256.3 299.2 349.8 14.5%GovernmentSecurities 35.1 47.1 61.0 70.7 82.4 96.2 112.4 19.0%OtherAssets 38.8 47.0 72.7 89.3 102.1 116.6 132.8 23.1%TotalAssets 211.5 271.6 328.8 379.9 440.7 511.9 595.0 17.0%CustomerDeposits 161.0 194.1 238.3 281.2 331.8 391.5 461.9 18.9%OtherLiabilities 18.3 39.3 37.1 37.4 38.7 40.3 42.1 1.4%TotalLiabilities 179.3 233.3 275.4 318.6 370.5 431.8 504.1 16.7%ShareholdersEquity 29.0 34.1 48.9 56.8 65.7 75.6 86.4 20.4%BookvaluePershare 108.8 128.2 183.5 213.3 246.5 283.8 324.3 20.4%%ChangeinBPSYoY 37.9% 17.9% 43.2% 16.2% 15.6% 15.1% 14.3%
6565
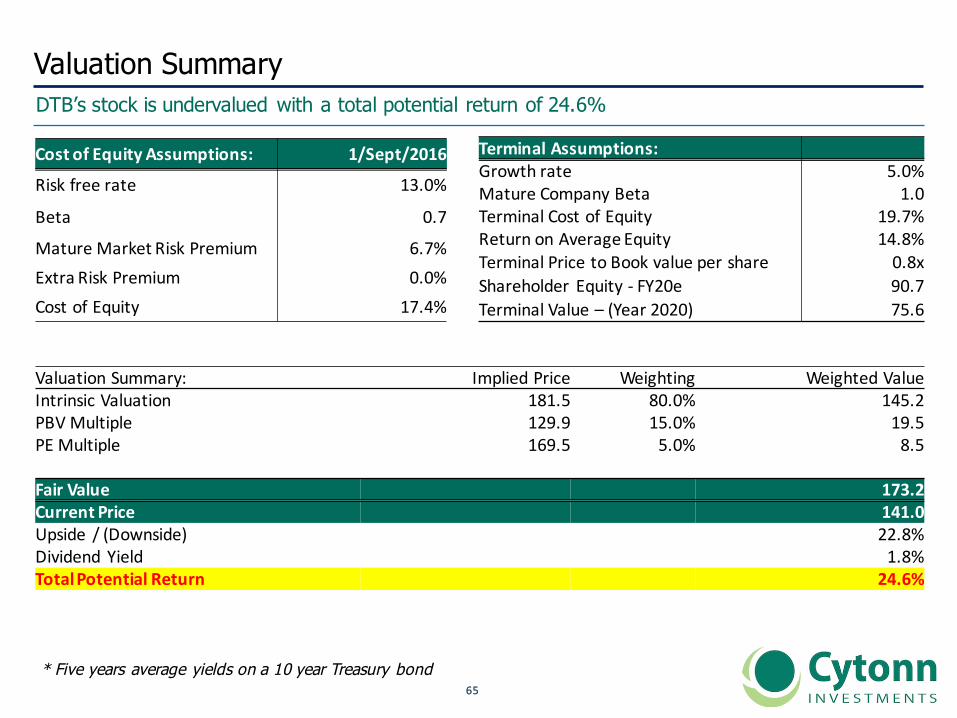
Valuation SummaryDTB’s stock is undervalued with a total potential return of 24.6%
CostofEquityAssumptions: 1/Sept/2016
Riskfreerate 13.0%
Beta 0.7
MatureMarketRiskPremium 6.7%ExtraRiskPremium 0.0%CostofEquity 17.4%
TerminalAssumptions:Growthrate 5.0%MatureCompanyBeta 1.0TerminalCostofEquity 19.7%ReturnonAverageEquity 14.8%TerminalPricetoBookvaluepershare 0.8xShareholder Equity- FY20e 90.7TerminalValue– (Year2020) 75.6
ValuationSummary: ImpliedPrice Weighting WeightedValueIntrinsicValuation 181.5 80.0% 145.2PBVMultiple 129.9 15.0% 19.5PEMultiple 169.5 5.0% 8.5
FairValue 173.2CurrentPrice 141.0Upside / (Downside) 22.8%Dividend Yield 1.8%TotalPotentialReturn 24.6%
* Five years average yields on a 10 year Treasury bond

6666
C. Tier II Banks
6767
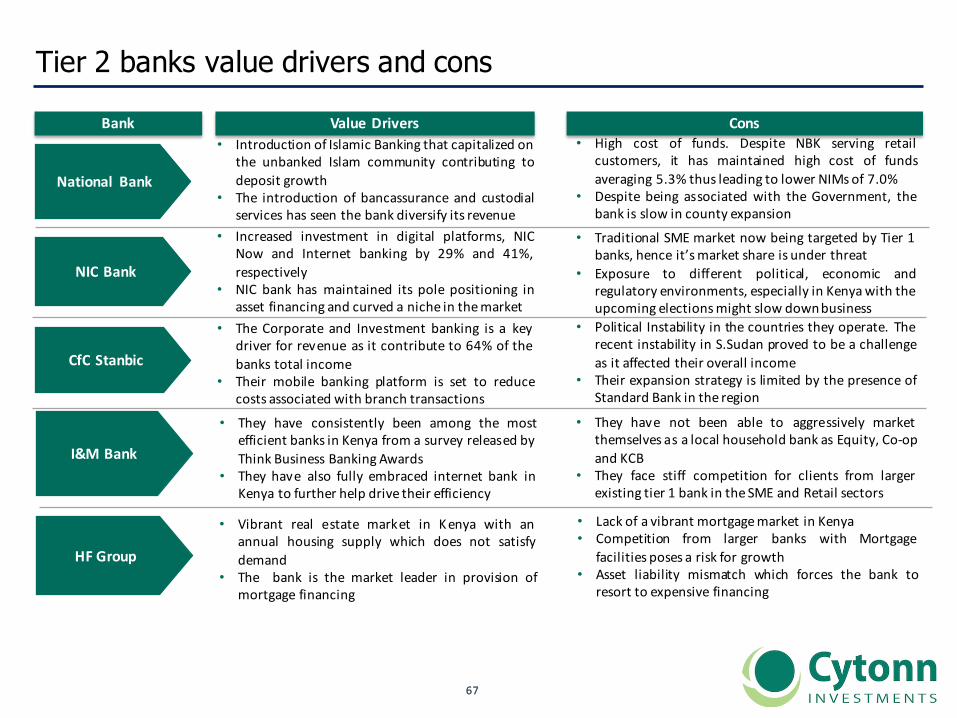
Tier 2 banks value drivers and cons
2013
NICBank
ValueDrivers Cons
• Increased investment in digital platforms, NICNow and Internet banking by 29% and 41%,respectively
• NIC bank has maintained its pole positioning inasset financing and curved a niche in themarket
• Traditional SME market now being targeted by Tier 1banks, hence it’smarket share is under threat
• Exposure to different political, economic andregulatory environments, especially in Kenyawith theupcoming electionsmight slow downbusiness
CfCStanbic
• The Corporate and Investment banking is a keydriver for revenue as it contribute to 64% of thebanks total income
• Their mobile banking platform is set to reducecosts associated with branch transactions
• Political Instability in the countries they operate. Therecent instability in S.Sudan proved to be a challengeas it affected their overall income
• Their expansion strategy is limited by the presence ofStandard Bank in the region
Bank
National Bank
• Introduction of Islamic Banking that capitalized onthe unbanked Islam community contributing todeposit growth
• The introduction of bancassurance and custodialservices has seen the bank diversify its revenue
• High cost of funds. Despite NBK serving retailcustomers, it has maintained high cost of fundsaveraging 5.3% thus leading to lower NIMsof 7.0%
• Despite being associated with the Government, thebank is slow in county expansion
I&MBank
• They have consistently been among the mostefficient banks in Kenya from a survey released byThink Business Banking Awards
• They have also fully embraced internet bank inKenya to further help drive their efficiency
• They have not been able to aggressively marketthemselves as a local household bank as Equity, Co-opand KCB
• They face stiff competition for clients from largerexisting tier 1 bank in theSME and Retail sectors
HFGroup
• Vibrant real estate market in Kenya with anannual housing supply which does not satisfydemand
• The bank is the market leader in provision ofmortgage financing
• Lack of a vibrant mortgagemarket in Kenya• Competition from larger banks with Mortgage
facilities poses a risk for growth• Asset liability mismatch which forces the bank to
resort to expensive financing
6868
I. National Bank of Kenya
6969
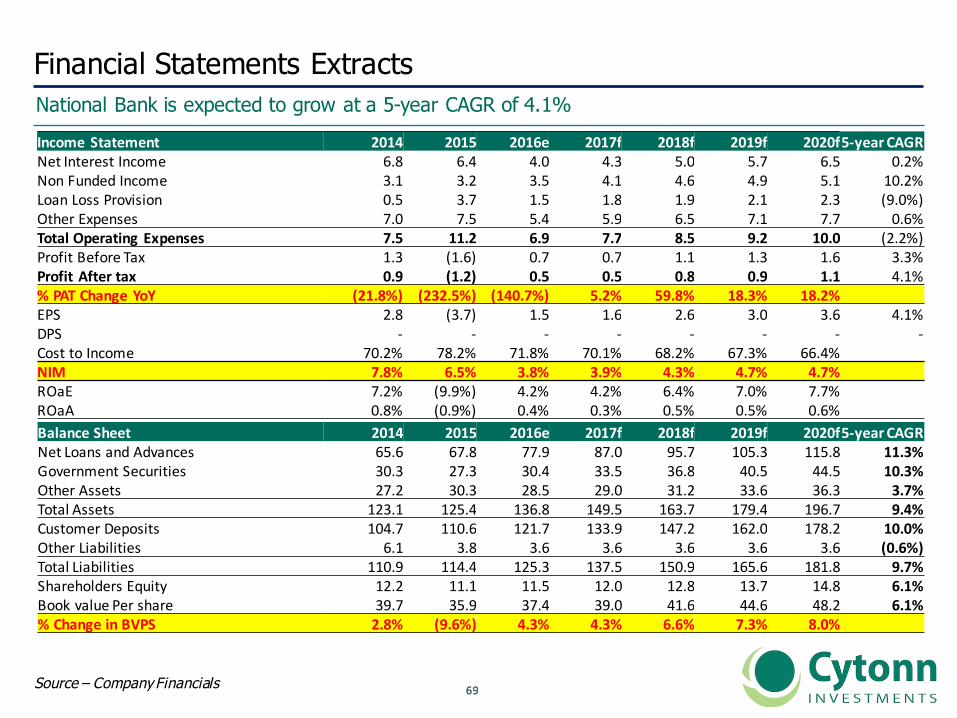
Financial Statements ExtractsNational Bank is expected to grow at a 5-year CAGR of 4.1%
Source – Company Financials
IncomeStatement 2014 2015 2016e 2017f 2018f 2019f 2020f5-yearCAGRNetInterestIncome 6.8 6.4 4.0 4.3 5.0 5.7 6.5 0.2%NonFundedIncome 3.1 3.2 3.5 4.1 4.6 4.9 5.1 10.2%LoanLossProvision 0.5 3.7 1.5 1.8 1.9 2.1 2.3 (9.0%)OtherExpenses 7.0 7.5 5.4 5.9 6.5 7.1 7.7 0.6%TotalOperatingExpenses 7.5 11.2 6.9 7.7 8.5 9.2 10.0 (2.2%)ProfitBeforeTax 1.3 (1.6) 0.7 0.7 1.1 1.3 1.6 3.3%ProfitAftertax 0.9 (1.2) 0.5 0.5 0.8 0.9 1.1 4.1%%PATChangeYoY (21.8%) (232.5%) (140.7%) 5.2% 59.8% 18.3% 18.2%EPS 2.8 (3.7) 1.5 1.6 2.6 3.0 3.6 4.1%DPS - - - - - - - -CosttoIncome 70.2% 78.2% 71.8% 70.1% 68.2% 67.3% 66.4%NIM 7.8% 6.5% 3.8% 3.9% 4.3% 4.7% 4.7%ROaE 7.2% (9.9%) 4.2% 4.2% 6.4% 7.0% 7.7%ROaA 0.8% (0.9%) 0.4% 0.3% 0.5% 0.5% 0.6%BalanceSheet 2014 2015 2016e 2017f 2018f 2019f 2020f5-yearCAGRNetLoansandAdvances 65.6 67.8 77.9 87.0 95.7 105.3 115.8 11.3%GovernmentSecurities 30.3 27.3 30.4 33.5 36.8 40.5 44.5 10.3%OtherAssets 27.2 30.3 28.5 29.0 31.2 33.6 36.3 3.7%TotalAssets 123.1 125.4 136.8 149.5 163.7 179.4 196.7 9.4%CustomerDeposits 104.7 110.6 121.7 133.9 147.2 162.0 178.2 10.0%OtherLiabilities 6.1 3.8 3.6 3.6 3.6 3.6 3.6 (0.6%)TotalLiabilities 110.9 114.4 125.3 137.5 150.9 165.6 181.8 9.7%ShareholdersEquity 12.2 11.1 11.5 12.0 12.8 13.7 14.8 6.1%BookvaluePershare 39.7 35.9 37.4 39.0 41.6 44.6 48.2 6.1%%ChangeinBVPS 2.8% (9.6%) 4.3% 4.3% 6.6% 7.3% 8.0%
7070
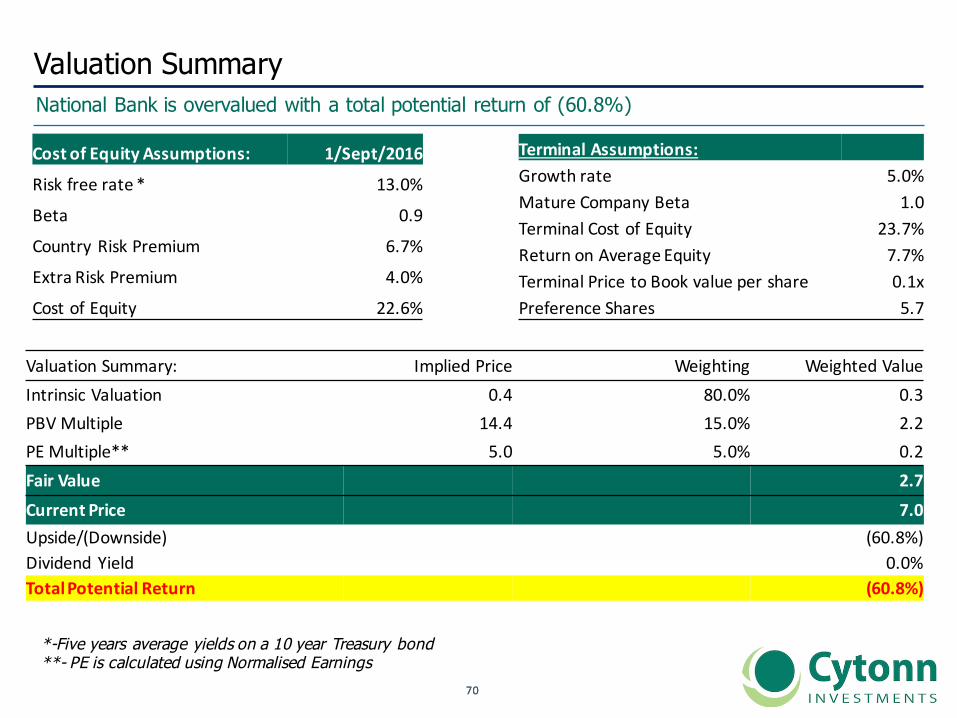
Valuation SummaryNational Bank is overvalued with a total potential return of (60.8%)
CostofEquityAssumptions: 1/Sept/2016
Riskfreerate* 13.0%
Beta 0.9
Country RiskPremium 6.7%
ExtraRiskPremium 4.0%
CostofEquity 22.6%
TerminalAssumptions:Growthrate 5.0%MatureCompanyBeta 1.0TerminalCostofEquity 23.7%ReturnonAverageEquity 7.7%TerminalPricetoBookvaluepershare 0.1xPreferenceShares 5.7
ValuationSummary: ImpliedPrice Weighting WeightedValueIntrinsic Valuation 0.4 80.0% 0.3PBVMultiple 14.4 15.0% 2.2PEMultiple** 5.0 5.0% 0.2Fair Value 2.7Current Price 7.0Upside/(Downside) (60.8%)Dividend Yield 0.0%TotalPotentialReturn (60.8%)
*-Five years average yields on a 10 year Treasury bond**- PE is calculated using Normalised Earnings

7171
II. NIC Bank
7272
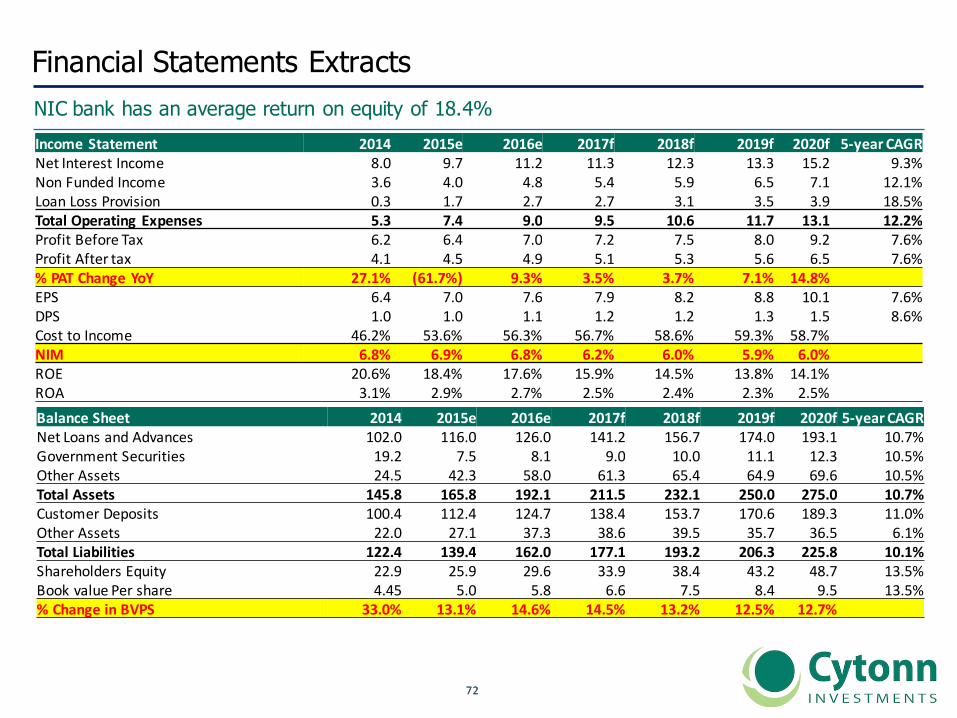
Financial Statements ExtractsNIC bank has an average return on equity of 18.4%IncomeStatement 2014 2015e 2016e 2017f 2018f 2019f 2020f 5-yearCAGRNetInterestIncome 8.0 9.7 11.2 11.3 12.3 13.3 15.2 9.3%NonFundedIncome 3.6 4.0 4.8 5.4 5.9 6.5 7.1 12.1%LoanLossProvision 0.3 1.7 2.7 2.7 3.1 3.5 3.9 18.5%TotalOperatingExpenses 5.3 7.4 9.0 9.5 10.6 11.7 13.1 12.2%ProfitBeforeTax 6.2 6.4 7.0 7.2 7.5 8.0 9.2 7.6%ProfitAftertax 4.1 4.5 4.9 5.1 5.3 5.6 6.5 7.6%%PATChangeYoY 27.1% (61.7%) 9.3% 3.5% 3.7% 7.1% 14.8%EPS 6.4 7.0 7.6 7.9 8.2 8.8 10.1 7.6%DPS 1.0 1.0 1.1 1.2 1.2 1.3 1.5 8.6%CosttoIncome 46.2% 53.6% 56.3% 56.7% 58.6% 59.3% 58.7%NIM 6.8% 6.9% 6.8% 6.2% 6.0% 5.9% 6.0%ROE 20.6% 18.4% 17.6% 15.9% 14.5% 13.8% 14.1%ROA 3.1% 2.9% 2.7% 2.5% 2.4% 2.3% 2.5%BalanceSheet 2014 2015e 2016e 2017f 2018f 2019f 2020f 5-yearCAGRNetLoansandAdvances 102.0 116.0 126.0 141.2 156.7 174.0 193.1 10.7%GovernmentSecurities 19.2 7.5 8.1 9.0 10.0 11.1 12.3 10.5%OtherAssets 24.5 42.3 58.0 61.3 65.4 64.9 69.6 10.5%TotalAssets 145.8 165.8 192.1 211.5 232.1 250.0 275.0 10.7%CustomerDeposits 100.4 112.4 124.7 138.4 153.7 170.6 189.3 11.0%OtherAssets 22.0 27.1 37.3 38.6 39.5 35.7 36.5 6.1%TotalLiabilities 122.4 139.4 162.0 177.1 193.2 206.3 225.8 10.1%ShareholdersEquity 22.9 25.9 29.6 33.9 38.4 43.2 48.7 13.5%BookvaluePershare 4.45 5.0 5.8 6.6 7.5 8.4 9.5 13.5%%ChangeinBVPS 33.0% 13.1% 14.6% 14.5% 13.2% 12.5% 12.7%
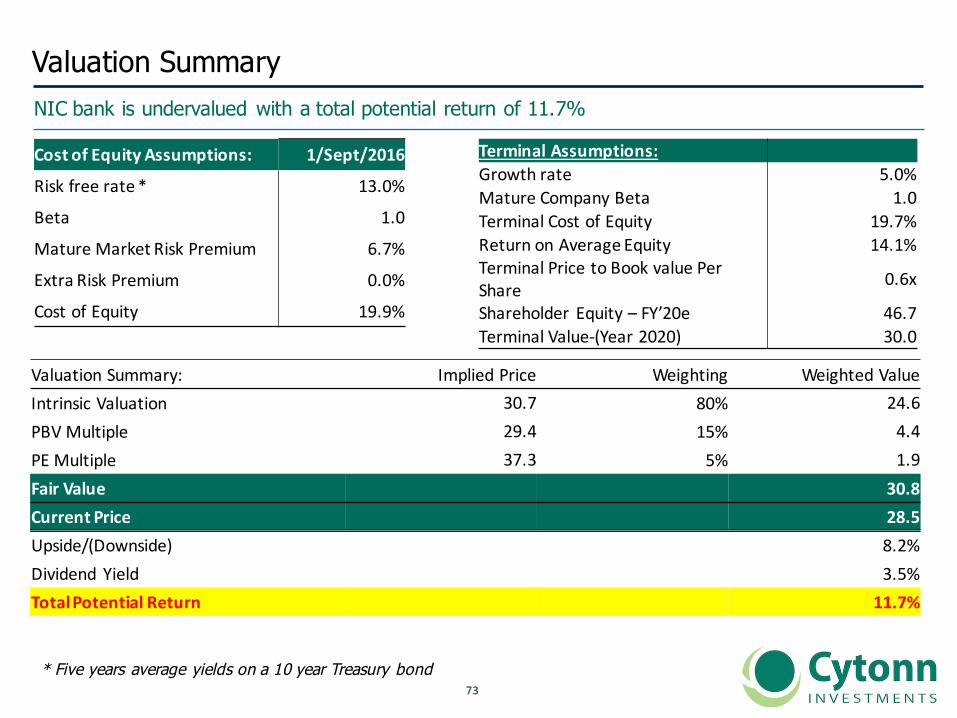
7373
Valuation SummaryNIC bank is undervalued with a total potential return of 11.7%
CostofEquityAssumptions: 1/Sept/2016
Riskfreerate* 13.0%
Beta 1.0
MatureMarketRiskPremium 6.7%
ExtraRiskPremium 0.0%
CostofEquity 19.9%
TerminalAssumptions:Growthrate 5.0%MatureCompanyBeta 1.0TerminalCostofEquity 19.7%ReturnonAverageEquity 14.1%TerminalPricetoBookvaluePerShare 0.6x
Shareholder Equity– FY’20e 46.7TerminalValue-(Year2020) 30.0
ValuationSummary: ImpliedPrice Weighting WeightedValueIntrinsic Valuation 30.7 80% 24.6PBVMultiple 29.4 15% 4.4PEMultiple 37.3 5% 1.9Fair Value 30.8Current Price 28.5Upside/(Downside) 8.2%Dividend Yield 3.5%TotalPotentialReturn 11.7%
* Five years average yields on a 10 year Treasury bond
7474
III. CfC Stanbic Bank
7575
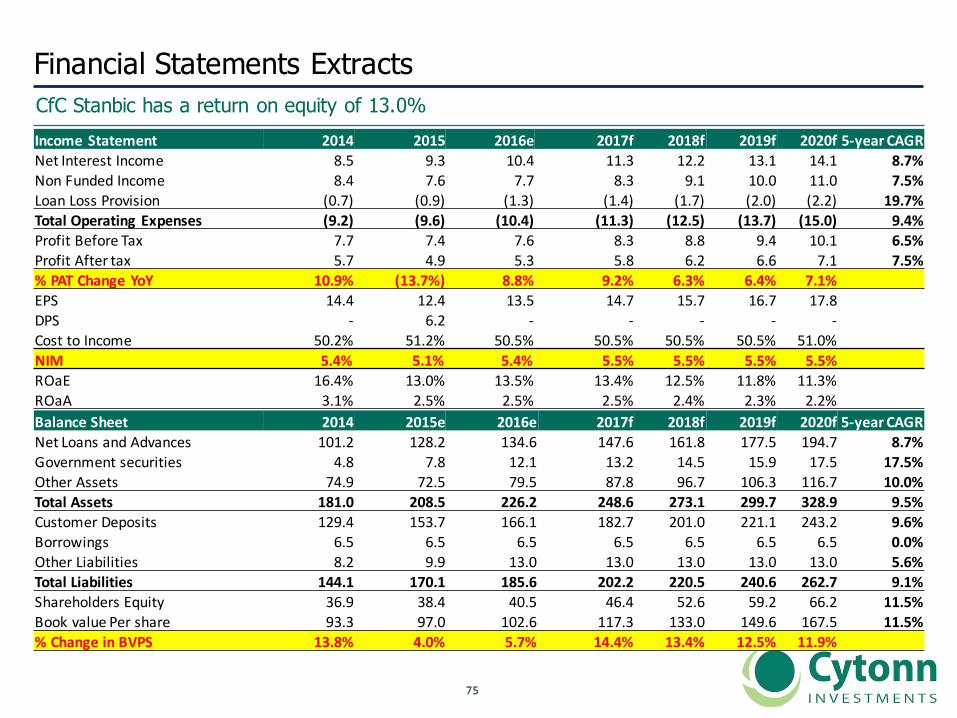
Financial Statements ExtractsCfC Stanbic has a return on equity of 13.0%IncomeStatement 2014 2015 2016e 2017f 2018f 2019f 2020f 5-yearCAGRNetInterestIncome 8.5 9.3 10.4 11.3 12.2 13.1 14.1 8.7%NonFundedIncome 8.4 7.6 7.7 8.3 9.1 10.0 11.0 7.5%LoanLossProvision (0.7) (0.9) (1.3) (1.4) (1.7) (2.0) (2.2) 19.7%TotalOperatingExpenses (9.2) (9.6) (10.4) (11.3) (12.5) (13.7) (15.0) 9.4%ProfitBeforeTax 7.7 7.4 7.6 8.3 8.8 9.4 10.1 6.5%ProfitAftertax 5.7 4.9 5.3 5.8 6.2 6.6 7.1 7.5%%PATChangeYoY 10.9% (13.7%) 8.8% 9.2% 6.3% 6.4% 7.1%EPS 14.4 12.4 13.5 14.7 15.7 16.7 17.8DPS - 6.2 - - - - -CosttoIncome 50.2% 51.2% 50.5% 50.5% 50.5% 50.5% 51.0%NIM 5.4% 5.1% 5.4% 5.5% 5.5% 5.5% 5.5%ROaE 16.4% 13.0% 13.5% 13.4% 12.5% 11.8% 11.3%ROaA 3.1% 2.5% 2.5% 2.5% 2.4% 2.3% 2.2%BalanceSheet 2014 2015e 2016e 2017f 2018f 2019f 2020f 5-year CAGRNetLoansandAdvances 101.2 128.2 134.6 147.6 161.8 177.5 194.7 8.7%Governmentsecurities 4.8 7.8 12.1 13.2 14.5 15.9 17.5 17.5%OtherAssets 74.9 72.5 79.5 87.8 96.7 106.3 116.7 10.0%TotalAssets 181.0 208.5 226.2 248.6 273.1 299.7 328.9 9.5%CustomerDeposits 129.4 153.7 166.1 182.7 201.0 221.1 243.2 9.6%Borrowings 6.5 6.5 6.5 6.5 6.5 6.5 6.5 0.0%OtherLiabilities 8.2 9.9 13.0 13.0 13.0 13.0 13.0 5.6%TotalLiabilities 144.1 170.1 185.6 202.2 220.5 240.6 262.7 9.1%ShareholdersEquity 36.9 38.4 40.5 46.4 52.6 59.2 66.2 11.5%BookvaluePershare 93.3 97.0 102.6 117.3 133.0 149.6 167.5 11.5%%ChangeinBVPS 13.8% 4.0% 5.7% 14.4% 13.4% 12.5% 11.9%
7676
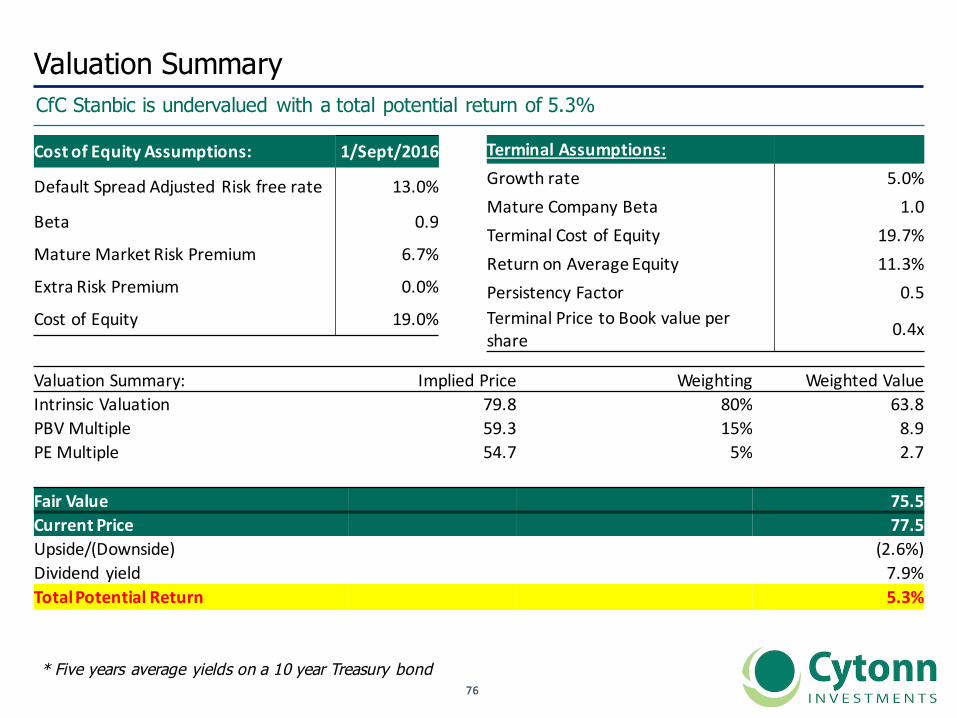
Valuation SummaryCfC Stanbic is undervalued with a total potential return of 5.3%
CostofEquityAssumptions: 1/Sept/2016
DefaultSpreadAdjustedRiskfreerate 13.0%
Beta 0.9
MatureMarketRiskPremium 6.7%
ExtraRiskPremium 0.0%
CostofEquity 19.0%
TerminalAssumptions:Growthrate 5.0%MatureCompanyBeta 1.0TerminalCostofEquity 19.7%ReturnonAverageEquity 11.3%PersistencyFactor 0.5TerminalPricetoBookvaluepershare 0.4x
Valuation Summary: ImpliedPrice Weighting WeightedValueIntrinsic Valuation 79.8 80% 63.8PBV Multiple 59.3 15% 8.9PE Multiple 54.7 5% 2.7
Fair Value 75.5Current Price 77.5Upside/(Downside) (2.6%)Dividend yield 7.9%TotalPotential Return 5.3%
* Five years average yields on a 10 year Treasury bond

7777
IV. I&M Holdings
7878
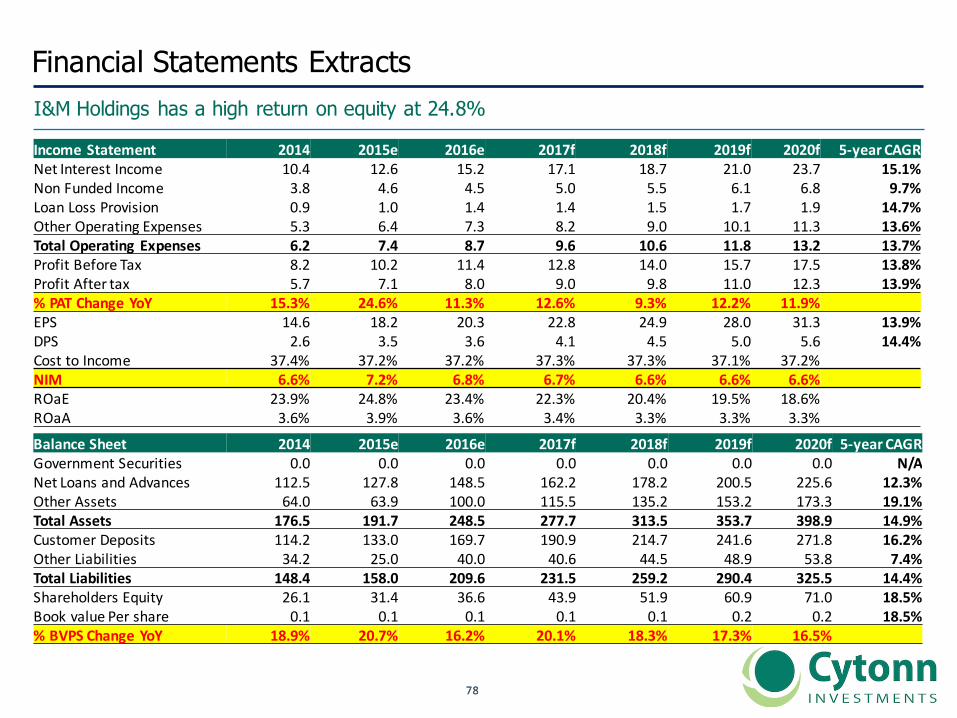
Financial Statements Extracts I&M Holdings has a high return on equity at 24.8%
IncomeStatement 2014 2015e 2016e 2017f 2018f 2019f 2020f 5-yearCAGRNetInterestIncome 10.4 12.6 15.2 17.1 18.7 21.0 23.7 15.1%NonFundedIncome 3.8 4.6 4.5 5.0 5.5 6.1 6.8 9.7%LoanLossProvision 0.9 1.0 1.4 1.4 1.5 1.7 1.9 14.7%OtherOperatingExpenses 5.3 6.4 7.3 8.2 9.0 10.1 11.3 13.6%TotalOperatingExpenses 6.2 7.4 8.7 9.6 10.6 11.8 13.2 13.7%ProfitBeforeTax 8.2 10.2 11.4 12.8 14.0 15.7 17.5 13.8%ProfitAftertax 5.7 7.1 8.0 9.0 9.8 11.0 12.3 13.9%%PATChangeYoY 15.3% 24.6% 11.3% 12.6% 9.3% 12.2% 11.9%EPS 14.6 18.2 20.3 22.8 24.9 28.0 31.3 13.9%DPS 2.6 3.5 3.6 4.1 4.5 5.0 5.6 14.4%Cost toIncome 37.4% 37.2% 37.2% 37.3% 37.3% 37.1% 37.2%NIM 6.6% 7.2% 6.8% 6.7% 6.6% 6.6% 6.6%ROaE 23.9% 24.8% 23.4% 22.3% 20.4% 19.5% 18.6%ROaA 3.6% 3.9% 3.6% 3.4% 3.3% 3.3% 3.3%
BalanceSheet 2014 2015e 2016e 2017f 2018f 2019f 2020f 5-yearCAGRGovernmentSecurities 0.0 0.0 0.0 0.0 0.0 0.0 0.0 N/ANetLoansandAdvances 112.5 127.8 148.5 162.2 178.2 200.5 225.6 12.3%OtherAssets 64.0 63.9 100.0 115.5 135.2 153.2 173.3 19.1%TotalAssets 176.5 191.7 248.5 277.7 313.5 353.7 398.9 14.9%CustomerDeposits 114.2 133.0 169.7 190.9 214.7 241.6 271.8 16.2%OtherLiabilities 34.2 25.0 40.0 40.6 44.5 48.9 53.8 7.4%TotalLiabilities 148.4 158.0 209.6 231.5 259.2 290.4 325.5 14.4%ShareholdersEquity 26.1 31.4 36.6 43.9 51.9 60.9 71.0 18.5%BookvaluePershare 0.1 0.1 0.1 0.1 0.1 0.2 0.2 18.5%%BVPSChangeYoY 18.9% 20.7% 16.2% 20.1% 18.3% 17.3% 16.5%
7979
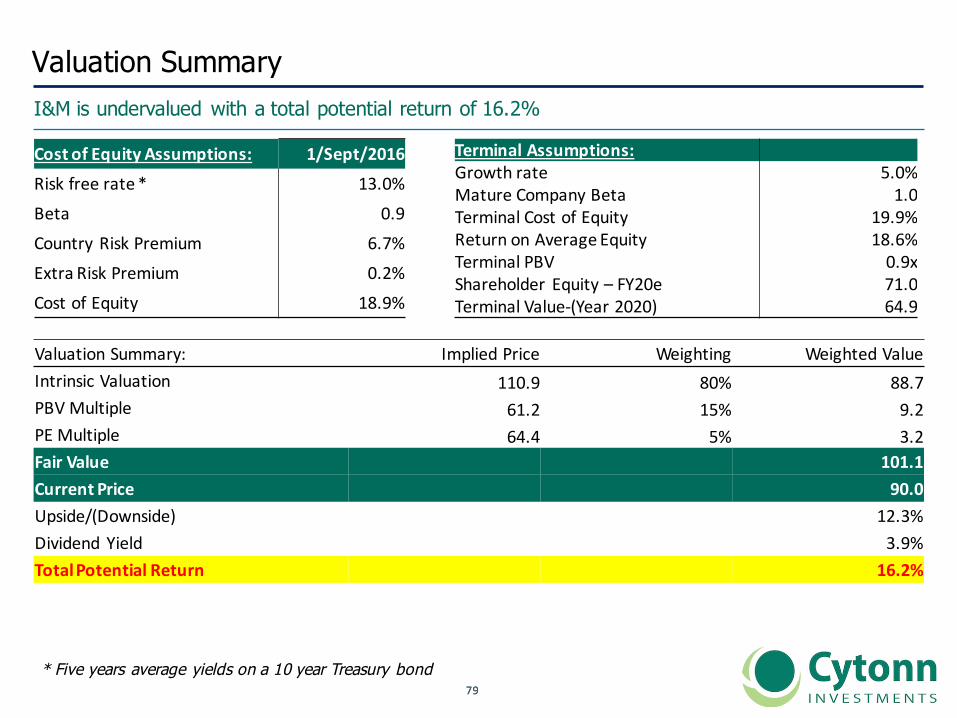
Valuation SummaryI&M is undervalued with a total potential return of 16.2%
CostofEquityAssumptions: 1/Sept/2016Riskfreerate* 13.0%Beta 0.9Country RiskPremium 6.7%ExtraRiskPremium 0.2%CostofEquity 18.9%
TerminalAssumptions:Growthrate 5.0%MatureCompanyBeta 1.0TerminalCostofEquity 19.9%ReturnonAverageEquity 18.6%TerminalPBV 0.9xShareholder Equity– FY20e 71.0TerminalValue-(Year2020) 64.9
ValuationSummary: ImpliedPrice Weighting WeightedValueIntrinsic Valuation 110.9 80% 88.7PBVMultiple 61.2 15% 9.2PEMultiple 64.4 5% 3.2FairValue 101.1CurrentPrice 90.0Upside/(Downside) 12.3%Dividend Yield 3.9%TotalPotential Return 16.2%
* Five years average yields on a 10 year Treasury bond

8080
VI. HF Group
8181
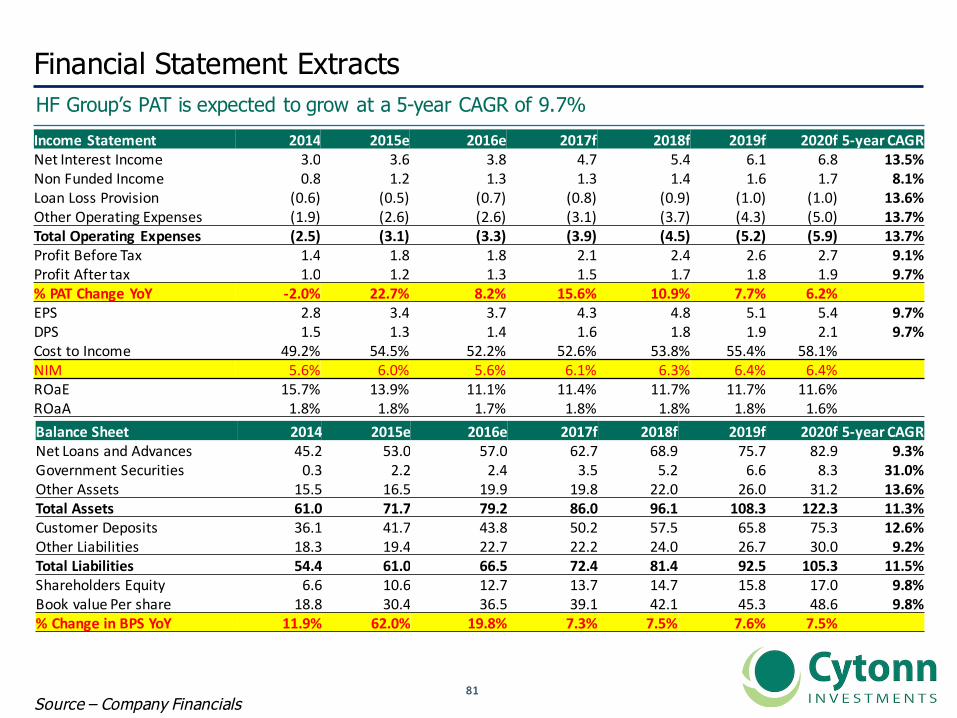
Financial Statement ExtractsHF Group’s PAT is expected to grow at a 5-year CAGR of 9.7%
Source – Company Financials
IncomeStatement 2014 2015e 2016e 2017f 2018f 2019f 2020f 5-yearCAGRNetInterestIncome 3.0 3.6 3.8 4.7 5.4 6.1 6.8 13.5%NonFundedIncome 0.8 1.2 1.3 1.3 1.4 1.6 1.7 8.1%LoanLossProvision (0.6) (0.5) (0.7) (0.8) (0.9) (1.0) (1.0) 13.6%OtherOperatingExpenses (1.9) (2.6) (2.6) (3.1) (3.7) (4.3) (5.0) 13.7%TotalOperatingExpenses (2.5) (3.1) (3.3) (3.9) (4.5) (5.2) (5.9) 13.7%ProfitBeforeTax 1.4 1.8 1.8 2.1 2.4 2.6 2.7 9.1%ProfitAftertax 1.0 1.2 1.3 1.5 1.7 1.8 1.9 9.7%%PATChangeYoY -2.0% 22.7% 8.2% 15.6% 10.9% 7.7% 6.2%EPS 2.8 3.4 3.7 4.3 4.8 5.1 5.4 9.7%DPS 1.5 1.3 1.4 1.6 1.8 1.9 2.1 9.7%CosttoIncome 49.2% 54.5% 52.2% 52.6% 53.8% 55.4% 58.1%NIM 5.6% 6.0% 5.6% 6.1% 6.3% 6.4% 6.4%ROaE 15.7% 13.9% 11.1% 11.4% 11.7% 11.7% 11.6%ROaA 1.8% 1.8% 1.7% 1.8% 1.8% 1.8% 1.6%BalanceSheet 2014 2015e 2016e 2017f 2018f 2019f 2020f 5-yearCAGRNetLoansandAdvances 45.2 53.0 57.0 62.7 68.9 75.7 82.9 9.3%GovernmentSecurities 0.3 2.2 2.4 3.5 5.2 6.6 8.3 31.0%OtherAssets 15.5 16.5 19.9 19.8 22.0 26.0 31.2 13.6%TotalAssets 61.0 71.7 79.2 86.0 96.1 108.3 122.3 11.3%CustomerDeposits 36.1 41.7 43.8 50.2 57.5 65.8 75.3 12.6%OtherLiabilities 18.3 19.4 22.7 22.2 24.0 26.7 30.0 9.2%TotalLiabilities 54.4 61.0 66.5 72.4 81.4 92.5 105.3 11.5%ShareholdersEquity 6.6 10.6 12.7 13.7 14.7 15.8 17.0 9.8%BookvaluePershare 18.8 30.4 36.5 39.1 42.1 45.3 48.6 9.8%%ChangeinBPSYoY 11.9% 62.0% 19.8% 7.3% 7.5% 7.6% 7.5%
8282
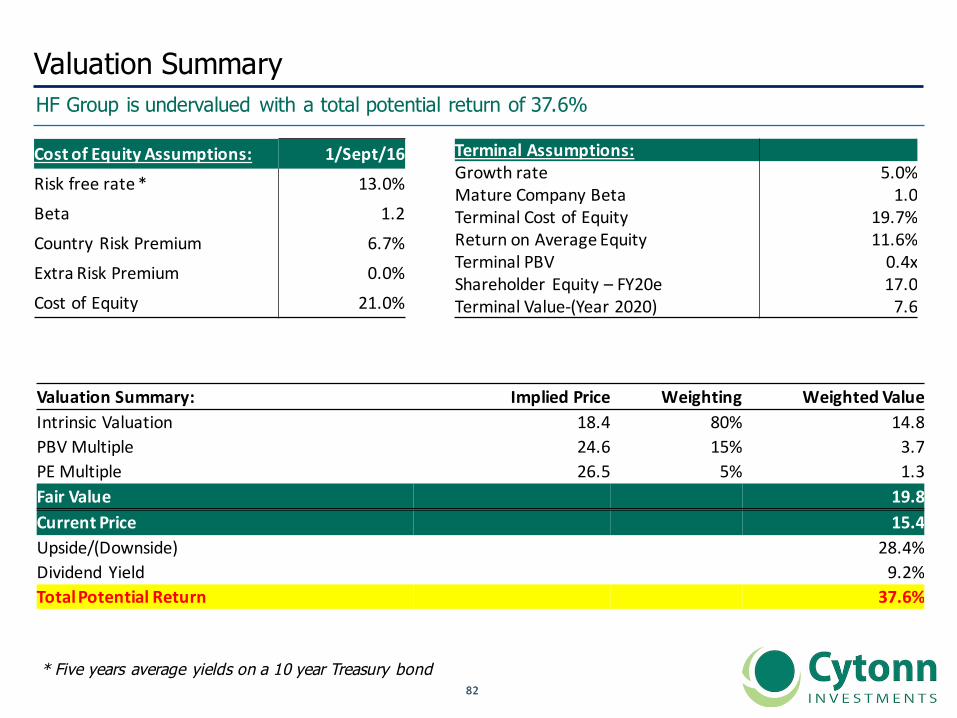
Valuation SummaryHF Group is undervalued with a total potential return of 37.6%
ValuationSummary: ImpliedPrice Weighting WeightedValueIntrinsic Valuation 18.4 80% 14.8PBVMultiple 24.6 15% 3.7PEMultiple 26.5 5% 1.3FairValue 19.8CurrentPrice 15.4Upside/(Downside) 28.4%Dividend Yield 9.2%TotalPotentialReturn 37.6%
CostofEquityAssumptions: 1/Sept/16Riskfreerate* 13.0%Beta 1.2Country RiskPremium 6.7%ExtraRiskPremium 0.0%CostofEquity 21.0%
TerminalAssumptions:Growthrate 5.0%MatureCompanyBeta 1.0TerminalCostofEquity 19.7%ReturnonAverageEquity 11.6%TerminalPBV 0.4xShareholder Equity– FY20e 17.0TerminalValue-(Year2020) 7.6
* Five years average yields on a 10 year Treasury bond

8383
Q&A