Embed Size (px)
Citation preview
EXSCEL Primary Results PresentationEASDLisbon, PortugalThursday 14th September, 2017
Study Rationale, Design and Conduct
Robert J. Mentz, MDDuke Clinical Research Institute
Presenter Disclosure Information
Research support:• AstraZeneca, Amgen, GlaxoSmithKline
Advisory boards:• Amgen, Boehringer-Ingelheim
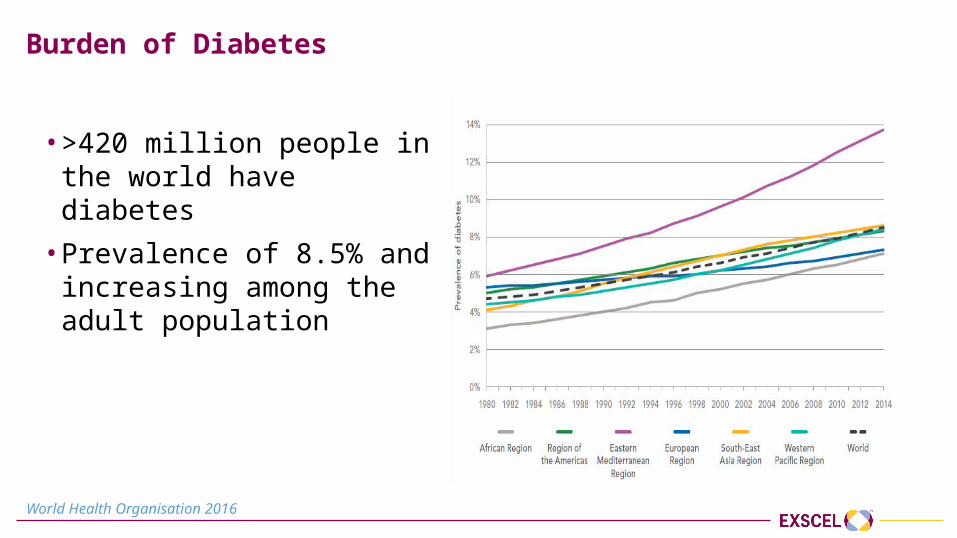
Burden of Diabetes
• >420 million people in the world have diabetes
• Prevalence of 8.5% and increasing among the adult population
World Health Organisation 2016
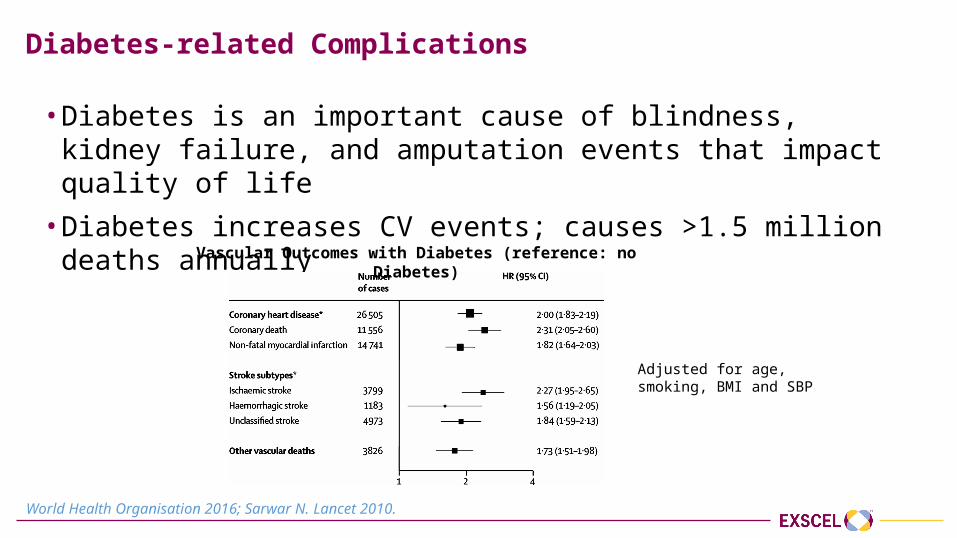
Diabetes-related Complications
• Diabetes is an important cause of blindness, kidney failure, and amputation events that impact quality of life
• Diabetes increases CV events; causes >1.5 million deaths annually
Vascular Outcomes with Diabetes (reference: no Diabetes)
Adjusted for age, smoking, BMI and SBP
World Health Organisation 2016; Sarwar N. Lancet 2010.
Evaluating Cardiovascular Risk in New Antidiabetic Therapies
• Regulatory requirement that new therapies to treat T2DM both effectively lower glucose levels and demonstrate evidence of cardiovascular safety
• Large cardiovascular outcomes trials required for novel T2DM therapies with robust assessment of cardiovascular end-points and important safety events
EXSCEL
• Large, pragmatic, international trial designed to characterise the effects of once weekly GLP-1 receptor agonist, exenatide, on CV-related outcomes in patients with T2DM, when added to usual diabetes care
• Double-blind, placebo-controlled trial randomising participants to exenatide 2 mg once weekly injection or matching placebo
• Academically led by the Diabetes Trials Unit, University of Oxford and the Duke Clinical Research Institute in collaboration with industry sponsorship
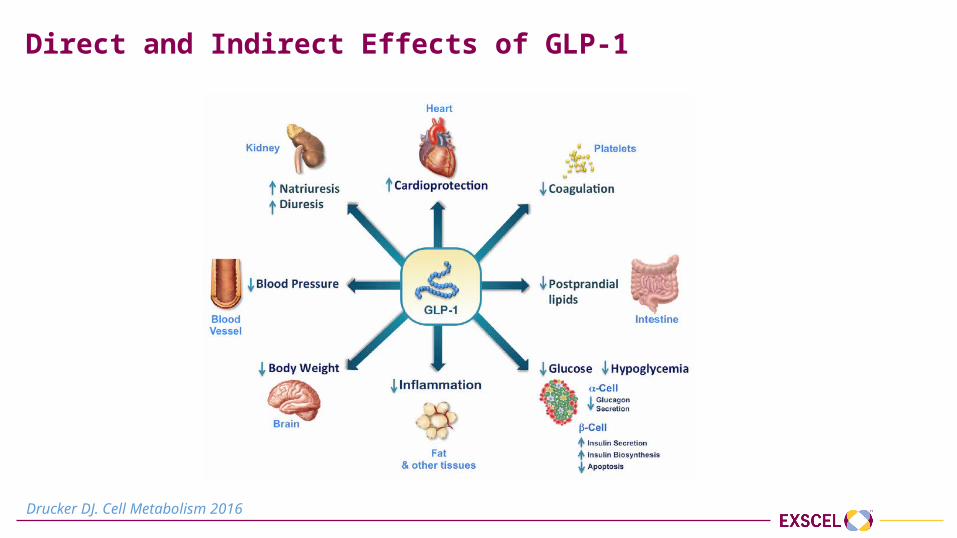
Direct and Indirect Effects of GLP-1
Drucker DJ. Cell Metabolism 2016
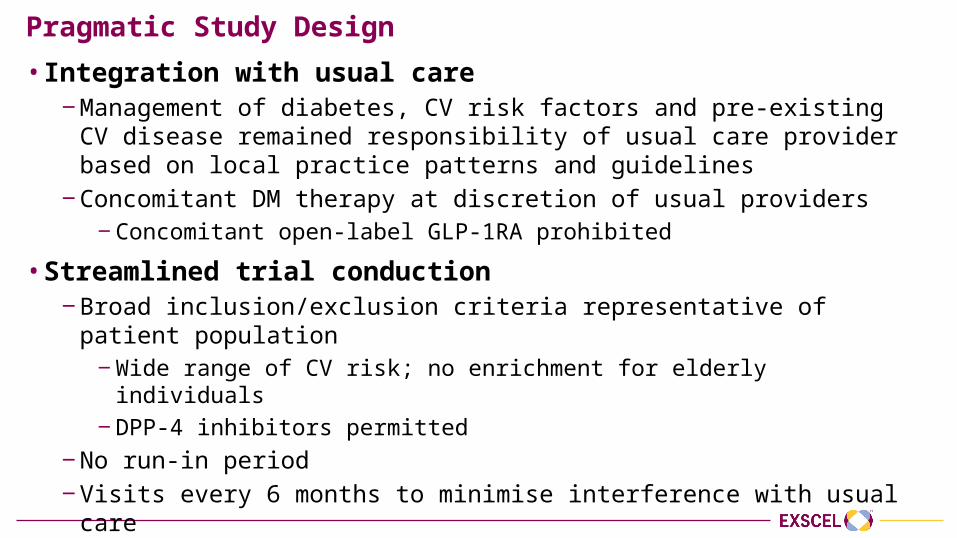
Pragmatic Study Design• Integration with usual care
‒ Management of diabetes, CV risk factors and pre-existing CV disease remained responsibility of usual care provider based on local practice patterns and guidelines
‒ Concomitant DM therapy at discretion of usual providers ‒ Concomitant open-label GLP-1RA prohibited
• Streamlined trial conduction‒ Broad inclusion/exclusion criteria representative of patient population
‒ Wide range of CV risk; no enrichment for elderly individuals‒ DPP-4 inhibitors permitted
‒ No run-in period‒ Visits every 6 months to minimise interference with usual care‒ All efficacy and safety (except for annual calcitonin) laboratory results collected
as available from the usual care setting
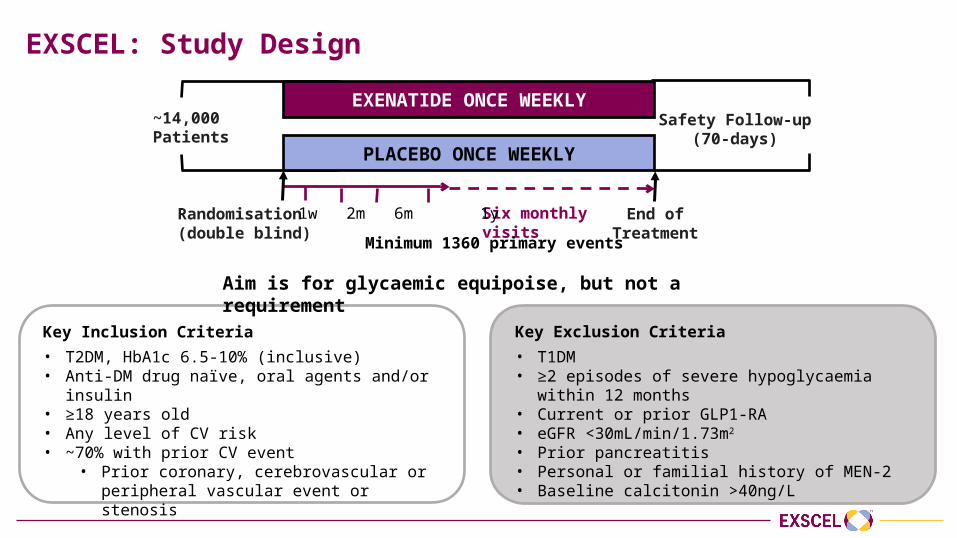
EXSCEL: Study Design
~14,000 Patients
Safety Follow-up(70-days)
PLACEBO ONCE WEEKLY
EXENATIDE ONCE WEEKLY
Six monthly visitsRandomisation(double blind)
1w 2m 6m 1y
Minimum 1360 primary events
End of Treatment
Key Inclusion Criteria• T2DM, HbA1c 6.5-10% (inclusive)• Anti-DM drug naïve, oral agents and/or insulin• ≥18 years old • Any level of CV risk• ~70% with prior CV event
• Prior coronary, cerebrovascular or peripheral vascular event or stenosis
Key Exclusion Criteria• T1DM• ≥2 episodes of severe hypoglycaemia within 12
months• Current or prior GLP1-RA• eGFR <30mL/min/1.73m2
• Prior pancreatitis• Personal or familial history of MEN-2• Baseline calcitonin >40ng/L
Aim is for glycaemic equipoise, but not a requirement
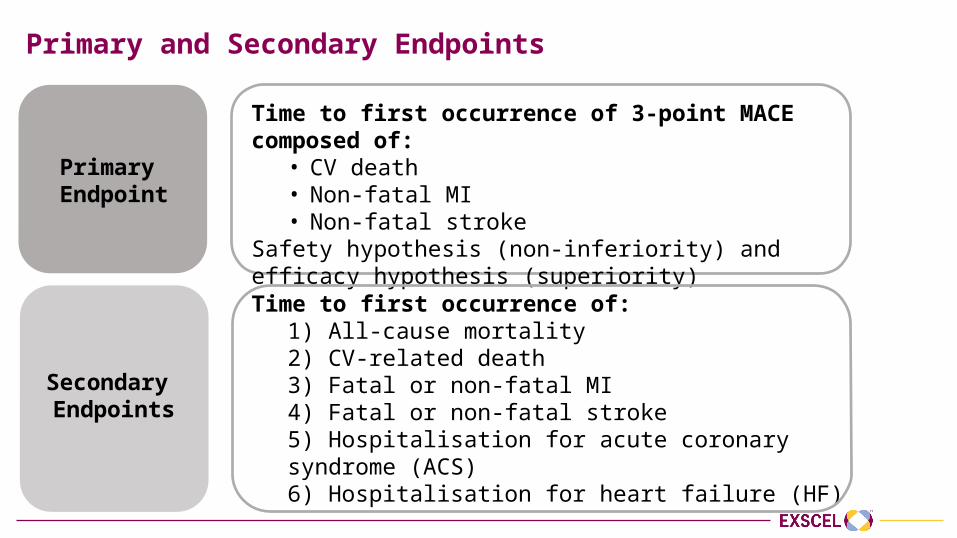
Primary and Secondary Endpoints
Time to first occurrence of 3-point MACE composed of: • CV death• Non-fatal MI• Non-fatal stroke
Safety hypothesis (non-inferiority) and efficacy hypothesis (superiority)
Primary Endpoint
Time to first occurrence of:1) All-cause mortality2) CV-related death3) Fatal or non-fatal MI4) Fatal or non-fatal stroke5) Hospitalisation for acute coronary syndrome (ACS)6) Hospitalisation for heart failure (HF)
Secondary Endpoints
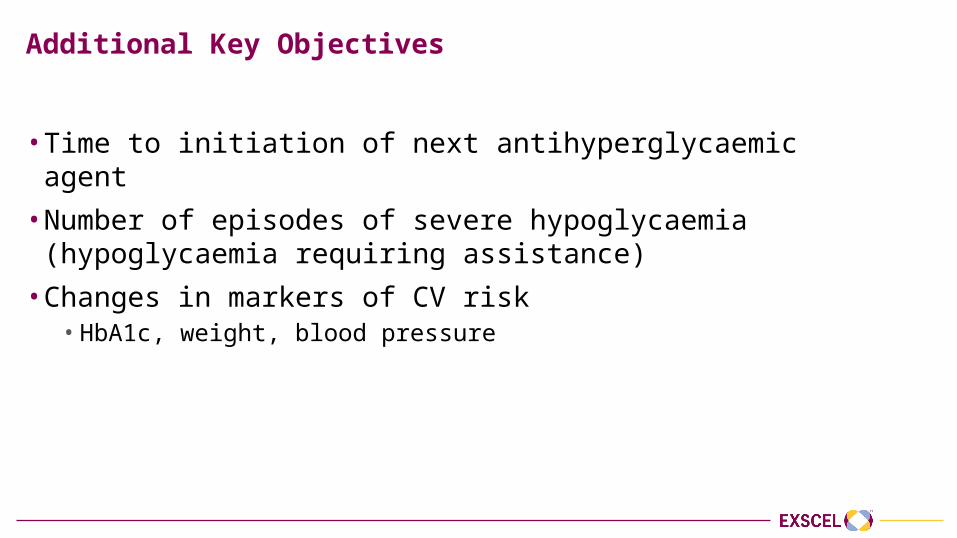
Additional Key Objectives
• Time to initiation of next antihyperglycaemic agent• Number of episodes of severe hypoglycaemia (hypoglycaemia
requiring assistance)• Changes in markers of CV risk
• HbA1c, weight, blood pressure
Power and Sample Size Calculations
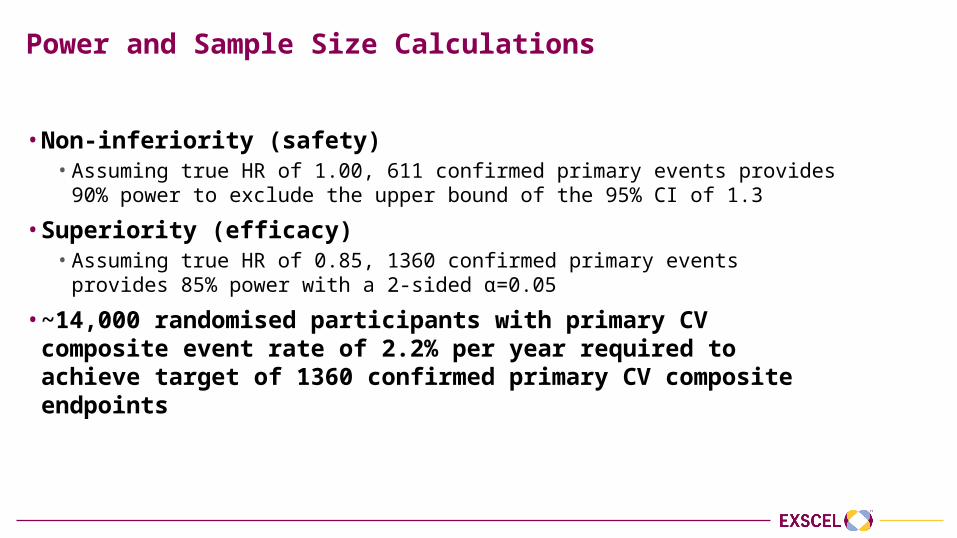
• Non-inferiority (safety)• Assuming true HR of 1.00, 611 confirmed primary events provides 90%
power to exclude the upper bound of the 95% CI of 1.3
• Superiority (efficacy)• Assuming true HR of 0.85, 1360 confirmed primary events provides 85%
power with a 2-sided α=0.05
• ~14,000 randomised participants with primary CV composite event rate of 2.2% per year required to achieve target of 1360 confirmed primary CV composite endpoints
Statistical Analysis Plan
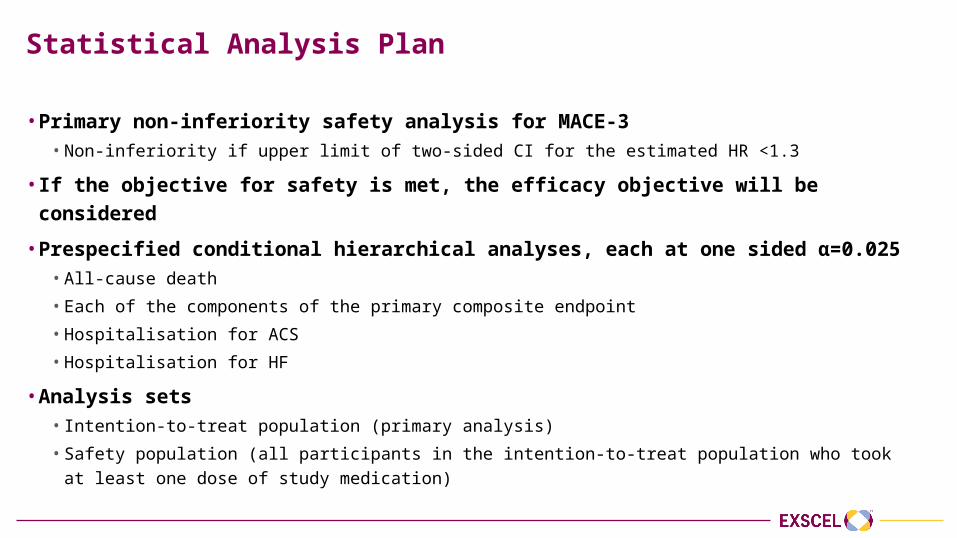
• Primary non-inferiority safety analysis for MACE-3• Non-inferiority if upper limit of two-sided CI for the estimated HR <1.3
• If the objective for safety is met, the efficacy objective will be considered• Prespecified conditional hierarchical analyses, each at one sided α=0.025
• All-cause death • Each of the components of the primary composite endpoint• Hospitalisation for ACS• Hospitalisation for HF
• Analysis sets• Intention-to-treat population (primary analysis)• Safety population (all participants in the intention-to-treat population who took at least one dose of study
medication)
Protocol-Specified Study Drug Discontinuation Criteria
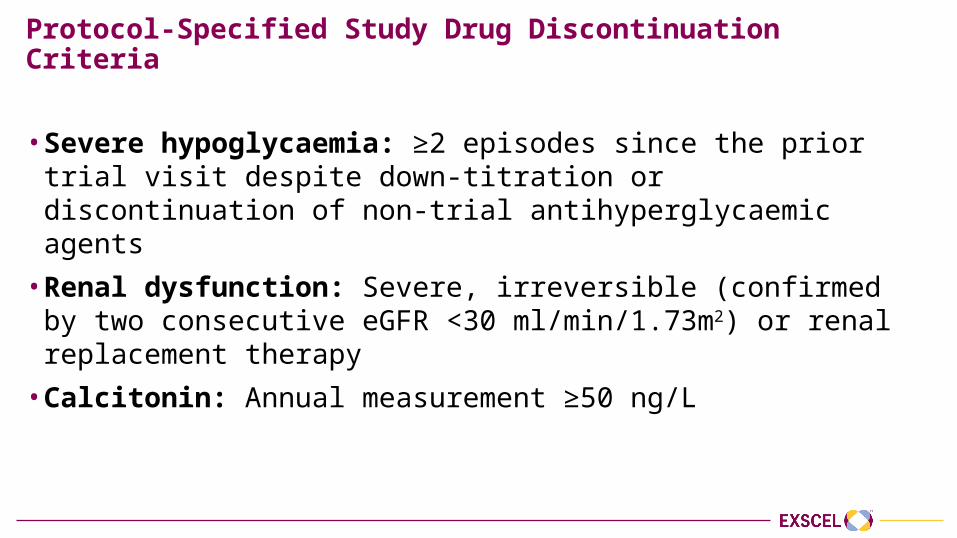
• Severe hypoglycaemia: ≥2 episodes since the prior trial visit despite down-titration or discontinuation of non-trial antihyperglycaemic agents
• Renal dysfunction: Severe, irreversible (confirmed by two consecutive eGFR <30 ml/min/1.73m2) or renal replacement therapy
• Calcitonin: Annual measurement ≥50 ng/L
Safety Documentation and Event Adjudication
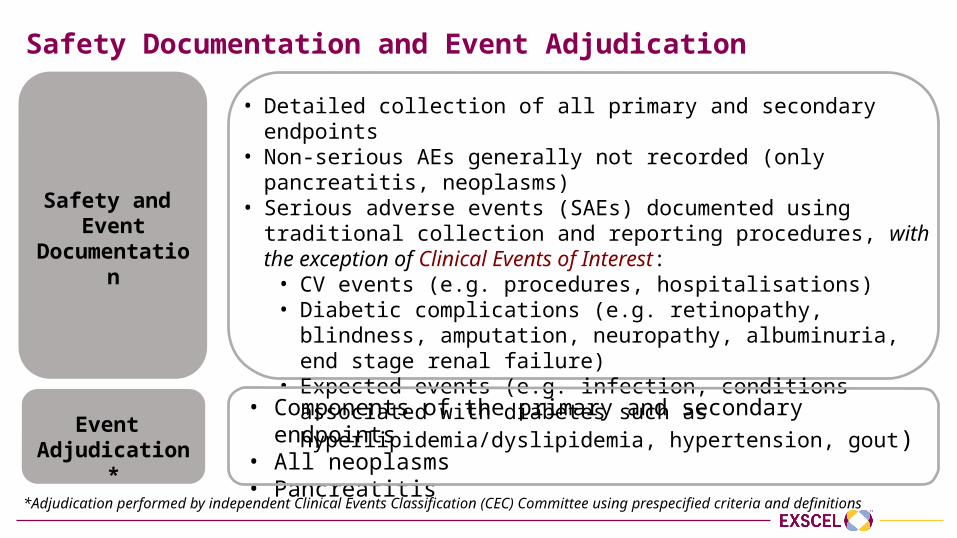
• Detailed collection of all primary and secondary endpoints• Non-serious AEs generally not recorded (only pancreatitis, neoplasms)• Serious adverse events (SAEs) documented using traditional collection
and reporting procedures, with the exception of Clinical Events of Interest:
• CV events (e.g. procedures, hospitalisations)• Diabetic complications (e.g. retinopathy, blindness, amputation,
neuropathy, albuminuria, end stage renal failure)• Expected events (e.g. infection, conditions associated with
diabetes such as hyperlipidemia/dyslipidemia, hypertension, gout)
Safety and Event
Documentation
• Components of the primary and secondary endpoints• All neoplasms• Pancreatitis
Event Adjudication*
*Adjudication performed by independent Clinical Events Classification (CEC) Committee using prespecified criteria and definitions
Participant Characteristics, Follow-Up and Changes in Key
Risk Factors
M. Angelyn Bethel, MDDiabetes Trials Unit, University of Oxford
Presenter Disclosure Information
Research Support: • Astra Zeneca, Bayer, Merck, Merck Serono
Advisory Boards:• Boehringer-Ingelheim, Novo Nordisk
Other Support:• Astra Zeneca, Merck, Novo Nordisk, Sanofi
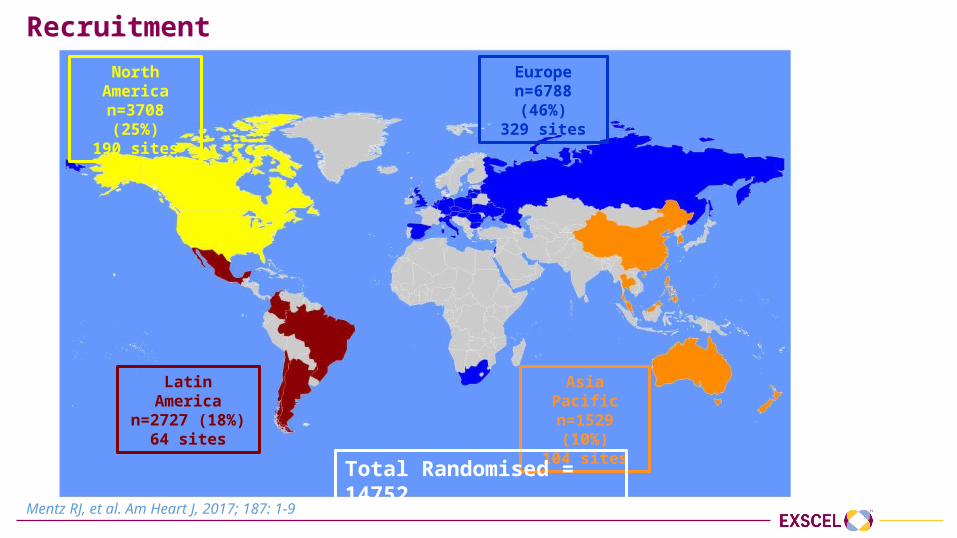
Recruitment
Mentz RJ, et al. Am Heart J, 2017; 187: 1-9
North American=3708 (25%)
190 sites
Latin American=2727 (18%)
64 sites
Europen=6788 (46%)
329 sites
Asia Pacificn=1529 (10%)
104 sites
Total Randomised = 14752
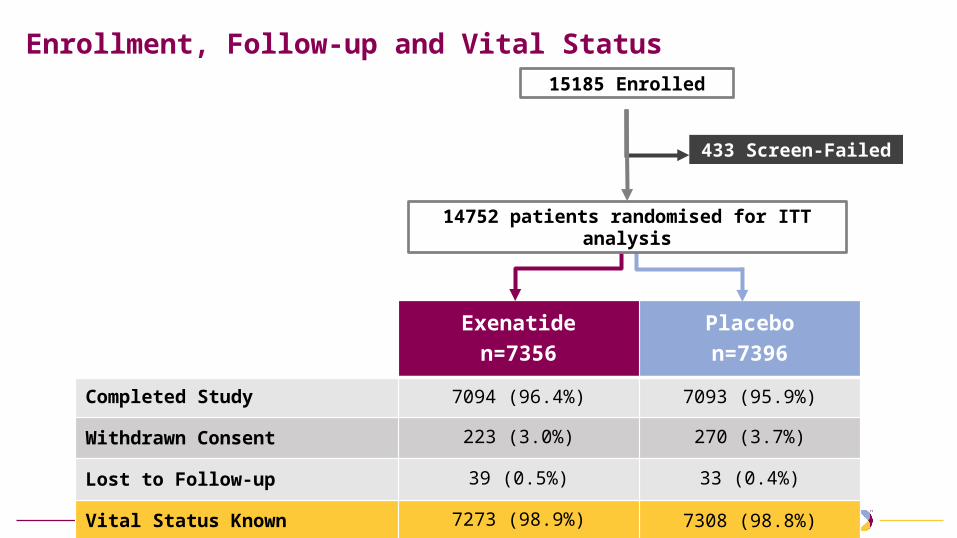
Enrollment, Follow-up and Vital Status
433 Screen-Failed
Exenatiden=7356
Placebon=7396
Completed Study 7094 (96.4%) 7093 (95.9%)
Withdrawn Consent 223 (3.0%) 270 (3.7%)
Lost to Follow-up 39 (0.5%) 33 (0.4%)
Vital Status Known 7273 (98.9%) 7308 (98.8%)
15185 Enrolled
14752 patients randomised for ITT analysis
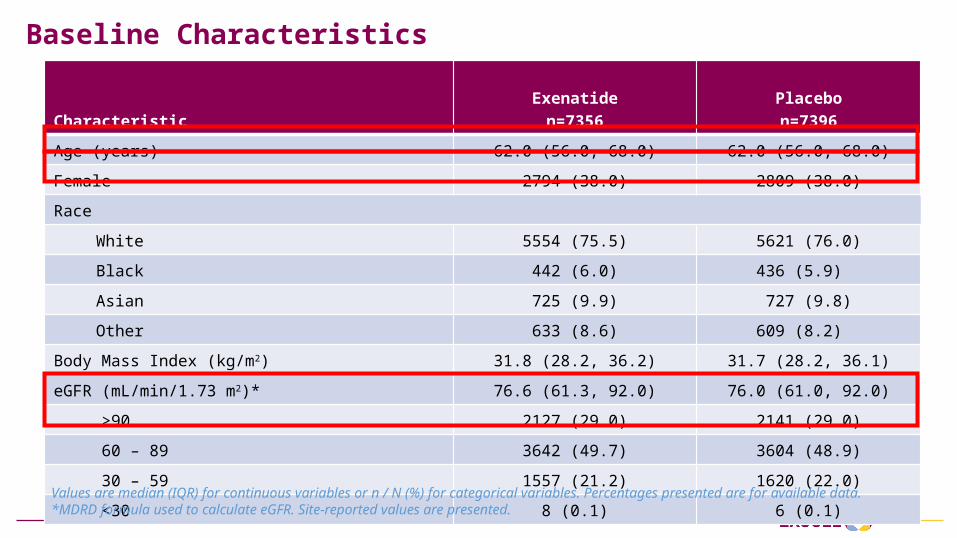
Baseline Characteristics
CharacteristicExenatide
n=7356Placebon=7396
Age (years) 62.0 (56.0, 68.0) 62.0 (56.0, 68.0)
Female 2794 (38.0) 2809 (38.0)
Race
White 5554 (75.5) 5621 (76.0)
Black 442 (6.0) 436 (5.9)
Asian 725 (9.9) 727 (9.8)
Other 633 (8.6) 609 (8.2)
Body Mass Index (kg/m2) 31.8 (28.2, 36.2) 31.7 (28.2, 36.1)
eGFR (mL/min/1.73 m2)* 76.6 (61.3, 92.0) 76.0 (61.0, 92.0)
>90 2127 (29.0) 2141 (29.0)
60 – 89 3642 (49.7) 3604 (48.9)
30 – 59 1557 (21.2) 1620 (22.0)
<30 8 (0.1) 6 (0.1)
Values are median (IQR) for continuous variables or n / N (%) for categorical variables. Percentages presented are for available data. *MDRD formula used to calculate eGFR. Site-reported values are presented.
Values are median (IQR) for continuous variables or n / N (%) for categorical variables. Percentages presented are for available data.
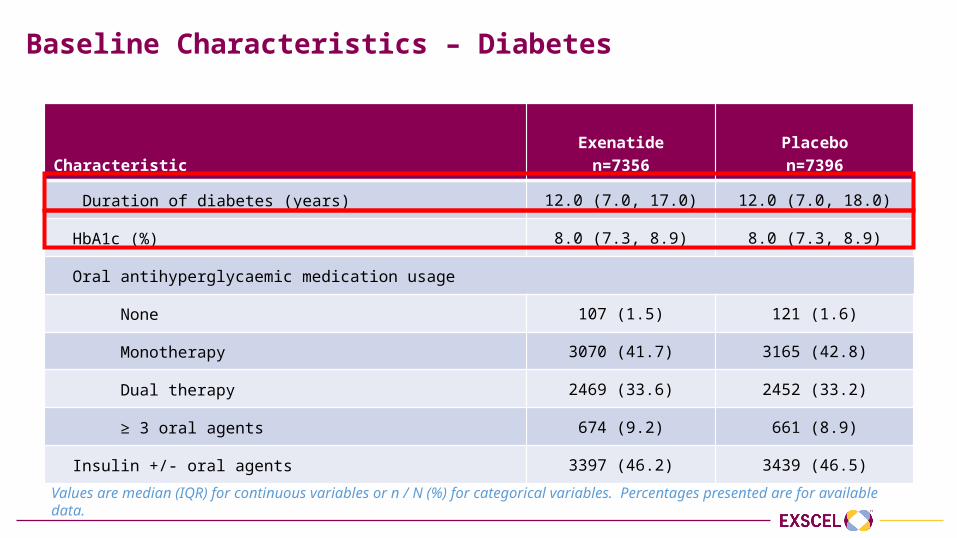
Baseline Characteristics – Diabetes
CharacteristicExenatide
n=7356Placebon=7396
Duration of diabetes (years) 12.0 (7.0, 17.0) 12.0 (7.0, 18.0)
HbA1c (%) 8.0 (7.3, 8.9) 8.0 (7.3, 8.9)
Oral antihyperglycaemic medication usage
None 107 (1.5) 121 (1.6)
Monotherapy 3070 (41.7) 3165 (42.8)
Dual therapy 2469 (33.6) 2452 (33.2)
≥ 3 oral agents 674 (9.2) 661 (8.9)
Insulin +/- oral agents 3397 (46.2) 3439 (46.5)
Includes medications taken alone or in combination. Percentages presented are for available data. * Information regarding SGLT-2 inhibitor usage was added to the eCRF on 9th May, 2013. Percentages presented are for ITT population.
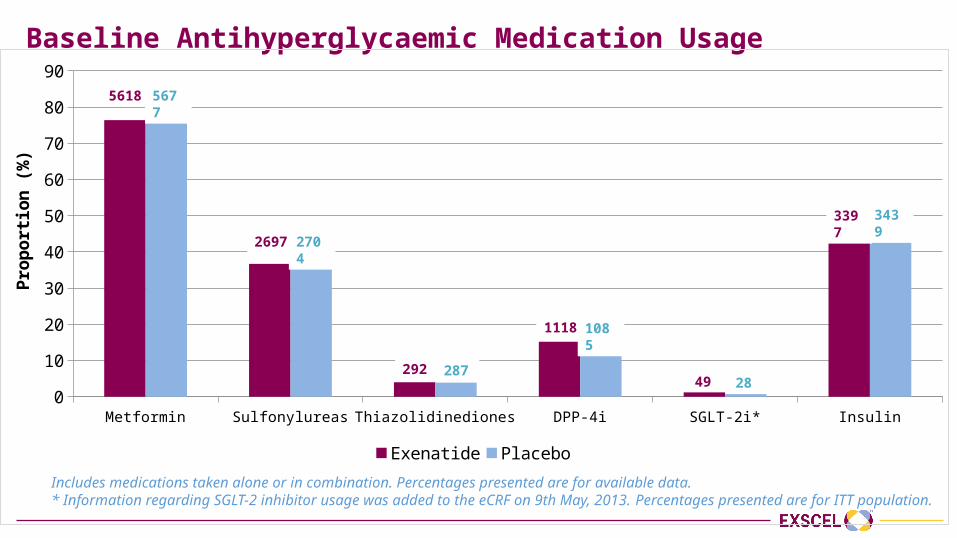
Baseline Antihyperglycaemic Medication Usage
Metformin Sulfonylureas Thiazolidinediones DPP-4i SGLT-2i* Insulin0
10
20
30
40
50
60
70
80
90
Exenatide Placebo
Prop
ortio
n (%
)
5618 5677
2697 2704
292 287
1118 1085
49 28
3397 3439
Percentages presented are for available data.
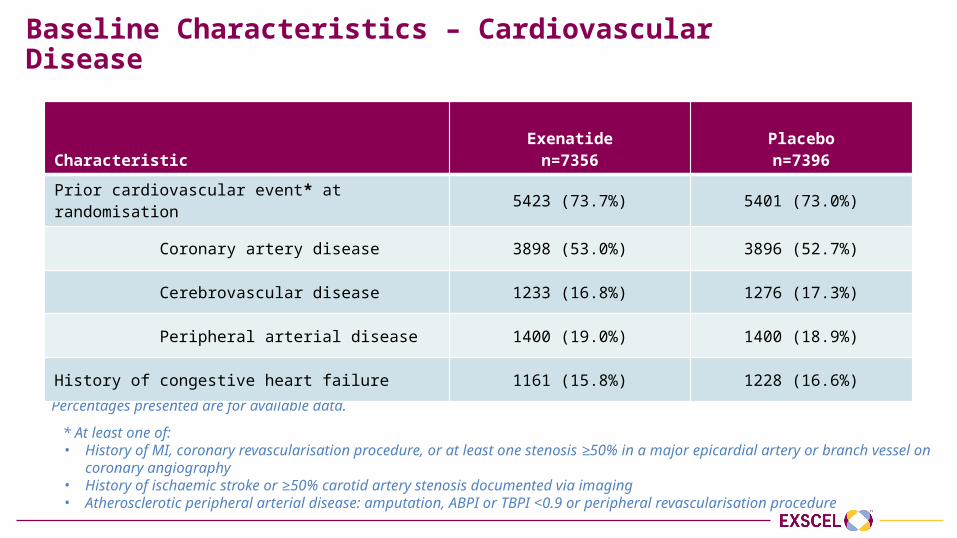
Baseline Characteristics – Cardiovascular Disease
CharacteristicExenatide
n=7356Placebon=7396
Prior cardiovascular event* at randomisation 5423 (73.7%) 5401 (73.0%)
Coronary artery disease 3898 (53.0%) 3896 (52.7%)
Cerebrovascular disease 1233 (16.8%) 1276 (17.3%)
Peripheral arterial disease 1400 (19.0%) 1400 (18.9%)
History of congestive heart failure 1161 (15.8%) 1228 (16.6%)
* At least one of:• History of MI, coronary revascularisation procedure, or at least one stenosis ≥50% in a major epicardial artery or branch vessel on
coronary angiography• History of ischaemic stroke or ≥50% carotid artery stenosis documented via imaging• Atherosclerotic peripheral arterial disease: amputation, ABPI or TBPI <0.9 or peripheral revascularisation procedure
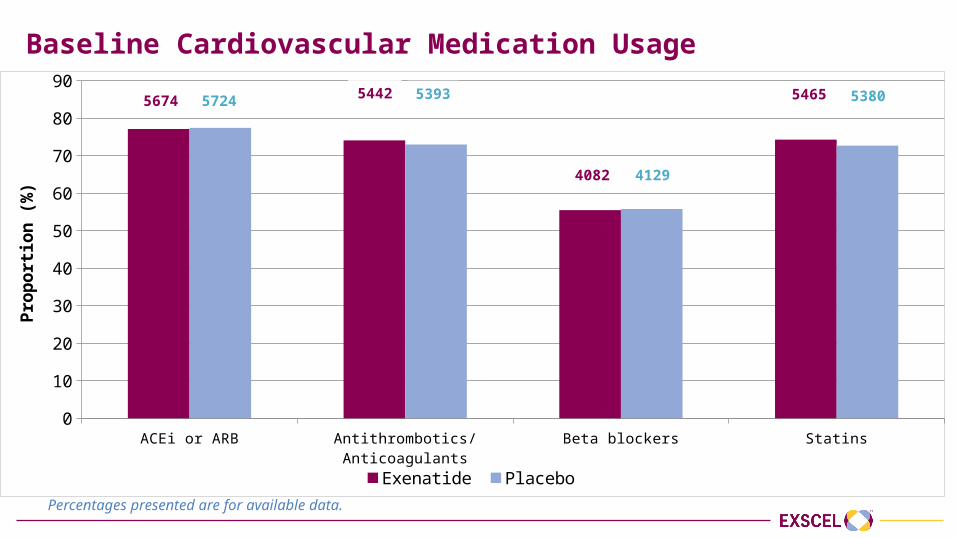
Baseline Cardiovascular Medication Usage
ACEi or ARB Antithrombotics/Anticoagulants Beta blockers Statins0
10
20
30
40
50
60
70
80
90
Exenatide Placebo
Prop
ortio
n (%
)
5674 5724 5442 5393
4082 4129
5465 5380
Percentages presented are for available data.
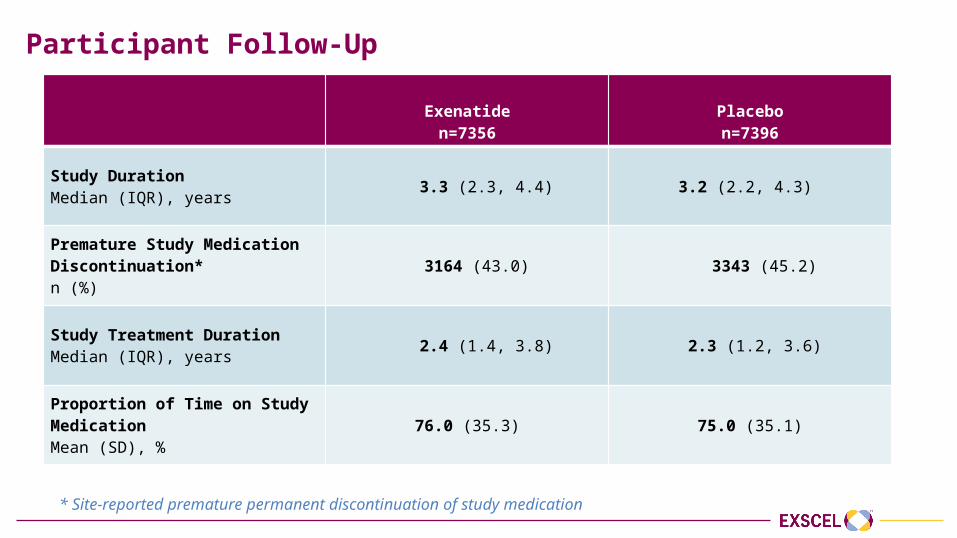
Participant Follow-Up
Exenatiden=7356
Placebon=7396
Study DurationMedian (IQR), years 3.3 (2.3, 4.4) 3.2 (2.2, 4.3)
Premature Study Medication Discontinuation* n (%)
3164 (43.0) 3343 (45.2)
Study Treatment DurationMedian (IQR), years
2.4 (1.4, 3.8) 2.3 (1.2, 3.6)
Proportion of Time on Study MedicationMean (SD), %
76.0 (35.3) 75.0 (35.1)
* Site-reported premature permanent discontinuation of study medication
Changes in key risk factors
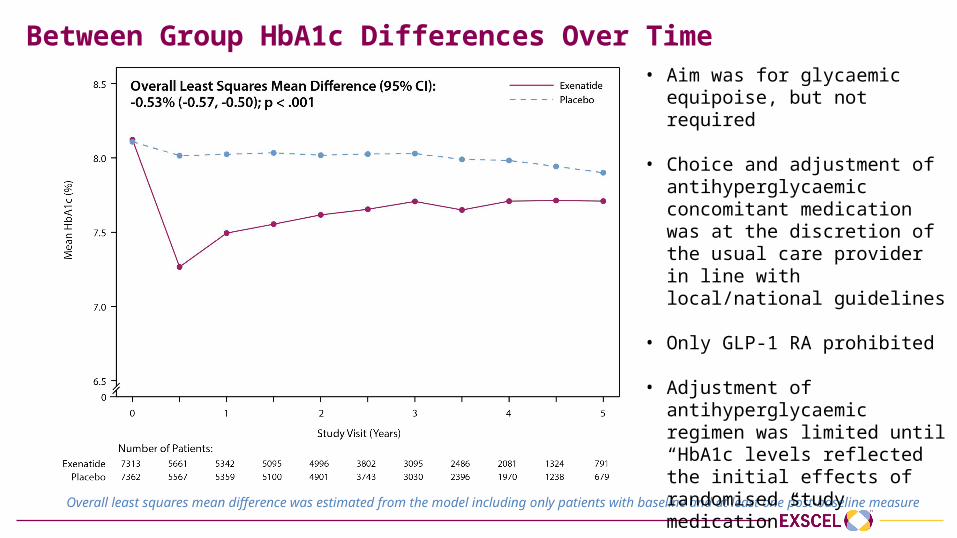
Between Group HbA1c Differences Over Time
Overall least squares mean difference was estimated from the model including only patients with baseline and at least one post-baseline measure
• Aim was for glycaemic equipoise, but not required
• Choice and adjustment of antihyperglycaemic concomitant medication was at the discretion of the usual care provider in line with local/national guidelines
• Only GLP-1 RA prohibited
• Adjustment of antihyperglycaemic regimen was limited until “HbA1c levels reflected the initial effects of randomised study medication”
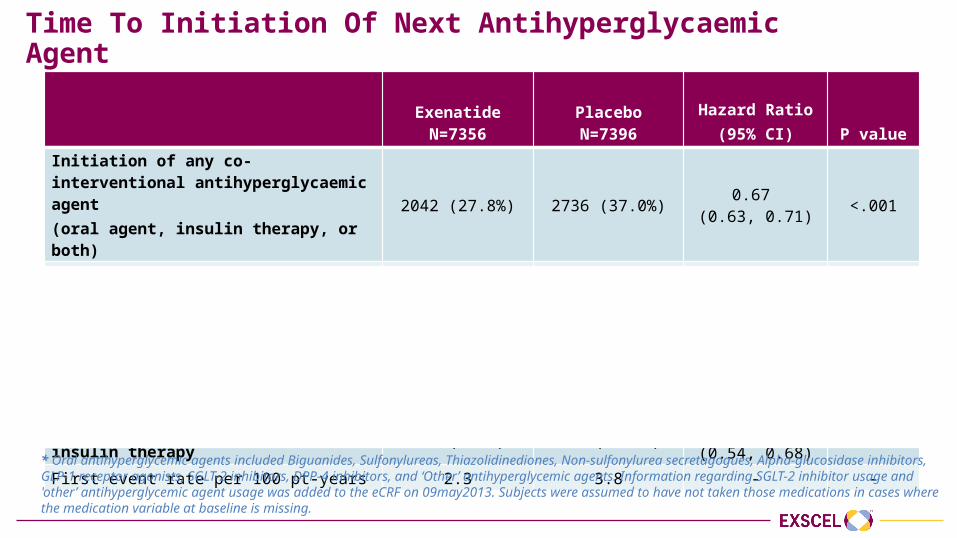
Time To Initiation Of Next Antihyperglycaemic Agent
ExenatideN=7356
PlaceboN=7396
Hazard Ratio(95% CI) P value
Initiation of any co-interventional antihyperglycaemic agent (oral agent, insulin therapy, or both)
2042 (27.8%) 2736 (37.0%) 0.67 (0.63, 0.71) <.001
First event rate per 100 pt-years 10.5 15.7 - -
Initiation of additional oral antihyperglycaemic agent * 1743 (23.7%) 2289 (30.9%)
0.70 (0.66, 0.75) <.001
First event rate per 100 pt-years 8.6 12.2 - -
Initiation of first chronic insulin therapy 515 (7.0%) 811 (11.0%)0.61
(0.54, 0.68)<.001
First event rate per 100 pt-years 2.3 3.8 - -
* Oral antihyperglycemic agents included Biguanides, Sulfonylureas, Thiazolidinediones, Non-sulfonylurea secretagogues, Alpha-glucosidase inhibitors, GLP-1 receptor agonists, SGLT-2 inhibitors, DPP-4 inhibitors, and ‘Other’ antihyperglycemic agents. Information regarding SGLT-2 inhibitor usage and 'other’ antihyperglycemic agent usage was added to the eCRF on 09may2013. Subjects were assumed to have not taken those medications in cases where the medication variable at baseline is missing.
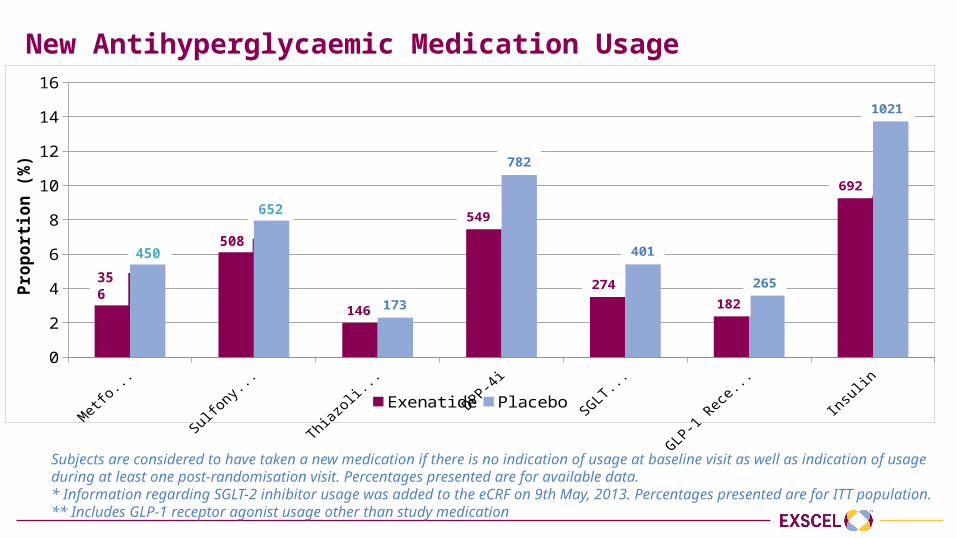
New Antihyperglycaemic Medication Usage
Metformin Sulfonylureas Thiazolidinediones DPP-4i SGLT-2i* GLP-1 Receptor Agonists** Insulin0
2
4
6
8
10
12
14
16
Exenatide Placebo
Prop
ortio
n (%
)
146 173
549
782
274
401
182265
692
1021
356450
508
652
Subjects are considered to have taken a new medication if there is no indication of usage at baseline visit as well as indication of usage during at least one post-randomisation visit. Percentages presented are for available data. * Information regarding SGLT-2 inhibitor usage was added to the eCRF on 9th May, 2013. Percentages presented are for ITT population.** Includes GLP-1 receptor agonist usage other than study medication
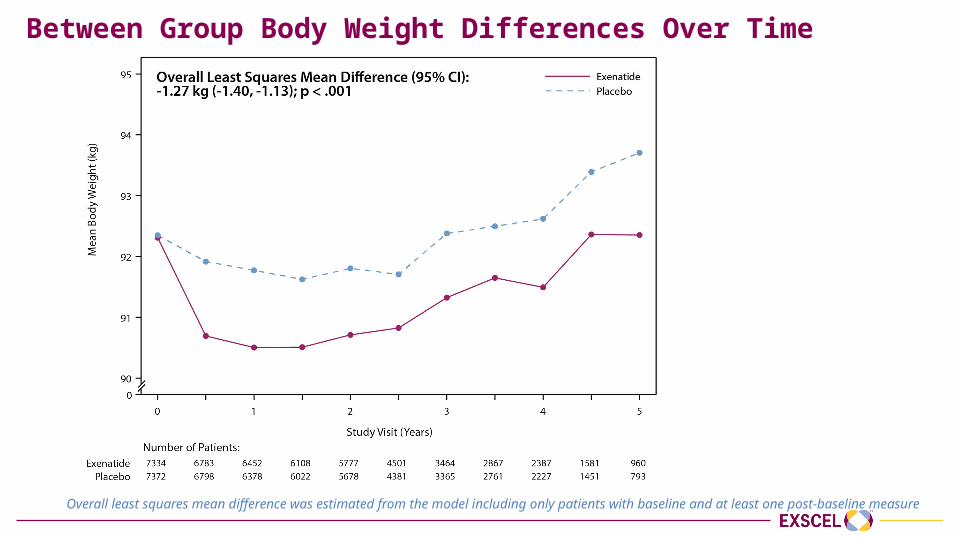
Between Group Body Weight Differences Over Time
Overall least squares mean difference was estimated from the model including only patients with baseline and at least one post-baseline measure
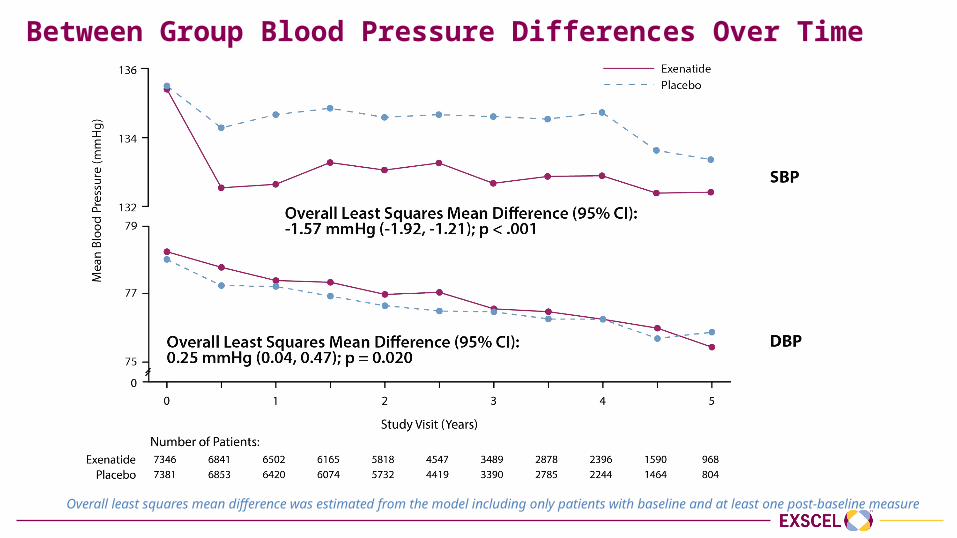
Between Group Blood Pressure Differences Over Time
Overall least squares mean difference was estimated from the model including only patients with baseline and at least one post-baseline measure
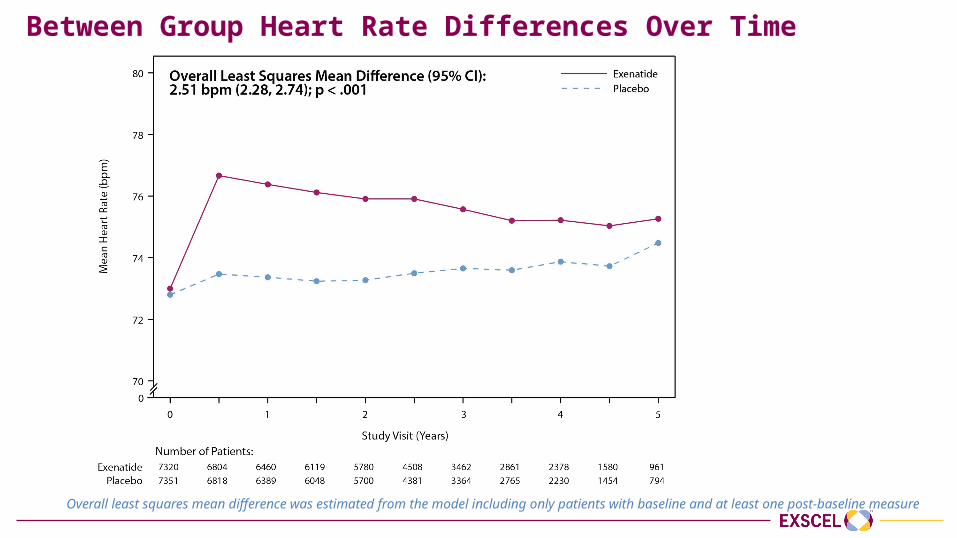
Between Group Heart Rate Differences Over Time
Overall least squares mean difference was estimated from the model including only patients with baseline and at least one post-baseline measure
Safety Data
Bernard Zinman, MDLunenfeld Tanenbaum Research Institute,
University of Toronto
Presenter Disclosure Information
Grant support:• Boehringer-Ingelheim, AstraZeneca, Novo Nordisk
Consulting fees:• AstraZeneca, Boehringer-Ingelheim, Eli Lilly, Janssen, Merck,
Novo Nordisk, Sanofi Aventis
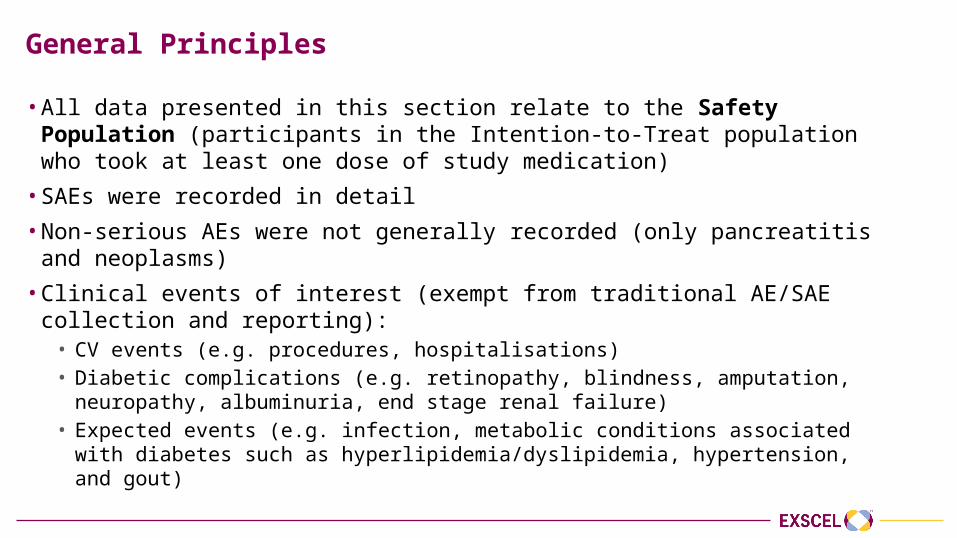
General Principles
• All data presented in this section relate to the Safety Population (participants in the Intention-to-Treat population who took at least one dose of study medication)
• SAEs were recorded in detail• Non-serious AEs were not generally recorded (only pancreatitis and neoplasms) • Clinical events of interest (exempt from traditional AE/SAE collection and
reporting): • CV events (e.g. procedures, hospitalisations)• Diabetic complications (e.g. retinopathy, blindness, amputation, neuropathy,
albuminuria, end stage renal failure)• Expected events (e.g. infection, metabolic conditions associated with diabetes such
as hyperlipidemia/dyslipidemia, hypertension, and gout)
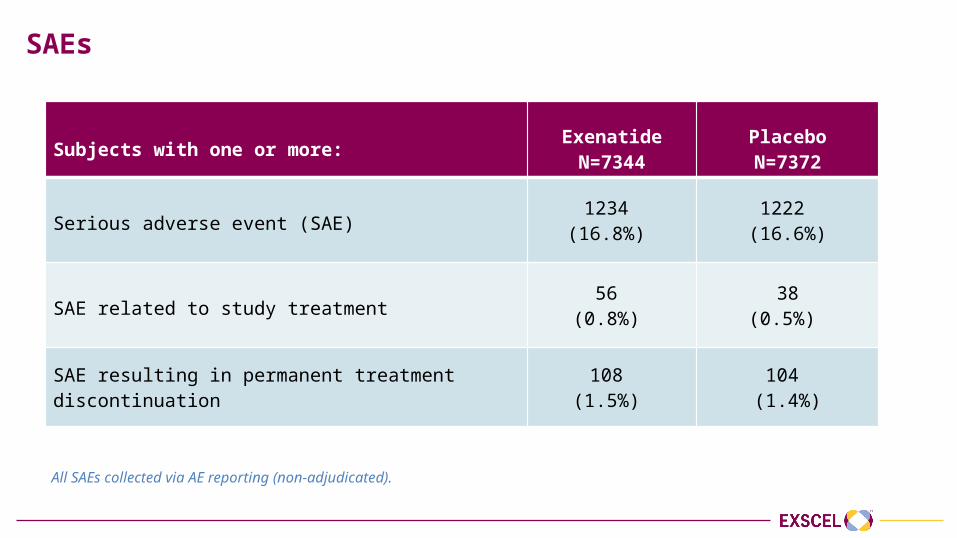
SAEs
Subjects with one or more: ExenatideN=7344
PlaceboN=7372
Serious adverse event (SAE)1234
(16.8%) 1222
(16.6%)
SAE related to study treatment56
(0.8%) 38
(0.5%)
SAE resulting in permanent treatment discontinuation 108 (1.5%)
104 (1.4%)
All SAEs collected via AE reporting (non-adjudicated).
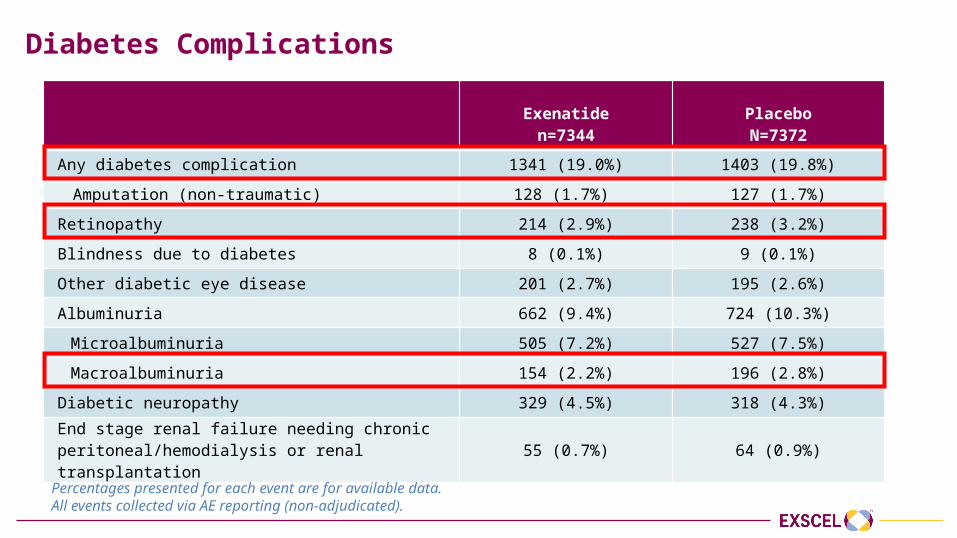
Diabetes Complications
Exenatiden=7344
PlaceboN=7372
Any diabetes complication 1341 (19.0%) 1403 (19.8%)
Amputation (non-traumatic) 128 (1.7%) 127 (1.7%)
Retinopathy 214 (2.9%) 238 (3.2%)
Blindness due to diabetes 8 (0.1%) 9 (0.1%)
Other diabetic eye disease 201 (2.7%) 195 (2.6%)
Albuminuria 662 (9.4%) 724 (10.3%)
Microalbuminuria 505 (7.2%) 527 (7.5%)
Macroalbuminuria 154 (2.2%) 196 (2.8%)
Diabetic neuropathy 329 (4.5%) 318 (4.3%)
End stage renal failure needing chronic peritoneal/hemodialysis or renal transplantation 55 (0.7%) 64 (0.9%)
Percentages presented for each event are for available data. All events collected via AE reporting (non-adjudicated).
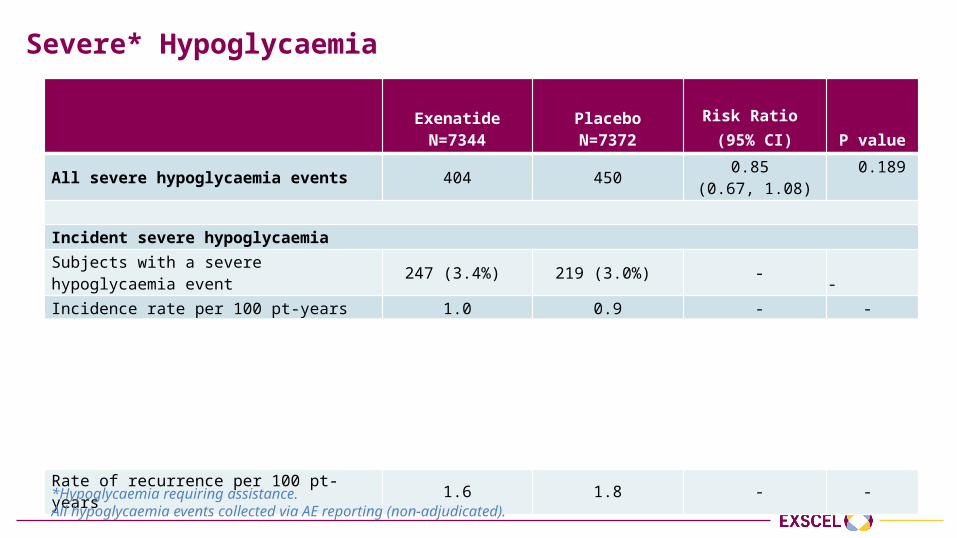
Severe* Hypoglycaemia
ExenatideN=7344
PlaceboN=7372
Risk Ratio (95% CI) P value
All severe hypoglycaemia events 404 450 0.85 (0.67, 1.08)
0.189
Incident severe hypoglycaemiaSubjects with a severe hypoglycaemia event 247 (3.4%) 219 (3.0%) - -Incidence rate per 100 pt-years 1.0 0.9 - -
Recurrent severe hypoglycaemiaNumber of events per subject:
1 185 148 - - 2 39 40 - - ≥3 23 31 - -
Rate of recurrence per 100 pt-years 1.6 1.8 - -
*Hypoglycaemia requiring assistance.All hypoglycaemia events collected via AE reporting (non-adjudicated).
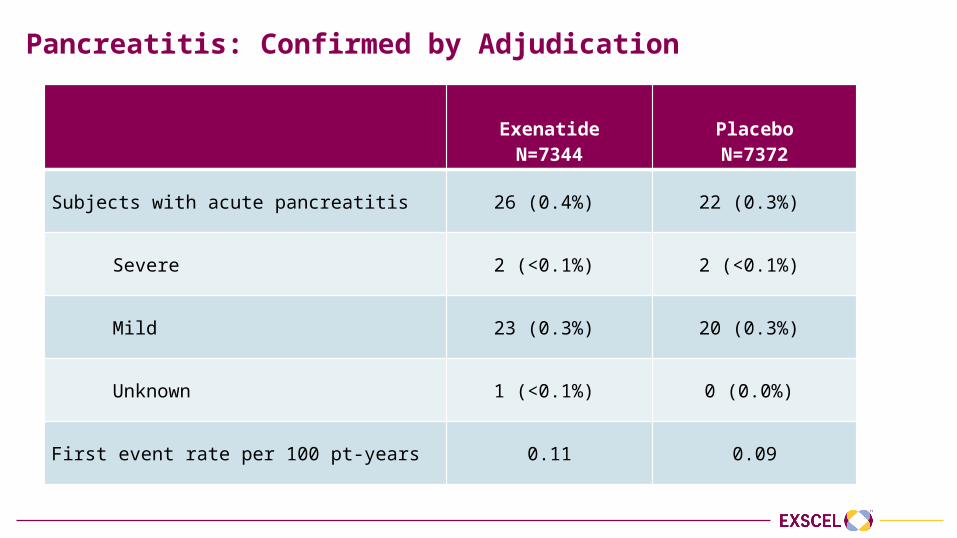
Pancreatitis: Confirmed by Adjudication
ExenatideN=7344
PlaceboN=7372
Subjects with acute pancreatitis 26 (0.4%) 22 (0.3%)
Severe 2 (<0.1%) 2 (<0.1%)
Mild 23 (0.3%) 20 (0.3%)
Unknown 1 (<0.1%) 0 (0.0%)
First event rate per 100 pt-years 0.11 0.09
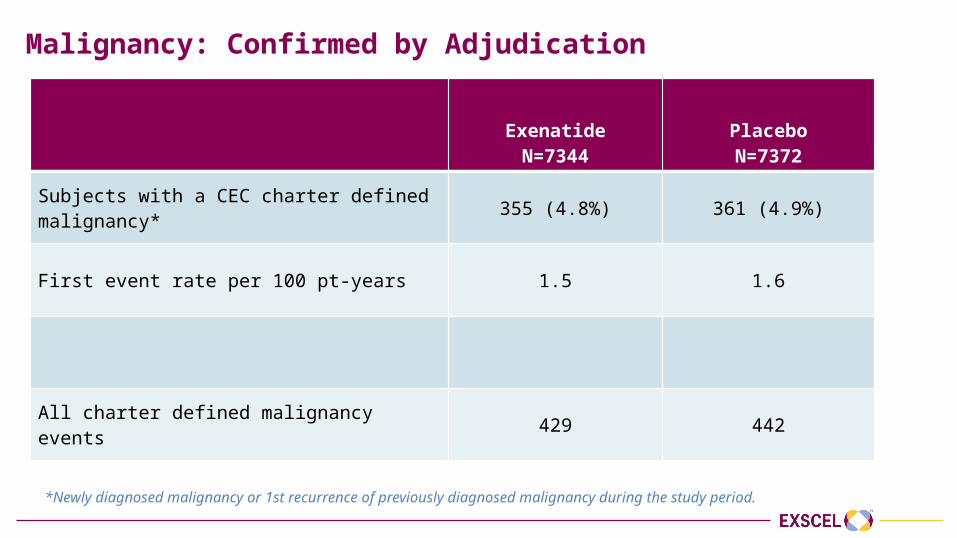
Malignancy: Confirmed by Adjudication
ExenatideN=7344
PlaceboN=7372
Subjects with a CEC charter defined malignancy* 355 (4.8%) 361 (4.9%)
First event rate per 100 pt-years 1.5 1.6
All charter defined malignancy events 429 442
*Newly diagnosed malignancy or 1st recurrence of previously diagnosed malignancy during the study period.
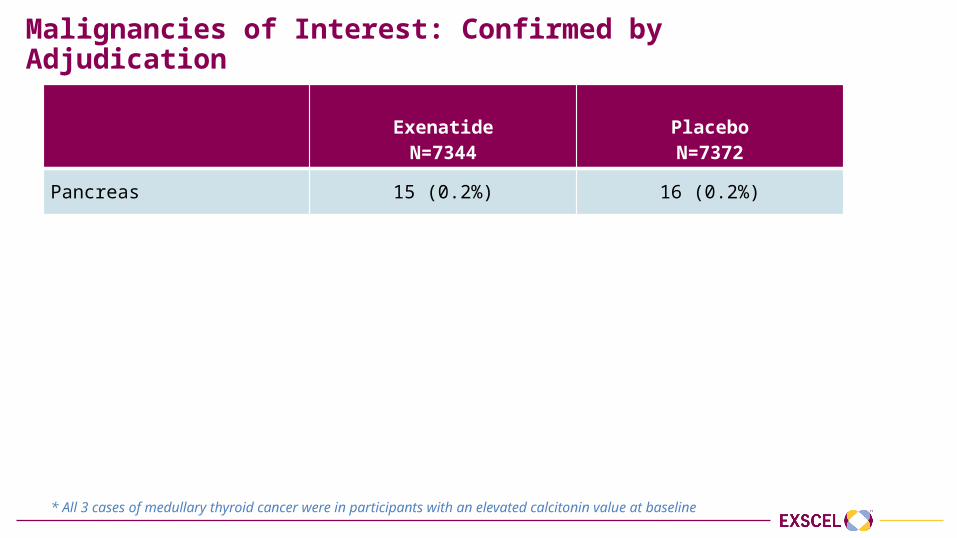
Malignancies of Interest: Confirmed by Adjudication
ExenatideN=7344
PlaceboN=7372
Pancreas 15 (0.2%) 16 (0.2%)
Thyroid 14 (0.2%) 6 (0.1%)
Medullary * 2 1
Papillary 10 4
Follicular 2 0
Other/Unknown 0 1
* All 3 cases of medullary thyroid cancer were in participants with an elevated calcitonin value at baseline
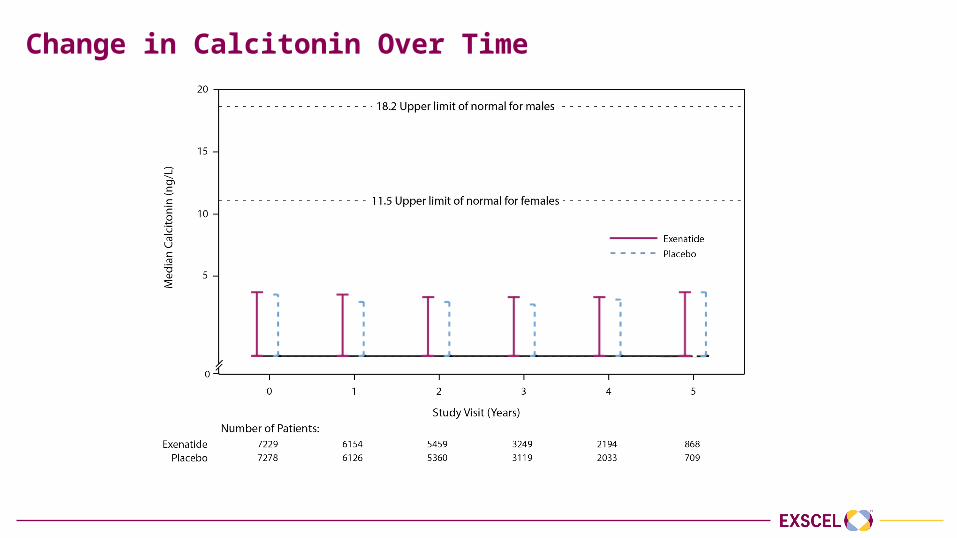
Change in Calcitonin Over Time
Cardiovascular Outcomes
Adrian F. Hernandez, MDDuke Clinical Research Institute
Presenter Disclosure Information
Research funding:• AstraZeneca, GlaxoSmithKline, Merck
Consulting fees:• Amgen, AstraZeneca, Bayer, Boehringer-Ingelheim, Merck,
Sanofi Aventis
Primary Endpoint
Primary Endpoint
Time to first occurrence of 3-point MACE composed of: • CV death• Non-fatal MI• Non-fatal stroke
Safety hypothesis (non-inferiority) and efficacy hypothesis (superiority)
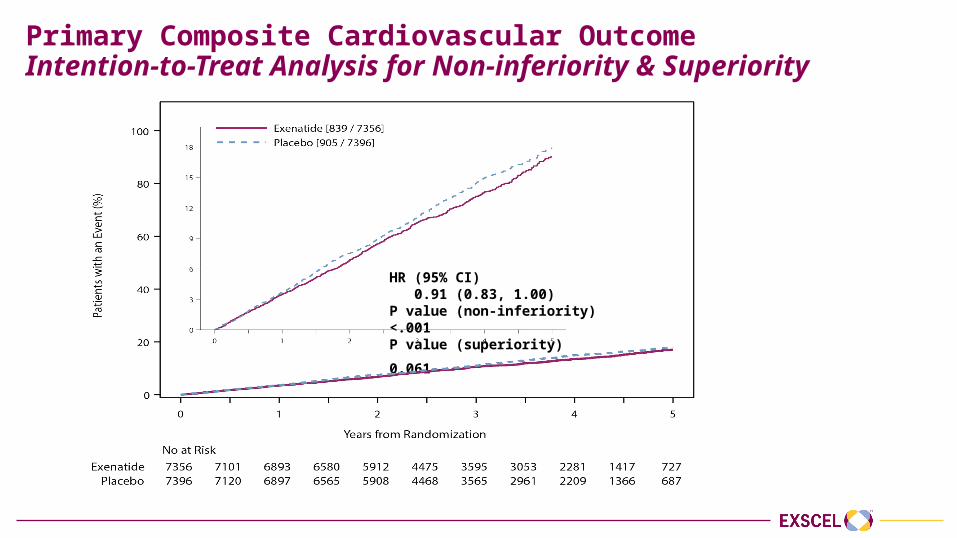
Primary Composite Cardiovascular OutcomeIntention-to-Treat Analysis for Non-inferiority & Superiority
HR (95% CI) 0.91 (0.83, 1.00)P value (non-inferiority) <.001P value (superiority) 0.061
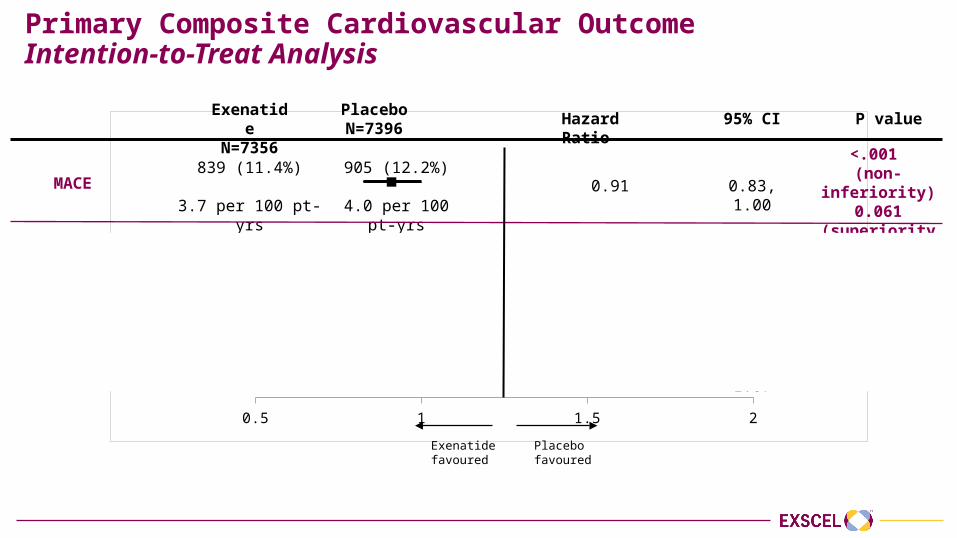
Primary Composite Cardiovascular OutcomeIntention-to-Treat Analysis
0.5 1 1.5 2
Exenatide favoured
Placebo favoured
MACE
CV-death
Non-fatal MI
Non-fatal stroke
ExenatideN=7356
PlaceboN=7396
229 (3.1%)
258 (3.5%)
455 (6.2%)
470 (6.4%)
155 (2.1%)
177 (2.4%)
839 (11.4%)
3.7 per 100 pt-yrs
905 (12.2%)
4.0 per 100 pt-yrs
Hazard Ratio 95% CI P value
0.91
0.88
0.95
0.86
0.83, 1.00
0.73, 1.05
0.84, 1.09
0.70, 1.07
<.001 (non-inferiority)
0.061(superiority)
0.628 (homogeneity
among components)
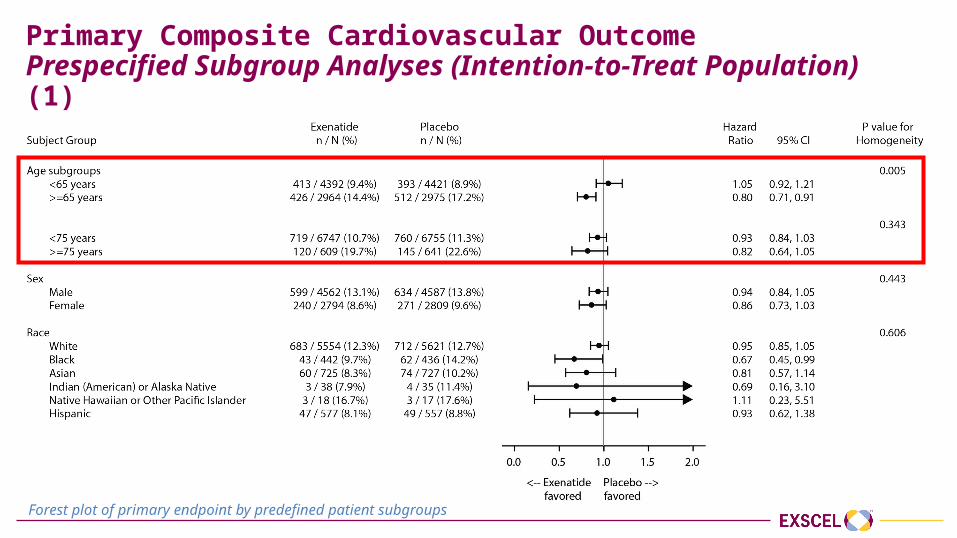
Primary Composite Cardiovascular OutcomePrespecified Subgroup Analyses (Intention-to-Treat Population) (1)
Forest plot of primary endpoint by predefined patient subgroups
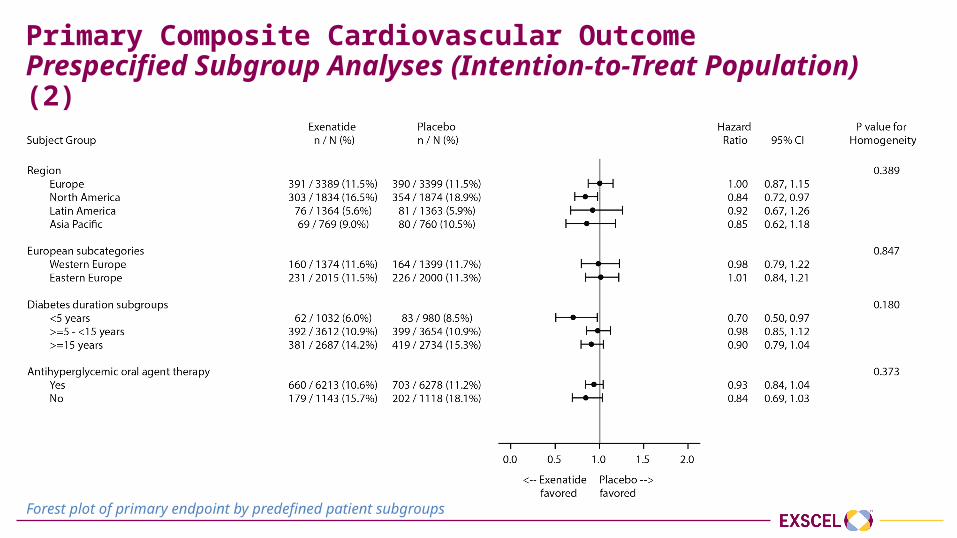
Primary Composite Cardiovascular OutcomePrespecified Subgroup Analyses (Intention-to-Treat Population) (2)
Forest plot of primary endpoint by predefined patient subgroups
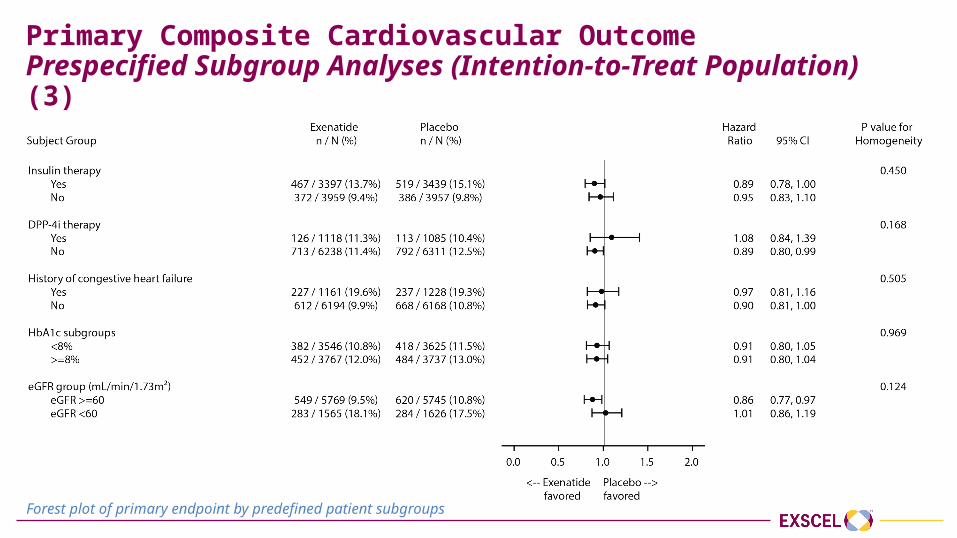
Primary Composite Cardiovascular OutcomePrespecified Subgroup Analyses (Intention-to-Treat Population) (3)
Forest plot of primary endpoint by predefined patient subgroups
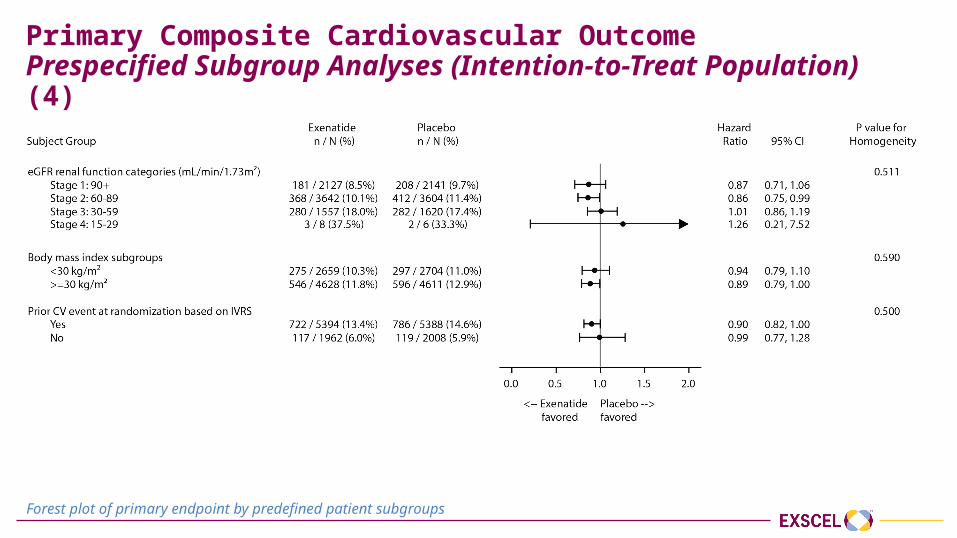
Primary Composite Cardiovascular OutcomePrespecified Subgroup Analyses (Intention-to-Treat Population) (4)
Forest plot of primary endpoint by predefined patient subgroups

Secondary Endpoints
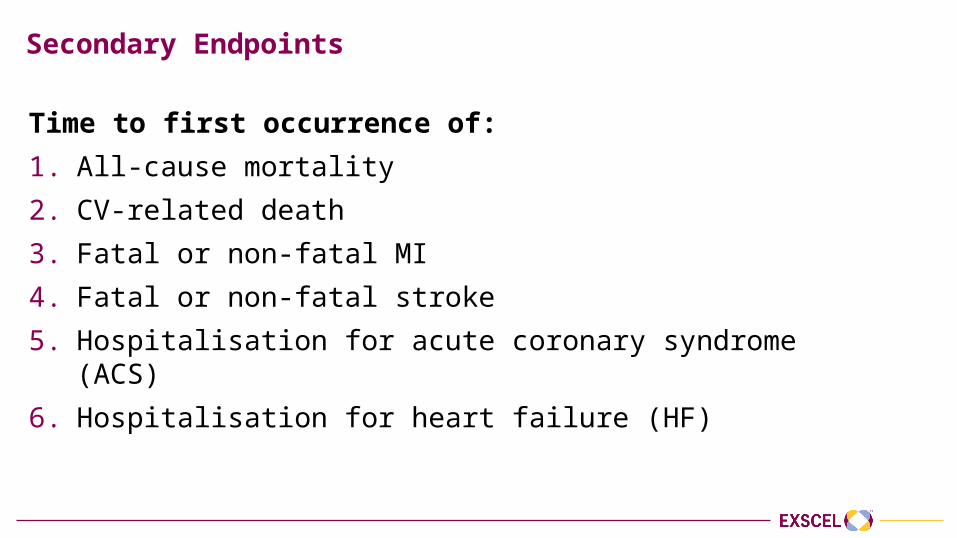
Secondary Endpoints
Time to first occurrence of:1. All-cause mortality2. CV-related death3. Fatal or non-fatal MI4. Fatal or non-fatal stroke5. Hospitalisation for acute coronary syndrome (ACS)6. Hospitalisation for heart failure (HF)
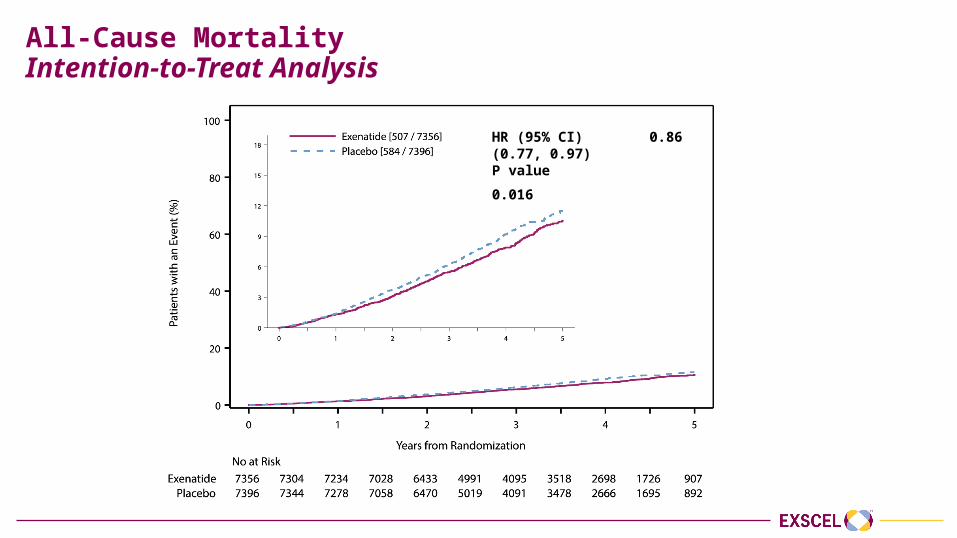
All-Cause MortalityIntention-to-Treat Analysis
HR (95% CI) 0.86 (0.77, 0.97)P value 0.016
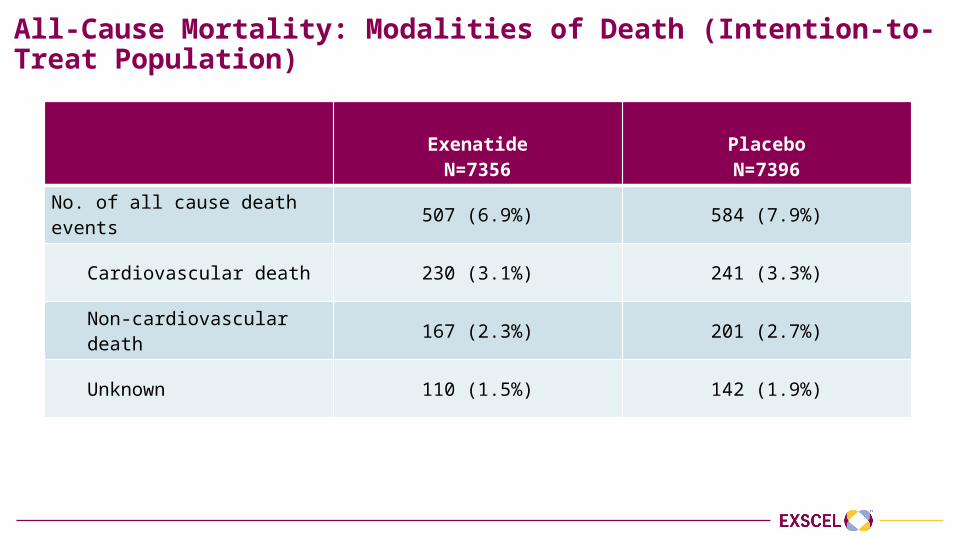
All-Cause Mortality: Modalities of Death (Intention-to-Treat Population)
ExenatideN=7356
PlaceboN=7396
No. of all cause death events 507 (6.9%) 584 (7.9%)
Cardiovascular death 230 (3.1%) 241 (3.3%)
Non-cardiovascular death 167 (2.3%) 201 (2.7%)
Unknown 110 (1.5%) 142 (1.9%)
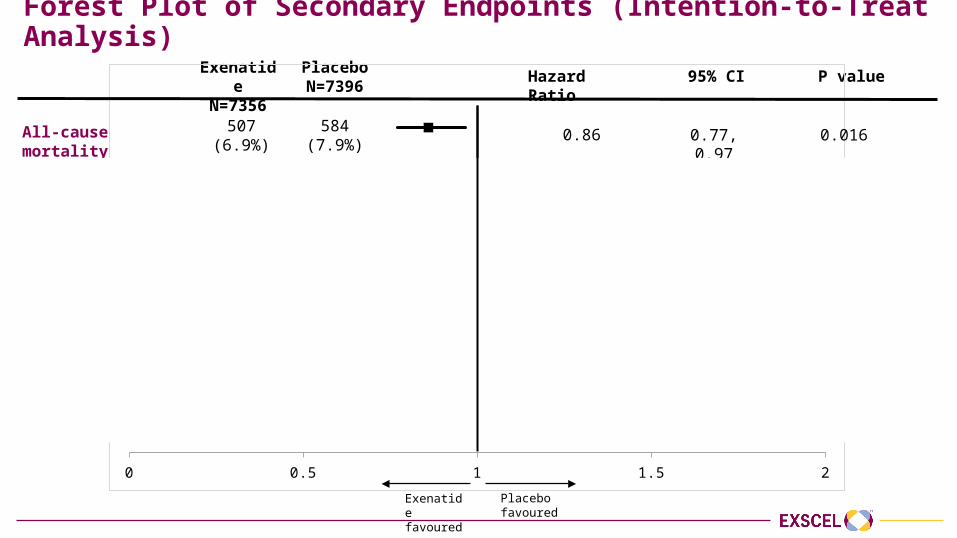
Forest Plot of Secondary Endpoints (Intention-to-Treat Analysis)Exenatide
N=7356PlaceboN=7396 Hazard Ratio 95% CI P value
0 0.5 1 1.5 2
All-cause mortality
CV-death
Fatal or non-fatal MI
Fatal or non-fatal stroke
Hospitalisation for ACS
Hospitalisation for heart failure
507(6.9%)
584(7.9%)
340(4.6%)
383(5.2%)
483(6.6%)
493(6.7%)
187(2.5%)
218(2.9%)
602(8.2%)
570(7.7%)
219(3.0%)
231(3.1%)
0.86
0.88
0.97
0.85
1.05
0.94
0.77, 0.97
0.76, 1.02
0.85, 1.10
0.70, 1.03
0.94, 1.18
0.78, 1.13
Exenatide favoured
Placebo favoured
0.016
0.096
0.622
0.095
0.402
0.485
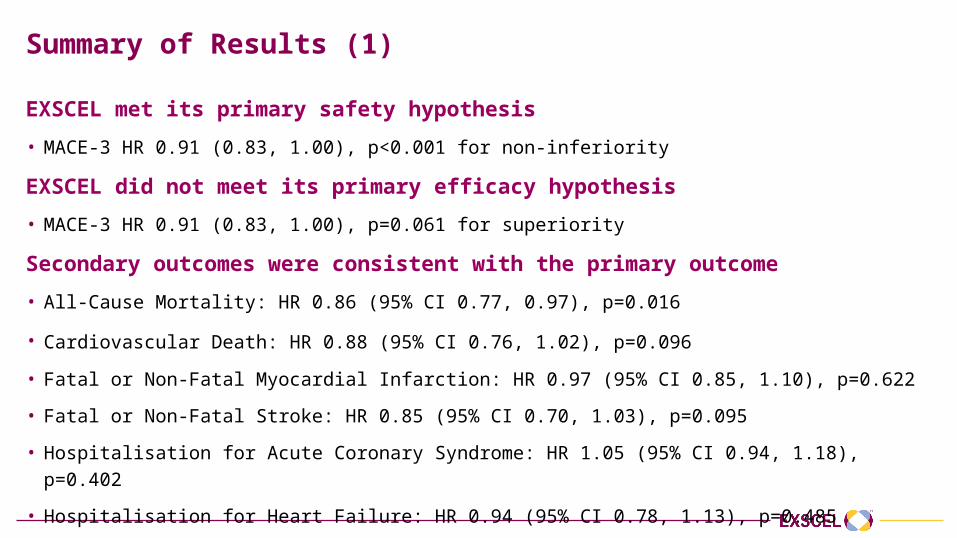
Summary of Results (1)
EXSCEL met its primary safety hypothesis • MACE-3 HR 0.91 (0.83, 1.00), p<0.001 for non-inferiority
EXSCEL did not meet its primary efficacy hypothesis • MACE-3 HR 0.91 (0.83, 1.00), p=0.061 for superiority
Secondary outcomes were consistent with the primary outcome• All-Cause Mortality: HR 0.86 (95% CI 0.77, 0.97), p=0.016
• Cardiovascular Death: HR 0.88 (95% CI 0.76, 1.02), p=0.096
• Fatal or Non-Fatal Myocardial Infarction: HR 0.97 (95% CI 0.85, 1.10), p=0.622
• Fatal or Non-Fatal Stroke: HR 0.85 (95% CI 0.70, 1.03), p=0.095
• Hospitalisation for Acute Coronary Syndrome: HR 1.05 (95% CI 0.94, 1.18), p=0.402
• Hospitalisation for Heart Failure: HR 0.94 (95% CI 0.78, 1.13), p=0.485
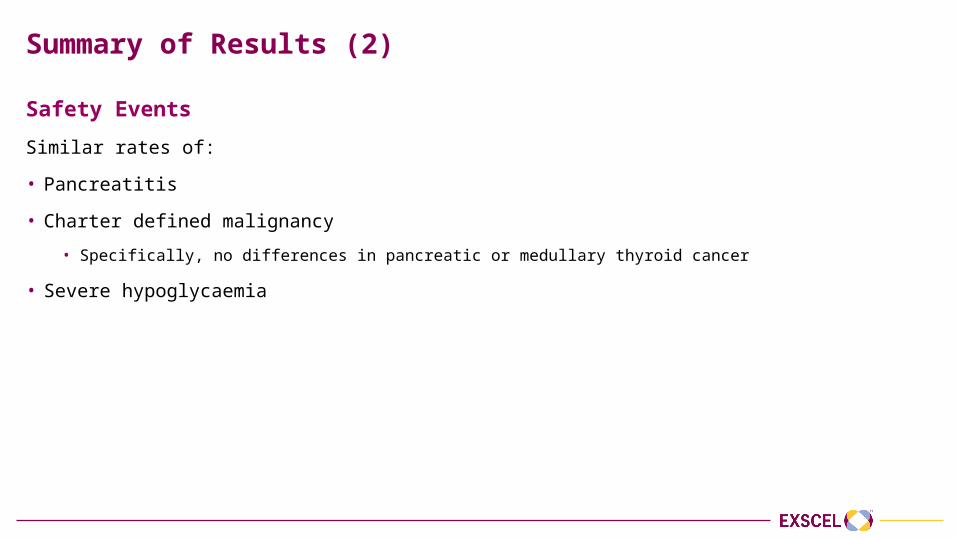
Summary of Results (2)
Safety EventsSimilar rates of:
• Pancreatitis
• Charter defined malignancy
• Specifically, no differences in pancreatic or medullary thyroid cancer
• Severe hypoglycaemia

Acknowledgements and Thanks
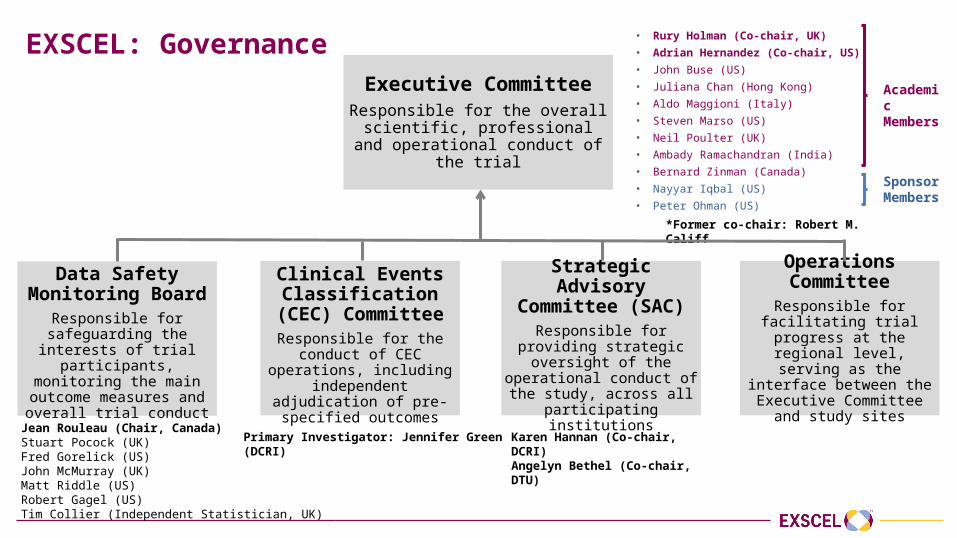
EXSCEL: GovernanceExecutive Committee
Responsible for the overall scientific, professional and operational conduct
of the trial
Data Safety Monitoring Board
Responsible for safeguarding the interests of trial
participants, monitoring the main outcome measures and
overall trial conduct
Clinical Events Classification (CEC)
CommitteeResponsible for the conduct of CEC operations, including independent adjudication of
pre-specified outcomes
Operations Committee
Responsible for facilitating trial progress at the regional
level, serving as the interface between the Executive
Committee and study sites
Jean Rouleau (Chair, Canada)Stuart Pocock (UK)Fred Gorelick (US)John McMurray (UK)Matt Riddle (US)Robert Gagel (US)Tim Collier (Independent Statistician, UK)
Primary Investigator: Jennifer Green (DCRI)
• Rury Holman (Co-chair, UK)• Adrian Hernandez (Co-chair, US) • John Buse (US)• Juliana Chan (Hong Kong)• Aldo Maggioni (Italy)• Steven Marso (US)• Neil Poulter (UK)• Ambady Ramachandran (India) • Bernard Zinman (Canada)• Nayyar Iqbal (US)• Peter Ohman (US)
Academic Members
Sponsor Members
*Former co-chair: Robert M. Califf
Strategic Advisory Committee (SAC)
Responsible for providing strategic oversight of the
operational conduct of the study, across all participating
institutions
Karen Hannan (Co-chair, DCRI)Angelyn Bethel (Co-chair, DTU)
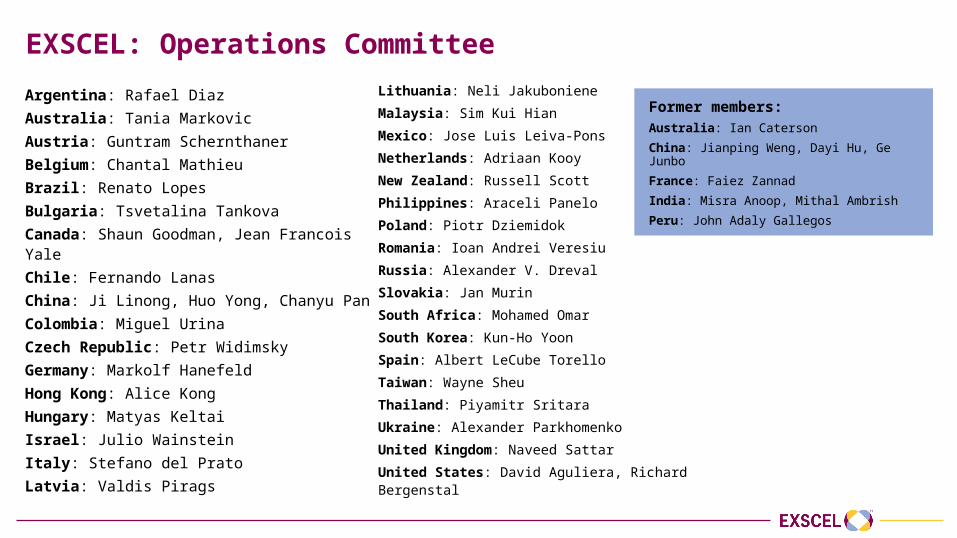
EXSCEL: Operations CommitteeArgentina: Rafael Diaz Australia: Tania MarkovicAustria: Guntram SchernthanerBelgium: Chantal MathieuBrazil: Renato LopesBulgaria: Tsvetalina TankovaCanada: Shaun Goodman, Jean Francois YaleChile: Fernando LanasChina: Ji Linong, Huo Yong, Chanyu Pan Colombia: Miguel UrinaCzech Republic: Petr WidimskyGermany: Markolf HanefeldHong Kong: Alice KongHungary: Matyas KeltaiIsrael: Julio WainsteinItaly: Stefano del PratoLatvia: Valdis Pirags
Lithuania: Neli Jakuboniene
Malaysia: Sim Kui Hian
Mexico: Jose Luis Leiva-Pons
Netherlands: Adriaan Kooy
New Zealand: Russell Scott
Philippines: Araceli Panelo
Poland: Piotr Dziemidok
Romania: Ioan Andrei Veresiu
Russia: Alexander V. Dreval
Slovakia: Jan Murin
South Africa: Mohamed Omar
South Korea: Kun-Ho Yoon
Spain: Albert LeCube Torello
Taiwan: Wayne Sheu
Thailand: Piyamitr Sritara
Ukraine: Alexander Parkhomenko
United Kingdom: Naveed Sattar
United States: David Aguliera, Richard Bergenstal
Former members:Australia: Ian CatersonChina: Jianping Weng, Dayi Hu, Ge Junbo
France: Faiez Zannad
India: Misra Anoop, Mithal Ambrish
Peru: John Adaly Gallegos
Participants and Sites
• We thank the participants, without whom this study and these analyses would not have been possible
• We also thank the many investigators from 687 sites in 35 countries who worked diligently to help ensure EXSCEL was run to the highest possible standards

Partners
We thank the following academic partners and contract research organisations for their assistance:
• Canadian VIGOUR Centre
• PAREXEL International
Results online at www.nejm.org
DOI: 10.1056/NEJMoa1612917
Slides available at:
www.dtu.ox.ac.uk/EXSCEL