Embed Size (px)
Citation preview

Analysis
EMBARGOED: NOT FOR NEWSWIRE TRANSMISSION, POSTING ON WEBSITES, OR ANY OTHER MEDIA USE UNTIL JANUARY 26, 2016, 10:00AM EST (1500 GMT) EMBARGOED: NOT FOR NEWSWIRE TRANSMISSION, POSTING ON WEBSITES, OR ANY OTHER MEDIA USE UNTIL JANUARY 26, 2016, 10:00AM EST (1500 GMT)
Resource development in an era of cheap commodities
Commodity Markets Outlook
A World Bank Quarterly Report
Q4Q3Q2Q1
APRIL 2016
http://www.worldbank.org/commodities


A World Bank Quarterly Report
APRIL 2016
Commodity Markets Outlook

© 2016 International Bank for Reconstruction and Development / The World Bank
1818 H Street NW, Washington, DC 20433
Telephone: 202-473-1000; Internet: www.worldbank.org
Some rights reserved
This work is a product of the staff of The World Bank with external contributions. The findings, interpretations, and conclusions expressed in this work do not necessarily reflect the views of The World Bank, its Board of Executive Directors, or the governments they represent. The maps were produced by the Map Design Unit of The World Bank. The World Bank does not guarantee the accuracy of the data included in this work. The boundaries, colors, denominations, and other information shown on these maps do not imply, on the part of The World Bank Group, any judgment on the legal status of any territory, or any endorsement or acceptance of such boundaries.
Nothing herein shall constitute or be considered to be a limitation upon or waiver of the privileges and immunities of The World Bank, all of which are specifically reserved.
Rights and Permissions
Attribution—Please cite the work as follows: World Bank Group. 2016. Commodity Markets Outlook, April. World Bank, Washington, DC. License: Creative Commons Attribution CC BY 3.0 IGO
Translations—If you create a translation of this work, please add the following disclaimer along with the attribution: This translation was not created by The World Bank and should not be considered an official World Bank translation. The World Bank shall not be liable for any content or error in this translation.
Adaptations—If you create an adaptation of this work, please add the following disclaimer along with the attribution: This is an adaptation of an original work by The World Bank. Views and opinions expressed in the adaptation are the sole responsibility of the author or authors of the adaptation and are not endorsed by The World Bank.
Third-party content—The World Bank does not necessarily own each component of the content contained within the work. The World Bank therefore does not warrant that the use of any third-party-owned individual component or part contained in the work will not infringe on the rights of those third parties. The risk of claims resulting from such infringement rests solely with you. If you wish to re-use a component of the work, it is your responsibility to determine whether permission is needed for that re-use and to obtain permission from the copyright owner. Examples of components can include, but are not limited to, tables, figures, or images.
All queries on rights and licenses should be addressed to the Publishing and Knowledge Division, The World Bank, 1818 H Street NW, Washington, DC 20433, USA; fax: 202-522-2625; e-mail: [email protected].
The cutoff date for the data used in this report was April 22, 2016.

ContentsAcknowledgments . . . . . . . . . . . . . . . . . . . . . . . . . . . . . . . . . . . . . . . . . . . . . . . . . . . . . . . . . . . . . . . . . . . . . .7
Executive summary . . . . . . . . . . . . . . . . . . . . . . . . . . . . . . . . . . . . . . . . . . . . . . . . . . . . . . . . . . . . . . . . . . . . .9
Special Focus: Resource development in an era of rising vulnerabilities and low commodity prices . . . . . . . . . . . .11
Commodity Market Developments and Outlook
Energy . . . . . . . . . . . . . . . . . . . . . . . . . . . . . . . . . . . . . . . . . . . . . . . . . . . . . . . . . . . . . . . . . . . .23
Agriculture . . . . . . . . . . . . . . . . . . . . . . . . . . . . . . . . . . . . . . . . . . . . . . . . . . . . . . . . . . . . . . . . .27
Fertilizers . . . . . . . . . . . . . . . . . . . . . . . . . . . . . . . . . . . . . . . . . . . . . . . . . . . . . . . . . . . . . . . . . .31
Metals and minerals . . . . . . . . . . . . . . . . . . . . . . . . . . . . . . . . . . . . . . . . . . . . . . . . . . . . . . . . . .32
Precious metals . . . . . . . . . . . . . . . . . . . . . . . . . . . . . . . . . . . . . . . . . . . . . . . . . . . . . . . . . . . . . .34
Appendix A: Historical commodity prices and price forecasts . . . . . . . . . . . . . . . . . . . . . . . . . . . . . . . . . . . .35
Appendix B: Commodity balances . . . . . . . . . . . . . . . . . . . . . . . . . . . . . . . . . . . . . . . . . . . . . . . . . . . . . . . .43
Appendix C: Description of price series . . . . . . . . . . . . . . . . . . . . . . . . . . . . . . . . . . . . . . . . . . . . . . . . . . . . .71
Figures
1 Commodity price indexes . . . . . . . . . . . . . . . . . . . . . . . . . . . . . . . . . . . . . . . . . . . . . . . . . . . . . . . . .9
2 Crude oil price for 2016 . . . . . . . . . . . . . . . . . . . . . . . . . . . . . . . . . . . . . . . . . . . . . . . . . . . . . . . . . .9
F1 Global metal and hydrocarbon production (change from 2000 to 2014). . . . . . . . . . . . . . . . . . . . .13
F2 Global investment spending on exploration and production . . . . . . . . . . . . . . . . . . . . . . . . . . . . . .13
F3 Mining exploration spending and discoveries during 2003-12 . . . . . . . . . . . . . . . . . . . . . . . . . . . .14
F4 Giant oil and gas discoveries during 2000-09 . . . . . . . . . . . . . . . . . . . . . . . . . . . . . . . . . . . . . . . . .14
F5 Number of years from discovery to production for gold and copper . . . . . . . . . . . . . . . . . . . . . . . .15
F6 Rig counts in Africa and Latin America . . . . . . . . . . . . . . . . . . . . . . . . . . . . . . . . . . . . . . . . . . . . . .15
F7 Distribution of discovery-to-production time . . . . . . . . . . . . . . . . . . . . . . . . . . . . . . . . . . . . . . . . .16
F8 Reductions in lead times for copper mines under two scenarios . . . . . . . . . . . . . . . . . . . . . . . . . . .16
3 Crude oil prices . . . . . . . . . . . . . . . . . . . . . . . . . . . . . . . . . . . . . . . . . . . . . . . . . . . . . . . . . . . . . . . .23
4 World oil demand growth . . . . . . . . . . . . . . . . . . . . . . . . . . . . . . . . . . . . . . . . . . . . . . . . . . . . . . . .23
5 U.S. crude oil production . . . . . . . . . . . . . . . . . . . . . . . . . . . . . . . . . . . . . . . . . . . . . . . . . . . . . . . .24
6 U.S. oil rig count and oil prices . . . . . . . . . . . . . . . . . . . . . . . . . . . . . . . . . . . . . . . . . . . . . . . . . . . .24
7 OPEC crude oil production . . . . . . . . . . . . . . . . . . . . . . . . . . . . . . . . . . . . . . . . . . . . . . . . . . . . . .25
8 OECD crude oil stocks . . . . . . . . . . . . . . . . . . . . . . . . . . . . . . . . . . . . . . . . . . . . . . . . . . . . . . . . . .25
9 Coal consumption. . . . . . . . . . . . . . . . . . . . . . . . . . . . . . . . . . . . . . . . . . . . . . . . . . . . . . . . . . . . . .26
10 Coal and natural gas prices . . . . . . . . . . . . . . . . . . . . . . . . . . . . . . . . . . . . . . . . . . . . . . . . . . . . . . .26
11 Agriculture price indexes . . . . . . . . . . . . . . . . . . . . . . . . . . . . . . . . . . . . . . . . . . . . . . . . . . . . . . . . .27

12 Changes in nominal commodity price indexes . . . . . . . . . . . . . . . . . . . . . . . . . . . . . . . . . . . . . . . .27
13 Global grain production and consumption . . . . . . . . . . . . . . . . . . . . . . . . . . . . . . . . . . . . . . . . . . .28
14 Global production of key edible oils . . . . . . . . . . . . . . . . . . . . . . . . . . . . . . . . . . . . . . . . . . . . . . . .28
15 Energy intensities, cost of energy component in 2007 . . . . . . . . . . . . . . . . . . . . . . . . . . . . . . . . . . .29
16 China's stocks of key commodities . . . . . . . . . . . . . . . . . . . . . . . . . . . . . . . . . . . . . . . . . . . . . . . . .29
17 Coffee prices . . . . . . . . . . . . . . . . . . . . . . . . . . . . . . . . . . . . . . . . . . . . . . . . . . . . . . . . . . . . . . . . . .30
18 Cotton stocks . . . . . . . . . . . . . . . . . . . . . . . . . . . . . . . . . . . . . . . . . . . . . . . . . . . . . . . . . . . . . . . . .30
19 Fertilizer prices . . . . . . . . . . . . . . . . . . . . . . . . . . . . . . . . . . . . . . . . . . . . . . . . . . . . . . . . . . . . . . . .31
20 Global nutrient consumption . . . . . . . . . . . . . . . . . . . . . . . . . . . . . . . . . . . . . . . . . . . . . . . . . . . . .31
21 Metal and mineral prices . . . . . . . . . . . . . . . . . . . . . . . . . . . . . . . . . . . . . . . . . . . . . . . . . . . . . . . . .32
22 World refined metal consumption . . . . . . . . . . . . . . . . . . . . . . . . . . . . . . . . . . . . . . . . . . . . . . . . . .32
23 World metal consumption growth . . . . . . . . . . . . . . . . . . . . . . . . . . . . . . . . . . . . . . . . . . . . . . . . . .33
24 Zinc price and LME stocks . . . . . . . . . . . . . . . . . . . . . . . . . . . . . . . . . . . . . . . . . . . . . . . . . . . . . . .33
25 Precious metal prices . . . . . . . . . . . . . . . . . . . . . . . . . . . . . . . . . . . . . . . . . . . . . . . . . . . . . . . . . . . .34
26 Global gold production . . . . . . . . . . . . . . . . . . . . . . . . . . . . . . . . . . . . . . . . . . . . . . . . . . . . . . . . . .34
Tables
1 Nominal price indexes (actual and forecasts) and forecast revisions . . . . . . . . . . . . . . . . . . . . . . . . .10
Annex Global metal, ore and hydrocarbon production . . . . . . . . . . . . . . . . . . . . . . . . . . . . . . . . . . . . . . . .17
AcknowledgmentscommodItY mARkets oUtlook | ApRIl 2016 7
AcknowledgmentsThis World Bank Group Report is a product of the Prospects Group in the Development Economics Vice Presidency. The report was managed by John Baffes under the general guidance of Ayhan Kose and Franziska Ohnsorge.
The World Bank’s Commodity Markets Outlook is published quarterly, in January, April, July, and October. The report provides detailed market analysis for major commodity groups, including energy, agriculture, fertilizers, metals, and precious metals. A Special Focus section examines current topics and issues in commodity markets. Price forecasts to 2025 for 46 commodities are presented, together with historical price data. The report also contains production, consumption, and trade balances for major commodities. Commodity price data updates are published separately at the beginning of each month.The report and data can be accessed at: www.worldbank.org/commoditiesFor inquiries and correspondence, email at: [email protected]
Many people contributed to the report. John Baffes authored the section on agriculture. Shane Streifel authored the sections on energy, fertilizers, metals, and precious metals. Christian Eigen-Zucchi was the principal contributor of the Special Focus section on the implications of on resource development in an era of low commodity prices. Xinghao Gong managed the price database and assisted with the Annex tables. The design and production of the report was managed by Maria Hazel Macadangdang and Adriana Maximiliano. Vandana Chandra, Graeme Littler, Boaz Nandwa, Yirbehogre Modeste Some, Dana Vorisek, and Lou Wells provided extensive editorial comments. David Rosenblatt reviewed the report. Mark Felsenthal, Phillip Jeremy Hay, and Mikael Reventar managed the media relations and dissemination. The accompanying website was produced by Graeme Littler.


EXECUTIVE SUMMARYCOMMODITY MARKETS OUTLOOK | ApRIL 2016 9
Trends. Energy prices fell 21 percent in the first quar-ter of 2016 (Figure 1). Oil prices led the decline by dropping 22 percent owing to resilient non-OPEC oil production, expanding supplies from Iran, and weak seasonal demand. Natural gas and coal prices are down 15 and 3 percent, respectively, due to oversup-ply. Oil prices rose from $25/bbl in mid-January to more than $40/bbl in mid-April due a number of sup-ply issues, notably outages in Iraq and Nigeria. In ad-dition, oil production in the U.S. fell in December, the first year-on-year drop in several years, and there are indications that output declines may accelerate during 2016. A proposal by key OPEC and non-OPEC producers to freeze production at January lev-els failed to materialize at the Doha meeting on April 17.
Non-energy commodity prices fell 2 percent in the first quarter on persistently large inventories and am-ple supplies. Metal prices declined on weakening growth prospects in China and increasing supplies.
Executive Summary
Cost reductions, largely stemming from lower energy prices, have delayed closures of higher-cost mines. On early indications of favorable harvests in major pro-ducers, agricultural commodity prices fell 1 percent, marking the eighth consecutive quarterly decline, though prices of some agricultural commodities re-versed the downward trend in March/April. El Niño-related problems reduced production of a few com-modities (for example, rice and palm oil), but the reductions were not large enough to materially affect the agricultural price index. Fertilizer prices fell 12 percent amid surplus production capacity and slower seasonal demand. Precious metals prices rose 6 per-cent in the quarter (the only index with a sizeable in-crease), on stronger investment demand amid grow-ing concerns about global growth prospects.
Outlook and risks. All main commodity price in-dexes are expected to decline in 2016 due to persis-tently abundant supplies and, in the case of industrial commodities, weak growth prospects in emerging
Most commodity price indexes rebounded in February-March from their January lows on improved market sentiment and a weakening dollar. Still, average prices for the first quarter fell compared to the last quarter of 2015, with energy prices down 21 percent and non-energy prices lower by 2 percent. Given the recent rebound in oil prices and expected supply tightening in the second half of the year, the crude oil price forecast for 2016 has been raised to $41 per barrel (bbl), up from $37/bbl in the January assessment (and represents a drop of 19 percent from 2015.) Metals prices are projected to decline 8 percent, a slightly smaller drop than anticipated in January due to supply reductions. Agricul-tural prices have been revised marginally lower on signs of adequate harvests in major producers, and are expected to register a decline of 4 percent from last year. Looking to 2017, a modest price recovery is projected for most commodities as demand strengthens. Crude oil is projected to rise to $50/bbl as the market moves into balance. This issue of the Commodity Markets Outlook examines the implications of resource development in an era of lower commodity prices and concludes that ambitious improvements in governance and sounder macroeconomic policies are required to miti-gate delays and risks.
Source: World Bank.Note: Last observation is March 2016.
Source: World Bank, Consensus Forecast, Bloomberg.Notes: World Bank forecast, average of Brent, WTI, Dubai. Average Brent futures closing for the week of April 18, including actuals to date. Consensus median and range for Brent as of April 22. Historical average represents the 12-month recovery (median and range) since the lows of 07/86, 12/98, and 12/08 applied to 01/16 average of $29.78/bbl.
FIGURE 1 Commodity price indexes FIGURE 2 Crude oil price for 2016
41.00 41.17 39.55
57.95
20
30
40
50
60
70
World Bankforecast
BrentFutures
Consensus Historicalaverage
US$/bbl
30
50
70
90
110
130
150
Jan-11 Jan-12 Jan-13 Jan-14 Jan-15 Jan-16
US$ indexes, 2010=100
Metals
Agriculture
Energy

EXECUTIVE SUMMARY COMMODITY MARKETS OUTLOOK | ApRIL 2016 10
market and developing economies (EMDE). Energy prices are expected to fall 19 percent, with average oil prices projected at $41/bbl in 2016 (compared with $37/bbl in the January 2016 Commodity Markets Out-look). This implies marginally higher prices for the rest of the year as the oversupply in the oil market di-minishes. The rebound in oil prices from the January lows will be weaker than previous recoveries (Figure 2). Downside risks to the energy price forecast include higher-than-expected output from OPEC producers and weaker global growth. On the other hand, higher oil prices could result because of supply disruptions among key OPEC producers, stronger-than-expected demand, or an agreement by major oil producers to curtail supplies.
Non-energy prices are expected to fall 5 percent in 2016, 1 percentage point lower than the January 2016 Commodity Markets Outlook forecast (Table 1). Metals prices are projected to decline 8 percent following last year’s 21 percent drop, due to weak demand prospects and new capacity coming on line. Downside price risks include a further slowdown in China, larger-than-expected production, and depreciation of cur-rencies of key suppliers.
Agricultural prices have been revised lower, and are projected to decline 4 percent in 2016 with prices fall-ing in most commodity groups. This agricultural price outlook reflects adequate supplies in anticipa-tion of another favorable crop year for most grain and oilseed commodities. Agricultural commodity mar-kets are also aided by lower energy costs and plateau-ing demand for biofuels. The largest price drop is for
grains and beverages (-5 percent each) and oils and meals (-3 percent). Other food items and agricultural raw material prices are expected to fall as well. Upside risks to agricultural price forecasts include the likely development of La Niña (unusually cold weather in the equatorial Eastern Central Pacific Ocean). Its overall impact on commodity markets—if it material-izes—will be less than the impact of El Niño. Down-side risks reflect policies favoring support to agricul-tural commodity producers. Fertilizer prices could retreat as much as 13 percent in 2016 due to surplus capacity and weak demand. Precious metal prices are projected to fall 2 percent.
Special Focus on resource development in an era of low commodity prices. During the commodities su-per cycle that began in the early 2000s, many re-source-rich countries benefitted from surging explora-tion, investment, and production activities, which transformed growth prospects. In 2016, with oil and metals prices 50-70 percent below their early-2011 peaks, these patterns have been reversed, adversely af-fecting many commodity-exporting countries. Project development has already been put on hold or delayed in several emerging and developing countries. It would take ambitious governance improvements in EMDEs (e.g., to the levels prevailing in advanced markets) to mitigate the delays in ongoing develop-ment of large mines resulting from falling metals prices (up to four years for some of the largest mines in EMDEs). Governments seeking to newly develop natural resources may consider delaying new initia-tives until the price outlook turns more favorable.
TABLE 1 Nominal price indexes (actual and forecasts) and forecast revisions
Price Indexes (2010=100) Change (%) Revision2
2012 2013 2014 2015 2016F1 2017F1 2015-16 2016-17 2016F 2017F
Energy 128 127 118 65 52 63 -19.3 20.0 3.5 1.3
Non-Energy3 110 102 97 82 78 80 -5.1 2.3 -1.1 -1.0
Agriculture 114 106 103 89 86 88 -3.5 1.8 -1.9 -1.7
Beverages 93 83 102 94 89 89 -4.6 -0.5 -3.5 -3.1
Food 124 116 107 91 88 90 -3.4 2.1 -1.5 -1.4
Oils and meals 126 116 109 85 82 85 -3.4 3.0 -1.1 -1.0
Grains 141 128 104 89 84 86 -5.3 2.8 -1.6 -1.5
Other food 107 104 108 100 98 99 -1.9 0.5 -2.0 -1.8
Raw Materials 101 95 92 83 81 83 -2.9 2.4 -2.0 -1.8
Fertilizers 138 114 100 95 83 84 -13.2 1.4 -8.9 -8.0
Metals and minerals 96 91 85 67 61 64 -8.2 3.7 1.4 1.1
Precious Metals3 138 115 101 91 89 88 -1.7 -1.0 5.7 5.0
Memorandum items
Crude oil ($/bbl) 105 104 96 51 41 50 -19.2 21.9 4.0 2.0
Gold ($/toz) 1,670 1,411 1,266 1,161 1,150 1,132 -0.9 -1.5 75.0 65.9
Source: World Bank.Notes: (1) “F” denotes forecasts. (2) “Revision” denotes change to the forecast from the January 2016 report (expressed in percentage points for the price indexes, $/bbl for crude oil, and $/toz for gold). (3) The non-energy price index excludes precious metals. See Appendix C for definitions of price and indexes.

SPECIAL FOCUS:
Resource development in an era of cheap commodities


COMMODITY MARKETS OUTLOOK | ApRIL 2016 13SPECIAL FOCUS
Resource development in an era of cheap commodities1
Introduction
The post-2000 commodity price increases, in part a reflection of demand growing faster than supply and concerns about the security of supply, set in motion a boom in commodities exploration, investment, and production, especially in mining and hydrocarbons (Figure F1). Less is known about the scale of invest-ment that flowed into agriculture, but private sector investment in farmland in Africa increased signifi-cantly (FAO 2012).2
With oil and metals price declines of 50-70 percent between 2011 and early 2016, many resource devel-opment projects have been delayed or put on hold. Lead times—the time it takes from resource discovery to production—are a critical issue in many countries as these periods are associated with heightened macro-economic vulnerabilities. This raises concerns about the ability of commodity-exporting emerging market and developing economies (EMDEs) to withstand shocks in the global economy.
This Special Focus addresses the following three ques-tion: (1) How did resource development evolve through the post-2000 price super-cycle? (2) What are the main drivers of resource development? (3) What are the implications of the decline in metal prices for resource development?
How did resource development evolve through the post-2000 price super-cycle?Exploration. Between 2000 and 2012, investment spending by global oil, gas, and base-metal mining companies rose five-fold (Figure F2), especially in Latin American and the Caribbean, and Sub-Saharan Africa. Including investment in other mined prod-ucts, global investment in 2011–12 amounted to over $1 trillion; in Africa, mining investment alone amounted to $100 billion in 2011 (or 15 percent of global mining investment) and was a key driver of growth (ICMM 2012).
During the commodities super cycle that began in the early 2000s, many resource-rich countries benefitted from surging exploration, investment, and production activities, which transformed growth prospects. In 2016, with oil and metals prices 50-70 percent below their early-2011 peaks, these patterns have been reversed, adversely affecting many com-modity-exporting countries. Project development has already been put on hold or delayed in several Emerging Markets and Developing Economies (EMDEs). It would take ambitious governance improvements in EMDEs—for example, to the levels prevailing in advanced markets—to mitigate the delays in ongoing development of large mines resulting from falling metals prices (up to four years for some of the largest mines in EMDEs). Governments seeking to develop natural resources may consider delaying new initiatives until the price outlook turns more favorable.
FIGURE F2 Global investment spending on exploration and production
Source: International Energy Agency, MinEx Consulting.Note: Last observation is 2012.
FIGURE F1 Global metal and hydrocarbon production (change from 2000 to 2014)
Source: BP Statistical Review, World Bureau of Metal Statistics.Notes: Detailed data are reported in the Annex Table. Blue and red bars refer to metals and energy commodities, respectively.
0 20 40 60 80 100
Oil
Copper
Gas
Tin
Zinc
Nickel
Coal
Lead
Bauxite
Percent0
100
200
300
400
500
600
0
20
40
60
80
100
120
140
1990 1994 1998 2002 2006 2010
Thou
sand
sCrude oil exploration & production spending (RHS)Base metal companies capital expenditures (LHS)
US$, billion US$, billion

COMMODITY MARKETS OUTLOOK | ApRIL 2016 14 SPECIAL FOCUS
depending mainly on the accessibility of the deposit. All steps depend on the quality of governance, the re-liability of institutions, and macroeconomic stability. Investment risks tend to be high in the exploration, pre-feasibility, and feasibility stages, and decline as a deposit gets closer to production.While resource development tends to have lengthy lead times, there are differences across commodities and regions:• Oil and gas. Conventional discoveries can take
30-40 years to develop (Clo 2000), but lead times for giant oil and gas discoveries can be shorter (Arezki, Ramey, and Sheng 2015). For oil depos-its, such as shale, the lead times are much shorter (2-3 years), a reflection of technological improve-ments and reduced entry barriers for small, agile firms (Wang and Xue 2014, World Bank 2015a).3 Monetizing discoveries in natural gas is harder than oil because the former require investment in transport infrastructure (in addition to drilling) as well as long-term contractual arrangements with end-users (Huurdeman 2014).
• Mining. The time to develop resources ranges from a few years to decades, depending on the type of mineral, the size and grade of the deposit, financing conditions, country factors, availability of key inputs like electricity, and commodity prices (UNECA 2011, Schodde 2014, World Bank 2015b). For example, resource develop-ment takes an average of ten years for gold but more than 15 years for base metals such as zinc, lead, copper, and nickel (Schodde 2014). Devel-opment of most gold deposits tends to begin im-mediately, whereas a significant share of copper discoveries takes several decades due to their
Discoveries. Several major discoveries transformed country prospects in Sub-Saharan Africa, and Latin America and the Caribbean (Figure F3). Since 2000, 120 “giant” oil and gas fields (fields with recoverable reserves of more than 500 million barrels of oil equiv-alent) have been discovered world-wide, with esti-mated “proved plus probable” reserves of almost 250 billion barrels of oil. The fields are located in seven clusters (Figure F4), two of which are in Africa, mostly offshore in East and West Africa. In Tanzania alone (which accounts for almost 7 percent of these reserves) there have been 13 giant oil and gas discoveries. Other major discoveries are in Kenya, Madagascar, Mozam-bique, and Uganda, as well as in six countries in West Africa and in the Gulf of Guinea. Another major frontier for giant oil and gas fields has emerged in the Krishna and Rakhine basins in the Bay of Bengal in South Asia (Bai and Xu 2014; Basu et al. 2010). Lead times from discovery to production. Bringing discoveries to actual production is a process that re-quires large upfront and sustained investment that varies across regions and time (Figure F5). Currently, there is high uncertainty about prices, as well as mac-roeconomic and policy environments (IMF 2012a). The process of developing most mines generally has five major stages. It begins with exploration to estab-lish the existence of a potentially commercially viable deposit. Once a deposit is confirmed, feasibility, envi-ronmental, and other impact studies are conducted, and financing plans are developed to establish com-mercial viability. Following confirmation of commer-cial viability, a mining license is obtained, which can take several years in some countries (on average, three years in Africa; Gajigo, Mutambatsere, and Ndiaye 2012). Finally, investments are made in constructing the physical facility, with the amount of time needed
FIGURE F3 Mining exploration spending and discoveries during 2003-12
FIGURE F4 Giant oil and gas discoveries during 2000-09
Source: MinEx Consulting.Note: “Rest of World” includes Middle East, South West Asia (including India and Pakistan) and Mongolia.
Source: Bai and Xu (2014).Note: “Giant” fields are those with recoverable reserves of more than 500 million barrels of oil equivalent.
0 5 10 15 20 25 30
Rest of the world
United States
Pacific/ Southeast Asia
Western Europe
Canada
Australia
Africa
Latin America
Percent of world total
Exploration spendingDiscoveries
0 5 10 15 20 25 30
Rakhine Basin (Bay of Bengal)
Gulf of Mexico
Offshore West Africa
Northwest Shelf of Australia
Central Asia
Offshore East Africa
Offshore Brazil
Middle East
Number of fields

COMMODITY MARKETS OUTLOOK | ApRIL 2016 15SPECIAL FOCUS
complexity and larger infrastructure investment to move ore to export ports (Figure F7).4 Loca-tion has a major impact on processing. For in-stance, it is less costly to ship concentrates from Chile’s copper mines due to their proximity to the sea, than, say, from Central Africa where, be-cause of infrastructure impediments, it is more profitable to smelt and refine the ore locally in order to reduce the volumes transported to ports (Crowson 2011).
What are the main drivers of resource development?
Surging resource exploration and development during the 2000s was driven by rising commodity prices (in part due to increasing scarcity and availability con-cerns), lower cost of capital, better technologies, and improved domestic policies and investment climates (Arbache and Page 2010). These factors varied by commodity and country over time, and remain im-portant determinants of resource development in gen-eral, and lead times in particular.
Commodity prices. Between 2000 and 2010, real en-ergy and metal prices doubled, real precious metal prices tripled, and real agricultural prices increased more than 60 percent. Surging prices stimulated a sharp increase in industry spending on exploration, investment, and production, including in many low-income countries and difficult-to-reach places.5 For example, mining exploration expenditures in Africa reached an estimated $4.5 billion in 2012, up from just $0.3 billion in 2000 (UNECA 2011, Schodde 2014). Conversely, lower commodity prices have a negative impact on resource development. For exam-
ple, the rig count in Africa and Latin America re-sponded quickly to rising oil prices, but also declined sharply following the oil price plunge (Figure F6).
Cost of capital. Global mining, oil, and gas produc-tion has been dominated by large transnational com-panies, but the structure of the industry has changed over the past decade. Smaller, younger companies have emerged as risk takers at the forefront of explora-tion, whereas larger developers and operators tended to enter projects only after the discovery of deposits (UNECA 2011; Gelb, Kaiser, and Vinuela 2012). Spending by junior companies is primarily driven by the availability of funding, facilitated by favorable global financing conditions in recent years (Schodde 2013). In addition, China has emerged as a major source of exploration and development finance in Af-rica, broadening choices for governments in the region.
Technologies. Technological innovations have allowed extraction in previously inaccessible or less-developed regions (including deepwater). The development of large shipping carriers has reduced the cost of trans-porting bulk commodities such as iron ore, coal, and bauxite (ICMM 2012, Lusty and Gunn 2015). As a result, the location of production and exploration has increasingly shifted towards frontier regions such as Africa and the Arctic (ICMM 2012). Mining explora-tion in Sub-Saharan Africa has been particularly at-tractive because it is seen as a relatively unexplored frontier with low cost (African discoveries are found closer to the surface than anywhere else except Latin America). Africa had the largest discoveries per dollar of exploration cost during 2003–12; it accounted for 22 percent of discoveries but only 15 percent of global exploration expenditures (Schodde 2013).
FIGURE F5 Number of years from discovery to production for gold and copper
Source: http://pumpkinhollowcopper.com/project-timeline/.Notes: Based on a sample of 46 countries with copper discoveries and 73 coun-tries with gold discoveries. Regions refer to World Bank classification. (*) indicates that data is not available for 2000s.
Source: Baker Hughes.Note: Last observation is April 15, 2016.
FIGURE F6 Rig counts in Africa and Latin America
180
230
280
330
380
430
480
20
40
60
80
100
120
140
160
2000 2002 2004 2006 2008 2010 2012 2014 2016
Number of rigs Number of rigs
Africa (LHS)
Latin America(RHS)
0 10 20 30 40
Latin Amercia and the Caribbean
High-income countries
East Asia and Pacific
Sub-Sarahan Africa
South Asia*
Europe and Central Asia
Middle East and North Africa*
Average 1950-70sAverage 1980-90sAverage 2000s
Number of years

COMMODITY MARKETS OUTLOOK | ApRIL 2016 16 SPECIAL FOCUS
Domestic conditions. The business environment for resource development has benefited from the modera-tion of conflict and internal political tensions (Cen-tral African Republic, Democratic Republic of Congo, Eritrea, Myanmar, and Rwanda) as well as strengthen-ing of investment climate (Eritrea, Myanmar, and Rwanda). Improved macroeconomic policies, includ-ing easing of fiscal deficits and debt burdens, have also aided resource developments (World Bank 2015a, IMF 2014a). Anecdotal evidence suggests that lead times for exploration, discovery, investment, and pro-duction are shorter in countries with more conducive policy environments.
What are the implications of the decline in commodities prices for resource development?In the same way that high prices spurred activity in the resources sector, the sharp decline in commodity prices over the past few years may delay resource de-velopment. Lower commodity prices reduce the ap-parent commercial feasibility of marginal projects, and could slow the start of development after discov-ery (Schodde 2014). Once started, however, sunk costs may make mining companies reluctant to dis-rupt ongoing projects, particularly if development is already well advanced (McIntosh 2015, Crowson 2011).6 In addition, other drivers like the accessibility and quality of the discovery, as well as the policy envi-ronment, play an important role. Larger discoveries that are closer to the surface and in more predictable policy environments appear to see faster development (World Bank 2015a).
A “duration analysis” has been developed to assess the relative importance of these drivers (Jenkins 2006, World Bank 2016). Based on a dataset of 273 copper discoveries in 46 countries and 687 gold discoveries in 73 countries during 1950-2015, the probability of a particular mine reaching production in any given year was examined.7 Explanatory variables include real gold and copper prices and two indicators of the pol-icy environment. A number of physical characteristics of the deposit were used as controls. The policy envi-ronment is proxied by the Worldwide Governance Indicators for Control of Corruption and by the Quality of Government Institute’s Index of the Qual-ity of Government. These proxies capture policy con-ditions that help avoid the “resource curse” – the mac-roeconomic volatility and stunted institutional development that often plague resource-based econo-mies (Sachs and Warner 2001; Mehlum, Moene, and Torvik 2002; Humphreys, Sachs, and Stiglitz 2007). Three key results emerge from the analysis.
• Commodity prices. The findings on the role of commodity prices are mixed depending on the commodity. An upswing in copper prices at the time of discovery – the crucial period when li-censes are obtained and exploration and extrac-tion rights are negotiated – is found to accelerate development. For example, for the average cop-per deposit discovered in EMDEs since 2000, ris-ing copper prices at the time of discovery may have shaved off more than a year from lead times. For an EMDE mine in the largest quartile, higher prices can reduce lead times by more than four years. Although mines in LICs tend to be smaller, high and rising prices reduced lead times for aver-
Source: http://pumpkinhollowcopper.com/project-timeline/.Note: Number of discoveries for each number of years.
FIGURE F7 Distribution of discovery-to-production time
FIGURE F8 Reductions in lead times for copper mines under two scenarios
Source: http://pumpkinhollowcopper.com/project-timeline/.Notes: The bars indicate a range of reduction in lead times. The governance sce-narios are: EMDE governance level reaches that of Canada, and LIC governance level reaches that of Chile.
0
5
10
15
20
25
30
35
5 10 15 20 25 30 35 40 45 50 55 60Number of years in lead time
Gold
Copper
Number of projects
-5
-4
-3
-2
-1
0
EMDEAverage
mine
EMDELargestmines
LICAverage
mine
LICLargestmines
EMDEAll
mines
LICAll
mines
Price downturn shifts to price upswing Governance levelimproves
Range in years

COMMODITY MARKETS OUTLOOK | ApRIL 2016 17SPECIAL FOCUS
age sized copper mines by a year, and for their largest mines by more than three years (Figure F8, left panel).
• Governance. If the average EMDE had the same readings on the Quality of Government Index or Control of Corruption Index as Canada (the world’s ninth largest copper producer), the lead times for the development of copper discoveries since 2000 might have been shortened by more than two years. Similarly, if the average low-in-come country had the same readings on these in-dexes as Chile (the world’s largest copper pro-ducer), the lead time of the average copper mine since 2000 might have been shortened by one to two years (Figure F8, right panel).
• Macroeconomic policies. Lowering government debt below 40 percent of GDP, or reducing infla-tion below 10 percent, is found to accelerate de-velopment times by about 10 percent. Indeed, a more stable macroeconomic environment is typi-cally associated with more predictable tax and expenditure decisions.
Extended lead times prolong the period of inflation, fiscal, and balance of payments vulnerabilities that are
often associated with resource development, as gov-ernments and private sectors borrow and invest in an-ticipation of future income growth. Such vulnerabili-ties are especially sizeable in small, low-income countries where resource development accounts for a sizeable share of economic activity. In countries where resource development is still in initial stages, further delays may contain vulnerabilities and reduce the long-term risk of stranded assets (Stevens, Lahn, and Kooroshy 2015).
ConclusionGiven that resource development, production, and revenue streams take place over decades, with substan-tial sunk costs along the way, longer term commodity price prospects are critical in deciding whether to de-velop a discovery into production. In 2016, the out-look for an era of low commodity prices had already set back many resource development projects. Ambi-tious improvements in business climates along with better and more predictable macroeconomic policies will be needed to offset these headwinds to resource development. Governments seeking to develop natu-ral resources may consider delaying new initiatives until the price outlook turns more favorable.
ANNEX TABLE Global metal, ore and hydrocarbon production Metals (million metric tons) Energy (mb/d equivalent)
Bauxite Copper Lead Nickel Tin Zinc Coal Gas Oil
2000
Africa 18.42 0.46 0.17 0.07 0.00 0.29 2.61 2.33 7.76
Asia 17.21 1.90 0.77 0.19 0.15 2.18 18.46 4.45 7.07
Europe 3.87 0.81 0.35 0.02 0.00 0.89 4.73 5.12 6.98
FSU 8.73 1.09 0.05 0.27 0.01 0.46 4.03 11.73 8.03
Latin America 36.17 5.70 0.45 0.16 0.06 1.67 0.79 2.51 10.11
Middle East 0.49 0.15 0.02 0.00 0.00 0.08 0.01 3.73 23.72
Oceania 53.80 1.04 0.68 0.30 0.01 1.42 3.38 0.56 0.82
US and Canada 0.20 2.07 0.60 0.19 0.00 1.83 12.18 13.19 10.44
Total 138.89 13.21 3.08 1.19 0.23 8.82 46.20 43.62 74.93
2014
Africa 21.31 2.06 0.09 0.10 0.01 0.33 3.04 3.65 8.26
Asia 91.50 2.82 3.09 0.68 0.27 6.28 48.79 8.57 7.88
Europe 2.63 0.87 0.29 0.06 0.00 0.80 3.53 4.36 3.40
FSU 10.10 1.32 0.26 0.26 0.00 0.65 5.31 13.69 13.80
Latin America 53.12 8.07 0.67 0.22 0.06 2.74 1.44 4.20 10.40
Middle East 2.86 0.22 0.05 0.00 0.00 0.16 0.01 10.82 28.55
Oceania 78.63 1.04 0.73 0.44 0.01 1.56 5.67 1.00 0.45
US and Canada 0.13 2.08 0.39 0.24 0.00 1.18 10.89 16.28 15.94
Total 260.29 18.48 5.56 2.01 0.35 13.71 78.67 62.55 88.67
Change, 2000-14 (percent) 87.4 39.9 80.5 68.9 52.2 55.4 70.3 43.4 18.3
Source: BP Statistical Review, World Bureau of Metal Statistics.

COMMODITY MARKETS OUTLOOK | ApRIL 2016 18 SPECIAL FOCUS
Endnotes
1. This section draws from the following: World Bank (2015b, pp. 93-101, “After the Commodities Boom—What Next for Low-Income Countries,” authored by Tehmina Khan and Gerard Kambou) and World Bank (2016, pp. 45-60, “From Com-modity Discovery to Production: Vulnerabilities and Policies in LICs,” authored by Tehmina Khan, Trang Nguyen, Franziska Ohnsorge and Richard Schodde).
2. Total foreign direct investment in agriculture and agribusiness in developing countries was estimated at $13 billion in 2006/07, with Africa receiving $1 billion.
3. The U.S. is by far the largest producer of oil and gas from shale formations, with smaller amounts com-ing from Canada, China, and Argentina (EIA 2013). A number of other countries possess rela-tively large shale oil reserves, and several have ac-tively drilled these formations including Algeria, Australia, Columbia, Norway, Mexico, and Russia (IER 2015). Related, the U.S. shale oil industry turned out to be more resilient than originally an-ticipated following the post-2014 oil price collapse, a reflection of technological advances and lower in-put costs (Decker et al. 2016).
4. One-third of copper discoveries since 1950 have had lead times to eventual production of 30 or more years, compared with only 4.5 percent of gold dis-coveries. Similarly, industry estimates place the pe-riod from early exploration to final production of copper mines at close to 25 years (McIntosh 2015).
5. Average annual returns for the top ten global min-ing companies are estimated to have risen from $3 billion in 2005 to just under $8 billion in 2010 (UNECA 2011). Returns in the oil and gas sector are even larger, since country conditions matter less, transportation (including in unprocessed form) is easier, and the sector is less dependent on the condi-tions of infrastructure such as roads, railways, and power stations (UNECA 2013).
6. In general, the cost of delaying projects may be lower in the resource sector than in non-resource sectors due to a limited number of alternative feasi-ble projects and heavy involvement of the state, which provides some insulation from political shocks (Crowson 2011).
7. The dataset, which is proprietary, was provided by MinEx Consulting.
References APEC Advisory Council. 2014. Asia-Pacific Mining
Sector Study. London: CRU International Limited.
Arbache, J. S., and J. Page. 2010. “How Fragile Is Af-rica’s Recent Growth?” Journal of African Economies 19 (1): 1-24.
Arezki, R., V. A. Ramey, and L. Sheng. 2015. “News Shocks in Open Economies: Evidence from Giant Oil Discoveries.” NBER Working Paper 20857, National Bureau of Economic Research, Cam-bridge, Massachusetts.
Bai, G, and Y. Xu. 2014. “Giant Fields Retain Domi-nance in the Reserves Growth.” Oil and Gas Journal 122 (2): 44-51.
Basu, P., R. Verma, R. Paul, and K. Viswanath. 2010. “Deep Waters of Rakhine Basin - A New Frontier.” 8th Biannual International Conference and Exposi-tion on Petroleum Geophysics. Hyderabad, India. http://www.spgindia.org/2010/160.pdf.
Clo, A. 2000. Oil Economics and Policy. New York: Springer Science and Business Media.
Crowson, P. 2011. “Economics of the Minerals Indus-try.” In SME Mining Engineering Handbook, edited by Peter Darling. Englewood, CO: Society for Min-ing, Metallurgy and Exploration.
Decker, R. A., A. Flaaen, and M. D. Tito. 2016. "Un-raveling the Oil Conundrum: Productivity Im-provements and Cost Declines in the U.S. Shale Oil Industry," FEDS Notes. Washington: Board of Governors of the Federal Reserve System, March 22, 2016. http://dx.doi.org/10.17016/2380-7172. 1736.
Deloitte & Touche. 2015. State of Mining in Africa in the Spotlight. Johannesburg: Deloitte & Touche.
EIA (U.S. Energy Information Administration). 2013. “Technically Recoverable Shale Oil and Shale Gas Resources: An Assessment of 137 Shale Forma-tions in 41 Countries Outside the United States.” https://eia.gov/analysis/studies/worldshalegas/ archive/2013/pdf/fullreport_2013.pdf.
FAO (Food and Agriculture Organization of the United Nations). 2012. Proceedings of a Technical Workshop on Policies for Promoting Investment in Agriculture, 12–13 December, 12-13. FAO, Rome. http://fao.org/fileadmin/user_upload/tcsp/docs/ workshop%20final.pdf.
Fraser Institute. 2011. “Annual Survey of Mining Companies.”

COMMODITY MARKETS OUTLOOK | ApRIL 2016 19SPECIAL FOCUS
Gajigo, O., E. Mutambatsere, and G. Ndiaye. 2012. “Gold Mining in Africa: Maximizing Economic Returns for Countries.” Working Paper 147, Afri-can Development Bank, Tunis, Tunisia.
Gelb, A., K. Kaiser, and L. Vinuela. 2012. “How Much Does Natural Resource Extraction Really Di-minish National Wealth? The Implications of Dis-covery.” Working Paper No. 290, Center for Global Development, Washington, DC.
Humphreys, M., J. Sachs, and J. E. Stiglitz, eds. 2007. Escaping the Resource Curse. New York: Columbia University Press.
Huurdeman, W. 2014. “Natural Gas: Fiscal Regime Challenges.” Presentation for workshop on “Fiscal Management of Oil and Natural Gas in East Af-rica.” East African Community and IMF Work-shop, Jan.15-17, 2014, Arusha, Tanzania.
ICMM (International Council of Mining and Met-als). 2012. “Trends in the Mining and Metals In-dustry.” InBrief Publication.
IER (Institute for Energy Research). 2015. “U.S. Miles Ahead in Global Shale Race.” http://www.instituteforenergyresearch.org/analysis/only-four- countries-produce-shale-oilgas/
IMF (International Monetary Fund). 2012. “Macro-economic Policy Frameworks for Resource-Rich Developing Countries.” IMF Policy Paper, Interna-tional Monetary Fund, Washington, DC.
______. 2014. “Macroeconomic Developments in Low-Income Developing Countries.” IMF Policy Paper, September 18, 2014, International Mone-tary Fund, Washington, DC.
Jenkins, S. 2006. “Introduction to the Empirical Analysis of Spell Duration Data.” Institute for So-cial and Economic Research, University of Essex.
Loayza, N. V., and C. Raddatz. 2007. “The Structural Determinants of External Vulnerability.” The World Bank Economic Review 21 (3): 359-387.
Lusty, P. A. J., and A. G. Gunn. 2015. “Challenges to Global Mineral Resource Security and Options for Future Supply.” Geological Society, London, Spe-
cial Publications Vol. 393, Issue 1.
McIntosh, S. 2015. “Mining Exploration in Emerg-ing Markets–A Major’s Perspective.” Presentation at the Global Mining Finance Conference, London.
Mehlum, H., K. Moene, and R. Torvik. 2006. “Insti-tutions and the Resource Curse.” The Economic Journal 116 (508): 1-20.
Sachs, J. D., and A. M. Warner. 2001. “The Curse of Natural Resources.” European Economic Review 45 (4): 827-838.
Schodde, R. 2013. “The Impact of Commodity Prices and Other Factors on the Level of Exploration.” MinEx Consulting presentation.
Stevens, P., G. Lahn, and J. Kooroshy. 2015. “The Re-source Curse Revisited.” Chatham House Research Paper, London.
UNECA (United Nations Economic Commission on Africa). 2011. “Minerals and Africa’s Development: The International Study Groups Report on Africa’s Mineral Regimes.” Addis Ababa, Ethiopia.
______. 2013. “African Economic Outlook: Struc-tural Transformation and Natural Resources. Spe-cial Thematic Edition,” published jointly by UN-ECA, AFDB, OECD, UNDP and European Commission.
Wang, Z., and Q. Xue. 2014. “The Market Structure of Shale Gas Drilling in the United States.” Discus-sion Paper 14-31, Resources for the Future, Wash-ington, DC.
World Bank. 2015a. Global Economic Prospects: Hav-ing Fiscal Space and Using It. January 2015. Wash-ington, DC: World Bank.
______. 2015b. The Power of the Mine: A Transforma-tive Opportunity for Sub-Saharan Africa. Washing-ton, DC: World Bank.
______. 2016. Global Economic Prospects: Spillovers Amid Weak Growth. January 2016. Washington, DC: World Bank.


COmmOdITy mARkET dEvELOPmEnTS
And OUTLOOk
EnergyAgriculture
FertilizersMetals and minerals
Precious metals


april 2016COMMODiTY MarKETS OUTlOOK 23
Energy
The World Bank Energy Price Index fell 21 percent in the first quarter of 2016 from the previous quarter. Oil led the decline by dropping 22 percent on weak demand and well-supplied markets. Natural gas and coal dropped 15 and 3 percent, respectively. However, oil prices recovered from lows in mid-January on improving market sentiment.
Crude oil
After dropping to $25/bbl in mid-January, oil prices rebounded to more than $40/bbl in mid-April on im-proved sentiment and investor short covering (Figure 3). However, average oil prices were down 22 for the quarter and 70 percent from June 2014.
The rally during the quarter reflected a number of supply side factors, notably disruptions in Iraq and Nigeria. In addition, the United States reported that oil production in December fell year-on-year for the first time in several years, and the U.S. Energy Infor-mation Administration (EIA) projections show falling output accelerating in 2016. Expectations of a pro-duction freeze among a number of OPEC and non-OPEC countries at a meeting in Doha on April 17 ended without an agreement. A weaker dollar and improved oil demand sentiment also contributed to the rally.
Despite the improved sentiment, the oil market re-mains oversupplied with stocks near record levels. Given that crude oil demand typically weakens in late winter and spring due to refinery maintenance, stocks are likely to stay high until demand picks up in the second quarter.
The differential between West Texas Intermediate (WTI) and Brent spot crude oil prices began the year
with WTI at a small premium. WTI was supported by declining domestic production and the lifting of the U.S. export ban on crude oil, while Brent was rela-tively suppressed due to weak seasonal demand. WTI subsequently slipped back into a modest discount throughout much of the quarter, reflecting crude oil stocks rising to ever-higher record levels and lower re-finery production. Futures prices show the WTI dis-count to Brent widening to more than $3/bbl, or about 6 percent, several years forward. This compares to a discount of $25/bbl or 23 percent at its most ex-treme in September 2011, and with an average his-torical premium of $1.2/bbl or 4 percent on average over 1986-2010.
World oil demand in 2015 grew by 1.8 mb/d or 2.0 percent, the highest growth in five years, in part aided by low prices. OECD oil demand grew by more than 0.4 mb/d (1 percent), after falling nearly 5 mb/d (10 percent) on a cumulative basis during the previous nine years. All of the OECD growth last year was in North America and Europe. Non-OECD oil demand trended modestly higher, rising by 1.4 mb/d (3 per-cent), with most of the growth in Asia. Among prod-ucts, gasoline led the way, particularly in the U.S. and Asia, due to lower prices and increased miles driven. Gasoil/diesel demand was subdued, however, due to slower economic activity, lower freight travel, and re-duced industrial activity.
Robust world oil demand growth slowed in the fourth quarter of 2015 and into the first quarter of 2016, in part because of mild weather in the northern hemi-sphere and waning effects of lower prices (Figure 4). World oil demand is projected to increase by 1.2 mb/d to 95.9 mb/d in 2016. OECD oil demand is projected to be flat, with modest gains in North America offset by losses elsewhere. Non-OECD oil demand is projected to rise by 1.2 mb/d (2.4 percent),
Source: Bloomberg.Notes: Daily frequency. Last observation is April 22, 2016.
Source: International Energy Agency.
FIGURE 3 Crude oil prices FIGURE 4 World oil demand growth
-4
-2
0
2
4
2007Q1 2009Q1 2011Q1 2013Q1 2015Q1
OECDChinaOther Non-OECD
mb/d, growth year over year
20
30
40
50
60
70
Jan-15 Apr-15 Jul-15 Oct-15 Jan-16 Apr-16
US$/bbl
Brent
WTI

commodity markets outlook april 2016 24
somewhat slower than last year. Growth is projected to slow in Asia, notably in China, but the region still accounts for the bulk of non-OECD growth, rising by 0.9 mb/d or 3.7 percent.
Global oil supply in 2015 increased by 2.7 mb/d, far exceeding the pace of demand. The gains were split between OPEC at 1.3 mb/d (mainly Iraq and Saudi Arabia) and non-OPEC 1.4 mb/d (of which 0.9 mb/d was in the United States). Other increases were in Bra-zil, Canada, the North Sea, and Russia—mainly from earlier investments in large projects. While OPEC maintained strong production growth throughout the year, non-OPEC growth declined steadily from 2.3 mb/d in the first quarter to just 0.4 mb/d in the fourth quarter, mainly due to a sharp slowdown in the United States. In the first quarter of 2016, non-OPEC supply is estimated to have fallen by 0.3 mb/d, the first re-duction in 14 consecutive quarters. Declines are ex-pected to steepen during the year to more the 1 mb/d in the fourth quarter, resulting in an average annual fall of 0.7 mb/d—the bulk of which will be from on-shore U.S. producers. Some annual increases are an-ticipated, with Canada and Russia raising output by more than 0.1 mb/d each.
Slowing output growth from higher-cost, short-cycle, unconventional oil in the U.S. is expected to help re-balance supply. This output includes but is not lim-ited to shale plays. Production from unconventional oil rose from 0.5 mb/d in 2009 to 4.6 mb/d at its high in 2015, and accounted for about half of U.S. oil out-put in last year. U.S. shale production has held up re-markably well—despite low prices and large declines in investment and drilling—through significant cost reductions, productivity improvements, technology innovations, an emphasis on the most productive as-sets, and hedging programs. Some of the important
operating improvements include shorter drilling cy-cles, longer laterals, multi-well drilling pads, tighter well spacing, greater proppant use, better geo-steer-ing, and re-fracking of wells. There is also a significant backlog of drilled but uncompleted wells that can be completed at roughly two-thirds the cost of a new well.
U.S. oil production recorded a year-on-year decline in December, the first material drop in nearly 10 years (Figure 5). The U.S. EIA projects that production will decline from 9.3 mb/d in the fourth quarter of 2015 to 7.9 mb/d in third quarter of 2017 before trending upward. U.S. upstream investment is estimated to have declined by at least one-third last year, and is likely to fall another 40 percent this year. Conse-quently, rigs drilling for oil have plunged by more than three-quarters from their October 2014 high (Figure 6).
Still, there is large uncertainty as to how far produc-tion will decline, or when it may start rising again. The recent oil price rally brought some relief to pro-ducers’ cash flow, and many hedged production for-ward at higher prices, thereby delaying supply rebal-ancing. Higher prices and continued efficiency improvements could further impinge on required re-balancing. On the other hand, the industry borrowed heavily during the boom years, outspending cash flow, and many companies are encumbered with debt, sell-ing assets, and entering into bankruptcy (and not confined to U.S. producers). With external financing increasingly closed, companies will need greater cash flow generation to fund drilling and completion of wells—which will depend on the level of prices. In addition, cost reductions and efficiency improve-ments may be more difficult going forward as much as the potential gains have already been achieved.
Source: U.S. Energy Information Administration.Notes: Last actual is January 2016. February 2016 to December 2017 are forecasts.
Source: Baker Hughes, Bloomberg.Notes: Weekly frequency. Last observation is April 22, 2016.
FIGURE 5 U.S. crude oil production FIGURE 6 U.S. oil rig count and oil prices
-1.5
-1.0
-0.5
0.0
0.5
1.0
1.5
2.0
Jan-07 Jan-09 Jan-11 Jan-13 Jan-15 Jan-17
AlaskaGulf of MexicoLower 48
mb/d, growth year over year
0
300
600
900
1,200
1,500
1,800
0
25
50
75
100
125
150
Jan-07 Jan-09 Jan-11 Jan-13 Jan-15
US$/bbl Rig count
US oil rig count (RHS)
Oil price, WTI (LHS)

april 2016COMMODiTY MarKETS OUTlOOK 25
OPEC crude oil production averaged 32.6 mb/d in the first quarter of 2016, up 1.4 mb/d from a year earlier, with all of the increase coming from Middle East Gulf countries (Figure 7). Saudi Arabia has main-tained output at around 10.2 mb/d for much of the past year, rising only in summer to meet peak summer domestic power demand. Iraq’s production surged to a high of 4.4 mb/d in January, but slipped in February as sabotage halted flows on the northern export pipe-line through Turkey. Nigerian production was also disrupted due to an attack on a sub-sea pipeline. The Islamic Republic of Iran has increased output 0.4 mb/d following the lifting of sanctions in January. Iran’s exports have resumed to Europe, and Asian buy-ers have also increased purchases. The country’s out-put is expected to continue climbing, from 2.9 mb/d at end-2015 toward its estimated capacity of 3.6 mb/d. The International Energy Agency states that with foreign investment and technology, the Islamic Republic of Iran could increase capacity to 4 mb/d by the end of the decade.
At a meeting in Doha on April 17th, sixteen OPEC and non-OPEC countries failed to freeze production, as many anticipated. Non-OPEC members were Azerbaijan, Colombia, Mexico, Oman, and Russia. OPEC members Libya and the Islamic Republic of Iran did not attend. This failure was attributed to disagreement over whether to include the Islamic Re-public of Iran and other producers in the freeze. An agreement was not expected to materially affect sup-ply in the near term, as most countries were produc-ing at relatively high levels and were not expected to produce much more in 2016. OPEC next meets on June 2 to discuss market developments.
The large supply overhang continues to result in near record OECD crude oil inventories (Figure 8). Much
of the increase has been in North America, but stocks are elevated in Europe and the Pacific regions as well. In the fourth quarter of 2015—a period when stocks typically fall—implied inventories soared by a record 1.8 mb/d. Global stocks are estimated to have risen by a 1.5 mb/d in first quarter, again with continued gains in North America. The stock buildup slowed signifi-cantly in March, suggesting a beginning of a tighten-ing of oil balances. The flattening of futures prices curves this year further suggests the process is underway.
Crude oil prices are projected to average $41/bbl in 2016, a decline of 19 percent from last year. This im-plies small increases through the rest of the year as the oversupply in the oil market diminishes. The market surplus is expected to extend in the first half of the year amid weak seasonal demand, but stocks are ex-pected to fall during the second half of the year as re-finery demand increases and U.S. production declines steepen. OPEC production excluding the Islamic Re-public of Iran is expected to remain flat, while Iranian output is expected to climb by some 0.5 mb/d.
Near-term upside risks to the price forecast include larger non-OPEC supply declines and slow expansion of Iranian exports. In addition, there are risks of sup-ply disruptions among key OPEC producers (Iraq, Nigeria, and the República Bolivariana de Venezuela) due to internal conflict and financial constraints. Higher global demand, particularly for transport, would also help reduce the stock overhang. Downside price risks include a slower rebalancing because of weak demand, and continued resilience of U.S. pro-ducers to sustain output and develop uncompleted wells. A large increase in the Islamic Republic of Iran’s exports and higher production from the rest of OPEC could help sustain the surplus.
Source: International Energy Agency.Note: Last observation is March 2016.
Source: International Energy Agency.Notes: Previous 5-year average for each month. Last observation is February, 2016.
FIGURE 7 OPEC crude oil production FIGURE 8 OECD crude oil stocks
7
8
9
10
11
12
13
14
Jan-07 Jan-09 Jan-11 Jan-13 Jan-15
mb/d
Saudi Arabia
Other Gulf
Non Gulf
900
1,000
1,100
1,200
Jan-07 Jan-09 Jan-11 Jan-13 Jan-15
Million barrels
5-year average
Crude oil stocks

commodity markets outlook april 2016 26
Coal
Thermal coal prices fell 3 percent in the first quarter of 2016—and down 60 percent over past five years—on continued weak import demand and excess supply. Prices rose slightly in February and March on some-what firmer seasonal demand and low stocks at Chi-nese ports, but surplus conditions are expected to remain due to falling imports into China—the world’s largest consumer of coal (Figure 9). High cost produc-tion has been reduced, notably in Indonesia, and new capacity continues to be developed, boosted in part by falling costs and depreciating producer currencies.
China’s thermal coal imports fell by one-third last year due to slowing power demand, increases in other energy sources to generate electricity, and government policies to reduce pollution and limit coal use. The government’s planned closure of high-cost, low-quality mines will improve the country’s overall power plant efficiency, further reducing thermal coal imports. Coal markets are contracting in many developed economies under government initiatives to shift away from coal. New climate change commitments may accelerate that transition. Growing supplies of low-priced natural gas are also prompting substitution away from coal.
Coal prices are expected to decline by 13 percent in 2016, averaging $50/ton, on continued weak demand and oversupply. Import demand in China is expected to continue to fall, and will partly be offset by rising demand in India and other emerging markets. How-ever, production in India is rising under new govern-ment policies that plan to significantly reduce imports in the next few years. Coal supply is expected to be ample, and there is also significant spare capacity that could be brought back on-line in countries such as Australia and Indonesia. China is also seeking to boost exports, further bloating the seaborne market.
Natural gas
Natural gas prices fell 15 percent in the first quarter of 2016 amid weak demand and large stocks (Figure 10). European gas prices plunged 23 percent to $4.8/mmbtu on weak demand; gas has been too expensive to compete with coal in power generation. Most gas is delivered at a spot or hub basis.
Gas delivered to Japan fell 11 percent to $8.0/mmbtu, owing to weak demand and strong seaborne supply from the Pacific and Atlantic Basins. Spot cargoes of liquefied natural gas (LNG) flowing into Asia and Europe have collapsed to around $4/mmbtu because of excess supply, but they only account for about 1 percent of global LNG trade. Significant new liquefaction capacity is expected from Australia and the U.S. in the next few years.
U.S. gas prices fell 6 percent to under $2.0/mmbtu due to record high stocks and weak demand from a mild winter. Natural gas use in the power sector con-tinues to increase and is expected to overtake coal this year. U.S. gas production finally shows signs of pla-teauing. The country shipped its first two cargoes of LNG to Brazil and India, and is on track to be a net exporter of gas by mid-2017.
Natural gas prices are projected to fall in 2016, led by large declines in Europe (-38 percent to $4.2/mmbtu) and Japan (-23 percent to $8.0/mmbtu) on contin-ued weak demand and surplus supply. Gas prices in the U.S. are expected to fall by 4 percent and average $2.5/mmbtu due to high stocks. However, strong growth in the power sector, rising exports, and slow-ing production growth are expected to underpin prices. Risks to the forecast are mainly to the down-side, given a global supply surplus and forthcoming increases in new LNG capacity.
Source: BP Statistical Review.Note: Last observation is 2014.
Source: World Bank. Note: Last observation is March 2016.
FIGURE 9 Coal consumption FIGURE 10 Coal and natural gas prices
0
5
10
15
20
Jan-00 Jan-03 Jan-06 Jan-09 Jan-12 Jan-15
US$/mmbtu
Coal(Australia)
Natural Gas(Japan)
Natural Gas(U.S.) Natural Gas
(Europe)
0
500
1,000
1,500
2,000
1970 1980 1990 2000 2010
Million tons of oil equivalent
China
OECD
Other
FSU
april 2016COMMODiTY MarKETS OUTlOOK 27
Agriculture
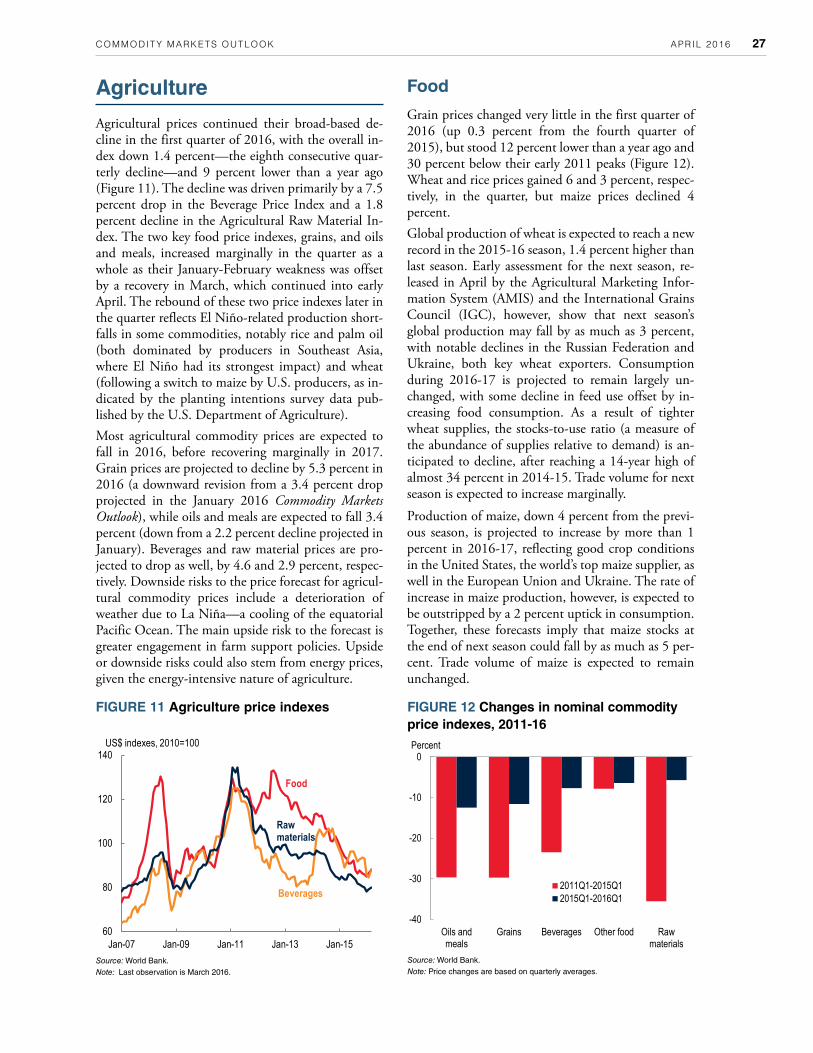
Agricultural prices continued their broad-based de-cline in the first quarter of 2016, with the overall in-dex down 1.4 percent—the eighth consecutive quar-terly decline—and 9 percent lower than a year ago (Figure 11). The decline was driven primarily by a 7.5 percent drop in the Beverage Price Index and a 1.8 percent decline in the Agricultural Raw Material In-dex. The two key food price indexes, grains, and oils and meals, increased marginally in the quarter as a whole as their January-February weakness was offset by a recovery in March, which continued into early April. The rebound of these two price indexes later in the quarter reflects El Niño-related production short-falls in some commodities, notably rice and palm oil (both dominated by producers in Southeast Asia, where El Niño had its strongest impact) and wheat (following a switch to maize by U.S. producers, as in-dicated by the planting intentions survey data pub-lished by the U.S. Department of Agriculture).Most agricultural commodity prices are expected to fall in 2016, before recovering marginally in 2017. Grain prices are projected to decline by 5.3 percent in 2016 (a downward revision from a 3.4 percent drop projected in the January 2016 Commodity Markets Outlook), while oils and meals are expected to fall 3.4 percent (down from a 2.2 percent decline projected in January). Beverages and raw material prices are pro-jected to drop as well, by 4.6 and 2.9 percent, respec-tively. Downside risks to the price forecast for agricul-tural commodity prices include a deterioration of weather due to La Niña—a cooling of the equatorial Pacific Ocean. The main upside risk to the forecast is greater engagement in farm support policies. Upside or downside risks could also stem from energy prices, given the energy-intensive nature of agriculture.
Food
Grain prices changed very little in the first quarter of 2016 (up 0.3 percent from the fourth quarter of 2015), but stood 12 percent lower than a year ago and 30 percent below their early 2011 peaks (Figure 12). Wheat and rice prices gained 6 and 3 percent, respec-tively, in the quarter, but maize prices declined 4 percent.Global production of wheat is expected to reach a new record in the 2015-16 season, 1.4 percent higher than last season. Early assessment for the next season, re-leased in April by the Agricultural Marketing Infor-mation System (AMIS) and the International Grains Council (IGC), however, show that next season’s global production may fall by as much as 3 percent, with notable declines in the Russian Federation and Ukraine, both key wheat exporters. Consumption during 2016-17 is projected to remain largely un-changed, with some decline in feed use offset by in-creasing food consumption. As a result of tighter wheat supplies, the stocks-to-use ratio (a measure of the abundance of supplies relative to demand) is an-ticipated to decline, after reaching a 14-year high of almost 34 percent in 2014-15. Trade volume for next season is expected to increase marginally.
Production of maize, down 4 percent from the previ-ous season, is projected to increase by more than 1 percent in 2016-17, reflecting good crop conditions in the United States, the world’s top maize supplier, as well in the European Union and Ukraine. The rate of increase in maize production, however, is expected to be outstripped by a 2 percent uptick in consumption. Together, these forecasts imply that maize stocks at the end of next season could fall by as much as 5 per-cent. Trade volume of maize is expected to remain unchanged.
Source: World Bank.Note: Last observation is March 2016.
Source: World Bank.Note: Price changes are based on quarterly averages.
FIGURE 11 Agriculture price indexes FIGURE 12 Changes in nominal commodity price indexes, 2011-16
-40
-30
-20
-10
0
Oils andmeals
Grains Beverages Other food Rawmaterials
Percent
2011Q1-2015Q12015Q1-2016Q1
60
80
100
120
140
Jan-07 Jan-09 Jan-11 Jan-13 Jan-15
US$ indexes, 2010=100
Food
Beverages
Raw materials

commodity markets outlook april 2016 28
Rice production, which began the current crop year on a positive note, has been gradually declining due to the El Niño-related shortfall in various East Asian rice producers, notably Thailand, the world’s dominant rice exporter. Global rice production, which is ex-pected to decline by 2 percent this season, will partly recover in 2016-17, perhaps by as much as 1 percent, according to the AMIS and IGC assessment. In-creased production is expected to materialize in India, the Philippines, and Thailand, which together ac-count for more than one-quarter of global rice sup-plies. The stock-to-use ratio, however, is likely to de-cline as consumption is projected to outpace production growth and a stock drawdown is expected to take place in India and Thailand.
Global supplies (beginning stocks plus production) for all three grains will reach 2.70 billion tons in 2015-16, slightly up from last season’s record produc-tion. Next season’s assessment is that global supplies will remain at the same levels, as higher maize and rice crops will offset lower wheat production (Figure 13).
The World Bank’s Oils and Meals Price Index changed little in the first quarter as increases in palm oil (+11 percent), coconut oil (+15 percent), and palm kernel oil (+24 percent) were offset by a decline in soybean meal (-8 percent) and some other oils. The overall in-dex is down 13 percent from a year ago and is one-third lower than its early 2011 peak. As was the case for rice, the price of edible oils, which are produced primarily in East Asia (notably palm oil and coconut oil), were affected by El Niño.
The oilseed supply outlook is healthy, with current season global supplies for the 10 major oilseeds ex-pected to exceed 621 million tons, 12 million tons higher than last season. Most of the increase in cur-rent supplies comes from elevated stock carry-over,
which is projected to reach 104 million tons, up from last season’s 100 million tons. Most of the stocks come from the large soybean crop.
This season’s outlook is also favorable for the 17 most consumed edible oils (Figure 14). Despite the short-fall from key producers in East Asia, global produc-tion in 2015-16 (October to September) will reach 206.9 million tons, up from last season’s 204.7 mil-lion tons, with most of the increase coming from soy-bean oil.
In view of adequately supplied food commodity mar-kets, together with the projection of lower energy and fertilizer prices, the World Bank’s Food Commodity Price Index is expected to fall by 3.4 percent in 2016, a downward revision from the 1.9 percent decline projected in the January assessment. A moderate gain of 2.1 percent is expected in 2017.
Risks
This forecast for food prices is subject to a number of short- and long-term risks. The most important are the evolution of energy prices; weather patterns (espe-cially the possibility of a La Niña episode in late 2016); and trade policies, including policies aimed at supporting commodity producers and biofuel production.Food commodity prices are affected by energy prices through a number of channels, including fuel costs and chemicals, and indirectly through fertilizers (some fertilizers are made directly from natural gas). Overall, agriculture has been estimated to be four to five times more energy intensive than manufacturing. The trans-mission elasticity from energy to food commodity prices has been estimated at between 0.15 and 0.20, implying that a halving of energy prices could precipi-tate a 10 percent permanent decline in food prices
Source: U.S. Department of Agriculture, AMIS-FAO, IGC.Note: Grains include maize, wheat, and rice.
Source: U.S. Department of Agriculture.Note: Data is based on USDA's April 2016 update.
FIGURE 13 Global grain production and consumption
FIGURE 14 Global production of key edible oils
1.2
1.4
1.6
1.8
2.0
2.2
2.4
1996 1999 2002 2005 2008 2011 2014
ProductionConsumption
Billion metric tons
-2
0
2
4
6
8
10
1990 1993 1996 1999 2002 2005 2008 2011 2014
Palm oilSoybean oilRapeseed oilOthers
Million metric tons, growth year over year

april 2016COMMODiTY MarKETS OUTlOOK 29
over the longer term, assuming everything else re-mains constant.
Oil prices are expected to average $41/bbl in 2016 (27 percent lower than 2015), while fertilizer prices are projected to fall 13 percent, on top of a similar decline in 2015. Low energy prices will ease input cost pres-sure for food commodity producers, especially in countries where energy intensity in agriculture is highest, such as North America, Europe, China, and Brazil (Figure 15).
El Niño, a key weather risk, reached its maximum strength in December 2015. By most accounts is the largest, or second largest after 1997, this year’s episode of the past 30 years. (The October 2015 edition of the Commodity Markets Outlook has an extensive discus-sion on El Niño.) El Niño has had diverse impacts on food commodity producers. In East Asian countries, especially for rice and palm oil producers, the impact has been detrimental. On the other hand, the delayed onset of rains in Southern Africa and the increased precipitation in Central Asia that El Niño has brought about is expected to aid agricultural production in these regions. Although the effects are expected to dis-sipate by June 2016, it is possible (with a current probability of 50 percent) that La Niña will develop toward the end of 2016. Typically, the impacts of La Niña are milder than those of El Niño.
In the current weak commodity price environment, governments are increasingly shifting from trade poli-cies aimed at reducing consumer prices (frequent dur-ing the food price spikes of 2007-08 and 2010-11) to domestic and trade policies designed to raise producer prices. India, for instance, has extended a 15-percent import duty on wheat from March to June 2016.
The most important policy change is China’s decision to end its maize stockpiling program, beginning in
October 2016. The quantity of stocks under govern-ment control is not known with certainty, nor is the quality. As of mid-April, the U.S. Department of Ag-riculture estimates that China is holding 109 million metric tons, or 53 percent of global stocks. China’s stockpiling program is intended to be replaced by a less distortionary program. Although details of the new support mechanism are unknown, it appears that China will follow the footsteps of agricultural policy reforms introduced by the European Union (1992), Mexico (1994), and the United States (1996). These replaced earlier stockpiling and price support pro-grams by direct income support mechanisms (often referred to as “decoupled support”). China’s stockpil-ing policies are not restricted to maize by they have been implemented to other agricultural commodities as well. For example, China accounts for more than half of global stocks for cotton and rice and 40 per-cent of global wheat stocks (Figure 16). In the case of cotton and wheat, China’s stocks have been twice as high compared to past decade’s average.While policy changes such as the above have been iso-lated so far, and therefore have not affected global commodity prices in a major way, they could play a key role if implemented by several major exporters (or numerous smaller suppliers).Finally, the outlook assumes that biofuels will con-tinue to be a source of demand for food commodi-ties—mainly maize for ethanol in the United States, sugar cane for ethanol in Brazil, and edible oils for biodiesel in Europe. Biofuels currently account for 3-4 percent of global arable land and 1.5 mb/d in crude oil equivalent terms. Yet, the role of biofuels will be less important in the long term as policymak-ers increasingly realize that the environmental and energy independence benefits stemming from biofu-els policies are not as strong as originally envisaged.
Source: U.S. Department of Agriculture.Note: Figures on top of colunms represent million metric tons.
Source: World Bank.Note: Calculations based on the Global Trade Analysis Project database.
FIGURE 16 China’s stocks of key commodities
FIGURE 15 Energy intensities: cost of energy component in 2007
0 5 10 15 20
TurkeyIndia
BrazilChinaEU-12
CanadaUnited States
Sub-Saharan AfricaDeveloping countries
High-income countriesWorld
ManufactureAgriculture
Share of energy component in 2007, percent
6 4257
52
12
48 109
96
20
30
40
50
60
Cotton Rice Maize Wheat
Past 10 years2015/2016
Percent of world total

commodity markets outlook april 2016 30
Beverages
The World Bank’s Beverage Price Index declined 7 percent in the first quarter of 2016. Although arabica coffee prices have been broadly stable during the first quarter, robusta prices declined sharply to reach a six-year low in February, and 25 percent lower than a year ago. The global coffee market is expected to be over-supplied in the 2015-16 season, with production of 153 million bags compared to consumption of 151 million bags. The weakness in robusta prices reflects record output by Vietnam, whose exports increased by 20 percent over the first five months of the season. Based on early assessments, 2016-17 will be another surplus production year, which combined with depre-ciated exchange rates by Brazil and Colombia, makes the coffee outlook bearish: arabica and robusta are projected to average 6 and 12 percent lower, respec-tively, compared to 2015.Although cocoa prices declined 10 percent in the quarter, they are still 2 percent higher than a year ago. The recent weakness in cocoa prices reflects, in part, strong exports from Côte d’Ivoire, the world’s domi-nant cocoa producer, and better-than-expected mid-crop production, despite a late start. The demand side, however, has been weak, especially by European chocolate and confectionary companies. Cocoa prices are expected to register only a marginal decline in 2016.
Tea prices fell almost 15 percent in the first quarter of 2016, with large declines at Mombasa and Kolkata auctions. In addition to strong supplies in key East African tea producing countries and India, the tea market has been facing headwinds from weak con-sumption in several tea-consuming countries. Tea prices are projected to decline 4 percent in 2016 but gain 2 percent in 2017.
Agricultural raw materials
The World Bank’s Raw Material Price index declined almost 2 percent in the first quarter of 2016. The in-dex is down 6 percent from a year earlier and 40 per-cent lower than its early 2011 peak. This pattern is remarkably similar to the other two industrial com-modity price indexes—energy and metals—and mainly reflects a slowing global economy (see the “special focus” of the January edition of the Commod-ity Markets Outlook) and the scale-up in production capacity (see Special Focus).Cotton prices declined 4 percent in the quarter. The weakness accelerated in February and March as early indications for the upcoming 2016-17 season suggest a 3 percent increase in global production from the current season. Although consumption is projected to be higher than production for a second consecutive year, the cotton market is mired by unusually high stocks, the equivalent of almost one year’s worth of consumption. More than half of those stocks are held by China (Figure 18); fears that they could be released will prevent any significant recovery in cotton prices. No change is expected in cotton prices for 2016 and only a marginal increase is projected in 2017.
Natural rubber prices increased 4 percent in the quar-ter with most of the gains realized in March (up 15 percent from February). The strengthening in rubber prices reflects a seasonal decline in production by Ma-laysia and Thailand, stronger demand by China, and, perhaps most importantly, the International Tripartite Rubber Council’s export quota scheme which began in March and is expected to withhold 615,000 tons of natural rubber from the world market over the next six months. Despite the recent uptick, natural rubber prices are expected to remain weak in 2016 and in-crease only marginally in 2017.
Source: Bloomberg.Notes: Daily frequency. Last observation is April 22, 2016.
Source: International Cotton Advisory Committee.
FIGURE 17 Coffee prices FIGURE 18 Cotton stocks
0
5
10
15
20
25
1990 1993 1996 1999 2002 2005 2008 2011 2014
Rest of worldChina
Million metric tons
2.5
3.0
3.5
4.0
4.5
5.0
1.3
1.5
1.7
1.9
2.1
Jan-15 Apr-15 Jul-15 Oct-15 Jan-16 Apr-16
US$/kg
Arabica (RHS)
Robusta (LHS)
US$/kg

april 2016COMMODiTY MarKETS OUTlOOK 31
Fertilizers
Fertilizer prices plunged 12 percent in the first quarter (Figure 19), down a fifth consecutive quarter, due to weak import demand, high stocks, and ample supply. Urea prices led the decline by dropping 17 percent, down for a sixth straight quarter, on weak demand and increasing capacity. Phosphate prices fell 13-14 percent, while potash prices declined 2 percent. De-mand weakness stems from poor farmer profitability, low crop prices, and depreciated currencies of key im-porting countries—although these reversed slightly during the quarter on a weaker dollar. Supply sur-pluses continue to be impacted by falling costs and cheaper feedstock prices (e.g., natural gas). Urea prices dropped 17 percent, mainly due to over-supply amid weak seasonal demand, including the impact of drought in south-east Asia. However, prices rose in March on strong purchases in the United States for spring application. Chinese demand contin-ues to decline on lower crop prices and a desire to re-duce unsustainably high application rates. The U.S. Department of Agriculture reported sharply higher planting intentions for rice and corn, which should benefit urea consumption. Increases in new export ca-pacity are expected this year, especially in Africa and the Middle East. However, continued large increases in the U.S. are expected to keep downward pressure on prices, unless there are reductions in high-cost ca-pacity. China’s exports are also expected to increase.
Phosphate prices fell by 14 percent (TSP) and 13 per-cent (DAP) due to weak demand in Brazil and India amid high stocks and weak currencies. Higher U.S. planting intentions for cotton and corn—the latter mainly at the expense of wheat—could increase phos-phate consumption, as both consume more fertilizer than wheat. Some producers have curtailed output
but there is little indication of further cuts. Chinese exports are set to pick up just as the domestic demand season comes to an end—which has also been slower than expected. Production capacity continues to ex-pand globally, with significant expansions expected in Morocco and Saudi Arabia. Potash (potassium chloride) prices fell 5 percent ow-ing to weak demand, high stocks, and ample supply. March was an exception, however, thanks to stronger demand in Brazil aided by increased credit made available to farmers on February 1. Major potash pro-ducers also withheld shipments to Brazil. Near-term demand could be buoyed in Brazil and the U.S., but reduced in Asia because of dry weather. The annual contract negotiations with Chinese buyers is expected to be settled later in the second quarter, as high inven-tory levels in China have delayed discussions. The price is also expected to be settled significantly lower than the current contract price of $315/mt, with vari-ous estimates at $220-240/mt owing to weak demand and surplus global capacity. The Indian annual con-tract is expected to be settled soon after at some $10/mt higher. Fertilizer prices are projected to decline by 13 percent in 2016 due to weak demand, rising supply capacity, and destocking. Nutrient application, which has been on a rising trend (Figure 20), remains constrained as farmers face both weak crop prices and domestic cur-rencies. Prices are generally expected to increase mod-erately over the medium term due to expected growth in demand, higher energy costs, and needed new ca-pacity of primary and processed supply. Risks to the forecast are skewed to the downside on low farm margins and expected increases in new pro-duction capacity. On the upside, higher agriculture prices and currency appreciation could boost fertilizer demand and prices.
Source: World Bank.Note: Last observation is March 2016.
Source: Agrium Fact Book, International Fertilizer Association.
FIGURE 19 Fertilizer prices FIGURE 20 Global nutrient consumption
0
200
400
600
800
1000
1200
Jan-07 Jan-09 Jan-11 Jan-13 Jan-15
US$/mtDAP
Urea
Potassium chloride
0
40
80
120
160
200
2004-05 2006-07 2008-09 2010-11 2012-13 2014-15
Nitrogen Phosphorus Potassium
Million metric tons

commodity markets outlook april 2016 32
Metals and minerals
Metals prices fell 1 percent in the first quarter, a sixth straight quarterly decline (Figure 21). Prices re-bounded in mid-January, and average prices in March were 11 percent higher than January. Most metals prices recorded strong gains in February and March—particularly iron ore, tin, and zinc—mainly driven by improved market sentiment, short covering, and a weaker dollar. Expectations of rising demand in China followed strong imports in January and February, and improving macro indicators. Prices were also buoyed by falling stocks, production cuts, and a few supply interruptions. Most markets remain oversupplied, however, with large stocks and lingering uncertainty over demand. China’s share of world metal consumption rose above 50 percent in 2015 (Figure 22), and the country ac-counted for the majority of global growth over the past 15 years (Figure 23). Metals consumption growth in the country has begun to retreat due to ongoing rebalancing to a consumer-based and less metal-inten-sive economy. Construction growth, for example, is expected to remain constrained this year as the gov-ernment attempts to reduce the current large over-hang of housing in lower-tiered cities by tightening credit. On the supply side, production cuts among some high-cost operations and supply disruptions have helped support prices. Global mining investment has fallen by more than half since peaking in 2012, al-though new lower-cost supply continues to expand for some metals from legacy investment. Supply at existing operations has been supported by significant cost reductions (notably for energy), producer cur-rency devaluations, and better management practices. The recent price rally has likely delayed closure of
high-cost operations and may create incentives to re-start idled capacity. Iron ore prices rose 3 percent in the quarter, but soared 33 percent in February/March on a spike in steel prices and restocking at Chinese mills ahead of the construction season. In addition, there were some disruptions to iron ore seaborne supply which further tightened the market. Prices continued to rally in April driven by renewed growth prospects in China, especially following government’s added stimulus measures and revival of construction. Significant vol-umes of low-cost capacity are expected over the next 2-3 years, while high-cost capacity is being shut down. Further closure of high-cost capacity is required to balance the market. Tin prices rose 2 percent in the quarter, but surged 22 percent in February/March on production cuts, low LME inventories, and stockpiling in China. China’s nine major tin producers—which account for 40 per-cent of world production—agreed to cut output in response to low prices. New regulations in Indonesia to curb environmental degradation and illegal trade has also reduced exports. Shipments from Myanmar continue to fill the gap, while Chinese demand in the key electronics sector (solder) remains weak. Although supply growth remains limited, higher prices would likely reactivate idled capacity.Zinc prices rose 4 percent in the quarter, but jumped 19 percent in February/March on expected market tightening due to large mine closures and Glencore’s production cuts. LME stocks fell slightly but remain high, and stocks rose in China because of weak de-mand to galvanize steel—which accounts for more than half of global zinc end-use consumption (Figure 24). With large mine closures in Australia (Century) and Ireland (Lisheen) in 2015, no new major projects are expected in the near-to-medium term, and stocks
Source: World Bank.Note: Last observation is March 2016.
Source: World Bureau of Metal Statistics.Note: Last observation is January 2016.
FIGURE 21 Metal and mineral prices FIGURE 22 World refined metal consumption
0
1
2
3
4
5
Jan-95 Jan-98 Jan-01 Jan-04 Jan-07 Jan-10 Jan-13 Jan-16
Million metric tons
China
OECD
Other non-OECD
25
45
65
85
105
125
145
Jan-07 Jan-09 Jan-11 Jan-13 Jan-15
US$ indexes, 2010=100
Base metals
Iron ore

april 2016COMMODiTY MarKETS OUTlOOK 33
are expected to fall and tighten the market. Key un-certainties are demand growth in China and future mine capacity additions.Lead prices rose 3 percent in the quarter and 9 percent in February/March, but retreated in April due to weak seasonal demand for replacement batteries. The lead market is expected to tighten going forward from clo-sure of large zinc/lead mines. With more than half of refined supply coming from recycled batteries, a key uncertainty is the supply of scrap material. Also un-certain is the pace of demand, given China’s maturing e-bike market and the growth of electric vehicles. One positive development is the increase of stop-start ve-hicles, which require 25 percent more lead per battery. Aluminum prices rose 1 percent in the quarter. After rising modestly in February, prices reverted to below $1500/mt toward the quarter's end on continued oversupply in China. The rest of the world, however, remains in deficit due to significant capacity closures. While demand growth has slowed in China’s property and manufacturing sectors, the outlook for global alu-minum consumption is robust due to its many uses, favorable properties, and substitution attractiveness. Low prices have curtailed high-cost capacity in China, but new capacity continues to come online there and elsewhere. Further closure of high-cost supply is re-quired to bring the market into balance and reduce the large inventory overhang, but restart of idle capac-ity will continue to overhang the market.Although copper prices average 4 percent lower in the first quarter of 2016, they rallied in February/March on declining LME inventories and strong import de-mand in China. However, the imports likely boosted Chinese inventories, as did part of the LME outflows, as China’s end-use consumption growth has slowed. The global market remains oversupplied, despite a
number of production cuts. Furthermore, new capac-ity will continue to come on-line in the next 2-3 years from earlier investment. The market is expected to remain in surplus, especially as Chinese demand growth slows, with additional risks from cost-saving measures and substitution of other materials. Nickel prices dropped 10 percent and did not rise sig-nificantly during the quarter, as the market remains oversupplied amid record high stocks and weak stain-less steel demand (which consumes about two-thirds of the world’s refined nickel). Other than China’s nickel pig iron sector, production cuts have been lim-ited despite prices falling deep into the cost curve. A group of Philippine producers agreed in March to cut exports by up to 20 percent this year, but further cuts are required to reduce excess supply. Metals prices are projected to decline by 8 percent in 2016 due to slowing demand in emerging economies, notably China, and increases in new production ca-pacity. The largest decline is for nickel, which is ex-pected to fall by 22 percent due to weak demand and insufficient production cuts. Sizable declines are also expected for iron ore (down 10 percent) and copper (down 9 percent). Most other prices are expected to fall as markets remain in surplus amid high stocks. Markets are expected to tighten in the medium term due to reduced investment in supply capacity, rising global demand, and some specific factors, including Indonesia’s ore export ban and closure of large zinc mines due to exhaustion.Downside risks to the forecast include slower demand in China and higher-than-expected production due to further cost reductions. Upside risks are centered on stronger global demand growth and supply shortfalls from project delays, operational disruptions, falling ore grades, environmental constraints, and greater closure of high-cost capacity.
Source: World Bureau of Metal Statistics. Source: Bloomberg.Notes: Daily frequency. Last observation is April 21, 2016.
FIGURE 23 World metal consumption growth FIGURE 24 Zinc price and LME stocks
-8
-4
0
4
8
12
1996 1998 2000 2002 2004 2006 2008 2010 2012 2014
OECDOther non-OECDChina
Million metric tons, growth year over year
0
200
400
600
800
1,000
1,200
1,400
0
1,000
2,000
3,000
4,000
5,000
Jan-07 Jan-09 Jan-11 Jan-13 Jan-15
US$/ton Thousand metric tons
Zinc price (LHS)
LME stocks (RHS)

commodity markets outlook april 2016 34
Precious metals
Precious metals prices rose 6 percent in the first quar-ter on stronger investment demand and safe-haven buying (Figure 15). Gold rose by 7 percent, while sil-ver and platinum prices each increased 1 percent. All prices rose strongly in February and March, aided in part by U.S. dollar depreciation, declining real inter-est rates, and a more cautious U.S. Federal Reserve position on future interest rate hikes. Gold prices increased 7 percent in the first quarter, and jumped 13 percent in second and third months, averaging $1,245/toz in March. Investor sentiment reversed due to the U.S. Federal Reserve interest rate hike deferral, a weaker dollar, increased macro risks, and a rise in safe-haven demand. The adoption of negative interest rates in a number of developed econ-omies increased gold’s attractiveness by reducing its holding costs. Conversely, rising interest rates typi-cally have negative implications for gold prices, as in-vestors seek yield-bearing assets.
Physical gold demand was weak in the two largest consuming countries. In India, higher prices and un-certainty over the government’s end-February budget restrained purchases. An excise tax of 1 percent was announced in March and many Indian jewelers went on strike. In China, demand was weak due to New Year holidays and a slowing economy. Global gold mine supply growth has trended lower due to declin-ing investment, but has been partly offset by cost re-ductions and depreciating producer currencies. Nev-ertheless, significant new production is expected this year as mines commissioned last year continue to ramp up (Figure 16).
Silver prices rose 1 percent in the quarter. After a weak January performance, prices surged 10 percent in Feb-ruary and March, in line with investor sentiment to-
ward gold. Physical demand was weighed down by slowing industrial activity, partly reducing its attrac-tiveness as a safe-haven asset. Falling silver intensity in electronic and photovoltaic sectors, and declining trends in photographic applications are also contrib-uting to lower consumption. Mine supply is contract-ing mainly in Australia and the Americas, and in part reflects lower by-product output from declines in zinc and other metals production.
Platinum prices also rose 1 percent in the quarter. As with gold and silver, platinum’s surge (13 percent) came in February and March, with rising gold prices and a stronger Rand (South Africa produces about 60 percent of global production) sparking the rally. How-ever, mine supply is facing headwinds due to sharply lower investment, upcoming labor negotiations, and adverse effects from drought. Demand from the auto sector remains robust, boosted by low fuel prices and easing credit.
Precious metals prices are projected to decline 2 per-cent in 2016, mainly due to lower investment de-mand. Platinum is expected to lead the decline, falling 10 percent on surplus supply. Silver prices are ex-pected to fall 5 percent due to slowing physical de-mand, as the metal is more vulnerable than gold to shifts in industrial production. Gold prices are pro-jected to fall just 1 percent, reflecting strong invest-ment demand in the first quarter, but is expected to decline going forward on expectations of a rising dol-lar and tightening in U.S. monetary policy. Physical demand is expected to remain robust in India and China, while mine production continues to benefit from cost reductions. Downside risks to the forecast include stronger-than-expected monetary tightening and dollar strength. Upside risks include weaker global growth, financial stress in key economies, heightened geopolitical events, and stronger demand from consumers, central banks, and investors.
Source: World Bank.Note: Last observation is March 2016.
Source: World Bureau of Metal Statistics.Note: Last observation is January 2016.
FIGURE 25 Precious metal prices FIGURE 26 Global gold production
0
50
100
150
200
250
300
Jan-95 Jan-00 Jan-05 Jan-10 Jan-15
Americas Europe OceaniaAsia Africa
Thousand metric tons
600
900
1,200
1,500
1,800
2,100
5
15
25
35
45
Jan-07 Jan-09 Jan-11 Jan-13 Jan-15
US$/toz US$/toz
Platinum (RHS)
Silver (LHS)
Gold (RHS)

APPEndIx A
Historical commodity prices Price forecasts


COMMODITY MARKETS OUTLOOK | ApRIL 2016 37APPENDIX A
TABLE A.1 Commodity prices
Commodity Unit Q1 Q2 Q3 Q4 Q1 Jan Feb Mar2014 2015 2015 2015 2015 2015 2016 2016 2016 2016
EnergyCoal, Australia $/mt * 70.1 57.5 61.2 59.0 57.5 52.3 50.9 49.8 50.7 52.1Coal, Colombia $/mt 65.9 52.5 57.3 54.3 50.4 48.0 42.7 43.0 41.4 43.8Coal, South Africa $/mt 72.3 57.0 62.1 60.7 54.3 51.1 51.6 49.9 51.5 53.2Crude oil, average $/bbl 96.2 50.8 51.6 60.5 48.8 42.2 32.7 29.8 31.0 37.3Crude oil, Brent $/bbl * 98.9 52.4 53.9 62.1 50.0 43.4 34.4 30.8 33.2 39.1Crude oil, Dubai $/bbl * 96.7 51.2 52.2 61.4 49.9 41.2 30.6 27.0 29.5 35.2Crude oil, WTI $/bbl * 93.1 48.7 48.6 57.8 46.4 42.0 33.2 31.5 30.4 37.8Natural gas, Index 2010=100 111.7 73.3 85.4 74.2 72.2 61.4 52.3 58.4 52.5 46.1Natural gas, Europe $/mmbtu * 10.05 7.26 8.60 7.33 6.86 6.26 4.82 5.35 4.90 4.20Natural gas, US $/mmbtu * 4.37 2.61 2.87 2.73 2.75 2.11 1.98 2.27 1.96 1.70Natural gas, Japan $/mmbtu * 16.04 10.40 14.26 9.18 9.23 8.94 7.95 7.85 8.00 8.00
Non-EnergyAgriculture
BeveragesCocoa $/kg ** 3.06 3.14 2.92 3.07 3.25 3.30 2.98 2.95 2.92 3.07Coffee, arabica $/kg ** 4.42 3.53 3.89 3.54 3.36 3.31 3.31 3.20 3.26 3.47Coffee, robusta $/kg ** 2.22 1.94 2.12 1.98 1.87 1.79 1.65 1.65 1.63 1.67Tea, average $/kg 2.72 2.71 2.43 2.79 2.85 2.76 2.36 2.50 2.31 2.28Tea, Colombo $/kg ** 3.54 2.96 3.16 3.00 2.83 2.85 2.82 2.84 2.79 2.82Tea, Kolkata $/kg ** 2.58 2.42 1.82 2.56 2.78 2.52 1.89 2.07 1.78 1.81Tea, Mombasa $/kg ** 2.05 2.74 2.31 2.80 2.95 2.91 2.38 2.58 2.37 2.21
FoodOils and MealsCoconut oil $/mt ** 1,280 1,110 1,147 1,115 1,067 1,109 1,273 1,155 1,216 1,448Copra $/mt 854 735 760 737 708 737 855 763 813 990Fishmeal $/mt 1,709 1,558 1,712 1,523 1,472 1,524 1,465 1,476 1,472 1,448Groundnuts $/mt 1,296 1,248 1,333 1,290 1,193 1,175 1,158 1,175 1,150 1,150Groundnut oil $/mt ** 1,313 1,337 1,371 1,346 1,332 1,298 1,277 1,274 1,271 1,286Palm oil $/mt ** 821 623 683 664 574 570 631 566 640 686Palmkernel oil $/mt 1,121 909 1,046 957 802 831 1,032 894 988 1,213Soybean meal $/mt ** 528 395 432 391 398 358 328 333 326 325Soybean oil $/mt ** 909 757 774 774 736 743 749 727 758 761Soybeans $/mt ** 492 390 411 394 385 372 370 367 369 375
GrainsBarley $/mt ** 138 194 189 201 200 187 183 185 187 176Maize $/mt ** 193 170 174 168 169 167 160 161 160 159Rice, Thailand 5% $/mt ** 423 386 417 385 374 368 379 369 384 384Rice, Thailand 25% $/mt 382 373 397 372 362 359 370 361 374 375Rice, Thailand A1 $/mt 425 386 416 388 376 365 373 366 377 375Rice, Vietnam 5% $/mt 407 352 363 351 337 356 362 365 360 360Sorghum $/mt 207 205 237 215 190 176 174 174 174 174Wheat, US HRW $/mt ** 285 204 239 216 183 180 191 193 187 191Wheat, US SRW $/mt 245 206 223 205 196 201 190 192 188 190
Other FoodBananas, EU $/kg 1.04 0.90 0.92 0.92 0.90 0.88 0.91 0.86 0.93 0.94Bananas, US $/kg ** 0.93 0.96 0.98 0.97 0.95 0.93 1.03 1.04 1.05 1.01Meat, beef $/kg ** 4.95 4.42 4.76 4.47 4.55 3.91 3.72 3.50 3.77 3.88Meat, chicken $/kg ** 2.43 2.53 2.51 2.55 2.55 2.50 2.47 2.48 2.47 2.46Meat, sheep $/kg 6.39 5.22 5.60 5.38 5.07 4.82 4.51 4.54 4.51 4.48Oranges $/kg ** 0.78 0.68 0.70 0.62 0.65 0.73 0.69 0.69 0.69 0.68Shrimp $/kg 17.25 14.36 15.84 15.65 15.43 10.50 10.83 10.44 11.02 11.02Sugar, EU $/kg ** 0.43 0.36 0.37 0.36 0.36 0.36 0.36 0.35 0.36 0.36Sugar, US $/kg ** 0.53 0.55 0.54 0.54 0.54 0.56 0.57 0.57 0.56 0.58Sugar, World $/kg ** 0.37 0.30 0.32 0.29 0.27 0.32 0.31 0.31 0.29 0.34

COMMODITY MARKETS OUTLOOK | ApRIL 2016 38 APPENDIX A
TABLE A.1 Commodity prices
Source: See Appendix C.Notes: (*) Included in the energy index; (**) Included in the non-energy index; (***) Included in the precious metals index: (****) Metals and Minerals exluding iron ore.
Commodity Unit Q1 Q2 Q3 Q4 Q1 Jan Feb Mar2014 2015 2015 2015 2015 2015 2016 2016 2016 2016
Raw MaterialsTimberLogs, Africa $/cum 465 389 395 387 389 383 386 380 388 389Logs, S.E. Asia $/cum ** 282 246 250 245 244 245 258 252 259 264Plywood ¢/sheets 517 451 458 450 447 450 474 462 476 484Sawnwood, Africa $/cum 789 733 726 734 743 727 686 691 686 681Sawnwood, S.E. Asia $/cum ** 898 833 826 835 845 827 780 786 780 775Woodpulp $/mt 877 875 875 875 875 875 875 875 875 875
Other Raw MaterialsCotton $/kg ** 1.83 1.55 1.52 1.59 1.56 1.53 1.48 1.52 1.47 1.44Rubber, RSS3 $/kg ** 1.96 1.56 1.73 1.79 1.46 1.26 1.31 1.22 1.26 1.45Rubber, TSR20 $/kg 1.71 1.37 1.42 1.52 1.34 1.20 1.15 1.08 1.09 1.28
FertilizersDAP $/mt ** 472 459 483 469 464 419 367 385 355 360Phosphate rock $/mt ** 110 117 115 115 117 123 116 118 115 115Potassium chloride $/mt ** 297 303 305 307 303 297 283 290 282 277TSP $/mt ** 388 385 400 380 380 380 328 380 329 275Urea, E. Europe $/mt ** 316 273 296 277 268 251 209 214 209 203
Metals and MineralsAluminum $/mt ** 1,867 1,665 1,802 1,770 1,592 1,494 1,514 1,481 1,531 1,531Copper $/mt ** 6,863 5,510 5,833 6,057 5,267 4,885 4,675 4,472 4,599 4,954Iron ore $/dmt ** 96.9 55.8 63.0 58.3 55.0 47.0 48.3 42.0 47.0 56.0Lead $/mt ** 2,095 1,788 1,810 1,942 1,717 1,682 1,738 1,646 1,766 1,802Nickel $/mt ** 16,893 11,863 14,393 13,056 10,579 9,423 8,508 8,507 8,299 8,717Tin $/mt ** 21,899 16,067 18,370 15,590 15,230 15,077 15,439 13,808 15,610 16,898Zinc $/mt ** 2,161 1,932 2,080 2,192 1,843 1,612 1,677 1,520 1,710 1,802
Precious MetalsGold $/toz *** 1,266 1,161 1,219 1,193 1,124 1,107 1,181 1,098 1,200 1,245Platinum $/toz *** 1,384 1,053 1,193 1,127 986 907 914 855 919 968Silver $/toz *** 19.07 15.72 16.75 16.42 14.91 14.80 14.91 14.11 15.17 15.47
Commodity Price Indexes (2010=100)Energy 118.3 64.9 67.3 75.5 62.7 54.2 43.0 40.5 41.2 47.4Non-energy 97.0 82.4 86.7 84.8 80.6 77.6 76.2 74.6 75.8 78.0
Agriculture 102.7 89.3 92.9 90.2 88.0 85.9 84.7 83.5 84.4 86.2Beverages 101.8 93.5 93.4 93.6 94.0 93.1 86.2 85.7 84.6 88.2Food 107.4 90.9 96.5 91.6 88.8 86.6 86.7 85.1 86.5 88.3
Oils and Meals 109.0 85.2 91.3 86.7 83.1 79.6 79.9 77.3 80.0 82.5Grains 103.9 88.8 95.4 89.9 85.7 84.1 84.3 84.3 84.3 84.4Other Food 108.4 100.3 104.3 99.7 99.2 98.0 97.6 96.1 97.1 99.6
Raw Materials 91.9 83.2 84.0 85.1 83.1 80.7 79.2 78.3 79.2 80.1Timber 104.9 96.1 95.7 96.2 96.9 95.4 92.2 92.1 92.2 92.1Other Raw Materials 77.8 69.2 71.1 73.1 67.9 64.5 65.0 63.2 64.8 67.0
Fertilizers 100.5 95.4 99.3 95.6 94.4 92.3 81.6 86.0 81.5 77.2Metals and Minerals 84.8 66.9 72.7 72.4 63.9 58.8 58.0 55.2 57.7 61.2
Base Metals **** 89.0 73.6 79.5 79.9 70.0 65.0 63.8 61.4 63.6 66.5Precious Metals 101.1 90.6 95.6 93.5 87.4 86.1 90.9 84.7 92.3 95.6

COMMODITY MARKETS OUTLOOK | ApRIL 2016 39APPENDIX A
TABLE A.2 Commodity price forecasts in nominal U.S. dollars
Next update: July 2016.
Commodity Unit Forecasts2013 2014 2015 2016 2017 2018 2019 2020 2025
EnergyCoal, Australia $/mt 84.6 70.1 57.5 50.0 51.0 52.1 53.1 54.2 60.0Crude oil, avg, spot $/bbl 104.1 96.2 50.8 41.0 50.0 53.3 56.7 60.4 82.6Natural gas, Europe $/mmbtu 11.79 10.05 7.26 4.50 4.80 5.11 5.45 5.81 8.00Natural gas, US $/mmbtu 3.73 4.37 2.61 2.50 3.00 3.50 3.68 3.88 5.00Natural gas, Japan $/mmbtu 15.96 16.04 10.40 8.00 8.20 8.41 8.62 8.83 10.00
Non-EnergyAgriculture
BeveragesCocoa $/kg 2.44 3.06 3.14 3.10 3.01 2.93 2.85 2.77 2.40Coffee, Arabica $/kg 3.08 4.42 3.53 3.30 3.32 3.34 3.37 3.39 3.50Coffee, robusta $/kg 2.08 2.22 1.94 1.70 1.72 1.74 1.76 1.79 1.90Tea, average $/kg 2.86 2.72 2.71 2.60 2.65 2.70 2.76 2.81 3.10
FoodOils and MealsCoconut oil $/mt 941 1,280 1,110 1,300 1,263 1,226 1,191 1,157 1,000Groundnut oil $/mt 1,773 1,313 1,337 1,300 1,339 1,380 1,422 1,465 1,700Palm oil $/mt 857 821 623 630 647 664 682 701 800Soybean meal $/mt 545 528 395 340 353 367 381 396 480Soybean oil $/mt 1,057 909 757 775 797 820 844 868 1,000Soybeans $/mt 538 492 390 390 403 416 429 443 520GrainsBarley $/mt 202 138 194 185 187 188 190 192 200Maize $/mt 259 193 170 165 170 176 182 188 220Rice, Thailand, 5% $/mt 506 423 386 375 379 383 386 390 410Wheat, US, HRW $/mt 312 285 204 180 188 197 206 216 270Other FoodBananas, EU $/kg 0.92 0.93 0.96 1.00 0.99 0.98 0.97 0.96 0.92Meat, beef $/kg 4.07 4.95 4.42 3.80 3.84 3.89 3.93 3.97 4.20Meat, chicken $/kg 2.29 2.43 2.53 2.50 2.46 2.43 2.40 2.36 2.20Oranges $/kg 0.97 0.78 0.68 0.70 0.72 0.75 0.78 0.80 0.95Shrimp $/kg 13.84 17.25 14.36 11.00 11.21 11.42 11.63 11.85 13.00Sugar, World $/kg 0.39 0.37 0.30 0.32 0.33 0.33 0.34 0.35 0.38
Raw MaterialsTimberLogs, Africa $/cum 464 465 389 390 401 412 424 436 500Logs, S.E. Asia $/cum 305 282 246 250 259 268 277 287 340Sawnwood, S.E. Asia $/cum 853 898 833 800 820 841 862 883 1,000Other Raw MaterialsCotton A $/kg 1.99 1.83 1.55 1.55 1.61 1.68 1.74 1.81 2.20Rubber, RSS3 $/kg 2.79 1.96 1.56 1.35 1.43 1.52 1.61 1.71 2.30Tobacco $/mt 4,589 4,991 4,908 5,000 4,942 4,884 4,827 4,771 4,500
FertilizersDAP $/mt 445 472 459 360 368 376 385 394 440Phosphate rock $/mt 148 110 117 120 119 118 117 115 110Potassium chloride $/mt 379 297 303 285 288 290 293 296 310TSP $/mt 382 388 385 310 315 320 326 331 360Urea, E. Europe $/mt 340 316 273 220 226 232 238 245 280
Metals and MineralsAluminum $/mt 1,847 1,867 1,665 1,600 1,649 1,700 1,752 1,806 2,100Copper $/mt 7,332 6,863 5,510 5,000 5,190 5,388 5,593 5,807 7,000Iron ore $/dmt 135.4 96.9 55.8 50.0 51.5 53.0 54.6 56.2 65.0Lead $/mt 2,140 2,095 1,788 1,775 1,827 1,880 1,935 1,992 2,300Nickel $/mt 15,032 16,893 11,863 9,200 10,029 10,933 11,918 12,992 20,000Tin $/mt 22,283 21,899 16,067 15,000 15,652 16,333 17,043 17,783 22,000Zinc $/mt 1,910 2,161 1,932 1,800 1,858 1,919 1,981 2,046 2,400
Precious MetalsGold $/toz 1,411 1,266 1,161 1,150 1,132 1,115 1,098 1,081 1,000Silver $/toz 23.85 19.07 15.72 15.00 15.11 15.22 15.33 15.44 16.00Platinum $/toz 1,487 1,384 1,053 950 999 1,051 1,106 1,164 1,500

COMMODITY MARKETS OUTLOOK | ApRIL 2016 40 APPENDIX A
TABLE A.3 Commodity price forecasts in constant U.S. dollars (2010=100)
Sources and Notes: See Appendix C.Next update: July 2016.
Commodity Unit Forecasts2013 2014 2015 2016 2017 2018 2019 2020 2025
EnergyCoal, Australia $/mt 79.7 66.2 54.4 46.5 46.6 46.8 47.0 47.3 48.1Crude oil, avg, spot $/bbl 98.1 90.9 48.0 38.1 45.7 47.9 50.2 52.6 66.3Natural gas, Europe $/mmbtu 11.11 9.49 6.87 4.18 4.38 4.60 4.83 5.06 6.42Natural gas, US $/mmbtu 3.52 4.13 2.47 2.32 2.74 3.15 3.26 3.38 4.01Natural gas, Japan $/mmbtu 15.04 15.15 9.85 7.43 7.50 7.56 7.63 7.70 8.02
Non-EnergyAgriculture
BeveragesCocoa $/kg 2.30 2.89 2.97 2.88 2.75 2.63 2.52 2.41 1.92Coffee, Arabica $/kg 2.90 4.18 3.34 3.07 3.04 3.01 2.98 2.95 2.81Coffee, robusta $/kg 1.96 2.09 1.84 1.58 1.57 1.57 1.56 1.56 1.52Tea, avgerage $/kg 2.70 2.57 2.56 2.42 2.42 2.43 2.44 2.45 2.49
FoodOils and MealsCoconut oil $/mt 887 1,209 1,050 1,208 1,154 1,103 1,055 1,008 802Groundnut oil $/mt 1,672 1,240 1,265 1,208 1,224 1,241 1,259 1,276 1,363Palm oil $/mt 808 776 589 585 591 598 604 611 642Soybean meal $/mt 514 499 374 316 323 330 338 345 385Soybean oil $/mt 996 859 716 720 729 738 747 756 802Soybeans $/mt 508 464 370 362 368 374 380 386 417
GrainsBarley $/mt 191 130 184 172 171 169 168 167 160Maize $/mt 245 182 161 153 156 158 161 163 176Rice, Thailand, 5% $/mt 477 399 365 348 346 344 342 340 329Wheat, US, HRW $/mt 294 269 194 167 172 177 182 188 217
Other FoodBananas, EU $/kg 0.87 0.88 0.91 0.93 0.91 0.88 0.86 0.84 0.74Meat, beef $/kg 3.84 4.67 4.19 3.53 3.51 3.49 3.48 3.46 3.37Meat, chicken $/kg 2.16 2.29 2.39 2.32 2.25 2.19 2.12 2.06 1.76Oranges $/kg 0.91 0.74 0.64 0.65 0.66 0.67 0.69 0.70 0.76Shrimp $/kg 13.05 16.29 13.59 10.22 10.24 10.27 10.30 10.32 10.43Sugar, World $/kg 0.37 0.35 0.28 0.30 0.30 0.30 0.30 0.30 0.30
Raw MaterialsTimberLogs, Africa $/cum 437 439 368 362 366 371 375 380 401Logs, S.E. Asia $/cum 288 266 233 232 236 241 245 250 273Sawnwood, S.E. Asia $/cum 804 848 789 743 750 756 763 770 802Other Raw MaterialsCotton A $/kg 1.88 1.73 1.47 1.44 1.47 1.51 1.54 1.58 1.76Rubber, RSS3 $/kg 2.63 1.85 1.48 1.25 1.31 1.37 1.43 1.49 1.84Tobacco $/mt 4,327 4,714 4,646 4,645 4,517 4,393 4,274 4,158 3,609
FertilizersDAP $/mt 419 446 434 334 336 339 341 343 353Phosphate rock $/mt 140 104 111 111 109 106 103 101 88Potassium chloride $/mt 357 281 287 265 263 261 260 258 249TSP $/mt 360 367 364 288 288 288 288 289 289Urea, E. Europe $/mt 321 299 258 204 207 209 211 213 225
Metals and MineralsAluminum $/mt 1,741 1,764 1,576 1,486 1,507 1,529 1,551 1,573 1,684Copper $/mt 6,913 6,482 5,216 4,645 4,744 4,847 4,952 5,060 5,614Iron ore $/dmt 127.6 91.6 52.8 46.5 47.0 47.7 48.3 49.0 52.1Lead $/mt 2,018 1,979 1,692 1,649 1,670 1,691 1,713 1,736 1,845Nickel $/mt 14,173 15,955 11,228 8,547 9,166 9,834 10,552 11,322 16,041Tin $/mt 21,010 20,683 15,207 13,936 14,305 14,691 15,089 15,497 17,645Zinc $/mt 1,801 2,041 1,828 1,672 1,699 1,726 1,754 1,783 1,925
Precious MetalsGold $/toz 1,331 1,195 1,099 1,068 1,035 1,003 972 942 802Silver $/toz 22.49 18.01 14.88 13.94 13.81 13.69 13.57 13.45 12.83Platinum $/toz 1,402 1,307 997 883 913 946 979 1,014 1,203

COMMODITY MARKETS OUTLOOK | ApRIL 2016 41APPENDIX A
TABLE A.4 Commodity price index forecasts (2010=100)
Source: See Appendix C.
Notes: (*) Base metals plus iron ore; (**) Includes aluminum, copper, lead, nickel, tin and zinc; (***) MUV is the unit value index of manufacture exports. For other notes see Appendix C.
Next update: July 2016.
Commodity Unit Forecasts2013 2014 2015 2016 2017 2018 2019 2020 2025
Nominal US dollars (2010=100)Energy 127.4 118.3 64.9 52.4 62.9 67.2 71.4 75.9 102.6Non-energy commodities 101.7 97.0 82.4 78.2 80.0 81.9 83.8 85.8 97.3
Agriculture 106.3 102.7 89.3 86.2 87.8 89.4 91.1 92.9 102.9Beverages 83.3 101.8 93.5 89.2 88.8 88.4 88.1 87.8 86.8Food 115.6 107.4 90.9 87.8 89.6 91.5 93.4 95.5 106.8
Oils and meals 115.9 109.0 85.2 82.3 84.7 87.3 89.9 92.6 107.7Grains 128.2 103.9 88.8 84.1 86.5 88.9 91.5 94.1 108.8Other food 103.9 108.4 100.3 98.3 98.8 99.3 99.9 100.5 103.8
Raw materials 95.4 91.9 83.2 80.8 82.7 84.8 86.9 89.1 101.7Timber 102.6 104.9 96.1 93.3 95.9 98.5 101.1 103.9 118.8Other Raw Materials 87.6 77.8 69.2 67.1 68.4 69.8 71.3 73.0 82.9
Fertilizers 113.7 100.5 95.4 82.8 84.0 85.2 86.4 87.6 94.4Metals and minerals * 90.8 84.8 66.9 61.4 63.7 66.1 68.6 71.2 86.0Base Metals ** 90.3 89.0 73.6 67.7 70.3 73.0 75.9 78.8 95.6Precious Metals 115.1 101.1 90.6 89.1 88.1 87.2 86.4 85.5 81.6
Constant 2010 US dollars (2010=100), deflated by the MUV IndexEnergy 120.1 111.7 61.4 48.7 57.5 60.5 63.2 66.1 82.3Non-energy commodities 95.9 91.6 78.0 72.7 73.1 73.7 74.2 74.8 78.0
Agriculture 100.2 97.0 84.5 80.1 80.2 80.4 80.6 80.9 82.5Beverages 78.5 96.1 88.5 82.9 81.2 79.5 78.0 76.5 69.6Food 109.0 101.4 86.0 81.5 81.9 82.3 82.7 83.2 85.7
Oils and meals 109.3 103.0 80.6 76.4 77.4 78.5 79.6 80.7 86.4Grains 120.9 98.1 84.0 78.1 79.0 80.0 81.0 82.0 87.3Other food 98.0 102.3 94.9 91.4 90.3 89.4 88.4 87.5 83.2
Raw materials 90.0 86.8 78.8 75.1 75.6 76.3 76.9 77.7 81.6Timber 96.7 99.0 90.9 86.7 87.6 88.6 89.6 90.5 95.3Other Raw Materials 82.6 73.5 65.5 62.3 62.5 62.8 63.2 63.6 66.5
Fertilizers 107.2 94.9 90.3 77.0 76.8 76.6 76.5 76.4 75.7Metals and minerals * 85.6 80.1 63.4 57.1 58.2 59.5 60.7 62.0 69.0Base Metals ** 85.2 84.1 69.7 62.9 64.3 65.7 67.2 68.7 76.7Precious Metals 108.5 95.5 85.8 82.8 80.6 78.5 76.5 74.5 65.4
Inflation indexes, 2010=100 MUV index *** 106.1 105.9 105.7 107.6 109.4 111.2 112.9 114.8 124.7
% change per annum -1.4 -0.2 -0.2 1.9 1.7 1.6 1.6 1.6 1.7US GDP deflator 105.4 106.9 108.5 110.7 113.0 115.3 117.6 120.0 132.6
% change per annum 1.5 1.3 1.6 2.0 2.0 2.0 2.0 2.0 2.0


ContentsCommodity markets outlook 43
APPEndIx B
Commodity BalancesNickel 58
Nitrogen Fertilizers 59
Palm oil and Soybean oil 60
Phosphate and Potash Fertilizers 61
Rice 62
Silver 63
Soybeans 64
Sugar 65
Tin 66
Wheat 67
Wood-based panels and Woodpulp 68
Zinc 69
Aluminum 45
Coal 46
Cocoa 47
Coffee 48
Copper 49
Cotton 50
Crude oil 51
Gold 52
Industrial roundwood and Sawnwood 53
Lead 54
Maize 55
Natural gas 56
Natural rubber 57


COMMODITY MARKETS OUTLOOK | ApRIL 2016 45APPENDIX B
Aluminum
Source: World Bureau of Metal Statistics.
Note: n/a implies data not available.
Source: World Bank.Note: Last observation is March 2016.
Source: World Bank.Note: 2016-25 are forecasts.
1980 1990 2000 2005 2010 2012 2013 2014 2015Bauxite Production (thousand metric tons)
Australia 27,179 40,697 53,801 59,959 68,535 76,282 81,119 78,633 80,910China 1,700 3,655 7,900 17,408 36,837 44,052 50,339 65,000 65,000Brazil 4,152 9,876 14,379 22,365 32,028 34,988 33,849 35,410 31,231India 1,785 5,277 7,562 12,385 12,662 15,320 20,421 20,688 26,383Malaysia 920 398 123 5 124 122 220 963 22,867Guinea 13,911 16,150 17,992 19,237 17,633 19,974 18,763 19,178 20,414Jamaica 12,064 10,937 11,127 14,118 8,540 9,339 9,435 9,677 9,629Russian Federation n/a n/a 5,000 6,409 5,475 5,166 5,322 5,589 6,580Kazakhstan n/a n/a 3,729 4,815 5,310 5,170 5,193 4,515 4,683Greece 3,286 2,496 1,991 2,495 1,902 1,815 1,844 1,876 2,100Saudi Arabia n/a n/a 0 0 0 760 1,044 1,965 1,964Surinam 4,903 3,267 3,610 4,757 3,097 2,873 2,706 2,708 1,871Venezuela, RB 0 786 4,361 5,815 3,126 2,285 2,341 2,316 1,770Others n/a n/a 7,315 7,038 33,532 39,538 64,212 11,775 10,080World 93,326 114,835 138,889 176,807 228,802 257,685 296,808 260,291 285,483
Refined Production (thousand metric tons)China 358 854 2,647 7,759 16,244 20,251 23,153 27,517 31,410Russian Federation n/a n/a 3,258 3,647 3,947 4,024 3,724 3,488 3,524Canada 1,075 1,567 2,373 2,894 2,963 2,781 2,967 2,858 2,880United Arab Emirates 35 174 536 722 1,400 1,861 1,848 2,296 2,464India 185 433 647 942 1,610 1,714 1,597 1,767 1,886Australia 304 1,233 1,761 1,903 1,928 1,864 1,778 1,704 1,645United States 4,654 4,048 3,668 2,480 1,728 2,070 1,948 1,710 1,587Norway 662 867 1,026 1,376 1,090 1,111 1,155 1,331 1,241Bahrain 126 212 509 708 851 890 913 931 961Saudi Arabia 0 0 0 0 0 0 187 665 835Brazil 261 931 1,271 1,498 1,536 1,436 1,304 962 773Iceland 75 88 226 272 826 803 736 749 756South Africa 87 157 683 851 806 665 822 745 695Others n/a n/a 5,699 6,788 6,630 6,766 6,569 6,526 6,686World 16,036 19,362 24,304 31,841 41,559 46,236 48,701 53,249 57,342
Refined Consumption (thousand metric tons)China 550 861 3,352 7,072 15,854 20,224 21,955 27,204 31,068United States 4,454 4,330 6,161 6,114 4,242 4,875 4,632 5,250 5,325Germany 1,272 1,379 1,632 1,758 1,912 2,086 2,083 2,289 2,126Japan 1,639 2,414 2,223 2,276 2,025 1,982 1,772 2,034 1,779India 234 433 601 958 1,475 1,690 1,559 1,523 1,476Korea, Rep. 68 369 823 1,201 1,255 1,278 1,241 1,282 1,366Turkey 45 152 211 390 703 925 867 915 952United Arab Emirates 0 0 34 85 650 835 835 835 835Brazil 296 341 514 759 985 1,021 988 1,027 801Others 6,754 8,947 9,456 11,022 11,317 11,013 10,563 10,945 11,353World 15,312 19,227 25,007 31,636 40,419 45,929 46,495 53,305 57,080
1,000
1,500
2,000
2,500
3,000
3,500
Jan-04 Jan-06 Jan-08 Jan-10 Jan-12 Jan-14 Jan-16
Monthly Prices (US$/mt)
500
1,000
1,500
2,000
2,500
3,000
3,500
1970 1980 1990 2000 2010 2020
Constant 2010
Nominal
Annual Prices (US$/mt)

COMMODITY MARKETS OUTLOOK | ApRIL 2016 46 APPENDIX B 46
Coal
Source: BP Statistical Review.
Notes: n/a implies data not available. Production includes crude oil and natural gas liquids but excludes liquid fuels from other sources such as biomass and derivatives of coal and natural gas included in consumption.
Source: World Bank.Note: Last observation is March 2015.
Source: World Bank.Note: 2016-25 are forecasts.
1981 1990 2000 2005 2010 2011 2012 2013 2014Production (million metric tons oil equivalent) China 311 540 707 1,241 1,665 1,853 1,872 1,894 1,845 United States 463 566 570 580 551 556 518 501 508 Indonesia 0 7 47 94 169 217 237 276 282 Australia 65 109 167 206 241 233 250 268 281 India 63 92 132 162 218 216 229 229 244 Russian Federation n/a 178 117 140 151 159 170 169 171 South Africa 75 100 127 138 144 143 147 145 148 Colombia 3 14 25 38 48 56 58 56 58 Kazakhstan n/a 68 38 44 54 56 59 58 55 Poland 98 94 71 69 55 57 59 58 55 Germany 149 125 61 57 46 47 48 45 44 Canada 23 40 39 35 35 35 36 37 37 Ukraine n/a 84 42 41 40 44 45 44 32 Vietnam 3 3 7 19 25 26 24 23 23 Turkey 7 12 12 11 18 18 17 15 18 Czech Republic 43 37 25 24 21 22 21 18 17 United Kingdom 76 55 19 12 11 11 10 8 7 Mexico 2 3 5 6 7 9 7 8 7 Greece 3 7 8 9 7 8 8 7 6 Bulgaria 5 5 4 4 5 6 6 5 5 Thailand 0 4 5 6 5 6 5 5 5 Romania 8 9 6 7 6 7 6 5 4 Brazil 3 2 3 2 2 2 3 3 3 Others n/a 111 71 72 79 83 79 86 80 World 1,855 2,265 2,310 3,018 3,604 3,869 3,913 3,961 3,933
Consumption (million metric tons oil equivalent) China 303 525 700 1,318 1,741 1,896 1,922 1,961 1,962 United States 401 483 569 574 525 495 438 455 453 India 63 95 144 184 260 270 302 324 360 Japan 64 76 99 121 124 118 124 129 127 South Africa 51 67 75 80 93 90 88 89 89 Russian Federation n/a 182 106 95 91 94 98 91 85 Korea, Rep. 15 24 43 55 76 84 81 82 85 Germany 144 132 85 81 77 78 80 82 77 Indonesia 0 3 13 24 39 47 53 58 61 Poland 91 80 58 56 56 56 54 56 53 Australia 27 37 48 54 51 50 47 45 44 Taiwan, China 4 11 29 38 40 41 41 41 41 Turkey 7 16 23 22 31 34 36 32 36 Kazakhstan n/a 40 23 27 32 34 37 36 35 Ukraine n/a 75 39 38 38 41 43 41 33 Others n/a 386 316 354 337 348 352 347 341 World 1,834 2,233 2,369 3,122 3,611 3,777 3,799 3,867 3,882
0
50
100
150
200
Jan-04 Jan-06 Jan-08 Jan-10 Jan-12 Jan-14 Jan-16
Monthly Prices (US$/mt)
0
30
60
90
120
150
1970 1980 1990 2000 2010 2020
Constant 2010
Nominal
Annual Prices (US$/mt)

COMMODITY MARKETS OUTLOOK | ApRIL 2016 47APPENDIX B
Cocoa
Source: Quarterly Bulletin of Cocoa Statistics.Notes: n/a implies data not available. 1970/71 data are average of 1968-1972.
Source: World Bank.Note: Last observation is March 2016.
Source: World Bank.Note: 2016-25 are forecasts.
1
2
3
4
Jan-04 Jan-06 Jan-08 Jan-10 Jan-12 Jan-14 Jan-16
Monthly Prices (US$/kg)
0
3
6
9
1970 1980 1990 2000 2010 2020
Constant 2010
Nominal
Annual Prices (US$/kg)
1970/71 1980/81 1990/91 2000/01 2010/11 2012/13 2013/14 2014/15 2015/16Production (thousand metric tons)
Côte d’Ivoire 179.6 417.2 804.4 1,212.4 1,511.3 1,449.0 1,746.2 1,795.9 1,690.0 Ghana 406.0 258.0 293.4 395.0 1,024.6 835.5 896.9 740.3 840.0 Indonesia 1.7 12.4 150.0 385.0 440.0 410.0 375.0 325.0 300.0 Ecuador 71.6 86.7 111.1 88.9 160.5 191.5 234.0 250.0 230.0 Cameroon 112.0 117.1 115.0 133.0 228.5 225.0 211.0 232.3 230.0 Brazil 182.4 353.0 368.1 162.8 199.8 185.3 228.2 230.0 210.0 Nigeria 304.8 155.9 160.0 180.0 240.0 238.0 248.0 195.0 200.0 Peru 2.0 7.0 11.0 16.9 54.4 69.8 80.2 83.0 85.0 Dominican Republic 34.6 34.5 42.0 44.9 54.3 68.0 70.0 82.0 72.0 Colombia 21.0 38.3 52.0 37.1 35.2 48.4 48.8 51.0 53.0 Others 212.3 213.9 399.8 195.5 360.6 222.9 233.4 245.1 244.1 World 1,528.0 1,694.0 2,506.8 2,851.5 4,309.0 3,943.4 4,371.6 4,229.6 4,154.1
Grindings (thousand metric tons)Côte d’Ivoire 34.7 60.0 118.1 285.0 360.9 471.1 519.4 558.8 575.0 Netherlands 116.4 139.6 267.7 451.9 540.0 545.0 530.0 508.0 510.0 Germany 150.7 180.0 294.2 226.6 438.5 402.0 412.0 415.0 430.0 United States 278.7 185.6 267.9 444.7 401.3 429.2 446.0 398.0 395.0 Indonesia 1.2 10.0 32.0 83.0 190.0 290.0 340.0 335.0 370.0 Ghana 48.0 27.0 29.9 70.0 229.5 225.1 234.2 233.7 235.0 Others 801.3 963.8 1,314.9 1,479.9 1,777.8 1,810.3 1,840.0 1,698.0 1,710.3 World 1,431.0 1,566.0 2,324.7 3,041.1 3,938.1 4,172.7 4,321.6 4,146.5 4,225.3
Exports (thousand metric tons)Côte d’Ivoire 138.0 405.6 688.1 903.4 1,079.3 1,045.2 1,191.8 n/a n/a Ghana 347.6 181.8 245.2 306.8 694.4 600.6 709.2 n/a n/a Ecuador 46.5 19.0 55.9 57.2 135.7 165.4 196.8 n/a n/a Nigeria 215.5 75.9 142.0 149.4 219.0 182.9 191.6 n/a n/a Cameroon 74.6 96.0 96.3 101.6 204.1 186.4 160.0 n/a n/a Indonesia 0.6 6.3 113.4 326.5 275.2 173.6 99.0 n/a n/a Others 296.2 315.3 396.2 141.9 388.3 288.7 371.9 n/a n/a World 1,118.9 1,099.8 1,737.1 1,986.7 2,995.9 2,642.9 2,920.2 n/a n/a
Imports (thousand metric tons)Netherlands 116.2 167.0 267.0 549.0 805.5 671.9 641.4 n/a n/a United States 269.0 246.3 319.7 354.7 472.0 427.9 475.2 n/a n/a Germany 154.7 187.4 299.9 228.2 433.8 272.6 318.2 n/a n/a Malaysia 0.9 n/a 0.9 109.6 320.4 305.4 315.4 n/a n/a Belgium 18.4 28.0 49.7 101.3 193.8 224.6 257.9 n/a n/a France 41.7 58.8 74.1 157.2 149.2 114.0 141.3 n/a n/a Spain 33.8 36.9 45.4 48.8 87.9 98.9 107.5 n/a n/a Italy 41.2 31.7 56.2 72.2 85.7 87.7 89.5 n/a n/a Turkey 1.2 2.0 5.9 39.1 71.1 78.3 87.8 n/a n/a Singapore 2.6 21.8 126.6 67.0 87.8 79.9 80.7 n/a n/a Others 459.7 418.2 516.0 682.3 649.4 635.0 656.1 n/a n/a World 1,139.4 1,198.1 1,761.4 2,409.5 3,356.6 2,996.2 3,171.0 n/a n/a

COMMODITY MARKETS OUTLOOK | ApRIL 2016 48 APPENDIX B
Coffee
Source: U.S. Department of Agriculture (April 2016 update).Note: n/a implies data not available.
Source: World Bank.Note: Last observation is March 2016.
Source: World Bank.Note: 2016-25 are forecasts.
1970/71 1980/81 1990/91 2000/01 2010/11 2012/13 2013/14 2014/15 2015/16Production (thousand 60kg bags)
Brazil 11,000 21,500 31,000 34,100 54,500 57,600 57,200 54,300 49,400 Vietnam 56 77 1,200 15,333 19,415 26,500 29,833 27,400 29,300 Colombia 8,000 13,500 14,500 10,500 8,525 9,927 12,075 13,300 13,400 Indonesia 2,330 5,365 7,480 6,495 9,325 10,500 9,500 8,800 10,605 Ethiopia 2,589 3,264 3,500 2,768 6,125 6,325 6,345 6,475 6,500 Honduras 545 1,265 1,685 2,821 3,975 4,725 4,400 5,000 5,900 India 1,914 1,977 2,970 5,020 5,035 5,303 5,075 5,440 5,300 Uganda 2,667 2,133 2,700 3,097 3,212 3,600 3,850 3,550 3,800 Mexico 3,200 3,862 4,550 4,800 4,000 4,650 3,950 3,300 3,400 Guatemala 1,965 2,702 3,282 4,564 3,960 4,010 3,515 3,365 3,315 Peru 1,114 1,170 1,170 2,824 4,100 4,300 4,250 2,900 3,000 Nicaragua 641 971 460 1,610 1,740 1,925 2,000 2,100 2,200 Malaysia 66 88 75 700 1,100 1,400 1,500 1,750 1,800 Costa Rica 1,295 2,140 2,565 2,502 1,575 1,675 1,450 1,400 1,350 Côte d’Ivoire 3,996 6,090 3,300 5,100 1,600 1,750 1,675 1,400 1,325 Tanzania, United Rep. 909 1,060 763 809 1,050 1,180 800 800 900 Thailand 19 201 785 1,692 850 850 850 900 900 Papua New Guinea 401 880 964 1,041 865 825 855 810 850 Kenya 999 1,568 1,455 864 710 660 850 780 840 Others 15,496 16,361 15,777 10,577 8,755 7,053 5,698 5,765 6,037 World 59,202 86,174 100,181 117,217 140,417 154,758 155,671 149,535 150,122
Consumption (thousand 60kg bags)European Union n/a n/a n/a n/a 41,350 43,275 41,475 43,630 43,850 United States n/a n/a n/a n/a 22,383 23,027 23,811 23,577 24,067 Brazil 8,890 7,975 9,000 13,100 19,420 20,110 20,210 20,330 20,330 Japan n/a n/a n/a n/a 7,015 7,505 7,750 7,825 8,125 Canada n/a n/a n/a n/a 4,245 4,230 4,605 4,505 4,800 Philippines 496 432 810 900 2,825 4,405 3,630 4,265 4,600 Russian Federation n/a n/a n/a n/a 4,355 4,130 4,230 4,050 4,075 Indonesia 888 1,228 1,295 1,335 1,690 2,670 2,790 3,050 3,090 Ethiopia 1,170 1,600 1,900 1,667 2,860 3,055 3,120 2,985 2,972 Vietnam 31 35 100 417 1,337 1,825 2,008 2,217 2,600 Korea, Rep. n/a n/a n/a n/a 1,910 1,825 2,160 2,305 2,350 Algeria n/a n/a n/a n/a 1,815 1,945 2,300 2,155 2,280 Mexico 1,512 1,500 1,400 978 2,470 2,030 2,331 1,776 2,173 China n/a n/a n/a n/a 965 1,560 1,705 1,940 1,925 Australia n/a n/a n/a n/a 1,445 1,660 1,615 1,775 1,800 Thailand 93 118 160 500 683 1,130 1,260 1,700 1,550 Switzerland n/a n/a n/a n/a 1,570 1,500 1,410 1,445 1,450 Colombia 1,349 1,825 1,615 1,530 1,120 1,200 1,300 1,515 1,350 India 665 887 1,224 959 1,231 1,100 1,200 1,200 1,250 Others n/a n/a n/a n/a 13,698 14,089 13,843 13,276 13,630 World n/a n/a n/a n/a 134,387 142,271 142,753 145,521 148,267
0
2
4
6
8
Jan-04 Jan-06 Jan-08 Jan-10 Jan-12 Jan-14 Jan-16
Monthly Prices (US$/kg)
Arabica
Robusta
0
3
6
9
12
1970 1980 1990 2000 2010 2020
Arabica
Robusta
Annual Constant 2010 Prices (US$/kg)

COMMODITY MARKETS OUTLOOK | ApRIL 2016 49APPENDIX B
Copper
Source: World Bank.Note: Last observation is March 2016.
Source: World Bank.Note: 2016-25 are forecasts.
Source: World Bureau of Metal Statistics.
Notes: n/a implies data not available. Refined production and consumption include significant recyled material.
1980 1990 2000 2005 2010 2012 2013 2014 2015Mine Production (thousand metric tons)
Chile 1,068 1,588 4,602 5,321 5,419 5,434 5,776 5,750 5,764 Peru 367 318 553 1,010 1,247 1,299 1,376 1,380 1,705 China 177 296 549 639 1,180 1,552 1,681 1,632 1,669 United States 1,181 1,587 1,440 1,157 1,129 1,196 1,279 1,383 1,373 Congo, Dem. Rep. 460 356 33 98 378 608 817 996 1,039 Australia 244 327 832 930 870 914 999 965 957 Zambia 596 496 249 441 732 782 839 756 754 Russian Federation n/a n/a 580 805 703 720 720 720 720 Canada 716 794 634 595 522 580 632 696 697 Indonesia 59 169 1,006 1,064 871 398 494 366 580 Kazakhstan n/a n/a 433 436 404 491 538 501 566 Mexico 175 291 365 391 270 500 480 514 540 Poland 343 370 454 523 425 427 429 421 426 Others n/a n/a 1,476 1,619 1,985 2,088 2,251 2,399 2,517 World 7,864 8,997 13,207 15,029 16,135 16,989 18,311 18,478 19,308
Refined Production (thousand metric tons)China 314 562 1,312 2,566 4,540 5,879 6,667 7,959 7,964 Chile 811 1,192 2,669 2,824 3,244 2,902 2,755 2,729 2,688 Japan 1,014 1,008 1,437 1,395 1,549 1,516 1,468 1,554 1,483 United States 1,686 2,017 1,802 1,257 1,093 1,001 1,040 1,095 1,135 Russian Federation n/a n/a 824 968 900 880 874 874 874 India 23 39 265 518 647 689 619 764 792 Congo, Dem. Rep. 144 173 29 3 254 453 643 742 775 Zambia 607 479 226 465 767 700 629 710 710 Germany 425 533 709 639 585 534 680 673 678 Korea, Rep. 79 187 471 527 556 590 604 604 604 Poland 357 346 486 560 547 566 565 577 574 Australia 182 274 484 471 424 461 480 511 489 Spain 154 171 316 308 347 408 351 428 426 Others n/a n/a 3,731 4,135 3,640 3,627 3,737 3,707 3,905 World 9,390 10,809 14,761 16,635 19,094 20,207 21,112 22,927 23,097
Refined Consumption (thousand metric tons)China 286 512 1,869 3,621 7,385 8,896 9,830 11,303 11,451 United States 1,868 2,150 2,979 2,264 1,760 1,758 1,826 1,767 1,792 Germany 870 1,028 1,309 1,115 1,312 1,114 1,136 1,162 1,219 Japan 1,158 1,577 1,351 1,229 1,060 985 996 1,072 993 Korea, Rep. 85 324 862 868 856 721 722 759 705 Italy 388 475 674 680 619 570 552 622 611 India 77 135 246 397 514 456 423 434 491 Turkey 33 103 248 319 369 429 453 453 475 Taiwan, China 85 265 628 638 532 432 437 465 471 Others n/a n/a 4,929 5,516 4,932 4,772 4,626 4,774 4,529
World 9,385 10,780 15,096 16,649 19,340 20,133 21,002 22,811 22,736
0
2,000
4,000
6,000
8,000
10,000
Jan-04 Jan-06 Jan-08 Jan-10 Jan-12 Jan-14 Jan-16
Monthly Prices (US$/mt)
0
2,000
4,000
6,000
8,000
10,000
1970 1980 1990 2000 2010 2020
Constant 2010
Nominal
Annual Prices (US$/mt)
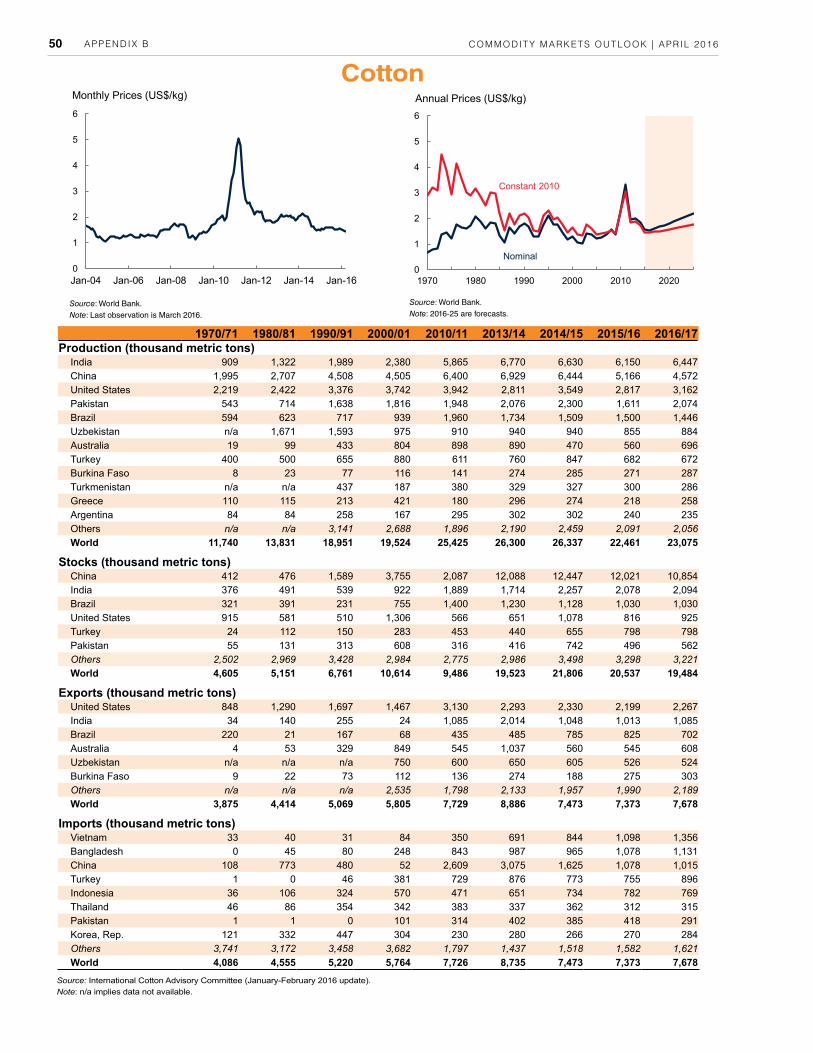
COMMODITY MARKETS OUTLOOK | ApRIL 2016 50 APPENDIX B
Cotton
Source: World Bank.Note: Last observation is March 2016.
Source: World Bank.Note: 2016-25 are forecasts.
Source: International Cotton Advisory Committee (January-February 2016 update).Note: n/a implies data not available.
0
1
2
3
4
5
6
Jan-04 Jan-06 Jan-08 Jan-10 Jan-12 Jan-14 Jan-16
Monthly Prices (US$/kg)
0
1
2
3
4
5
6
1970 1980 1990 2000 2010 2020
Constant 2010
Nominal
Annual Prices (US$/kg)
1970/71 1980/81 1990/91 2000/01 2010/11 2013/14 2014/15 2015/16 2016/17Production (thousand metric tons)
India 909 1,322 1,989 2,380 5,865 6,770 6,630 6,150 6,447 China 1,995 2,707 4,508 4,505 6,400 6,929 6,444 5,166 4,572 United States 2,219 2,422 3,376 3,742 3,942 2,811 3,549 2,817 3,162 Pakistan 543 714 1,638 1,816 1,948 2,076 2,300 1,611 2,074 Brazil 594 623 717 939 1,960 1,734 1,509 1,500 1,446 Uzbekistan n/a 1,671 1,593 975 910 940 940 855 884 Australia 19 99 433 804 898 890 470 560 696 Turkey 400 500 655 880 611 760 847 682 672 Burkina Faso 8 23 77 116 141 274 285 271 287 Turkmenistan n/a n/a 437 187 380 329 327 300 286 Greece 110 115 213 421 180 296 274 218 258 Argentina 84 84 258 167 295 302 302 240 235 Others n/a n/a 3,141 2,688 1,896 2,190 2,459 2,091 2,056 World 11,740 13,831 18,951 19,524 25,425 26,300 26,337 22,461 23,075
Stocks (thousand metric tons)China 412 476 1,589 3,755 2,087 12,088 12,447 12,021 10,854 India 376 491 539 922 1,889 1,714 2,257 2,078 2,094 Brazil 321 391 231 755 1,400 1,230 1,128 1,030 1,030 United States 915 581 510 1,306 566 651 1,078 816 925 Turkey 24 112 150 283 453 440 655 798 798 Pakistan 55 131 313 608 316 416 742 496 562 Others 2,502 2,969 3,428 2,984 2,775 2,986 3,498 3,298 3,221 World 4,605 5,151 6,761 10,614 9,486 19,523 21,806 20,537 19,484
Exports (thousand metric tons)United States 848 1,290 1,697 1,467 3,130 2,293 2,330 2,199 2,267 India 34 140 255 24 1,085 2,014 1,048 1,013 1,085 Brazil 220 21 167 68 435 485 785 825 702 Australia 4 53 329 849 545 1,037 560 545 608 Uzbekistan n/a n/a n/a 750 600 650 605 526 524 Burkina Faso 9 22 73 112 136 274 188 275 303 Others n/a n/a n/a 2,535 1,798 2,133 1,957 1,990 2,189 World 3,875 4,414 5,069 5,805 7,729 8,886 7,473 7,373 7,678
Imports (thousand metric tons)Vietnam 33 40 31 84 350 691 844 1,098 1,356 Bangladesh 0 45 80 248 843 987 965 1,078 1,131 China 108 773 480 52 2,609 3,075 1,625 1,078 1,015 Turkey 1 0 46 381 729 876 773 755 896 Indonesia 36 106 324 570 471 651 734 782 769 Thailand 46 86 354 342 383 337 362 312 315 Pakistan 1 1 0 101 314 402 385 418 291 Korea, Rep. 121 332 447 304 230 280 266 270 284 Others 3,741 3,172 3,458 3,682 1,797 1,437 1,518 1,582 1,621 World 4,086 4,555 5,220 5,764 7,726 8,735 7,473 7,373 7,678

COMMODITY MARKETS OUTLOOK | ApRIL 2016 51APPENDIX B
Crude oil
Source: BP Statistical Review.
Notes: n/a implies data not available. Production includes crude oil and natural gas liquids but excludes liquid fuels from other sources such as biomass and derivatives of coal and natural gas included in consumption.
Source: World Bank.Note: Last observation is March 2016.
Source: World Bank.Note: 2016-25 are forecasts.
1970 1980 1990 2000 2010 2011 2012 2013 2014Production (thousand barrels per day)
United States 11,297 10,170 8,914 7,732 7,556 7,861 8,904 10,069 11,644 Saudi Arabia 3,851 10,270 7,105 9,470 10,075 11,144 11,635 11,393 11,505 Russian Federation n/a n/a 10,342 6,583 10,366 10,516 10,640 10,777 10,838 Canada 1,473 1,764 1,968 2,703 3,332 3,515 3,740 3,977 4,292 China 616 2,122 2,778 3,257 4,077 4,074 4,155 4,216 4,246 United Arab Emirates 762 1,745 2,283 2,660 2,895 3,325 3,406 3,648 3,712 Iran, Islamic Rep. 3,848 1,479 3,270 3,852 4,352 4,373 3,742 3,525 3,614 Iraq 1,549 2,658 2,149 2,613 2,490 2,801 3,116 3,141 3,285 Kuwait 3,036 1,757 964 2,244 2,562 2,915 3,172 3,135 3,123 Mexico 487 2,129 2,941 3,456 2,959 2,940 2,911 2,875 2,784 Venezuela, RB 3,754 2,228 2,244 3,097 2,838 2,734 2,704 2,687 2,719 Nigeria 1,084 2,059 1,870 2,159 2,509 2,450 2,395 2,302 2,361 Brazil 167 188 650 1,271 2,137 2,193 2,149 2,114 2,346 Qatar 363 476 434 853 1,655 1,850 1,968 1,998 1,982 Norway 0 528 1,716 3,346 2,136 2,040 1,917 1,838 1,895 Angola 103 150 475 746 1,863 1,726 1,784 1,799 1,712 Kazakhstan n/a n/a 571 740 1,672 1,684 1,662 1,720 1,701 Algeria 1,052 1,139 1,347 1,549 1,689 1,642 1,537 1,485 1,525 Colombia 226 131 446 687 786 915 944 1,004 990 Oman 332 285 695 961 865 885 918 942 943 India 140 193 715 726 882 916 906 906 895 Indonesia 854 1,577 1,539 1,456 1,003 952 918 882 852 United Kingdom 4 1,676 1,933 2,714 1,361 1,116 949 867 850 Others n/a n/a 8,037 10,051 11,128 9,413 9,977 9,280 8,857 World 48,056 62,959 65,385 74,925 83,190 83,980 86,150 86,579 88,673
Consumption (thousand barrels per day)United States 14,710 17,062 16,988 19,701 19,180 18,882 18,490 18,961 19,035 China 556 1,690 2,320 4,766 9,266 9,791 10,231 10,664 11,056 Japan 3,876 4,905 5,240 5,542 4,442 4,439 4,688 4,521 4,298 India 391 644 1,213 2,261 3,319 3,488 3,685 3,727 3,846 Brazil 523 1,163 1,478 2,056 2,701 2,813 2,860 3,048 3,229 Russian Federation n/a n/a 5,042 2,542 2,895 3,096 3,137 3,179 3,196 Saudi Arabia 408 607 1,158 1,578 2,793 2,838 2,991 3,000 3,185 Korea, Rep. 162 476 1,042 2,263 2,370 2,394 2,458 2,455 2,456 Germany 2,774 3,020 2,689 2,746 2,445 2,369 2,356 2,408 2,371 Canada 1,472 1,898 1,747 2,043 2,316 2,404 2,372 2,383 2,371 Iran, Islamic Rep. 222 591 1,070 1,457 1,874 1,910 1,928 2,038 2,024 Mexico 412 1,048 1,580 1,965 2,014 2,043 2,063 2,020 1,941 Indonesia 138 396 653 1,137 1,458 1,567 1,599 1,615 1,641 France 1,867 2,221 1,895 1,994 1,763 1,730 1,676 1,664 1,615 United Kingdom 2,030 1,647 1,754 1,704 1,588 1,532 1,520 1,494 1,501 Others n/a n/a 20,868 23,112 27,442 27,679 27,789 28,065 28,320 World 45,348 61,233 66,737 76,868 87,867 88,974 89,846 91,243 92,086
0
30
60
90
120
150
1970 1980 1990 2000 2010 2020
Constant 2010
Nominal
Annual Prices (US$/bbl)
0
30
60
90
120
150
Jan-04 Jan-06 Jan-08 Jan-10 Jan-12 Jan-14 Jan-16
Monthly Prices (US$/bbl)

COMMODITY MARKETS OUTLOOK | ApRIL 2016 52 APPENDIX B
Gold
Source: World Bank.Note: Last observation is March 2016.
Source: World Bank.Note: 2016-25 are forecasts.
Sources: World Bureau of Metal Statistics and Thomson Reuters.Notes: n/a implies data not available. Fabrication includes the use of scrap. Fabrication of "Saudi Arabia" includes Saudi Arabia and Yemen in 1995 and 2000.
1995 2000 2005 2010 2011 2012 2013 2014 2015Production (metric tons)
China 136 175 209 341 361 403 428 452 450 Australia 247 296 263 260 258 252 267 274 285 Russian Federation 128 144 163 201 185 183 230 249 249 United States 317 353 256 231 234 235 230 210 213 Canada 152 156 121 91 100 105 125 152 159 Peru 56 134 206 164 164 162 151 141 145 South Africa 522 428 297 191 187 154 169 152 144 Mexico 20 24 30 79 89 103 120 118 125 Ghana 53 72 67 93 88 99 95 136 113 Uzbekistan 70 88 84 90 91 93 98 102 102 Indonesia 63 125 158 106 77 69 60 69 97 Argentina 1 26 28 64 59 55 52 72 71 Kazakhstan 11 27 18 30 37 40 42 49 64 Papua New Guinea 52 73 67 67 62 58 63 56 62 Colombia 22 37 36 54 56 66 56 57 58 Tanzania 0 15 48 39 37 40 43 41 46 Mali 8 29 44 39 36 41 41 45 44 Brazil 64 61 38 62 65 67 80 78 42 Chile 44 54 40 39 45 50 49 46 41 Others 206 242 291 352 404 439 482 563 519 World 2,174 2,560 2,464 2,594 2,635 2,713 2,881 3,061 3,027
Fabrication (metric tons) India 426 704 695 783 761 736 716 771 812 China 217 213 277 523 651 698 1,058 731 668 Turkey 126 228 303 109 136 114 178 156 112 United States 245 277 219 179 167 147 160 152 164 Japan 189 161 165 158 147 126 124 119 102 Italy 458 522 290 126 103 96 92 96 94 Russian Federation n/a 34 61 61 66 72 74 70 51 South Korea 82 107 83 68 62 54 49 61 56 Switzerland 47 54 56 41 48 48 48 44 41 Indonesia 133 99 87 39 39 44 52 49 43 Egypt, Arab Rep. 61 107 71 43 30 39 42 42 39 Malaysia 78 86 74 44 37 35 45 41 36 Saudi Arabia 156 153 125 47 37 33 41 37 41 Germany 71 64 52 41 39 36 37 36 36 United Arab Emirates 30 50 55 33 28 28 38 36 39 South Africa 12 14 10 25 27 27 31 25 31 Canada 28 25 27 44 45 32 45 32 40 Iran, Islamic Rep. 37 46 41 39 37 37 42 36 30 Singapore 22 26 30 25 24 22 25 26 26 Others 877 791 605 401 373 344 373 334 331 World 3,294 3,761 3,325 2,827 2,858 2,767 3,269 2,891 2,790
0
300
600
900
1,200
1,500
1,800
Jan-04 Jan-06 Jan-08 Jan-10 Jan-12 Jan-14 Jan-16
Monthly Prices (US$/toz)
0
300
600
900
1,200
1,500
1,800
1970 1980 1990 2000 2010 2020
Constant 2010
Nominal
Annual Prices (US$/toz)
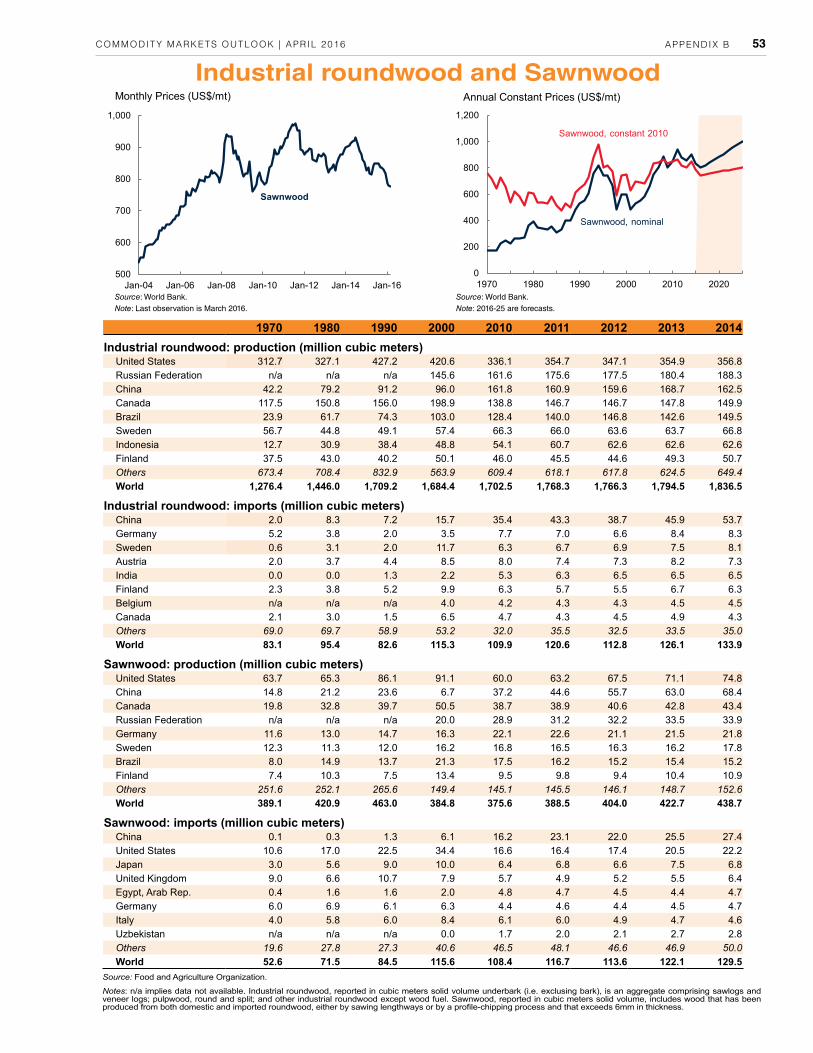
COMMODITY MARKETS OUTLOOK | ApRIL 2016 53APPENDIX B
Industrial roundwood and Sawnwood
Source: Food and Agriculture Organization.
Notes: n/a implies data not available. Industrial roundwood, reported in cubic meters solid volume underbark (i.e. exclusing bark), is an aggregate comprising sawlogs and veneer logs; pulpwood, round and split; and other industrial roundwood except wood fuel. Sawnwood, reported in cubic meters solid volume, includes wood that has been produced from both domestic and imported roundwood, either by sawing lengthways or by a profile-chipping process and that exceeds 6mm in thickness.
Source: World Bank.Note: Last observation is March 2016.
Source: World Bank.Note: 2016-25 are forecasts.
500
600
700
800
900
1,000
Jan-04 Jan-06 Jan-08 Jan-10 Jan-12 Jan-14 Jan-16
Monthly Prices (US$/mt)
Sawnwood
0
200
400
600
800
1,000
1,200
1970 1980 1990 2000 2010 2020
Sawnwood, constant 2010
Sawnwood, nominal
Annual Constant Prices (US$/mt)
1970 1980 1990 2000 2010 2011 2012 2013 2014Industrial roundwood: production (million cubic meters)
United States 312.7 327.1 427.2 420.6 336.1 354.7 347.1 354.9 356.8 Russian Federation n/a n/a n/a 145.6 161.6 175.6 177.5 180.4 188.3 China 42.2 79.2 91.2 96.0 161.8 160.9 159.6 168.7 162.5 Canada 117.5 150.8 156.0 198.9 138.8 146.7 146.7 147.8 149.9 Brazil 23.9 61.7 74.3 103.0 128.4 140.0 146.8 142.6 149.5 Sweden 56.7 44.8 49.1 57.4 66.3 66.0 63.6 63.7 66.8 Indonesia 12.7 30.9 38.4 48.8 54.1 60.7 62.6 62.6 62.6 Finland 37.5 43.0 40.2 50.1 46.0 45.5 44.6 49.3 50.7 Others 673.4 708.4 832.9 563.9 609.4 618.1 617.8 624.5 649.4 World 1,276.4 1,446.0 1,709.2 1,684.4 1,702.5 1,768.3 1,766.3 1,794.5 1,836.5
Industrial roundwood: imports (million cubic meters)China 2.0 8.3 7.2 15.7 35.4 43.3 38.7 45.9 53.7 Germany 5.2 3.8 2.0 3.5 7.7 7.0 6.6 8.4 8.3 Sweden 0.6 3.1 2.0 11.7 6.3 6.7 6.9 7.5 8.1 Austria 2.0 3.7 4.4 8.5 8.0 7.4 7.3 8.2 7.3 India 0.0 0.0 1.3 2.2 5.3 6.3 6.5 6.5 6.5 Finland 2.3 3.8 5.2 9.9 6.3 5.7 5.5 6.7 6.3 Belgium n/a n/a n/a 4.0 4.2 4.3 4.3 4.5 4.5 Canada 2.1 3.0 1.5 6.5 4.7 4.3 4.5 4.9 4.3 Others 69.0 69.7 58.9 53.2 32.0 35.5 32.5 33.5 35.0 World 83.1 95.4 82.6 115.3 109.9 120.6 112.8 126.1 133.9
Sawnwood: production (million cubic meters)United States 63.7 65.3 86.1 91.1 60.0 63.2 67.5 71.1 74.8 China 14.8 21.2 23.6 6.7 37.2 44.6 55.7 63.0 68.4 Canada 19.8 32.8 39.7 50.5 38.7 38.9 40.6 42.8 43.4 Russian Federation n/a n/a n/a 20.0 28.9 31.2 32.2 33.5 33.9 Germany 11.6 13.0 14.7 16.3 22.1 22.6 21.1 21.5 21.8 Sweden 12.3 11.3 12.0 16.2 16.8 16.5 16.3 16.2 17.8 Brazil 8.0 14.9 13.7 21.3 17.5 16.2 15.2 15.4 15.2 Finland 7.4 10.3 7.5 13.4 9.5 9.8 9.4 10.4 10.9 Others 251.6 252.1 265.6 149.4 145.1 145.5 146.1 148.7 152.6 World 389.1 420.9 463.0 384.8 375.6 388.5 404.0 422.7 438.7
Sawnwood: imports (million cubic meters)China 0.1 0.3 1.3 6.1 16.2 23.1 22.0 25.5 27.4 United States 10.6 17.0 22.5 34.4 16.6 16.4 17.4 20.5 22.2 Japan 3.0 5.6 9.0 10.0 6.4 6.8 6.6 7.5 6.8 United Kingdom 9.0 6.6 10.7 7.9 5.7 4.9 5.2 5.5 6.4 Egypt, Arab Rep. 0.4 1.6 1.6 2.0 4.8 4.7 4.5 4.4 4.7 Germany 6.0 6.9 6.1 6.3 4.4 4.6 4.4 4.5 4.7 Italy 4.0 5.8 6.0 8.4 6.1 6.0 4.9 4.7 4.6 Uzbekistan n/a n/a n/a 0.0 1.7 2.0 2.1 2.7 2.8 Others 19.6 27.8 27.3 40.6 46.5 48.1 46.6 46.9 50.0 World 52.6 71.5 84.5 115.6 108.4 116.7 113.6 122.1 129.5

COMMODITY MARKETS OUTLOOK | ApRIL 2016 54 APPENDIX B
Lead
Source: World Bureau of Metal Statistics.
Notes: n/a implies data not available. Refined production and consumption include significant recyled material.
Source: World Bank.Note: Last observation is March 2016.
Source: World Bank.Note: 2016-25 are forecasts.
1980 1990 2000 2005 2010 2012 2013 2014 2015Mine Production (thousand metric tons)
China 160 364 660 1,142 1,981 2,613 2,697 2,853 2,340 Australia 398 570 678 767 712 639 711 728 689 United States 562 493 447 437 356 336 343 385 375 Peru 189 188 271 319 262 249 266 278 316 Mexico 146 174 138 134 192 238 253 250 254 Russian Federation n/a n/a 13 36 97 151 165 194 188 India 15 26 38 60 91 115 106 105 139 Sweden 72 84 107 61 68 64 60 71 79 Bolivia 16 20 10 11 73 81 82 76 79 Poland 48 45 51 51 48 73 74 77 77 Turkey 8 18 16 19 39 54 78 65 77 Korea, Dem. People’s Rep. 125 70 26 20 27 38 59 45 48 Iran, Islamic Rep. 12 9 17 22 32 36 40 45 46 Others n/a n/a 610 372 396 427 384 388 352 World 3,595 3,150 3,080 3,453 4,374 5,115 5,317 5,561 5,059
Refined Production (thousand metric tons)China 175 297 1,100 2,359 4,157 4,591 4,935 4,740 3,858 United States 1,151 1,291 1,431 1,293 1,255 1,221 1,308 1,120 1,127 Korea, Rep. 15 80 222 254 321 460 522 670 616 India 26 39 57 56 366 461 462 477 442 Germany 392 394 387 342 405 426 400 380 377 United Kingdom 325 329 328 304 301 312 296 267 351 Mexico 149 238 332 272 317 334 321 313 310 Canada 231 184 284 230 273 279 284 282 269 Japan 305 327 312 275 267 259 252 240 232 Australia 234 229 223 267 210 206 233 226 223 Italy 134 171 237 211 150 138 180 210 210 Spain 121 124 120 110 163 160 160 162 162 Brazil 85 76 86 121 115 165 152 160 160 Others 2,083 1,683 1,582 1,572 1,531 1,572 1,675 1,670 1,768 World 5,424 5,460 6,701 7,665 9,832 10,585 11,180 10,917 10,106
Refined Consumption (thousand metric tons)China 210 244 660 1,974 4,171 4,618 4,927 4,718 3,816 United States 1,094 1,275 1,660 1,490 1,430 1,360 1,750 1,670 1,608 Korea, Rep. 54 80 309 376 382 429 550 601 536 India 33 147 56 139 420 524 428 521 484 Germany 433 448 390 330 343 381 392 337 357 Japan 393 416 343 291 224 273 252 254 263 Italy 275 258 283 262 245 195 235 258 232 Spain 111 115 219 279 262 244 257 245 228 Brazil 83 75 155 189 201 238 234 229 224 Others 2,663 2,290 2,416 2,447 2,130 2,126 2,195 2,121 2,227 World 5,348 5,348 6,491 7,777 9,807 10,388 11,222 10,955 9,976
0
1,000
2,000
3,000
4,000
Jan-04 Jan-06 Jan-08 Jan-10 Jan-12 Jan-14 Jan-16
Monthly Prices (US$/mt)
0
500
1,000
1,500
2,000
2,500
3,000
1970 1980 1990 2000 2010 2020
Constant 2010
Nominal
Annual Prices (US$/mt)

COMMODITY MARKETS OUTLOOK | ApRIL 2016 55APPENDIX B
Maize
Source: U.S. Department of Agriculture (April 2016 update).
Notes: n/a implies data not available. The trade year is January-December of the later year of the split. For example, 1970/71 refers to calendar year 1971.
Source: World Bank.Note: Last observation is March 2016.
Source: World Bank.Note: 2016-25 are forecasts.
0
100
200
300
400
Jan-04 Jan-06 Jan-08 Jan-10 Jan-12 Jan-14 Jan-16
Monthly Prices (US$/mt)
0
100
200
300
400
1970 1980 1990 2000 2010 2020
Constant 2010
Nominal
Annual Prices (US$/mt)
1970/71 1980/81 1990/91 2000/01 2010/11 2012/13 2013/14 2014/15 2015/16Production (million metric tons)
United States 105.5 168.6 201.5 251.9 315.6 273.2 351.3 361.1 345.5 China 33.0 62.6 96.8 106.0 177.2 205.6 218.5 215.6 224.6 Brazil 14.1 22.6 24.3 41.5 57.4 81.5 80.0 85.0 84.0 European Union 29.8 42.5 36.6 51.9 58.3 58.9 64.6 75.5 57.5 Argentina 9.9 12.9 7.7 15.4 25.2 27.0 26.0 28.7 28.0 Mexico 8.9 10.4 14.1 17.9 21.1 21.6 22.9 25.5 24.0 Ukraine n/a n/a 4.7 3.8 11.9 20.9 30.9 28.5 23.3 India 7.5 7.0 9.0 12.0 21.7 22.3 24.3 24.2 21.0 Canada 2.6 5.8 7.1 7.0 12.0 13.1 14.2 11.5 13.6 Russian Federation n/a n/a 2.5 1.5 3.1 8.2 11.6 11.3 13.2 Indonesia 2.8 4.0 5.0 5.9 6.8 8.5 9.1 9.0 9.4 Philippines 2.0 3.1 5.1 4.5 7.3 7.3 7.5 7.7 7.5 Nigeria 1.3 1.7 5.8 4.0 8.8 7.6 7.7 7.5 7.0 Others 80.4 110.1 98.4 68.5 109.1 113.9 121.9 121.8 113.6 World 297.9 451.3 518.6 591.8 835.5 869.5 990.5 1,012.8 972.1
Stocks (million metric tons)China 8.9 42.8 82.8 102.4 49.4 67.6 81.3 100.5 109.5 United States 16.8 35.4 38.6 48.2 28.6 20.9 31.3 44.0 47.3 Brazil 2.0 1.3 0.8 2.7 6.3 9.2 14.0 7.9 6.5 European Union 2.3 4.8 3.7 3.2 5.2 5.1 6.8 9.3 6.4 Iran, Islamic Rep. n/a 0.1 0.0 0.9 2.8 3.2 4.5 5.8 5.5 Others 8.4 22.9 19.1 17.8 31.2 27.4 37.1 40.1 33.8 World 38.4 107.4 145.1 175.3 123.6 133.4 175.0 207.6 208.9
Exports (million metric tons)United States 12.9 60.7 43.9 49.3 46.5 18.5 48.8 47.4 41.9 Brazil 0.9 0.0 0.0 6.3 8.4 24.9 21.0 34.5 28.0 Argentina 6.4 9.1 4.0 9.7 16.3 18.7 17.1 18.9 19.0 Ukraine n/a n/a 0.4 0.4 5.0 12.7 20.0 19.7 15.7 Russian Federation n/a n/a 0.4 0.0 0.0 1.9 4.2 3.2 4.1 Paraguay 0.0 0.0 0.0 0.6 1.6 2.8 2.4 3.3 2.3 Serbia n/a n/a n/a n/a 2.0 0.6 1.7 3.0 1.7 Others 11.9 10.5 9.8 10.5 11.4 14.9 15.9 11.8 9.6 World 32.2 80.3 58.4 76.7 91.3 95.1 131.1 141.7 122.3
Imports (million metric tons)European Union 18.9 26.6 5.7 3.7 7.4 11.4 16.0 8.6 15.0 Japan 5.2 14.0 16.3 16.3 15.6 14.4 15.1 14.7 14.7 Mexico 0.1 3.8 1.9 6.0 8.3 5.7 11.0 11.3 12.0 Korea, Rep. 0.3 2.4 5.6 8.7 8.1 8.2 10.4 10.2 10.0 Egypt, Arab Rep. 0.1 1.0 1.9 5.3 5.8 5.1 8.7 7.8 8.3 Vietnam 0.1 0.1 0.0 0.1 1.3 1.7 2.4 3.5 5.0 Iran, Islamic Rep. 0.0 0.4 0.8 1.3 3.5 3.7 5.5 6.2 5.0 Others 22.6 52.6 32.0 33.5 42.6 49.7 54.9 61.2 60.0 World 47.3 100.9 64.3 74.9 92.6 99.8 124.0 123.5 130.0

COMMODITY MARKETS OUTLOOK | ApRIL 2016 56 APPENDIX B
Natural gas
Source: BP Statistical Review.Note: n/a implies data not available.
Source: World Bank.Note: Last observation is March 2016.
Source: World Bank.Note: 2016-25 are forecasts.
1970 1980 1990 2000 2010 2011 2012 2013 2014Production (billion cubic metres)
United States 595 549 504 543 604 649 681 689 728 Russian Federation n/a n/a 590 529 589 607 592 605 579 Qatar 1 5 6 24 126 161 170 176 177 Iran, Islamic Rep. 4 5 26 60 152 160 166 164 173 Canada 57 75 109 182 160 160 156 156 162 China 3 15 16 28 99 109 114 125 134 Norway 0 25 25 50 107 101 115 109 109 Saudi Arabia 2 10 34 50 88 92 99 100 108 Algeria 3 14 49 84 80 83 82 82 83 Indonesia 1 19 44 70 86 81 77 72 73 Turkmenistan n/a n/a 79 43 42 60 62 62 69 Malaysia 0 2 17 47 63 62 62 67 66 Mexico 11 26 27 38 58 58 57 58 58 United Arab Emirates 1 8 20 38 51 52 54 55 58 Uzbekistan n/a n/a 37 51 54 57 57 57 57 Netherlands 27 76 61 58 71 64 64 69 56 Australia 2 11 21 31 46 47 52 53 55 Egypt, Arab Rep. 0 2 8 21 61 61 61 56 49 Thailand 0 0 7 20 36 37 41 42 42 Trinidad & Tobago 2 3 5 16 45 43 43 43 42 Pakistan 3 7 12 22 42 42 44 43 42 Nigeria 0 2 4 12 37 41 43 36 39 United Kingdom 10 35 45 108 57 45 39 36 37 Others n/a n/a 236 293 448 443 450 454 464 World 992 1,435 1,983 2,416 3,203 3,316 3,380 3,409 3,461
Consumption (billion cubic metres)United States 599 563 543 661 682 693 723 740 759 Russian Federation n/a n/a 408 360 414 425 416 413 409 China 3 15 16 25 110 135 151 171 185 Iran, Islamic Rep. 3 5 24 63 153 162 162 159 170 Japan 3 24 48 72 95 105 114 114 112 Saudi Arabia 2 10 34 50 88 92 99 100 108 Canada 36 52 67 93 95 101 100 104 104 Mexico 10 23 28 41 72 77 80 85 86 Germany 15 57 60 79 83 75 78 82 71 United Arab Emirates 1 5 17 31 61 63 66 67 69 United Kingdom 11 45 52 97 94 78 74 73 67 Italy 14 25 43 65 76 71 69 64 57 Thailand 0 0 7 22 45 47 51 52 53 India 1 1 12 26 63 64 59 51 51 Uzbekistan n/a n/a 36 46 41 48 47 47 49 Others n/a n/a 565 686 1,021 1,030 1,057 1,058 1,042 World 980 1,436 1,958 2,418 3,194 3,265 3,346 3,381 3,393
0
5
10
15
20
Jan-04 Jan-06 Jan-08 Jan-10 Jan-12 Jan-14 Jan-16
Monthly Prices (US$/mmbtu)
Japan
Europe
US
0
5
10
15
20
1980 1990 2000 2010 2020
Japan
US
Annual Constant 2010 Prices (US$/mmbtu)
Europe
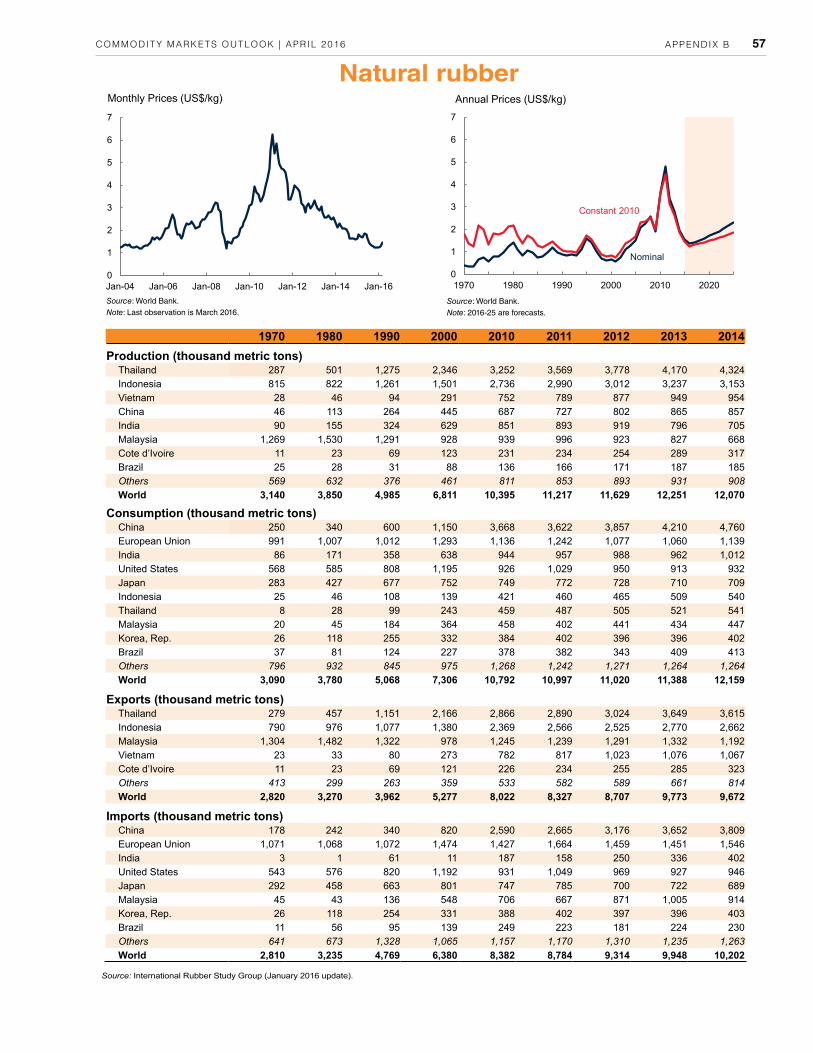
COMMODITY MARKETS OUTLOOK | ApRIL 2016 57APPENDIX B
Natural rubber
Source: International Rubber Study Group (January 2016 update).
Source: World Bank.Note: Last observation is March 2016.
Source: World Bank.Note: 2016-25 are forecasts.
0
1
2
3
4
5
6
7
Jan-04 Jan-06 Jan-08 Jan-10 Jan-12 Jan-14 Jan-16
Monthly Prices (US$/kg)
0
1
2
3
4
5
6
7
1970 1980 1990 2000 2010 2020
Constant 2010
Nominal
Annual Prices (US$/kg)
1970 1980 1990 2000 2010 2011 2012 2013 2014Production (thousand metric tons)
Thailand 287 501 1,275 2,346 3,252 3,569 3,778 4,170 4,324 Indonesia 815 822 1,261 1,501 2,736 2,990 3,012 3,237 3,153 Vietnam 28 46 94 291 752 789 877 949 954 China 46 113 264 445 687 727 802 865 857 India 90 155 324 629 851 893 919 796 705 Malaysia 1,269 1,530 1,291 928 939 996 923 827 668 Cote d’Ivoire 11 23 69 123 231 234 254 289 317 Brazil 25 28 31 88 136 166 171 187 185 Others 569 632 376 461 811 853 893 931 908 World 3,140 3,850 4,985 6,811 10,395 11,217 11,629 12,251 12,070
Consumption (thousand metric tons)China 250 340 600 1,150 3,668 3,622 3,857 4,210 4,760 European Union 991 1,007 1,012 1,293 1,136 1,242 1,077 1,060 1,139 India 86 171 358 638 944 957 988 962 1,012 United States 568 585 808 1,195 926 1,029 950 913 932 Japan 283 427 677 752 749 772 728 710 709 Indonesia 25 46 108 139 421 460 465 509 540 Thailand 8 28 99 243 459 487 505 521 541 Malaysia 20 45 184 364 458 402 441 434 447 Korea, Rep. 26 118 255 332 384 402 396 396 402 Brazil 37 81 124 227 378 382 343 409 413 Others 796 932 845 975 1,268 1,242 1,271 1,264 1,264 World 3,090 3,780 5,068 7,306 10,792 10,997 11,020 11,388 12,159
Exports (thousand metric tons)Thailand 279 457 1,151 2,166 2,866 2,890 3,024 3,649 3,615 Indonesia 790 976 1,077 1,380 2,369 2,566 2,525 2,770 2,662 Malaysia 1,304 1,482 1,322 978 1,245 1,239 1,291 1,332 1,192 Vietnam 23 33 80 273 782 817 1,023 1,076 1,067 Cote d’Ivoire 11 23 69 121 226 234 255 285 323 Others 413 299 263 359 533 582 589 661 814 World 2,820 3,270 3,962 5,277 8,022 8,327 8,707 9,773 9,672
Imports (thousand metric tons)China 178 242 340 820 2,590 2,665 3,176 3,652 3,809 European Union 1,071 1,068 1,072 1,474 1,427 1,664 1,459 1,451 1,546 India 3 1 61 11 187 158 250 336 402 United States 543 576 820 1,192 931 1,049 969 927 946 Japan 292 458 663 801 747 785 700 722 689 Malaysia 45 43 136 548 706 667 871 1,005 914 Korea, Rep. 26 118 254 331 388 402 397 396 403 Brazil 11 56 95 139 249 223 181 224 230 Others 641 673 1,328 1,065 1,157 1,170 1,310 1,235 1,263 World 2,810 3,235 4,769 6,380 8,382 8,784 9,314 9,948 10,202

COMMODITY MARKETS OUTLOOK | ApRIL 2016 58 APPENDIX B
Nickel
Source: World Bank.Note: Last observation is March 2016.
Source: World Bank.Note: 2016-25 are forecasts.
Source: World Bureau of Metal Statistics.
Note: n/a implies data not available.
1980 1990 2000 2005 2010 2012 2013 2014 2015Mine Production (thousand metric tons)
Philippines 38 16 17 27 184 318 316 411 317 Russian Federation n/a n/a 266 289 274 269 264 264 264 Canada 189 196 191 200 160 212 223 235 235 Australia 74 67 170 186 170 244 256 245 220 New Caledonia 87 85 129 112 130 132 150 178 186 Indonesia 41 69 117 156 216 622 811 146 106 China 11 33 51 59 80 93 93 92 92 Brazil 3 13 32 38 54 90 74 86 83 South Africa 26 30 37 42 40 46 51 55 57 Cuba 38 41 71 74 65 65 62 50 49 Madagascar 0 0 0 0 0 6 25 37 47 Guatemala 7 0 0 0 0 2 9 36 46 Colombia 0 0 28 53 49 52 49 41 37 Others n/a n/a 82 120 95 117 118 131 145 World 749 888 1,191 1,356 1,518 2,266 2,504 2,006 1,884
Refined Production (thousand metric tons)China 11 28 52 97 314 591 711 644 575 Russian Federation n/a n/a 242 264 263 254 242 239 233 Japan 109 103 161 164 166 170 178 178 193 Canada 145 127 134 140 105 152 153 151 163 Australia 35 43 112 122 102 129 142 138 128 Norway 37 58 59 85 92 92 91 91 91 New Caledonia 33 32 44 47 40 45 48 62 78 Brazil 3 13 23 30 28 59 56 73 72 Madagascar 0 0 0 0 0 6 25 37 47 Finland 13 17 54 41 49 46 44 43 43 United Kingdom 19 27 38 38 32 39 42 39 39 Korea, Rep. n/a n/a 0 0 23 24 28 25 37 Colombia 0 18 28 53 49 52 49 41 37 Others n/a n/a 164 208 174 200 194 186 181 World 743 858 1,110 1,288 1,437 1,858 2,005 1,946 1,916
Refined Consumption (thousand metric tons)China 18 28 58 197 489 805 909 761 964 Japan 122 159 192 180 177 159 159 157 159 United States 142 127 153 128 119 126 123 152 152 Taiwan, China 0 18 106 84 73 57 53 66 87 Korea, Rep. 0 24 91 118 101 108 107 100 83 Italy 27 27 53 85 62 65 59 60 60 Germany 78 93 102 116 100 89 66 62 60 India 12 14 23 16 27 33 37 27 37 Belgium 4 21 32 50 21 19 26 29 35 Others n/a n/a 342 344 257 275 259 285 295 World 717 842 1,150 1,317 1,427 1,734 1,798 1,700 1,933
0
20,000
40,000
60,000
Jan-04 Jan-06 Jan-08 Jan-10 Jan-12 Jan-14 Jan-16
Monthly Prices (US$/mt)
0
10,000
20,000
30,000
40,000
50,000
1970 1980 1990 2000 2010 2020
Constant 2010
Nominal
Annual Prices (US$/mt)

COMMODITY MARKETS OUTLOOK | ApRIL 2016 59APPENDIX B
Nitrogen Fertilizers
Source: World Bank.Note: Last observation is March 2016.
Source: World Bank.Note: 2016-25 are forecasts.
Sources: International Fertilizer Industry Association (http://ifadata.fertilizer.org/ucSearch.aspx).
Notes: n/a implies data not available. The statistics are based on the nutrient content. All production statistics are expressed on a calendar-year basis, while consumption statistics are expressed either on a calendar- or on a fertilizer-year basis (see www.fertilizers.org for details).
0.0
200.0
400.0
600.0
800.0
Jan-04 Jan-06 Jan-08 Jan-10 Jan-12 Jan-14 Jan-16
Monthly Prices (US$/mt)
Urea
0
200
400
600
800
1970 1980 1990 2000 2010 2020
Annual Constant Prices (US$/mt)
Urea, nominal
Urea, constant 2010
1970 1980 1990 2000 2009 2010 2011 2012 2013Production (thousand tonnes nutrients)
China 1,200 9,993 14,637 22,175 36,009 35,678 36,323 36,056 36,810India 838 2,164 6,993 10,943 11,924 12,178 12,288 12,237 12,409United States 8,161 12,053 10,816 8,352 9,722 9,587 9,414 10,150 9,280Russian Federation n/a n/a n/a 5,452 6,052 6,544 6,917 6,605 6,819Canada 726 1,755 2,683 3,797 3,509 3,364 3,565 3,344 3,225Indonesia 45 958 2,462 2,853 3,261 3,207 3,375 3,313 3,173Pakistan 140 572 1,120 2,054 2,594 2,629 2,534 2,232 2,589Qatar n/a 295 350 748 1,379 1,556 1,480 2,095 2,535Ukraine n/a n/a 3,004 2,130 2,154 2,312 2,985 3,072 2,489Egypt, Arab Rep. 118 401 678 1,441 2,779 2,761 2,709 2,474 2,308Iran, Islamic Rep. 31 72 376 726 1,311 1,524 1,904 2,058 1,975Saudi Arabia 0 138 568 1,278 1,619 1,695 1,737 1,923 1,920Poland 1,030 1,290 1,233 1,497 1,320 1,509 1,445 1,529 1,466Netherlands 957 1,624 1,928 1,300 1,216 1,175 1,322 1,293 1,381Germany 1,900 2,380 1,165 1,558 1,165 1,289 1,275 1,326 1,326Vietnam 0 15 18 227 431 479 503 861 999Belgium 594 743 770 935 884 947 956 932 911Turkey 82 600 1,026 400 557 747 929 905 865Belarus n/a n/a 747 574 670 740 773 832 862Others 16,868 27,900 21,389 18,185 17,017 18,195 18,739 18,344 18,126World 32,690 62,951 71,964 86,624 105,573 108,116 111,170 111,580 111,468
Consumption (thousand tonnes nutrients)China 2,987 11,787 19,233 22,720 33,600 32,599 33,800 34,294 34,250India 1,310 3,522 7,566 10,911 15,582 16,558 17,300 16,821 16,731United States 7,363 10,818 10,239 10,467 11,117 11,737 12,231 12,050 12,247Brazil 276 886 797 1,998 2,554 2,855 3,366 3,435 3,699Pakistan 264 843 1,472 2,265 3,476 3,143 3,209 2,853 3,179Indonesia 184 851 1,610 1,964 3,215 3,045 2,940 3,063 2,820Canada 323 946 1,158 1,592 1,901 1,990 2,297 2,479 2,457France 1,425 2,146 2,493 2,317 2,069 2,337 2,020 2,140 2,191Germany 1,642 2,303 1,787 1,848 1,569 1,786 1,640 1,648 1,675Turkey 243 782 1,200 1,276 1,412 1,344 1,259 1,432 1,584Russian Federation n/a n/a 4,344 960 1,494 1,483 1,577 1,576 1,537Thailand 50 136 577 922 1,228 1,311 1,386 1,382 1,480Ukraine n/a n/a 1,836 350 700 650 1,159 1,254 1,382Australia 123 248 439 951 849 982 1,099 1,099 1,315Vietnam 166 129 425 1,332 1,190 1,250 1,300 1,407 1,261Mexico 406 878 1,346 1,342 1,113 1,166 1,168 1,201 1,246Poland 785 1,344 671 896 1,113 1,090 1,095 1,204 1,172Bangladesh 99 266 609 996 1,149 1,237 1,122 1,112 1,133Egypt, Arab Rep. 331 554 745 1,084 1,193 1,159 1,207 1,087 1,114Others 13,446 22,054 18,231 15,880 15,928 16,800 16,660 17,006 17,665World 31,423 60,493 76,777 82,070 102,453 104,522 107,835 108,543 110,136

COMMODITY MARKETS OUTLOOK | ApRIL 2016 60 APPENDIX B
Palm oil and Soybean oil
Source: U.S. Department of Agriculture (April 2016 update).Notes: The trade year is January-December of the later year of the split. For example, 1970/71 refers to calendar year 1971.
Source: World Bank.Note: Last observation is March 2016.
Source: World Bank.Note: 2016-25 are forecasts.
1970/71 1980/81 1990/91 2000/01 2010/11 2012/13 2013/14 2014/15 2015/16Palm oil: production (thousand metric tons)
Indonesia 248 752 2,650 8,300 23,600 28,500 30,500 33,000 33,000Malaysia 589 2,692 6,031 11,937 18,211 19,321 20,161 19,879 19,500Thailand 0 19 200 580 1,832 2,135 2,000 1,800 2,200Colombia 36 80 252 520 753 974 1,041 1,110 1,174Nigeria 432 520 600 730 971 970 970 970 970Papua New Guinea 0 45 145 336 488 520 500 520 580Ecuador 5 44 150 222 380 540 565 485 510Ghana 21 19 24 108 426 471 493 495 500Honduras 0 18 64 148 320 425 460 470 490Guatemala 0 0 6 124 231 365 434 448 470Others 591 707 912 1,234 2,021 2,183 2,244 2,222 2,285World 1,922 4,896 11,034 24,239 49,233 56,404 59,368 61,399 61,679
Palm oil: consumption (thousand metric tons)India 1 431 259 4,100 7,090 8,250 8,452 9,100 9,800Indonesia 29 561 1,330 3,263 6,414 7,851 9,019 7,327 8,520European Union 595 607 1,509 2,790 5,110 6,560 6,850 6,730 6,630China 53 16 1,194 2,028 5,797 6,389 5,700 5,750 5,600Malaysia 8 420 914 1,571 2,204 2,451 2,868 2,941 3,280Pakistan 1 231 800 1,245 2,077 2,285 2,490 2,890 3,185Others 1,707 3,104 6,658 8,618 18,940 21,383 22,906 23,507 24,559World 2,394 5,370 12,664 23,615 47,632 55,169 58,285 58,245 61,574
Soybean oil: production (thousand metric tons)China 181 183 599 3,240 9,840 11,626 12,335 13,347 14,655United States 3,749 5,112 6,082 8,355 8,568 8,990 9,131 9,706 9,857Argentina 0 158 1,179 3,190 7,181 6,364 6,785 7,687 8,740Brazil n/a 2,601 2,669 4,333 6,970 6,760 7,070 7,760 7,680European Union 1,260 2,478 2,317 3,033 2,318 2,375 2,546 2,584 2,622India 2 69 425 805 1,646 1,752 1,478 1,211 1,086Paraguay 10 6 56 174 300 564 640 697 783Mexico 52 255 330 795 648 653 720 745 760Others 2,205 4,191 4,425 2,887 3,915 3,993 4,415 5,303 5,913World 7,459 15,053 18,082 26,812 41,386 43,077 45,120 49,040 52,096
Soybean oil: consumption (thousand metric tons)China 179 256 1,055 3,542 11,409 12,545 13,650 14,200 15,450United States 2,854 4,134 5,506 7,401 7,506 8,522 8,576 8,600 8,891Brazil n/a 1,490 2,075 2,932 5,205 5,534 5,705 6,275 6,365India 79 708 445 2,080 2,610 2,950 3,300 4,000 4,750Argentina 0 56 101 247 2,520 2,275 2,729 2,501 2,560European Union 1,170 1,926 1,879 2,186 2,400 1,900 1,950 1,950 1,950Mexico 52 305 404 863 840 860 890 1,001 1,036Iran, Islamic Rep. 95 343 431 873 620 600 630 720 800Others 2,699 5,120 5,417 6,335 7,409 7,482 7,774 8,627 9,398World 7,128 14,338 17,313 26,459 40,519 42,668 45,204 47,874 51,200
200
600
1,000
1,400
1,800
Jan-04 Jan-06 Jan-08 Jan-10 Jan-12 Jan-14 Jan-16
Monthly Prices (US$/mt)
Soybean oil
Palm oil
200
600
1,000
1,400
1,800
2,200
1970 1980 1990 2000 2010 2020
Soybean oil
Palm oil
Annual Constant 2010 Prices (US$/mt)

COMMODITY MARKETS OUTLOOK | ApRIL 2016 61APPENDIX B
Phosphate and Potash Fertilizers
Source: World Bank.Note: Last observation is March 2016.
Source: World Bank.Note: 2016-25 are forecasts.
Sources: International Fertilizer Industry Association (http://ifadata.fertilizer.org/ucSearch.aspx).
Notes: n/a implies data not available. The statistics are based on the nutrient content. All production statistics are expressed on a calendar-year basis, while consumption statistics are expressed either on a calendar- or on a fertilizer-year basis (see www.fertilizers.org for details).
0.0
200.0
400.0
600.0
800.0
1000.0
1200.0
Jan-04 Jan-06 Jan-08 Jan-10 Jan-12 Jan-14 Jan-16
Monthly Prices (US$/mt)
DAP
Potassium chloride
0
200
400
600
800
1,000
1970 1980 1990 2000 2010 2020
Annual Constant Prices (US$/mt)
DAP
Potassium chloride
1970 1980 1990 2000 2009 2010 2011 2012 2013Phosphate: production (thousand tonnes nutrients)
China 907 2,607 4,114 6,759 14,374 15,998 17,631 16,387 16,620United States n/a 7,437 8,105 7,337 5,817 6,297 6,123 6,456 6,055India 228 854 2,077 3,751 4,390 4,378 4,370 3,825 3,973Russian Federation n/a n/a 4,943 2,320 2,578 2,926 3,070 2,940 2,929Morocco 99 174 1,180 1,122 1,288 1,875 2,242 2,433 2,198Brazil 169 1,623 1,091 1,496 1,813 2,004 2,011 2,183 2,100Saudi Arabia 0 n/a n/a 159 71 119 298 826 919Tunisia 177 408 664 885 859 997 398 528 631Others 14,102 20,574 14,244 8,915 6,787 8,102 8,323 8,171 8,036World 15,682 33,677 36,417 32,744 37,977 42,697 44,466 43,749 43,460
Phosphate: consumption (thousand tonnes nutrients)China 907 2,952 5,770 8,664 11,000 12,100 12,300 12,400 11,480India 305 1,091 3,125 4,248 7,278 8,050 7,914 6,653 5,695Brazil 416 1,965 1,202 2,544 3,342 3,384 3,860 4,325 4,641United States 4,671 4,926 3,811 3,862 3,719 3,890 3,946 4,215 4,335Canada 326 634 578 634 630 723 799 831 886Pakistan 31 227 389 675 860 767 633 747 881Indonesia 45 274 581 263 450 500 584 695 849Australia 757 853 579 1,107 641 817 873 803 816Others 13,743 18,990 19,887 10,815 9,556 10,343 10,642 10,732 11,405World 21,202 31,912 35,920 32,812 37,477 40,574 41,551 41,401 40,988
Potash: production (thousand tonnes nutrients)Canada 3,179 7,337 7,005 9,174 4,414 10,289 9,919 9,877 9,461Russian Federation n/a n/a n/a 3,716 3,691 6,128 6,526 5,403 6,086China n/a 20 46 275 2,600 3,101 3,390 4,007 4,565Belarus n/a n/a 4,992 3,372 2,485 5,223 5,332 4,831 4,229Germany 4,824 6,123 4,967 3,409 1,789 2,962 3,106 3,056 2,968Israel 576 797 1,296 1,748 1,653 1,944 1,700 2,100 2,150Chile 21 23 41 408 662 850 964 1,244 1,187Jordan n/a n/a 842 1,162 672 1,166 1,355 1,094 1,047Others 8,871 13,307 3,649 2,878 1,801 2,043 2,482 2,409 2,604World 17,471 27,608 22,838 26,141 19,767 33,706 34,775 34,022 34,297
Potash: consumption (thousand tonnes nutrients)China 25 527 1,761 3,364 4,300 5,200 5,700 6,000 6,500Brazil 307 1,267 1,210 2,760 3,149 3,894 4,431 4,844 5,094United States 3,827 5,733 4,537 4,469 4,044 4,165 4,186 4,461 4,717India 199 618 1,309 1,565 3,632 3,514 2,576 2,062 2,058Indonesia 18 91 310 266 801 1,250 1,401 1,490 1,580Malaysia 61 250 494 650 700 1,150 1,250 1,290 1,290Belarus n/a n/a 986 450 663 660 787 720 683Viet Nam 38 39 29 450 300 400 440 552 570Others 11,289 15,302 13,685 8,121 6,011 7,243 7,369 7,531 7,874World 15,764 23,826 24,320 22,095 23,601 27,477 28,140 28,950 30,365

COMMODITY MARKETS OUTLOOK | ApRIL 2016 62 APPENDIX B
Rice
Source: U.S. Department of Agriculture (April 2016 update).
Notes: The trade year is January-December of the later year of the split. For example, 1970/71 refers to calendar year 1971.
Source: World Bank.Note: Last observation is March 2016.
Source: World Bank.Note: 2016-25 are forecasts.
0
200
400
600
800
1,000
Jan-04 Jan-06 Jan-08 Jan-10 Jan-12 Jan-14 Jan-16
Monthly Prices (US$/mt)
0
300
600
900
1,200
1,500
1970 1980 1990 2000 2010 2020
Constant 2010
Nominal
Annual Prices (US$/mt)
1970/71 1980/81 1990/91 2000/01 2010/11 2012/13 2013/14 2014/15 2015/16Production (million metric tons)
China 77.0 97.9 132.5 131.5 137.0 143.0 142.5 144.6 145.8 India 42.2 53.6 74.3 85.0 96.0 105.2 106.6 105.5 103.0 Indonesia 13.1 22.3 29.0 33.0 35.5 36.6 36.3 35.6 35.3 Bangladesh 11.1 13.9 17.9 25.1 31.7 33.8 34.4 34.5 34.5 Vietnam 6.4 7.7 12.4 20.5 26.4 27.5 28.2 28.2 28.1 Thailand 9.0 11.5 11.3 17.1 20.3 20.2 20.5 18.8 15.8 Burma 5.1 6.7 7.9 10.8 11.1 11.7 12.0 12.6 12.2 Philippines 3.4 5.0 6.4 8.1 10.5 11.4 11.9 11.9 11.4 Japan 11.5 8.9 9.6 8.6 7.8 7.9 7.9 7.8 7.7 Brazil 3.7 5.9 6.8 6.9 9.3 8.0 8.3 8.5 7.6 Pakistan 2.2 3.1 3.3 4.8 4.8 5.5 6.8 6.9 6.7 United States 2.8 4.8 5.1 5.9 7.6 6.3 6.1 7.1 6.1 Cambodia 2.5 1.1 1.6 2.5 4.2 4.7 4.7 4.7 4.4 Others 22.9 27.6 33.3 39.4 48.3 50.4 52.2 52.2 52.2 World 213.0 269.9 351.4 399.3 450.4 472.4 478.4 478.8 470.6
Stocks (million metric tons)China 11.0 28.0 94.0 93.0 42.6 46.8 46.8 47.6 47.8 India 6.0 6.5 14.5 25.1 23.5 25.4 22.8 17.8 13.3 Thailand 1.2 2.0 0.9 2.2 5.6 12.8 11.7 10.1 5.2 Indonesia 0.6 3.0 2.1 4.6 7.1 6.5 5.5 4.0 3.2 Japan 6.1 4.0 1.0 2.6 2.9 2.9 3.0 2.8 2.5 Philippines 0.6 1.5 1.8 2.8 2.5 1.5 1.7 2.2 2.3 Others 3.4 7.6 12.4 16.4 15.9 14.7 15.9 19.1 16.0 World 28.8 52.6 126.7 146.7 100.0 110.6 107.4 103.6 90.2
Exports (million metric tons)Thailand 1.6 3.0 4.0 7.5 10.6 6.7 11.0 9.8 10.0 India 0.0 0.9 0.7 1.7 2.8 10.9 10.6 12.2 9.0 Vietnam 0.0 0.0 1.0 3.5 7.0 6.7 6.3 6.6 7.0 Pakistan 0.2 1.2 1.3 2.4 3.4 3.6 3.2 4.0 4.4 United States 1.5 3.1 2.3 2.6 3.5 3.4 3.0 3.2 3.2 Others 5.2 4.2 2.8 6.2 7.8 8.1 8.1 8.1 8.0 World 8.5 12.4 12.1 24.0 35.1 39.4 42.2 44.0 41.6
Imports (million metric tons)China 0.0 0.2 0.1 0.3 0.5 3.2 4.0 4.7 5.0 Nigeria 0.0 0.4 0.2 1.3 2.4 2.8 2.8 3.5 2.5 Philippines 0.0 0.0 0.4 1.4 1.3 1.4 1.2 1.8 2.0 Indonesia 0.5 0.5 0.2 1.5 3.1 0.7 1.2 1.2 2.0 European Union 0.9 0.5 0.7 1.2 1.4 1.4 1.5 1.7 1.6 Saudi Arabia 0.2 0.4 0.5 1.0 1.1 1.3 1.4 1.4 1.5
Iran, Islamic Rep. 0.1 0.6 0.6 0.8 2.0 2.1 1.6 1.4 1.5 Iraq 0.1 0.4 0.3 1.0 1.2 1.4 1.0 1.2 1.2 Others 6.8 8.8 8.3 13.7 20.0 22.4 23.7 24.2 22.4 World 8.6 11.8 11.3 22.1 33.0 36.7 38.4 41.1 39.6

COMMODITY MARKETS OUTLOOK | ApRIL 2016 63APPENDIX B
Silver
Source: World Bank.Note: Last observation is March 2016.
Source: World Bank.Note: 2016-25 are forecasts.
Sources: World Bureau of Metal Statistics and Thomson Reuters.Notes: n/a implies data not available. Fabrication: jewelry and silverware including the use of scrap.
1995 2000 2005 2009 2010 2011 2012 2013 2014Production (metric tons)
Mexico 2,334 2,483 2,894 3,554 4,411 4,778 5,358 5,821 5,766 Peru 1,881 2,418 3,193 3,854 3,640 3,414 3,481 3,674 3,777 China 1,000 1,600 2,500 2,900 3,085 3,232 3,639 3,673 3,673 Australia 920 2,060 2,417 1,633 1,880 1,725 1,728 1,840 1,847 Chile 1,036 1,245 1,400 1,301 1,276 1,311 1,151 1,174 1,572 Russian Federation 250 400 1,350 1,313 1,145 1,134 1,400 1,412 1,412 Bolivia 425 434 420 1,326 1,259 1,214 1,207 1,287 1,345 Poland 1,001 1,164 1,262 1,207 1,183 1,167 1,149 1,403 1,200 United States 1,565 2,017 1,230 1,250 1,280 1,120 1,060 1,050 1,160 Kazakhstan 371 927 883 618 552 651 963 964 982 Argentina 48 78 264 533 723 641 750 768 905 Guatemala 0 0 7 129 195 273 205 284 857 Canada 1,285 1,204 1,124 631 596 572 705 618 493 Sweden 268 329 310 289 302 302 309 341 401 India 38 40 32 138 165 203 374 367 338 Morocco 204 290 186 210 243 227 230 255 277 Turkey 70 110 80 352 348 292 236 187 187 Finland 29 24 47 70 65 73 128 101 148 Dominican Republic 21 n/a n/a 19 23 19 23 80 128 Others 1,436 1,372 1,099 1,002 1,069 1,042 1,088 1,061 954 World 14,183 18,194 20,697 22,328 23,440 23,389 25,185 26,362 27,422
Fabrication (metric tons) China n/a n/a 4,307 5,843 6,792 7,534 7,711 8,448 7,808 India n/a n/a 3,116 1,793 2,823 4,477 3,119 5,756 6,676 United States n/a n/a 5,891 5,297 4,147 3,705 4,155 3,293 4,022 Japan n/a n/a 3,860 2,145 3,050 2,806 2,404 2,440 2,329 Canada n/a n/a 126 404 667 816 644 1,011 1,032 Italy n/a n/a 1,577 1,095 1,117 894 815 828 882 South Korea n/a n/a 794 763 929 941 927 895 820 Germany n/a n/a 1,260 1,028 1,193 1,052 856 818 803 Russian Federation n/a n/a 795 854 944 864 845 832 793 United Kingdom n/a n/a 1,330 588 634 694 631 641 629 Thailand n/a n/a 1,150 967 957 808 673 702 622 Mexico n/a n/a 693 504 556 689 657 517 501 Taiwan, China n/a n/a 380 397 486 510 463 471 488 Australia n/a n/a 210 368 450 535 387 471 430 Belgium n/a n/a 846 614 556 453 419 374 358 France n/a n/a 381 299 346 325 298 277 273 Indonesia n/a n/a 159 166 199 225 245 254 243 Turkey n/a n/a 309 221 201 181 184 209 241 Brazil n/a n/a 232 199 241 219 216 236 218 Others n/a n/a 2,025 3,216 5,770 5,703 4,311 6,126 4,011 World n/a n/a 29,441 26,761 32,058 33,431 29,960 34,599 33,179
0
10
20
30
40
50
1970 1980 1990 2000 2010 2020
Constant 2010
Nominal
Annual Prices (US$/toz)
0
10
20
30
40
50
Jan-04 Jan-06 Jan-08 Jan-10 Jan-12 Jan-14 Jan-16
Monthly Prices (US$/toz)

COMMODITY MARKETS OUTLOOK | ApRIL 2016 64 APPENDIX B
Soybeans
Source: U.S. Department of Agriculture (April 2016 update).Notes: The trade year is January-December of the later year of the split. For example, 1970/71 refers to calendar year 1971.
Source: World Bank.Note: Last observation is March 2016.
Source: World Bank.Note: 2016-25 are forecasts.
200
400
600
800
Jan-04 Jan-06 Jan-08 Jan-10 Jan-12 Jan-14 Jan-16
Monthly Prices (US$/mt)
0
200
400
600
800
1,000
1970 1980 1990 2000 2010 2020
Constant 2010
Nominal
Annual Prices (US$/mt)
1970/71 1980/81 1990/91 2000/01 2010/11 2012/13 2013/14 2014/15 2015/16Production (million metric tons)
United States 30.7 48.9 52.4 75.1 90.7 82.8 91.4 106.9 106.9 Brazil 0.0 15.2 15.8 39.5 75.3 82.0 86.7 97.2 100.0 Argentina 0.0 3.5 11.5 27.8 49.0 49.3 53.4 61.4 59.0 China 8.7 7.9 11.0 15.4 15.1 13.1 12.0 12.2 11.8 Paraguay 0.1 0.6 1.3 3.5 7.1 8.2 8.2 8.1 8.8 India 0.0 0.4 2.6 5.3 10.1 12.2 9.5 8.7 7.5 Canada 0.3 0.7 1.3 2.7 4.4 5.1 5.4 6.0 6.2 Ukraine n/a n/a 0.1 0.1 1.7 2.4 2.8 3.9 3.9 Uruguay 0.0 0.0 0.0 0.0 1.9 3.7 3.3 3.1 3.1 Bolivia 0.0 0.0 0.4 1.2 2.3 2.6 2.4 2.7 3.1 Others 2.4 3.5 7.9 5.4 6.7 7.3 7.6 9.4 9.7 World 42.1 80.9 104.3 175.8 264.3 268.6 282.6 319.5 320.2
Crushings (million metric tons)China 1.5 1.5 3.9 18.9 55.0 65.0 68.9 74.5 81.8 United States 20.7 27.8 32.3 44.6 44.9 46.0 47.2 51.0 50.9 Argentina 0.0 0.9 7.0 17.3 37.6 33.6 36.2 40.2 45.7 Brazil 0.0 13.8 14.2 22.7 36.3 35.2 36.9 40.4 40.0 European Union 7.3 14.1 13.0 16.8 12.2 12.5 13.4 13.6 13.8 India 0.0 0.4 2.4 4.5 9.3 9.9 8.3 6.8 6.1 Mexico 0.3 1.5 1.9 4.5 3.6 3.7 4.0 4.2 4.3 Paraguay 0.1 0.0 0.3 0.9 1.6 3.0 3.4 3.7 4.1 Russian Federation n/a n/a 0.4 0.4 2.1 2.2 3.4 3.7 4.0 Bolivia 0.0 0.0 0.3 0.9 1.8 2.2 2.3 2.5 2.7 Others 12.7 23.8 24.1 15.0 16.5 16.3 17.5 21.6 24.4 World 42.5 83.9 99.7 146.4 220.9 229.5 241.3 262.1 277.7
Exports (million metric tons)Brazil 0.0 1.8 2.5 15.5 30.0 41.9 46.8 50.6 59.5 United States 11.8 19.7 15.2 27.1 41.0 36.1 44.6 50.2 46.4 Argentina 0.0 2.7 4.5 7.3 9.2 7.7 7.8 10.6 11.4 Paraguay 0.0 0.6 1.0 2.5 5.2 5.5 4.8 4.5 4.6 Canada 0.0 0.1 0.2 0.7 2.9 3.5 3.5 3.9 4.2 Others 0.5 0.4 2.1 0.7 3.4 6.0 5.2 6.3 6.3 World 12.3 25.3 25.4 53.8 91.7 100.8 112.7 126.0 132.4
Imports (million metric tons)China 0.0 0.5 0.0 13.2 52.3 59.9 70.4 78.4 83.0 European Union 7.4 13.6 13.2 17.7 12.5 12.5 13.3 13.4 13.2 Mexico 0.1 1.4 1.4 4.4 3.5 3.4 3.8 3.8 4.0 Japan 3.2 4.2 4.4 4.8 2.9 2.8 2.9 3.0 3.1 Taiwan, China 0.5 1.1 2.2 2.3 2.5 2.3 2.3 2.5 2.6 Turkey 0.0 0.0 0.0 0.4 1.4 1.2 1.6 2.2 2.4 Thailand 0.0 0.0 0.0 1.3 2.1 1.9 1.8 2.4 2.4 Others 8.8 19.0 17.6 9.0 11.6 12.1 15.7 16.4 19.3 World 20.0 39.8 38.8 53.1 88.8 96.1 111.9 122.1 129.8
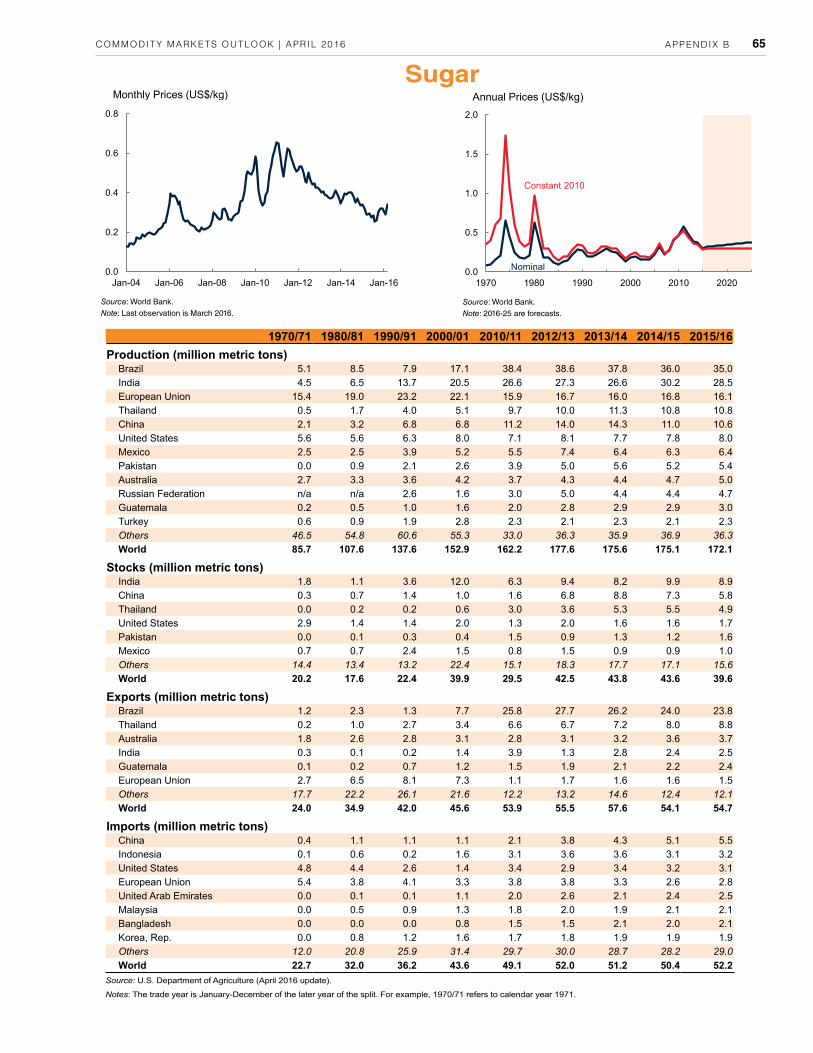
COMMODITY MARKETS OUTLOOK | ApRIL 2016 65APPENDIX B
Sugar
Source: U.S. Department of Agriculture (April 2016 update).
Notes: The trade year is January-December of the later year of the split. For example, 1970/71 refers to calendar year 1971.
Source: World Bank.Note: Last observation is March 2016.
Source: World Bank.Note: 2016-25 are forecasts.
0.0
0.2
0.4
0.6
0.8
Jan-04 Jan-06 Jan-08 Jan-10 Jan-12 Jan-14 Jan-16
Monthly Prices (US$/kg)
0.0
0.5
1.0
1.5
2.0
1970 1980 1990 2000 2010 2020
Constant 2010
Nominal
Annual Prices (US$/kg)
1970/71 1980/81 1990/91 2000/01 2010/11 2012/13 2013/14 2014/15 2015/16Production (million metric tons)
Brazil 5.1 8.5 7.9 17.1 38.4 38.6 37.8 36.0 35.0 India 4.5 6.5 13.7 20.5 26.6 27.3 26.6 30.2 28.5 European Union 15.4 19.0 23.2 22.1 15.9 16.7 16.0 16.8 16.1 Thailand 0.5 1.7 4.0 5.1 9.7 10.0 11.3 10.8 10.8 China 2.1 3.2 6.8 6.8 11.2 14.0 14.3 11.0 10.6 United States 5.6 5.6 6.3 8.0 7.1 8.1 7.7 7.8 8.0 Mexico 2.5 2.5 3.9 5.2 5.5 7.4 6.4 6.3 6.4 Pakistan 0.0 0.9 2.1 2.6 3.9 5.0 5.6 5.2 5.4 Australia 2.7 3.3 3.6 4.2 3.7 4.3 4.4 4.7 5.0 Russian Federation n/a n/a 2.6 1.6 3.0 5.0 4.4 4.4 4.7 Guatemala 0.2 0.5 1.0 1.6 2.0 2.8 2.9 2.9 3.0 Turkey 0.6 0.9 1.9 2.8 2.3 2.1 2.3 2.1 2.3 Others 46.5 54.8 60.6 55.3 33.0 36.3 35.9 36.9 36.3 World 85.7 107.6 137.6 152.9 162.2 177.6 175.6 175.1 172.1
Stocks (million metric tons)India 1.8 1.1 3.6 12.0 6.3 9.4 8.2 9.9 8.9 China 0.3 0.7 1.4 1.0 1.6 6.8 8.8 7.3 5.8 Thailand 0.0 0.2 0.2 0.6 3.0 3.6 5.3 5.5 4.9 United States 2.9 1.4 1.4 2.0 1.3 2.0 1.6 1.6 1.7 Pakistan 0.0 0.1 0.3 0.4 1.5 0.9 1.3 1.2 1.6 Mexico 0.7 0.7 2.4 1.5 0.8 1.5 0.9 0.9 1.0 Others 14.4 13.4 13.2 22.4 15.1 18.3 17.7 17.1 15.6 World 20.2 17.6 22.4 39.9 29.5 42.5 43.8 43.6 39.6
Exports (million metric tons)Brazil 1.2 2.3 1.3 7.7 25.8 27.7 26.2 24.0 23.8 Thailand 0.2 1.0 2.7 3.4 6.6 6.7 7.2 8.0 8.8 Australia 1.8 2.6 2.8 3.1 2.8 3.1 3.2 3.6 3.7 India 0.3 0.1 0.2 1.4 3.9 1.3 2.8 2.4 2.5 Guatemala 0.1 0.2 0.7 1.2 1.5 1.9 2.1 2.2 2.4 European Union 2.7 6.5 8.1 7.3 1.1 1.7 1.6 1.6 1.5 Others 17.7 22.2 26.1 21.6 12.2 13.2 14.6 12.4 12.1 World 24.0 34.9 42.0 45.6 53.9 55.5 57.6 54.1 54.7
Imports (million metric tons)China 0.4 1.1 1.1 1.1 2.1 3.8 4.3 5.1 5.5 Indonesia 0.1 0.6 0.2 1.6 3.1 3.6 3.6 3.1 3.2 United States 4.8 4.4 2.6 1.4 3.4 2.9 3.4 3.2 3.1 European Union 5.4 3.8 4.1 3.3 3.8 3.8 3.3 2.6 2.8 United Arab Emirates 0.0 0.1 0.1 1.1 2.0 2.6 2.1 2.4 2.5 Malaysia 0.0 0.5 0.9 1.3 1.8 2.0 1.9 2.1 2.1 Bangladesh 0.0 0.0 0.0 0.8 1.5 1.5 2.1 2.0 2.1 Korea, Rep. 0.0 0.8 1.2 1.6 1.7 1.8 1.9 1.9 1.9 Others 12.0 20.8 25.9 31.4 29.7 30.0 28.7 28.2 29.0 World 22.7 32.0 36.2 43.6 49.1 52.0 51.2 50.4 52.2

COMMODITY MARKETS OUTLOOK | ApRIL 2016 66 APPENDIX B
Tin
Source: World Bureau of Metal Statistics.
Notes: n/a implies data not available. Refined production and consumption include significant recyled material.
Source: World Bank.Note: Last observation is March 2016.
Source: World Bank.Note: 2016-25 are forecasts.
1980 1990 2000 2005 2010 2011 2012 2013 2014Mine Production (thousand metric tons)
China 16.0 42.2 87.7 113.1 129.6 115.7 149.0 177.3 146.6Indonesia 32.5 39.3 51.6 120.0 84.0 90.0 84.0 69.6 68.4Myanmar 1.2 0.6 1.6 0.7 0.8 2.1 9.0 17.5 24.0Bolivia 22.5 17.3 12.5 18.6 20.2 19.7 19.3 19.8 20.2Peru 1.1 4.8 36.4 42.5 33.8 26.1 23.7 23.1 19.5Brazil 6.9 39.1 14.2 11.7 10.4 13.7 13.8 13.8 13.8Australia 11.6 7.4 9.1 2.7 18.6 6.2 6.5 7.2 7.1Malaysia 61.4 28.5 6.3 2.9 2.7 3.7 3.7 3.8 3.7Vietnam 0.4 0.8 1.8 5.4 5.4 5.4 5.4 5.4 3.6Congo, Dem. Rep. 3.2 1.6 0.0 7.6 7.4 2.5 5.2 4.1 3.0Nigeria 2.5 0.3 2.0 0.9 1.3 2.4 2.6 2.5 2.1Rwanda 1.5 0.7 0.4 3.3 2.9 3.5 3.6 4.2 2.0Lao PDR 0.6 0.3 0.4 0.6 0.4 0.6 0.5 0.8 0.8Others 69.7 41.6 10.4 3.1 0.6 0.5 0.6 0.5 0.6World 231.1 224.5 234.5 333.1 318.1 292.0 326.9 349.6 315.5
Refined Production (thousand metric tons)China 15.0 35.8 109.9 112.2 149.0 147.9 159.6 186.9 166.9Indonesia 30.5 38.0 46.4 78.0 64.2 79.8 63.0 64.8 67.4Malaysia 71.3 49.0 26.2 39.2 38.7 37.8 32.7 36.7 31.2Peru 0.0 0.0 17.4 38.3 36.4 24.8 24.2 24.5 20.4Bolivia 17.5 13.1 9.4 15.6 15.0 14.3 14.9 15.4 15.1Brazil 8.8 37.6 13.8 9.0 9.1 12.0 12.0 12.0 12.0Thailand 34.8 15.5 17.2 29.4 23.5 22.8 23.0 16.3 10.5Belgium 3.1 6.1 8.5 7.7 9.9 11.4 10.3 9.7 8.8Vietnam 0.0 1.8 1.8 1.8 3.0 4.8 5.5 5.5 5.5India 0.1 0.3 3.6 3.6 3.6 3.6 3.8 4.2 4.2Poland 0.0 0.0 0.0 0.0 0.6 1.4 1.9 2.3 2.1Japan 1.3 0.8 0.6 0.8 0.8 1.1 1.8 1.7 1.7Nigeria 2.7 0.3 0.1 0.6 0.6 0.6 0.6 0.6 0.6Others n/a n/a 7.4 4.4 2.0 1.8 0.5 0.1 0.1World 244.6 248.0 262.3 340.5 356.6 364.0 353.7 380.8 346.4
Refined Consumption (thousand metric tons)China 12.5 25.5 49.1 108.7 154.3 176.2 169.3 192.6 176.4United States 46.5 36.8 51.0 42.3 32.0 30.7 29.2 28.8 31.3Japan 30.9 34.8 25.2 33.2 35.7 27.7 28.3 27.1 26.8Germany 19.0 21.7 20.7 19.1 17.4 17.6 18.0 18.8 17.9Korea, Rep. 1.8 7.8 15.3 17.9 17.4 16.2 14.5 13.8 13.1India 2.3 2.3 6.4 8.4 10.7 10.0 10.4 11.9 12.9Vietnam 0.0 0.0 0.8 1.2 2.0 2.0 3.6 5.5 6.0Netherlands 5.0 6.9 3.6 3.5 5.4 4.5 7.4 7.2 6.0Spain 4.6 4.0 4.1 7.0 6.1 2.9 4.7 6.4 5.7Others 100.3 97.8 100.6 97.4 87.7 70.0 69.7 66.8 67.2World 222.9 237.6 276.9 338.6 368.8 357.8 355.1 378.8 363.1
0
10,000
20,000
30,000
40,000
Jan-04 Jan-06 Jan-08 Jan-10 Jan-12 Jan-14 Jan-16
Monthly Prices (US$/mt)
0
10,000
20,000
30,000
1970 1980 1990 2000 2010 2020
Constant 2010
Nominal
Annual Prices (US$/mt)

COMMODITY MARKETS OUTLOOK | ApRIL 2016 67APPENDIX B
Wheat
Source: U.S. Department of Agriculture (April 2016 update).
Notes: n/a implies data not available. The trade year is January-December of the later year of the split. For example, 1970/71 refers to calendar year 1971.
Source: World Bank.Note: Last observation is March 2016.
Source: World Bank.Note: 2016-25 are forecasts.
100
200
300
400
500
Jan-04 Jan-06 Jan-08 Jan-10 Jan-12 Jan-14 Jan-16
Monthly Prices (US$/mt)
0
100
200
300
400
500
1970 1980 1990 2000 2010 2020
Constant 2010
Nominal
Annual Prices (US$/mt)
1970/71 1980/81 1990/91 2000/01 2010/11 2012/13 2013/14 2014/15 2015/16Production (million metric tons)
European Union 62.5 93.3 125.0 132.7 136.7 133.9 144.6 156.8 160.0 China 29.2 55.2 98.2 99.6 115.2 121.0 121.9 126.2 130.2 India 20.1 31.8 49.9 76.4 80.8 94.9 93.5 95.9 86.5 Russian Federation n/a n/a 49.6 34.5 41.5 37.7 52.1 59.1 61.0 United States 36.8 64.8 74.3 60.6 58.9 61.3 58.1 55.1 55.8 Canada 9.0 19.3 32.1 26.5 23.3 27.2 37.5 29.4 27.6 Ukraine n/a n/a 30.4 10.2 16.8 15.8 22.3 24.8 27.3 Pakistan 7.3 10.9 14.4 21.1 23.3 23.5 24.2 26.0 25.1 Australia 7.9 10.9 15.1 22.1 27.4 22.9 25.3 23.1 24.5 Turkey 8.0 13.0 16.0 18.0 17.0 16.0 18.8 15.3 19.5 Iran, Islamic Rep. 3.8 5.9 8.0 8.1 13.5 13.8 14.5 13.0 14.0 Kazakhstan n/a n/a 16.2 9.1 9.6 9.8 13.9 13.0 13.7 Argentina 4.9 7.8 11.0 16.3 17.2 9.3 10.5 12.5 11.3 Egypt, Arab Rep. 1.5 1.8 4.3 6.4 7.2 8.5 8.3 8.3 8.1 Others 178.0 214.5 169.4 41.7 60.9 62.7 69.4 67.1 68.4 World 369.1 529.2 713.8 583.3 649.3 658.3 714.9 725.4 733.1
Stocks (million metric tons)China 7.2 31.7 49.9 91.9 59.1 54.0 65.3 76.1 96.3 United States 22.4 26.9 23.6 23.8 23.5 19.5 16.1 20.5 26.6 European Union 8.6 13.0 22.5 17.9 11.9 10.7 9.9 13.8 19.3 India 5.0 4.0 5.8 21.5 15.4 24.2 17.8 17.2 13.2 Russian Federation n/a n/a 16.4 1.5 13.7 4.9 5.2 6.3 8.0 Iran, Islamic Rep. 0.7 1.2 3.2 2.9 2.9 5.1 7.2 7.8 7.1 Others 45.2 48.8 72.2 47.0 72.1 58.5 72.4 73.1 68.7 World 89.1 125.6 193.7 206.5 198.7 176.9 193.9 214.8 239.3
Exports (million metric tons)European Union 6.7 17.5 23.8 15.7 23.1 22.8 32.0 35.4 32.0 Russian Federation n/a n/a 1.2 0.7 4.0 11.3 18.6 22.8 23.0 Canada 11.8 16.3 21.7 17.3 16.6 19.0 23.3 24.1 22.0 United States 20.2 41.2 29.1 28.9 35.1 27.5 32.0 23.2 21.1 Australia 9.1 9.6 11.8 15.9 18.6 18.6 18.6 16.6 17.0 Ukraine n/a n/a 2.0 0.1 4.3 7.2 9.8 11.3 15.5 Others 15.3 23.1 38.0 22.6 31.0 31.1 31.6 30.6 32.5 World 63.2 107.6 127.7 101.3 132.7 137.5 165.9 164.1 163.1
Imports (million metric tons)Egypt, Arab Rep. 2.8 5.4 5.7 6.1 10.6 8.3 10.1 11.1 11.0 Indonesia 0.5 1.2 2.0 4.1 6.6 7.1 7.4 7.5 8.1 Algeria 0.6 2.3 4.4 5.6 6.5 6.5 7.5 7.3 8.1 European Union 18.9 26.6 5.7 3.7 4.6 5.3 4.0 6.0 6.3 Brazil 1.7 3.9 4.4 7.2 6.7 7.4 7.1 5.4 6.0 Japan 4.8 5.8 5.6 5.9 5.9 6.6 6.1 5.9 5.7 Others 45.3 70.8 76.9 67.0 91.1 104.0 116.2 115.8 115.3 World 74.7 116.1 104.7 99.5 132.0 145.2 158.4 158.8 160.5

COMMODITY MARKETS OUTLOOK | ApRIL 2016 68 APPENDIX B
Wood-based panels and Woodpulp
Source: Food and Agriculture Organization of the United Nations.
Notes: n/a implies data not available. Wood-based panels, reported in cubic meters solid volume, is an aggregate comprising veneer sheets, plywood, particle board and fiberboard. Woodpulp, reported in metric tons air-dry weight (i.e. with 10% moisture content), is an aggregate comprising mechanical woodpulp; semi-chemical woodpulp; chemical woodpulp; and dissolving woodpulp.
Source: World Bank.Note: Last observation is March 2016.
Source: World Bank.Note: 2016-25 are forecasts.
400
600
800
1,000
Jan-04 Jan-06 Jan-08 Jan-10 Jan-12 Jan-14 Jan-16
Monthly Prices (US$/mt)
Woodpulp
300
600
900
1,200
1979 1989 1999 2009
Woodpulp, constant 2010
Woodpulp, nominal
Annual Constant Prices (US$/mt)
1970 1980 1990 2000 2010 2011 2012 2013 2014Wood-based panels: production (million cubic meters)
China 0.9 2.3 3.0 19.3 109.2 134.0 149.3 177.0 191.2 United States 23.0 26.4 37.0 45.7 32.6 32.0 31.5 33.5 34.0 Russian Federation n/a n/a n/a 4.8 10.1 12.1 12.8 12.7 13.1 Canada 3.3 4.8 6.4 15.0 9.9 10.5 11.1 11.7 12.4 Germany 5.8 8.3 9.6 14.1 12.6 12.1 12.1 12.2 12.3 Brazil 0.8 2.5 2.9 5.8 10.2 11.1 12.1 11.7 11.8 Turkey 0.2 0.4 0.8 2.4 6.6 7.4 8.1 8.8 9.6 Poland 1.0 2.0 1.4 4.6 8.2 8.4 8.5 9.0 9.4 Others 34.7 54.6 67.9 74.7 88.8 89.5 89.3 90.9 93.8 World 69.8 101.3 129.0 186.3 288.3 317.2 334.7 367.4 387.6
Wood-based panels: imports (million cubic meters)United States 2.5 2.1 4.2 13.9 7.7 7.9 8.8 8.8 9.6 Germany 1.0 2.3 3.3 4.1 4.6 5.1 5.3 5.1 5.1 Japan 0.6 0.3 3.8 6.2 4.2 5.0 4.8 5.0 4.9 China 0.1 0.3 3.2 6.6 3.0 3.0 2.8 3.0 3.4 United Kingdom 2.0 2.4 3.3 3.3 2.7 2.8 2.6 3.0 3.3 Korea, Rep. n/a n/a 1.2 2.1 2.6 2.3 2.3 2.5 2.9 Canada 0.2 0.2 0.5 1.5 2.8 2.9 2.9 2.5 2.8 Italy 0.1 0.8 0.9 1.7 2.4 2.1 2.2 2.4 2.8 Others 3.5 7.1 9.9 20.4 36.6 39.3 40.7 42.1 43.1 World 10.0 15.7 30.3 59.9 66.7 70.5 72.5 74.5 77.8
Woodpulp: production (million metric tons)United States 37.3 46.2 57.2 57.8 50.9 51.1 50.2 49.1 47.8 Canada 16.6 19.9 23.0 26.7 18.9 18.3 17.8 18.1 17.7 Brazil 0.8 3.4 4.3 7.3 14.5 14.3 14.3 15.5 16.8 Sweden 8.1 8.7 10.2 11.5 11.9 11.9 12.0 11.7 11.5 Finland 6.2 7.2 8.9 12.0 10.5 10.4 10.2 10.5 10.5 China 1.2 1.3 2.1 3.7 7.5 8.9 8.8 9.6 10.4 Japan 8.8 9.8 11.3 11.4 9.5 9.1 8.7 8.8 9.1 Russian Federation n/a n/a n/a 5.8 7.4 7.9 7.7 7.2 7.5 Others 22.5 29.1 37.8 34.9 39.5 41.8 42.6 41.4 41.7 World 101.6 125.7 154.8 171.3 170.6 173.6 172.5 171.9 172.9
Woodpulp: imports (million metric tons)China 0.1 0.4 0.9 4.0 12.1 15.2 17.2 17.6 18.7 United States 3.2 3.7 4.4 6.6 5.6 5.5 5.2 5.5 5.8 Germany 1.8 2.6 3.7 4.1 5.1 5.0 4.8 5.0 4.8 Italy 1.4 1.8 2.1 3.2 3.4 3.5 3.3 3.5 3.4 Netherlands 0.6 0.6 0.6 0.9 1.2 1.6 1.6 2.5 2.4 Korea, Rep. 0.2 0.5 1.1 2.1 2.5 2.5 2.4 2.4 2.3 France 1.3 1.8 1.9 2.4 1.9 1.9 2.0 2.1 2.0 Japan 0.9 2.2 2.9 3.1 1.8 1.9 1.8 1.7 1.8 Others 7.0 7.0 7.6 11.4 14.1 14.4 15.4 16.3 16.9 World 16.6 20.6 25.2 37.8 47.9 51.4 53.7 56.6 57.8

COMMODITY MARKETS OUTLOOK | ApRIL 2016 69APPENDIX B
Zinc
Source: World Bank.Note: Last observation is March 2016.
Source: World Bank.Note: 2016-25 are forecasts.
Source: World Bureau of Metal Statistics.
Note: n/a implies data not available.
1980 1990 2000 2005 2010 2012 2013 2014 2015Mine Production (thousand metric tons)
China 150 763 1,780 2,061 3,842 4,859 5,188 5,200 4,750 Australia 495 940 1,420 1,367 1,480 1,507 1,523 1,560 1,691 Peru 488 584 910 1,202 1,470 1,281 1,351 1,319 1,422 India 32 70 208 447 740 725 817 729 826 United States 349 571 829 748 748 738 784 832 810 Mexico 243 307 401 476 570 660 643 660 677 Bolivia 50 108 149 160 411 390 407 449 480 Kazakhstan n/a n/a 322 364 405 371 417 386 384 Canada 1,059 1,203 1,002 667 649 612 426 353 278 Sweden 167 160 177 216 199 188 177 222 247 Ireland 229 167 263 429 354 338 327 283 236 Russian Federation n/a n/a 132 186 214 189 193 217 236 Brazil 70 110 100 168 211 164 152 193 193 Others n/a n/a 1,129 1,079 1,163 1,253 1,251 1,306 1,142 World 6,172 7,176 8,823 9,569 12,457 13,274 13,655 13,708 13,372
Refined Production (thousand metric tons)China 155 552 1,957 2,725 5,209 4,881 5,280 5,827 6,155 Korea, Rep. 76 248 473 650 750 877 895 915 978 India 44 79 176 266 701 691 773 700 817 Canada 592 592 780 724 690 649 652 648 678 Japan 735 688 654 638 574 571 587 583 567 Spain 152 253 386 501 517 528 529 529 529 Australia 301 309 489 457 498 496 492 482 479 Peru 64 118 200 166 223 319 346 336 335 Kazakhstan n/a n/a 263 357 319 320 320 325 324 Mexico 145 199 337 334 322 324 323 321 318 Finland 147 175 223 282 307 315 312 302 306 Netherlands 170 208 217 225 264 257 275 290 291 Russian Federation n/a n/a 241 206 260 247 262 265 267 Others n/a n/a 2,757 2,587 2,275 2,086 2,012 2,030 1,930 World 6,159 6,698 9,153 10,119 12,909 12,561 13,058 13,553 13,975
Refined Consumption (thousand metric tons)China 200 369 1,402 3,040 5,350 5,396 5,962 6,420 6,487 United States 810 992 1,315 1,080 907 892 935 962 924 Korea, Rep. 68 230 419 448 540 553 578 644 633 India 95 135 224 389 538 561 640 638 612 Germany 474 530 532 514 494 474 479 477 479 Japan 752 814 674 602 516 479 498 503 457 Belgium 155 178 394 256 321 239 222 388 442 Australia 100 114 193 239 225 104 180 174 289 Russian Federation n/a n/a 138 166 203 222 265 242 255 Others n/a n/a 3,599 3,662 3,432 3,139 3,195 3,314 3,334 World 6,131 6,568 8,889 10,396 12,526 12,059 12,954 13,762 13,911
0
1,000
2,000
3,000
4,000
5,000
Jan-04 Jan-06 Jan-08 Jan-10 Jan-12 Jan-14 Jan-16
Monthly Prices (US$/mt)
0
1,000
2,000
3,000
4,000
5,000
1970 1980 1990 2000 2010 2020
Constant 2010
Nominal
Annual Prices (US$/mt)


APPEndIx C
Description of price seriesTechnical notes


COMMODITY MARKETS OUTLOOK | ApRIL 2016 73APPENDIX C
Description of Price Series
ENERGY
Coal (Australia). Thermal, f.o.b. piers, Newcastle/Port Kembla, 6,700 kcal/kg, 90 days forward delivery.Coal (Colombia). Thermal, f.o.b. Bolivar, 6,450 kcal/kg, (11,200 btu/lb), less than .8% sulfur, 9% ash, 90 days forward delivery.Coal (South Africa). Thermal, f.o.b. Richards Bay, 6,000 kcal/kg, 90 days forward delivery.Crude oil. Average price of Brent (38° API), Dubai Fateh (32° API), and West Texas Intermediate (WTI, 40° API). Equally weighed.natural Gas Index (Laspeyres). Weights based on five-year consumption volumes for Europe, U.S. and Japan (LNG), updated every five years.natural gas (Europe). Average import border price with a component of spot price, including U.K.natural gas (U.S.). Spot price at Henry Hub, Louisiana.natural gas (Japan). LNG, import price, cif; recent two months' averages are estimates. NON-ENERGYBeverages
Cocoa (ICCO). International Cocoa Organization daily price, average of the first three positions on the terminal markets of New York and London, nearest three future trading months.Coffee (ICO). International Coffee Organization indicator price, other mild Arabicas, average New York and Bremen/Hamburg markets, ex-dock.Coffee (ICO). International Coffee Organization indicator price, Robustas, average New York and Le Havre/Marseilles markets, ex-dock. Tea. Average three auctions, average of quotations at Kolkata, Colombo, and Mombasa/Nairobi.Tea (Colombo). Sri Lankan origin, all tea, average of weekly quotes.Tea (Kolkata). leaf, include excise duty, average of weekly quotes.Tea (Mombasa/Nairobi). African origin, all tea, average of weekly quotes.
Oils and meals
Coconut oil (Philippines/Indonesia). Bulk, c.i.f. Rotterdam. Copra (Philippines/Indonesia). Bulk, c.i.f. N.W. Europe.
Groundnuts (U.S.). Runners 40/50, shelled basis, c.i.f. Rotterdam.Groundnut oil (any origin). C.i.f. Rotterdam.Fishmeal (any origin). 64-65%, c&f Bremen, esti-mates based on wholesale price.Palm oil (Malaysia). 5% bulk, c.i.f. N. W. Europe.Palmkernel Oil (Malaysia). C.i.f. Rotterdam.Soybean meal (any origin), Argentine 45/46% ex-traction, c.i.f. Rotterdam.Soybean oil (any origin). Crude, f.o.b. ex-mill Netherlands.Soybeans (U.S.). C.i.f. Rotterdam.
Grains
Barley (U.S.). Feed, No. 2, spot, 20 days to-arrive, delivered Minneapolis.maize (U.S.). No. 2, yellow, f.o.b. US Gulf ports.Rice (Thailand). 5% broken, white rice (WR), milled, indicative price based on weekly surveys of export transactions, government standard, f.o.b. Bangkok.Rice (Thailand). 25% broken, WR, milled indicative survey price, government standard, f.o.b. Bangkok.Rice (Thailand). 100% broken, A.1 Super, indicative survey price, government standard, f.o.b. Bangkok.Rice (Vietnam). 5% broken, WR, milled, weekly indicative survey price, minimum export price, f.o.b. Hanoi.Sorghum (U.S.). No. 2 milo yellow, f.o.b. Gulf ports.Wheat (U.S.). No. 1, hard red winter (HRW), ordinary protein, export price delivered at the US Gulf port for prompt or 30 days shipment.Wheat (U.S.). No. 2, soft red winter (SRW), export price delivered at the U.S. Gulf port for prompt or 30 days shipment.
Other food
Bananas (Central and South America). Major brands, free on truck (f.o.t.) Southern Europe, including duties. Bananas (Central and South America). Major brands, US import price, f.o.t. US Gulf ports.meat, beef (Australia/New Zealand). Chucks and cow forequarters, frozen boneless, 85% chemical lean, c.i.f. U.S. port (east coast), ex-dock.meat, chicken (U.S.). Broiler/fryer, whole birds, 2-1/2 to 3 pounds, USDA grade "A", ice-packed, Georgia Dock preliminary weighted average, wholesale.meat, sheep (New Zealand). Frozen whole carcasses Prime Medium (PM) wholesale, Smithfield, London.

COMMODITY MARKETS OUTLOOK | ApRIL 2016 74 APPENDIX C
Oranges (Mediterranean exporters). Navel, EEC indicative import price, c.i.f. Paris.Shrimp (Mexico). West coast, frozen, white, No. 1, shell-on, headless, 26 to 30 count per pound, wholesale price at New York.Sugar (EU). European Union negotiated import price for raw unpackaged sugar from African, Caribbean, and Pacific (ACP), c.i.f. European ports.Sugar (U.S.). Nearby futures contract, c.i.f.Sugar (world). International Sugar Agreement (ISA) daily price, raw, f.o.b. and stowed at greater Caribbean ports.
Timber
Logs (West Africa). Sapele, high quality (loyal and marchand), 80 centimeter or more, f.o.b. Douala, Cameroon.Logs (Southeast Asia). Meranti, Sarawak, Malaysia, sale price charged by importers, Tokyo.Plywood (Africa and Southeast Asia). Lauan, 3-ply, extra, 91 cm x 182 cm x 4 mm, wholesale price, spot Tokyo.Sawnwood (West Africa). Sapele, width 6 inches or more, length 6 feet or more, f.a.s. Cameroonian ports.Sawnwood (Southeast Asia). Malaysian dark red se-raya/meranti, select and better quality, average 7 to 8 inches; length average 12 to 14 inches; thickness 1 to 2 inches; kiln dry, c. & f. UK ports, with 5% agents commission including premium for products of certi-fied sustainable forest.Woodpulp (Sweden). Softwood, sulphate, bleached, air-dry weight, c.i.f. North Sea ports.
Other raw materials
Cotton (Cotton Outlook "CotlookA index"). Middling 1-3/32 inch, traded in Far East, C/F.Rubber (Asia). RSS3 grade, Singapore Commodity Exchange Ltd (SICOM) nearby contract.Rubber (Asia). TSR 20, Technically Specified Rubber, SICOM nearby contract.
Fertilizers
dAP (diammonium phosphate). Standard size, bulk, spot, f.o.b. US Gulf.Phosphate rock (Morocco). 70% BPL, contract, f.a.s. Casablanca.Potassium chloride (muriate of potash). Standard grade, spot, f.o.b. Vancouver.
TSP (triple superphosphate). Bulk, spot, granular, f.o.b. Tunisia.Urea (Black Sea). Bulk, spot, f.o.b. Black Sea (primarily Yuzhnyy).
Metals and minerals
Aluminum (LME). London Metal Exchange, unalloyed primary ingots, standard high grade, physical settlement.Copper (LME). Standard grade A, cathodes and wire bar shapes, physical settlement. Iron ore (any origin). Fines, spot price, c.f.r. China, 62% Fe.Lead (LME). Refined, standard high grade, physical settlement.nickel (LME). Cathodes, standard high grade, physical settlement.Tin (LME). Refined, standard high grade, physical settlement.Zinc (LME). Refined, standard special high grade, physical settlement.
PRECIOUS METALS
Gold (U.K.). 99.5% fine, London afternoon fixing, average of daily rates.Platinum (U.K.). 99.9% refined, London afternoon fixing.Silver (U.K.). 99.9% refined, London afternoon fixing.

COMMODITY MARKETS OUTLOOK | ApRIL 2016 75APPENDIX C
Technical Notes
Definitions and explanations
Constant prices are prices which are deflated by the Manufacturers Unit Value Index (MUV).mUv is the unit value index in U.S. dollar terms of manufactures exported from fifteen countries: Brazil, Canada, China, Germany, France, India, Italy, Japan, Mexico, Republic of Korea, South Africa, Spain, Thailand, United Kingdom, and United States.Price indexes were computed by the Laspeyres formula. The Non-Energy Price Index is comprised of 34 commodities. U.S. dollar prices of each commodity is weighted by 2002-2004 average export values. Base year reference for all indexes is 2010. Countries included in indexes are all low- and middle-income, according to World Bank income classifications.Price index weights. Trade data as of May 2008 comes from United Nations' Comtrade Database via the World Bank WITS system, Food and Agriculture Organization FAOSTAT Database, International Energy Agency Database, BP Statistical Review, World Metal Statistics, World Bureau of Metal Statistics, and World Bank staff estimates. The weights can be found in the table on the next page.Reporting period. Calendar vs. crop or marketing year refers to the span of the year. It is common in many agricultural commodities to refer to production and other variables over a twelve-month period that begins with harvest. A crop or marketing year will often differ by commodity and, in some cases, by country or region.
Abbreviations$ = U.S. dollarbbl = barrelbcf/d = billion cubic feet per daycif = cost, insurance, freightcum = cubic meterdmt = dry metric tonf.o.b. = free on boardf.o.t. = free on trackkg = kilogrammb/d = million barrels per daymmbtu = million British thermal unitsmt = metric ton (1,000 kilograms)toz = troy oz
AcronymsAMIS Agricultural Market Information SystemDAP diammonium phosphateEIA Energy Information AdministrationEMDE emerging and developing economiesFAO Food and Agriculture OrganizationGDP gross domestic productICMM International Council on Mining and MetalsIEA International Energy Agency
IER Institute for Energy ResearchIGC International Growth CentreITRC International Tripartite Rubber CouncilLIC Low-income countryLME London Metal ExchangeLNG liquefied natural gasOECD Organization of Economic Cooperation and
DevelopmentOPEC Organization of Petroleum Exporting CountriesTSP triple superphosphateUN United NationsUNECA United Nations Economic Commission for
AfricaUSDA United States Department of AgricultureWTI West Texas Intermediate
Data sourcesBaker HughesBloombergBP Statistical ReviewConcensus ForecastCotton OutlookFAOFertilizer WeekINFOFISHINTERFEL Fel Actualités HebdoInternational Cocoa Organization (ICCO)International Coffee Organization (ICO)International Cotton Advisory CommitteeInternational Energy Agency (IEA)International Fertilizer Industry Association (IFA)International Rubber Study Group (IRSG)International Tea Committee (ITC)International Tropical Timber Organization (ITTO)International Sugar Organization (ISO)ISTA Mielke GmbH Oil WorldJapan Lumber JournalMinEx ConsultingMLA Meat & Livestock WeeklyPlatts International Coal ReportQuarterly Bulleting of Cocoa StatisticsSingapore Commodity ExchangeSopisco NewsSri Lanka Tea BoardThomson ReutersU.S. Department of AgricultureU.S. Energy Information Administration (EIA)U.S. NOAA Fisheries ServiceWorld Bureau of Metal StatisticsWorld Gas Intelligence

COMMODITY MARKETS OUTLOOK | ApRIL 2016 76 APPENDIX C
Weights for commodity price indexes Commodity group
Share of energy and non-energy indexes
Share of sub-group indexes
ENERGY 100.0 100.0 Coal 4.7 4.7 Crude Oil 84.6 84.6 Natural Gas 10.8 10.8
NON-ENERGY 100.0 Agriculture 64.9
Beverages 8.4 100.0 Coffee 3.8 45.7 Cocoa 3.1 36.9 Tea 1.5 17.4
Food 40.0 Grains 11.3 100.0
Rice 3.4 30.2 Wheat 2.8 25.3 Maize (includes sorghum) 4.6 40.8 Barley 0.5 3.7
Oils and Meals 16.3 100.0 Soybeans 4.0 24.6 Soybean Oil 2.1 13.0 Soybean Meal 4.3 26.3 Palm Oil 4.9 30.2 Coconut Oil 0.5 3.1 Groundnut Oil (includes groundnuts) 0.5 2.8
Other Food 12.4 100.0 Sugar 3.9 31.5 Bananas 1.9 15.7 Meat, beef 2.7 22.0 Meat, chicken 2.4 19.2 Oranges (includes orange junice) 1.4 11.6
Agricultural Raw Materials 16.5 Timber 8.6 100.0
Hardwood 8.6 100.0 Logs 1.9 22.1 Sawnwood 6.7 77.9
Other Raw Materials 7.9 100.0 Cotton 1.9 24.7 Natural Rubber 3.7 46.7 Tobacco 2.3 28.7
Fertilizers 3.6 100.0 Natural Phosphate Rock 0.6 16.9
Phosphate 0.8 21.7 Potassium 0.7 20.1 Nitogenous 1.5 41.3
Metals and Minerals 31.6 100.0 Aluminum 8.4 26.7 Copper 12.1 38.4 Iron Ore 6.0 18.9 Lead 0.6 1.8 Nickel 2.5 8.1 Tin 0.7 2.1 Zinc 1.3 4.1
PRECIOUS METALS 100.0 Gold 77.8 Silver 18.9 Platinum 3.3
Notes: Index weights are based on 2002-04 developing countries' export values. Precious metals are not included in the non-energy index.


Most commodity prices rebounded from their January lows
on improved market sentiment and a weakening dollar. Still,
average prices fell in the first quarter—energy down 21 percent
and non-energy down 2 percent. The crude oil price forecast has
been raised to $41/bbl for 2016 (up from $37/bbl in January)
on expected supply tightening in the second half of the year,
but represents a 19 percent drop from 2015. Metals prices are
projected to decline 8 percent on weak demand and increases
in new capacity. Agriculture prices are projected to decline 4
percent in 2016 on early signs of good harvests for next season.
Looking to 2017, a modest price recovery is expected for most
commodities. Crude oil price is projected to rise to $50/bbl
as supply tightens. The Special Focus of this edition examines
the implications of resource development in an era of cheaper
commodities, and concludes that ambitious improvements in
governance and sounder macroeconomic policies are required to
mitigate delays and risks.
The World Bank’s Commodity Markets Outlook is published
quarterly, in January, April, July, and October. The report
provides detailed market analysis for major commodity groups,
including energy, metals, agriculture, precious metals, and
fertilizers. Price forecasts to 2025 for 46 commodities are also
presented, together with historical price data. Commodity price
data updates are published separately at the beginning of each
month.
The report and data can be accessed at:
www.worldbank.org/commodities